moisture and ion transport in layered porous building materials : a
TRANSCRIPT
Moisture and ion transport in layered porous buildingmaterials : a nuclear magnetic resonance studyPetkovic, J.
DOI:10.6100/IR593069
Published: 01/01/2005
Document VersionPublisher’s PDF, also known as Version of Record (includes final page, issue and volume numbers)
Please check the document version of this publication:
• A submitted manuscript is the author's version of the article upon submission and before peer-review. There can be important differencesbetween the submitted version and the official published version of record. People interested in the research are advised to contact theauthor for the final version of the publication, or visit the DOI to the publisher's website.• The final author version and the galley proof are versions of the publication after peer review.• The final published version features the final layout of the paper including the volume, issue and page numbers.
Link to publication
Citation for published version (APA):Petkovic, J. (2005). Moisture and ion transport in layered porous building materials : a nuclear magneticresonance study Eindhoven: Technische Universiteit Eindhoven DOI: 10.6100/IR593069
General rightsCopyright and moral rights for the publications made accessible in the public portal are retained by the authors and/or other copyright ownersand it is a condition of accessing publications that users recognise and abide by the legal requirements associated with these rights.
• Users may download and print one copy of any publication from the public portal for the purpose of private study or research. • You may not further distribute the material or use it for any profit-making activity or commercial gain • You may freely distribute the URL identifying the publication in the public portal ?
Take down policyIf you believe that this document breaches copyright please contact us providing details, and we will remove access to the work immediatelyand investigate your claim.
Download date: 07. Apr. 2018

Moisture and ion transport
in layered
porous building materials:
a Nuclear Magnetic
Resonance study
PROEFSCHRIFT
ter verkrijging van de graad van doctor aan deTechnische Universiteit Eindhoven, op gezag vande Rector Magnificus, prof.dr.ir. C.J. van Duijn,voor een commissie aangewezen door het Collegevoor Promoties in het openbaar te verdedigen op
woensdag 8 juni 2005 om 16.00 uur
door
Jelena Petkovic
geboren te Belgrado, Joegoslavie
Dit proefschrift is goedgekeurd door de promotoren:
prof.dr.ir. K. Kopingaenprof.ir. R.P.J. van Hees
Copromotor:dr.ir. L. Pel
CIP-DATA LIBRARY EINDHOVEN UNIVERSITY OF TECHNOLOGY
Petkovic, Jelena
Moisture and ion transport in layered porous building materials: a Nuclear MagneticResonance study / door Jelena Petkovic.- Eindhoven : Eindhoven University of Technology, 2005. -Proefschrift.ISBN 90-386-2151-5NUR 926Trefwoorden: kernspinresonantie / poreuze materialen / bouwmaterialenpleister / gelaagde systemen / zouttransport / zoutschadeSubject headings: nuclear magnetic resonance / porous materials /building materials/ plaster / layered systems / salt transport / salt damage
Cover design: Jan-Willem LuitenOriginal cover illustrations: Jose Delgado RodriguesPrinted by: PrintPartners Ipskamp, Enschede.
The work described in this thesis has been carried out in the group Transport in PermeableMedia at the Eindhoven University of Technology, Department of Applied Physics.Part of this work is supported by the Dutch Technology Foundation (STW).
Contents
1. Introduction . . . . . . . . . . . . . . . . . . . . . . . . . . . . . . . . . . . . . . 1
2. Transport of moisture and ions in porous media . . . . . . . . . . . . . . . . . . 3
2.1 Introduction . . . . . . . . . . . . . . . . . . . . . . . . . . . . . . . . . . . 3
2.2 Moisture transport . . . . . . . . . . . . . . . . . . . . . . . . . . . . . . . 3
2.2.1 Saturated materials . . . . . . . . . . . . . . . . . . . . . . . . . . . 3
2.2.2 Non-saturated materials . . . . . . . . . . . . . . . . . . . . . . . . 4
2.3 Salt transport . . . . . . . . . . . . . . . . . . . . . . . . . . . . . . . . . . 6
3. NMR . . . . . . . . . . . . . . . . . . . . . . . . . . . . . . . . . . . . . . . . . . 9
3.1 Introduction . . . . . . . . . . . . . . . . . . . . . . . . . . . . . . . . . . . 9
3.2 Principles of NMR . . . . . . . . . . . . . . . . . . . . . . . . . . . . . . . 9
3.3 Determination of water and salt profiles by MRI . . . . . . . . . . . . . . . 11
3.4 Determination of the diffusion coefficient . . . . . . . . . . . . . . . . . . . 13
3.4.1 Stimulated echo pulse sequence . . . . . . . . . . . . . . . . . . . . 14
3.5 Measurement setup . . . . . . . . . . . . . . . . . . . . . . . . . . . . . . . 16
4. Moisture and salt transport in plaster/substrate layers . . . . . . . . . . . . . . 19
4.1 Introduction . . . . . . . . . . . . . . . . . . . . . . . . . . . . . . . . . . . 19
4.2 Theory . . . . . . . . . . . . . . . . . . . . . . . . . . . . . . . . . . . . . 20
4.3 Experimental . . . . . . . . . . . . . . . . . . . . . . . . . . . . . . . . . . 23
4.4 Results . . . . . . . . . . . . . . . . . . . . . . . . . . . . . . . . . . . . . 27
4.4.1 Plaster/Bentheimer sandstone . . . . . . . . . . . . . . . . . . . . 27
4.4.2 Plaster/calcium-silicate brick . . . . . . . . . . . . . . . . . . . . . 33
4.5 Discussion . . . . . . . . . . . . . . . . . . . . . . . . . . . . . . . . . . . 39
4.5.1 Non-uniformly salt loaded systems . . . . . . . . . . . . . . . . . . 39
4.5.2 Other plaster/substrate combinations . . . . . . . . . . . . . . . . 41
4.6 Conclusions . . . . . . . . . . . . . . . . . . . . . . . . . . . . . . . . . . . 43
5. Moisture and salt transport in three-layer plaster/substrate systems . . . . . . . 47
5.1 Introduction . . . . . . . . . . . . . . . . . . . . . . . . . . . . . . . . . . . 47
5.2 Theory . . . . . . . . . . . . . . . . . . . . . . . . . . . . . . . . . . . . . 48
iii

5.3 Experimental . . . . . . . . . . . . . . . . . . . . . . . . . . . . . . . . . . 49
5.4 Results . . . . . . . . . . . . . . . . . . . . . . . . . . . . . . . . . . . . . 50
5.4.1 Plaster layers on a fired-clay brick substrate: an LS system . . . . 50
5.4.2 Plaster layers on Bentheimer sandstone substrate: a GPB system . 59
5.5 Conclusions . . . . . . . . . . . . . . . . . . . . . . . . . . . . . . . . . . . 67
6. Diffusion in porous building materials with high internal magnetic field gradients 69
6.1 Introduction . . . . . . . . . . . . . . . . . . . . . . . . . . . . . . . . . . . 69
6.2 NMR method . . . . . . . . . . . . . . . . . . . . . . . . . . . . . . . . . . 71
6.3 Experimental setup and materials . . . . . . . . . . . . . . . . . . . . . . . 74
6.4 Results . . . . . . . . . . . . . . . . . . . . . . . . . . . . . . . . . . . . . . 75
6.4.1 Glass filter . . . . . . . . . . . . . . . . . . . . . . . . . . . . . . . . 75
6.4.2 Fired-clay brick and sintered crushed glass . . . . . . . . . . . . . . 76
6.5 Discussion and conclusions . . . . . . . . . . . . . . . . . . . . . . . . . . . 79
6.6 Appendix: Magnetization Decay . . . . . . . . . . . . . . . . . . . . . . . . 82
7. Conclusions and outlook . . . . . . . . . . . . . . . . . . . . . . . . . . . . . . . 85
7.1 Conclusions . . . . . . . . . . . . . . . . . . . . . . . . . . . . . . . . . . . 85
7.2 Outlook . . . . . . . . . . . . . . . . . . . . . . . . . . . . . . . . . . . . . 87
References . . . . . . . . . . . . . . . . . . . . . . . . . . . . . . . . . . . . . . . . . 89
Summary . . . . . . . . . . . . . . . . . . . . . . . . . . . . . . . . . . . . . . . . . 95
Samenvatting . . . . . . . . . . . . . . . . . . . . . . . . . . . . . . . . . . . . . . . 97
List of Publications . . . . . . . . . . . . . . . . . . . . . . . . . . . . . . . . . . . . 99
Acknowledgement . . . . . . . . . . . . . . . . . . . . . . . . . . . . . . . . . . . . . 101
Curriculum vitae . . . . . . . . . . . . . . . . . . . . . . . . . . . . . . . . . . . . . 103
iv
1. Introduction
Plasters and renders may be applied as a finishing layer on masonry, for decorative,protective, and sometimes insulation reasons. They are used in new buildings, but alsofor restoration purposes in old buildings and monuments. The word ‘plaster’ is generallyused for indoor, the word ‘render’ for outdoor applications. For simplicity, in this thesisonly the word ‘plaster’ will be used. Plasters are applied on masonry, which here isgenerally referred to as substrate.
Once a plaster is applied it should be durable and its maintenance costs should below. Among the most recurrent causes of damage of plasters and substrates are moistureand salt decay processes. Although salt damage has been intensively investigated forseveral decades [Puh83, Gou97], the mechanisms and factors that control the formationof salt crystals in porous media and the development of damage by crystal growth arepoorly understood. Salt crystallization may occur at the surface of a plaster, causingefflorescence, or just below the surface, i.e., as sub-florescence or crypto-florescence. Hereit may cause more severe damage like sanding and crumbling of the surface or exfoliationand delamination. Salt crystallization and subsequent salt weathering of porous buildingmaterials are important consequences of the drying process.
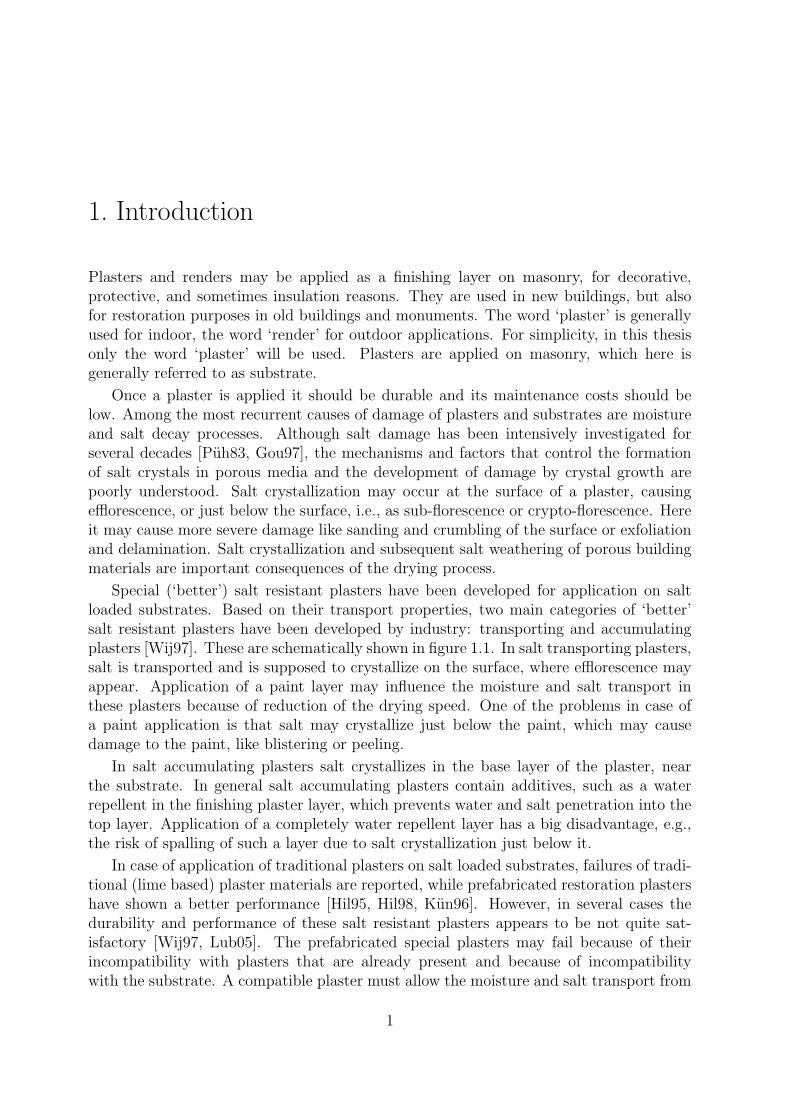
Special (‘better’) salt resistant plasters have been developed for application on saltloaded substrates. Based on their transport properties, two main categories of ‘better’salt resistant plasters have been developed by industry: transporting and accumulatingplasters [Wij97]. These are schematically shown in figure 1.1. In salt transporting plasters,salt is transported and is supposed to crystallize on the surface, where efflorescence mayappear. Application of a paint layer may influence the moisture and salt transport inthese plasters because of reduction of the drying speed. One of the problems in case ofa paint application is that salt may crystallize just below the paint, which may causedamage to the paint, like blistering or peeling.
In salt accumulating plasters salt crystallizes in the base layer of the plaster, nearthe substrate. In general salt accumulating plasters contain additives, such as a waterrepellent in the finishing plaster layer, which prevents water and salt penetration into thetop layer. Application of a completely water repellent layer has a big disadvantage, e.g.,the risk of spalling of such a layer due to salt crystallization just below it.
In case of application of traditional plasters on salt loaded substrates, failures of tradi-tional (lime based) plaster materials are reported, while prefabricated restoration plastershave shown a better performance [Hil95, Hil98, Kun96]. However, in several cases thedurability and performance of these salt resistant plasters appears to be not quite sat-isfactory [Wij97, Lub05]. The prefabricated special plasters may fail because of theirincompatibility with plasters that are already present and because of incompatibilitywith the substrate. A compatible plaster must allow the moisture and salt transport from
1

2 1. Introduction
p l a s t e r s u b s t r a t es u b s t r a t e
s a l t t r a n s p o r t s a l t t r a n s p o r t
s a l t a c c u m u l a t i o ns a l t a c c u m u l a t i o n
p l a s t e r
a ) b )dry
ing
drying
Fig. 1.1: Transport and accumulation in salt resistant plasters: a) transporting type, b) accumu-lating type (note that the actual system contains two layers). Salt crystallizes mainlyin the dashed area.
the underlying material (substrate) to the plaster layer. Furthermore, the plaster shouldhave a high durability and prevent damage to the substrate as much as possible [vH03b].The compatibility between plasters and underlying materials is an important durabilityissue. However, in the guidelines of the Wissenschaftlich-Technische Arbeitsgemeinshaft(WTA) for restoration plasters [WTA92] the influence of the substrates on the plasterperformance is not considered. Plasters are tested solely, without taking into account theproperties of the substrate [Wij00].
To achieve a better plaster performance, more knowledge about transport and saltcrystallization in the plasters and the substrates is needed. This thesis focuses on themoisture and salt transport in plaster/substrate systems during drying. Our aim is toinvestigate which material properties determine the transport behavior of the plaster, inparticular, whether plasters are behaving as a transporting or an accumulating system.To study the influence of the substrate on the transport in the plasters, we have appliedthe same plaster on substrate materials with significantly different pore-size distributions.We also want to investigate the possibility to develop salt accumulating plasters withoutthe use of a water repellent additive. To this end we have applied combinations of twolayers of plasters with different pore sizes on the substrate.
In chapter 2 the theory of moisture and ion transport is introduced. The basic princi-ples of the NMR technique, used for the experimental verification of the transport proper-ties of porous materials, are given in chapter 3. The NMR equipment is reviewed togetherwith the additional setup for controlling the environmental conditions of the samples thatare investigated. The transport of moisture and salt in two-layer plaster/substrate sys-tems is treated in chapter 4. In chapter 5 studies on the transport and salt accumulationin some three-layer systems are presented. Chapter 6 is devoted to the measurement ofthe water diffusion in building materials by NMR, which is complicated by the presenceof high internal magnetic field gradients in these materials. Finally, in chapter 7 the mainconclusions and suggestions for future research are given.
2. Transport of moisture and ions in porous media
The moisture and ion transport in saturated and unsaturated porous media porous media isreviewed briefly. The drying behavior of a material is determined by capillary pressure, andtherefore by pore-size distribution. As a consequence the largest pores are emptied first. Inlayered systems of different materials the material with larger pores should dry first. Ionsare transported via diffusion and advection with the flow of the water. These processesare described by a diffusion-advection equation. The competition between advection anddiffusion can be characterized by a Peclet number Pe. For high drying rates (Pe À 1)advection dominates the ion transport, whereas for low drying rates (Pe ¿ 1) diffusiondominates the ion transport.
2.1 Introduction
The transport of moisture and salts can be considered at both a microscopic and macro-scopic level. However, the detailed pore network and the transport over microscopic inter-faces can hardly be assessed experimentally and are too complex to describe mathemat-ically. Therefore, for practical relevance a description of the transport on a macroscopiclevel is needed. In this chapter some aspects of the theory of moisture and ion transportin porous media will be discussed. First, moisture transport in saturated and unsaturatedporous materials is treated on a macroscopic level. Next, transport in multi-layer sys-tems, including transport across the interfaces between the various layers, is connected tothe macroscopic capillary pressure and the pore sizes of the layers. Finally, diffusive andconvective transport of ions are considered.
2.2 Moisture transport
2.2.1 Saturated materials
Generally, moisture is transported by liquid and vapor. Liquid transport in a saturatedporous medium can be described with Darcy’s law. The volume flux of water q [m3m−2s−1]through a water saturated porous medium is a function of the gradient of the pressure p[Pa]. In the one-dimensional case this law reads:
q = −k
µ
∂p
∂x, (2.1)
where k [m2] and µ [kg m−1s−1] are the permeability of the material and the viscosityof the liquid, respectively.
3
4 2. Transport of moisture and ions in porous media
2.2.2 Non-saturated materials
In non-saturated materials the volume flux q is the sum of the liquid flux ql and the vaporflux qv. The liquid flux ql can also be described with Darcy’s law [Dul91, Hal02]. However,now both the permeability k and the pressure p are functions of the liquid content θ:
ql = −k(θ)
µ
∂p(θ)
∂x. (2.2)
The pressure in the liquid phase p [Pa] is given by the following expression:
p = pa − pc(θ) , (2.3)
where pa and pc [Pa] are the external air pressure and the capillary pressure, respectively.
At a macroscopic level the capillary pressure can be regarded as a function of the liquidmoisture content θ. This dependence is described by capillary pressure curves [Dul91],which show that pc increases with decreasing θ in the case that water wets the solid. Thiscan be understood as follows. At a certain water content θ, a pore radius rm can bedefined [Plo03, Kop00], that discriminates between pores filled with water (r < rm) andempty pores (r > rm). Assuming cylindrical pores, the capillary pressure at a certainvalue of θ is given by the following expression [Dul91, Bea90]:
pc =2γ
rm
cos φ , (2.4)
where γ [N m−1] is the surface tension of the liquid/vapor interface and φ is contact anglebetween liquid/air and liquid/solid interface. With increasing θ the radius of the widestpore just filled with water, rm, increases and therefore pc decreases.
The transport in the vapor phase is a diffusive process. When the vapor behaves as anideal gas and the temperature over the sample is constant, the vapor flux qv [m3m−2s−1]obeys the following expression for the one-dimensional case [Dul91]:
qv = −vDv∂ρv
∂x, (2.5)
where Dv [m2 s−1] and ρv [mol m−3] are the diffusion constant and the molar density ofthe vapor, respectively. The quantity v [m3] is the molar volume of water in the liquidphase. Both Dv and ρv are functions of the water content θ.
The rate at which the local moisture content varies can be found with the help of thelaw of mass conservation:
∂θ
∂t= −∂q
∂x= − ∂
∂x(θU) , (2.6)
where U [m s−1] is the water velocity. When liquid transport dominates the water move-ment, U is in fact the velocity of the water in the liquid phase.
The velocity profiles can be calculated from the moisture profiles using the followingequation, which can be derived directly from Eq. 2.6:
2.2. Moisture transport 5
U(x) =1
θ(x)
∂
∂t
∫ l
x
θ(x′) dx′ . (2.7)
In this equation l [m] is length of the sample and∫ l
xθ(x′) dx′ is the integral of the moisture
content over the sample from position x to l. Here it is assumed that at x = l there is noflux, for instance, because the sample is sealed at that side.
Masonry is a composite material, consisting of brick units and mortar, which arematerials with different transport properties. Additional mortar layers (plasters) areoften applied on the masonry for decorative and protective reasons. In such multi-layermaterials two types of interfaces can be identified: air/material and material/material[Pel95]. The air/material boundary conditions are treated in [Pel95, Hal02]. The dryingrate is proportional to the vapor flux ~qv [m3m−2s−1] at this boundary, which is given by:
~qv · ~n =β
ρl
(ha − hl) , (2.8)
where ~n is the unit vector perpendicular to the air/material interface, β [mol m−2s−1] themolar mass transfer coefficient, and ρl [mol m−3] the molar density of liquid water. ha isthe relative humidity of the air and hl the relative humidity at the air/fluid interface. Thetransfer coefficient β depends on many parameters, such as the air velocity, the thicknessof the boundary layer above the drying surface, and the porosity of the material.
If two materials are in perfect hydraulic contact, at their interface a local equilibriumis assumed. Therefore, the pressure drop is negligible in comparison to the pressure dropin the whole system. The flux q and total pressure p at the interface are assumed to becontinuous [Hal02, Bro97]:
q1 = q2 and p1 = p2 , (2.9)
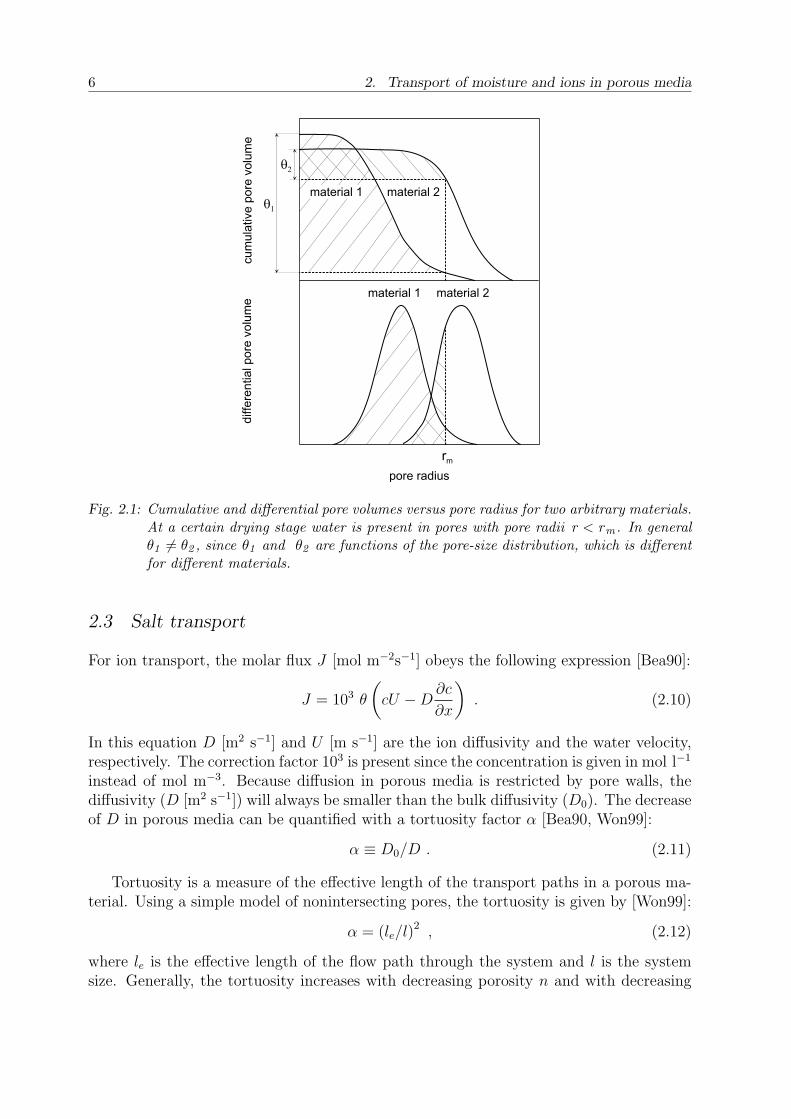
where the indices 1,2 indicate both sides of an interface between two materials. Since atthe interface local equilibrium is assumed, the composition of the fluid is the same at bothsides of the interface and, hence, the salt concentration c is continuous at the interface. Forpartially saturated materials, the continuity of the total pressure results in a continuityof the capillary pressure, see Eq. 2.3. Therefore, rm(θ1) = rm(θ2), where θ1 and θ2 arethe moisture contents in material 1 and material 2, respectively. In figure 2.1, pore-sizedistributions of some materials are shown. At a certain moisture content, water is presentin pores with a radius smaller than rm (shaded areas in Fig. 2.1). Since, generally, θ1
and θ2 are different functions of the pore-size distribution, the moisture contents in bothmaterials will differ (θ1 6= θ2) and θ will be discontinuous at the interface.
In the case of an imperfect contact the pressure drop cannot be neglected and aninterfacial resistance should be incorporated for a correct description of the experimentalresults [Bro98b]. The equations for the moisture flux for perfect and imperfect hydrauliccontact are given [Bro97]. One should note that the study described in this thesis isconfined to drying experiments, which generally involve much longer time scales andmuch slower processes than wetting experiments. Indeed, numerical simulations of thetransport over a brick-mortar joint [Bro98a] were in much better agreement with theexperimental data for drying than for water absorption. Moreover, the impact of aninterface permeability seemed to decrease as the drying of the sample proceeded.
6 2. Transport of moisture and ions in porous media
r m
m a t e r i a l 2q 2
q 1
m a t e r i a l 1
p o r e r a d i u s
differ
entia
l pore
volum
ecu
mulat
ive po
re vo
lume
m a t e r i a l 2m a t e r i a l 1
Fig. 2.1: Cumulative and differential pore volumes versus pore radius for two arbitrary materials.At a certain drying stage water is present in pores with pore radii r < rm . In generalθ1 6= θ2 , since θ1 and θ2 are functions of the pore-size distribution, which is differentfor different materials.
2.3 Salt transport
For ion transport, the molar flux J [mol m−2s−1] obeys the following expression [Bea90]:
J = 103 θ
(cU −D
∂c
∂x
). (2.10)
In this equation D [m2 s−1] and U [m s−1] are the ion diffusivity and the water velocity,respectively. The correction factor 103 is present since the concentration is given in mol l−1
instead of mol m−3. Because diffusion in porous media is restricted by pore walls, thediffusivity (D [m2 s−1]) will always be smaller than the bulk diffusivity (D0). The decreaseof D in porous media can be quantified with a tortuosity factor α [Bea90, Won99]:
α ≡ D0/D . (2.11)
Tortuosity is a measure of the effective length of the transport paths in a porous ma-terial. Using a simple model of nonintersecting pores, the tortuosity is given by [Won99]:
α = (le/l)2 , (2.12)
where le is the effective length of the flow path through the system and l is the systemsize. Generally, the tortuosity increases with decreasing porosity n and with decreasing
2.3. Salt transport 7
moisture content θ. The bulk diffusivity of the ions (D0) and the ion diffusivity in aporous material (D) depend on the ion concentration c [Mil89].
Changes in salt content can be calculated with the following law of mass conservation:
∂cθ
∂t= −10−3 ∂J
∂x. (2.13)
where 10−3 is again the correction factor accounting for the fact that the concentration isgiven in mol l−1 instead of mol m−3.
By combining equations 2.10 and 2.13, the ion transport can be described with adiffusion-advection equation [Wil88]:
∂cθ
∂t=
∂
∂x
[θ
(D
∂c
∂x− cU
)]. (2.14)
This equation yields the variation of solute density cθ [mol l−1] with time t and positionx. The first term at the right hand side accounts for diffusion and the second term foradvection. The dissolved ions are transported by advection in the same direction as thewater flows. Diffusion tends to level off the concentration differences in the sample.
The competition between advection and diffusion is characterized by a dimensionlessPeclet number Pe [Bea90, Dul91], which is defined as follows:
Pe =|U |LD
, (2.15)
where L [m] is the length scale of interest. For Pe À1, the product of the water velocityand the length scale |U |L exceeds the diffusion constant D. This reflects the situationwhere advection dominates the ion transport. For Pe ¿1, the diffusion constant exceedsthe |U |L product, and diffusion dominates the ion transport.

8 2. Transport of moisture and ions in porous media
3. NMR
Nuclear Magnetic Resonance (NMR) is a non-destructive technique, suitable for probingthe molecular motions on both microscopic and macroscopic scales, such as the transportof water and dissolved ions in porous materials. In this chapter we introduce the NMRmethods and the NMR setup used for the experimental investigations described in this the-sis. The time evolution of the moisture profiles and the profiles of dissolved sodium can bemeasured quasi-simultaneously, which enables us to monitor the transport of moisture andsalt during drying of (layered) porous media on a macroscopic level. Using a Hahn spin-echo pulse sequence and a static magnetic field gradient of 0.3 T/m, measurements can beperformed with a spatial resolution of 0 .9 ± 0 .1 mm for H and 3 .5 ± 0 .5 mm for Na,which is very accurate compared to conventional destructive techniques (hygroscopic mois-ture content analysis, chemical methods). It is outlined that using a stimulated echo pulsesequence the self-diffusion of water in porous materials can be measured up to diffusiontimes exceeding 1 s.
3.1 Introduction
Diffusion on both macroscopic and microscopic scales (self-diffusion) plays an importantrole in moisture and ion transport in porous media. For the experimental assessment ofsuch molecular motions in bulk or in porous media, Nuclear Magnetic Resonance (NMR)has proven to be a non-destructive and sensitive technique [Woe61, Tan68, Kim97, Blu00].NMR has been used to determine microscopic (self)diffusion constants of water and ionsin a broad concentration range [Mil89]. In the present chapter the basics of the NMR tech-nique are introduced first, followed by the Magnetic Resonance Imaging (MRI) method,which we use for monitoring macroscopic transport in porous media. Next, the methodsand the NMR sequences for the determination of diffusion coefficients are given. Finally,the NMR measurement equipment used for the experiments presented in this thesis isdescribed.
3.2 Principles of NMR
The principles of Nuclear Magnetic Resonance are treated in numerous papers and text-books [Far71, Cal91, Lev01]. The method is based on the fact that most nuclei possesa nuclear magnetic moment (for 1H, this moment is about 2000 times smaller than that
of an electron [Atk02]). When a sample is placed in an external magnetic field ~B0, theHamiltonian (H) describing the interaction between the nuclear magnetic moment ~µ and
9
10 3. NMR
the field ~B0 is:
H = −~µ · ~B0, (3.1)
where
~µ = γ~~I. (3.2)
Here γ is the gyromagnetic ratio of the nucleus, ~ is Plank’s constant (h = 6.626×10⁻³⁴ Js)
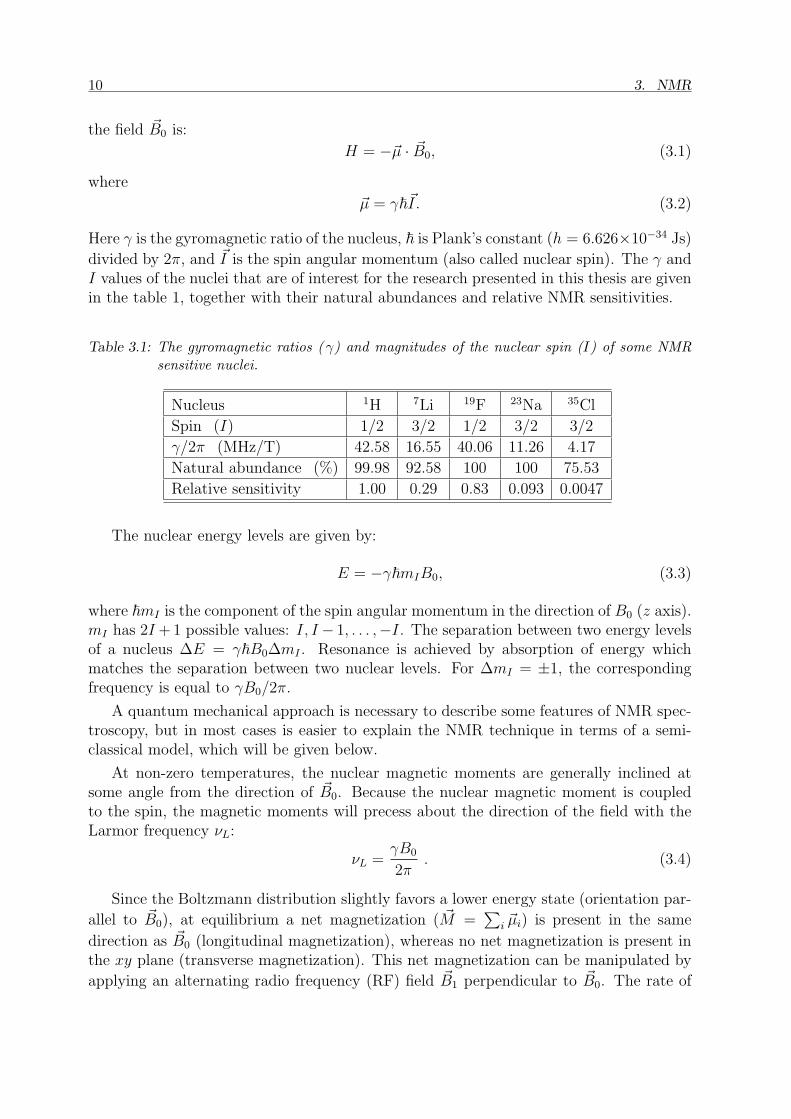
divided by 2π, and ~I is the spin angular momentum (also called nuclear spin). The γ andI values of the nuclei that are of interest for the research presented in this thesis are givenin the table 1, together with their natural abundances and relative NMR sensitivities.
Table 3.1: The gyromagnetic ratios ( γ) and magnitudes of the nuclear spin (I) of some NMRsensitive nuclei.
Nucleus 1H 7Li 19F 23Na 35Cl
Spin (I) 1/2 3/2 1/2 3/2 3/2
γ/2π (MHz/T) 42.58 16.55 40.06 11.26 4.17
Natural abundance (%) 99.98 92.58 100 100 75.53
Relative sensitivity 1.00 0.29 0.83 0.093 0.0047
The nuclear energy levels are given by:
E = −γ~mIB0, (3.3)
where ~mI is the component of the spin angular momentum in the direction of B0 (z axis).mI has 2I +1 possible values: I, I − 1, . . . ,−I. The separation between two energy levelsof a nucleus ∆E = γ~B0∆mI . Resonance is achieved by absorption of energy whichmatches the separation between two nuclear levels. For ∆mI = ±1, the correspondingfrequency is equal to γB0/2π.
A quantum mechanical approach is necessary to describe some features of NMR spec-troscopy, but in most cases is easier to explain the NMR technique in terms of a semi-classical model, which will be given below.
At non-zero temperatures, the nuclear magnetic moments are generally inclined atsome angle from the direction of ~B0. Because the nuclear magnetic moment is coupledto the spin, the magnetic moments will precess about the direction of the field with theLarmor frequency νL:
νL =γB0
2π. (3.4)
Since the Boltzmann distribution slightly favors a lower energy state (orientation par-
allel to ~B0), at equilibrium a net magnetization ( ~M =∑
i ~µi) is present in the same
direction as ~B0 (longitudinal magnetization), whereas no net magnetization is present inthe xy plane (transverse magnetization). This net magnetization can be manipulated by
applying an alternating radio frequency (RF) field ~B1 perpendicular to ~B0. The rate of
3.3. Determination of water and salt profiles by MRI 11
change of ~M depends upon the torque, ~M × ~B, exerted on the magnetization by themagnetic field:
d ~M
dt= γ ~M × ~B. (3.5)
Here ~B is the total magnetic field, which now consists of the static field ~B0 and the RFfield ~B1, rotating in the xy plane at an angular frequency ω:
~B(t) =
B1 cos ωtB1 sin ωt
B0
. (3.6)
The resulting motion of the magnetization is given by the Bloch equations [Blo46]:
dMx/dt = γ(MyB0 + MzB1 sin ωt)−Mx/T2
dMy/dt = γ(MzB1 cos ωt−MxB0)−My/T2
dMz/dt = −γ(MxB1 sin ωt + MyB1 cos ωt)− (Mz −M0)/T2.(3.7)
These equations contain two relaxation times, T1 and T2, describing the restoration of thelongitudinal magnetization to its equilibrium value and the decay of transverse magneti-zation, respectively.
When, at equilibrium, the RF field ~B1 is applied at the Larmor frequency, it can beshown that the net nuclear magnetization starts to rotate from the z axis towards the xyplane. By applying the RF field during a ‘pulse’), the net magnetization is rotated by anangle θ:
θ = γB1∆t. (3.8)
The duration of the RF pulse is chosen such to rotate the net magnetization M bya so-called flip angle, specific for a particular experiment (and pulse sequence). After acommonly used 90◦ pulse, the magnetization is in the xy plane. This so-called transversemagnetization now rotates around ~B0 at the Larmor frequency, thereby inducing a signalin a pick up coil. The decay of this transverse magnetization by relaxation processes andby diffusion of nuclei will be considered in the next section in more detail.
3.3 Determination of water and salt profiles by MRI
Magnetic resonance imaging (MRI) is based on the principles of Nuclear Magnetic Res-onance. It is described extensively in the literature [Haa99, Vla99]. MRI is a non-destructive method for obtaining images from the NMR signal of thin slices through thehuman body or another medium. It can be used for quantitative and selective mappingof several chemical elements in materials, because the resonance condition of a certaintype of nucleus depends on the gyromagnetic ratio (table 3.1). Since the degradation ofbuilding materials is closely connected to the moisture and salt transport, we will focuson 1H and 23Na density profiles.
When the applied magnetic field is homogeneous, all nuclei of a certain type in thesample are at resonance at the same frequency, and a signal from the whole sample
12 3. NMR
is obtained. To achieve spatial resolution, the resonance frequency is made positiondependent by superimposing a magnetic field gradient Gα (α = x, y, z) on the mainmagnetic field B0:
ν(α) = γ(B0 + Gαα), (3.9)
where α is a position in the sample along the direction of the magnetic field gradientGα. For 3D imaging magnetic field gradients are applied in three orthogonal directions.Selection of an imaging plane (slice) through the sample is done by a slice selectiongradient, applied during the RF pulse. The selected slice is perpendicular to the fieldgradient. The RF pulse will rotate only the spins within the selected slice. The rest ofthe spins in the sample will be unaffected by the RF pulse.
9 0R F e c h o
a c qt
R F R F1 8 0 9 0
G
tE
Rtt
o o o
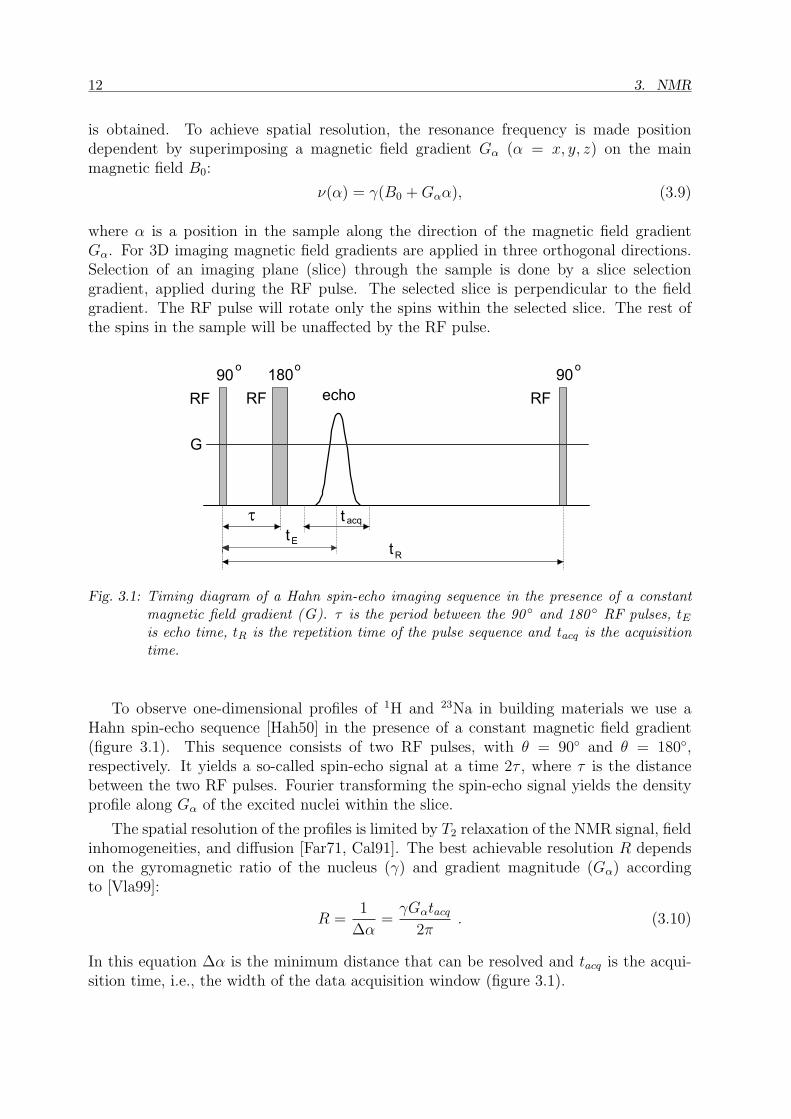
Fig. 3.1: Timing diagram of a Hahn spin-echo imaging sequence in the presence of a constantmagnetic field gradient (G). τ is the period between the 90 ◦ and 180 ◦ RF pulses, tEis echo time, tR is the repetition time of the pulse sequence and tacq is the acquisitiontime.
To observe one-dimensional profiles of 1H and 23Na in building materials we use aHahn spin-echo sequence [Hah50] in the presence of a constant magnetic field gradient(figure 3.1). This sequence consists of two RF pulses, with θ = 90◦ and θ = 180◦,respectively. It yields a so-called spin-echo signal at a time 2τ , where τ is the distancebetween the two RF pulses. Fourier transforming the spin-echo signal yields the densityprofile along Gα of the excited nuclei within the slice.
The spatial resolution of the profiles is limited by T2 relaxation of the NMR signal, fieldinhomogeneities, and diffusion [Far71, Cal91]. The best achievable resolution R dependson the gyromagnetic ratio of the nucleus (γ) and gradient magnitude (Gα) accordingto [Vla99]:
R =1
∆α=
γGαtacq
2π. (3.10)
In this equation ∆α is the minimum distance that can be resolved and tacq is the acqui-sition time, i.e., the width of the data acquisition window (figure 3.1).
3.4. Determination of the diffusion coefficient 13
For moisture and ions within a porous material T2 ¿ T1. In this case the intensity ofthe received signal is given by [Cal91]:
S = kρ[1− exp(−tR/T1)] exp(−tE/T2), (3.11)
where k is the sensitivity of the nuclei relative to that of hydrogen, ρ is the density ofthe nuclei, tR is the repetition time of the pulse sequence and tE is the echo time (figure3.1). To obtain absolute values for the density profile within the selected slice, the signalattenuation due to T1 and T2 has to be taken into account. By changing the Larmorfrequency, the position of the selected slice can be changed, see Eq. 3.9. Alternatively,the position of the selected slice can be changed by moving the sample by means of step-motor along the direction of the field gradient (see chapter 4). From the density profilesof all individual slices, H or Na density profiles in the complete sample are obtained.
3.4 Determination of the diffusion coefficient
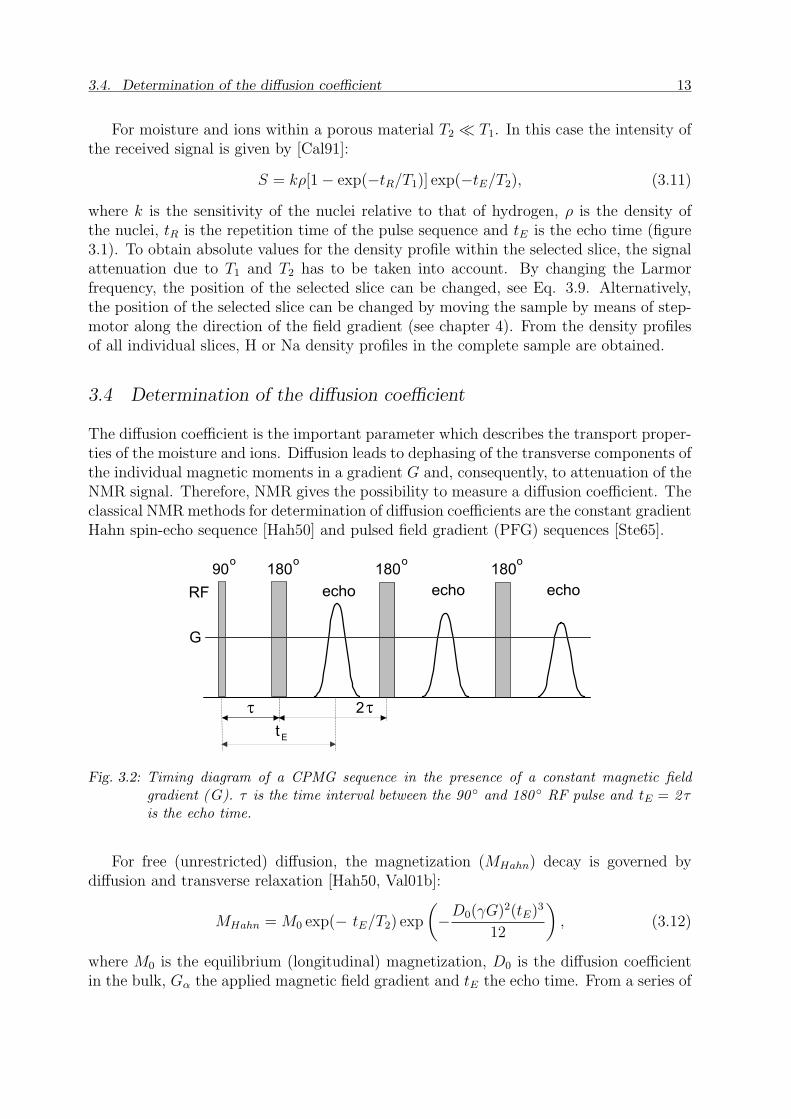
The diffusion coefficient is the important parameter which describes the transport proper-ties of the moisture and ions. Diffusion leads to dephasing of the transverse components ofthe individual magnetic moments in a gradient G and, consequently, to attenuation of theNMR signal. Therefore, NMR gives the possibility to measure a diffusion coefficient. Theclassical NMR methods for determination of diffusion coefficients are the constant gradientHahn spin-echo sequence [Hah50] and pulsed field gradient (PFG) sequences [Ste65].
9 0R F e c h o
t
1 8 0
G
t
1 8 0 1 8 0e c h o e c h o
E
o o o o
2 t
Fig. 3.2: Timing diagram of a CPMG sequence in the presence of a constant magnetic fieldgradient (G). τ is the time interval between the 90 ◦ and 180 ◦ RF pulse and tE = 2 τis the echo time.
For free (unrestricted) diffusion, the magnetization (MHahn) decay is governed bydiffusion and transverse relaxation [Hah50, Val01b]:
MHahn = M0 exp(− tE/T2) exp
(−D0(γG)2(tE)3
12
), (3.12)
where M0 is the equilibrium (longitudinal) magnetization, D0 is the diffusion coefficientin the bulk, Gα the applied magnetic field gradient and tE the echo time. From a series of
14 3. NMR
measurements at different values of tE it is possible to determine the diffusion coefficientif the T2 relaxation term is known. The latter can be obtained from a Carr-Purcell-Meiboom-Gill (CPMG) measurement [Car54]. The CPMG sequence consists of a train ofRF pulses (Fig. 3.2), of which the first one (a 90◦ pulse) rotates the net magnetization inthe transverse (xy) plane. After that the magnetization is manipulated in the xy planeby a series of 180◦ pulses resulting in a series of echoes. If the time interval between thesuccessive 180◦ pulses is sufficiently short [Val01b], the signal decay of this echo series isgoverned by T2 relaxation, because the dephasing due to diffusion is largely compensated.In that case, the decay of the magnetization (MCPMG) is given by:
MCPMG = M0 exp(− t/T2). (3.13)
The Hahn spin-echo pulse sequence is mainly used to determine the diffusivity in bulkliquids. The transverse relaxation of the spins in a liquid confined in a porous medium isoften very fast (T2 < 20 ms [Val01a, Val02]) and depends on the pore size [Bro79, Val01a].This hampers an accurate determination of the diffusivity, especially at longer time scales(up to a few seconds). In that case the stimulated echo method is used.
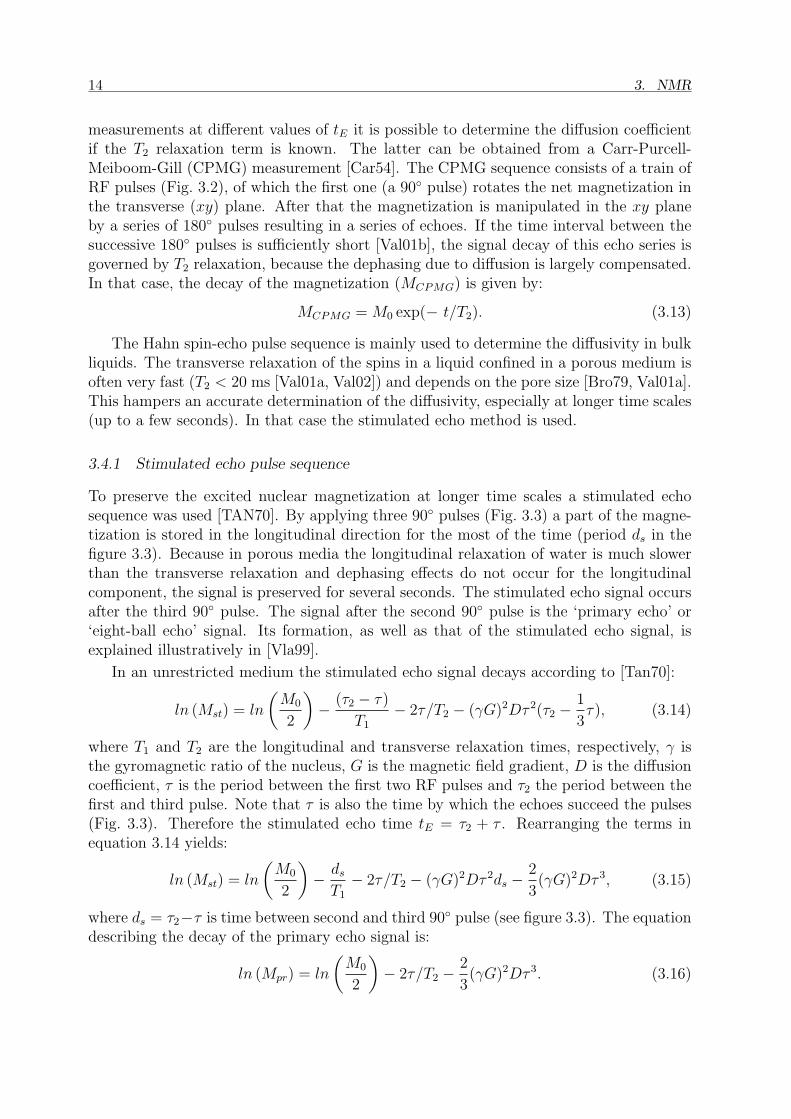
3.4.1 Stimulated echo pulse sequence
To preserve the excited nuclear magnetization at longer time scales a stimulated echosequence was used [TAN70]. By applying three 90◦ pulses (Fig. 3.3) a part of the magne-tization is stored in the longitudinal direction for the most of the time (period ds in thefigure 3.3). Because in porous media the longitudinal relaxation of water is much slowerthan the transverse relaxation and dephasing effects do not occur for the longitudinalcomponent, the signal is preserved for several seconds. The stimulated echo signal occursafter the third 90◦ pulse. The signal after the second 90◦ pulse is the ‘primary echo’ or‘eight-ball echo’ signal. Its formation, as well as that of the stimulated echo signal, isexplained illustratively in [Vla99].
In an unrestricted medium the stimulated echo signal decays according to [Tan70]:
ln (Mst) = ln
(M0
2
)− (τ2 − τ)
T1
− 2τ/T2 − (γG)2Dτ 2(τ2 − 1
3τ), (3.14)
where T1 and T2 are the longitudinal and transverse relaxation times, respectively, γ isthe gyromagnetic ratio of the nucleus, G is the magnetic field gradient, D is the diffusioncoefficient, τ is the period between the first two RF pulses and τ2 the period between thefirst and third pulse. Note that τ is also the time by which the echoes succeed the pulses(Fig. 3.3). Therefore the stimulated echo time tE = τ2 + τ . Rearranging the terms inequation 3.14 yields:
ln (Mst) = ln
(M0
2
)− ds
T1
− 2τ/T2 − (γG)2Dτ 2ds − 2
3(γG)2Dτ 3, (3.15)
where ds = τ2−τ is time between second and third 90◦ pulse (see figure 3.3). The equationdescribing the decay of the primary echo signal is:
ln (Mpr) = ln
(M0
2
)− 2τ/T2 − 2
3(γG)2Dτ 3. (3.16)
3.4. Determination of the diffusion coefficient 15
t
9 0 o
R F
t
9 0 9 0p r i m a r ye c h o s t i m u l a t e de c h oR F R F
1t
t3
G
oo
E
d St 2
Fig. 3.3: Timing diagram of the stimulated echo pulse sequence with a constant field gradient.The signal decay can be measured as a function of echo time ( τE) by changing the timebetween the second and third RF pulse ( ds), for different τ and G values.
By dividing Eq. 3.15 by Eq. 3.16, T2 relaxation effects and attenuation due to diffusionduring the time interval τ are eliminated:
ln
(Mst
Mpr
)= −
[1
T1
+ (γG)2Dτ 2
]ds. (3.17)
For measurements of the diffusivity at long time scales τ ¿ τ2 in equation 3.17,ds = τ2 − τ ' tE, where tE is the stimulated echo time. Dividing the two echo intensitiesalso eliminates the effect of variations of the sensitivity of the equipment, if measurementsare performed during extended periods of time. Another advantage of this approach isthat measurements on different materials can be compared directly without any signalnormalization.
D = D 0
D < D 0
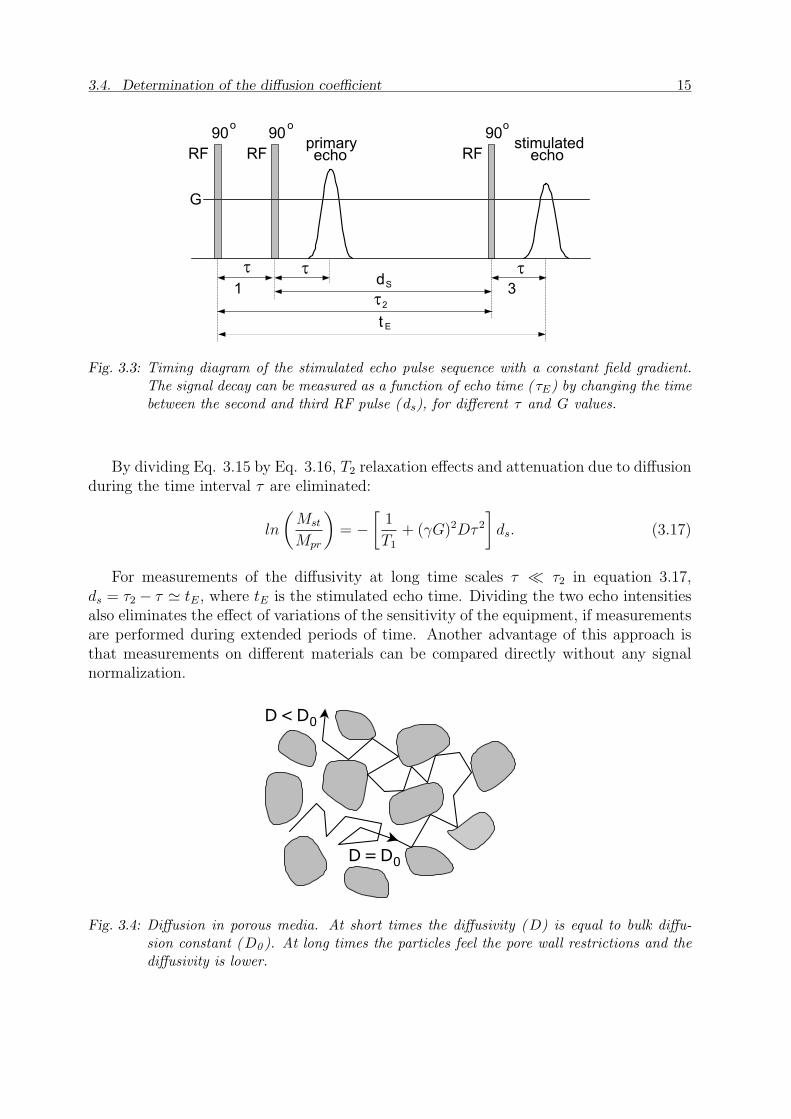
Fig. 3.4: Diffusion in porous media. At short times the diffusivity (D) is equal to bulk diffu-sion constant (D0 ). At long times the particles feel the pore wall restrictions and thediffusivity is lower.
16 3. NMR
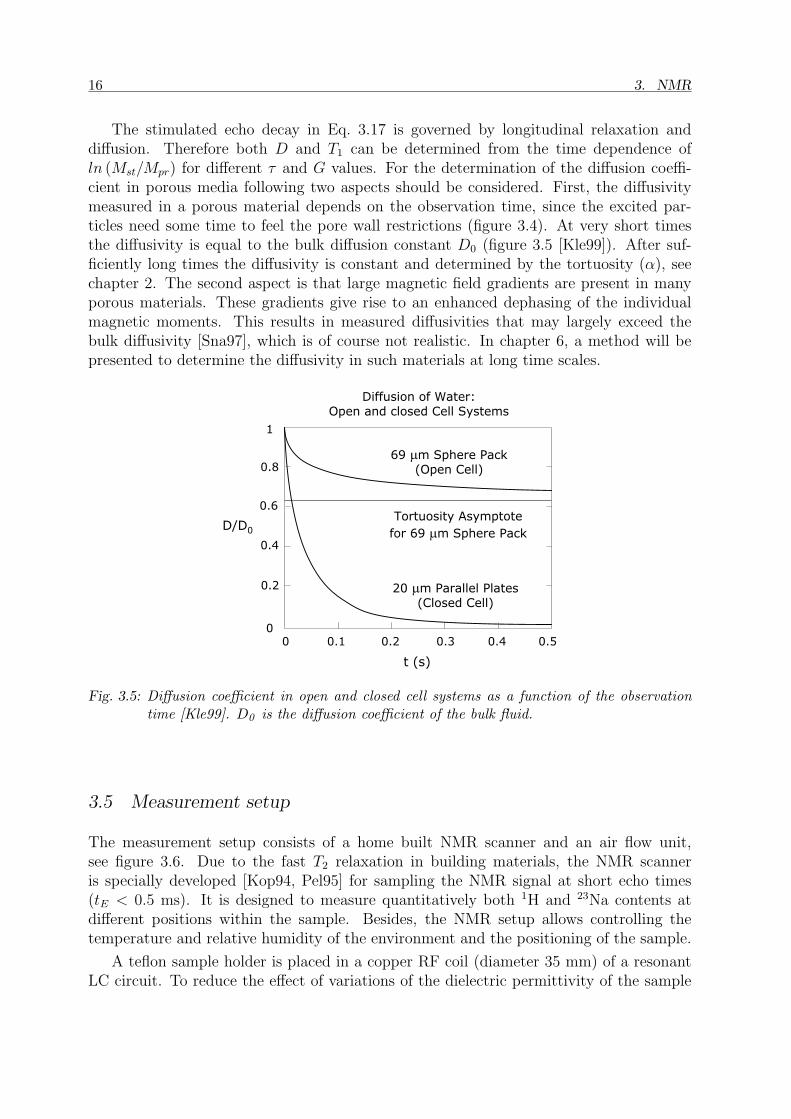
The stimulated echo decay in Eq. 3.17 is governed by longitudinal relaxation anddiffusion. Therefore both D and T1 can be determined from the time dependence ofln (Mst/Mpr) for different τ and G values. For the determination of the diffusion coeffi-cient in porous media following two aspects should be considered. First, the diffusivitymeasured in a porous material depends on the observation time, since the excited par-ticles need some time to feel the pore wall restrictions (figure 3.4). At very short timesthe diffusivity is equal to the bulk diffusion constant D0 (figure 3.5 [Kle99]). After suf-ficiently long times the diffusivity is constant and determined by the tortuosity (α), seechapter 2. The second aspect is that large magnetic field gradients are present in manyporous materials. These gradients give rise to an enhanced dephasing of the individualmagnetic moments. This results in measured diffusivities that may largely exceed thebulk diffusivity [Sna97], which is of course not realistic. In chapter 6, a method will bepresented to determine the diffusivity in such materials at long time scales.
D i f f u s i o n o f W a t e r :O p e n a n d c l o s e d C e l l S y s t e m s
D / D 0
6 9 m m S p h e r e P a c k( O p e n C e l l )
T o r t u o s i t y A s y m p t o t e f o r 6 9 m m S p h e r e P a c k
2 0 m m P a r a l l e l P l a t e s( C l o s e d C e l l )
t ( s )
0
0 . 2
0 . 4
0 . 6
0 . 8
1
0 . 1 0 . 2 0 . 3 0 . 4 0 . 50
Fig. 3.5: Diffusion coefficient in open and closed cell systems as a function of the observationtime [Kle99]. D0 is the diffusion coefficient of the bulk fluid.
3.5 Measurement setup
The measurement setup consists of a home built NMR scanner and an air flow unit,see figure 3.6. Due to the fast T2 relaxation in building materials, the NMR scanneris specially developed [Kop94, Pel95] for sampling the NMR signal at short echo times(tE < 0.5 ms). It is designed to measure quantitatively both 1H and 23Na contents atdifferent positions within the sample. Besides, the NMR setup allows controlling thetemperature and relative humidity of the environment and the positioning of the sample.
A teflon sample holder is placed in a copper RF coil (diameter 35 mm) of a resonantLC circuit. To reduce the effect of variations of the dielectric permittivity of the sample
3.5. Measurement setup 17
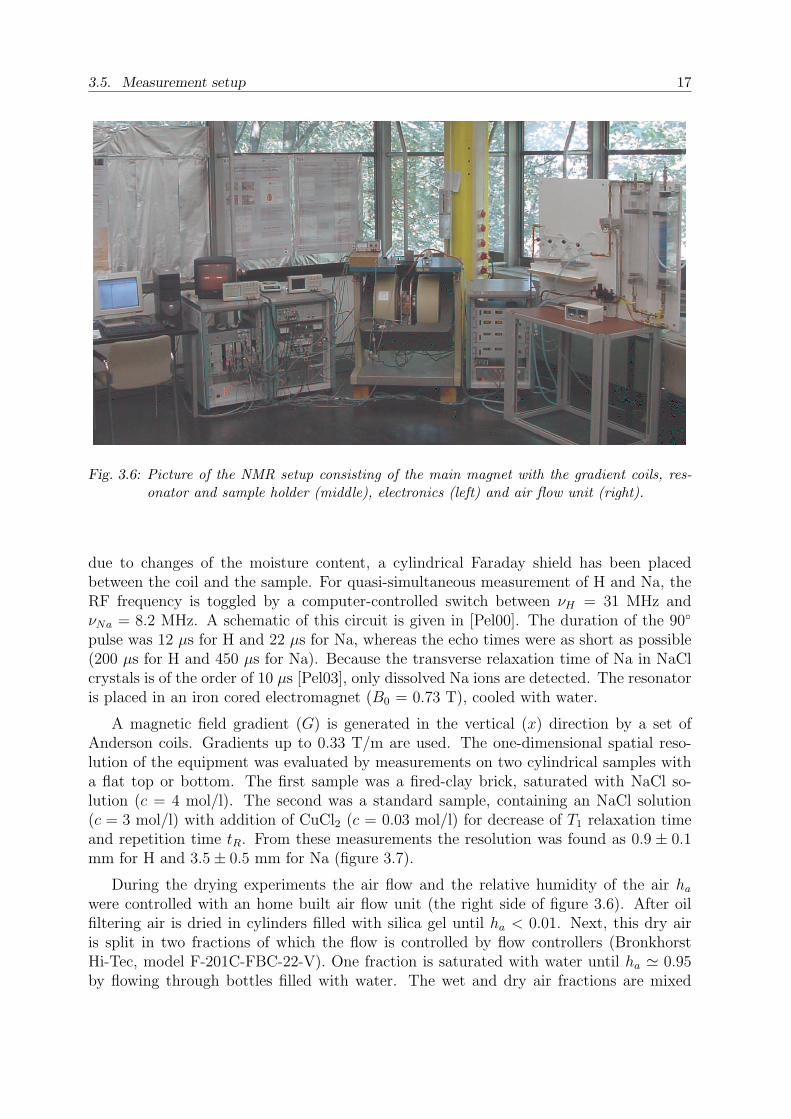
Fig. 3.6: Picture of the NMR setup consisting of the main magnet with the gradient coils, res-onator and sample holder (middle), electronics (left) and air flow unit (right).
due to changes of the moisture content, a cylindrical Faraday shield has been placedbetween the coil and the sample. For quasi-simultaneous measurement of H and Na, theRF frequency is toggled by a computer-controlled switch between νH = 31 MHz andνNa = 8.2 MHz. A schematic of this circuit is given in [Pel00]. The duration of the 90◦
pulse was 12 µs for H and 22 µs for Na, whereas the echo times were as short as possible(200 µs for H and 450 µs for Na). Because the transverse relaxation time of Na in NaClcrystals is of the order of 10 µs [Pel03], only dissolved Na ions are detected. The resonatoris placed in an iron cored electromagnet (B0 = 0.73 T), cooled with water.
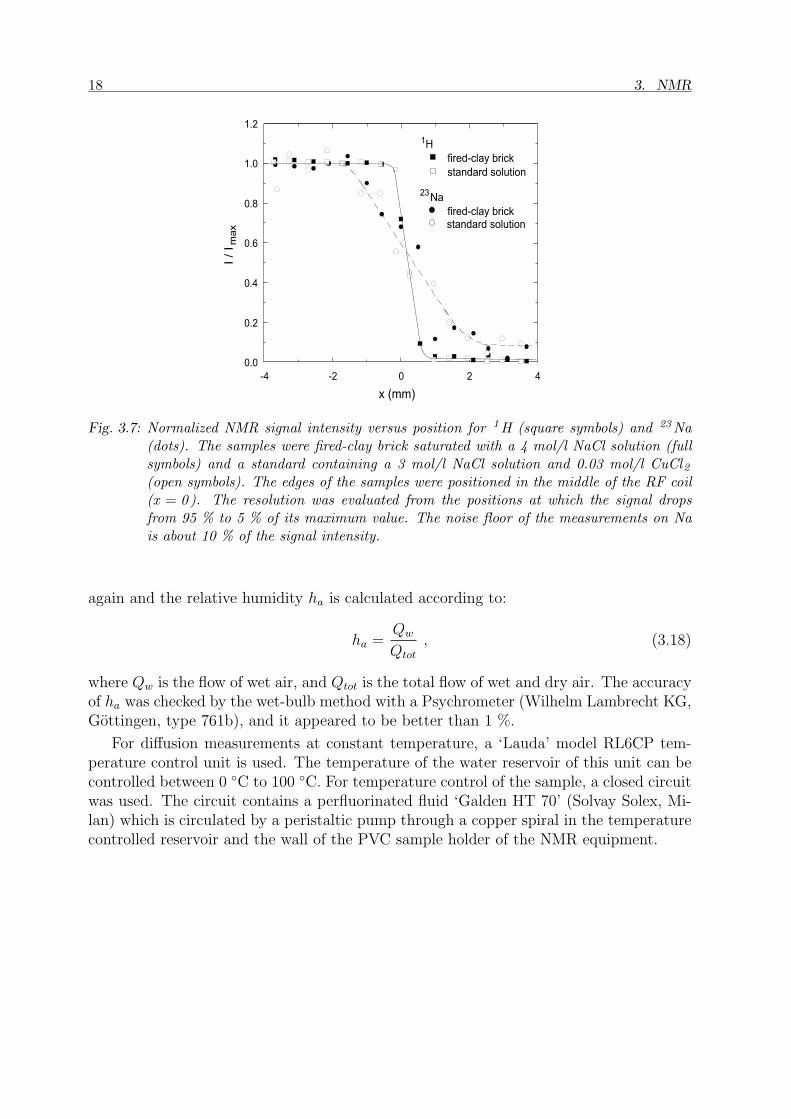
A magnetic field gradient (G) is generated in the vertical (x) direction by a set ofAnderson coils. Gradients up to 0.33 T/m are used. The one-dimensional spatial reso-lution of the equipment was evaluated by measurements on two cylindrical samples witha flat top or bottom. The first sample was a fired-clay brick, saturated with NaCl so-lution (c = 4 mol/l). The second was a standard sample, containing an NaCl solution(c = 3 mol/l) with addition of CuCl2 (c = 0.03 mol/l) for decrease of T1 relaxation timeand repetition time tR. From these measurements the resolution was found as 0.9 ± 0.1mm for H and 3.5± 0.5 mm for Na (figure 3.7).
During the drying experiments the air flow and the relative humidity of the air ha
were controlled with an home built air flow unit (the right side of figure 3.6). After oilfiltering air is dried in cylinders filled with silica gel until ha < 0.01. Next, this dry airis split in two fractions of which the flow is controlled by flow controllers (BronkhorstHi-Tec, model F-201C-FBC-22-V). One fraction is saturated with water until ha ' 0.95by flowing through bottles filled with water. The wet and dry air fractions are mixed
18 3. NMR
- 4 - 2 0 2 40 . 0
0 . 2
0 . 4
0 . 6
0 . 8
1 . 0
1 . 2
2 3 N a f i r e d - c l a y b r i c k
1 H f i r e d - c l a y b r i c k
I / I m
ax
x ( m m )
s t a n d a r d s o l u t i o n
s t a n d a r d s o l u t i o n
Fig. 3.7: Normalized NMR signal intensity versus position for 1H (square symbols) and 23Na(dots). The samples were fired-clay brick saturated with a 4 mol/l NaCl solution (fullsymbols) and a standard containing a 3 mol/l NaCl solution and 0.03 mol/l CuCl2(open symbols). The edges of the samples were positioned in the middle of the RF coil(x = 0). The resolution was evaluated from the positions at which the signal dropsfrom 95 % to 5 % of its maximum value. The noise floor of the measurements on Nais about 10 % of the signal intensity.
again and the relative humidity ha is calculated according to:
ha =Qw
Qtot
, (3.18)
where Qw is the flow of wet air, and Qtot is the total flow of wet and dry air. The accuracyof ha was checked by the wet-bulb method with a Psychrometer (Wilhelm Lambrecht KG,Gottingen, type 761b), and it appeared to be better than 1 %.
For diffusion measurements at constant temperature, a ‘Lauda’ model RL6CP tem-perature control unit is used. The temperature of the water reservoir of this unit can becontrolled between 0 ◦C to 100 ◦C. For temperature control of the sample, a closed circuitwas used. The circuit contains a perfluorinated fluid ‘Galden HT 70’ (Solvay Solex, Mi-lan) which is circulated by a peristaltic pump through a copper spiral in the temperaturecontrolled reservoir and the wall of the PVC sample holder of the NMR equipment.
4. Moisture and salt transport in plaster/substratelayers
Moisture and salt decay processes are amongst the most recurrent causes of damage ofbuildings and monuments. Plasters are often present as a finishing layer. The perfor-mance of specially developed restoration plasters is not always as good as expected. Insome cases salt is transported to the surface of the plaster, where efflorescence occurs.In other cases salt crystallizes in the masonry, giving rise to degradation. Apart fromthis, salt may crystallize between the masonry and the plaster, causing the plaster layer todetach. To understand these processes in more detail, we have investigated how transportand accumulation of salt in a plaster depends on the underlying masonry material.
Moisture and sodium profiles have been measured non-destructively with a NuclearMagnetic Resonance technique during drying of plaster/substrate systems. The sameplaster is applied on two substrates of which the pores are either an order of magnitudelarger or an order of magnitude smaller than those of the plaster. The moisture and salttransport and the salt accumulation differed significantly for these two systems. In a plas-ter/Bentheimer sandstone system (the pores of the plaster are smaller than those of thesubstrate) all salt is removed from the substrate and accumulates in the plaster, becausethis layer remains wet for a longer time than the substrate. In a plaster/calcium-silicatebrick system (the substrate has a considerable amount of pores that are smaller than thoseof the plaster) some salt crystallizes in the plaster layer, but a significant amount of saltcrystallizes within the substrate itself.
The salt transport from substrate to plaster is quantified in terms of an efficiencynumber ε, which can be estimated from the pore-size distributions measured by mercuryintrusion porosimetry. Based on the results of this study, we discuss the salt transport forvarious combinations of plasters and substrates, of which the pore-size distributions havebeen reported in the literature.
4.1 Introduction
The choice of restoration plasters, suitable for long-time protection and performance, isa delicate conservation problem. The performance of specially developed plasters is notalways satisfactory [Wij97, Lub05]. The durability of a plaster and its ability to protectthe underlying masonry strongly depend on its transport properties with respect to saltand moisture. Although salt damage has been investigated intensively for several decades[Gou97], the mechanisms that control salt crystallization in porous media are poorlyunderstood. A better understanding of the transport of water and dissolved ions during
19
20 4. Moisture and salt transport in plaster/substrate layers
drying and salt crystallization in plasters and the underlying masonry (the substrate)is necessary for understanding salt damage and for developing plasters that meet therequirements with respect to durability and protection.
The fluid transport in a single medium depends on its pore structure [Dul91]. Inprinciple, knowledge about the pore-size distribution, the geometry of the pore net-work, the connectivity of the pores, and the properties of the pore walls is necessaryfor understanding the transport behavior, because these properties determine the per-meability [Rei90, Nua81, Meh80, Die94], diffusivity [Gar90, Que98], and capillary pres-sure [Bea90, Dul91]. The pore-size distribution is one of the parameters which determinethe material durability. Generally, bricks with large pores seem to be more resistant todamage than bricks with small pores [Rob84, Lub04, RM91].
In the existing recommendations for the application of plasters on salt-loaded sub-strates [WTA92] the influence of the substrate materials is not taken into account. Theaim of the work described in this chapter is to investigate the influence of a difference inpore-size distribution between the plaster and substrate layer on the water and salt trans-port and the salt accumulation during drying. Until now, the details of the drying processof two-layer materials has not been investigated very extensively [Bro97, Bro98a]. Using aNuclear Magnetic Resonance (NMR) technique we are able to measure non-destructivelythe time evolution of water and dissolved ions in these layered materials during drying.
In section 4.2 we will discuss some theoretical aspects of the relation between the porestructure and the water and salt transport during drying. The salt transport from thesubstrate to the plaster will be quantified in terms of an efficiency number. In section4.3 the Nuclear Magnetic Resonance (NMR) technique will be explained and the maincharacteristics of the materials will be given. In section 4.4 the time evolution of thewater and salt distribution during drying will be presented. From these measurements, theefficiency number is calculated. In section 4.5 we will discuss the salt transport in systemsof which the substrate is salt loaded but the plaster layer is saturated with pure water.In this section we will also discuss the salt transport in plaster/substrate combinations ofwhich the pore-size distributions are known from literature. The conclusions are presentedin section 4.6.
4.2 Theory
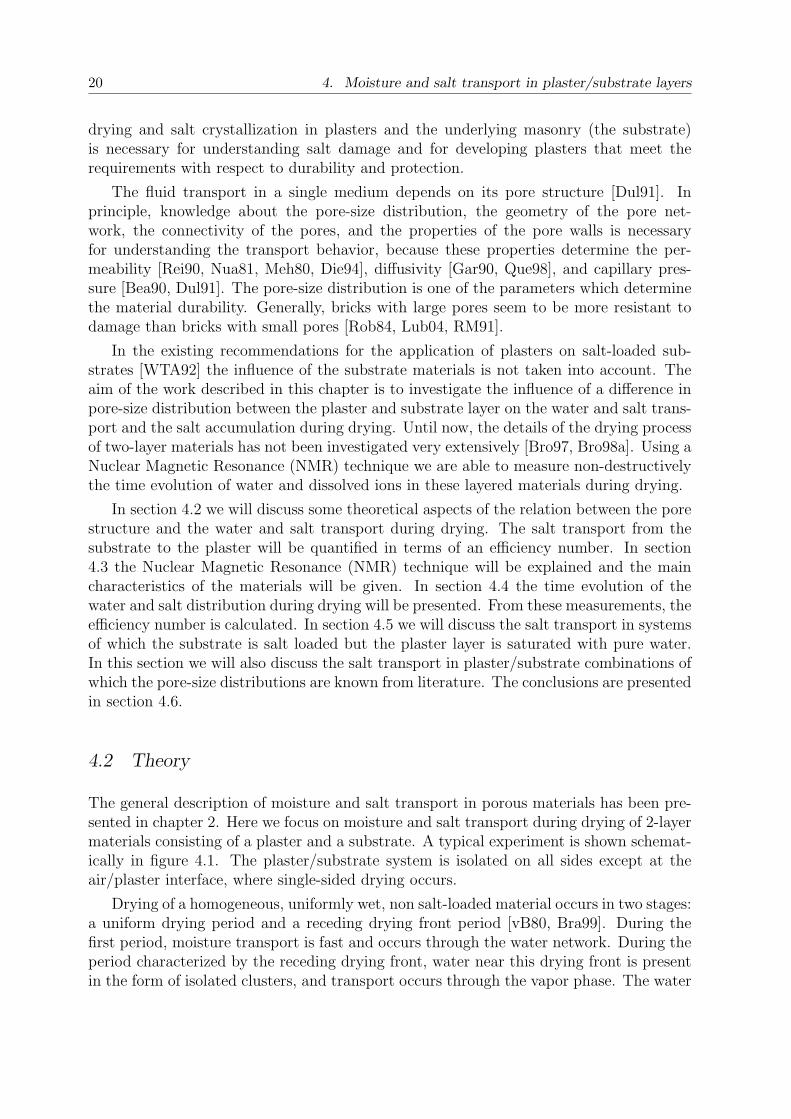
The general description of moisture and salt transport in porous materials has been pre-sented in chapter 2. Here we focus on moisture and salt transport during drying of 2-layermaterials consisting of a plaster and a substrate. A typical experiment is shown schemat-ically in figure 4.1. The plaster/substrate system is isolated on all sides except at theair/plaster interface, where single-sided drying occurs.
Drying of a homogeneous, uniformly wet, non salt-loaded material occurs in two stages:a uniform drying period and a receding drying front period [vB80, Bra99]. During thefirst period, moisture transport is fast and occurs through the water network. During theperiod characterized by the receding drying front, water near this drying front is presentin the form of isolated clusters, and transport occurs through the vapor phase. The water
4.2. Theory 21
s u b s t r a t ep l a s t e rdrying
i s o l a t i o nFig. 4.1: Plaster/substrate system isolated at all sides except the air/plaster interface, where the
water vapor can escape.
clusters evaporate because of the large difference in relative humidity between the vapornear the clusters and the air at the drying surface of the material.
During drying air will invade the largest pores, where the capillary pressure is lowest,as can be seen from the following equation [Dul91, Bea90]:
pc =2γ cos φ
rm
. (4.1)
In this equation rm is a pore radius that discriminates between the pores filled with water(r < rm) and the empty pores (r > rm). γ [Nm−1] is the surface tension of the liquid/vaporinterface and φ is the contact angle between the liquid/air and liquid/solid interface.
In two-layer systems the drying is determined by the pore-size distributions of the twomaterials, as long as the following assumptions are valid:
• the two materials are in perfect hydraulic contact
• the water network is a percolating network
• external pressure gradients are negligible, i.e., drying is completely determined bypc, which is continuous at the interface between the two materials
At a given moisture content, water is present in the pores with diameters smaller thanrm in each material. Therefore, the material with the largest pores is emptied first, asexplained in chapter 2. In the case of plaster/substrate systems, the plaster will dry firstif it has larger pores than the substrate. On the other hand, if the plaster has smallerpores than the substrate, the substrate will dry first.
Ions are transported both by advection and diffusion, as has been discussed in chapter2. Advection drives the salt in the same direction as the water. During drying, advectionwill lead to salt accumulation and crystallization at the drying surface. Diffusion is acompetitive process which tends to level off concentration differences within the liquid inthe sample. The competition between advection and diffusion can be characterized bythe Peclet number Pe, given by:
Pe =|U |LD
, (4.2)
22 4. Moisture and salt transport in plaster/substrate layers
where |U |, L and D are the water velocity, the length scale of interest, and the ion diffu-sivity, respectively. For Pe À 1 advection dominates the ion transport, which happens atsufficiently high drying rates, whereas for Pe ¿ 1 diffusion dominates the ion transport,which happens at low drying rates.
In plaster/substrate systems, a plaster, applied on a substrate with larger pores, stayswet during a longer time than the substrate. If the condition Pe À 1 is valid everywherein the system, advection dominates and salt will be transported and accumulated at theair/plaster interface. If Pe ¿ 1, diffusion dominates and salt will precipitate everywherein the plaster. If the plaster has larger pores than the substrate, the plaster will dry first.For Pe À 1, salt will be transported to the drying interface, which in this case is notnecessarily the air/plaster interface, but rather the plaster/substrate interface, since theplaster dries first. For Pe ¿ 1, salt will precipitate everywhere in the substrate.
The ion transport from the substrate to the plaster can be characterized by means ofa dimensionless efficiency ε:
ε =|∆m|m0
. (4.3)
In this equation m0 is the initial mass of the sodium in the substrate and |∆m| is themass of the sodium which is transported from the substrate to the plaster layer at a timet′ when the top plaster layer has dried out. The efficiency number is easy to estimate,since m0 and |∆m| are experimentally accessible parameters.
Since salt is transported with water, the efficiency number ε can be estimated fromthe water quantities, even without knowing the salt quantities. When Pe À 1, the saltconcentration in the sample during drying equals the initial concentration, except in anarrow region just below the drying surface [Pel02]. Therefore, it follows From Eq. 4.3that:
ε ' εw =|∆V |V0
=|∆θ|θ0
, (4.4)
where εw is efficiency number calculated from the water quantity. θ0 and V0 are the initialmoisture content and the initial volume of water in the substrate, respectively. |∆θ|and |∆V | are the moisture content and the volume of water that disappeared from thesubstrate at the time t′ when the plaster has dried out, respectively.
Since the water transport in a two-layer system is characterized by the pore sizedifferences between the two materials, the efficiency number ε for the case Pe À1 canalso be estimated from the capillary pressure law (Eq. 4.1). The volume of water thatdisappears from the substrate while the plaster completely dries out equals the volume ofthe pores in the substrate with a radius larger than that of the smallest pores in plaster.Hence εp can be calculated from the total pore volume Vp of the substrate and the volumeof the pores V ′
p in the substrate with a radius larger than that of the smallest pores inthe plaster:
εp =V ′
p
Vp
. (4.5)
By measuring the cumulative pore volume of both materials as function of pore sizewith mercury intrusion porosimetry, εp can be calculated and the salt accumulation can
4.3. Experimental 23
be estimated even without investigating the actual transport at all. In section 4.6.2we will use mercury intrusion data reported in the literature for an analysis of the saltaccumulation of various plaster/substrate combinations.
εw and εp are defined as ideal numbers which are estimated assuming Pe À 1. Thesituation is less clear when this assumption is not satisfied. In the case of very slowdrying (Pe ¿ 1), diffusion dominates and there is no salt accumulation at the dryingsurface. During drying the salt concentration will increase uniformly in both materialsof the sample from the initial concentration c0 to the saturation concentration. If thesubstrate dries first, the salt concentration will increase faster in the substrate than in theplaster, and dissolved ions will diffuse into the plaster. If the drying process is sufficientlyslow, the efficiency number may tend to 1 for low initial salt quantities or if the thicknessof the substrate is much smaller than the thickness of the plaster. If, on the other hand,the plaster dries first, dissolved ions may diffuse back to the substrate, which may evenreduce the efficiency number to negative values.
4.3 Experimental
Nuclear Magnetic Resonance (NMR) imaging is a non-destructive technique for quantita-tive mapping of certain chemical elements in materials. Using a home-built NMR scanner,designed for the imaging of the building materials [Kop94, Pel95], it is possible to followthe distribution of water and dissolved sodium ions in time during wetting [Pel00] ordrying [Pel02].
As already mentioned in chapter 3, the resonance frequency of a certain type of nucleus,called the Larmor frequency, is determined by the magnitude of the applied magnetic fieldB:
νi =1
2πγiB , (4.6)
where the index i refers to the type of nucleus (H or Na), νi [Hz] is the Larmor frequency,γi is the gyromagnetic ratio of the nucleus (γH/2π = 42.58 MHz/T; γNa/2π = 11.27MHz/T) and B [T] is the strength of the magnetic field.
When the applied magnetic field is homogeneous, the nuclei in the whole sample are atresonance at the same frequency, and a signal from whole sample is obtained. To achievespatial resolution it is necessary to excite the nuclei in the limited volume of the sample.This is done by making the resonance frequency position dependent by superimposing aconstant magnetic field gradient G on the main magnetic field B0:
B = B0 + G(x− x0) , (4.7)
where x [m] is a position in the sample along the direction of the magnetic field gradientG [T m−1] and x0 is the position where B = B0.
The NMR signal S is proportional to the density of the nuclei ρ [Cal91]:
S = Ckρ[1− exp(−tR/T1)] exp(−tE/T2) . (4.8)
In this equation C is a calibration factor, k is the sensitivity of nuclei relative to that ofhydrogen, T1 [s] is the spin-lattice (longitudinal) relaxation time, tR [s] is the repetition
24 4. Moisture and salt transport in plaster/substrate layers
time of the spin-echo experiment, T2 [s] is spin-spin (transverse) relaxation time, and tE[s] is the spin-echo time. The relaxation times T1 and T2 are proportional to the poresize [Bro79, Val01b], which enables us to distinguish water present in different pores. Tomeasure the water in the entire pore system, which may include a certain fraction of nucleiwith a small T2, tE has to be as short as possible. In our experiments we have used tE,H
= 0.2 ms and tE,Na = 0.45 ms. Nevertheless, we observed some Na signal loss in materialswith small pores, due to fast T2 relaxation. If quantitative measurements are required,this loss has to be corrected for. Since the NMR sensitivity for Na is low, the Na signalsfrom 256 successive spin-echo measurements were averaged to obtain a sufficient signal tonoise ratio.
BR F c o i l
t e f l o n h o l d e r
a i r f l o w0 % R H
s t e p m o t o r
s t a n d a r d
x
p l a s t e r
s u b s t r a t e
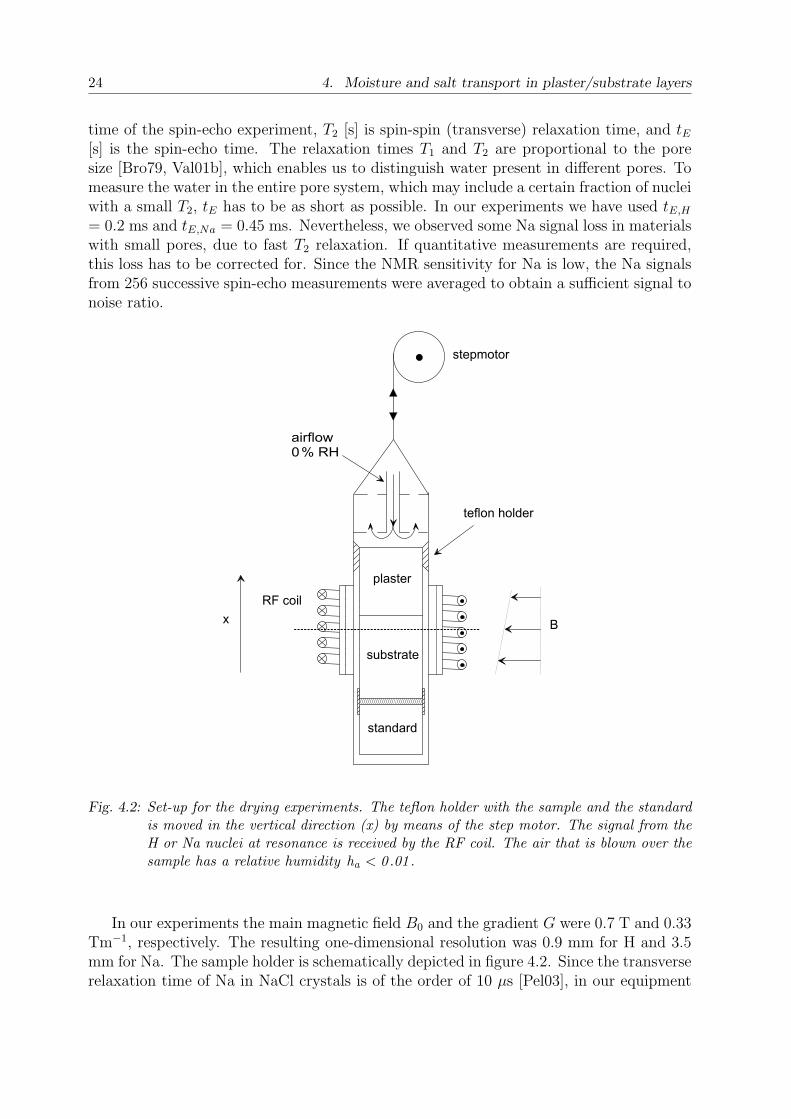
Fig. 4.2: Set-up for the drying experiments. The teflon holder with the sample and the standardis moved in the vertical direction (x) by means of the step motor. The signal from theH or Na nuclei at resonance is received by the RF coil. The air that is blown over thesample has a relative humidity ha < 0 .01 .
In our experiments the main magnetic field B0 and the gradient G were 0.7 T and 0.33Tm−1, respectively. The resulting one-dimensional resolution was 0.9 mm for H and 3.5mm for Na. The sample holder is schematically depicted in figure 4.2. Since the transverserelaxation time of Na in NaCl crystals is of the order of 10 µs [Pel03], in our equipment

4.3. Experimental 25
are only able to measure dissolved Na ions. During the acquisition of the profiles theRF frequency is switched in such a way that the H and Na signals can be recordedquasi-simultaneously [Pel00]. H and Na signal intensities are related to the correspondingvolume of water [cm3] and quantity of Na [mol] using a standard (see Fig. 4.2). Thisconsisted of an NaCl solution (c = 3 mol l−1) to which a small amount of CuCl2 (c = 0.03mol l−1) was added to decrease the T1 relaxation time and, correspondingly, the repetitiontime tR. To determine the H and Na profiles over the whole sample and the standard, thesample holder was moved in the vertical (x) direction by means of a step motor. The timeto measure both a water and Na profile within the sample and the standard was about 2hours. Before the actual drying was started, i.e., before the air flow was switched on, awater and a Na profile were measured that served as t = 0 reference. The moisture andNa profiles for t > 0 were obtained by interpolating the successive experimental profilesmeasured at different times.
0
0 . 1
0 . 2
0 . 3
0 2 0 4 0 6 0 8 0
0
0 . 2
0 . 4
0 . 6
0 . 8
0 2 0 4 0 6 0 8 0
Na co
ntent
x 103
(mol/
m3)
x ( m m )
a
b
(m3
3 )q
/m
p l a s t e r B e n t h e i m e r s a n d s t o n e s t a n d a r d
p l a s t e r B e n t h e i m e r s a n d s t o n e s t a n d a r d
Fig. 4.3: a) Moisture content and b) amount of Na per volume of material of the sample and thestandard plotted as a function of position for every 2 hours of a drying process. Themoisture contents are only given for the first 100 h.
26 4. Moisture and salt transport in plaster/substrate layers
Cylindrical samples were cut with a diameter of 19 mm and a total length of 50 mm.Initially the samples were uniformly capillary saturated by immersing them in water ora NaCl solution, c = 4 mol l−1, for about 20 hours. Because of the low NMR sensitivityfor Na, a rather high concentration has been chosen. The corresponding salt quantityamounts to roughly 0.02 gram per gram of sample. To be able to model the observeddrying and salt transport as 1D processes, the samples were sealed with teflon tape at allsides except at the top (the plaster/air interface), over which the dry air is blown. Therelative humidity of the air was less than 1 % and the air flow was kept at 0.7 l min−1.This corresponds to an air speed over the drying surface in the range of 0.03− 0.15 m/s,estimated from the geometry of the NMR set-up.
0 . 0 1 0 . 1 1 1 0 1 0 00 . 0
0 . 1
0 . 2
0 . 3
0 . 0 0
0 . 0 1
0 . 0 2
0 . 0 3
0 . 0 4
V p V p '
dinc
remen
tal po
re vo
lume
(ml/m
l)
cumu
lative
pore
volum
e (m
l/ml)
c a l c i u m - s i l i c a t e b r i c k p l a s t e r
5 %
0 . 0 1 0 . 1 1 1 0 1 0 00 . 0
0 . 1
0 . 2
0 . 3
0 . 0 0
0 . 0 2
0 . 0 4
0 . 0 6
0 . 0 8
0 . 1 0
0 . 1 2
mp o r e s i z e d i a m e t e r ( m )
V p = V p '
increm
ental
pore
volum
e (m
l/ml)
cumu
lative
pore
volum
e (m
l/ml)
B e n t h e i m e r s a n d s t o n e p l a s t e r
d
5 %
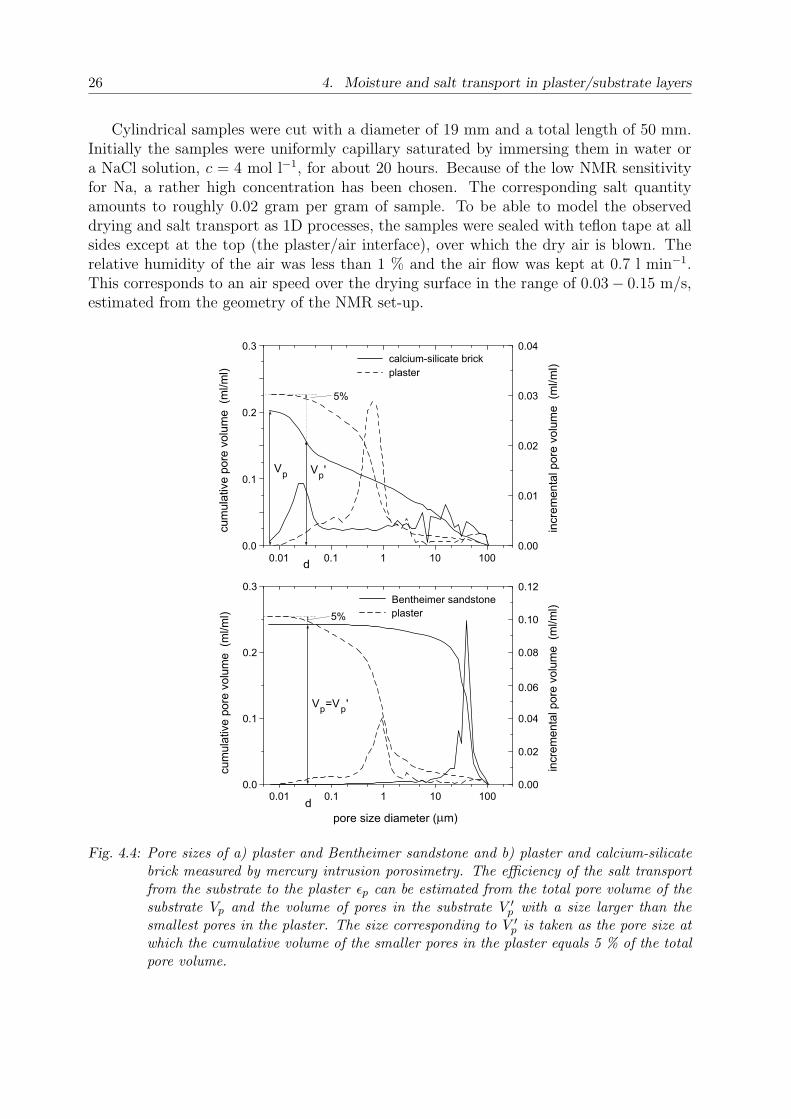
Fig. 4.4: Pore sizes of a) plaster and Bentheimer sandstone and b) plaster and calcium-silicatebrick measured by mercury intrusion porosimetry. The efficiency of the salt transportfrom the substrate to the plaster εp can be estimated from the total pore volume of thesubstrate Vp and the volume of pores in the substrate V ′
p with a size larger than thesmallest pores in the plaster. The size corresponding to V ′
p is taken as the pore size atwhich the cumulative volume of the smaller pores in the plaster equals 5 % of the totalpore volume.
4.4. Results 27
An example of the H and Na profiles in the sample and the standard for every 2 hoursof a drying process are given in figure 4.3a and figure 4.3b, respectively. In the nextsection only profiles in the sample will be plotted.
Experiments were done on two different plaster-substrate systems. Bentheimer sand-stone and calcium-silicate brick were used as substrates. The plaster had the same com-position in both systems: lime:cement:sand = 4:1:10 (v/v). The two substrates wereselected because of the significant differences in their pore-size distributions. The systemswere dried during seven days in a plastic box and during 21 days at 40 ◦C and 65 %relative humidity. After that the systems were carbonated during a few weeks, until fullcarbonation was reached, in a box with 3 % CO2 (v/v) at 50 % relative humidity.
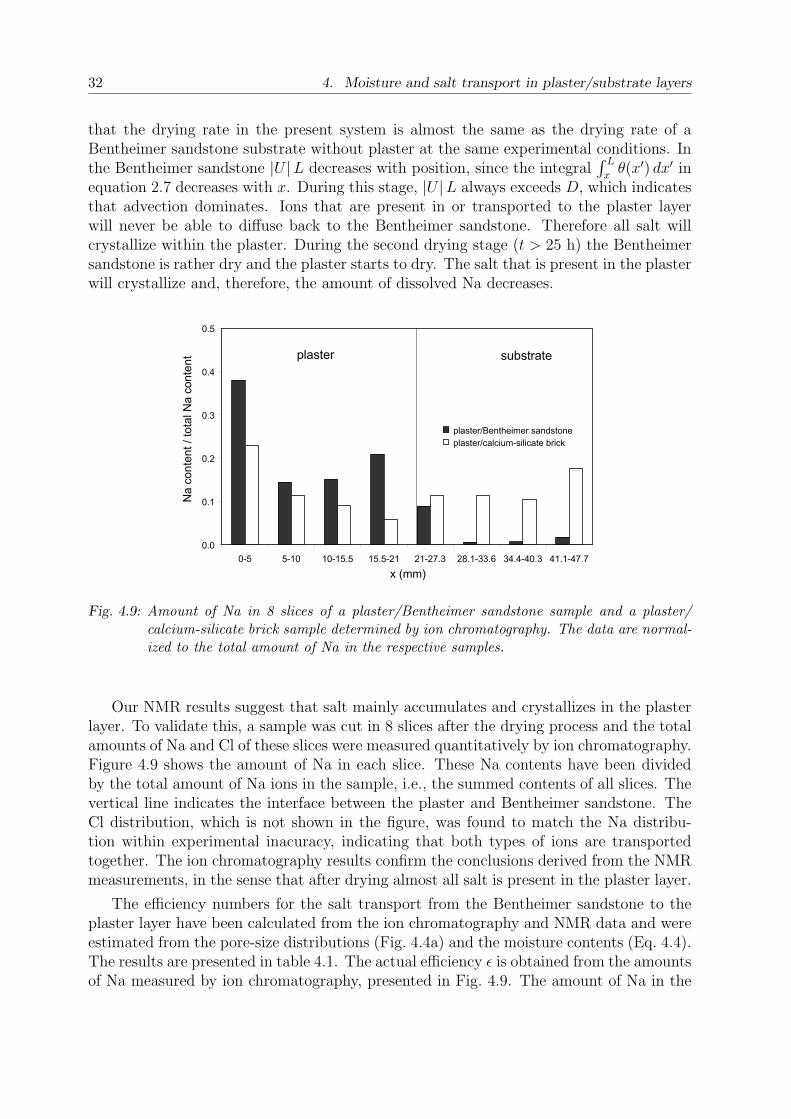
The pore sizes and open porosities of the materials have been measured by means ofmercury intrusion porosimetry. The cumulative and differential pore volumes vs. porediameter are presented for both systems in figure 4.4. This figure shows that the pores ofthe plaster are an order of magnitude smaller than those of Bentheimer sandstone and anorder of magnitude larger than the nanometer pores of the calcium-silicate brick. We liketo add that the fraction of large pores (10 − 100 µm) in, e.g., the calcium-silicate brickmay have been underestimated, due to ink-bottle effects. Mercury intrusion porosimetryactually probes the distribution of the pores as a function of the size of the pore entrance,which causes the results to depend on the geometry of the pore system.
4.4 Results
4.4.1 Plaster/Bentheimer sandstone
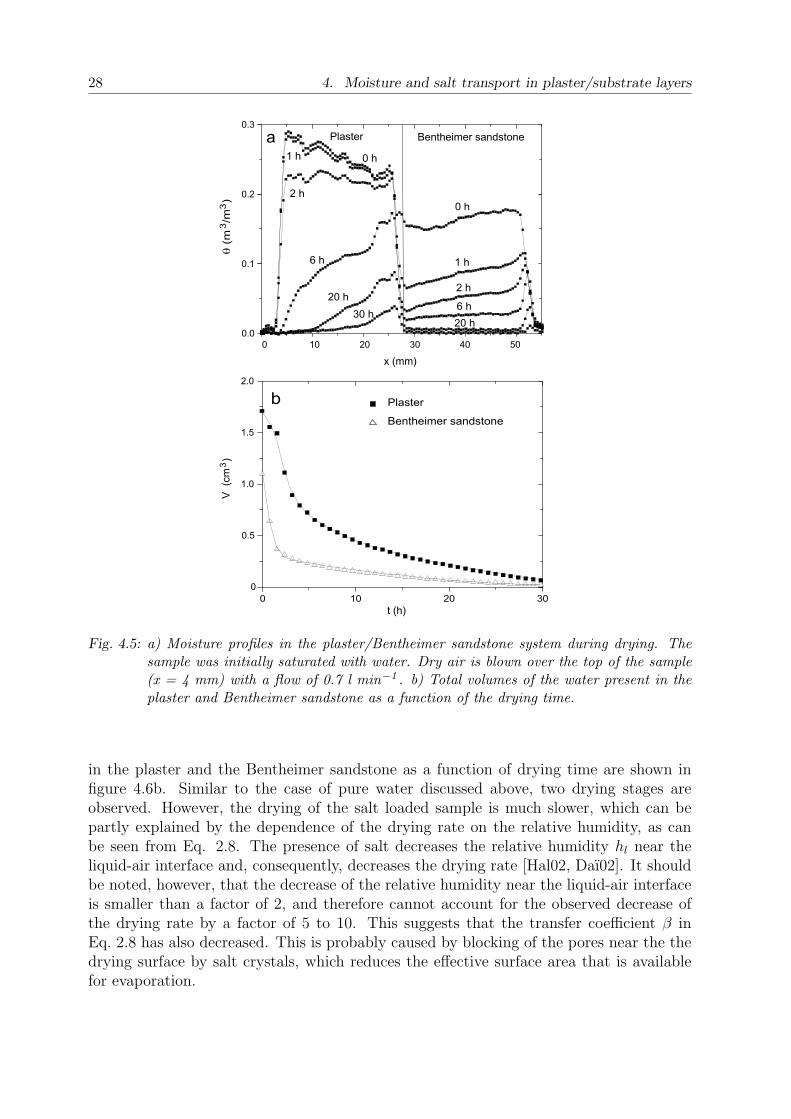
Pure water
First, the drying behavior of plaster/substrate systems saturated with pure water has beenstudied. In figure 4.5a the water profiles in the plaster/Bentheimer sandstone system areplotted for several times during the drying process. In all systems we have studied, thewater evaporates from the sample through the air/plaster interface (x = 4). The totalamounts of water in the plaster and the Bentheimer sandstone as a function of dryingtime are presented in figure 4.5b. Two drying stages can be observed. During stage 1(t < 2 h) the Bentheimer sandstone dries, whereas the plaster remains saturated. Theplaster starts to dry during the second drying stage (t > 2 h). After about 6 hours thewater network in the plaster breaks down and a receding drying front enters the plaster.This drying behavior can be understood as follows. During drying water tends to remainin the pores where the capillary pressures (pc) is highest, which are the smallest poresaccording to equation 4.1. The Bentheimer sandstone dries first, because its pores aregenerally an order of magnitude larger than the pores in the plaster (figure 4.4a).
Salt solution
To study the salt transport in the plaster/Bentheimer sandstone system, the sample wasinitially saturated with a NaCl solution, c = 4 mol l−1. In figure 4.6a we have plottedwater profiles for several times during the drying process. The total amounts of water
28 4. Moisture and salt transport in plaster/substrate layers
0 1 0 2 0 3 00
0 . 5
1 . 0
1 . 5
2 . 0b
P l a s t e r B e n t h e i m e r s a n d s t o n e
0 1 0 2 0 3 0 4 0 5 00 . 0
0 . 1
0 . 2
0 . 3 a
3 0 h
1 hP l a s t e r B e n t h e i m e r s a n d s t o n e
2 0 h6 h
1 h
2 h
0 h
2 0 h
6 h
2 h
0 h
x ( m m )
t ( h )
q (m
3 /m3 )
V (cm
3 )
Fig. 4.5: a) Moisture profiles in the plaster/Bentheimer sandstone system during drying. Thesample was initially saturated with water. Dry air is blown over the top of the sample(x = 4 mm) with a flow of 0.7 l min−1 . b) Total volumes of the water present in theplaster and Bentheimer sandstone as a function of the drying time.
in the plaster and the Bentheimer sandstone as a function of drying time are shown infigure 4.6b. Similar to the case of pure water discussed above, two drying stages areobserved. However, the drying of the salt loaded sample is much slower, which can bepartly explained by the dependence of the drying rate on the relative humidity, as canbe seen from Eq. 2.8. The presence of salt decreases the relative humidity hl near theliquid-air interface and, consequently, decreases the drying rate [Hal02, Daı02]. It shouldbe noted, however, that the decrease of the relative humidity near the liquid-air interfaceis smaller than a factor of 2, and therefore cannot account for the observed decrease ofthe drying rate by a factor of 5 to 10. This suggests that the transfer coefficient β inEq. 2.8 has also decreased. This is probably caused by blocking of the pores near the thedrying surface by salt crystals, which reduces the effective surface area that is availablefor evaporation.
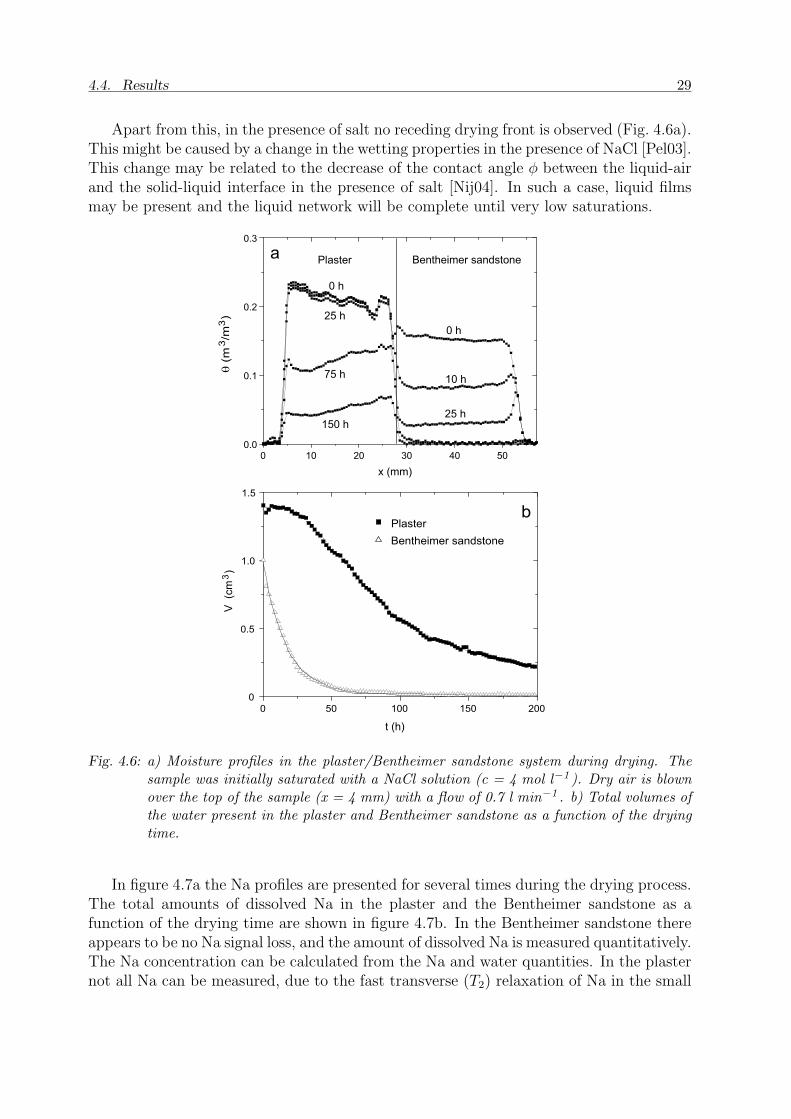
4.4. Results 29
Apart from this, in the presence of salt no receding drying front is observed (Fig. 4.6a).This might be caused by a change in the wetting properties in the presence of NaCl [Pel03].This change may be related to the decrease of the contact angle φ between the liquid-airand the solid-liquid interface in the presence of salt [Nij04]. In such a case, liquid filmsmay be present and the liquid network will be complete until very low saturations.
0 1 0 2 0 3 0 4 0 5 00 . 0
0 . 1
0 . 2
0 . 3
0 5 0 1 0 0 1 5 0 2 0 00
0 . 5
1 . 0
1 . 5
t ( h )
b
a
1 5 0 h
P l a s t e r B e n t h e i m e r s a n d s t o n e
1 0 h
2 5 h
7 5 h
2 5 h0 h
0 h
x ( m m )
B e n t h e i m e r s a n d s t o n eP l a s t e r
q (m
3 /m3 )
V (cm
3 )
Fig. 4.6: a) Moisture profiles in the plaster/Bentheimer sandstone system during drying. Thesample was initially saturated with a NaCl solution (c = 4 mol l−1 ). Dry air is blownover the top of the sample (x = 4 mm) with a flow of 0.7 l min−1 . b) Total volumes ofthe water present in the plaster and Bentheimer sandstone as a function of the dryingtime.
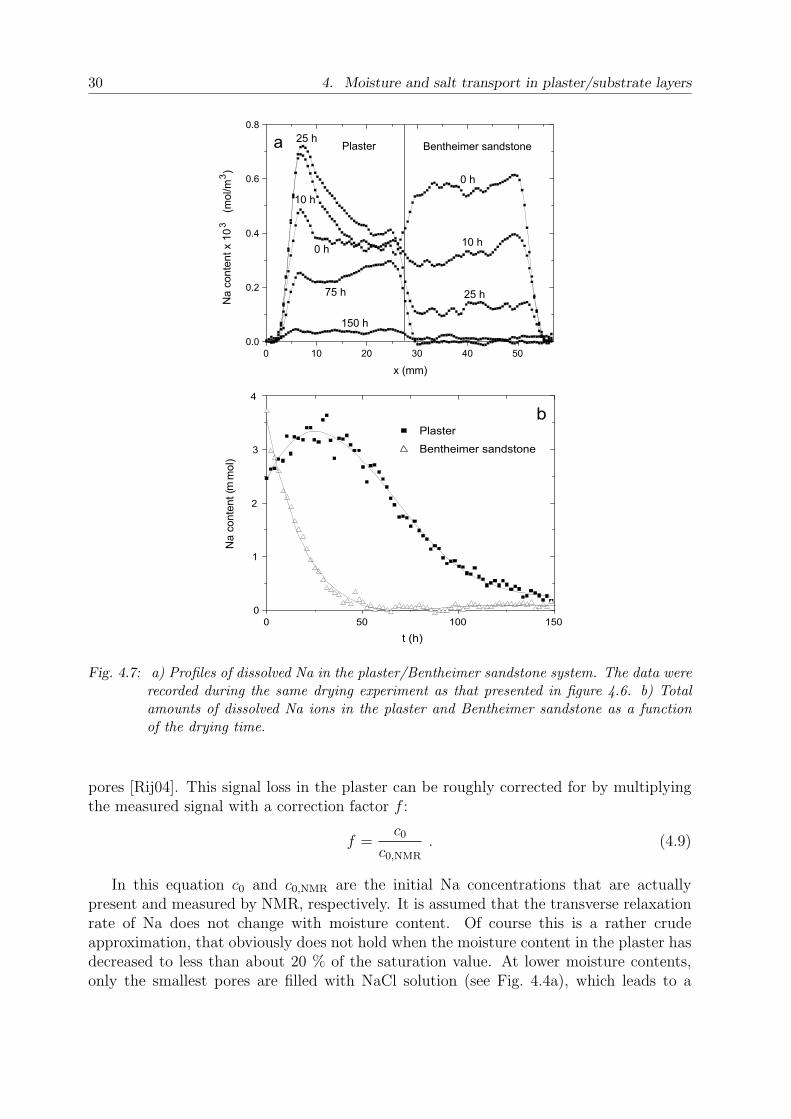
In figure 4.7a the Na profiles are presented for several times during the drying process.The total amounts of dissolved Na in the plaster and the Bentheimer sandstone as afunction of the drying time are shown in figure 4.7b. In the Bentheimer sandstone thereappears to be no Na signal loss, and the amount of dissolved Na is measured quantitatively.The Na concentration can be calculated from the Na and water quantities. In the plasternot all Na can be measured, due to the fast transverse (T2) relaxation of Na in the small
30 4. Moisture and salt transport in plaster/substrate layers
0 1 0 2 0 3 0 4 0 5 00 . 0
0 . 2
0 . 4
0 . 6
0 . 8
b
a
0 5 0 1 0 0 1 5 00
1
2
3
4
Na co
ntent
(mmo
l)
t ( h )
P l a s t e r B e n t h e i m e r s a n d s t o n e
2 5 h
1 0 h
0 h
1 5 0 h
7 5 h
0 h
1 0 h
2 5 h
Na co
ntent
x 103
(mol/
m3)
x ( m m )
P l a s t e rB e n t h e i m e r s a n d s t o n e
Fig. 4.7: a) Profiles of dissolved Na in the plaster/Bentheimer sandstone system. The data wererecorded during the same drying experiment as that presented in figure 4.6. b) Totalamounts of dissolved Na ions in the plaster and Bentheimer sandstone as a functionof the drying time.
pores [Rij04]. This signal loss in the plaster can be roughly corrected for by multiplyingthe measured signal with a correction factor f :
f =c0
c0,NMR
. (4.9)
In this equation c0 and c0,NMR are the initial Na concentrations that are actuallypresent and measured by NMR, respectively. It is assumed that the transverse relaxationrate of Na does not change with moisture content. Of course this is a rather crudeapproximation, that obviously does not hold when the moisture content in the plaster hasdecreased to less than about 20 % of the saturation value. At lower moisture contents,only the smallest pores are filled with NaCl solution (see Fig. 4.4a), which leads to a
4.4. Results 31
drastic decrease of T2 and hence the NMR signal intensity.
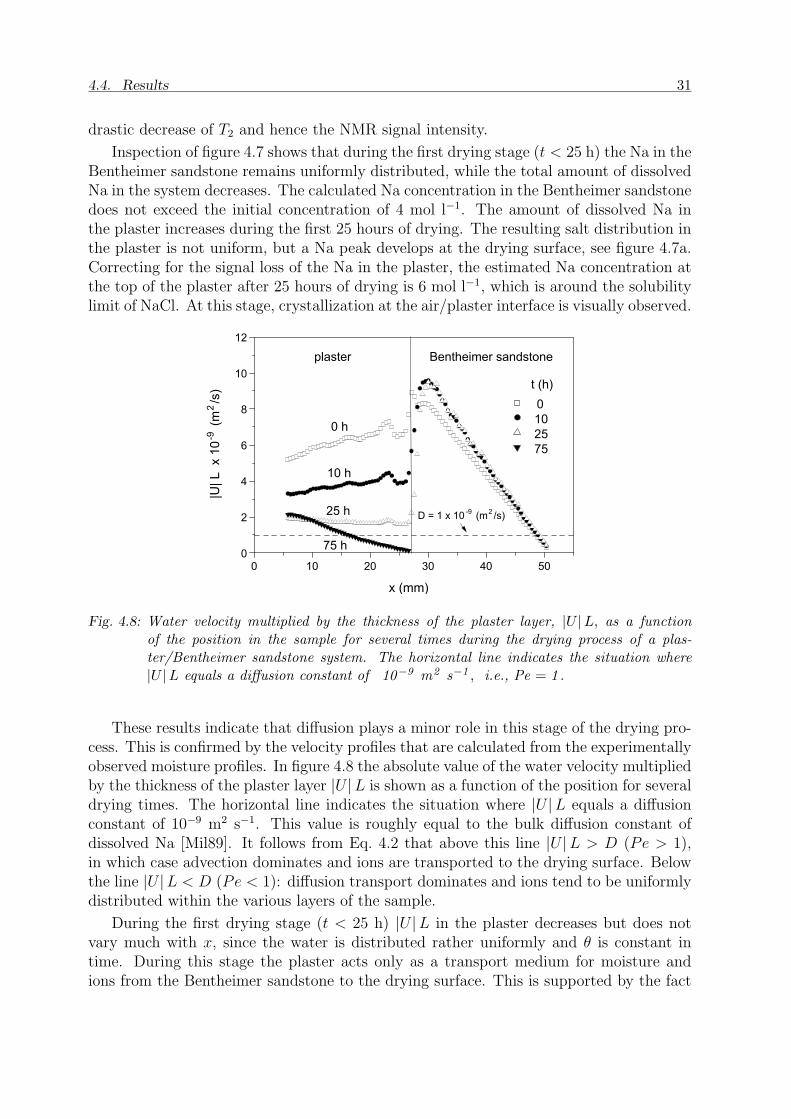
Inspection of figure 4.7 shows that during the first drying stage (t < 25 h) the Na in theBentheimer sandstone remains uniformly distributed, while the total amount of dissolvedNa in the system decreases. The calculated Na concentration in the Bentheimer sandstonedoes not exceed the initial concentration of 4 mol l−1. The amount of dissolved Na inthe plaster increases during the first 25 hours of drying. The resulting salt distribution inthe plaster is not uniform, but a Na peak develops at the drying surface, see figure 4.7a.Correcting for the signal loss of the Na in the plaster, the estimated Na concentration atthe top of the plaster after 25 hours of drying is 6 mol l−1, which is around the solubilitylimit of NaCl. At this stage, crystallization at the air/plaster interface is visually observed.
0 1 0 2 0 3 0 4 0 5 00
2
4
6
8
1 0
1 2
t ( h ) 0 1 0 2 5 7 5
B e n t h e i m e r s a n d s t o n ep l a s t e r
7 5 h
2 5 h
1 0 h
0 h
|U| L
x 10
-9 (m
2 /s)
x ( m m )
D = 1 x 1 0 - 9 ( m 2 / s )
Fig. 4.8: Water velocity multiplied by the thickness of the plaster layer, |U |L, as a functionof the position in the sample for several times during the drying process of a plas-ter/Bentheimer sandstone system. The horizontal line indicates the situation where|U |L equals a diffusion constant of 10−9 m2 s−1 , i.e., Pe = 1 .
These results indicate that diffusion plays a minor role in this stage of the drying pro-cess. This is confirmed by the velocity profiles that are calculated from the experimentallyobserved moisture profiles. In figure 4.8 the absolute value of the water velocity multipliedby the thickness of the plaster layer |U |L is shown as a function of the position for severaldrying times. The horizontal line indicates the situation where |U |L equals a diffusionconstant of 10−9 m2 s−1. This value is roughly equal to the bulk diffusion constant ofdissolved Na [Mil89]. It follows from Eq. 4.2 that above this line |U |L > D (Pe > 1),in which case advection dominates and ions are transported to the drying surface. Belowthe line |U |L < D (Pe < 1): diffusion transport dominates and ions tend to be uniformlydistributed within the various layers of the sample.
During the first drying stage (t < 25 h) |U |L in the plaster decreases but does notvary much with x, since the water is distributed rather uniformly and θ is constant intime. During this stage the plaster acts only as a transport medium for moisture andions from the Bentheimer sandstone to the drying surface. This is supported by the fact
32 4. Moisture and salt transport in plaster/substrate layers
that the drying rate in the present system is almost the same as the drying rate of aBentheimer sandstone substrate without plaster at the same experimental conditions. Inthe Bentheimer sandstone |U |L decreases with position, since the integral
∫ L
xθ(x′) dx′ in
equation 2.7 decreases with x. During this stage, |U |L always exceeds D, which indicatesthat advection dominates. Ions that are present in or transported to the plaster layerwill never be able to diffuse back to the Bentheimer sandstone. Therefore all salt willcrystallize within the plaster. During the second drying stage (t > 25 h) the Bentheimersandstone is rather dry and the plaster starts to dry. The salt that is present in the plasterwill crystallize and, therefore, the amount of dissolved Na decreases.
0 . 0
0 . 1
0 . 2
0 . 3
0 . 4
0 . 5
0 - 5 5 - 1 0 1 0 - 1 5 . 5 1 5 . 5 - 2 1 2 1 - 2 7 . 3 2 8 . 1 - 3 3 . 6 3 4 . 4 - 4 0 . 3 4 1 . 1 - 4 7 . 7x ( m m )
Na co
ntent
/ total
Na c
onten
t
p l a s t e r / B e n t h e i m e r s a n d s t o n e p l a s t e r / c a l c i u m - s i l i c a t e b r i c k
p l a s t e r s u b s t r a t e
Fig. 4.9: Amount of Na in 8 slices of a plaster/Bentheimer sandstone sample and a plaster/calcium-silicate brick sample determined by ion chromatography. The data are normal-ized to the total amount of Na in the respective samples.
Our NMR results suggest that salt mainly accumulates and crystallizes in the plasterlayer. To validate this, a sample was cut in 8 slices after the drying process and the totalamounts of Na and Cl of these slices were measured quantitatively by ion chromatography.Figure 4.9 shows the amount of Na in each slice. These Na contents have been dividedby the total amount of Na ions in the sample, i.e., the summed contents of all slices. Thevertical line indicates the interface between the plaster and Bentheimer sandstone. TheCl distribution, which is not shown in the figure, was found to match the Na distribu-tion within experimental inacuracy, indicating that both types of ions are transportedtogether. The ion chromatography results confirm the conclusions derived from the NMRmeasurements, in the sense that after drying almost all salt is present in the plaster layer.
The efficiency numbers for the salt transport from the Bentheimer sandstone to theplaster layer have been calculated from the ion chromatography and NMR data and wereestimated from the pore-size distributions (Fig. 4.4a) and the moisture contents (Eq. 4.4).The results are presented in table 4.1. The actual efficiency ε is obtained from the amountsof Na measured by ion chromatography, presented in Fig. 4.9. The amount of Na in the
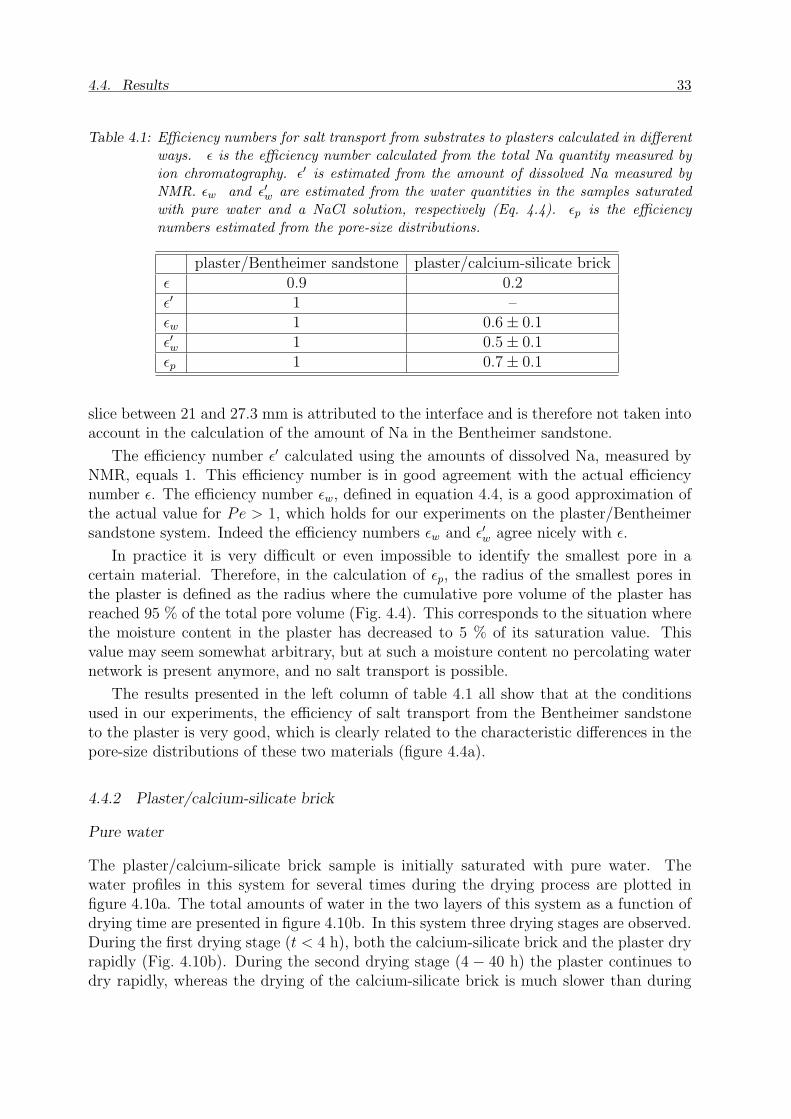
4.4. Results 33
Table 4.1: Efficiency numbers for salt transport from substrates to plasters calculated in differentways. ε is the efficiency number calculated from the total Na quantity measured byion chromatography. ε′ is estimated from the amount of dissolved Na measured byNMR. εw and ε′w are estimated from the water quantities in the samples saturatedwith pure water and a NaCl solution, respectively (Eq. 4.4). εp is the efficiencynumbers estimated from the pore-size distributions.
plaster/Bentheimer sandstone plaster/calcium-silicate brickε 0.9 0.2ε′ 1 –εw 1 0.6± 0.1ε′w 1 0.5± 0.1εp 1 0.7± 0.1
slice between 21 and 27.3 mm is attributed to the interface and is therefore not taken intoaccount in the calculation of the amount of Na in the Bentheimer sandstone.
The efficiency number ε′ calculated using the amounts of dissolved Na, measured byNMR, equals 1. This efficiency number is in good agreement with the actual efficiencynumber ε. The efficiency number εw, defined in equation 4.4, is a good approximation ofthe actual value for Pe > 1, which holds for our experiments on the plaster/Bentheimersandstone system. Indeed the efficiency numbers εw and ε′w agree nicely with ε.
In practice it is very difficult or even impossible to identify the smallest pore in acertain material. Therefore, in the calculation of εp, the radius of the smallest pores inthe plaster is defined as the radius where the cumulative pore volume of the plaster hasreached 95 % of the total pore volume (Fig. 4.4). This corresponds to the situation wherethe moisture content in the plaster has decreased to 5 % of its saturation value. Thisvalue may seem somewhat arbitrary, but at such a moisture content no percolating waternetwork is present anymore, and no salt transport is possible.
The results presented in the left column of table 4.1 all show that at the conditionsused in our experiments, the efficiency of salt transport from the Bentheimer sandstoneto the plaster is very good, which is clearly related to the characteristic differences in thepore-size distributions of these two materials (figure 4.4a).
4.4.2 Plaster/calcium-silicate brick
Pure water
The plaster/calcium-silicate brick sample is initially saturated with pure water. Thewater profiles in this system for several times during the drying process are plotted infigure 4.10a. The total amounts of water in the two layers of this system as a function ofdrying time are presented in figure 4.10b. In this system three drying stages are observed.During the first drying stage (t < 4 h), both the calcium-silicate brick and the plaster dryrapidly (Fig. 4.10b). During the second drying stage (4 − 40 h) the plaster continues todry rapidly, whereas the drying of the calcium-silicate brick is much slower than during
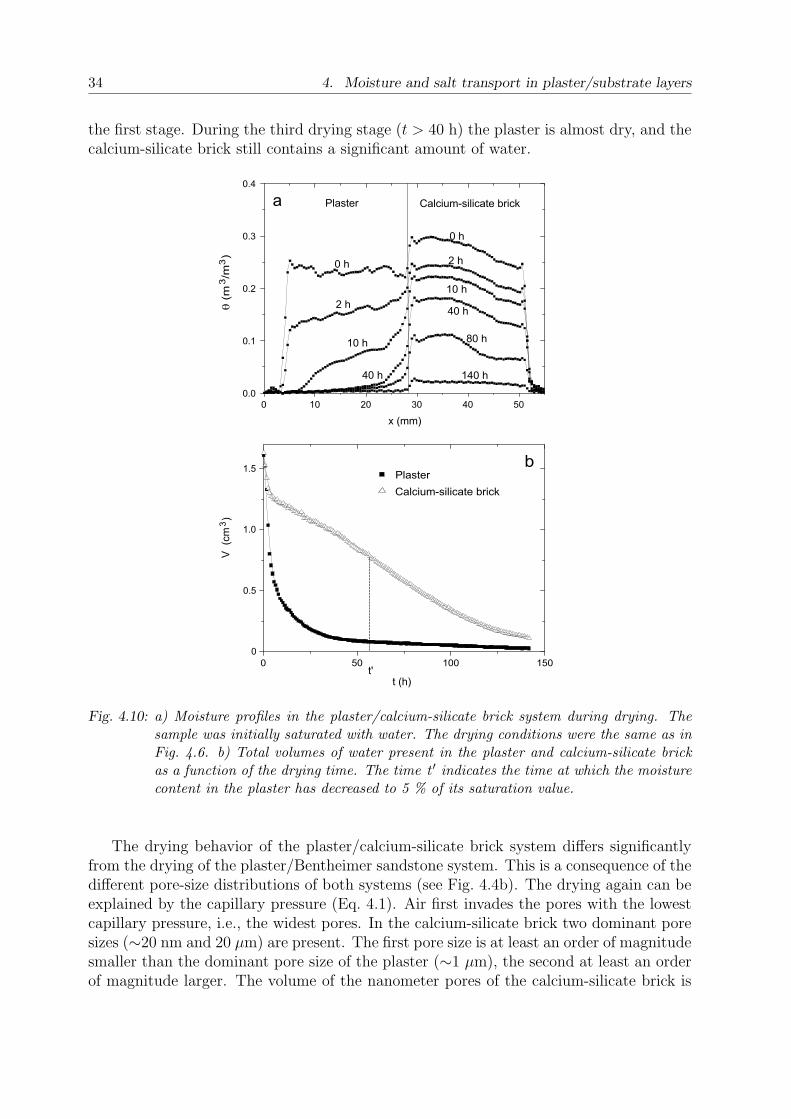
34 4. Moisture and salt transport in plaster/substrate layers
the first stage. During the third drying stage (t > 40 h) the plaster is almost dry, and thecalcium-silicate brick still contains a significant amount of water.
0 1 0 2 0 3 0 4 0 5 00 . 0
0 . 1
0 . 2
0 . 3
0 . 4
0 5 0 1 0 0 1 5 00
0 . 5
1 . 0
1 . 5
V (cm
3 )
t ( h )t '
b
a
8 0 h
4 0 h
P l a s t e r C a l c i u m - s i l i c a t e b r i c k
1 4 0 h
4 0 h
2 h
1 0 h
0 h
1 0 h
2 h
0 h
x ( m m )
q (m
3 /m3 )
P l a s t e rC a l c i u m - s i l i c a t e b r i c k
Fig. 4.10: a) Moisture profiles in the plaster/calcium-silicate brick system during drying. Thesample was initially saturated with water. The drying conditions were the same as inFig. 4.6. b) Total volumes of water present in the plaster and calcium-silicate brickas a function of the drying time. The time t ′ indicates the time at which the moisturecontent in the plaster has decreased to 5 % of its saturation value.
The drying behavior of the plaster/calcium-silicate brick system differs significantlyfrom the drying of the plaster/Bentheimer sandstone system. This is a consequence of thedifferent pore-size distributions of both systems (see Fig. 4.4b). The drying again can beexplained by the capillary pressure (Eq. 4.1). Air first invades the pores with the lowestcapillary pressure, i.e., the widest pores. In the calcium-silicate brick two dominant poresizes (∼20 nm and 20 µm) are present. The first pore size is at least an order of magnitudesmaller than the dominant pore size of the plaster (∼1 µm), the second at least an orderof magnitude larger. The volume of the nanometer pores of the calcium-silicate brick is
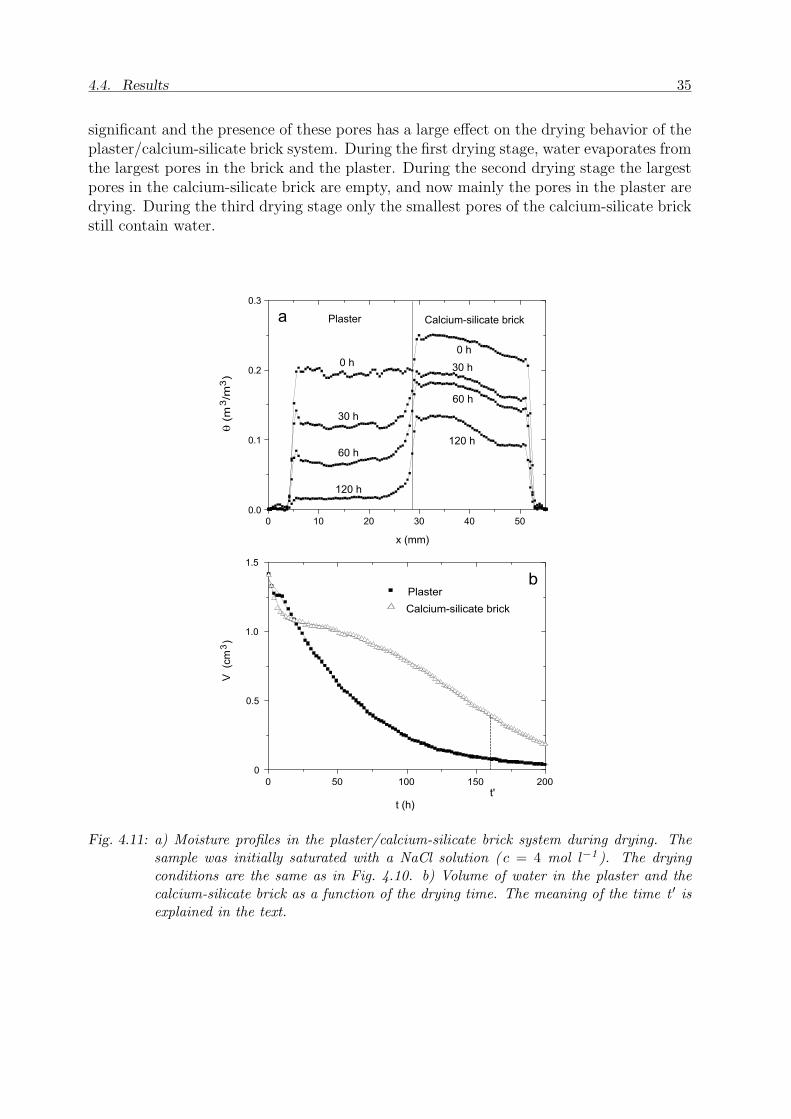
4.4. Results 35
significant and the presence of these pores has a large effect on the drying behavior of theplaster/calcium-silicate brick system. During the first drying stage, water evaporates fromthe largest pores in the brick and the plaster. During the second drying stage the largestpores in the calcium-silicate brick are empty, and now mainly the pores in the plaster aredrying. During the third drying stage only the smallest pores of the calcium-silicate brickstill contain water.
0 1 0 2 0 3 0 4 0 5 00 . 0
0 . 1
0 . 2
0 . 3
0 5 0 1 0 0 1 5 0 2 0 00
0 . 5
1 . 0
1 . 5
t '
b
a
1 2 0 h
P l a s t e r C a l c i u m - s i l i c a t e b r i c k
1 2 0 h
6 0 h
3 0 h
6 0 h
3 0 h
0 h0 h
P l a s t e rC a l c i u m - s i l i c a t e b r i c k
V (cm
3 )q (
m3 /m
3 )
x ( m m )
t ( h )
Fig. 4.11: a) Moisture profiles in the plaster/calcium-silicate brick system during drying. Thesample was initially saturated with a NaCl solution ( c = 4 mol l−1 ). The dryingconditions are the same as in Fig. 4.10. b) Volume of water in the plaster and thecalcium-silicate brick as a function of the drying time. The meaning of the time t ′ isexplained in the text.
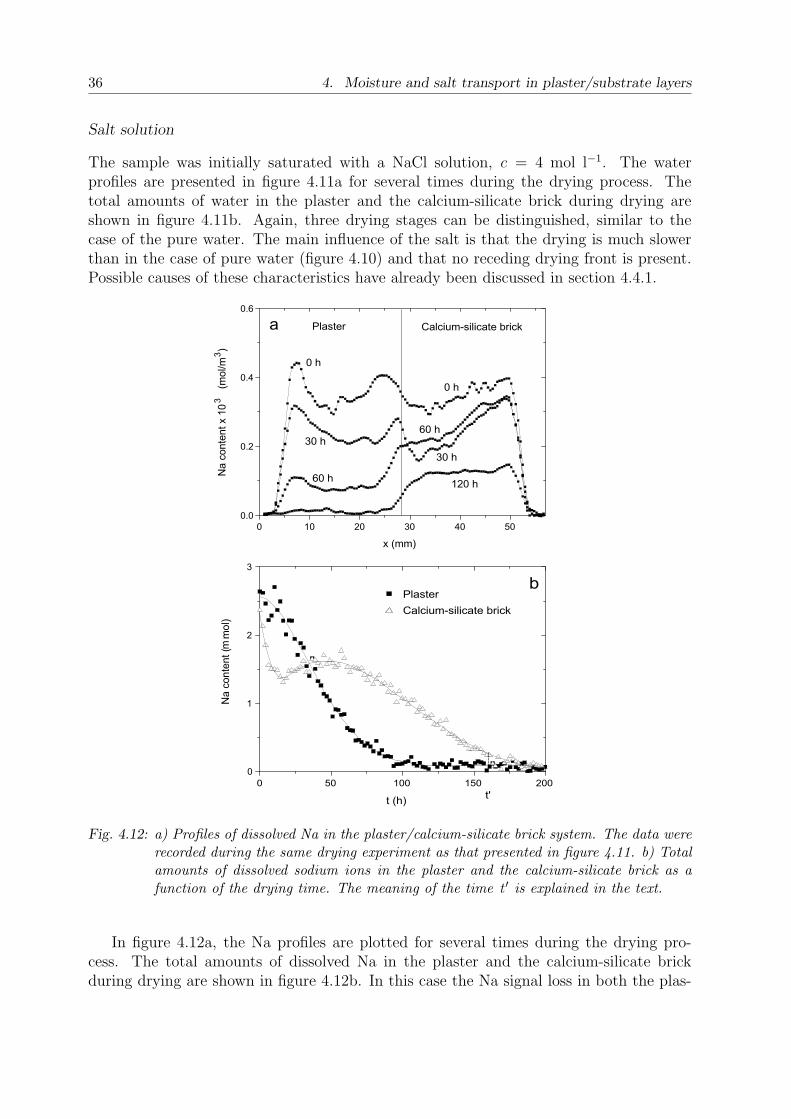
36 4. Moisture and salt transport in plaster/substrate layers
Salt solution
The sample was initially saturated with a NaCl solution, c = 4 mol l−1. The waterprofiles are presented in figure 4.11a for several times during the drying process. Thetotal amounts of water in the plaster and the calcium-silicate brick during drying areshown in figure 4.11b. Again, three drying stages can be distinguished, similar to thecase of the pure water. The main influence of the salt is that the drying is much slowerthan in the case of pure water (figure 4.10) and that no receding drying front is present.Possible causes of these characteristics have already been discussed in section 4.4.1.
0 1 0 2 0 3 0 4 0 5 00 . 0
0 . 2
0 . 4
0 . 6
t '0 5 0 1 0 0 1 5 0 2 0 0
0
1
2
3b
a P l a s t e r C a l c i u m - s i l i c a t e b r i c k
1 2 0 h
3 0 h
6 0 h
0 h
6 0 h
3 0 h
0 h
P l a s t e rC a l c i u m - s i l i c a t e b r i c k
Na co
ntent
x 103
(mol/
m3)
Na co
ntent
(mmo
l)
x ( m m )
t ( h )
Fig. 4.12: a) Profiles of dissolved Na in the plaster/calcium-silicate brick system. The data wererecorded during the same drying experiment as that presented in figure 4.11. b) Totalamounts of dissolved sodium ions in the plaster and the calcium-silicate brick as afunction of the drying time. The meaning of the time t ′ is explained in the text.
In figure 4.12a, the Na profiles are plotted for several times during the drying pro-cess. The total amounts of dissolved Na in the plaster and the calcium-silicate brickduring drying are shown in figure 4.12b. In this case the Na signal loss in both the plas-
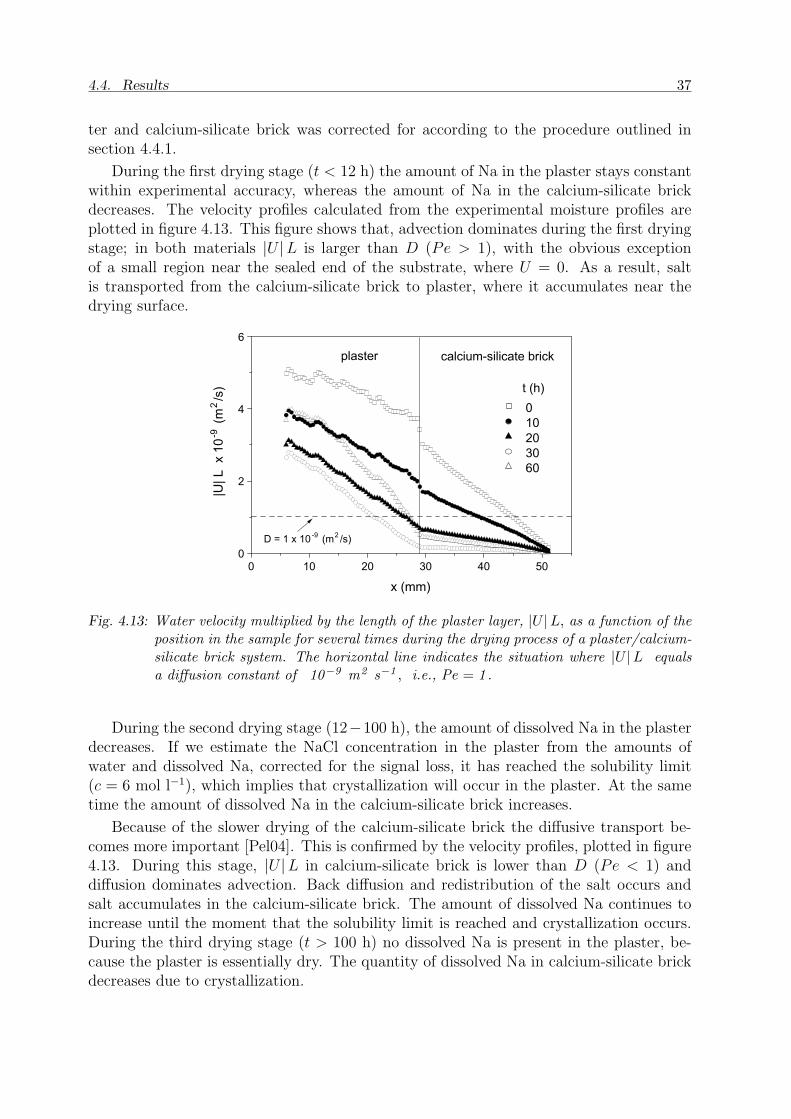
4.4. Results 37
ter and calcium-silicate brick was corrected for according to the procedure outlined insection 4.4.1.
During the first drying stage (t < 12 h) the amount of Na in the plaster stays constantwithin experimental accuracy, whereas the amount of Na in the calcium-silicate brickdecreases. The velocity profiles calculated from the experimental moisture profiles areplotted in figure 4.13. This figure shows that, advection dominates during the first dryingstage; in both materials |U |L is larger than D (Pe > 1), with the obvious exceptionof a small region near the sealed end of the substrate, where U = 0. As a result, saltis transported from the calcium-silicate brick to plaster, where it accumulates near thedrying surface.
0 1 0 2 0 3 0 4 0 5 00
2
4
6
|U| L
x 10
-9 (m
2 /s)
D = 1 x 1 0 - 9 ( m 2 / s )
t ( h ) 0 1 0 2 0 3 0 6 0
c a l c i u m - s i l i c a t e b r i c kp l a s t e r
x ( m m )
Fig. 4.13: Water velocity multiplied by the length of the plaster layer, |U |L, as a function of theposition in the sample for several times during the drying process of a plaster/calcium-silicate brick system. The horizontal line indicates the situation where |U |L equalsa diffusion constant of 10−9 m2 s−1 , i.e., Pe = 1 .
During the second drying stage (12−100 h), the amount of dissolved Na in the plasterdecreases. If we estimate the NaCl concentration in the plaster from the amounts ofwater and dissolved Na, corrected for the signal loss, it has reached the solubility limit(c = 6 mol l−1), which implies that crystallization will occur in the plaster. At the sametime the amount of dissolved Na in the calcium-silicate brick increases.
Because of the slower drying of the calcium-silicate brick the diffusive transport be-comes more important [Pel04]. This is confirmed by the velocity profiles, plotted in figure4.13. During this stage, |U |L in calcium-silicate brick is lower than D (Pe < 1) anddiffusion dominates advection. Back diffusion and redistribution of the salt occurs andsalt accumulates in the calcium-silicate brick. The amount of dissolved Na continues toincrease until the moment that the solubility limit is reached and crystallization occurs.During the third drying stage (t > 100 h) no dissolved Na is present in the plaster, be-cause the plaster is essentially dry. The quantity of dissolved Na in calcium-silicate brickdecreases due to crystallization.
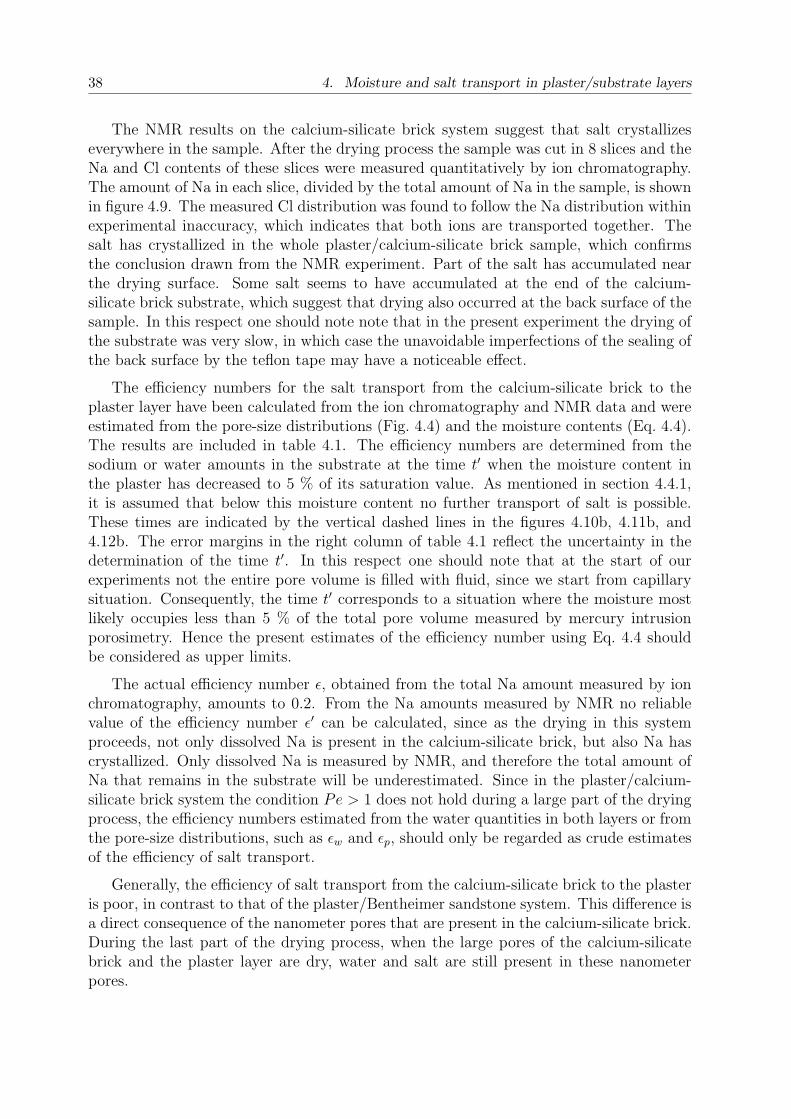
38 4. Moisture and salt transport in plaster/substrate layers
The NMR results on the calcium-silicate brick system suggest that salt crystallizeseverywhere in the sample. After the drying process the sample was cut in 8 slices and theNa and Cl contents of these slices were measured quantitatively by ion chromatography.The amount of Na in each slice, divided by the total amount of Na in the sample, is shownin figure 4.9. The measured Cl distribution was found to follow the Na distribution withinexperimental inaccuracy, which indicates that both ions are transported together. Thesalt has crystallized in the whole plaster/calcium-silicate brick sample, which confirmsthe conclusion drawn from the NMR experiment. Part of the salt has accumulated nearthe drying surface. Some salt seems to have accumulated at the end of the calcium-silicate brick substrate, which suggest that drying also occurred at the back surface of thesample. In this respect one should note note that in the present experiment the drying ofthe substrate was very slow, in which case the unavoidable imperfections of the sealing ofthe back surface by the teflon tape may have a noticeable effect.
The efficiency numbers for the salt transport from the calcium-silicate brick to theplaster layer have been calculated from the ion chromatography and NMR data and wereestimated from the pore-size distributions (Fig. 4.4) and the moisture contents (Eq. 4.4).The results are included in table 4.1. The efficiency numbers are determined from thesodium or water amounts in the substrate at the time t′ when the moisture content inthe plaster has decreased to 5 % of its saturation value. As mentioned in section 4.4.1,it is assumed that below this moisture content no further transport of salt is possible.These times are indicated by the vertical dashed lines in the figures 4.10b, 4.11b, and4.12b. The error margins in the right column of table 4.1 reflect the uncertainty in thedetermination of the time t′. In this respect one should note that at the start of ourexperiments not the entire pore volume is filled with fluid, since we start from capillarysituation. Consequently, the time t′ corresponds to a situation where the moisture mostlikely occupies less than 5 % of the total pore volume measured by mercury intrusionporosimetry. Hence the present estimates of the efficiency number using Eq. 4.4 shouldbe considered as upper limits.
The actual efficiency number ε, obtained from the total Na amount measured by ionchromatography, amounts to 0.2. From the Na amounts measured by NMR no reliablevalue of the efficiency number ε′ can be calculated, since as the drying in this systemproceeds, not only dissolved Na is present in the calcium-silicate brick, but also Na hascrystallized. Only dissolved Na is measured by NMR, and therefore the total amount ofNa that remains in the substrate will be underestimated. Since in the plaster/calcium-silicate brick system the condition Pe > 1 does not hold during a large part of the dryingprocess, the efficiency numbers estimated from the water quantities in both layers or fromthe pore-size distributions, such as εw and εp, should only be regarded as crude estimatesof the efficiency of salt transport.
Generally, the efficiency of salt transport from the calcium-silicate brick to the plasteris poor, in contrast to that of the plaster/Bentheimer sandstone system. This difference isa direct consequence of the nanometer pores that are present in the calcium-silicate brick.During the last part of the drying process, when the large pores of the calcium-silicatebrick and the plaster layer are dry, water and salt are still present in these nanometerpores.
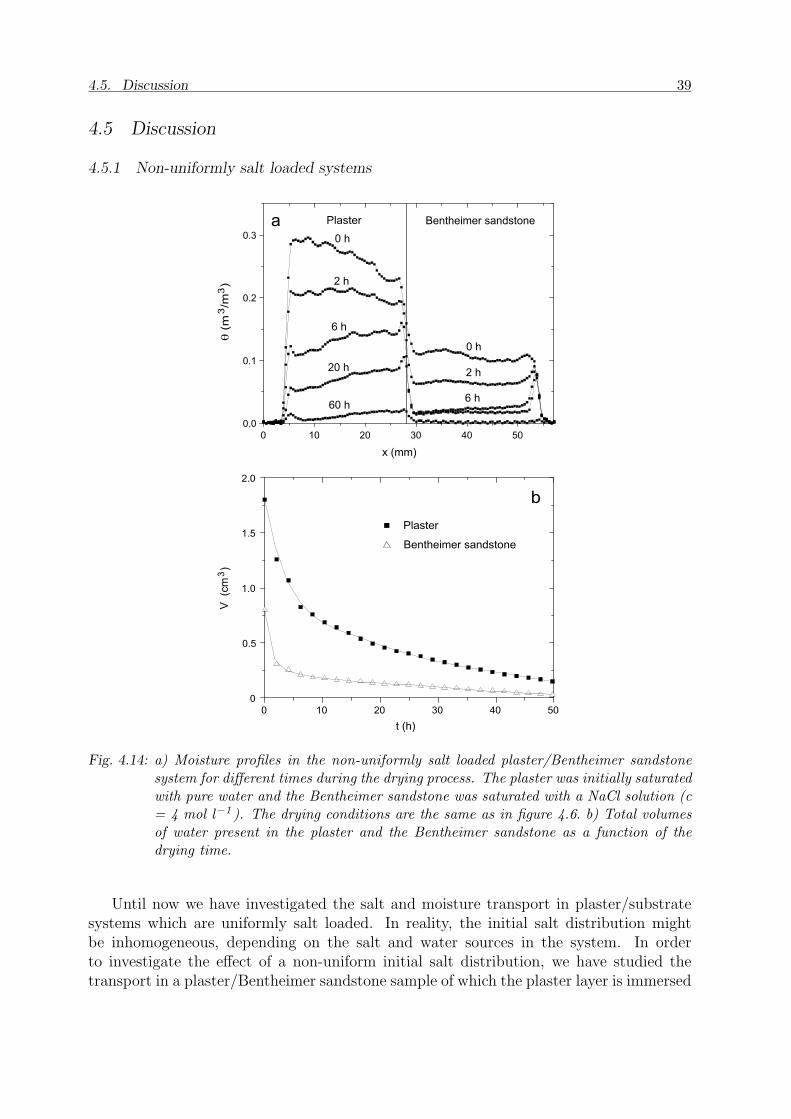
4.5. Discussion 39
4.5 Discussion
4.5.1 Non-uniformly salt loaded systems
0 1 0 2 0 3 0 4 0 5 00 . 0
0 . 1
0 . 2
0 . 3
6 h
2 0 h
B e n t h e i m e r s a n d s t o n e
2 h
6 0 h
6 h
2 h
0 h
0 h
0 1 0 2 0 3 0 4 0 5 00
0 . 5
1 . 0
1 . 5
2 . 0
P l a s t e rB e n t h e i m e r s a n d s t o n e
q (m
3 /m3 )
V (cm
3 )
x ( m m )
t ( h )
a
b
P l a s t e r
Fig. 4.14: a) Moisture profiles in the non-uniformly salt loaded plaster/Bentheimer sandstonesystem for different times during the drying process. The plaster was initially saturatedwith pure water and the Bentheimer sandstone was saturated with a NaCl solution (c= 4 mol l−1 ). The drying conditions are the same as in figure 4.6. b) Total volumesof water present in the plaster and the Bentheimer sandstone as a function of thedrying time.
Until now we have investigated the salt and moisture transport in plaster/substratesystems which are uniformly salt loaded. In reality, the initial salt distribution mightbe inhomogeneous, depending on the salt and water sources in the system. In orderto investigate the effect of a non-uniform initial salt distribution, we have studied thetransport in a plaster/Bentheimer sandstone sample of which the plaster layer is immersed
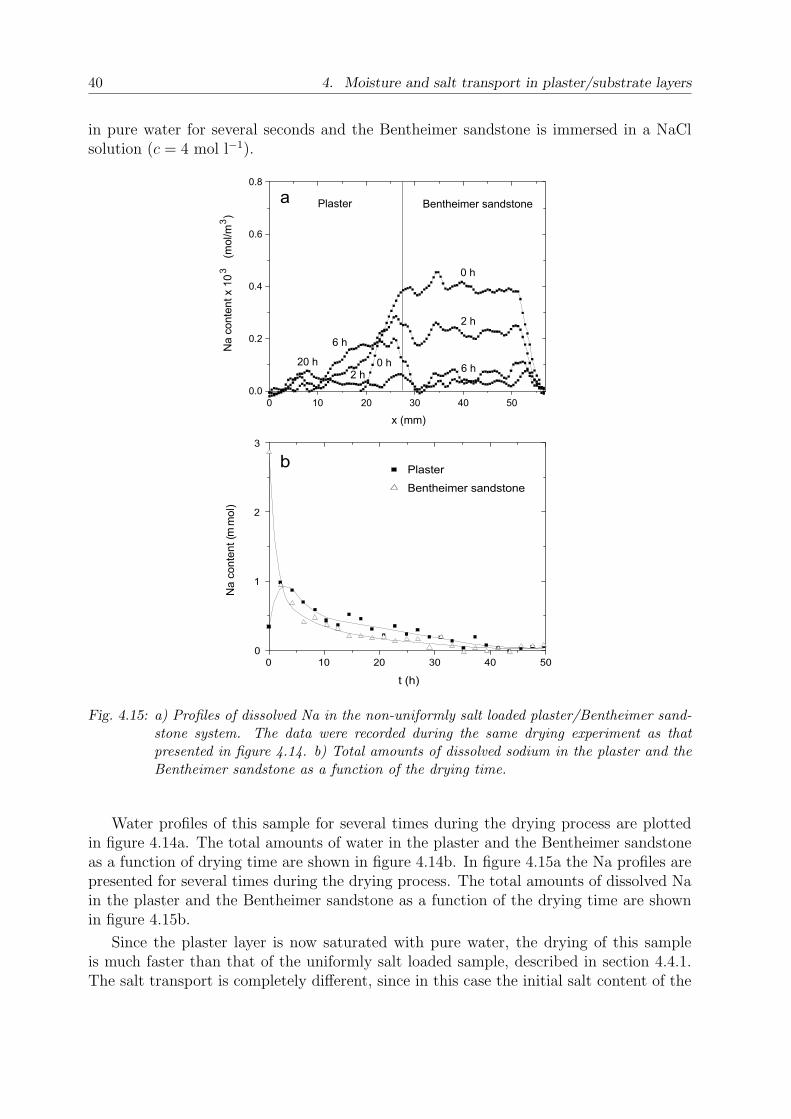
40 4. Moisture and salt transport in plaster/substrate layers
in pure water for several seconds and the Bentheimer sandstone is immersed in a NaClsolution (c = 4 mol l−1).
0 1 0 2 0 3 0 4 0 5 00 . 0
0 . 2
0 . 4
0 . 6
0 . 8
0 1 0 2 0 3 0 4 0 5 00
1
2
3
P l a s t e r B e n t h e i m e r s a n d s t o n e
6 h
2 h
0 h
6 h0 h
2 h2 0 h
B e n t h e i m e r s a n d s t o n eP l a s t e r
Na co
ntent
(mmo
l)Na
conte
nt x 1
03 (m
ol/m3
)
x ( m m )
t ( h )
a
b
Fig. 4.15: a) Profiles of dissolved Na in the non-uniformly salt loaded plaster/Bentheimer sand-stone system. The data were recorded during the same drying experiment as thatpresented in figure 4.14. b) Total amounts of dissolved sodium in the plaster and theBentheimer sandstone as a function of the drying time.
Water profiles of this sample for several times during the drying process are plottedin figure 4.14a. The total amounts of water in the plaster and the Bentheimer sandstoneas a function of drying time are shown in figure 4.14b. In figure 4.15a the Na profiles arepresented for several times during the drying process. The total amounts of dissolved Nain the plaster and the Bentheimer sandstone as a function of the drying time are shownin figure 4.15b.
Since the plaster layer is now saturated with pure water, the drying of this sampleis much faster than that of the uniformly salt loaded sample, described in section 4.4.1.The salt transport is completely different, since in this case the initial salt content of the

4.5. Discussion 41
plaster layer is zero. Fig. 4.15 shows that salt is transported to the drying surface, andthe total amount of salt in the plaster layers increases.
0 1 0 2 0 3 0 4 0 5 00
1 0
2 0
3 0
4 0
5 0
6 0
t ( h ) 0 2 6 2 0
|U| L
x 10
-9 (m
2 /s)
x ( m m )D = 1 x 1 0 - 9 ( m 2 / s )
p l a s t e r B e n t h e i m e r s a n d s t o n e
Fig. 4.16: The water velocity multiplied by the thickness of the plaster layer ( |U |L) versus theposition in the sample for several times during the drying process. of a non-uniformlysalt loaded plaster/Bentheimer sandstone system. The horizontal line indicates thesituation where |U |L equals a diffusion constant of 10−9 m2 s−1 , i.e., Pe = 1 .
The velocity profiles plotted in figure 4.16 indicate that the salt is transported byadvection, since |U |L À D. Most of the salt is already transported to the plaster withinthe first 10 hours of the drying process. After 50 h the Bentheimer sandstone is dry. TheNMR results suggest that all salt is transported to the plaster. This indicates that theefficiency of the salt transport from the Bentheimer sandstone to the plaster equals 1,similar to the uniformly salt loaded sample (section 4.4.1).
To validate this, the sample was cut in 9 slices after the drying experiment and thetotal amount of Na in these slices was measured quantitatively by ion chromatography.Figure 4.17 shows the amount of Na in each slice. These Na contents have been dividedby the total amount of Na ions in the sample, i.e., the summed contents of all slices. Thisfigure shows that the almost all salt is present in the plaster layer and in the interfacelayer, which confirms the results obtained by NMR. The overall salt distribution resem-bles the salt distribution obtained by ion chromatography for the uniformly salt loadedplaster/Bentheimer sandstone system, which is plotted in figure 4.9.
4.5.2 Other plaster/substrate combinations
In our experiments we have demonstrated how moisture and salt are transported in tworather extreme systems, where the same plaster is applied on a very coarse (Bentheimersandstone) or a fine substrate (calcium-silicate brick). Based on the results of this study,we will now discuss the salt transport for various combinations of plasters and substrates,of which the pore-size distributions have been reported in the literature.
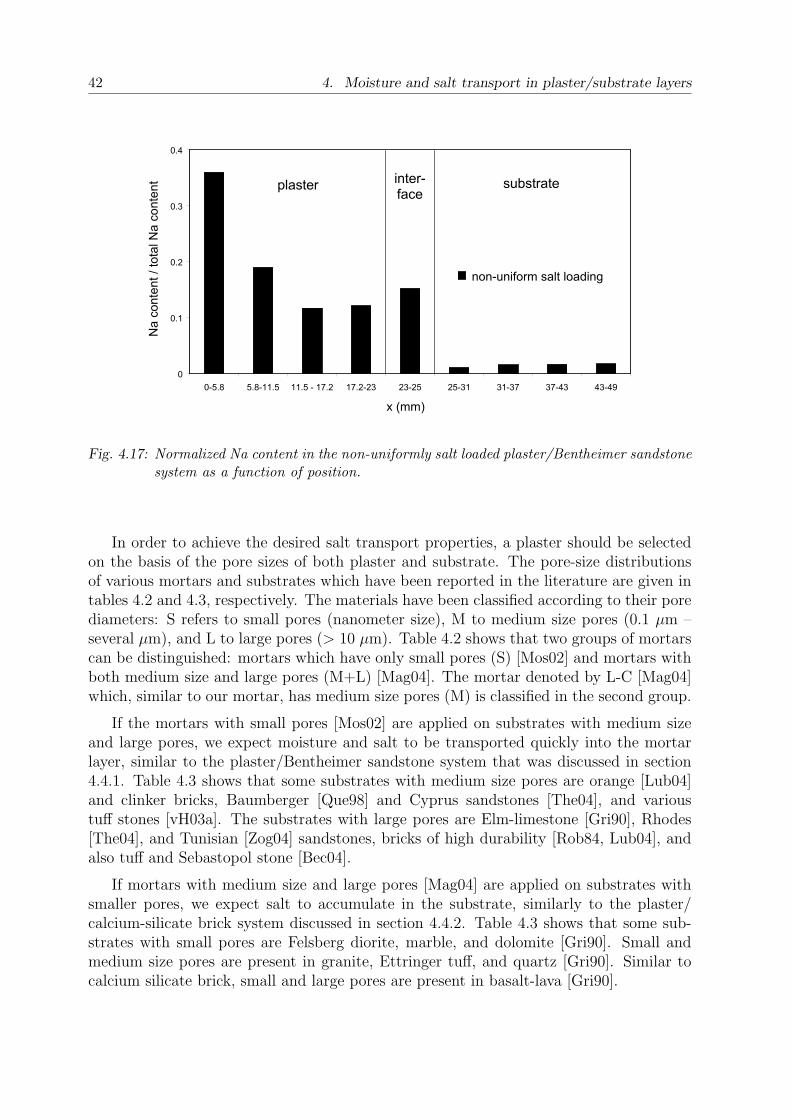
42 4. Moisture and salt transport in plaster/substrate layers
0
0 . 1
0 . 2
0 . 3
0 . 4
0 - 5 . 8 5 . 8 - 1 1 . 5 1 1 . 5 - 1 7 . 2 1 7 . 2 - 2 3 2 3 - 2 5 2 5 - 3 1 3 1 - 3 7 3 7 - 4 3 4 3 - 4 9x ( m m )
Na co
ntent
/ total
Na c
onten
t
n o n - u n i f o r m s a l t l o a d i n g
p l a s t e r s u b s t r a t ei n t e r -f a c e
Fig. 4.17: Normalized Na content in the non-uniformly salt loaded plaster/Bentheimer sandstonesystem as a function of position.
In order to achieve the desired salt transport properties, a plaster should be selectedon the basis of the pore sizes of both plaster and substrate. The pore-size distributionsof various mortars and substrates which have been reported in the literature are given intables 4.2 and 4.3, respectively. The materials have been classified according to their porediameters: S refers to small pores (nanometer size), M to medium size pores (0.1 µm –several µm), and L to large pores (> 10 µm). Table 4.2 shows that two groups of mortarscan be distinguished: mortars which have only small pores (S) [Mos02] and mortars withboth medium size and large pores (M+L) [Mag04]. The mortar denoted by L-C [Mag04]which, similar to our mortar, has medium size pores (M) is classified in the second group.
If the mortars with small pores [Mos02] are applied on substrates with medium sizeand large pores, we expect moisture and salt to be transported quickly into the mortarlayer, similar to the plaster/Bentheimer sandstone system that was discussed in section4.4.1. Table 4.3 shows that some substrates with medium size pores are orange [Lub04]and clinker bricks, Baumberger [Que98] and Cyprus sandstones [The04], and varioustuff stones [vH03a]. The substrates with large pores are Elm-limestone [Gri90], Rhodes[The04], and Tunisian [Zog04] sandstones, bricks of high durability [Rob84, Lub04], andalso tuff and Sebastopol stone [Bec04].
If mortars with medium size and large pores [Mag04] are applied on substrates withsmaller pores, we expect salt to accumulate in the substrate, similarly to the plaster/calcium-silicate brick system discussed in section 4.4.2. Table 4.3 shows that some sub-strates with small pores are Felsberg diorite, marble, and dolomite [Gri90]. Small andmedium size pores are present in granite, Ettringer tuff, and quartz [Gri90]. Similar tocalcium silicate brick, small and large pores are present in basalt-lava [Gri90].
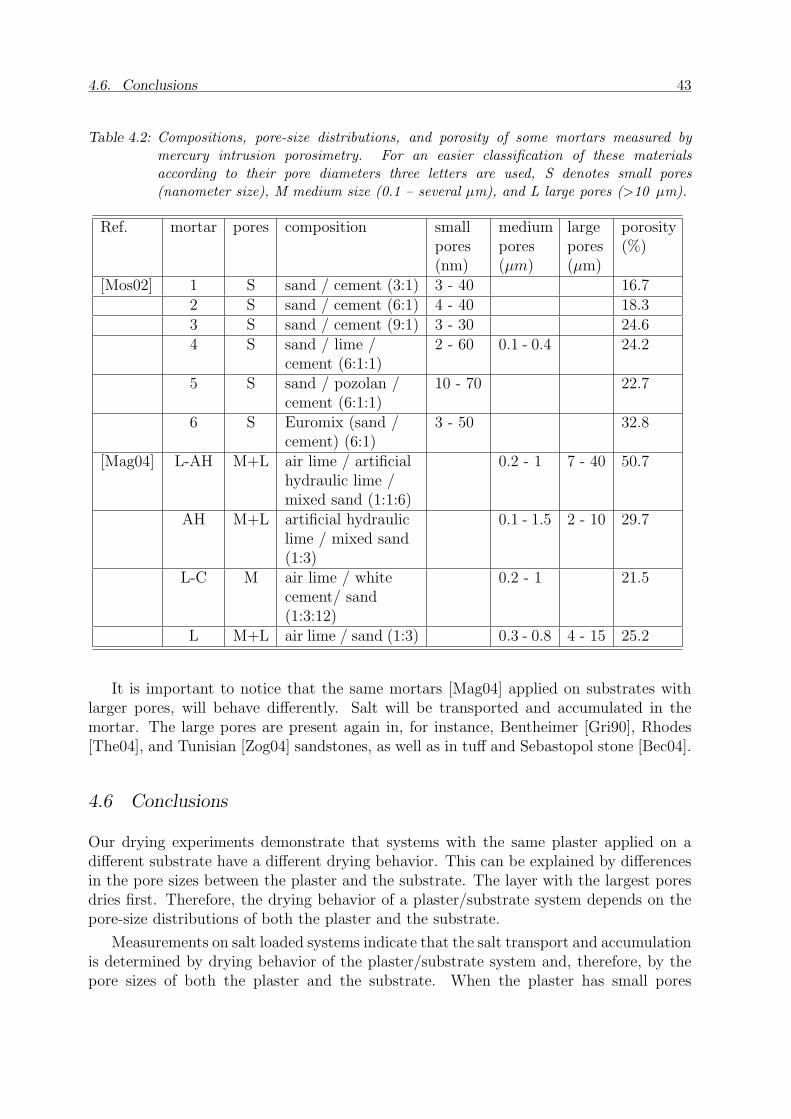
4.6. Conclusions 43
Table 4.2: Compositions, pore-size distributions, and porosity of some mortars measured bymercury intrusion porosimetry. For an easier classification of these materialsaccording to their pore diameters three letters are used, S denotes small pores(nanometer size), M medium size (0.1 – several µm), and L large pores (>10 µm).
Ref. mortar pores composition smallpores(nm)
mediumpores(µm)
largepores(µm)
porosity(%)
[Mos02] 1 S sand / cement (3:1) 3 - 40 16.72 S sand / cement (6:1) 4 - 40 18.33 S sand / cement (9:1) 3 - 30 24.64 S sand / lime /
cement (6:1:1)2 - 60 0.1 - 0.4 24.2
5 S sand / pozolan /cement (6:1:1)
10 - 70 22.7
6 S Euromix (sand /cement) (6:1)
3 - 50 32.8
[Mag04] L-AH M+L air lime / artificialhydraulic lime /mixed sand (1:1:6)
0.2 - 1 7 - 40 50.7
AH M+L artificial hydrauliclime / mixed sand(1:3)
0.1 - 1.5 2 - 10 29.7
L-C M air lime / whitecement/ sand(1:3:12)
0.2 - 1 21.5
L M+L air lime / sand (1:3) 0.3 - 0.8 4 - 15 25.2
It is important to notice that the same mortars [Mag04] applied on substrates withlarger pores, will behave differently. Salt will be transported and accumulated in themortar. The large pores are present again in, for instance, Bentheimer [Gri90], Rhodes[The04], and Tunisian [Zog04] sandstones, as well as in tuff and Sebastopol stone [Bec04].
4.6 Conclusions
Our drying experiments demonstrate that systems with the same plaster applied on adifferent substrate have a different drying behavior. This can be explained by differencesin the pore sizes between the plaster and the substrate. The layer with the largest poresdries first. Therefore, the drying behavior of a plaster/substrate system depends on thepore-size distributions of both the plaster and the substrate.
Measurements on salt loaded systems indicate that the salt transport and accumulationis determined by drying behavior of the plaster/substrate system and, therefore, by thepore sizes of both the plaster and the substrate. When the plaster has small pores
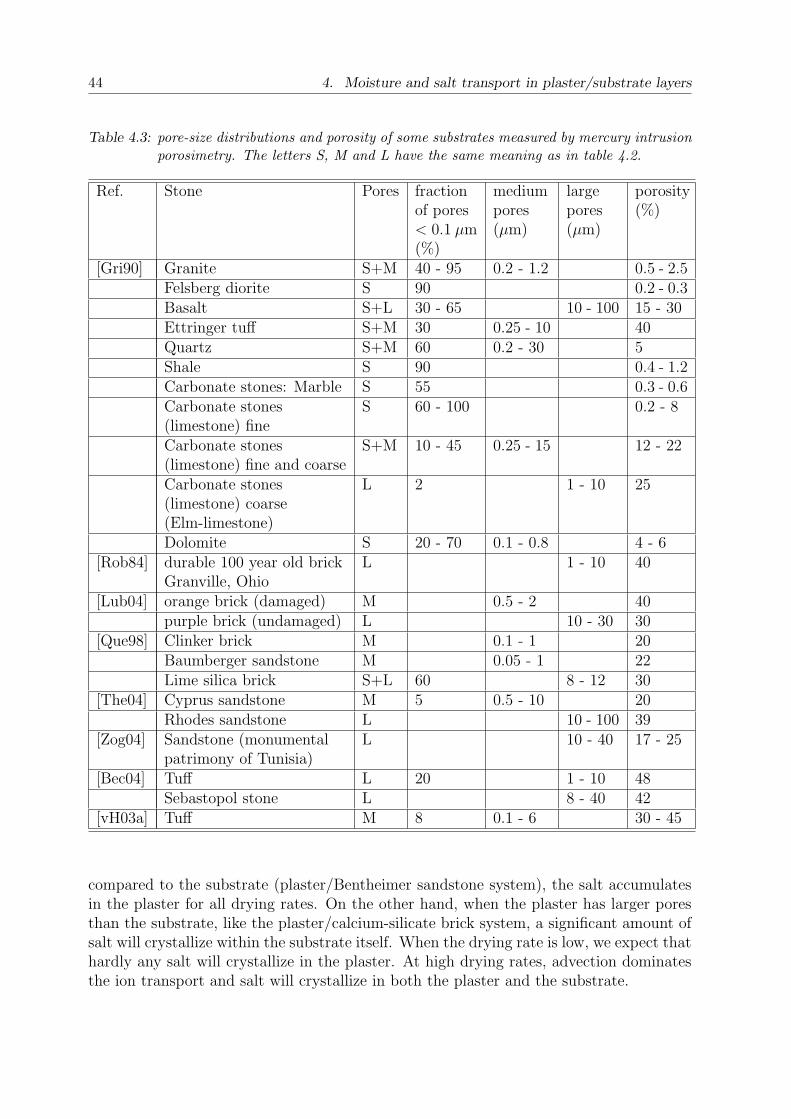
44 4. Moisture and salt transport in plaster/substrate layers
Table 4.3: pore-size distributions and porosity of some substrates measured by mercury intrusionporosimetry. The letters S, M and L have the same meaning as in table 4.2.
Ref. Stone Pores fractionof pores< 0.1 µm(%)
mediumpores(µm)
largepores(µm)
porosity(%)
[Gri90] Granite S+M 40 - 95 0.2 - 1.2 0.5 - 2.5Felsberg diorite S 90 0.2 - 0.3Basalt S+L 30 - 65 10 - 100 15 - 30Ettringer tuff S+M 30 0.25 - 10 40Quartz S+M 60 0.2 - 30 5Shale S 90 0.4 - 1.2Carbonate stones: Marble S 55 0.3 - 0.6Carbonate stones(limestone) fine
S 60 - 100 0.2 - 8
Carbonate stones(limestone) fine and coarse
S+M 10 - 45 0.25 - 15 12 - 22
Carbonate stones(limestone) coarse(Elm-limestone)
L 2 1 - 10 25
Dolomite S 20 - 70 0.1 - 0.8 4 - 6[Rob84] durable 100 year old brick
Granville, OhioL 1 - 10 40
[Lub04] orange brick (damaged) M 0.5 - 2 40purple brick (undamaged) L 10 - 30 30
[Que98] Clinker brick M 0.1 - 1 20Baumberger sandstone M 0.05 - 1 22Lime silica brick S+L 60 8 - 12 30
[The04] Cyprus sandstone M 5 0.5 - 10 20Rhodes sandstone L 10 - 100 39
[Zog04] Sandstone (monumentalpatrimony of Tunisia)
L 10 - 40 17 - 25
[Bec04] Tuff L 20 1 - 10 48Sebastopol stone L 8 - 40 42
[vH03a] Tuff M 8 0.1 - 6 30 - 45
compared to the substrate (plaster/Bentheimer sandstone system), the salt accumulatesin the plaster for all drying rates. On the other hand, when the plaster has larger poresthan the substrate, like the plaster/calcium-silicate brick system, a significant amount ofsalt will crystallize within the substrate itself. When the drying rate is low, we expect thathardly any salt will crystallize in the plaster. At high drying rates, advection dominatesthe ion transport and salt will crystallize in both the plaster and the substrate.
4.6. Conclusions 45
The drying of the plaster/Bentheimer system of which the substrate was saturatedwith a salt solution and the plaster was saturated with pure water is very fast comparedto the system that was uniformly saturated with a salt solution. At the drying conditionsused in the present study (air speed over the drying surface of the order of 0.1 m/s anda very low relative humidity) advection dominates. The salt is transported to the plasterand accumulates there.
We have seen that the salt transport is determined by the Peclet number Pe, whichcan be calculated from the drying rate. In practice a lot of factors are influencing thedrying rate and, correspondingly, the salt transport and accumulation. With increasingexternal temperature or air speed or with decreasing relative humidity of the environment,the drying rate increases, which results in increase of Pe.
We have introduced an efficiency number ε, which is a measure of the efficiency of salttransport from the substrate to the plaster. It is a simple, practical number, which canbe estimated without performing actual measurements of moisture or salt transport. Theefficiency number, estimated in various ways, shows that the efficiency of salt transportfrom the Bentheimer sandstone to the plaster is very good, whereas the efficiency of salttransport from calcium-silicate brick to the same plaster is poor. Even without knowingthe salt or water quantities in the plaster and the substrate, it is possible to obtain anestimate of εp using the cumulative pore-size distributions of the two materials. Therefore,it is possible to estimate the efficiency number εp before the materials are in physicalcontact. Finally, on basis of our results, we have discussed the salt transport properties ofvarious combinations of plasters and substrates, of which the pore-size distributions havebeen reported in the literature.
Concluding we like to note that all estimates for the efficiency number εp are basedon various assumptions, such as that the materials are in the perfect hydraulic contactand that the drying is sufficiently fast, i.e., Pe À 1. In the case of slow drying εp canonly be regarded as crude approximation of the efficiency of salt transport. In compositematerials which consist of more than 2 layers, the simple model that we used to estimatethe efficiency number εp may not be correct, and a non-invasive technique like NMR isnecessary to investigate the moisture and salt transport in these materials during thedrying process.

46 4. Moisture and salt transport in plaster/substrate layers
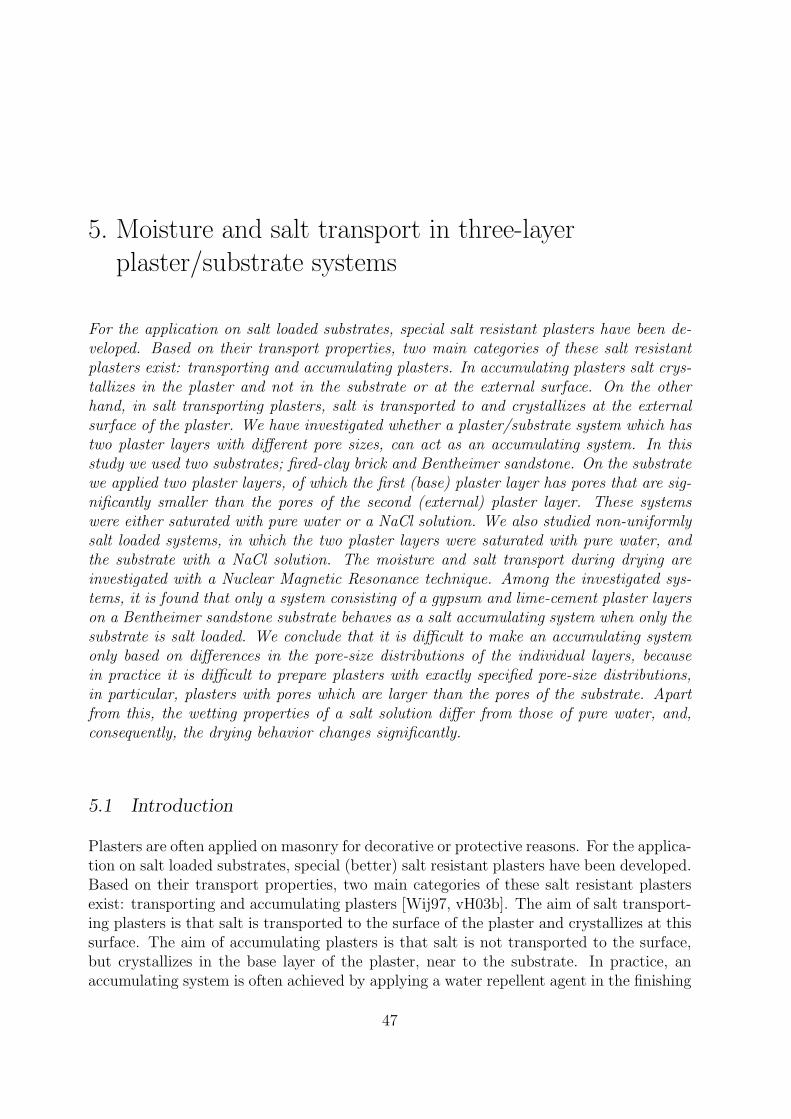
5. Moisture and salt transport in three-layerplaster/substrate systems
For the application on salt loaded substrates, special salt resistant plasters have been de-veloped. Based on their transport properties, two main categories of these salt resistantplasters exist: transporting and accumulating plasters. In accumulating plasters salt crys-tallizes in the plaster and not in the substrate or at the external surface. On the otherhand, in salt transporting plasters, salt is transported to and crystallizes at the externalsurface of the plaster. We have investigated whether a plaster/substrate system which hastwo plaster layers with different pore sizes, can act as an accumulating system. In thisstudy we used two substrates; fired-clay brick and Bentheimer sandstone. On the substratewe applied two plaster layers, of which the first (base) plaster layer has pores that are sig-nificantly smaller than the pores of the second (external) plaster layer. These systemswere either saturated with pure water or a NaCl solution. We also studied non-uniformlysalt loaded systems, in which the two plaster layers were saturated with pure water, andthe substrate with a NaCl solution. The moisture and salt transport during drying areinvestigated with a Nuclear Magnetic Resonance technique. Among the investigated sys-tems, it is found that only a system consisting of a gypsum and lime-cement plaster layerson a Bentheimer sandstone substrate behaves as a salt accumulating system when only thesubstrate is salt loaded. We conclude that it is difficult to make an accumulating systemonly based on differences in the pore-size distributions of the individual layers, becausein practice it is difficult to prepare plasters with exactly specified pore-size distributions,in particular, plasters with pores which are larger than the pores of the substrate. Apartfrom this, the wetting properties of a salt solution differ from those of pure water, and,consequently, the drying behavior changes significantly.
5.1 Introduction
Plasters are often applied on masonry for decorative or protective reasons. For the applica-tion on salt loaded substrates, special (better) salt resistant plasters have been developed.Based on their transport properties, two main categories of these salt resistant plastersexist: transporting and accumulating plasters [Wij97, vH03b]. The aim of salt transport-ing plasters is that salt is transported to the surface of the plaster and crystallizes at thissurface. The aim of accumulating plasters is that salt is not transported to the surface,but crystallizes in the base layer of the plaster, near to the substrate. In practice, anaccumulating system is often achieved by applying a water repellent agent in the finishing
47

48 5. Moisture and salt transport in three-layer plaster/substrate systems
plaster layer, which prevents water and salt migration into the surface layer. However,application of a completely water repellent layer has a big disadvantage, e.g., the risk ofspalling of such a layer due to salt crystallization just below it.
We have investigated whether a plaster system which contains no water repellent addi-tive, but which consists of two layers with different pore sizes, can act as an accumulatingplaster. In chapter 4 we have shown that in a layered system moisture and salt largelyremain in the material with the smallest pores. Therefore, to achieve an accumulatingsystem, the base plaster layer should have pores that are an order of magnitude smallerthan the pores of the substrate and the external plaster layer. On the other hand, to min-imize the salt accumulation in the external plaster layer, it should dry first. Therefore,the pores in this plaster layer should be the largest. The ideal pore-size distribution ofsuch a three-layer system is sketched in figure 5.1.
First, in section 5.2 the theoretical concept behind a three-layer system with accumu-lating properties is outlined. Next, the experimental procedure and the NMR techniqueused to measure the moisture and salt profiles is briefly reviewed in section 5.3. Themeasurements of water and salt profiles during drying are discussed in section 5.4. Twothree-layer systems were investigated: a fired clay brick substrate with a combination oflime-cement plasters and a Bentheimer sandstone substrate with a lime-cement plasteron which as a finishing a gypsum layer was applied. Finally, in section 5.5 the mainconclusions are given.
5.2 Theory
In this section we briefly discuss the moisture and salt transport during drying of three-layer systems consisting of two plaster layers and a substrate, in order to clarify the ideabehind an accumulating plaster based on pore size differences. Drying of a multi-layersystem is determined by the capillary pressure, i.e.,
pc =2γ cos φ
rm
. (5.1)
Here rm is the pore size that discriminates between the pores filled with water (r < rm)and the empty pores (r > rm). γ [N m−1] is the surface tension of the liquid/vaporinterface and φ is the contact angle between air/liquid and air/solid interfaces. Moredetails can be found in chapters 2 and 4.
At some time during the drying process and at a certain moisture content, water ispresent in the pores with diameters smaller than rm in all materials. Therefore, the ma-terial with the largest pores is ‘emptied’ first [Bra99]. According to the same principle,the layer with the smallest pores will dry last. In accumulating systems we would like theexternal layer to dry first, and therefore it should have larger pores than the base layerand the substrate, as is shown in figure 5.1. In that case the drying behavior resemblesthe drying of a plaster where a water repellent is applied in the outer layer.
5.3. Experimental 49
s u b s t r a t e
b a s e p l a s t e r l a y e r
e x t e r n a lp l a s t e r l a y e r
0 . 0 1 0 . 1 1 1 0 1 0 0 1 0 0 00
2
4
6
8
1 0
p o r e d i a m e t e r ( m )m
increm
ental
pore
volum
e (m
l/ml)
Fig. 5.1: Ideal pore-size distribution (PSD) of a three-layer system, which would accumulate saltmainly in the base plaster layer.
As already outlined in chapter 2 and chapter 4, the drying behavior of the differentlayers influences the salt transport. The competition between ion advection and diffusionis characterized by a Peclet number Pe, which can be estimated from the water velocity|U |:
Pe =|U |LD
, (5.2)
where L and D are the length scale of interest and the ion diffusivity, respectively. ForPe À 1 advection dominates the ion transport, which happens at sufficiently high dryingrates, whereas for Pe ¿ 1 diffusion dominates the ion transport, which happens at lowdrying rates.
If the external layer has the largest pores, it dries first and the transport of liquidwater and salt through this layer stops. During a later stage of the drying process, therest of the salt that is present in the system will remain in the the base layer, the substrateor both. If the smallest pores are present in the base layer, as sketched in figure 5.1, weexpect that salt accumulates preferably in that layer.
5.3 Experimental
The samples used in our study are cylindrical rods of about 19 mm diameter and 50 mmheight. They were uniformly capillary saturated by immersing them in water or a NaClsolution, c = 4 mol l−1, for about 20 hours. The corresponding salt quantity amounts toroughly 0.02 gram per gram of sample. The samples were sealed with teflon tape fromall sides except the top surface. The drying of the samples is enhanced by dry air (0.7 lmin−1) flowing over the exposed surface.

50 5. Moisture and salt transport in three-layer plaster/substrate systems
The H and Na profiles have been measured with NMR using the setup described inchapter 3. The echo times for measuring hydrogen and sodium were 0.2 and 0.45 ms,respectively. Some Na signal loss occurred in the plaster layers, due to fast T2 relaxation.
Since the NMR sensitivity for Na is low, a high NaCl concentration (c = 4 mol l−1) wasused. Moreover, the Na signals from 256 successive spin-echo measurements were averagedto obtain a sufficient signal to noise ratio. The main magnetic field B0 and the gradient Gwere 0.7 T and 0.33 T m−1, respectively. The one-dimensional resolution was 0.9±0.1 mmfor H and 3.5±0.5 mm for Na. To determine the H and Na profiles the sample was movedin the vertical (x) direction by means of a step-motor [Pel95]. Due to the short transverserelaxation time of Na in the solid phase [Pel03], in our equipment only dissolved Na ionsare measured. During the acquisition of the profiles the RF frequency is switched in sucha way that the H and Na signals can be recorded quasi-simultaneously [Pel95, Pel00].
Using an external standard, the H and Na signal intensities can be related to thevolume of water [cm3] and the quantity of Na [mol]. This standard contained a NaClsolution (c = 3 mol l−1), to which a small amount of CuCl2 (c = 0.03 mol l−1) was addedto decrease the longitudinal relaxation time of hydrogen and, consequently, the repetitiontime of the spin-echo sequences (see chapter 3).
5.4 Results
5.4.1 Plaster layers on a fired-clay brick substrate: an LS system
First a system was measured consisting of a fired-clay brick (FCB) substrate on whichtwo plaster layers (S and L) where applied. These plaster layers were prepared usingdifferent sand particle distributions in such a way that plaster S should have small poresand plaster L large pores.
Table 5.1: Volume ratio of the ingredients used for the preparation of the plaster.
Blast furnace slag cement Ca(OH)2 sand 0.5–1 mm fine particlesL plaster 1 4 20 -S plaster 1 4 8.5 1.5
The ingredients used for the plaster preparation are shown in table 5.1. The systemwas dried during seven days in a plastic box and during 21 days at 40 ◦C and 65 %relative humidity. After that the system was carbonated during a few weeks, until fullcarbonation was reached, in a box with 3 % CO2 (v/v) at 50 % relative humidity. Thissystem will further be referred to as the LS system.
The pore sizes of the various materials have been measure by means of mercury intru-sion porosimetry (MIP). The differential intrusion and the cumulative pore volume versuspore diameter are presented in figure 5.2. Both the S and L plasters appear to havebimodal pore-size distributions. The pore sizes, however, are rather similar, indicatingthat the initial goal was not reached.
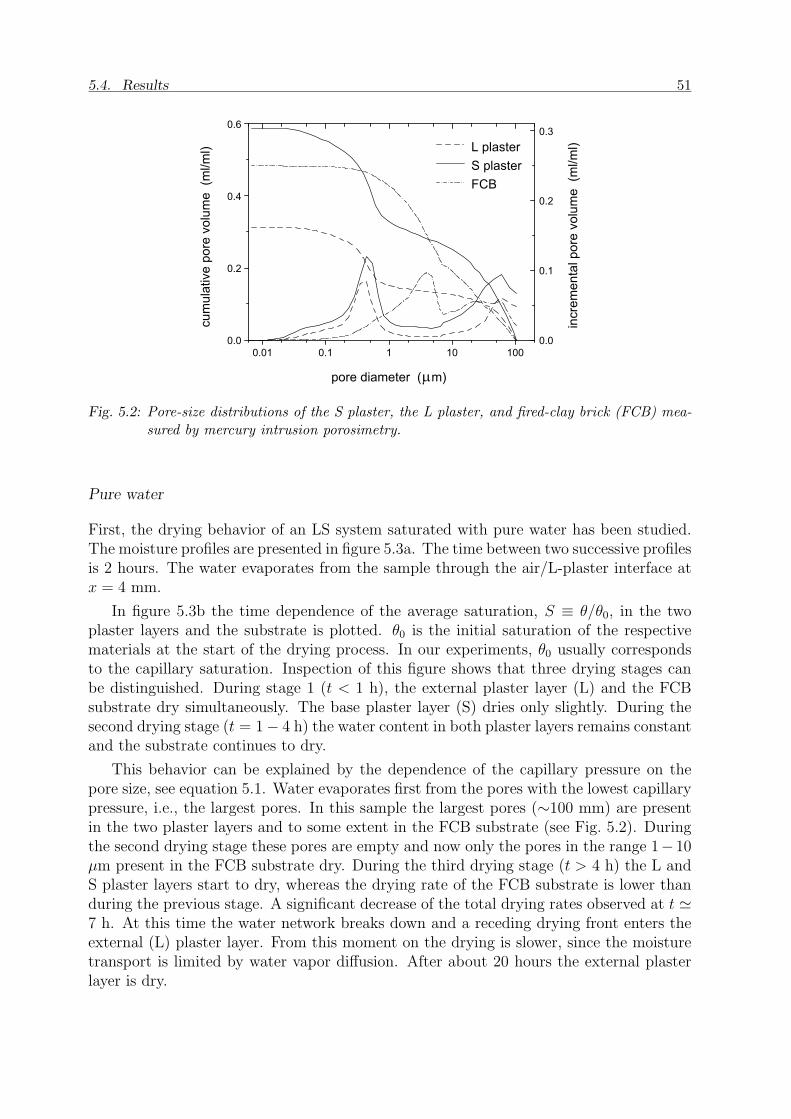
5.4. Results 51
0 . 0 1 0 . 1 1 1 0 1 0 00 . 0
0 . 2
0 . 4
0 . 6
0 . 0
0 . 1
0 . 2
0 . 3
cumu
lative
pore
volum
e (m
l/ml)
increm
ental
pore
volum
e (m
l/ml) L p l a s t e r
S p l a s t e r F C B
p o r e d i a m e t e r ( m )m
Fig. 5.2: Pore-size distributions of the S plaster, the L plaster, and fired-clay brick (FCB) mea-sured by mercury intrusion porosimetry.
Pure water
First, the drying behavior of an LS system saturated with pure water has been studied.The moisture profiles are presented in figure 5.3a. The time between two successive profilesis 2 hours. The water evaporates from the sample through the air/L-plaster interface atx = 4 mm.
In figure 5.3b the time dependence of the average saturation, S ≡ θ/θ0, in the twoplaster layers and the substrate is plotted. θ0 is the initial saturation of the respectivematerials at the start of the drying process. In our experiments, θ0 usually correspondsto the capillary saturation. Inspection of this figure shows that three drying stages canbe distinguished. During stage 1 (t < 1 h), the external plaster layer (L) and the FCBsubstrate dry simultaneously. The base plaster layer (S) dries only slightly. During thesecond drying stage (t = 1− 4 h) the water content in both plaster layers remains constantand the substrate continues to dry.
This behavior can be explained by the dependence of the capillary pressure on thepore size, see equation 5.1. Water evaporates first from the pores with the lowest capillarypressure, i.e., the largest pores. In this sample the largest pores (∼100 mm) are presentin the two plaster layers and to some extent in the FCB substrate (see Fig. 5.2). Duringthe second drying stage these pores are empty and now only the pores in the range 1−10µm present in the FCB substrate dry. During the third drying stage (t > 4 h) the L andS plaster layers start to dry, whereas the drying rate of the FCB substrate is lower thanduring the previous stage. A significant decrease of the total drying rates observed at t '7 h. At this time the water network breaks down and a receding drying front enters theexternal (L) plaster layer. From this moment on the drying is slower, since the moisturetransport is limited by water vapor diffusion. After about 20 hours the external plasterlayer is dry.
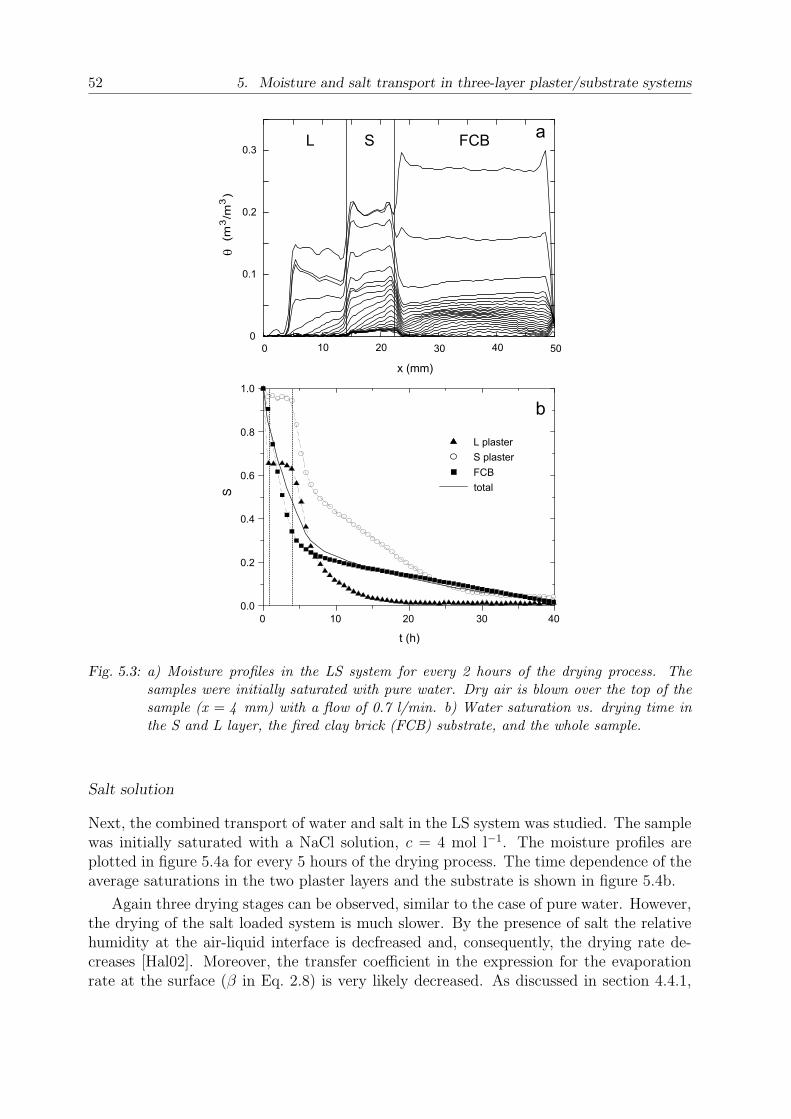
52 5. Moisture and salt transport in three-layer plaster/substrate systems
0 1 0 2 0 3 0 4 00 . 0
0 . 2
0 . 4
0 . 6
0 . 8
1 . 0
S
t ( h )
L p l a s t e r S p l a s t e r F C B t o t a l
0
0 . 1
0 . 2
0 . 3
0 1 0 2 0 3 0 4 0 5 0x ( m m )
F C BSL
b
a
(m3 /m
3 )q
Fig. 5.3: a) Moisture profiles in the LS system for every 2 hours of the drying process. Thesamples were initially saturated with pure water. Dry air is blown over the top of thesample (x = 4 mm) with a flow of 0.7 l/min. b) Water saturation vs. drying time inthe S and L layer, the fired clay brick (FCB) substrate, and the whole sample.
Salt solution
Next, the combined transport of water and salt in the LS system was studied. The samplewas initially saturated with a NaCl solution, c = 4 mol l−1. The moisture profiles areplotted in figure 5.4a for every 5 hours of the drying process. The time dependence of theaverage saturations in the two plaster layers and the substrate is shown in figure 5.4b.
Again three drying stages can be observed, similar to the case of pure water. However,the drying of the salt loaded system is much slower. By the presence of salt the relativehumidity at the air-liquid interface is decfreased and, consequently, the drying rate de-creases [Hal02]. Moreover, the transfer coefficient in the expression for the evaporationrate at the surface (β in Eq. 2.8) is very likely decreased. As discussed in section 4.4.1,
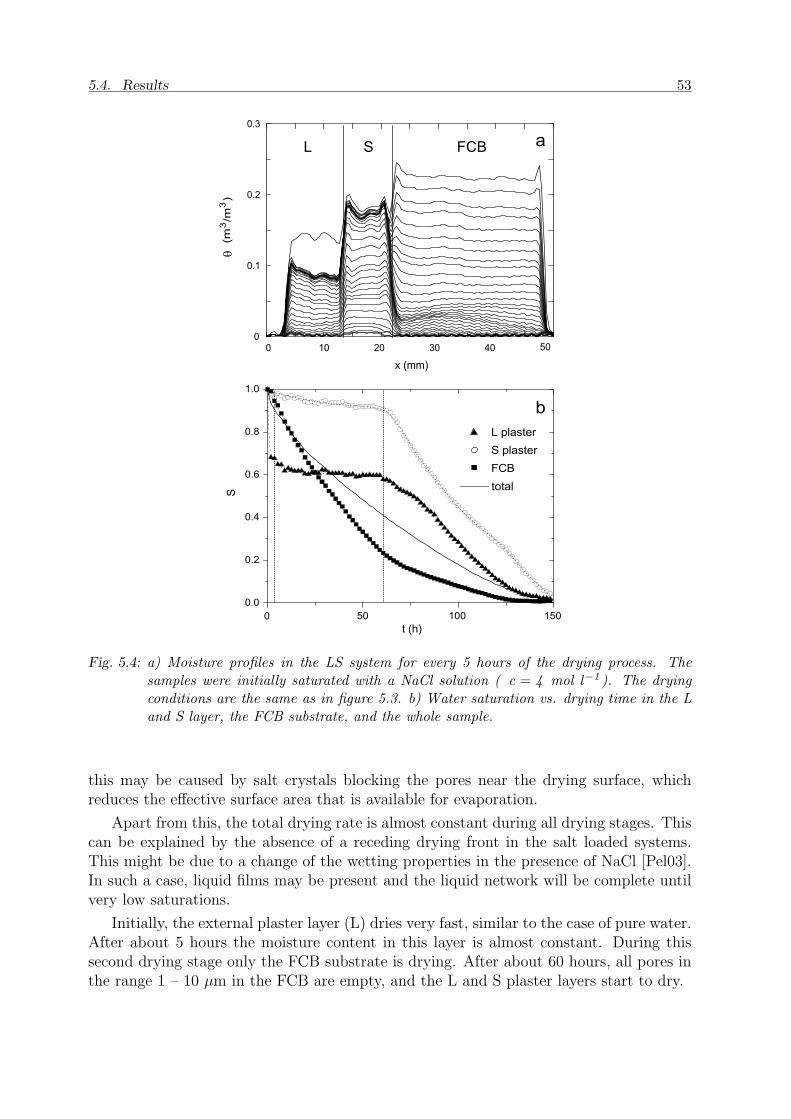
5.4. Results 53
L F C BS
0
0 . 1
0 . 2
0 . 3
0 1 0 2 0 3 0 4 0 5 0
L p l a s t e r S p l a s t e r F C B t o t a l
0 5 0 1 0 0 1 5 00 . 0
0 . 2
0 . 4
0 . 6
0 . 8
1 . 0
(m3 /m
3 )q
S
x ( m m )
t ( h )
a
b
Fig. 5.4: a) Moisture profiles in the LS system for every 5 hours of the drying process. Thesamples were initially saturated with a NaCl solution ( c = 4 mol l−1 ). The dryingconditions are the same as in figure 5.3. b) Water saturation vs. drying time in the Land S layer, the FCB substrate, and the whole sample.
this may be caused by salt crystals blocking the pores near the drying surface, whichreduces the effective surface area that is available for evaporation.
Apart from this, the total drying rate is almost constant during all drying stages. Thiscan be explained by the absence of a receding drying front in the salt loaded systems.This might be due to a change of the wetting properties in the presence of NaCl [Pel03].In such a case, liquid films may be present and the liquid network will be complete untilvery low saturations.
Initially, the external plaster layer (L) dries very fast, similar to the case of pure water.After about 5 hours the moisture content in this layer is almost constant. During thissecond drying stage only the FCB substrate is drying. After about 60 hours, all pores inthe range 1 – 10 µm in the FCB are empty, and the L and S plaster layers start to dry.

54 5. Moisture and salt transport in three-layer plaster/substrate systems
0
0 . 2
0 . 4
0 . 6
0 . 8
1
0 1 0 2 0 3 0 4 0 5 0
F C BSL
0 5 0 1 0 0 1 5 00
1
2
3
4
5
6
Na co
ntent
x 103
(mol/
m3)
Na co
ntent
(mmo
l)
x ( m m )
t ( h )
a
L p l a s t e r S p l a s t e r F C B
b
Fig. 5.5: a) Profiles of dissolved Na in the LS system for every 5 hours of the drying process.The samples were initially saturated with a NaCl solution ( c = 4 mol l−1 ). The dryingconditions are the same as in figure 5.3. b) Amount of dissolved Na vs. drying time inin the L layer, the S layer, and the FCB substrate.
In figure 5.5a the Na profiles are presented for every 5 hours of the drying process.The time dependence of the total amounts of dissolved Na in the plaster layers and thesubstrate is shown in figure 5.5b. We have to remark that in the plaster layers the Nacontent is underestimated, since not all dissolved ions could be measured due to the fasttransverse (T2) relaxation of Na in the small pores. In fired-clay brick there is no Nasignal loss, and the amount of dissolved ions can be measured quantitatively.
Inspection of figure 5.5b reveals that during the second stage of the drying process theNa content in the FCB substrate decreases. This is supported by the value of the Pecletnumber (Pe). This number can be calculated from the velocity profiles, similar to the
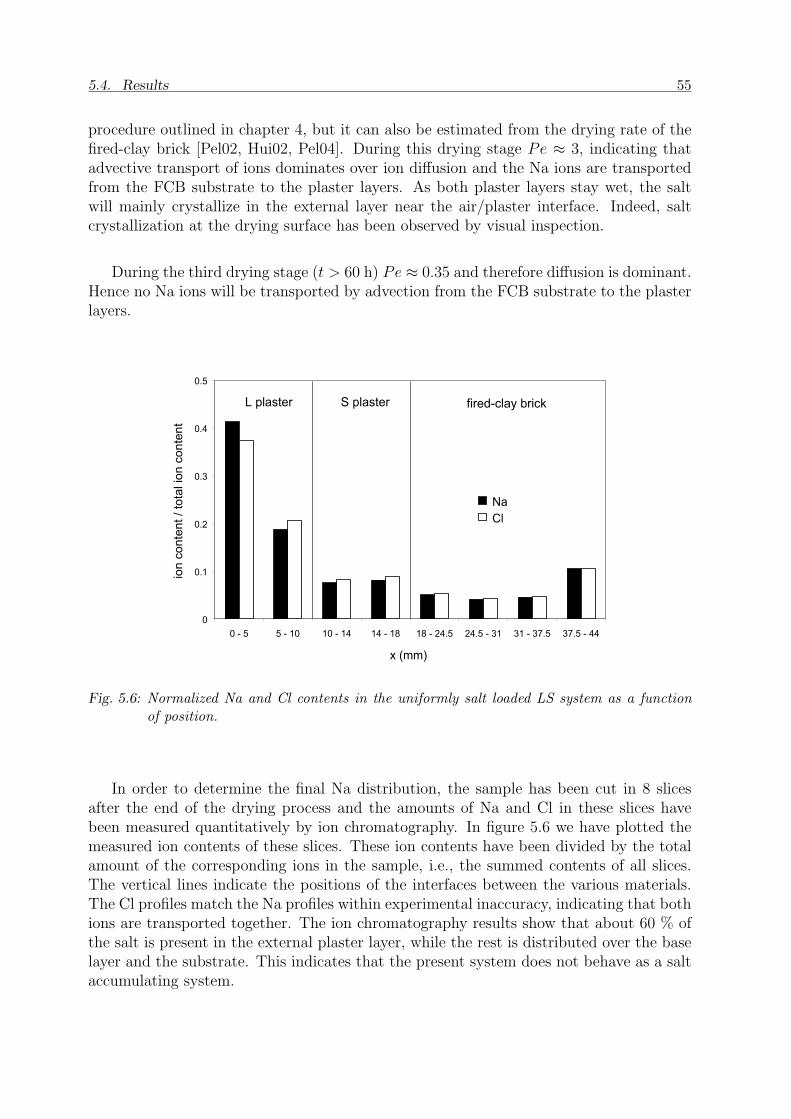
5.4. Results 55
procedure outlined in chapter 4, but it can also be estimated from the drying rate of thefired-clay brick [Pel02, Hui02, Pel04]. During this drying stage Pe ≈ 3, indicating thatadvective transport of ions dominates over ion diffusion and the Na ions are transportedfrom the FCB substrate to the plaster layers. As both plaster layers stay wet, the saltwill mainly crystallize in the external layer near the air/plaster interface. Indeed, saltcrystallization at the drying surface has been observed by visual inspection.
During the third drying stage (t > 60 h) Pe ≈ 0.35 and therefore diffusion is dominant.Hence no Na ions will be transported by advection from the FCB substrate to the plasterlayers.
0
0 . 1
0 . 2
0 . 3
0 . 4
0 . 5
0 - 5 5 - 1 0 1 0 - 1 4 1 4 - 1 8 1 8 - 2 4 . 5 2 4 . 5 - 3 1 3 1 - 3 7 . 5 3 7 . 5 - 4 4x ( m m )
ion co
ntent
/ total
ion c
onten
t
N a C l
f i r e d - c l a y b r i c kS p l a s t e rL p l a s t e r
Fig. 5.6: Normalized Na and Cl contents in the uniformly salt loaded LS system as a functionof position.
In order to determine the final Na distribution, the sample has been cut in 8 slicesafter the end of the drying process and the amounts of Na and Cl in these slices havebeen measured quantitatively by ion chromatography. In figure 5.6 we have plotted themeasured ion contents of these slices. These ion contents have been divided by the totalamount of the corresponding ions in the sample, i.e., the summed contents of all slices.The vertical lines indicate the positions of the interfaces between the various materials.The Cl profiles match the Na profiles within experimental inaccuracy, indicating that bothions are transported together. The ion chromatography results show that about 60 % ofthe salt is present in the external plaster layer, while the rest is distributed over the baselayer and the substrate. This indicates that the present system does not behave as a saltaccumulating system.
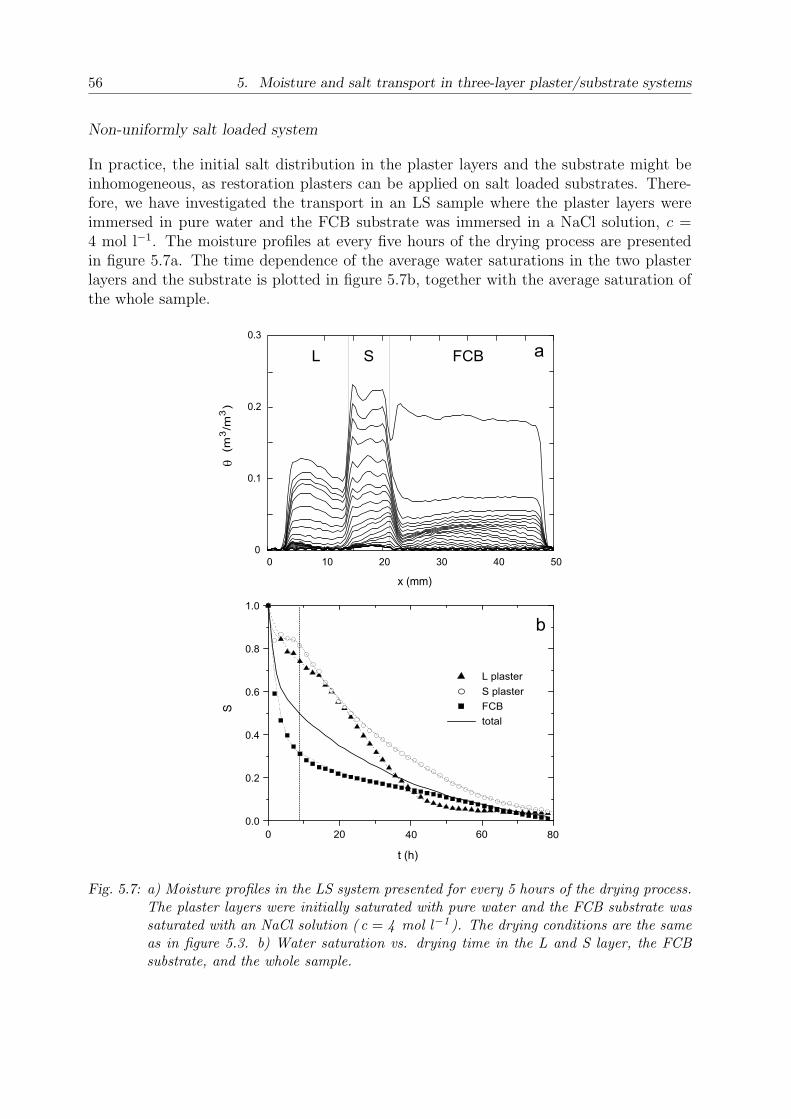
56 5. Moisture and salt transport in three-layer plaster/substrate systems
Non-uniformly salt loaded system
In practice, the initial salt distribution in the plaster layers and the substrate might beinhomogeneous, as restoration plasters can be applied on salt loaded substrates. There-fore, we have investigated the transport in an LS sample where the plaster layers wereimmersed in pure water and the FCB substrate was immersed in a NaCl solution, c =4 mol l−1. The moisture profiles at every five hours of the drying process are presentedin figure 5.7a. The time dependence of the average water saturations in the two plasterlayers and the substrate is plotted in figure 5.7b, together with the average saturation ofthe whole sample.
0 2 0 4 0 6 0 8 00 . 0
0 . 2
0 . 4
0 . 6
0 . 8
1 . 0
L p l a s t e r S p l a s t e r F C B t o t a l
0
0 . 1
0 . 2
0 . 3
0 1 0 2 0 3 0 4 0 5 0
F C BSL
b
a
(m3 /m
3 )q
x ( m m )
t ( h )
S
Fig. 5.7: a) Moisture profiles in the LS system presented for every 5 hours of the drying process.The plaster layers were initially saturated with pure water and the FCB substrate wassaturated with an NaCl solution ( c = 4 mol l−1 ). The drying conditions are the sameas in figure 5.3. b) Water saturation vs. drying time in the L and S layer, the FCBsubstrate, and the whole sample.
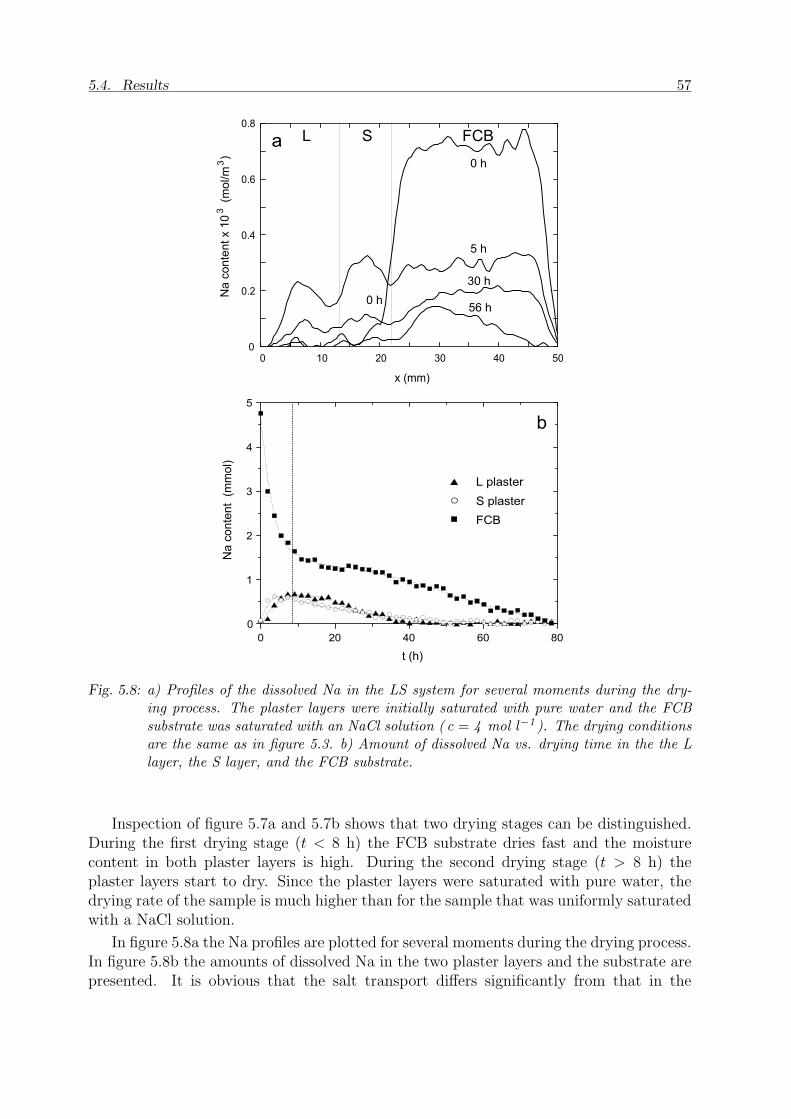
5.4. Results 57
b
a
0 2 0 4 0 6 0 8 00
1
2
3
4
5
0
0 . 2
0 . 4
0 . 6
0 . 8
0 1 0 2 0 3 0 4 0 5 0
F C BSL0 h
0 h
5 h
3 0 h5 6 h
x ( m m )
t ( h )
Na co
ntent
x 103
(mol/
m3)
Na co
ntent
(mmo
l)
L p l a s t e r S p l a s t e r F C B
Fig. 5.8: a) Profiles of the dissolved Na in the LS system for several moments during the dry-ing process. The plaster layers were initially saturated with pure water and the FCBsubstrate was saturated with an NaCl solution ( c = 4 mol l−1 ). The drying conditionsare the same as in figure 5.3. b) Amount of dissolved Na vs. drying time in the the Llayer, the S layer, and the FCB substrate.
Inspection of figure 5.7a and 5.7b shows that two drying stages can be distinguished.During the first drying stage (t < 8 h) the FCB substrate dries fast and the moisturecontent in both plaster layers is high. During the second drying stage (t > 8 h) theplaster layers start to dry. Since the plaster layers were saturated with pure water, thedrying rate of the sample is much higher than for the sample that was uniformly saturatedwith a NaCl solution.
In figure 5.8a the Na profiles are plotted for several moments during the drying process.In figure 5.8b the amounts of dissolved Na in the two plaster layers and the substrate arepresented. It is obvious that the salt transport differs significantly from that in the
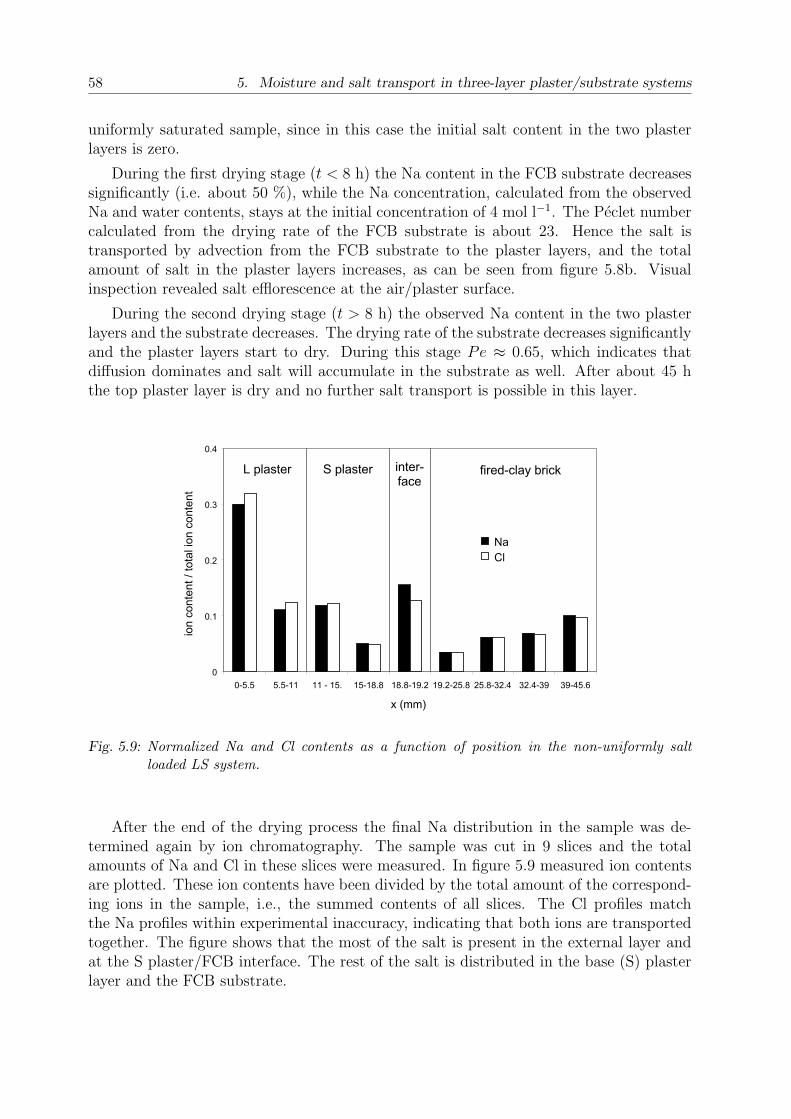
58 5. Moisture and salt transport in three-layer plaster/substrate systems
uniformly saturated sample, since in this case the initial salt content in the two plasterlayers is zero.
During the first drying stage (t < 8 h) the Na content in the FCB substrate decreasessignificantly (i.e. about 50 %), while the Na concentration, calculated from the observedNa and water contents, stays at the initial concentration of 4 mol l−1. The Peclet numbercalculated from the drying rate of the FCB substrate is about 23. Hence the salt istransported by advection from the FCB substrate to the plaster layers, and the totalamount of salt in the plaster layers increases, as can be seen from figure 5.8b. Visualinspection revealed salt efflorescence at the air/plaster surface.
During the second drying stage (t > 8 h) the observed Na content in the two plasterlayers and the substrate decreases. The drying rate of the substrate decreases significantlyand the plaster layers start to dry. During this stage Pe ≈ 0.65, which indicates thatdiffusion dominates and salt will accumulate in the substrate as well. After about 45 hthe top plaster layer is dry and no further salt transport is possible in this layer.
0
0 . 1
0 . 2
0 . 3
0 . 4
0 - 5 . 5 5 . 5 - 1 1 1 1 - 1 5 . 1 5 - 1 8 . 8 1 8 . 8 - 1 9 . 2 1 9 . 2 - 2 5 . 8 2 5 . 8 - 3 2 . 4 3 2 . 4 - 3 9 3 9 - 4 5 . 6x ( m m )
ion co
ntent
/ total
ion c
onten
t
N a C l
f i r e d - c l a y b r i c ki n t e r -f a c eS p l a s t e rL p l a s t e r
Fig. 5.9: Normalized Na and Cl contents as a function of position in the non-uniformly saltloaded LS system.
After the end of the drying process the final Na distribution in the sample was de-termined again by ion chromatography. The sample was cut in 9 slices and the totalamounts of Na and Cl in these slices were measured. In figure 5.9 measured ion contentsare plotted. These ion contents have been divided by the total amount of the correspond-ing ions in the sample, i.e., the summed contents of all slices. The Cl profiles matchthe Na profiles within experimental inaccuracy, indicating that both ions are transportedtogether. The figure shows that the most of the salt is present in the external layer andat the S plaster/FCB interface. The rest of the salt is distributed in the base (S) plasterlayer and the FCB substrate.
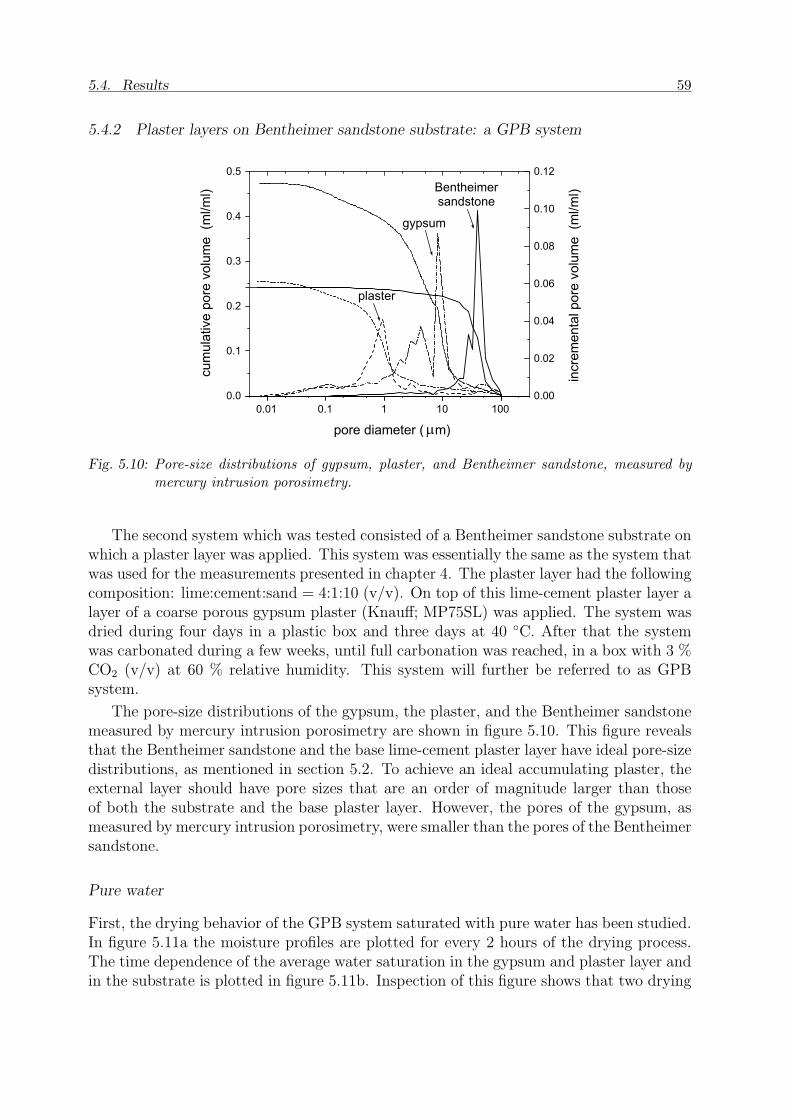
5.4. Results 59
5.4.2 Plaster layers on Bentheimer sandstone substrate: a GPB system
0 . 0 1 0 . 1 1 1 0 1 0 00 . 0
0 . 1
0 . 2
0 . 3
0 . 4
0 . 5
0 . 0 0
0 . 0 2
0 . 0 4
0 . 0 6
0 . 0 8
0 . 1 0
0 . 1 2B e n t h e i m e rs a n d s t o n e
g y p s u m
p l a s t e r
increm
ental
pore
volum
e (m
l/ml)
cumu
lative
pore
volum
e (m
l/ml)
p o r e d i a m e t e r ( m )m
Fig. 5.10: Pore-size distributions of gypsum, plaster, and Bentheimer sandstone, measured bymercury intrusion porosimetry.
The second system which was tested consisted of a Bentheimer sandstone substrate onwhich a plaster layer was applied. This system was essentially the same as the system thatwas used for the measurements presented in chapter 4. The plaster layer had the followingcomposition: lime:cement:sand = 4:1:10 (v/v). On top of this lime-cement plaster layer alayer of a coarse porous gypsum plaster (Knauff; MP75SL) was applied. The system wasdried during four days in a plastic box and three days at 40 ◦C. After that the systemwas carbonated during a few weeks, until full carbonation was reached, in a box with 3 %CO2 (v/v) at 60 % relative humidity. This system will further be referred to as GPBsystem.
The pore-size distributions of the gypsum, the plaster, and the Bentheimer sandstonemeasured by mercury intrusion porosimetry are shown in figure 5.10. This figure revealsthat the Bentheimer sandstone and the base lime-cement plaster layer have ideal pore-sizedistributions, as mentioned in section 5.2. To achieve an ideal accumulating plaster, theexternal layer should have pore sizes that are an order of magnitude larger than thoseof both the substrate and the base plaster layer. However, the pores of the gypsum, asmeasured by mercury intrusion porosimetry, were smaller than the pores of the Bentheimersandstone.
Pure water
First, the drying behavior of the GPB system saturated with pure water has been studied.In figure 5.11a the moisture profiles are plotted for every 2 hours of the drying process.The time dependence of the average water saturation in the gypsum and plaster layer andin the substrate is plotted in figure 5.11b. Inspection of this figure shows that two drying
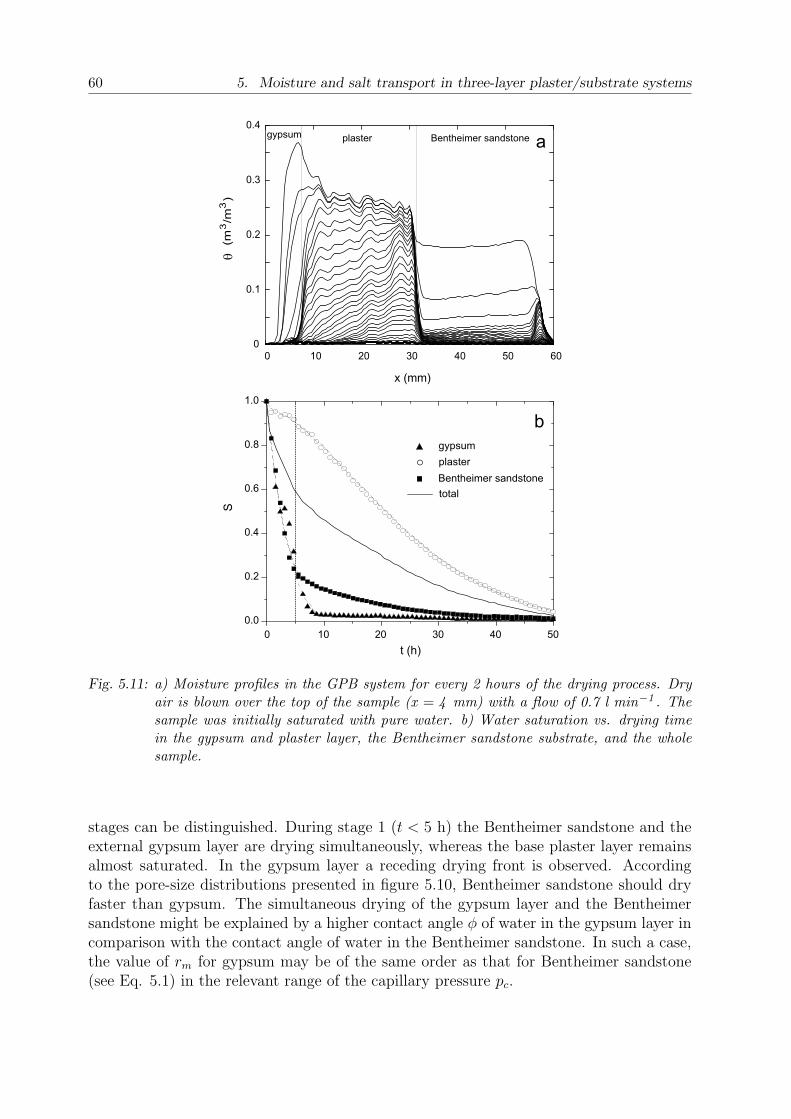
60 5. Moisture and salt transport in three-layer plaster/substrate systems
0 1 0 2 0 3 0 4 0 5 00 . 0
0 . 2
0 . 4
0 . 6
0 . 8
1 . 0
g y p s u m p l a s t e r B e n t h e i m e r s a n d s t o n e t o t a l
0
0 . 1
0 . 2
0 . 3
0 . 4
0 1 0 2 0 3 0 4 0 5 0 6 0
B e n t h e i m e r s a n d s t o n ep l a s t e rg y p s u m
b
a
(m3 /m
3 )q
S
t ( h )
x ( m m )
Fig. 5.11: a) Moisture profiles in the GPB system for every 2 hours of the drying process. Dryair is blown over the top of the sample (x = 4 mm) with a flow of 0.7 l min−1 . Thesample was initially saturated with pure water. b) Water saturation vs. drying timein the gypsum and plaster layer, the Bentheimer sandstone substrate, and the wholesample.
stages can be distinguished. During stage 1 (t < 5 h) the Bentheimer sandstone and theexternal gypsum layer are drying simultaneously, whereas the base plaster layer remainsalmost saturated. In the gypsum layer a receding drying front is observed. Accordingto the pore-size distributions presented in figure 5.10, Bentheimer sandstone should dryfaster than gypsum. The simultaneous drying of the gypsum layer and the Bentheimersandstone might be explained by a higher contact angle φ of water in the gypsum layer incomparison with the contact angle of water in the Bentheimer sandstone. In such a case,the value of rm for gypsum may be of the same order as that for Bentheimer sandstone(see Eq. 5.1) in the relevant range of the capillary pressure pc.
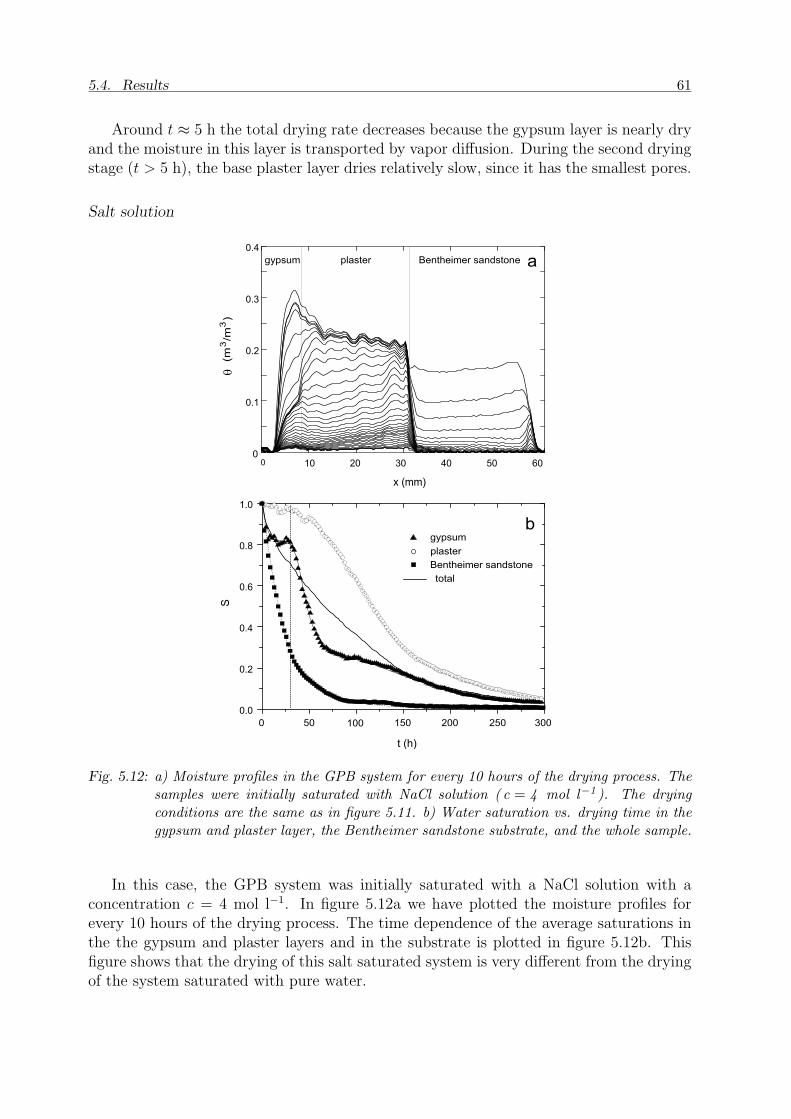
5.4. Results 61
Around t ≈ 5 h the total drying rate decreases because the gypsum layer is nearly dryand the moisture in this layer is transported by vapor diffusion. During the second dryingstage (t > 5 h), the base plaster layer dries relatively slow, since it has the smallest pores.
Salt solution
0 5 0 1 0 0 1 5 0 2 0 0 2 5 0 3 0 00 . 0
0 . 2
0 . 4
0 . 6
0 . 8
1 . 0
S
t ( h )
t o t a l
0
0 . 1
0 . 2
0 . 3
0 . 4
0 1 0 2 0 3 0 4 0 5 0 6 0x ( m m )
B e n t h e i m e r s a n d s t o n eg y p s u m p l a s t e r
b
a
g y p s u mp l a s t e rB e n t h e i m e r s a n d s t o n e
(m3 /m
3 )q
Fig. 5.12: a) Moisture profiles in the GPB system for every 10 hours of the drying process. Thesamples were initially saturated with NaCl solution ( c = 4 mol l−1 ). The dryingconditions are the same as in figure 5.11. b) Water saturation vs. drying time in thegypsum and plaster layer, the Bentheimer sandstone substrate, and the whole sample.
In this case, the GPB system was initially saturated with a NaCl solution with aconcentration c = 4 mol l−1. In figure 5.12a we have plotted the moisture profiles forevery 10 hours of the drying process. The time dependence of the average saturations inthe the gypsum and plaster layers and in the substrate is plotted in figure 5.12b. Thisfigure shows that the drying of this salt saturated system is very different from the dryingof the system saturated with pure water.
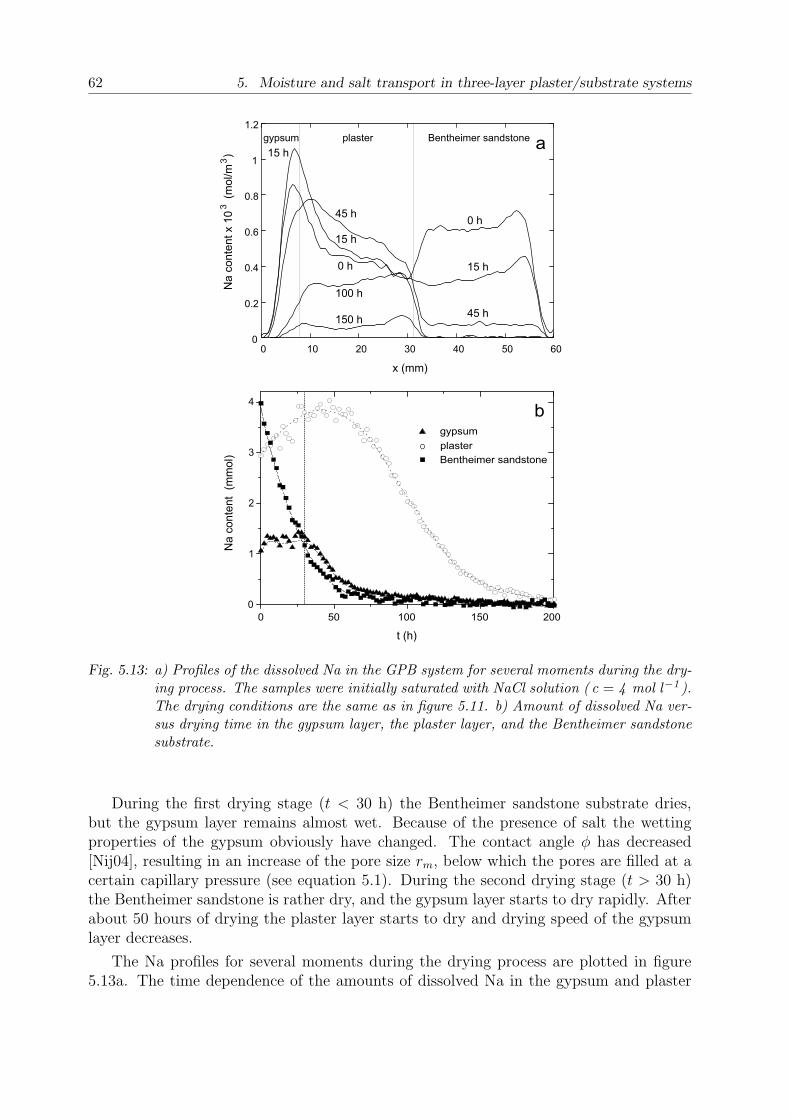
62 5. Moisture and salt transport in three-layer plaster/substrate systems
b
a
0 5 0 1 0 0 1 5 0 2 0 00
1
2
3
4
t ( h )
0
0 . 2
0 . 4
0 . 6
0 . 8
1
1 . 2
0 1 0 2 0 3 0 4 0 5 0 6 0
g y p s u m p l a s t e r B e n t h e i m e r s a n d s t o n e
Na co
ntent
x 103
(mol/
m3)
x ( m m )
Na co
ntent
(mmo
l)0 h
1 5 h
4 5 h
0 h
1 5 h
4 5 h
1 0 0 h1 5 0 h
1 5 h
g y p s u mp l a s t e rB e n t h e i m e r s a n d s t o n e
Fig. 5.13: a) Profiles of the dissolved Na in the GPB system for several moments during the dry-ing process. The samples were initially saturated with NaCl solution ( c = 4 mol l−1 ).The drying conditions are the same as in figure 5.11. b) Amount of dissolved Na ver-sus drying time in the gypsum layer, the plaster layer, and the Bentheimer sandstonesubstrate.
During the first drying stage (t < 30 h) the Bentheimer sandstone substrate dries,but the gypsum layer remains almost wet. Because of the presence of salt the wettingproperties of the gypsum obviously have changed. The contact angle φ has decreased[Nij04], resulting in an increase of the pore size rm, below which the pores are filled at acertain capillary pressure (see equation 5.1). During the second drying stage (t > 30 h)the Bentheimer sandstone is rather dry, and the gypsum layer starts to dry rapidly. Afterabout 50 hours of drying the plaster layer starts to dry and drying speed of the gypsumlayer decreases.
The Na profiles for several moments during the drying process are plotted in figure5.13a. The time dependence of the amounts of dissolved Na in the gypsum and plaster
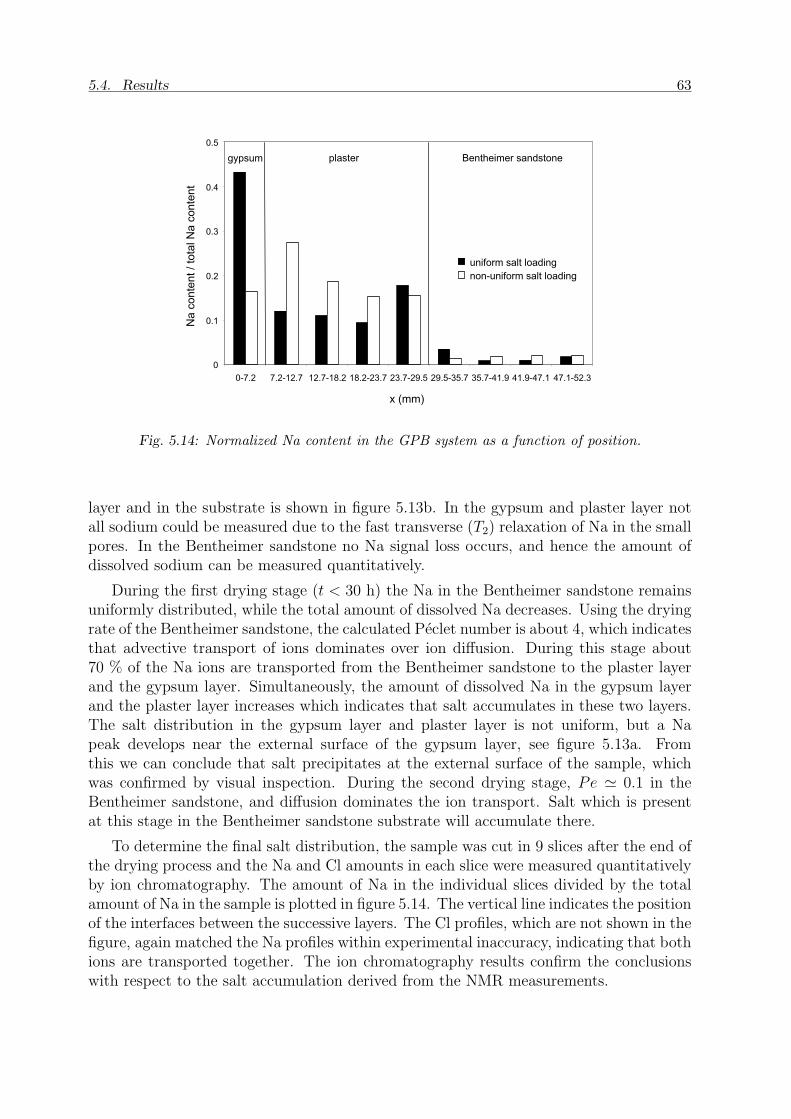
5.4. Results 63
0
0 . 1
0 . 2
0 . 3
0 . 4
0 . 5
0 - 7 . 2 7 . 2 - 1 2 . 7 1 2 . 7 - 1 8 . 2 1 8 . 2 - 2 3 . 7 2 3 . 7 - 2 9 . 5 2 9 . 5 - 3 5 . 7 3 5 . 7 - 4 1 . 9 4 1 . 9 - 4 7 . 1 4 7 . 1 - 5 2 . 3
x ( m m )
Na co
ntent
/ total
Na c
onten
t
u n i f o r m s a l t l o a d i n g n o n - u n i f o r m s a l t l o a d i n g
p l a s t e rg y p s u m B e n t h e i m e r s a n d s t o n e
Fig. 5.14: Normalized Na content in the GPB system as a function of position.
layer and in the substrate is shown in figure 5.13b. In the gypsum and plaster layer notall sodium could be measured due to the fast transverse (T2) relaxation of Na in the smallpores. In the Bentheimer sandstone no Na signal loss occurs, and hence the amount ofdissolved sodium can be measured quantitatively.
During the first drying stage (t < 30 h) the Na in the Bentheimer sandstone remainsuniformly distributed, while the total amount of dissolved Na decreases. Using the dryingrate of the Bentheimer sandstone, the calculated Peclet number is about 4, which indicatesthat advective transport of ions dominates over ion diffusion. During this stage about70 % of the Na ions are transported from the Bentheimer sandstone to the plaster layerand the gypsum layer. Simultaneously, the amount of dissolved Na in the gypsum layerand the plaster layer increases which indicates that salt accumulates in these two layers.The salt distribution in the gypsum layer and plaster layer is not uniform, but a Napeak develops near the external surface of the gypsum layer, see figure 5.13a. Fromthis we can conclude that salt precipitates at the external surface of the sample, whichwas confirmed by visual inspection. During the second drying stage, Pe ' 0.1 in theBentheimer sandstone, and diffusion dominates the ion transport. Salt which is presentat this stage in the Bentheimer sandstone substrate will accumulate there.
To determine the final salt distribution, the sample was cut in 9 slices after the end ofthe drying process and the Na and Cl amounts in each slice were measured quantitativelyby ion chromatography. The amount of Na in the individual slices divided by the totalamount of Na in the sample is plotted in figure 5.14. The vertical line indicates the positionof the interfaces between the successive layers. The Cl profiles, which are not shown in thefigure, again matched the Na profiles within experimental inaccuracy, indicating that bothions are transported together. The ion chromatography results confirm the conclusionswith respect to the salt accumulation derived from the NMR measurements.
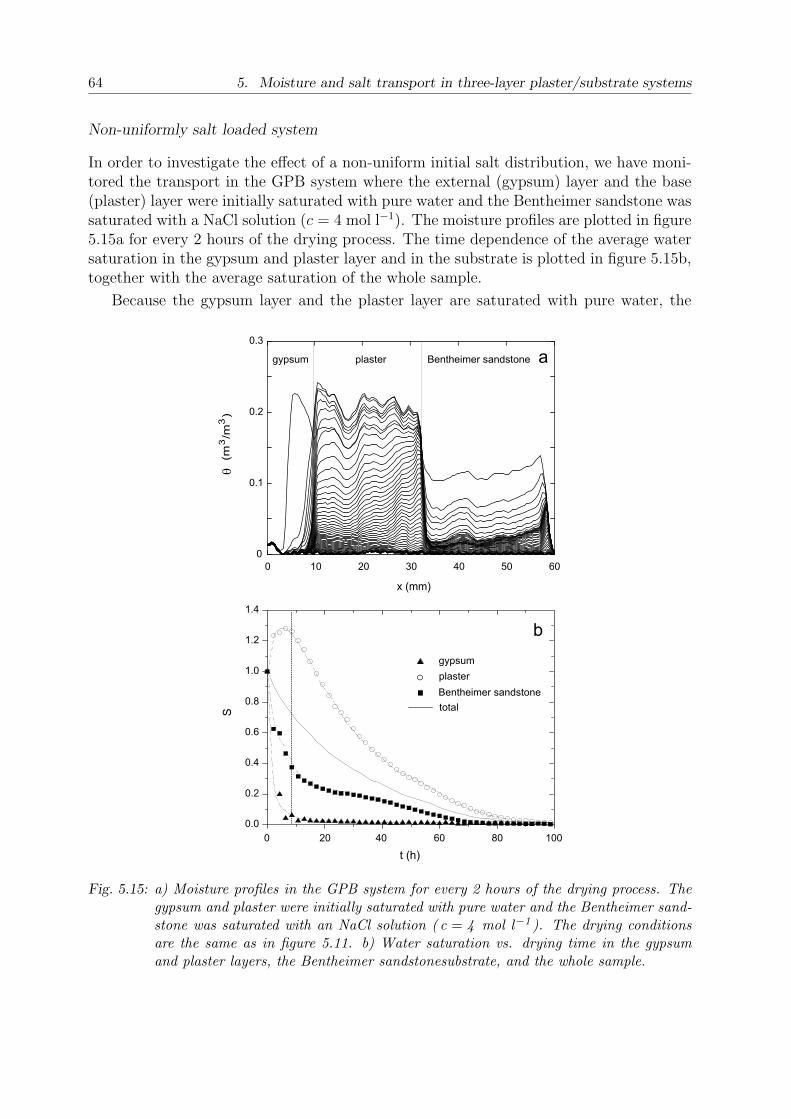
64 5. Moisture and salt transport in three-layer plaster/substrate systems
Non-uniformly salt loaded system
In order to investigate the effect of a non-uniform initial salt distribution, we have moni-tored the transport in the GPB system where the external (gypsum) layer and the base(plaster) layer were initially saturated with pure water and the Bentheimer sandstone wassaturated with a NaCl solution (c = 4 mol l−1). The moisture profiles are plotted in figure5.15a for every 2 hours of the drying process. The time dependence of the average watersaturation in the gypsum and plaster layer and in the substrate is plotted in figure 5.15b,together with the average saturation of the whole sample.
Because the gypsum layer and the plaster layer are saturated with pure water, the
0
0 . 1
0 . 2
0 . 3
0 1 0 2 0 3 0 4 0 5 0 6 0x ( m m )
g y p s u m p l a s t e r B e n t h e i m e r s a n d s t o n e a
0 2 0 4 0 6 0 8 0 1 0 00 . 0
0 . 2
0 . 4
0 . 6
0 . 8
1 . 0
1 . 2
1 . 4
t ( h )
b g y p s u m p l a s t e r B e n t h e i m e r s a n d s t o n e t o t a l
(m3 /m
3 )q
S
Fig. 5.15: a) Moisture profiles in the GPB system for every 2 hours of the drying process. Thegypsum and plaster were initially saturated with pure water and the Bentheimer sand-stone was saturated with an NaCl solution ( c = 4 mol l−1 ). The drying conditionsare the same as in figure 5.11. b) Water saturation vs. drying time in the gypsumand plaster layers, the Bentheimer sandstonesubstrate, and the whole sample.
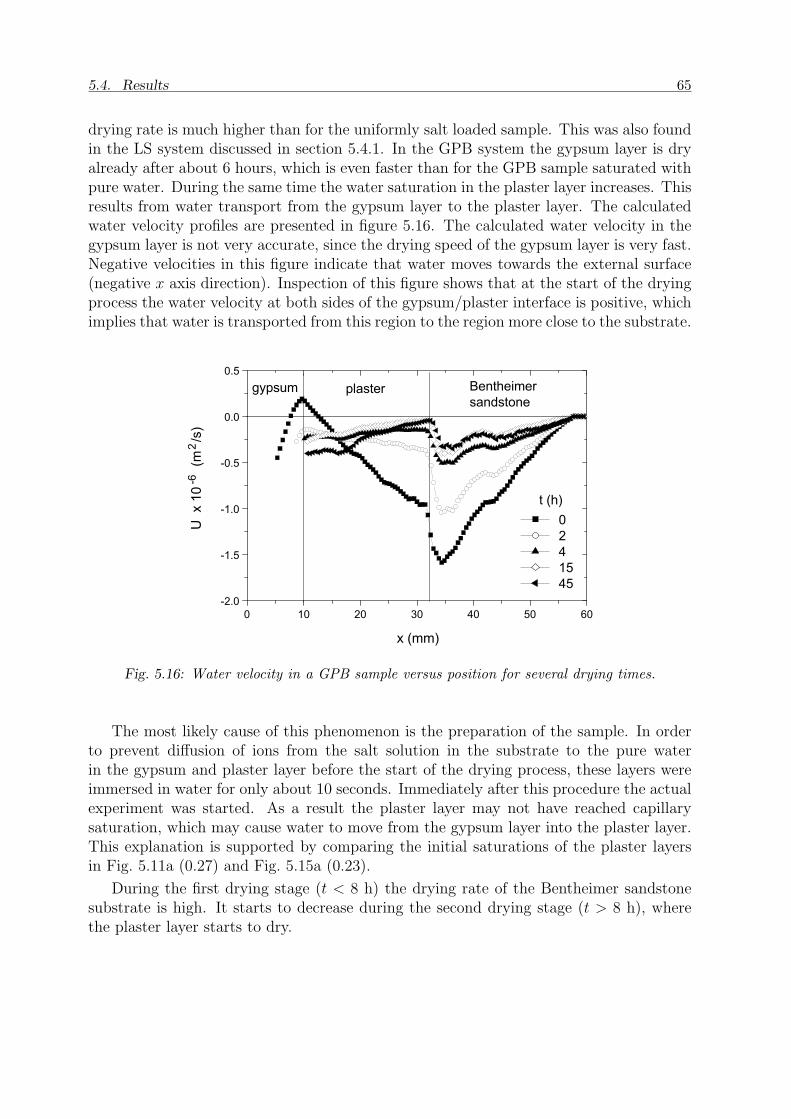
5.4. Results 65
drying rate is much higher than for the uniformly salt loaded sample. This was also foundin the LS system discussed in section 5.4.1. In the GPB system the gypsum layer is dryalready after about 6 hours, which is even faster than for the GPB sample saturated withpure water. During the same time the water saturation in the plaster layer increases. Thisresults from water transport from the gypsum layer to the plaster layer. The calculatedwater velocity profiles are presented in figure 5.16. The calculated water velocity in thegypsum layer is not very accurate, since the drying speed of the gypsum layer is very fast.Negative velocities in this figure indicate that water moves towards the external surface(negative x axis direction). Inspection of this figure shows that at the start of the dryingprocess the water velocity at both sides of the gypsum/plaster interface is positive, whichimplies that water is transported from this region to the region more close to the substrate.
0 1 0 2 0 3 0 4 0 5 0 6 0- 2 . 0
- 1 . 5
- 1 . 0
- 0 . 5
0 . 0
0 . 5g y p s u m p l a s t e r B e n t h e i m e r
s a n d s t o n e
t ( h ) 0 2 4 1 5 4 5
U x
10-6
(m2 /s
)
x ( m m )
Fig. 5.16: Water velocity in a GPB sample versus position for several drying times.
The most likely cause of this phenomenon is the preparation of the sample. In orderto prevent diffusion of ions from the salt solution in the substrate to the pure waterin the gypsum and plaster layer before the start of the drying process, these layers wereimmersed in water for only about 10 seconds. Immediately after this procedure the actualexperiment was started. As a result the plaster layer may not have reached capillarysaturation, which may cause water to move from the gypsum layer into the plaster layer.This explanation is supported by comparing the initial saturations of the plaster layersin Fig. 5.11a (0.27) and Fig. 5.15a (0.23).
During the first drying stage (t < 8 h) the drying rate of the Bentheimer sandstonesubstrate is high. It starts to decrease during the second drying stage (t > 8 h), wherethe plaster layer starts to dry.
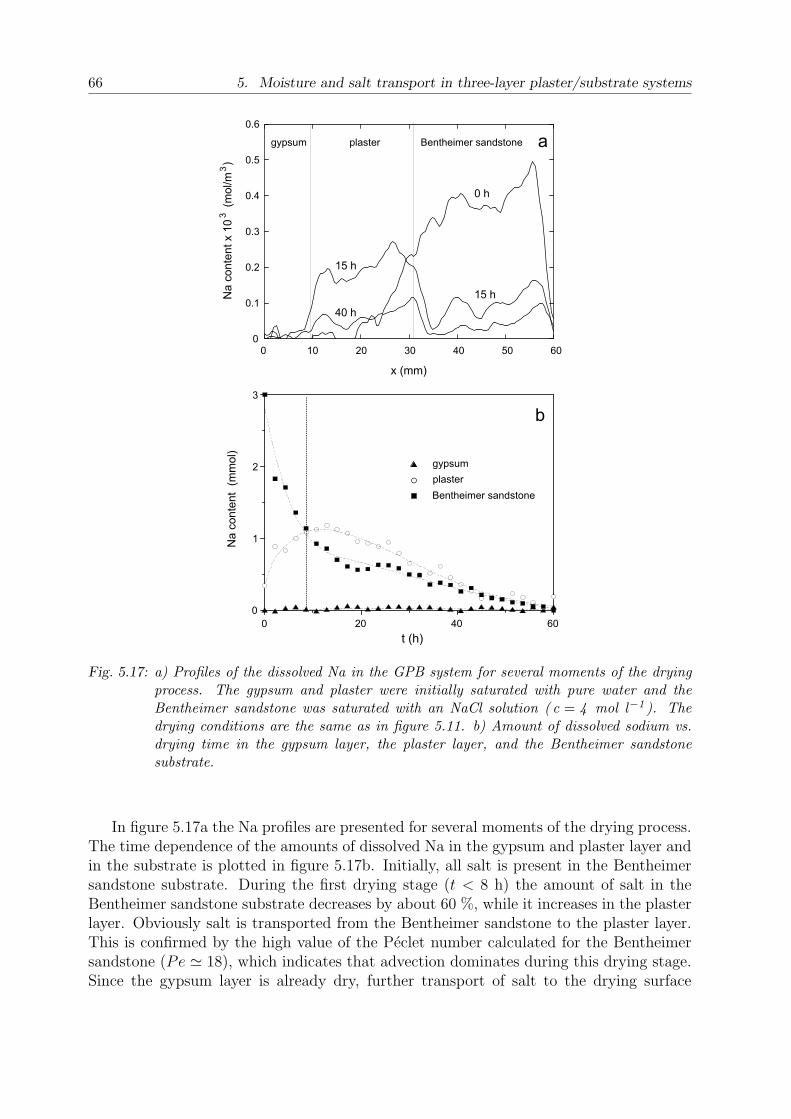
66 5. Moisture and salt transport in three-layer plaster/substrate systems
a
b
0 2 0 4 0 6 00
1
2
3
t ( h )
0
0 . 1
0 . 2
0 . 3
0 . 4
0 . 5
0 . 6
0 1 0 2 0 3 0 4 0 5 0 6 0x ( m m )
B e n t h e i m e r s a n d s t o n ep l a s t e rg y p s u m
0 h
1 5 h4 0 h
1 5 h
g y p s u m p l a s t e r B e n t h e i m e r s a n d s t o n e
Na co
ntent
x 103
(mol/
m3)
Na co
ntent
(mmo
l)
Fig. 5.17: a) Profiles of the dissolved Na in the GPB system for several moments of the dryingprocess. The gypsum and plaster were initially saturated with pure water and theBentheimer sandstone was saturated with an NaCl solution ( c = 4 mol l−1 ). Thedrying conditions are the same as in figure 5.11. b) Amount of dissolved sodium vs.drying time in the gypsum layer, the plaster layer, and the Bentheimer sandstonesubstrate.
In figure 5.17a the Na profiles are presented for several moments of the drying process.The time dependence of the amounts of dissolved Na in the gypsum and plaster layer andin the substrate is plotted in figure 5.17b. Initially, all salt is present in the Bentheimersandstone substrate. During the first drying stage (t < 8 h) the amount of salt in theBentheimer sandstone substrate decreases by about 60 %, while it increases in the plasterlayer. Obviously salt is transported from the Bentheimer sandstone to the plaster layer.This is confirmed by the high value of the Peclet number calculated for the Bentheimersandstone (Pe ' 18), which indicates that advection dominates during this drying stage.Since the gypsum layer is already dry, further transport of salt to the drying surface

5.5. Conclusions 67
is disabled. Therefore, we expect that salt mainly accumulates in the plaster layer, asrequired for an accumulating system. During the second drying stage (t > 8 h), the Pecletnumber calculated for the Bentheimer sandstone is about 0.2, indicating that diffusiondominates the ion transport and salt accumulates in the Bentheimer sandstone as well.
After the end of the drying process the sample was cut in 9 slices and the Na andCl contents of these slices were measured quantitatively by ion chromatography. Theamount of Na for each slice divided by the Na content of the whole sample is plotted infigure 5.14. The measured Cl distribution, which is not shown in the figure, again matchesthe Na distribution, which indicates that both ions are transported together. The saltis accumulated mainly in the plaster layer. Also inside the gypsum layer some salt hascrystallized. One should note that the salt that is present in the first slice (0 − 7.2 mm)reflects the total amount in the gypsum layer. Since the NMR results indicate that thesurface of the gypsum layer has dried very fast, we expect that the salt in the gypsum ismainly present near the gypsum/plaster interface and that the salt content decreases nearthe external surface. This is confirmed by visual inspection of the external surface, whereno salt was observed. From these results we conclude that in case of a non-uniformly saltloaded GPB system a salt accumulating system is achieved.
5.5 Conclusions
From our experiments on three-layer systems it was found that only in case of a nonsalt loaded plaster and gypsum layer and a salt loaded Bentheimer sandstone substratea salt accumulating system is formed. Our results indicate that it may be difficult tomake an accumulating system that is based only on differences between the pore sizesof the individual layers. In practice it may be difficult to prepare plasters with exactlyspecified pore-size distributions. Apart from this, the selection of appropriate materialsis complicated by the fact that the wetting properties of a salt solution differ from thoseof pure water, and, consequently, the drying behavior changes significantly. Even if thepore-size distributions suggest that a particular system will be salt accumulating, actualmeasurements of the drying behavior and the ion transport in a salt loaded system arenecessary to verify this point.

68 5. Moisture and salt transport in three-layer plaster/substrate systems
6. Diffusion in porous building materials with highinternal magnetic field gradients
Measuring the water diffusivity in porous building materials with NMR is hindered by thepresence of large internal magnetic field gradients originating from magnetic impurities(Fe). To investigate the diffusion of water in these materials, a stimulated echo NMRtechnique is applied. A new analytical equation for the long-time signal decay in the pres-ence of spatially varying internal field gradients is derived. This equation is experimen-tally confirmed by measurements on representative materials with large internal gradients(fired-clay brick and sintered crushed glass) and a material with very small internal gradi-ents (glass filter). The diffusivity is determined in the long time limit, where it is constantand limited by the tortuosity of the pore structure. Tortuosities of different samples de-rived from the NMR data show an excellent agreement with the macroscopic tortuositiesmeasured by electrochemical impedance spectroscopy. The developed technique can alsobe applied in unsaturated media, during e.g., drying, water absorption, and concentrationchanges. The characteristic length scales of the internal field fluctuations estimated fromthe model are compared with the structural length scales, whereas the magnitude of thesefluctuations is compared with results of macroscopic magnetization measurements.1
6.1 Introduction
In porous building materials, moisture and (dissolved) ions can give rise to several kinds ofdamage, e.g., frost damage, salt crystallization, corrosion of the reinforcement and mouldgrowth. Moisture and salt are naturally present in the materials, and their quantity isincreased by atmospheric influence (rain), neighborhood of salt water, etc. Knowledge ofthe transport properties of moisture and salt is necessary to obtain information about thedurability of building materials. In this paper we will study the diffusivity of the fluidin some representative building materials and relate it to structural parameters like thetortuosity [Bea90].
NMR is a nondestructive technique that can be used for measuring the effective diffu-sivities of water, hydrocarbons and ion species in porous materials [Kim97, Hol01, Vog02].The diffusivities obtained from these measurements are found to depend on the measure-ment time. With increasing times diffusing molecules start to feel the pore walls and thediffusion become restricted. From the measured time dependence of the diffusivity it ispossible to obtain important structural information on the material [Vog02, Lat93]. From
1 This chapter has been published in [Pet04]
69
70 6. Diffusion in porous building materials with high internal magnetic field gradients
the results for short times, it is possible to obtain the surface-to-volume ratio and porediameter, whereas for long times (order of seconds) the diffusivity is constant and limitedby the tortuosity of the pore structure. Therefore NMR offers the possibility to determinethe tortuosity of the pore system [Lat95]. An alternative method to determine the tor-tuosity is electrochemical impedance spectroscopy, which is based on the measurement ofthe conductivity of ions dissolved in the pore fluid [Kle99]. NMR is preferred when chem-ical reactions or adsorption of ions at the pore walls occur, when the pore fluid alreadycontains ions (cement and concrete) [Sny02] and during monitoring of time-dependentprocesses, like drying or absorption. Especially in the unsaturated state of a material,the diffusivity of the dissolved ions, which is measured electrochemically, can no longerbe related to the diffusivity, since the latter may contain an important contribution fromtransport by vapor diffusion.
Generally, NMR diffusion measurements are performed using Pulsed Field Gradient(PFG) techniques [Ste65]. By analyzing the NMR signal decay induced by PFG’s, ac-curate results can be obtained when the internal field gradients are small. However, inmany building materials a large amount of magnetic impurities (Mn, Fe, Co) can bepresent, which may give rise to internal gradients that are at least an order of magnitudelarger than the gradients that can be applied externally [Val00, Val01b]. These gradientsare often several orders of magnitude larger than the gradients induced by susceptibilitydifferences between, e.g., water and a clean (diamagnetic) porous material. In fired-claybrick, for instance, the internal field gradients induced by the presence of about 4 % Fecause such a rapid dephasing of the transverse nuclear magnetization, that even down toecho spacings of 100 µs, CPMG measurements show very pronounced diffusion effects.Using Hahn spin-echo pulse sequences with varying echo time, we observed a decay ofthe spin-echo signal in this material by more than a factor of 100 within 10 ms. Withinexperimental inaccuracy, this decay was independent of the magnitude and direction ofthe applied field gradient (0.2 – 1 T/m).
Since our aim is to determine the diffusivity at times of the order of seconds, we haveto use a pulse sequence in which the part of the nuclear magnetization that generates therelevant NMR signal is in the longitudinal direction during most of the measurement time,such as the stimulated-echo sequence [Tan70]. This sequence has proven to be appropriatefor diffusivity measurements in heterogeneous systems, but often very specialized pulsesequences like the ‘13-interval’ sequence [Cot89] have to be used, to suppress the effect ofthe cross terms between the internal and applied gradients [Vog02, Lat93, Lat95, For94],even if these gradients are small compared to the applied PFG’s. It has been shownthat at long observation times this approach may fail, since it is based on the assump-tion that the diffusing molecules experience a constant internal field gradient during theexperiment [Sel00]. In principle, the genuine diffusivities in heterogeneous media canbe obtained by extrapolation of the data obtained from simple PFG stimulated-echomeasurements [Vas01]. This technique, however, has only been applied to systems withsingle-exponential signal decays, and may therefore not be suitable for our materials,which show pronounced multi-exponential decays [Val01b].
In principle, the cross terms between the internal magnetic field fluctuations and theapplied field gradients may be suppressed by using RF field gradients instead of B0 gradi-
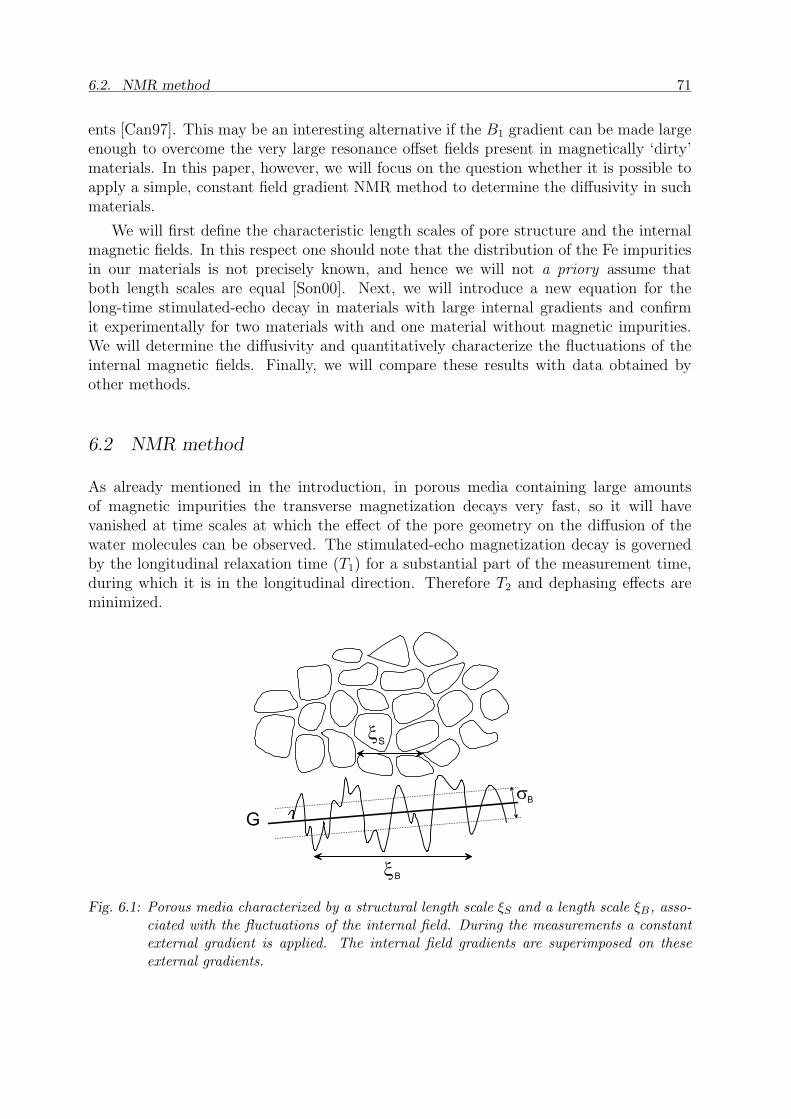
6.2. NMR method 71
ents [Can97]. This may be an interesting alternative if the B1 gradient can be made largeenough to overcome the very large resonance offset fields present in magnetically ‘dirty’materials. In this paper, however, we will focus on the question whether it is possible toapply a simple, constant field gradient NMR method to determine the diffusivity in suchmaterials.
We will first define the characteristic length scales of pore structure and the internalmagnetic fields. In this respect one should note that the distribution of the Fe impuritiesin our materials is not precisely known, and hence we will not a priory assume thatboth length scales are equal [Son00]. Next, we will introduce a new equation for thelong-time stimulated-echo decay in materials with large internal gradients and confirmit experimentally for two materials with and one material without magnetic impurities.We will determine the diffusivity and quantitatively characterize the fluctuations of theinternal magnetic fields. Finally, we will compare these results with data obtained byother methods.
6.2 NMR method
As already mentioned in the introduction, in porous media containing large amountsof magnetic impurities the transverse magnetization decays very fast, so it will havevanished at time scales at which the effect of the pore geometry on the diffusion of thewater molecules can be observed. The stimulated-echo magnetization decay is governedby the longitudinal relaxation time (T1) for a substantial part of the measurement time,during which it is in the longitudinal direction. Therefore T2 and dephasing effects areminimized.
x S
Gs B
x B
Fig. 6.1: Porous media characterized by a structural length scale ξS and a length scale ξB, asso-ciated with the fluctuations of the internal field. During the measurements a constantexternal gradient is applied. The internal field gradients are superimposed on theseexternal gradients.
72 6. Diffusion in porous building materials with high internal magnetic field gradients
In figure 6.1 we have schematically plotted the pore structure of the material and themagnetic field fluctuations, together with their characteristic length scales. At long timescales molecules diffuse over distances longer than the correlation length of the mediumξS. The typical time scale related to ξS is tS ≡ ξ 2
S/6D, where D is the diffusivity of thewater molecules within the pore system. At length scales much larger than ξS the porousmedium can be considered as homogeneous; the diffusivity D is constant and determinedby the geometry of the pore system. This is often called the tortuosity limit [Kle99]. Thetortuosity of a medium is defined by the following relation.
α = D0/D, (6.1)
where D0 is the bulk (self) diffusion constant of the pore fluid.
The stimulated echo pulse sequence [Tan70] is plotted schematically in figure 6.2. Thesignal attenuation for free diffusion is well known and can be described analytically. Whenthe stimulated echo intensity Mst is divided by primary echo intensity Mpr, the followingequation is obtained:
ln(Mst/Mpr) = −[1/T1 + (γG)2Dτ 2] t. (6.2)
In this equation T1 is longitudinal relaxation time, γ is the gyromagnetic ratio (for a 1Hnucleus γ = 2.67×10⁸ rad s−1T−1), G is the applied external gradient, τ the time betweenthe first two 90◦ pulses and t is stimulated-echo time. By dividing the two echo intensitiesthe T2 relaxation term is eliminated automatically.
t
9 0 oR F
t
9 0 o 9 0 op r i m a r ye c h o
s t i m u l a t e de c h oR F R F
1t
2
t3
Fig. 6.2: Stimulated echo pulse sequence with a constant field gradient. The magnetization decayis measured by changing the time between the second and third RF pulse (period 2).Measurements are performed for different values of τ and the applied field gradient G.
Equation (6.2) holds for diffusion in bulk liquids and for diffusion in a macroscopi-cally isotropic porous medium on length scales larger than ξS, where the medium can beconsidered as homogenous (the tortuosity limit). When internal gradients are present,the initial signal decay is generally very fast, and cannot be described by equation 6.2.The internal fields can be characterized by a characteristic length scale ξB (Fig. 6.1). The
6.2. NMR method 73
typical time scale related to ξB is tB ≡ ξ 2B/6D. At time scales shorter than tB, the internal
fields experienced by a spin during the periods 1 and 3 of the stimulated-echo sequence(Fig. 6.2), when the magnetization is in transverse plane, are still correlated. For timescales much larger than tB these internal fields become uncorrelated [Nes02] and the spinsexperience a purely random internal field.
For these time scales (t À tB) the magnetization decay can be described by theequation
ln [M(t)/M0] = −γ2τ 2⟨(
Bτ
)2⟩− (
T −11 + γ2G2τ 2D
)t. (6.3)
In this equation 〈(Bτ )2〉 is the ensemble average of Bτ , which is the temporal average of
the internal field experienced by a spin during an interval τ (periods 1 and 3, Fig. 6.2).For very small τ , 〈(Bτ )
2〉 becomes equal σ 2B, the squared standard deviation of the internal
field B. For details of the derivation we refer to the appendix. In this derivation it wasassumed that τ ¿ T2, the transverse relaxation time.
Equation 6.3 shows that the magnetization decay at long time scales can be describedby a single exponent. This equation consists of three parts. The first term gives the totalsignal attenuation due to diffusion in the internal gradients. The second term is the con-tribution of the longitudinal relaxation. The third term describes the signal attenuationdue to diffusion in the externally applied gradient. The important feature of the firstterm is that it does not depend on t, because the internal fields have become uncorrelated(spatially random) on the length scales much larger than ξB. With increasing echo timest, the second and third term of equation 6.3 become more important. At these times,decay due to diffusion is governed only by externally applied gradients and as such canbe quantified.
From the right hand side of Eq. (6.3) we are able to define a crossover time t∗
t∗ ≡γ2τ 2
⟨(Bτ
)2⟩
1/T1 + (γG)2Dτ 2. (6.4)
At time scales shorter than t∗ the internal fields dominate the signal decay. At longertime scales (t > t∗) the longitudinal relaxation and dephasing due to the applied gradientsstart to play significant role. Therefore, the diffusivity D can only be measured when thesignal is still above the noise level for t > t∗.
In a stimulated-echo experiment, the signal intensities of both the primary and thestimulated echo can be measured. In equation 6.2 the ratio of these two intensities is di-rectly related to, amongst others, the diffusion coefficient D. On the other hand, equation6.3 contains the ratio M(t)/M0. In our experiments, this ratio is not necessarily equal toMst/Mpr. The reasons for this are twofold. First, a significant dephasing of the transversecomponents of the magnetization forming the primary echo may occur during the timeinterval between the first and second 90◦ pulse, which is not completely refocused at thetime of the primary echo, due to the diffusive motion of the spins in the large local fieldinhomogeneities. Second, even if complete refocusing would occur, Mst/Mpr would onlybe equal to M(t)/M0 for perfect 90◦ pulses. Since our samples are often much larger thanthickness of the slices selected by our RF pulses (see section 6.3), this condition is gener-ally not satisfied in our experiments. However, we measure the decay of the stimulated
74 6. Diffusion in porous building materials with high internal magnetic field gradients
echo for a constant value of τ , and hence for a constant intensity of the primary echo.Since, on the other hand, only one coherent pathway contributes to the stimulated echo,the only effect of using Mst/Mpr instead of M(t)/M0 in equation 6.3 is the introduction ofa constant scaling factor. This was checked experimentally by comparing stimulated-echodecay curves of our samples measured with RF flip angles optimized to 90◦ with decaycurves measured with RF flip angles set to about 64◦ (reducing the RF power by 3 dB).The two sets of decay curves were found to coincide within experimental accuracy when aconstant scaling factor was applied. These observations were corroborated by numericalsimulations of the time evolution of the magnetization of a system of up to 106 spins. Inthese simulations the Bloch equations were solved in the presence of both longitudinaland transverse relaxation, pulsed RF fields, as well as diffusion in a uniform magneticfield gradient.
Before detailed measurements on a sample were started, both the primary and stim-ulated echoes was measured for a set of echo times below 10 ms. The RF power wasadjusted such that the observed echo-time dependence of Mst/Mpr extrapolated to 1 forecho times going to zero. This adjustment was performed for each value of τ . Althoughthis procedure is not required for the analysis of the echo decay, it has the advantage thatno scaling factors have to be applied afterwards. An experimental advantage of usingMst/Mpr instead of Mst alone is that variations in the sensitivity of the receiver chainduring these very time-consuming measurements are automatically compensated.
6.3 Experimental setup and materials
A home-built nuclear magnetic resonance apparatus was used. The operating frequencywas 30.9 MHz (B0 = 0.7 T). A constant magnetic field gradient was generated with aset of Anderson coils. The maximum gradient strength used in the experiments was 425mT/m. A detailed description of the apparatus is given elsewhere [Kop94].
The ratio of the amplitudes of the stimulated echo and the primary echo was measuredas a function of the echo time, by changing the time interval between the second and thirdRF pulse (cf. Fig. 6.2) from 1 ms to 3 s. The complete set of data was obtained by varyingthe interpulse time τ and the applied external gradient G. The time τ was varied between70 and 500 µs, and the magnitude of G between 94 mT/m and 425 mT/m. The width ofthe RF pulses was 12 µs.
NMR diffusivity measurements were performed on porous samples of glass filter (Du-ran, borosilicate glass), fired-clay brick, and sintered crushed glass. The porosity of fired-clay brick is 23 %. The pore sizes have been measured previously [Pel95] and are in therange of 1− 10 µm. The porosity of sintered crushed glass is 53 % and the pore size mea-sured by mercury intrusion amounts to 14± 3 µm. Glass filter is made from borosilicateglass. According to the supplier the pore sizes are in the range 10−16 µm. The measuredporosity is 33 %. Glass filter is used as a standard, magnetically ‘clean’, material withpore sizes comparable to that of fired-clay brick and sintered crushed glass.
The samples have a cylindrical shape with a diameter of 2 cm and a length of 5 cmin the case of fired-clay brick and sintered crushed glass. The length of the glass filtersample was 6 mm. The samples were vacuum saturated with deionized water.
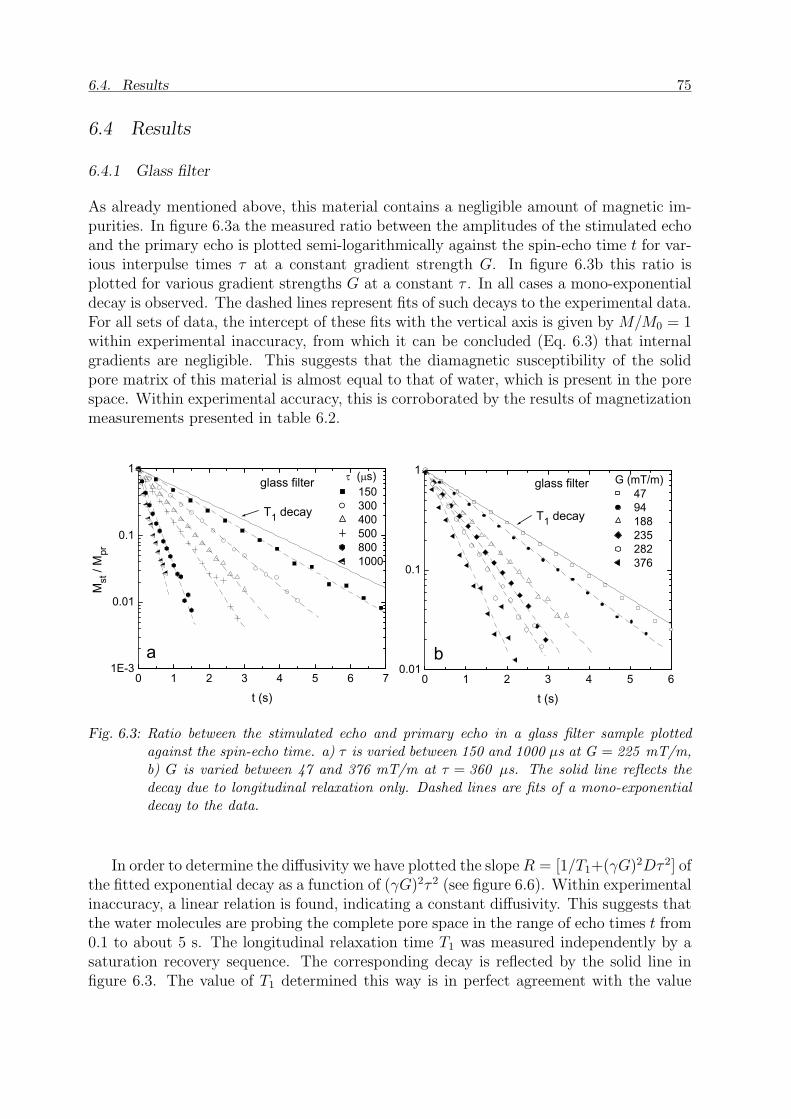
6.4. Results 75
6.4 Results
6.4.1 Glass filter
As already mentioned above, this material contains a negligible amount of magnetic im-purities. In figure 6.3a the measured ratio between the amplitudes of the stimulated echoand the primary echo is plotted semi-logarithmically against the spin-echo time t for var-ious interpulse times τ at a constant gradient strength G. In figure 6.3b this ratio isplotted for various gradient strengths G at a constant τ . In all cases a mono-exponentialdecay is observed. The dashed lines represent fits of such decays to the experimental data.For all sets of data, the intercept of these fits with the vertical axis is given by M/M0 = 1within experimental inaccuracy, from which it can be concluded (Eq. 6.3) that internalgradients are negligible. This suggests that the diamagnetic susceptibility of the solidpore matrix of this material is almost equal to that of water, which is present in the porespace. Within experimental accuracy, this is corroborated by the results of magnetizationmeasurements presented in table 6.2.
0 1 2 3 4 5 6 71 E - 3
0 . 0 1
0 . 1
1
0 1 2 3 4 5 60 . 0 1
0 . 1
1
b
G ( m T / m ) 4 7 9 4 1 8 8 2 3 5 2 8 2 3 7 6
g l a s s f i l t e r
T 1 d e c a y
t ( s )
a
t ( m s ) 1 5 0 3 0 0 4 0 0 5 0 0 8 0 0 1 0 0 0
T 1 d e c a y
g l a s s f i l t e r
M st /
M pr
t ( s )
Fig. 6.3: Ratio between the stimulated echo and primary echo in a glass filter sample plottedagainst the spin-echo time. a) τ is varied between 150 and 1000 µs at G = 225 mT/m,b) G is varied between 47 and 376 mT/m at τ = 360 µs. The solid line reflects thedecay due to longitudinal relaxation only. Dashed lines are fits of a mono-exponentialdecay to the data.
In order to determine the diffusivity we have plotted the slope R = [1/T1+(γG)2Dτ 2] ofthe fitted exponential decay as a function of (γG)2τ 2 (see figure 6.6). Within experimentalinaccuracy, a linear relation is found, indicating a constant diffusivity. This suggests thatthe water molecules are probing the complete pore space in the range of echo times t from0.1 to about 5 s. The longitudinal relaxation time T1 was measured independently by asaturation recovery sequence. The corresponding decay is reflected by the solid line infigure 6.3. The value of T1 determined this way is in perfect agreement with the value
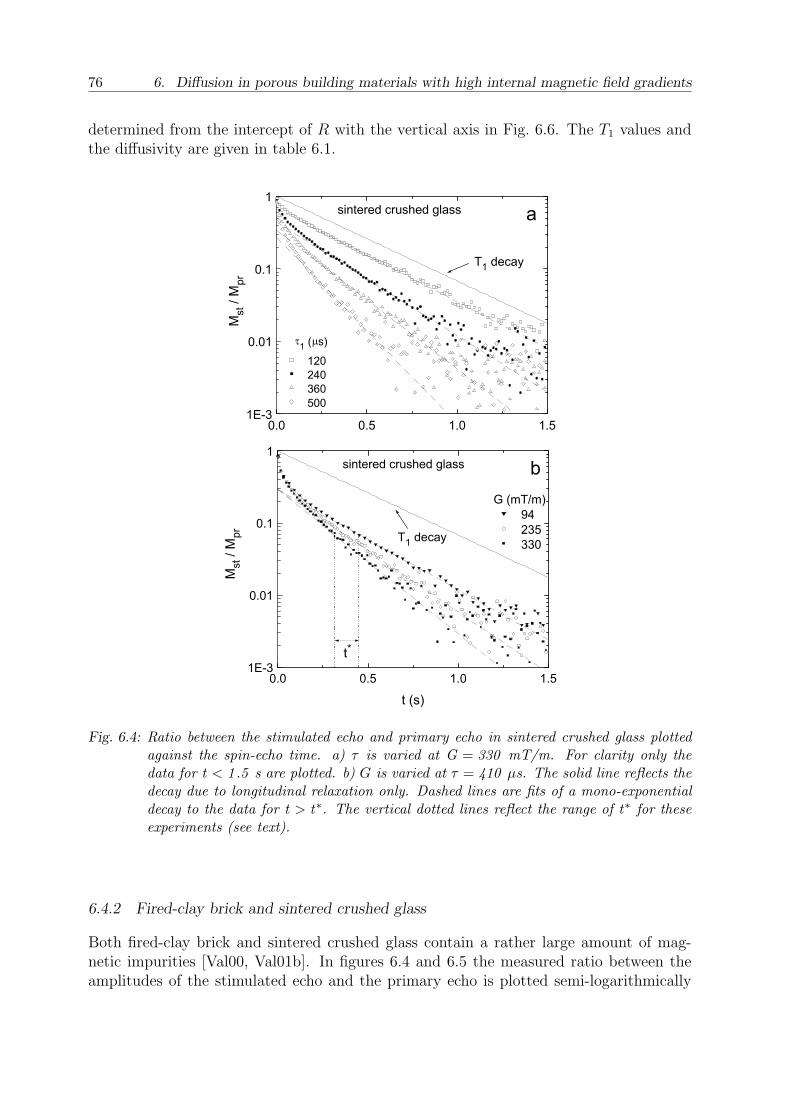
76 6. Diffusion in porous building materials with high internal magnetic field gradients
determined from the intercept of R with the vertical axis in Fig. 6.6. The T1 values andthe diffusivity are given in table 6.1.
0 . 0 0 . 5 1 . 0 1 . 51 E - 3
0 . 0 1
0 . 1
1
a
t 1 ( m s ) 1 2 0 2 4 0 3 6 0 5 0 0
s i n t e r e d c r u s h e d g l a s s
T 1 d e c a y
M st /
M pr
0 . 0 0 . 5 1 . 0 1 . 51 E - 3
0 . 0 1
0 . 1
1b
t *
s i n t e r e d c r u s h e d g l a s s
T 1 d e c a y
G ( m T / m ) 9 4 2 3 5 3 3 0
t ( s )
M s
t / M p
r
Fig. 6.4: Ratio between the stimulated echo and primary echo in sintered crushed glass plottedagainst the spin-echo time. a) τ is varied at G = 330 mT/m. For clarity only thedata for t < 1 .5 s are plotted. b) G is varied at τ = 410 µs. The solid line reflects thedecay due to longitudinal relaxation only. Dashed lines are fits of a mono-exponentialdecay to the data for t > t∗. The vertical dotted lines reflect the range of t∗ for theseexperiments (see text).
6.4.2 Fired-clay brick and sintered crushed glass
Both fired-clay brick and sintered crushed glass contain a rather large amount of mag-netic impurities [Val00, Val01b]. In figures 6.4 and 6.5 the measured ratio between theamplitudes of the stimulated echo and the primary echo is plotted semi-logarithmically
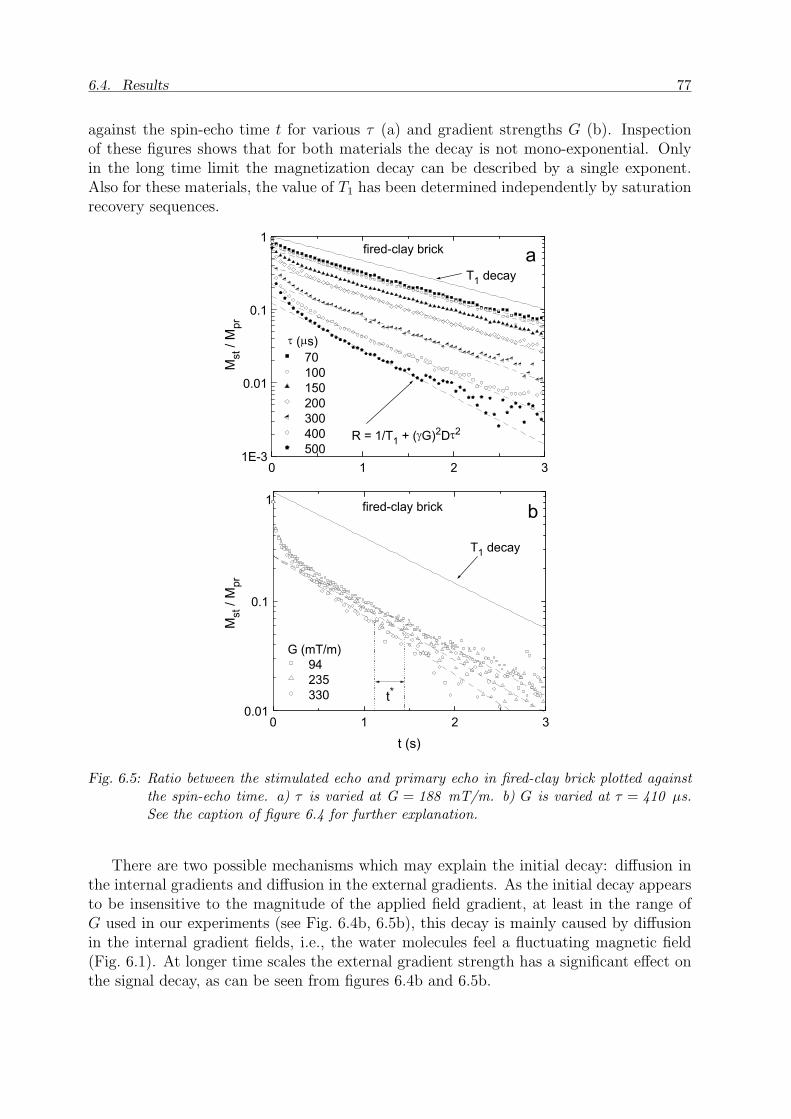
6.4. Results 77
against the spin-echo time t for various τ (a) and gradient strengths G (b). Inspectionof these figures shows that for both materials the decay is not mono-exponential. Onlyin the long time limit the magnetization decay can be described by a single exponent.Also for these materials, the value of T1 has been determined independently by saturationrecovery sequences.
0 1 2 31 E - 3
0 . 0 1
0 . 1
1
af i r e d - c l a y b r i c kT 1 d e c a y
t ( m s )
R = 1 / T 1 + ( g G ) 2 D t 2
7 0 1 0 0 1 5 0 2 0 0 3 0 0 4 0 0 5 0 0
M st /
M pr
0 1 2 30 . 0 1
0 . 1
1 b
t *
G ( m T / m ) 9 4 2 3 5 3 3 0
T 1 d e c a y
f i r e d - c l a y b r i c k
t ( s )
M s
t / M p
r
Fig. 6.5: Ratio between the stimulated echo and primary echo in fired-clay brick plotted againstthe spin-echo time. a) τ is varied at G = 188 mT/m. b) G is varied at τ = 410 µs.See the caption of figure 6.4 for further explanation.
There are two possible mechanisms which may explain the initial decay: diffusion inthe internal gradients and diffusion in the external gradients. As the initial decay appearsto be insensitive to the magnitude of the applied field gradient, at least in the range ofG used in our experiments (see Fig. 6.4b, 6.5b), this decay is mainly caused by diffusionin the internal gradient fields, i.e., the water molecules feel a fluctuating magnetic field(Fig. 6.1). At longer time scales the external gradient strength has a significant effect onthe signal decay, as can be seen from figures 6.4b and 6.5b.
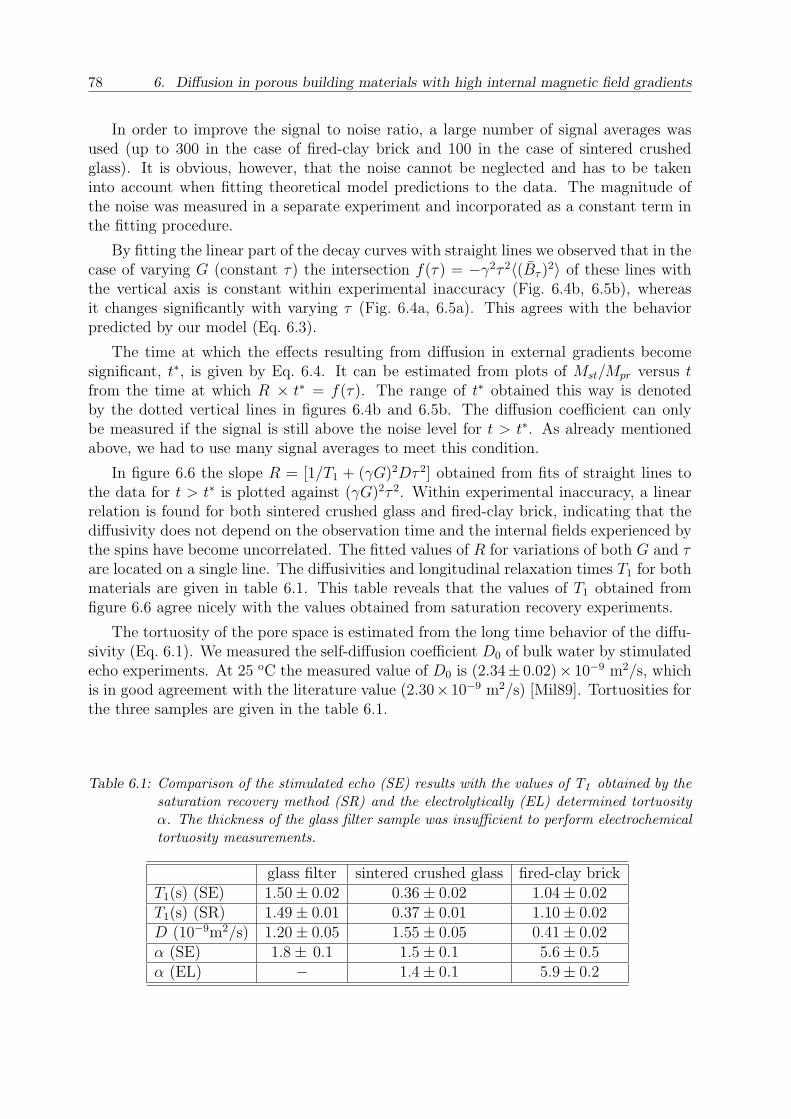
78 6. Diffusion in porous building materials with high internal magnetic field gradients
In order to improve the signal to noise ratio, a large number of signal averages wasused (up to 300 in the case of fired-clay brick and 100 in the case of sintered crushedglass). It is obvious, however, that the noise cannot be neglected and has to be takeninto account when fitting theoretical model predictions to the data. The magnitude ofthe noise was measured in a separate experiment and incorporated as a constant term inthe fitting procedure.
By fitting the linear part of the decay curves with straight lines we observed that in thecase of varying G (constant τ) the intersection f(τ) = −γ2τ 2〈(Bτ )
2〉 of these lines withthe vertical axis is constant within experimental inaccuracy (Fig. 6.4b, 6.5b), whereasit changes significantly with varying τ (Fig. 6.4a, 6.5a). This agrees with the behaviorpredicted by our model (Eq. 6.3).
The time at which the effects resulting from diffusion in external gradients becomesignificant, t∗, is given by Eq. 6.4. It can be estimated from plots of Mst/Mpr versus tfrom the time at which R × t∗ = f(τ). The range of t∗ obtained this way is denotedby the dotted vertical lines in figures 6.4b and 6.5b. The diffusion coefficient can onlybe measured if the signal is still above the noise level for t > t∗. As already mentionedabove, we had to use many signal averages to meet this condition.
In figure 6.6 the slope R = [1/T1 + (γG)2Dτ 2] obtained from fits of straight lines tothe data for t > t∗ is plotted against (γG)2τ 2. Within experimental inaccuracy, a linearrelation is found for both sintered crushed glass and fired-clay brick, indicating that thediffusivity does not depend on the observation time and the internal fields experienced bythe spins have become uncorrelated. The fitted values of R for variations of both G and τare located on a single line. The diffusivities and longitudinal relaxation times T1 for bothmaterials are given in table 6.1. This table reveals that the values of T1 obtained fromfigure 6.6 agree nicely with the values obtained from saturation recovery experiments.
The tortuosity of the pore space is estimated from the long time behavior of the diffu-sivity (Eq. 6.1). We measured the self-diffusion coefficient D0 of bulk water by stimulatedecho experiments. At 25 oC the measured value of D0 is (2.34± 0.02)× 10−9 m2/s, whichis in good agreement with the literature value (2.30×10⁻⁹ m2/s) [Mil89]. Tortuosities forthe three samples are given in the table 6.1.
Table 6.1: Comparison of the stimulated echo (SE) results with the values of T1 obtained by thesaturation recovery method (SR) and the electrolytically (EL) determined tortuosityα. The thickness of the glass filter sample was insufficient to perform electrochemicaltortuosity measurements.
glass filter sintered crushed glass fired-clay brickT1(s) (SE) 1.50± 0.02 0.36± 0.02 1.04± 0.02T1(s) (SR) 1.49± 0.01 0.37± 0.01 1.10± 0.02D (10−9m2/s) 1.20± 0.05 1.55± 0.05 0.41± 0.02α (SE) 1.8± 0.1 1.5± 0.1 5.6± 0.5α (EL) − 1.4± 0.1 5.9± 0.2
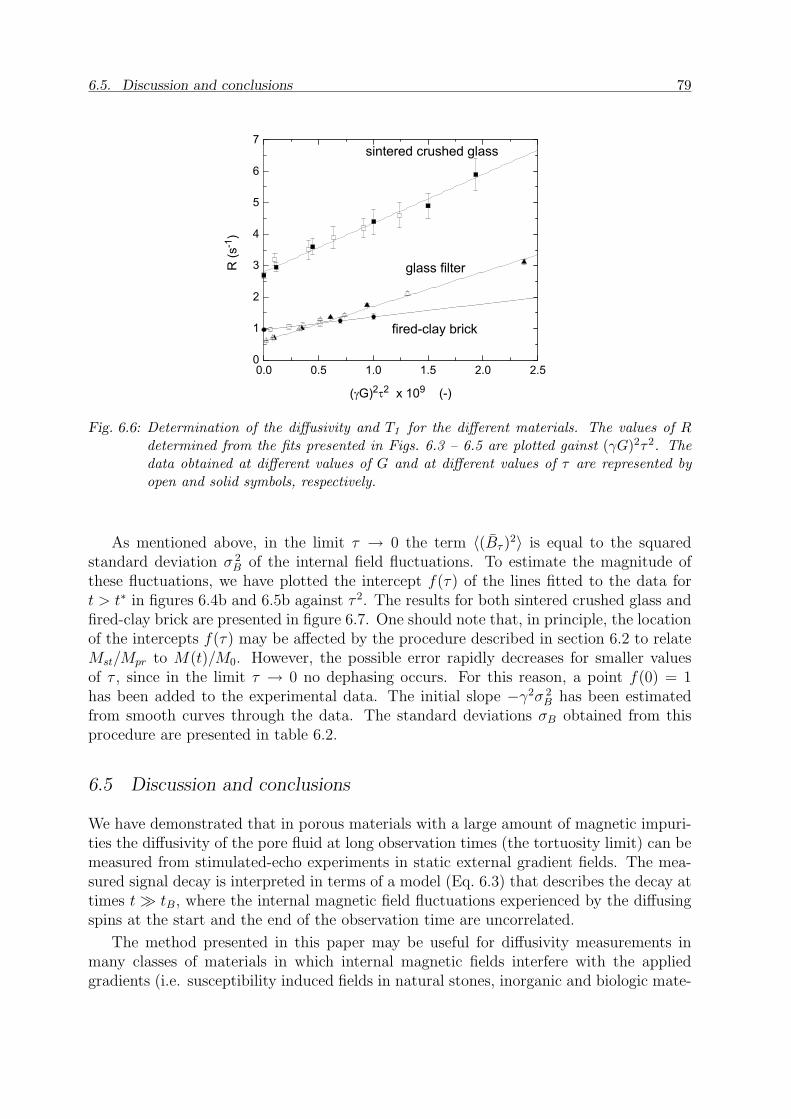
6.5. Discussion and conclusions 79
0 . 0 0 . 5 1 . 0 1 . 5 2 . 0 2 . 50
1
2
3
4
5
6
7
g l a s s f i l t e r
f i r e d - c l a y b r i c k
s i n t e r e d c r u s h e d g l a s s
R (s-
1 )
( g G ) 2 t 2 x 1 0 9 ( - )
Fig. 6.6: Determination of the diffusivity and T1 for the different materials. The values of Rdetermined from the fits presented in Figs. 6.3 – 6.5 are plotted gainst (γG)2τ2. Thedata obtained at different values of G and at different values of τ are represented byopen and solid symbols, respectively.
As mentioned above, in the limit τ → 0 the term 〈(Bτ )2〉 is equal to the squared
standard deviation σ 2B of the internal field fluctuations. To estimate the magnitude of
these fluctuations, we have plotted the intercept f(τ) of the lines fitted to the data fort > t∗ in figures 6.4b and 6.5b against τ 2. The results for both sintered crushed glass andfired-clay brick are presented in figure 6.7. One should note that, in principle, the locationof the intercepts f(τ) may be affected by the procedure described in section 6.2 to relateMst/Mpr to M(t)/M0. However, the possible error rapidly decreases for smaller valuesof τ , since in the limit τ → 0 no dephasing occurs. For this reason, a point f(0) = 1has been added to the experimental data. The initial slope −γ2σ 2
B has been estimatedfrom smooth curves through the data. The standard deviations σB obtained from thisprocedure are presented in table 6.2.
6.5 Discussion and conclusions
We have demonstrated that in porous materials with a large amount of magnetic impuri-ties the diffusivity of the pore fluid at long observation times (the tortuosity limit) can bemeasured from stimulated-echo experiments in static external gradient fields. The mea-sured signal decay is interpreted in terms of a model (Eq. 6.3) that describes the decay attimes t À tB, where the internal magnetic field fluctuations experienced by the diffusingspins at the start and the end of the observation time are uncorrelated.
The method presented in this paper may be useful for diffusivity measurements inmany classes of materials in which internal magnetic fields interfere with the appliedgradients (i.e. susceptibility induced fields in natural stones, inorganic and biologic mate-
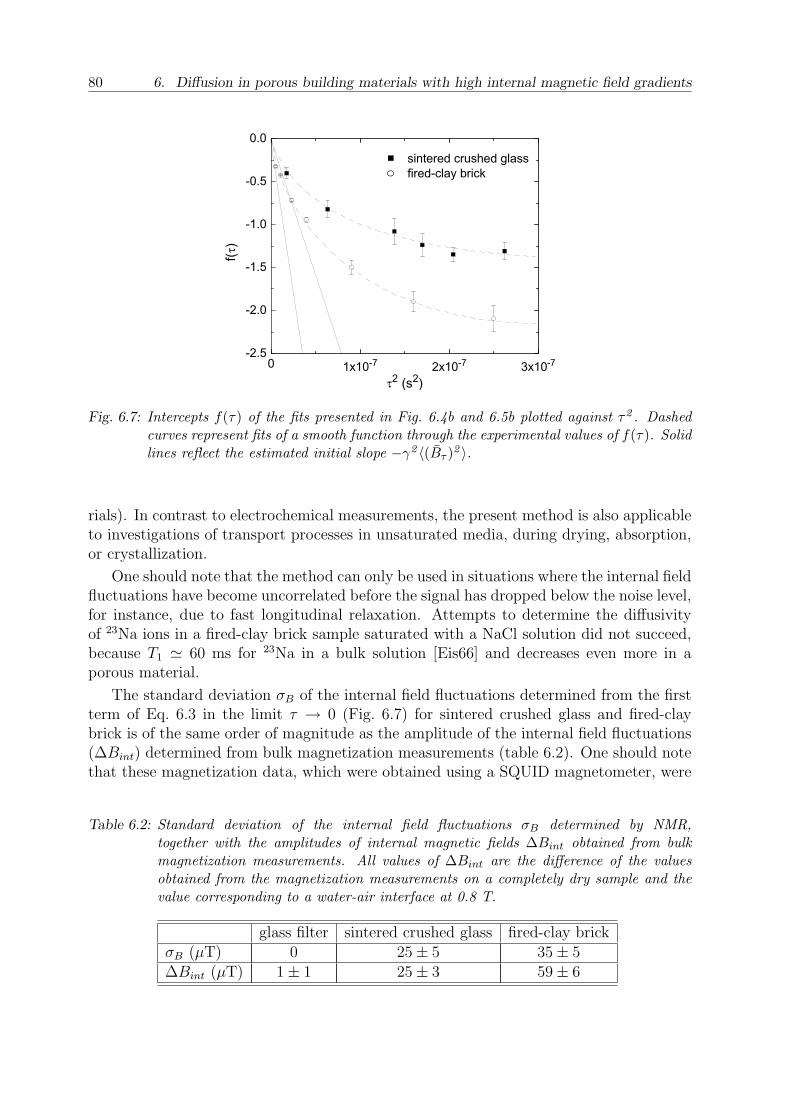
80 6. Diffusion in porous building materials with high internal magnetic field gradients
0 1 x 1 0 - 7 2 x 1 0 - 7 3 x 1 0 - 7- 2 . 5
- 2 . 0
- 1 . 5
- 1 . 0
- 0 . 5
0 . 0 s i n t e r e d c r u s h e d g l a s s f i r e d - c l a y b r i c k
f(t)
t 2 ( s 2 )
Fig. 6.7: Intercepts f(τ) of the fits presented in Fig. 6.4b and 6.5b plotted against τ2 . Dashedcurves represent fits of a smooth function through the experimental values of f(τ). Solidlines reflect the estimated initial slope −γ2 〈(Bτ )2 〉.
rials). In contrast to electrochemical measurements, the present method is also applicableto investigations of transport processes in unsaturated media, during drying, absorption,or crystallization.
One should note that the method can only be used in situations where the internal fieldfluctuations have become uncorrelated before the signal has dropped below the noise level,for instance, due to fast longitudinal relaxation. Attempts to determine the diffusivityof 23Na ions in a fired-clay brick sample saturated with a NaCl solution did not succeed,because T1 ' 60 ms for 23Na in a bulk solution [Eis66] and decreases even more in aporous material.
The standard deviation σB of the internal field fluctuations determined from the firstterm of Eq. 6.3 in the limit τ → 0 (Fig. 6.7) for sintered crushed glass and fired-claybrick is of the same order of magnitude as the amplitude of the internal field fluctuations(∆Bint) determined from bulk magnetization measurements (table 6.2). One should notethat these magnetization data, which were obtained using a SQUID magnetometer, were
Table 6.2: Standard deviation of the internal field fluctuations σB determined by NMR,together with the amplitudes of internal magnetic fields ∆Bint obtained from bulkmagnetization measurements. All values of ∆Bint are the difference of the valuesobtained from the magnetization measurements on a completely dry sample and thevalue corresponding to a water-air interface at 0.8 T.
glass filter sintered crushed glass fired-clay brickσB (µT) 0 25± 5 35± 5∆Bint (µT) 1± 1 25± 3 59± 6

6.5. Discussion and conclusions 81
analyzed assuming that the magnetic impurities are distributed homogeneously withinthe material. In that case the internal field fluctuations can be related directly to themaximum variation of the demagnetizing field at the pore to liquid interfaces [Val01b].Both magnetization and EPMA measurements [Val00], however, indicate that, especiallyin fired-clay brick, a fraction of these impurities is present in the form of small clusters,which act as localized magnetic dipoles. The internal fields in the direct vicinity ofthese dipoles may be much larger than the field variations arising from homogeneouslydistributed impurities, and hence the value of ∆Bint presented in table 6.2 should beconsidered as a lower limit. Because of the presence of these clusters, the length scale ofthe internal field fluctuations ξB may also differ from the typical pore dimension d.
0 . 0 0 . 2 0 . 4 0 . 60 . 0 0
0 . 0 5
0 . 1 0
0 . 1 5
0 . 2 0
0 . 0 0 . 2 0 . 4 0 . 6 0 . 81 E - 4
1 E - 3
0 . 0 1
0 . 1
1
l(t)
t ( s )
s i n t e r e d c r u s h e d g l a s s G = 1 8 8 m T / m t = 4 0 0 m s
l(t
)
t ( s )
Fig. 6.8: Echo-time dependence of λ(t), which represents the ratio between the stimulated echoand primary echo in sintered crushed glass minus the fitted long-time part of the signaldecay. The inset shows a semi-logarithmic plot of λ(t). The solid line in this insetreflects a fit of a mono-exponential decay to the data between 0.01 and 0.3 s.
To investigate this point in more detail we focus on the behavior of the decay curvesfor t < t∗. We subtract the part of the decay that is dominated by the applied gradients(Eq. 6.3) from the experimental data. As an example, the behavior of the remainingpart λ(t) for sintered crushed glass, G = 188 mT/m and τ = 400 µs is plotted in figure6.8. This figure shows that the part of the signal decay that can be attributed to theinternal field fluctuations has vanished at t ' 0.3 s. This value would correspond to somecharacteristic time constant between 0.05 and 0.1 s.
To analyze the decay process more precisely, we plotted λ(t) on a semi-logarithmicscale (inset of the figure). This plot suggests a mono-exponential decay, except for veryshort echo times. If we assume that, for constant G and τ , the decay Mst/Mpr can befactorized as g(t) exp(−t/T1), the observed decay rate 1/Td might be associated with a
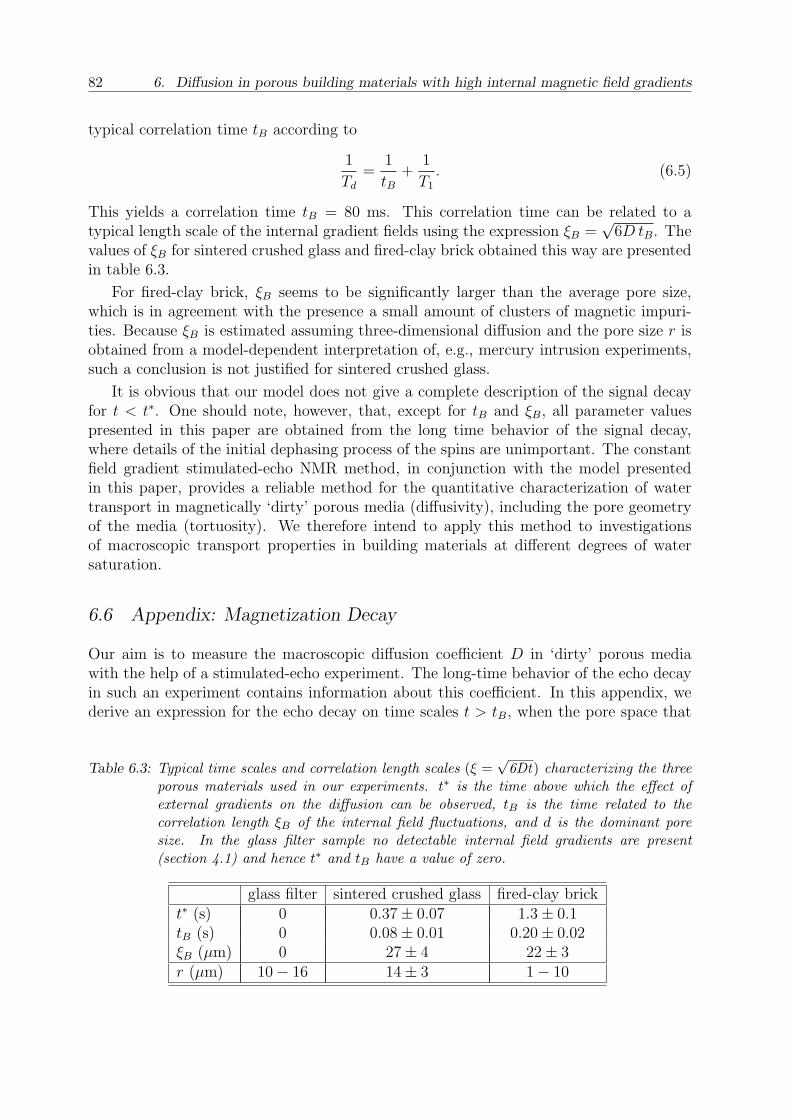
82 6. Diffusion in porous building materials with high internal magnetic field gradients
typical correlation time tB according to
1
Td
=1
tB+
1
T1
. (6.5)
This yields a correlation time tB = 80 ms. This correlation time can be related to atypical length scale of the internal gradient fields using the expression ξB =
√6D tB. The
values of ξB for sintered crushed glass and fired-clay brick obtained this way are presentedin table 6.3.
For fired-clay brick, ξB seems to be significantly larger than the average pore size,which is in agreement with the presence a small amount of clusters of magnetic impuri-ties. Because ξB is estimated assuming three-dimensional diffusion and the pore size r isobtained from a model-dependent interpretation of, e.g., mercury intrusion experiments,such a conclusion is not justified for sintered crushed glass.
It is obvious that our model does not give a complete description of the signal decayfor t < t∗. One should note, however, that, except for tB and ξB, all parameter valuespresented in this paper are obtained from the long time behavior of the signal decay,where details of the initial dephasing process of the spins are unimportant. The constantfield gradient stimulated-echo NMR method, in conjunction with the model presentedin this paper, provides a reliable method for the quantitative characterization of watertransport in magnetically ‘dirty’ porous media (diffusivity), including the pore geometryof the media (tortuosity). We therefore intend to apply this method to investigationsof macroscopic transport properties in building materials at different degrees of watersaturation.
6.6 Appendix: Magnetization Decay
Our aim is to measure the macroscopic diffusion coefficient D in ‘dirty’ porous mediawith the help of a stimulated-echo experiment. The long-time behavior of the echo decayin such an experiment contains information about this coefficient. In this appendix, wederive an expression for the echo decay on time scales t > tB, when the pore space that
Table 6.3: Typical time scales and correlation length scales (ξ =√
6Dt) characterizing the threeporous materials used in our experiments. t∗ is the time above which the effect ofexternal gradients on the diffusion can be observed, tB is the time related to thecorrelation length ξB of the internal field fluctuations, and d is the dominant poresize. In the glass filter sample no detectable internal field gradients are present(section 4.1) and hence t∗ and tB have a value of zero.
glass filter sintered crushed glass fired-clay brickt∗ (s) 0 0.37± 0.07 1.3± 0.1tB (s) 0 0.08± 0.01 0.20± 0.02ξB (µm) 0 27± 4 22± 3r (µm) 10− 16 14± 3 1− 10
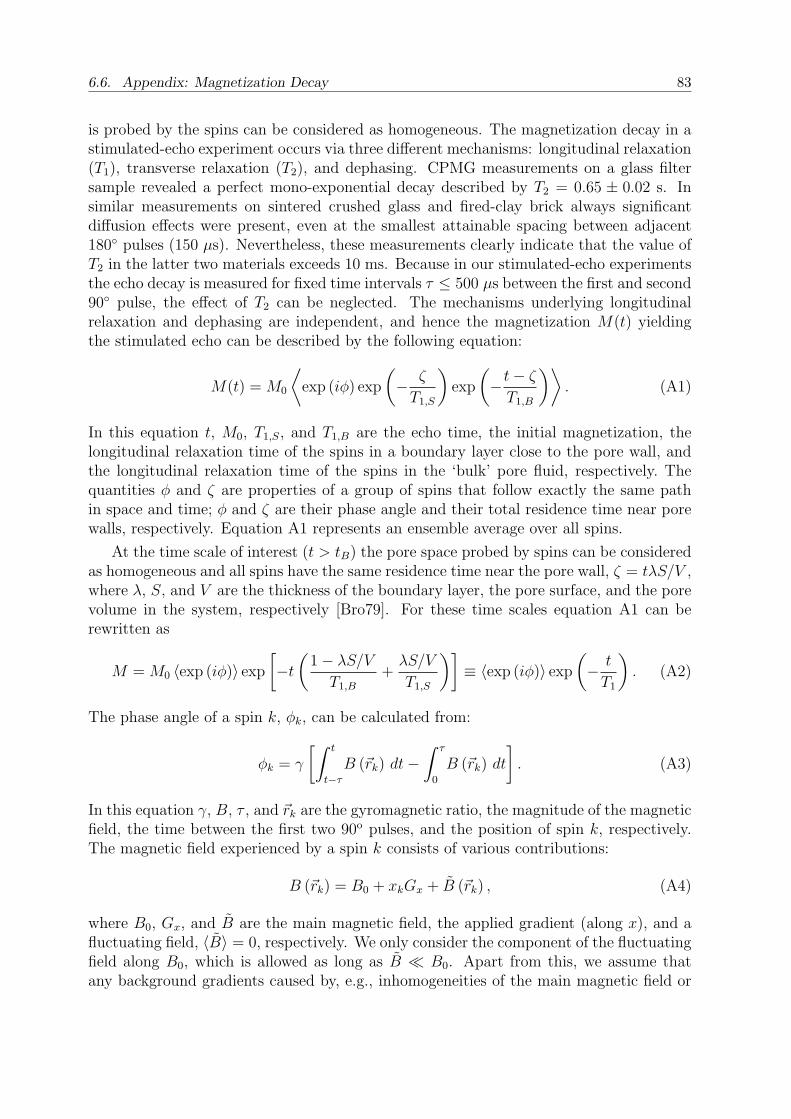
6.6. Appendix: Magnetization Decay 83
is probed by the spins can be considered as homogeneous. The magnetization decay in astimulated-echo experiment occurs via three different mechanisms: longitudinal relaxation(T1), transverse relaxation (T2), and dephasing. CPMG measurements on a glass filtersample revealed a perfect mono-exponential decay described by T2 = 0.65 ± 0.02 s. Insimilar measurements on sintered crushed glass and fired-clay brick always significantdiffusion effects were present, even at the smallest attainable spacing between adjacent180◦ pulses (150 µs). Nevertheless, these measurements clearly indicate that the value ofT2 in the latter two materials exceeds 10 ms. Because in our stimulated-echo experimentsthe echo decay is measured for fixed time intervals τ ≤ 500 µs between the first and second90◦ pulse, the effect of T2 can be neglected. The mechanisms underlying longitudinalrelaxation and dephasing are independent, and hence the magnetization M(t) yieldingthe stimulated echo can be described by the following equation:
M(t) = M0
⟨exp (iφ) exp
(− ζ
T1,S
)exp
(−t− ζ
T1,B
)⟩. (A1)
In this equation t, M0, T1,S, and T1,B are the echo time, the initial magnetization, thelongitudinal relaxation time of the spins in a boundary layer close to the pore wall, andthe longitudinal relaxation time of the spins in the ‘bulk’ pore fluid, respectively. Thequantities φ and ζ are properties of a group of spins that follow exactly the same pathin space and time; φ and ζ are their phase angle and their total residence time near porewalls, respectively. Equation A1 represents an ensemble average over all spins.
At the time scale of interest (t > tB) the pore space probed by spins can be consideredas homogeneous and all spins have the same residence time near the pore wall, ζ = tλS/V ,where λ, S, and V are the thickness of the boundary layer, the pore surface, and the porevolume in the system, respectively [Bro79]. For these time scales equation A1 can berewritten as
M = M0 〈exp (iφ)〉 exp
[−t
(1− λS/V
T1,B
+λS/V
T1,S
)]≡ 〈exp (iφ)〉 exp
(− t
T1
). (A2)
The phase angle of a spin k, φk, can be calculated from:
φk = γ
[∫ t
t−τ
B (~rk) dt−∫ τ
0
B (~rk) dt
]. (A3)
In this equation γ, B, τ , and ~rk are the gyromagnetic ratio, the magnitude of the magneticfield, the time between the first two 90o pulses, and the position of spin k, respectively.The magnetic field experienced by a spin k consists of various contributions:
B (~rk) = B0 + xkGx + B (~rk) , (A4)
where B0, Gx, and B are the main magnetic field, the applied gradient (along x), and afluctuating field, 〈B〉 = 0, respectively. We only consider the component of the fluctuatingfield along B0, which is allowed as long as B ¿ B0. Apart from this, we assume thatany background gradients caused by, e.g., inhomogeneities of the main magnetic field or
84 6. Diffusion in porous building materials with high internal magnetic field gradients
macroscopic demagnetization effects due to the non-spherical geometry of the sample, arevery small compared to Gx. By combining equations A3 and A4 we arrive at:
φk = γGx
[∫ t
t−τ
xkdt−∫ τ
0
xkdt
]+ γ
[∫ t
t−τ
B (~rk) dt−∫ τ
0
B (~rk) dt
]≡ φk,G + φk,B. (A5)
In this equation φk,G and φk,B are respectively used for the contributions of the appliedgradient and the fluctuating field to the dephasing.
As already mentioned in section 6.2, at time scales t > tB the spins experience a purelyrandom field B (~rk), for which 〈B (~rk)〉 = 0. Hence 〈xkB (~rk)〉 will also be zero, whichimplies that φk,G and φk,B will be uncorrelated at time scales t > tB. If we use this factand substitute equation A5 in equation A2, we obtain
M ∝ exp (−t/T1) 〈exp (iφG)〉 〈exp (iφB)〉 . (A6)
The second term at the right hand side of this equation is well known:
〈exp (iφG)〉 = exp(−γ2G2τ 2D t
). (A7)
The last term at the right hand side of equation A6 can be written as
〈exp(iφB)〉 = 1− 1
2!
⟨φ 2
B
⟩+
1
4!
⟨φ 4
B
⟩+ O (6) . (A8)
Here O(6) represents terms of sixth and higher order in φB. It is important to notethat 〈exp(iφB)〉 does not vary with time and only depends on the interpulse time τ . Byusing equation A5 we can obtain expressions for the terms at the right hand side of thisequation. For example, 〈φ 2
B〉 is given by:
⟨φ 2
B
⟩= 2γ2τ 2
⟨(Bτ
)2⟩
, Bτ ≡ 1
τ
∫ u+τ
u
B dt, (A9)
where the quantity Bτ is the value of B averaged over a time interval τ . Note that theensemble average of this quantity is a function of τ when a significant dephasing occursduring the interval τ . In the limit τ → 0 this equation reduces to
⟨φ 2
B
⟩= 2γ2τ 2
⟨B2
⟩= 2γ2τ 2σ 2
B, (A10)
where 〈B2〉 can also be thought of as the spatial average of B2 and σB ≡ 〈B2〉1/2 is thestandard deviation of the field B. By combining the equations A6, A7, and A9 we arriveat the following expression for the magnetization,
M = M0
(1− γ2τ 2
⟨(Bτ
)2⟩
+ O (4))
exp[− (
T −11 + γ2G2τ 2D
)t]. (A11)
For small values of τ this expression can be written as:
M = M0 exp[−γ2τ 2
⟨(Bτ
)2⟩− (
T −11 + γ2G2τ 2D
)t]. (A12)
This equation shows that by varying t, τ and G systematically we are able to obtainthe diffusion coefficient D and the magnitude of the internal fields σB. We wish to noteagain that equation A11 is valid as long as t > tB and τ ¿ T2, whereas equation A12additionally assumes that τ is so small that no significant dephasing due to diffusionoccurs during this time interval.
7. Conclusions and outlook
In this chapter, the main conclusions based on the research described in this thesis arepresented. Next, recommendations are given for future research on salt transport in layeredsystems, which is important for improving the performance of plasters.
7.1 Conclusions
NMR is a non-destructive technique, very suitable for probing the transport of water anddissolved ions in porous materials. We have measured the time evolution of the hydrogenand sodium profiles quasi-simultaneously, which enabled us to monitor the moisture andsalt transport during drying of layered porous media. Measurements have been performedwith a spatial resolution of the order of one millimeter, which is very accurate comparedto conventional destructive techniques (hygroscopic moisture content analysis, chemicalmethods). We have to remark that in gypsum, plaster, and calcium-silicate brick not alldissolved Na could be measured by NMR, due to the fast transverse (T2) relaxation ofNa in the small pores. Although this signal loss has been corrected for in first order, thiscorrection may be less reliable at very low moisture contents. In Bentheimer sandstoneand fired clay-brick no Na signal loss occurs, and hence the amount of dissolved Na canbe measured quantitatively.
The drying behavior of salt contaminated layered porous systems has been studied.Two key factors could be identified: the pore-size distributions of the individual layersand the presence of the salt. First of all, drying is determined by the pore sizes in thevarious layers. During drying air first invades the pores with the lowest capillary pressure.According to equation 2.4 these are generally the largest pores. Therefore, during dryingof layered materials the layer with the smallest pores remains wet while the other layersdry. Secondly, the presence of salt strongly influences the drying process by suppressingthe formation of a receding drying front and by reducing the drying rate. The suppressionof the formation of a receding drying front most likely results from a change of the wettingproperties in the presence of salt [Pel03]. This may be related to the decrease of the contactangle φ between the liquid-air and the solid-liquid interface in the presence of salt [Nij04].In such a case, liquid films may be present and the liquid network will be complete untilvery low saturations.
The slower drying of the salt loaded sample can partly be attributed to the dependenceof the drying rate on the relative humidity [Hal02]. The presence of salt decreases therelative humidity near the liquid-air interface and, consequently, decreases the dryingrate [Daı02]. Apart from this, the drying rate may have been decreased by blocking of thepores near the the drying surface by salt crystals, which reduces the effective surface area
85

86 7. Conclusions and outlook
that is available for evaporation. This explanation is supported by our measurements onnon-uniformly salt loaded systems in which the layer adjacent to the drying surface wassaturated with pure water. These systems have drying rates that are significantly higherthan those of the corresponding uniformly salt-loaded systems.
For two-layer systems it was shown that the moisture transport in the plaster layerwas largely influenced by the pore-size distribution of the underlying substrate. Thelayer with the largest pores dried first. This has important implications for the transportand accumulation of salt in plaster/substrate systems. When the plaster was appliedon a substrate with larger pores, salt tended to accumulate in the plaster layer, becausethis layer remained wet for a longer time than the substrate. When the plaster wasapplied on a substrate with smaller pores, some salt crystallized in the plaster layer, buta significant amount of salt crystallized within the substrate itself. In the latter case, thesalt accumulation is also influenced by the drying rate.
The effect of the drying rate on the salt transport can be described by a Peclet number(Pe), which characterizes the competition between advective and diffusive ion transport.At high drying rates, Pe À 1, advection dominates the ion transport and salt accumulatesat the drying surface. Therefore salt will primarily crystallize in the plaster. During alater stage of the drying process, salt will crystallize in the region that stays wet for thelongest time, which is the system with the smaller pores. On the other hand, at very lowdrying rates, Pe ¿ 1, diffusion dominates the ion transport and the salt concentrationtends to be uniform everywhere in the sample. For a system in which the pores of theplaster are larger than those of the substrate, we expect hardly any salt to crystallize inthe plaster, since it will diffuse to the relatively slow drying substrate.
For the two-layer systems an efficiency number was introduced, as a measure for theefficiency of salt transport from the substrate to the plaster. It is a simple, practicalnumber, useful for the choice of a compatible plaster for a particular substrate. Theefficiency number can be calculated or estimated in different ways: from the moisturecontent of the layers, from the amount of salt present in the layers, or from the pore-sizedistributions of the materials.
Using a three-layer system, with two different plaster layers applied on a substrate,we tried to achieve an accumulating system in which salt would crystallize in the baselayer of the plaster, near the substrate, and not in the cover layer, near the surface. Ourexperiments suggest that it is rather difficult to make a salt accumulating system which ispurely based on differences between the pore-size distributions of the individual layers. Inpractice it is difficult to prepare a plaster with an exactly specified pore-size distribution.On the other hand, the wetting properties of a porous medium may change significantlyin the presence of salt, which has a large effect on the drying behavior and, consequently,the salt transport.
One of our experiments on a non-uniformly salt loaded three-layer gypsum/plaster/Bentheimer sandstone sample revealed that, at the beginning of the drying process, waterwas transported from the cover layer to the base layer of the plaster. This has beenattributed to the preparation of the sample. In order to prevent diffusion of ions from thesalt solution in the substrate to the pure water in the gypsum and plaster layer beforethe start of the drying process, these layers were immersed in water for only about 10
7.2. Outlook 87
seconds. Immediately after this procedure the actual experiment was started. As a resultthe plaster layer may not have reached capillary saturation, which may cause water tomove from the gypsum layer into the plaster layer. Because in this system the coverlayer also dried very fast, no salt was transported to the external surface, and a saltaccumulating system has been formed.
NMR also offers the possibility to measure the microscopic moisture diffusion constantsin porous materials. In many building materials, these measurements are hindered by thepresence of internal magnetic field gradients originating from magnetic impurities, likeFe. A new analytical equation was derived for the long-time stimulated echo decay inthe presence of spatially varying internal field gradients. This equation was used tointerpret our NMR diffusion measurements on three materials with different amounts ofmagnetic impurities. It was found that the moisture diffusivity in these materials could bedetermined correctly. The tortuosity coefficients of these materials have been calculated,and were found to be in good agreement with the values obtained by electrochemicalimpedance spectroscopy. Compared to this technique, NMR has the advantage that itcan be used for investigations of the diffusion in the presence of chemical reactions orin unsaturated media, i.e., during drying, absorption, or crystallization. Our approachmay be useful for diffusivity measurements in many classes of materials in which internalmagnetic fields strongly interfere with the applied magnetic field gradients. Due to thefast longitudinal relaxation of Na, even in the bulk, it was not possible to determine themicroscopic diffusivity of Na in building materials.
7.2 Outlook
Although the study on moisture and salt transport in layered systems presented in thisthesis has provided a lot of information that may be useful for practical applications,there are still many open questions, which will be addressed below.
First, our experiments on three-layer systems show that is rather difficult to makea salt accumulating system which is purely based on differences between the pore-sizedistributions of the individual layers. In an accumulating system the cover layer shoulddry first. It follows from the capillary pressure law that the drying process is not onlydetermined by the pore size but also by the contact angle φ between the liquid-air and thesolid-liquid interface. Therefore a relatively fast drying top layer could also be realizedby making the pore walls more hydrophobic, i.e., by increasing the contact angle φ.This can be achieved by applying a water repellent agent on the outer layer. To relatethe performance of such systems to possible damage, for instance, spalling of the waterrepellent layer, research should be done on moisture and salt transport and crystallizationin the presence of water repellent agents.
Second, in our study we have only investigated the transport and accumulation ofNaCl. It is obvious that also research should be done on the transport and accumulationof other salts like Na2SO4 and Na2CO3, which cause serious damages to building materials.In the case of NaCl the crystals can easily nucleate and hence a NaCl solution does notshow supersaturation. NaCl crystals are deposited at all positions in the sample wherethe concentration reaches the saturation concentration. When ions are transported by
88 7. Conclusions and outlook
advection to the drying surface, NaCl crystals will be deposited mainly at the dryingsurface. Na2SO4 and Na2CO3 are salts which nucleate more difficult, and therefore theirsolutions may show supersaturation. If ions are transported to the drying surface, theirconcentration may exceed the saturation concentration in a wider region of the sample,where they can eventually crystallize causing damage. Since the NMR technique offers thepossibility to determine Na concentrations, it is possible to investigate the supersaturationof Na2SO4 and Na2CO3 solutions in porous materials.
In contrast to NaCl, which has only an anhydrous crystal structure, Na2SO4 andNa2CO3 can have hydrous crystal phases as well (Na2SO4·7H2O; Na2SO4·10H2O andNa2CO3·10H2O), depending on the temperature and relative humidity. During drying ofporous materials containing Na2SO4 or Na2CO3 solutions liquid water can be removedby two processes: evaporation and hydration. By using a balance it might be possible tomeasure the mass of the evaporated water. The mass of the hydrated water could then bedetermined from the initial mass of the water and the mass of the evaporated water. Sucha study might answer the question which crystal phase is present in the porous material.
Third, we have studied the salt accumulation in materials only during a single dryingprocess. In practice, frequent wetting-drying cycles occur because of the weather, day-night, and season cycles. Therefore it is important to study the transport of moisture andsalt for several cycles, since damages of building materials generally only occur after anumber of cycles [Gou97]. We expect that repeated wetting-drying cycles will change theinitial salt distribution in the system and, therefore, influence the drying and salt accumu-lation behavior. In order to investigate this point, successive wetting-drying experimentsshould be done under controlled laboratory conditions.
Fourth, in our experiments the drying process started at (almost) capillary saturationof the various materials. To investigate the effect of other initial conditions and otherboundary conditions (air speed relative humidity), it might be useful to model the waterand salt transport in these systems following an approach as outlined in [Bro98b, Bro98a].On should note that such modeling requires additional information about the macroscopic(equilibrium) properties of the various materials. This information might be obtainedfrom measurements of the capillary pressure curves (wetting curve, drying curve) and thehygroscopic curves. This type of simulation might, for instance, also provide informationon the consequences of a non-perfect hydraulic contact between the plaster layer and thesubstrate.
Finally, in some porous media like gypsum, plaster, and calcium-silicate brick we werenot able to measure the amount of Na quantitatively by NMR. We corrected for the NMRsignal loss by calibrating the Na signal in the completely saturated sample and assumedthat the transverse relaxation time (T2) of Na and, therefore, the signal loss does notchange with moisture content. Of course this is a rather crude assumption, since at lowmoisture contents only the smallest pores are filled with NaCl solution, which leads to adrastic decrease of T2 and hence the Na signal intensity. To solve this problem, calibrationsof the Na signal should be performed at different saturations.
Bibliography
[Atk02] P.W. Atkins, J. De Paula, C.A. Trapp, and M.P. Cady. Atkins’ physical chem-istry . Oxford University Press, Oxford, 2002.
[Bea90] J. Bear and Y. Bachmat. Introduction to Modeling of Transport Phenomena inPorous Media, volume 4. Kluwer, Dordrecht, The Netherlands, 1990.
[Bec04] K. Beck, O. Rozenbaum, M. Al-Mukhtar, and A. Plancon. Multi-scale char-acterisation of monument limestones. In 6th International symposium on theconservation of monuments in the Mediteranean basin, Lisbon, Portugal , pages229–232. 2004.
[Blo46] F. Bloch. Nuclear induction. Phys. Rev., 70:460–474, 1946.
[Blu00] B. Blumich. NMR imaging of materials . Clarendon Press, Oxford, 2000.
[Bra99] Y. Le Bray and M. Prat. Three dimensional pore network simulation of dryingin capillary porous media. Int. J. Heat and Mass Trans., 42:4207–4224, 1999.
[Bro79] K.R. Brownstein and C.E. Tarr. Importance of Classical Diffusion in NMRStudies of Water in Biological Cells. Phys. Rev. A, 19:2446–2452, 1979.
[Bro97] H.J.P. Brocken and L. Pel. Moisture transport over the brick-mortar interface:water absorption and drying. In Proc. 11th Int. Brick/Block Masonry Conf.,Shanghai, China, pages 826–835. 1997.
[Bro98a] H.J.P. Brocken. Moisture transport in brick masonry: the grey area betweenbricks . Ph.D. thesis, Eindhoven University of Technology, 1998.
[Bro98b] H.J.P. Brocken, L. Pel, and K. Kopinga. Moisture transport over thebrick/mortar interface. In H. Zanni P. Colombet, A.R. Grimmer and P. Sozzani,editors, Nuclear Magnetic Resonance Spectroscopy of Cement Based Materials .1998.
[Cal91] P.T. Callagan. Principles of nuclear magnetic resonance microscopy . ClarendonPress, Oxford, 1991.
[Can97] D. Canet. Radiofrequency field gradient experiments. Progr. NMR Spec-troscopy , 30:101–135, 1997.
[Car54] H.Y. Carr and E.M. Purcell. Effects of diffusion on free precession in nuclearmagnetic resonance experiments. Phys. Rev., 94:630–638, 1954.
[Cot89] R.M. Cotts, M.J.R. Hoch, T. Sun, and J.T. Markert. Pulsed Field GradientStimulated Echo Methods for Improved NMR Diffusion Measurements in Het-erogeneous Systems. J. Magn. Res., 83:252–266, 1989.
89
[Daı02] J.-F. Daıan. Coupled salt and moisture transport in partially saturated porousmedia. In Poromechanics II, Proceedings of the second Biot Conference onPoromechanics, Grenoble, France, pages 407–412. 2002.
[Die94] A.S. El Dieb and R.D. Hooton. Evaluation of the Katz-Thomson model forestimating the water permeability of cement based materials from mercuryintrusion porosimetry data. Cem. Concr. Res., 24:443–455, 1994.
[Dul91] F.A.L. Dullien. Porous media: fluid transport and pore structure. AcademicPress, London, 1991.
[Eis66] M. Eisenstadt and H.L. Friedman. Nuclear magnetic resonance in ionic solution.I. Relaxation of 23Na in aqueous solutions of NaCl and NaClO4. J. Chem. Phys.,44:1407–1415, 1966.
[Far71] T.C. Farrar and E.D. Becker. Pulse and Fourier transform NMR: introductionto theory and methods . Academic Press, London, 1971.
[For94] E.J. Fordham, S.J. Gibbs, and L.D. Hall. Partially restricted diffusion in apermeable sandstone: observations by stimulated echo PFG NMR. Mag. Res.Imaging , 112:279–284, 1994.
[Gar90] E.J. Garboczi. Permeability, diffusivity and microstructural parameters: acritical rewiew. Cem. Concr. Res., 20:591–601, 1990.
[Gou97] A. Goudie and H. Viles. Salt weathering hazard . Wiley, Chichester, 1997.
[Gri90] W.D. Grimm. Bildatlas wichtiger Denkmalgesteine der Bundesrepublik Deutsch-land . Bayerisches Landesamt fur Denkmalpflege, Munchen, 1990.
[Haa99] E.M. Haacke, R.W. Brown, M.R. Thompson, and R. Venkatesan. Magnetic Res-onance Imaging: Physical principles and sequence design. Wiley, Chichester,1999.
[Hah50] E.L. Hahn. Spin echoes. Phys. Rev., 80:580–594, 1950.
[Hal02] C. Hall and W.D. Hoff. Water transport in brick, stone and concrete. Spon,London, 2002.
[Hil95] G. Hilbert. Der Einfluss von Bindemitteln auf die Eigenschaften von Opfer-putze. In Bautenschutz und Bausanierung , volume 7, pages 71–75. 1995.
[Hil98] G. Hilbert. Technisches Optimum denkmalpflegerische Zielvorstelling. In Baut-enschutz und Bausanierung , volume 5, pages 16–18. 1998.
[Hol01] M. Holz, S.R. Heil, and I.A. Schwab. Electrophoretic NMR studies of electricaltransport in fluid-filled porous systems. Magn. Reson. Imaging , 19:457–463,2001.
[Hui02] H. P. Huinink, L. Pel, and M. A. J. Michels. How ions distribute in a dryingporous medium: A simple model. Phys. Fluids , 14:1389–1395, 2002.
[Kim97] R. Kimmich. NMR Tomography, Diffusometry, Relaxometry . Springer-Verlag,Berlin, 1997.
[Kle99] R.L. Kleinberg. Nuclear Magnetic Resonance. In P.-Z. Wong, editor, Methodsin the Physics of Porous Media, volume 35, pages 337–385. Academic Press,San Diego, California, USA, 1999.
90
[Kop94] K. Kopinga and L. Pel. One-Dimensional Scanning of Moisture in PorousMaterials with NMR. Rev. Sci. Instrum., 65:3673–3681, 1994.
[Kop00] I.V. Koptyug, S.I. Kabanikhin, K.T. Iskakov, V.B. Fenelonov, L.Yu. Khitrina,R.Z. Sagdeev, and V.N. Parmon. A quantitative NMR imaging study of masstransport in porous solids during drying. Chem. Eng. Sci., 55:1559–1571, 2000.
[Kun96] H. Kunzel and G. Riedl. Werktrockenmortel. Kalkputz in der denkmalpflege.In Bautenschutz und Bausanierung , volume 2, pages 12–18. 1996.
[Lat93] L.L. Latour, P.P. Mitra, R.L. Kleinberg, and C.H. Sotak. Time-DependentDiffusion Coefficient of Fluids in Porous Media as a Probe of Surface-to-VolumeRatio. J. Magn. Res. A, 101:342–346, 1993.
[Lat95] L.L. Latour, R.L. Kleinberg, P.P. Mitra, and C.H. Sotak. Pore-Size Distri-butions and Tortuosity in Heterogeneous Porous Media. J. Magn. Res. A,112:83–91, 1995.
[Lev01] M.H. Levitt. Spin dynamics: basics of nuclear magnetic resonance. Wiley,Chichester, 2001.
[Lub04] B. Lubelli, R.P.J. van Hees, and J. Larbi. Influence of brick properties on saltcrystalization damage. In 6th International symposium on the conservation ofmonuments in the Mediteranean basin, Lisbon, Portugal , pages 283–288. 2004.
[Lub05] B. Lubelli, R.P.J. van Hees, and C.J.W.P. Groot. The performance of a restora-tion plaster in the field: Investigation and monitoring of two case studies. InInternational Workshop: ‘Repair Mortars for Historic Masonry’, Delft, TheNetherlands . 2005.
[Mag04] A.C. Magalhaes, A. Moragues, and M. do Rosario Veiga. Application of somemethods on evaluation of porous systems of wall renderings. In VII CongresoInternacional de Rehabilitacion del Patrimonio Arquitectonico y Edificado, Lan-zarote, Spain. 2004.
[Meh80] P.K. Mehta and D. Manmohan. Pore distribution and permeability of hardenedcement pastes. In 7th International Symposium of the Chemistry of Cement,Paris, France. 1980.
[Mil89] R. Mills and V.M.M. Lobo. Self diffusion in electrolyte solutions. In PhysicalSciences Data, volume 36. Elsevier, 1989.
[Mos02] M.J. Mosquera, D.Benıtez, and S.H. Perry. Pore structure in mortars appliedon restoration: Effect on properties relevant to decay of granite buildings. Cem.Concr. Res., 32:1883–1888, 2002.
[Nes02] N. Nestle, A. Qadan, P. Galvosas, W. Suss, and J. Karger. PFG NMR and in-ternal magnetic field gradients in plant-based materials. Magn. Reson. Imaging ,20:567–573, 2002.
[Nij04] T. Nijland. Private Communication, 2004.
[Nua81] B.K. Nuame and J.M. Illston. Relationships between permeability and porestructure of haredened cement paste. Mag. Concr. Res., 33:139–146, 1981.
[Pel95] L. Pel. Moisture Transport in Porous Building Materials . Ph.D. thesis, Eind-hoven University of Technology, 1995.
91
[Pel00] L. Pel, K. Kopinga, and E.F. Kaasschieter. Saline absorption in calcium-silicatebrick observed by NMR scanning. J. Phys. D: Appl. Phys., 33:1380–1385, 2000.
[Pel02] L. Pel, H. Huinink, and K. Kopinga. Ion transport and crystallization in inor-ganic building materials as studied by nuclear magnetic resonance. Appl. Phys.Lett , 81:2893–2895, 2002.
[Pel03] L. Pel, H. Huinink, and K. Kopinga. Salt transport and crystallization in porousbuilding materials. Magn. Reson. Imaging , 21:317–320, 2003.
[Pel04] L. Pel, H. Huinink, K. Kopinga, R.P.J. van Hees, and O.C.G. Adan. Efflores-cence pathway diagram: understanding salt weathering. Constr. Build. Mater ,18:309–313, 2004.
[Pet04] J. Petkovic, H.P. Huinink, L.Pel, and K. Kopinga. Diffusion in porous buildingmaterials with high internal magnetic field gradients. J. Magn. Res., 167:97–106, 2004.
[Plo03] F. Plourde and M. Prat. Pore network simulations of drying of capillary porousmedia. influence of thermal gradients. Int. J. Heat Mass Tran., 46:1293–1307,2003.
[Puh83] J. Puhringer. Salt desintegration, Salt migration and degradation by salt - ahypothesis . Swedish Council for Building Research, Document D15, SpanbergsTryckerier AB, Stocholm, 1983.
[Que98] D.A. Quenard, K. Xu, H.M. Kuenzel, D.P. Bentz, and N.S. Martys. Microstruc-ture and transport properties of porous building materials. Mater. Struct.,31:317–324, 1998.
[Rei90] H.W. Reinhardt and K. Gaber. From pore size distribution to equivalent poresize of cement mortar. Mater. Struct., 23:3–15, 1990.
[Rij04] L.A. Rijniers. Salt crystallization in porous materials: an NMR study . Ph.D.thesis, Eindhoven University of Technology, 2004.
[RM91] R. Rossi-Manaresi and A. Tucci. Pore structure and the disruptive or cementingeffect of salt crystallization in various types of stone. Stud. Conserv., 36:56–58,1991.
[Rob84] G.C. Robinson. The relationship between pore structure and durability of brick.Bulletin of the American Ceramic Society , 63:295–300, 1984.
[Sel00] J.G. Seland, G.H. Sorland, K. Zick, and B. Hafskjold. Diffusion Measurementsat Long Observation Times in the Presence of Spatially Variable Internal Mag-netic Field Gradients. J. Magn. Res., 146:14–19, 2000.
[Sna97] J.E.M. Snaar and B.P. Hills. Constant gradient stimulated echo studies ofdiffusion in porous materials at high spectrometer fields. Magn. Reson. Imaging ,15:983–992, 1997.
[Sny02] K.A. Snyder, X. Feng, B.D. Keen, and T.O. Mason. Estimating the electricalconductivity of cement paste pore solutions from OH−, K+ and Na+ concen-trations. Cem. Concr. Res , 2260:1–6, 2002.
[Son00] Y.-Q. Song, S. Ryu, and P.N. Sen. Determining Multiple Length Scales inRocks. Nature, 406:178–181, 2000.
92
[Ste65] E.O. Stejskal and J.E. Tanner. Spin Diffusion Measurements: Spin Echoes inthe Presence of a Time-Dependent Field Gradient. J. Chem. Phys., 42:288–292,1965.
[Tan68] J.E. Tanner and E.O. Stejskal. Restricted self-diffusion of protons in colloidalsystems by the pulsed-gradient, spin-echo method. J. Chem. Phys., 49:1768–1777, 1968.
[Tan70] J.E. Tanner. Use of the Stimulated Echo in NMR Diffusion Studies. J. Chem.Phys., 52:2523–2526, 1970.
[The04] P. Theoulakis, I. Karatasios, V. Kilikoglou, and A. Sotiropoulos. The selectionof stone for historic buildings repair. The use of Cypriot stone in the medievalcity of Rhodes. In 6th International symposium on the conservation of monu-ments in the Mediteranean basin, Lisbon, Portugal , pages 352–360. 2004.
[Val00] R.M.E. Valckenborg. NMR on technological porous materials . Ph.D. thesis,Eindhoven University of Technology, The Netherlands, 2000.
[Val01a] R.M.E. Valckenborg, L. Pel, K. Hazrati, K. Kopinga, and J. Marchand. Porewater distribution in mortar during drying as determined by NMR. Mater.Struct., 34:599–604, 2001.
[Val01b] R.M.E. Valckenborg, L. Pel, and K. Kopinga. NMR Relaxation and DiffusionMeasurements on Iron (III) Doped Kaolin Clay. J. Magn. Res., 151:291–297,2001.
[Val02] R.M.E. Valckenborg, L. Pel, and K. Kopinga. Combined NMR cryoporometryand relaxometry. J. Phys. D: Appl. Phys., 35:249–256, 2002.
[Vas01] S. Vasenkov, P. Galvosas, O. Geier, and J. Karger N. Nestle, F. Stallmach.Determination of genuine diffusivities in heterogeneous media using stimulatedecho pulsed gradient NMR. J. Magn. Reson., 149:228–233, 2001.
[vB80] J. van Brakel. Mass transfer in convective drying. In A.S. Mujumdar, editor,Advances in drying , volume 1. Hemisphere, Washington, 1980.
[vH03a] R.P.J. van Hees, S. Brendle, T.G. Nijland, G.J.L.M. de Haas, and H.J. Tolboom.Decay of Rhenish tuff in Dutch monuments. Part 2: laboratory experiments asa basis for the choice of restoration stone. Heron, 48:167–178, 2003.
[vH03b] R.P.J. van Hees, C.J.W.P. Groot, and L. Pel. Compatibility of Plasters andRenders with Salt loaded Substrates in Historic Buildings. In R. Kozlowski,editor, Proceedings of the 5th EC Conference on Cultural Heritage Research,Cracow , pages 34–38. Office for Official Publications of the European Commu-nities, Luxembourg, 2003.
[Vla99] M.T. Vlaardingerbroek and J.A. den Boer. Magnetic Resonance Imaging .Springer, Heidelberg/Berlin, 1999.
[Vog02] C. Vogt, P. Galvosas, N. Klitzsch, and F. Stallmach. Self-diffusion studies ofpore fluids in unconsolidated sediments by PFG NMR. J. Appl. Geophys.,50:455–467, 2002.
[Wij97] T.J. Wijffels, C.J.W.P. Groot, and R.P.J. van Hees. Performance of restorationplasters. In 11th Int. Brick/Block Masonry Conf., Shanghai, China, pages1050–1062. 1997.
93
[Wij00] T.J. Wijffels and R.P.J. van Hees. The influence of the loss of water of thefresh mortar to the substrate on the hygric characteristics of so-called restora-tion renderings. In Proceedings International Workshop on Urban Heritage andBuilding Maintenance VII, Zurich, Switzerland , pages 49–54. 2000.
[Wil88] C.R. Wilke. Diffusion in Gases and Liquids. In S.P.Parker, editor, Physicalchemistry source book , pages 122–128. McGraw-Hill, London, 1988.
[Woe61] D.E. Woessner. Effects of Diffusion in Nuclear Magnetic Resonance Spin-EchoExperiments. J. Chem. Phys., 34:2057–2061, 1961.
[Won99] P.-Z. Wong. Conductivity, permeability and electrokinetics. In P.-Z. Wong,editor, Methods in the Physics of Porous Media, volume 35, pages 119–159.Academic Press, San Diego, California, USA, 1999.
[WTA92] WTA Merkblatt 2-2-91 - Sanierputzsysteme, Wissenschaftlich technischen Ar-beitsgemeinschaft fur Bauwerkserhaltung und Denkmalpflege. 1992.
[Zog04] K. Zoghlami, D. Gomez-Gras, and A. Alvarez. Petrophysical characterisationand durability of miocenic sandstones used in the Roman aqueduct of Zaghouan- Cartaghe building. In 6th International symposium on the conservation ofmonuments in the Mediteranean basin, Lisbon, Portugal , pages 385–389. 2004.
94
Summary
Moisture and salt decay processes are amongst the most recurrent causes of damage ofbuilt objects and monuments. Although salt damage has been intensively investigated forseveral decades, the mechanisms and factors that control salt transport, accumulation, andcrystallization in porous media and the development of damage are poorly understood.Knowledge about the transport of water and ions and salt crystallization in masonry (inthe thesis referred to as substrate) and plasters is needed to explain salt damage and todevelop durable materials.
In chapter 2 the moisture and ion transport in porous media is reviewed briefly. Thedrying behavior of a material is determined by the capillary pressure, and therefore bypore-size distribution. As a consequence the largest pores are emptied first. In layeredsystems of different materials the material with larger pores should dry first. Ions aretransported via diffusion and advection with the flow of the water. These processes aredescribed by a diffusion-advection equation. For high drying rates advection dominatesthe ion transport, whereas for low drying rates diffusion dominates the ion transport.
Chapter 3 reviews the Nuclear Magnetic Resonance (NMR) technique and the ex-perimental set-up, that is used for the investigations described in this thesis. NMR isa non-destructive technique, suitable for probing the transport of water and dissolvedions in porous materials. The time evolution of the hydrogen profiles and the profilesof dissolved sodium can be measured quasi-simultaneously, which enables monitoring themoisture and salt transport during drying of (layered) porous media. The spatial resolu-tion of the NMR measurements is of the order of one millimeter, which is very accuratecompared to conventional destructive techniques (hygroscopic moisture content analysis,chemical methods). It is outlined that using a stimulated echo NMR pulse sequence theself-diffusion of water in porous materials can be measured up to diffusion times exceeding1 s.
In chapter 4 the moisture and salt transport in a two-layer plaster/substrate systemis discussed. It is shown experimentally that moisture and salt transport in the plasterlayer is influenced by the pore-size distribution of the underlying substrate. The sameplaster was applied on a Bentheimer sandstone substrate and a calcium-silicate brick sub-strate. In case of the plaster/Bentheimer sandstone system the plaster has pores thatare an order of magnitude smaller than those of the substrate. On the other hand, incase of the the plaster/calcium-silicate brick system the plaster has pores that are anorder of magnitude larger than the smallest pores of the substrate. The moisture andsalt transport and the salt accumulation differs significantly for these two systems. Dur-ing the drying process, air invades first the layer with the largest pores. Therefore, inthe plaster/Bentheimer sandstone system the substrate dries before the plaster, while in
95

the plaster/calcium-silicate brick system the substrate stays wet longer than the plaster.This has important implications for the transport and accumulation of salt. In the plas-ter/Bentheimer sandstone system (the pores of the plaster are smaller than those of thesubstrate) all salt is removed from the substrate and accumulates in the plaster, becausethis layer remains wet for a longer time than the substrate. In the plaster/calcium-silicatebrick system (the substrate has smaller pores than the plaster) some salt crystallizes inthe plaster layer, but a significant amount of salt crystallizes within the substrate itself.The efficiency of the salt transport from substrate to plaster is quantified in terms of anefficiency number ε, which can be estimated in different ways. It is a simple, practicalnumber, useful for the choice of a compatible plaster for a particular substrate. Based onthe results of this study, we have discussed the salt transport for various combinationsof plasters and substrates, of which the pore-size distributions have been reported in theliterature.
In chapter 5 the question is addressed whether a plaster/substrate system which hastwo plaster layers with different pore sizes, can act as an accumulating system, i.e., asystem in which salt crystallizes in the plaster layer and not in the substrate or at theexternal surface. To this end we have studied the drying behavior of such plasters appliedon two different substrates: fired-clay brick and Bentheimer sandstone. On the substratewe applied two plaster layers, of which the first (base) plaster layer has pores that aresignificantly smaller than the pores of the second (external) plaster layer. These systemswere either saturated with pure water or a NaCl solution. We also studied non-uniformlysalt loaded systems, in which the two plaster layers were saturated with pure water, andthe substrate with a NaCl solution. The moisture and salt transport during drying wereinvestigated. Among the investigated systems, it is found that only a system consisting ofan external gypsum layer and a base lime-cement plaster layer on a Bentheimer sandstonesubstrate behaves as a salt accumulating system when it is non-uniformly salt loaded. Weconclude that it is difficult to make an accumulating system only based on differences inthe pore-size distributions of the individual layers, because in practice it is difficult toprepare plasters with exactly specified pore-size distributions, in particular, plasters withpores which are larger than the pores of the substrate.
Chapter 6 describes NMR measurements of the self-diffusion of water in porous ma-terials containing a large amount of magnetic impurities. These impurities (Fe), whichare often present in building materials, hinder the diffusivity measurements by NMR. Toinvestigate the self-diffusion of water in these materials, a stimulated echo NMR techniqueis applied. A new analytical equation for the long-time stimulated-echo decay in the pres-ence of spatially varying internal field gradients is derived and experimentally confirmed.This equation is used to interpret our NMR diffusion measurements on three materi-als with different amounts of magnetic impurities. It is shown that, using this method,the self-diffusion constant of water in these materials can be determined correctly. Themethod presented in this chapter may be useful for diffusivity measurements in manyclasses of materials in which internal magnetic fields interfere with the applied gradients(i.e. susceptibility induced fields in natural stones, inorganic and biologic materials).
96
Samenvatting
Verwering ten gevolge van vocht en zout is een van de meest voorkomende oorzakenvan schade aan bouwconstructies en monumenten. Hoewel al tientallen jaren lang veelonderzoek is verricht naar zoutschade, zijn de mechanismen en factoren die van invloed zijnop zouttransport, ophoping van zout en kristallisatie nog steeds slecht begrepen. Inzichtin het transport van water en ionen en zoutkistallisatie in metselwerk (in dit proefschriftondergrond genoemd) en pleisters is nodig om zoutschade te kunnen verklaren en omduurzame materialen te ontwikkelen.
In hoofdstuk 2 wordt een kort overzicht gegeven van het transport van vocht en ionenin poreuze materialen. Het drooggedrag van een materiaal blijkt bepaald te worden doorde capillaire druk, en dientengevolge door de porieverdeling. Hierdoor worden de grootsteporien het eerst geleegd. In systemen die opgebouwd zijn uit lagen van verschillende ma-terialen zal daarom het materiaal met de grootste porien het eerst drogen. Ionen wordenin het water getransporteerd door advectie en diffusie. Deze processen kunnen wordenbeschreven met een advectie-diffusie vergelijking. Bij hoge droogsnelheden domineertadvectie het ionentransport, bij lage snelheden domineert diffusie.
In hoofdstuk 3 wordt een overzicht gegeven van de kernspinresonantie (NMR) tech-niek en van de experimentele opstelling, die is gebruikt voor het onderzoek dat in ditproefschrift is beschreven. NMR is een niet-destructieve techniek, waarmee het transportvan water en daarin opgeloste ionen in poreuze materialen kan worden onderzocht. Detijdsafhankelijkheid van de profielen van waterstof en opgeloste natrium-ionen kunnenquasi-simultaan worden gemeten, wat het mogelijk maakt het vocht- en zouttransport tij-dens het drogen van (gelaagde) poreuze media waar te nemen. Het ruimtelijk oplossendvermogen van de NMR metingen in ruwweg 1 mm, hetgeen veel nauwkeuriger is danmeer conventionele destructieve technieken (hygroscopische analyse van het vochtgehalte,chemische analyses). Beschreven wordt dat met behulp van een stimulated echo NMRpulsreeks de zelfdiffusie van water in poreuze materialen kan worden gemeten tot dif-fusietijden langer dan 1 s.
Hoofdstuk 4 beschrijft het vocht- en zouttransport in een tweelaags pleister/ondergrondsysteem. Experimenteel wordt aangetoond dat het vocht- en zouttransport in de pleister-laag wordt beınvloed door de porieverdeling van de ondergrond. Dezelfde pleister werdaangebracht op een Bentheimer zandsteen en op een kalkzandsteen. In het geval vaneen Bentheimer zandsteen zijn de porien van de pleister een orde van grootte kleinerdan die van de ondergrond. In het andere geval, de kalkzandsteen, zijn de porien vande pleister een orde van grootte groter dan de kleinste porien van de ondergrond. Hetvocht- en ionentransport in deze beide systemen blijkt sterk te verschillen. Tijdens hetdrogen dringt lucht het eerst binnen in de laag waarvan de porien het grootst zijn. In het
97

pleister/Bentheimer zandsteen systeem droogt de ondergrond eerder dan de pleisterlaag,terwijl in het pleister/kalkzandsteen systeem de ondergrond langer nat blijft dan de pleis-terlaag. Dit heeft belangrijke gevolgen voor het zouttransport. In het pleister/Bentheimerzandsteen systeem (de porien van de pleister zijn kleiner dan die van de ondergrond) ver-dwijnt alle zout uit de ondergrond en hoopt zich op in de pleisterlaag, omdat deze langernat blijft. In het pleister/kalkzandsteen systeem (de porien van de ondergrond zijn kleinerdan die van de pleister) kristalliseert een deel van het zout in de pleisterlaag, maar hetmerendeel in de ondergrond zelf. De efficientie van het zouttransport van de ondergrondnaar de pleister kan worden uitgedrukt in een efficientie-getal ε, dat op verschillendemanieren afgeschat kan worden. Dit is een eenvoudig, praktisch getal, dat nuttig is bij dekeuze van een compatibele pleister voor een bepaalde ondergrond. Uitgaande van dezeresultaten wordt het zouttransport besproken voor verschillende combinaties van pleisteren ondergrond, waarvan de porie-verdelingen in de literatuur zijn gerapporteerd.
Hoofdstuk 5 gaat in op de vraag of een systeem waarin zich op de ondergrond tweepleisterlagen met verschillende porieverdelingen bevinden, zich kan gedragen als een accu-mulerend systeem. Dit is en systeem waarbij het zout kristalliseert binnen in de pleister-laag, dus niet in de ondergrond of aan het uitwendige oppervlak. Hiertoe is het droogge-drag van een degelijk type pleister bestudeerd op een ondergrond van rode baksteen enop een ondergrond van Bentheimer zandsteen. Op de ondergrond werden twee pleis-terlagen aangebracht. De eerste (basis)laag heeft porien die beduidend kleiner zijn dandie van tweede (buiten)laag. Deze systemen werden verzadigd met water of met eenNaCl zoutoplossing. Verder zijn niet-uniform zoutbelaste systemen bestudeerd, waarinde pleisterlagen verzadigd werden met puur water en de ondergrond met een zoutop-lossing. Onderzocht werd het vocht- en ionentransport van deze systemen tijdens hetdrogen. Van alle systemen die zijn bestudeerd, gedraagt alleen het systeem dat bestaatuit een buitenlaag van gipspleister, een basislaag van cement-pleister en een ondergrondvan Bentheimer zandsteen zich als een accumulerend systeem, wanneer het niet-uniformzoutbelast is. Hieruit kan geconcludeerd worden dat het lastig is een accumulerend sys-teem te maken dat gebaseerd is op verschillen in de porieverdelingen van de individuelelagen, omdat het in de praktijk moeilijk is om pleisters te vervaardigen met exact gespeci-ficeerde porieverdelingen, in het bijzonder porien die groter zijn dan die in de ondergrond.
In hoofdstuk 6 worden NMR metingen beschreven van de zelfdiffusie van water inporeuze materialen die veel magnetische verontreinigingen bevatten. Deze verontreinigin-gen (Fe), die veel voorkomen in bouwmaterialen, bemoeilijken de metingen van de diffusiemet behulp van NMR. Om de zelfdiffusie van water in dit soort materialen te onder-zoeken, is een stimulated echo NMR techniek gebruikt. We hebben een nieuwe analy-tische uitdrukking afgeleid voor het signaalverval van de stimulated echo wanneer in hetsysteem plaatsafhankelijke magneetveld-gradienten aanwezig zijn. Met behulp van dezeuitdrukking, die geldig is voor lange diffusie-tijden, zijn NMR diffusie-metingen geınterpre-teerd die verricht zijn aan drie materialen met een verschillende hoeveelheid magnetischeverontreinigingen. We hebben aangetoond dat met behulp van deze methode de zelf-diffusie van water in dit soort materialen correct kan worden bepaald. De methode kannuttig zijn voor diffusiemetingen in tal van materialen waarin de interne magneetvelden deaangelegde magneetveldgradienten verstoren (bijvoorbeeld susceptibiliteits-geınduceerdevelden in natuursteen, inorganische en biologische materialen).
98
List of Publications
• L.A. Rijniers, J. Petkovic, L. Pel, P.C.M.M. Magusin, and K. Kopinga, Relaxationof 23Na and 35Cl in porous building materials, Magn. Reson. Imaging 21, 435(2003).
• R.M.E. Valckenborg, J. Petkovic, H.P. Huinink, L. Pel, and K. Kopinga, HydrogenNMR relaxation and diffusion in a porous building material during drying, Magn.Reson. Imaging 21, 448 (2003).
• J. Petkovic, H.P. Huinink, L. Pel and K. Kopinga, Diffusion in porous buildingmaterials with high internal magnetic field gradients, J. Magn. Reson. 167, 97–106(2004).
• J. Petkovic, L. Pel, H.P. Huinink, K. Kopinga, and R.P.J. van Hees, Salt transportin plasters/substrate layers: a nuclear magnetic resonance study, 13th. Int. Brickand Block Masonry Conference, Amsterdam, July 4–7, 2004.
• J. Petkovic, L. Pel, H.P. Huinink, K. Kopinga, and R.P.J. van Hees, Salt trans-port and crystallization in plaster layers: a nuclear magnetic resonance study, 6thInternational Symposium on the Conservation of Monuments in the MediterraneanBasin, 318–322, April 7–10, Lisbon, Portugal (2004).
• C. Groot, R.P.J. van Hees, B. Lubelli, T. Wijffels, M. de Rooij, and J. Petkovic,Aspects of Salt and Moisture Transport in Restoration Plasters and Renders, Int.J. for Restoration 10, 593–608, 2004
• J. Petkovic, L. Pel, H.P. Huinink, K. Kopinga, and R.P.J. van Hees, Salt transportand crystallization in plaster layers: a nuclear magnetic resonance study, acceptedfor publication in Int. J. for Restoration
• C. Groot, R.P.J. van Hees, T. Wijffels, J. Petkovic, Aspects of Salt and MoistureTransport in Restoration Plasters and Renders, In: La conservacion del patrimonioen un entorno sostenible, M. Pilar de Luxan, Fernando Dorrego & Carlos Aymateds., Madrid, June 2004, pp. 89–101
• H.P. Huinink, J. Petkovic, L. Pel and K. Kopinga, Water and salt transport in plas-ter/substrate systems, Seminario sais soluveis em argamassas de edifıcios antigos,September 14–15, LNEC, Lisbon, Portugal (2004).
99

100
Acknowledgement
I hereby acknowledge those who have helped me on the way through this big step in mylife and career. I would first like to thank everyone who I cannot mention in person,and who have helped me in any way. I thank the most my first promoter Prof. KlaasKopinga for the opportunity to work on this interesting topic, for his help and support,and for being a very efficient and reliable supervisor whenever I needed anything. Mysecond promoter, Prof. Rob van Hees, I thank for all his suggestions and most of all forhis enthusiasm, which has helped me to love the conservation science. I thank my dailysupervisor Leo Pel for the constructive remarks and suggestions and help with the NMRsetup. Furthermore, I thank the members of my core committee Prof. Rini van Dongenand Prof. Jan Carmeliet for the remarks and suggestions regarding my thesis.
I also thank all my colleagues from the group ‘Transport in Permeable Media’ (TPM)and the ‘Biomedical Research group’. Special thanks go to Henk Huinink for help ontheoretical aspects and discussions about structure. I like to thank Hans Dalderop forhis help with the sample preparation and characterization, for all his efforts with respectto the ion chromatography measurements, and for his kindness. Jef Noijen for technicalassistance with the NMR equipment and many friendly discussions. Roland Valckenborgfor various stimulating discussions. Jaap Feijen for the many advises, help with theexperiments and the NMR setup, and help with the cutting of the samples. I also thankLourens Rijniers for his help, especially in emergency situations. Bart Erich for all thesupport he gave me and Rinus Vlaardingerbroek for the discussions about the theoreticalaspects of NMR.
I thank the AIO company for the nice evenings we had together. I name the per-sons which are not already mentioned: Carola van Pul, Edwin Heijman, Geralda vanTilborg, Willem Mulder, Ward Jennekens, Hein Castelijns, Henk de Feyter and AnnerietHeemskerk. I thank to Ria Groenendijk for her help with administrative matters. I wouldlike to thank Larry de Graaf for all the optimistic discussions. I thank to Gustav Strijkersfor the help with the software, for the kindness, and for wishing me a ‘nice evening’ everyevening. I like to thank Klaas Nicolay and Herman van Kleffens for the support they gaveme and Anke Stekelenburg, Jeanine Prompers, Flemming Nielsen, Jo Habets and MarijnGelten for the discussions, support, and nice moments during the breaks. Special thanksare due to Rob van der Meulen and all other students involved in the work in the group‘Transport in Permeable Media’ and the ‘Biomedical Research group’.
I thank the other employees at the Faculty of Applied Physics, especially the helpdesk,the ‘Werkplaats’, the administration and the ‘concierges’ for their help and friendly at-mosphere. Thanks are due to members of the group Physics of Nanostructures (FNA),especially Coen Smits for the magnetization measurements, Henk Swagten for consul-
101
tations, and Csaba Jozsa, Oleg Kurnosikov, Harm Wieldraaijer and Karel Knechten. Ithank Andre Duif, Carine van der Linden, Fred van Nijmweegen, Gerard Harkema, andJudith van de Griendt for supporting me and Jerome Remy, Misha Sorokin and GabrielaPaeva for help and useful information.
At the Faculty of Chemical Engineering I thank the Group ‘Separation Processes andTransport Phenomena’ for the facilities, especially Marcel Geboers and Peter Lipman forthe mercury intrusion measurement. I thank the former electrochemistry group, Prof. JosJanssen, Marlene Blijlevens , and Bart Coene for help with the electrochemical impedancespectroscopy measurements, and Nick Lousberg, of the group ‘Solid State and MaterialsChemistry’, for the SEM measurements. I thank the Group ‘Polymer Chemistry’ for beinga ‘second home’.
I thank the members of the Center for Building and Systems TNO–TU/e (KCBS)for interesting meetings and the friendly atmosphere. I thank my colleagues from TNODelft, Barbara Lubelli and Michele Sanders for the suggestions and help, Tomas Wijffelsfor preparation of the samples and help always when I needed, Mario de Rooij for thesuggestions and help with the ESM and MIP measurements and Timo Nijland for usefulexperimental proofs. I thank to Rinus van Maasakkers of the Microlab, TU Delft for helpwith ESM measurements.
I thank the colleagues who have worked on the ‘COMPASS’ project for the meetingsand sparkling discussions. A special thank is due to Jose Delgado Rodrigues, who allowedme to use his illustrations for the cover of my thesis.
I thank to Dutch Technology Foundation (STW) who supported this work. Part ofthis work was done within the framework of the EU project ‘COMPASS’, contract numberEVK4-CT-2001-00047, EC DG-Research. I also thank the user-committee of the STWproject ETN.4448 for their interest in my research.
I thank the company CIMA B.V. in Helmond for the water cutting of the samples.
I thank the Faculty of Physical Chemistry, University of Belgrade, and all my col-leagues for all the understanding and help during the time I spent in Holland.
I thank my family for education, trust and support. I thank Francois Lamy for helpwith the software and for the magnetic personality. At the end I thank all my friends.With your help I managed to exist through this, until now, the most difficult period ofmy life and with your help I have learned a lot about life, people, and myself.
102
Curriculum vitae
Jelena Petkovic, MSc
1995 Graduated at the Faculty of Physical Chemistry, University of Belgrade.Subject: ‘Spectrophotometric and potentiometric determination ofnizatidine in pharmaceutical formulations’.
1995 – 1996 Junior scientist in analytical laboratories,pharmaceutical industry ‘ICN-Galenika’, Belgrade.
1996 – 2000 Teaching assistant at the Faculty of Physical Chemistry,University of Belgrade.
2000 MSc degree at the Faculty of Physical Chemistry, University of Belgrade.Subject: ‘EPR spectroscopy application in ionising radiation dosemeasuring’.
2000 – 2005 Ph.D. research at Eindhoven University of TechnologyDepartment of Applied Physics, group ‘Transport in Permeable Media’.Ph.D. thesis: ‘Moisture and ion transport in layered porous buildingmaterials: A Nuclear Magnetic Resonance study’
2005 Started a company ’LAKO’, which provides project based services in thearea of physicochemical analysis. Specialized fields are material science,conservation and restoration science, and ecological aspects.Web page: www.labkonsalting.nl e-mail: [email protected]
Member of the Physicochemical Society of Serbia
e-mail: [email protected]
103