non-thermal atmospheric pressure plasmas: applications
TRANSCRIPT

Non-Thermal Atmospheric Pressure Plasmas: Applications
Alexander Fridman,
Applications
Alexander Fridman,
Nyheim Chair Professor, Drexel University, Philadelphia, USA
•NON-THERMAL ATMOSPHERIC PRESSURE DISCHARGES
•APPLICATIONS IN FUEL CONVERSION AND HYDROGEN PRODUCTION
•APPLICATIONS IN ENVIRONMENTAL CONTROL AND BIOLOGYAPPLICATIONS IN ENVIRONMENTAL CONTROL AND BIOLOGY
•APPLICATIONS IN MATERIAL TREATMENT
•PLASMA MEDICINE
Applications of Non-Thermal Atmospheric Pressure Plasmas
•APPLICATIONS IN FUEL CONVERSION AND HYDROGEN PRODUCTION
•Plasma Conversion of Natural Gas, Liquid and Solid Hydrocarbons, Production of H2 and SynGas
•Plasma Decomposition of H2S, Production of Hydrogen and Elemental Sulfur
•APPLICATIONS IN ENVIRONMENTAL CONTROL AND BIOLOGY
•Plasma Decontamination of Air and Water Streams from Chemical Pollutants
•Plasma Disinfection and Sterilization of Surfaces, Air and Water Streams
•APPLICATIONS IN MATERIAL TREATMENT
•Plasma Polymerization and Processing of Polymers: Low Pressure vs. Atmospheric Pressure
•Plasma Processing of Electronic Materials
•Plasma in Tissue Engineering1mm
•PLASMA MEDICINE
•Plasma Sterilization of Living Tissue
•Plasma-Stimulated Blood Coagulation
Pl T t t f W d d Ski Di•Plasma Treatment of Wounds and Skin Diseases.
•NON-THERMAL ATMOSPHERIC PRESSURE DISCHARGES: How to Keep them Cool?•Cold Plasmas vs. Transitional (Warm) Plasmas: Specifics of Applications•Examples of Cold and Warm Plasma Sources•Examples of Cold and Warm Plasma Sources•Gliding Arc Tornado and FE-DBD as Examples of the Cold and Transitional (Warm) Plasma Sources

Thermal Plasma Non-Thermal Cold Plasma
Cold Plasmas vs. Transitional (Warm) Plasmas: Specifics of ApplicationsNon-Thermal
thermal ionization
Non Thermal Cold Plasmadirect electron impact ionization
Transitional (Warm) Plasmastepwise electron impact ionization
Aurora
X-ray view of the sun
Aurora
TORNADO
Corona DischargeICP Torch
TORNADO
Gliding Arc
Co o a sc a geICP Torch• High power density
and productivity.
•High selectivity
•High plasma power and density.
•High gas temperature.
•Low gas temperature and very high electron temperature.
•High selectivity
• Relatively low temperature.
•Low selectivity of chemical processes .
•Low power density
•High chemical selectivity.
NonNon--Thermal Thermal Atmospheric Pressure Atmospheric Pressure Cold PlasmasCold Plasmas
APG in He mix.APG in He mix.
Cold PlasmasCold Plasmas
Electron BeamElectron BeamDielectric Barrier DischargeDielectric Barrier Discharge
APG in He mix.APG in He mix.
Floating Electrode (p/np) DBDFloating Electrode (p/np) DBD
Packed Bed DBDPacked Bed DBD10kW Pulsed Corona10kW Pulsed Corona Pulsed CoronaPulsed Corona

Non-Thermal Atmospheric Pressure pTransitional (Warm) Plasmas
Micro APG
TORNADO
Gliding ArcModerate
Pressure MW
NonNon--Thermal Transitional (Warm) Thermal Transitional (Warm) At h i P PlAt h i P Pl
“GLIDING ARC in Flat Geometry”“GLIDING ARC in Flat Geometry”“GLIDING ARC in Flat Geometry”
Atmospheric Pressure PlasmasAtmospheric Pressure Plasmas
GLIDING ARC in Flat GeometryGLIDING ARC in Flat GeometryGLIDING ARC in Flat Geometry
N E ilib i R i
Electron Temperature
~ 1 - 1.5 eV
Maximum ElectronNon-Equilibrium Region Maximum Electron Density (1/cm3)
1012 - 1014
Maximum Gas Temperature
300 - 3000KTemperature
Average Power Density
10 - 300 W/cm3
Fast Equilibrium to Non-Equilibrium Transition
Q i E ilib i R i (1 5 kV)
Ionization Mechanism
Stepwise / Direct
Quasi-Equilibrium Region (1- 5 kV) Discharge Cycle 2 - 10 mSec.
Current (A) 0.01 - 10
Power (kW) 0.1 - 100
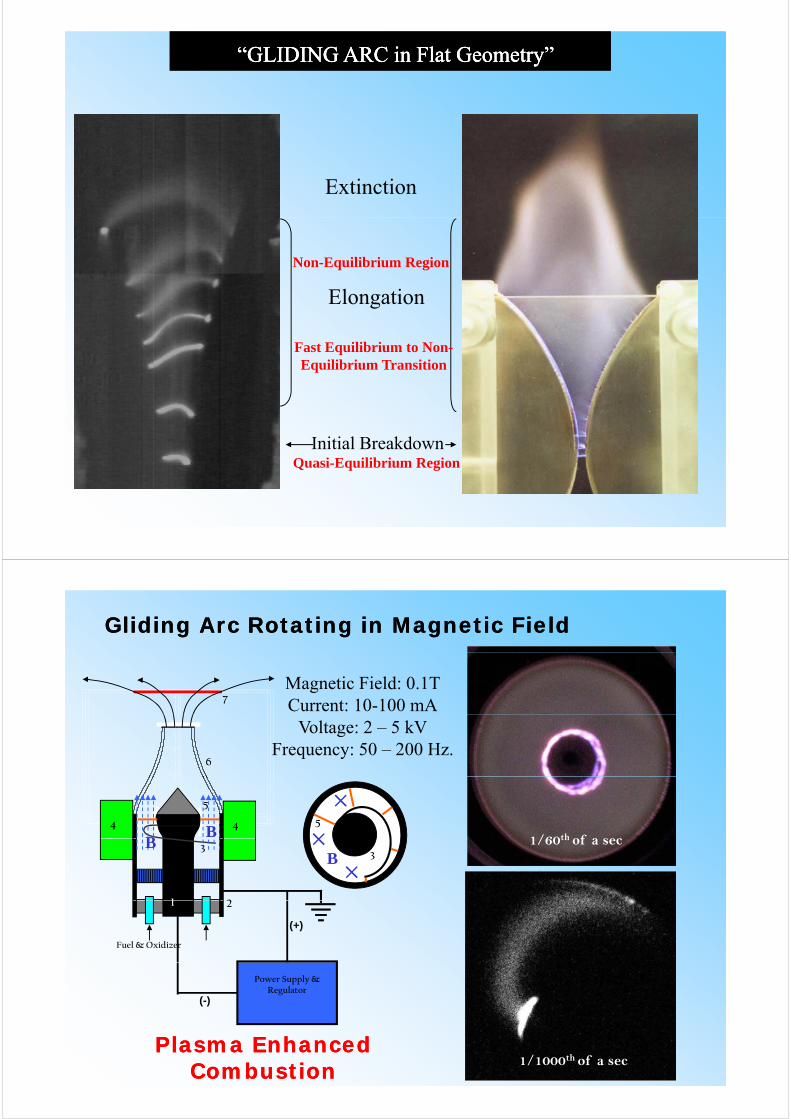
“GLIDING ARC in Flat Geometry”“GLIDING ARC in Flat Geometry”“GLIDING ARC in Flat Geometry”
Extinction
Non-Equilibrium Region
Elongation
Fast Equilibrium to Non-Equilibrium Transition
Initial BreakdownQuasi-Equilibrium RegionQuasi Equilibrium Region
Gliding Arc Rotating inGliding Arc Rotating in Magnetic FieldMagnetic Field
4
4.5
4
4.5
4
4.5 7
Magnetic Field: 0.1TCurrent: 10-100 mA
1.5
2
2.5
3
3.5
1.5
2
2.5
3
3.5
1 5
2
2.5
3
3.5
6
Voltage: 2 – 5 kVFrequency: 50 – 200 Hz.
50
0.5
1
-4 -3 -2 -1 0 1 2 3 4
0
0.5
1
-4 -3 -2 -1 0 1 2 3 40
0.5
1
1.5
-4 -3 -2 -1 0 1 2 3 4
44
5
BB 1/60th of a sec
3
1 2
3BB
1/60th of a sec
(+)
Fuel & Oxidizer
1 2
(-)
Power Supply & Regulator
Plasma Enhanced Plasma Enhanced CombustionCombustion
1/1000th of a sec

“THE GLIDING ARC IN TORNADO”“THE GLIDING ARC IN TORNADO”“THE GLIDING ARC IN TORNADO”
Flat circularElectrode 2Electrode 2
Gas out
Free end of spiral electrode
Plasma reactorSpiral shape
Electrode 1-A
Circular ringElectrode 1-B
Connection wireto power supply
Flow Visualization Camera Speed: 1.normal, 2. 1 msec.
“It Melts a Metal Rod But You Can Touch It”

Applications of Non-Thermal Atmospheric Pressure Plasmas
•APPLICATIONS IN FUEL CONVERSION AND HYDROGEN PRODUCTION
•Plasma Conversion of Natural Gas, Liquid and Solid Hydrocarbons, Production of H2 and SynGas
•Plasma Decomposition of H2S, Production of Hydrogen and Elemental Sulfur
•APPLICATIONS IN ENVIRONMENTAL CONTROL AND BIOLOGY
•Plasma Decontamination of Air and Water Streams from Chemical Pollutants
•Plasma Disinfection and Sterilization of Surfaces, Air and Water Streams
•APPLICATIONS IN MATERIAL TREATMENT
•Plasma Polymerization and Processing of Polymers: Low Pressure vs. Atmospheric Pressure
•Plasma Processing of Electronic Materials
•Plasma in Tissue Engineering1mm
•PLASMA MEDICINE
•Plasma Sterilization of Living Tissue
•Plasma-Stimulated Blood Coagulation
Pl T t t f W d d Ski Di•Plasma Treatment of Wounds and Skin Diseases.
•NON-THERMAL ATMOSPHERIC PRESSURE DISCHARGES: How to Keep them Cool?•Cold Plasmas vs. Transitional (Warm) Plasmas: Specifics of Applications•Examples of Cold and Warm Plasma Sources•Examples of Cold and Warm Plasma Sources•Gliding Arc Tornado and FE-DBD as Examples of the Cold and Transitional (Warm) Plasma Sources
Plasma-Chemical Hydrogen Production
Plasma PO optimal parameters:gas
chromatography
Production
Plasma PO optimal parameters:
CH4+0.5O2 = CO + 2 H2
optimal equivalence ratio = 3.3,
chromatography
p q ,[O2]/ [CH4]=0.6
Preheating temperature = Internal, 750KC i 92%
GLIDING ARC REACTOR
gas sampling
resistor box
Conversion = 92%Electric energy cost :
experimental = 0.06 kWh/m3
modeling EQ = 0.11 kWh/m3
powersupply
g Qmodeling NE = 0.07 kWh/m3
Output Syn-Gas energy = 3.00 kWh/m3
power for 100,000 barrel/day of Liquid Fuel:i t l 4 5 MW
Quartzheater
mixing chamber
experimental = 4.5 MWmodeling EQ = 8.2 MWmodeling NE= 5.2 MW
Oscilloscope & data acquisition
Temperature controller
Flowcontrollers

Gliding Arc Tornado for Fuel Conversion into SynGas
Gas Chromatography GlidingGas Chromatography
resistorbox
Gliding Arc
ReactorGas
Samplingbox
powersupplysupply
Heat Exchanger
Oscilloscope &
Flow Controllers
Exchanger
& data acquisition
Gliding-Arc-Tornado Plasma-Catalytic Methane Partial Oxidation
THE EXPERIMENTAL SETUP
FIRED ATFIRED AT EQUIVALENCE RATIO
4.
Syn-gas Burner
Plasma-Catalytic Reactor

Simulation Vs Experiments The conversion degree: α = ([H2] + [CO]) / 3[CH4]
1
The conversion degree: α = ([H2] + [CO]) / 3[CH4]
0.8
0.9
0.6
0.7
rsio
n D
egre
e
0 4
0.5
0.6
Co
nve
r
0.3
0.4
2.8 3.2 3.6 4 4.4 4.8Equivalence Ratio
Modeling results With plasma
Modeling results without plasmaWith plasma
Experimental results with plasma
without plasma
Experimental results without plasma
Simulation Vs Experiments Electric Energy Cost = W (KW-hr)/ meter cube of
0.18
Electric Energy Cost = Wel(KW-hr)/ meter cube of Syn-Gas (Output Syn-Gas Energy = 3.00 kWh/m3)
0.15
)
0.09
0.12
En
erg
y C
ost
^3
of
syn
gas
)
0 03
0.06
Ele
ctri
c
(KW
hr/
m
0
0.03
2.8 3.2 3.6 4 4.4 4.8Equivalence Ratio
Modeling results
E i t l ltExperimental results

Simulation Vs Experiments Total Energy Cost = (Electric Energy Cost +
10
gy ( gyMethane Energy Cost) per meter Cube of Syn-Gas
8
9
as)
6
7
En
erg
y C
ost
r/m
^3
of
syn
ga
4
5
E
(KW
hr
3
4
2.8 3.2 3.6 4 4.4 4.8Equivalence RatioEquivalence Ratio
Modeling results With plasma
Modeling results without plasmaWith plasma
Experimental results with plasma
without plasma
Experimental results without plasma
Gliding Arc Tornado Plasma Catalysis Highlights:
•Only 2.0% of Total Energy Consumption Required for
Plasma Catalysis Highlights:
Plasma Power
•Electric Energy Cost 0.06 kWh/m3 of syn-gas (energy from gy y g ( gySyn-Gas = 3.0 KW-hr/m3).
•92% conversion at Equivalence Ratio of 3 392% conversion at Equivalence Ratio of 3.3.
•Internal Heat Recuperation (Preheating) at 750 K.
•No soot Deposition.
•Large Specific Production Rates due to Low Residence g pTimes.
•Effective for Higher Hydrocarbon Conversion to Syn-Gas.Effective for Higher Hydrocarbon Conversion to Syn Gas.
•Not Sensitive to Sulfur and Other Impurities.

GAT for on board liquid fuel conversion
H2S Dissociation
with production of H2 and Sulfur
H2S → H2 +S(s), 0.2eV/molWhat has been done 20 years ago…
The most successful project on hydrogen production with the help of plasma (Russia Kurchatov Inst 1980-s (Major
( )
help of plasma (Russia, Kurchatov Inst., 1980-s (Major problem – Microwave, Power, PhDs)
The best results obtained in microwave plasma of moderate pressure: high Te, low T0,
The industrial scale H2S plasma-chemical plant with the power of about 1 MW has been built on the basis of microwave plasma generators near the city of Orenburg (also refinery near Lviv, Ukraine). ( y , )
Similar project started in 1990-s in the USA by the Argon National Laboratory (Harkness & Doctor 1993), was stopped because of the use of MW plasma generators (UOP Mobile)(UOP, Mobile)
The economic estimations of the hydrogen production using this method and taking into account pure sulfur productions were promising.


Conversion Degree and Energy Cost of H2 ProductionConversion Degree and Energy Cost of H2 Production by H2S Dissociation in Non-Equilibrium Plasma

What’s new in the H2S plasma technology?(after 20 years…)
• New discharges: gliding “arc” (Mimicking Microwave)
• New gas-dynamic solutions: reverse-New gas dynamic solutions: reversevortex or “tornado” flow
h f l d i l• GAT – cheaper, powerful and simple alternative to microwave plasma
• New generation of power supplies

H2S dissociation in 8
HH S
GAT2
H2H2S
Heat2
36
Dielectric reactor with
H2
H2S
Sulfur1
7
Dielectric reactor with discharge ignition at the reduced pressure.
H2S
5
7
Problem: quartz-metal sealing
A th ibl l tiAnother possible solution –discharge elongation over the metal reactor wall
Sulfur Sulfur
metal reactor wall
Sulfur
4
Sulfur
Laboratory System for H2S dissociation in the Gliding Arc Tornado
H2, H2O, S
43
6
H2S, H23
5H2, H2O
7
7
H2S
H2S, H2, S
1
H2
8
Scheme of the experimental system: (1) Plasma reactor, (2) Sulfur receiver; (3) Sulfur filter (4) Iron
5S
2
receiver; (3) Sulfur filter, (4) Iron sponge, (5) Water container, (6) Gas chromatograph, (7) Flow meter; (8) Heat exchanger. g

H2S Dissociation
in Gliding Arc Tornadoin Gliding Arc Tornado
(treatment of phosphogypsum)11
H2H2S Process Characteristics:•Gas Temperature 200-400C
Heat2
36
•Electron Temperature 15,000K•H2S Conversion Degree: 95% •Products: Hydrogen Sulfur
H2S
Sulfur
H2
3
4
•Products: Hydrogen, Sulfur•Energy Cost: 0.8 kWh/m3 H2
Sulfur
5
7 •5000 t/day phosphogypsum:•1, 142 t/day of H2S
H2
1
•1,076 t/day S; 67 t/day H2•Power requirement 6.6 MW (min)•Maximum unit power today 1 2 MW
Sulfur•Maximum unit power today 1.2 MW
Plasma Ignitiongand Flame Stabilization

Applications of Non-Thermal Atmospheric Pressure Plasmas
•APPLICATIONS IN FUEL CONVERSION AND HYDROGEN PRODUCTION
•Plasma Conversion of Natural Gas, Liquid and Solid Hydrocarbons, Production of H2 and SynGas
•Plasma Decomposition of H2S, Production of Hydrogen and Elemental Sulfur
•APPLICATIONS IN ENVIRONMENTAL CONTROL AND BIOLOGY
•Plasma Decontamination of Air and Water Streams from Chemical Pollutants
•Plasma Disinfection and Sterilization of Surfaces, Air and Water Streams
•APPLICATIONS IN MATERIAL TREATMENT
•Plasma Polymerization and Processing of Polymers: Low Pressure vs. Atmospheric Pressure
•Plasma Processing of Electronic Materials
•Plasma in Tissue Engineering1mm
•PLASMA MEDICINE
•Plasma Sterilization of Living Tissue
•Plasma-Stimulated Blood Coagulation
Pl T t t f W d d Ski Di•Plasma Treatment of Wounds and Skin Diseases.
•NON-THERMAL ATMOSPHERIC PRESSURE DISCHARGES: How to Keep them Cool?•Cold Plasmas vs. Transitional (Warm) Plasmas: Specifics of Applications•Examples of Cold and Warm Plasma Sources•Examples of Cold and Warm Plasma Sources•Gliding Arc Tornado and FE-DBD as Examples of the Cold and Transitional (Warm) Plasma Sources
VOC Destruction inVOC Destruction in Non-Thermal Plasma
“Non-thermal Plasma Oxidation” = “Thermal Oxidation” – “Heat Energy”
RTO → 0 1 eV/mol Plasma → 10-30 eV/molRTO → 0.1 eV/mol, Plasma → 10-30 eV/mol
Critical VOC Concentration → 0.3-1 % = 3,000-10,000 ppm
Electric Energy → Plasma Electrons →Active Radicals → Selective Oxidation
e + N2 → N2+ + e + e N2
+ + H2O → N2 + H2O+2 2 2 2 2 2
H2O+ + H2O → H3O+ + OH OH + R-H → R- + H2O
R- + O2 → R-O-O- R-O-O- + R-H → R-O-O-H + R-
R O O → CO + H O R O O H → CO + H O
Slide 32
R-O-O- → CO2 + H2O R-O-O-H → CO2 + H2O

HVLC Brownstock Washer Vent EmissionsHVLC Brownstock Washer Vent Emissions
CAS f i “ h i ”NCASI Information “The worst case scenario”suggested by GP
Dimethyl Disulfide 2 ppm 20 ppmDimethyl Disulfide 2 ppm 20 ppm
Dimethyl Sulfide - 1727 ppm
Methanol 83 ppm 2330 ppm
Acetone 3 ppm -
Terpenes 209 ppm 62 ppm
Conditions
Temperature 103°F 150°F
R l ti H idit 100% 100%Slide 33
Relative Humidity 100% 100%
Pulsed Corona, Philadelphia, Chicago
Electron Beam: Moscow
Slide 34Gliding Arc: PhiladelphiaDBD, Packed Bed: PNNL

Pulsed Corona ReactorVoltage pulses: - up to 20 kV
- duration 100 ns / rise time 10 ns- power 25 W / frequency 2000 Hz
Flow rate: - 2 SLMTemperature: - from 70OC to 220OC
Thyratron-
Multiple streamer
dischargesbased
High Voltage
Power Supply
g
Hazardous Central
Slide 35
gas inByproducts out
Central wire External cylinder
Wet Pulsed Corona Reactor
Gas phase byproducts out
Water input
A layer of absorbing material covers theMultiple streamer
discharges
A layer of absorbing material covers the internal wall of the external cylinder, in order to create a continuos water film.
External cylinder
RH non soluble
+OH
R+H O
Central wire
External cylinder R+H2O
+O2
RO2
Thyratron-based
High Voltage Hazardous
Water output2
RO2H soluble peroxides
Slide 36
Power SupplyHazardous
gas in

Wet Pulsed Corona Reactor
University Operation Conditions:
Water Film Flow: 0.01ml/min - 220 ml/min
Gas Flow Rate: 1 SLM
Kurchatov Institute Operation Conditions:Operation Conditions:
Gas Flow Rate: 30 CFM Power: 1kW
Slide 37
VOC Removal in Corona Discharge
Acetone Methanol
80
100
Acetone
80
100
Methanol
60
80
RE
[%
]
60
80
RE
[%
]
20
405 ppm
20 ppm
200 ppm
1000 ppm
DR
20
40 5 ppm 20 ppm 200 ppm1000 ppm
DR
00.02 0.04 0.06 0.08 0.1 0.12
1000 ppm
SEI [kWh/m3]
00.02 0.04 0.06 0.08 0.1
SEI [kWh/m3]
• no organic compounds are produced as byproducts of the oxidation process;
Slide 38
oxidation process;

VOC Removal in Corona Discharge
Alpha-Pinene Dimethyl Sulfide
80
100
90
100
60
RE
[%
]
80
90
RE
[%
]
20
40 150 ppm400 ppm800 ppm
DR
70< 300 ppm400 ppm1000 ppm
DR
00.02 0.03 0.04 0.05 0.06 0.07 0.08 0.09 0.1
SEI [kWh/m3]
60
0.02 0.03 0.04 0.05 0.06 0.07 0.08 0.09 0.1
SEI [kWh/m3]
• acetone and methanol are the main organic byproducts from destruction of Alpha-Pinene and Dimethyl Sulfide respectively
Slide 39
destruction of Alpha Pinene and Dimethyl Sulfide respectively (about 5-10%);
VOC Removal in Wet Corona
• the presence of the water film allows to
100
Wet Coronaincrease VOC removal by synergetic effect of
80
90
%]
Corona
plasma and water absorption;
70
DR
E [
Methanol = 1000 ppmMethanol = 1000 ppm
Corona
Water flow rates:
60
Acetone = 200 ppm
• 0.4 ml/min for methanol
0.02 0.03 0.04 0.05 0.06 0.07 0.08 0.09 0.1
SEI [kWh/m3] • 1 ml/min for acetone
Slide 40

Wet Corona is the Championfor Brownstock Washer Vent Emission
Destruction – Removal Efficiency – 98-100%
Treatment
y
Byproducts – No Byproducts in Gas Phase
Energy Price: Regular conditions – 10 W-h/m3
Worst Case Scenario – 20 W-h/m3
For 25,000 SCFM Brownstock Washer stream: Power – 500 kW
W t 25 l/ iWater – 25 gal/min
Advantages: 1. Long Period No-Maintenance, No Catalyst, No Regeneration
2. Low Inertia, Easy Adjustable for Different VOC Concentration
3. No Byproducts, No Emission of Sulfur Compounds
Slide 41
4. Low Cost
Mobile Environmental Laboratory
Slide 42

Control room boundaryPneumatic and hydraulic scheme
ScrubberCorona
discharge volume
Mist Separator
Automatic regulator
BlowerCorona control
itWater pump
Trailer boundary
Corona setup boundary
Treated air flow
unit
Treated air flowCompressed air and pressure control
line Clean and technical water
Waste water
Spray or air atomizing nozzles
Flow metersVacuum-gauge
Slide 43
Waste water
Control lines TapsPressure regulator
8 kW Pilot Pulsed Corona Discharge
Slide 44

Mobile Environmental Laboratory
Slide 45
Air Sterilization Using Non-thermal Plasma
Objective: Sterilize indoor air containing bio-aerosols at standard HVAC conditions (room temperature, pressure, high flow rates) using non thermal plasmaflow rates) using non-thermal plasma
Pathogen Detection & Remediation Facility (PDRF)•Sealed air flow system (250 liters 25 l/sec)Sealed air flow system (250 liters, 25 l/sec)•3 Non-thermal Plasma Reactors
–Dielectric Barrier Discharge (DBD)–Magnetically-rotated Gliding Arc
Influenza A virus cluster
–Pulsed Corona•Air sampling system
Virus size: 80-120 nm
Cyanobacteria – non-pathogenic unicellular bacteria (algae) used for initial tests.
Influenza A virus generally considered more difficult toInfluenza A virus – generally considered more difficult to destroy & requires many safety precautions for experiments
Spores – B. Subtilis B. ThurengiensisCyanobacteriaSize: ~1 micron
Slide 46
p g

Air Sterilization Experiments
Interchangeable Plasma Devices:
p
ev ces:DBD, Gliding Arc
Sealed Air Flow System
Air Sampling Equipment
AIR FLOW
Collison Nebulizer
BioSafety Level 2 Fume HoodCentrifugal
Blower
AIR FLOW
Slide 47
Pathogen Detection and Remediation Facility (PDRF)
Pathogen Detection and Remediation Facility (PDRF)Pathogen Detection and Remediation Facility (PDRF)
Slide 48

Dielectric Barrier Discharge (DBD) for Air SterilizationDielectric Barrier Discharge (DBD) for Air Sterilization
Electron Avalanche
150 cm (6.
Avalanche
.5”)
Viruses pass between wires through plasma
Area of DBD plasma region: ~104cm2
Quartz Capillary covers high voltage wire
Maximum Voltage: 18.4 kV
1.5 mm Discharge Gap
Slide 49
Maximum Voltage: 18.4 kV Operating Frequency: 6.8 kHz
Power Consumption: ~160 WattsReactor Inlet
View
Magnetically Rotated Gliding Arc for Air SterilizationMagnetically-Rotated Gliding Arc for Air Sterilization
Plasma treated air flow
Design PrototypeN N In Operation
Arc starts at the shortest gap and glides along the
spiral to stabilize at
S S
[+[p
constant distance position between electrodes
Outer pipe di t 8”
10 kVDC Power
Supply
[+]
[–]
Slide 50Contaminated air flow
Top View
diameter: 8”Arc Rotation Frequency: 20 Hz
Power ~ 1KW

DBD Air SterilizationPlasma Air Sterilization experiments
DBD Air Sterilizationp
1.00E+06
nit
s r
1 00E+03
1.00E+04
1.00E+05
min
g U
nre
of
Air
Expt 1
Expt 2First Pass Through Plasma
1.00E+01
1.00E+02
1.00E+03
on
y F
or
cfu
)/L
itr p
Expt 3
ControlComplete Inactivation
1.00E+00
0 2 4 6 8 10 12
Co
lo (c
Time (min)
R lt f th i t ili ti i t S l t k b f dResults of the air sterilization experiments. Samples taken before and after plasma exposure. Complete inactivation is observed at the third
sample.
Water Sterilization SystemWate Ste ili ation System
Spark in Water Corona in Water

Comparison of inactivation efficiency of d ff f d hdifferent types of discharges in water
Comparison of inactivation efficiency of different types of discharges in water(in all cases average discharge power was the same)
Plasma Sterilization of WaterLOG REDUCTION VS. ENERGY
FOR DIFFERENT BACTERIAL CONCENTRATION
A low D-value of 125 J/L was obtained for an initial
t ti fconcentration of 104 CFU/ml of bacterial solutionbacterial solution.
The D-value
Log reduction vs Energy for different concentrations in
decreased with a decrease in b t i lLog reduction vs. Energy for different concentrations in
case of spark discharge plasma treatment (distance 0.5 cm, energy in pulse 2J)
bacterial concentration.

Gliding Arc & DBDGliding Arc & DBD for sterilization of fruits/vegetables
Contaminated apples were treated with Gliding Arc and Dielectric Barrier Discharge (DBD)
Microorganism: Listeria innocua (surrogate for L. monocytogenes)
DBD
99% reduction after 2 minutes of treatment;99% reduction after 2 minutes of treatment;
Complete after 6 min
Glidi AGliding Arc
96% reduction after 4 minutes of treatment (current: 260mA) (discharges along the apple)260mA) (discharges along the apple)
Anthrax (BA spores)( spo es)
Gram positive, spore-forming bacteriap , p gCutaneous – most common (95% of cases)Inhalational – 18 U.S. cases in 20th century
Gastrointestinal – difficult to diagnose, 50% fatal
C be e d e il th h iCan be spread easily through airPersists in the environment for decades
Dry spores are very resistant to destruction by conventional sterilization methods
Experimental Results: Floating DBD sterilization
Bacillus anthracis spores – dimensions 1-1.5 X 3-10 microns
Original concentration of dry spores 1 mln per microgram Treatment time 2, 4, 6 minSterilization efficiency 100%Substrate temperature - room

Surface Sterilization and Disintegration of Microorganismsg
• Most sterilization efforts focus on the inactivation of
i i
Moogega Cooper
microorganisms
• NASA Goal: Surface sterilization of spacecraftsterilization of spacecraft materials with complete disintegration of spores and bacteria.
• Sterilization by cold ambient-air plasma has been successfullyplasma has been successfully demonstrated to lyse and completely disintegrate FE-DBDmicroorganisms
Efficiency of FE-DBD Plasma Treatment of B subtilis SporesTreatment of B. subtilis Spores
(Morphological Changes)100% sterilization after > 2 min DBD plasma
treatment (temperature 35 -45C)
Before 2 min
SEM images

Deinococcus Characteristics• Typically grows as clusters of two cells (diplococci) in the
early stages of growth and as clusters of four cells (tetracocci) in the late stages of growth
• Withstands extreme heat and Cold– Cultures grown at 30°C that have been
rapidly shifted to 52°C can be held at that temperature for up to 40 minutes with no loss of viabilitytemperature for up to 40 minutes with no loss of viability.
• Withstands Dehydration• Withstands Vacuum
E t ( 10 6 P ) d d ll– Exposure to space vacuum (~ 10-6 Pa) decreased cell survival by four orders of magnitude.
• Withstands Acid• Withstands Radiation• Withstands Radiation
– An instantaneous dose of up to 5,000 Gray with no loss of viability
– 100 rad = 1 gray (Gy) = 1 J/kgg y ( y) g– An instantaneous dose of up to 15,000 Gray with 37%
viability• 10 Gy is sufficient to kill a human
60 G ili l f E li• 60 Gy sterilizes a culture of E. coli
"Deinococcus radiodurans." Wikipedia, The Free Encyclopedia. 9 Nov 2006, 18:25 UTC. Wikimedia Foundation, Inc. 10 Nov 2006 <http://en.wikipedia.org/w/index.php?title=Deinococcus_radiodurans&oldid=86761044>.
Viability of Plasma Treated D. radioduransBefore Before
20 min DBD30 min DBD 20 min DBD
• Initial concentration of D radiodurans: 10E8• Initial concentration of D. radiodurans: 10E8
• Current: 0.25 Amps
• Temperature was 26 OC on average and did not exceed 30 OC

Efficiency of FE-DBD Plasma Treatment of Deinococcus di d i W t d D C ditiradiodurans in Wet and Dry Conditions
1 00E+06
1.00E+07
Expt 1 Expt 2
Dry D. radiodurans Wet D. radiodurans
1 00E+05
1.00E+04
1.00E+05
1.00E+06
cocc
us
(cfu
/ml)
1 00E 02
1.00E+03
1.00E+04
1.00E+05
oco
ccu
s(cf
u/m
l)
1.00E+01
1.00E+02
1.00E+03
Via
ble
Dei
no
c
1.00E+00
1.00E+01
1.00E+02
0 10 20 30 40 50 60 70
Via
ble
Dei
no
1.00E+00
0 5 10 15 20 25 30 35Time (min)
Time (sec)
FE-DBD
Applications of Non-Thermal Atmospheric Pressure Plasmas
•APPLICATIONS IN FUEL CONVERSION AND HYDROGEN PRODUCTION
•Plasma Conversion of Natural Gas, Liquid and Solid Hydrocarbons, Production of H2 and SynGas
•Plasma Decomposition of H2S, Production of Hydrogen and Elemental Sulfur
•APPLICATIONS IN ENVIRONMENTAL CONTROL AND BIOLOGY
•Plasma Decontamination of Air and Water Streams from Chemical Pollutants
•Plasma Disinfection and Sterilization of Surfaces, Air and Water Streams
•APPLICATIONS IN MATERIAL TREATMENT
•Plasma Polymerization and Processing of Polymers: Low Pressure vs. Atmospheric Pressure
•Plasma Processing of Electronic Materials
•Plasma in Tissue Engineering1mm
•PLASMA MEDICINE
•Plasma Sterilization of Living Tissue
•Plasma-Stimulated Blood Coagulation
Pl T t t f W d d Ski Di•Plasma Treatment of Wounds and Skin Diseases.
•NON-THERMAL ATMOSPHERIC PRESSURE DISCHARGES: How to Keep them Cool?•Cold Plasmas vs. Transitional (Warm) Plasmas: Specifics of Applications•Examples of Cold and Warm Plasma Sources•Examples of Cold and Warm Plasma Sources•Gliding Arc Tornado and FE-DBD as Examples of the Cold and Transitional (Warm) Plasma Sources

Interaction and Structuring of gDBD Microdischarges
ENHANCEMENT of OSTEOBLAST ATTACHEMENT andATTACHEMENT and
PROLIFERATION on 3D POLY (ε-CAPROLACTONE) SCAFFOLD
Precision Extrusion Deposition S t
Dielectric BarrierDi h S t
CAPROLACTONE) SCAFFOLDEda D. Yildirim
System Discharge System
PlasmaSample
250 μm
300 μm
15 mm×15mm×2mm(W×L×H)
7F2 Mouse osteoblast cells
Cell Suspension Seeded on Scaffoldsosteoblast cells

Surface wettability and functionalization are increased with plasma treatmentincreased with plasma treatment
>C=OFTIR-ATR
I d i>C=O
Increased in carboxyl and carbonyl
Contact Angle MeasurementSurface wettability is increased with
plasma treatment
functionalities with prolonged treatment time p
1790 1770 1750 1730 1710 1690 1670 1650 1630 1600
Wavenumber
CELL PROLIFERATION on PLASMA
TREATED SCAFFOLDSLive/Dead Essay with
untreated
yFluorescence Microscopy
550000
600000
650000
er
untreated
1 min
3 min
5 min
400000
450000
500000
Cell
Nu
mbe
250000
300000
350000
5 10 15
5-min treated
Incubation Time (hours)
Increased cell proliferation with plasma treatment

Plasma BioPrinter
1mm
Microplasmas for Micropatterning
Minimal current of glow discharge - 0.5 mA (below – dark):
•Cathode spot size - 90 mkm
•Anode spot size (channel diameter) - 30 mkm
•Diffusion radius for radicals 30 mkm•Diffusion radius for radicals - 30 mkm
Lower sizes – pulses, nano-corona in dense media
10 μm tungsten wire (Cathode)
Droplets condensed on surface from breath
800 μm
50 - 60 μm
800 μm
100 μm25 - 30 μm50 60 μ
800 μm
Silicon substrate
Silicon Oxidation

Applications of Non-Thermal Atmospheric Pressure Plasmas
•APPLICATIONS IN FUEL CONVERSION AND HYDROGEN PRODUCTION
•Plasma Conversion of Natural Gas, Liquid and Solid Hydrocarbons, Production of H2 and SynGas
•Plasma Decomposition of H2S, Production of Hydrogen and Elemental Sulfur
•APPLICATIONS IN ENVIRONMENTAL CONTROL AND BIOLOGY
•Plasma Decontamination of Air and Water Streams from Chemical Pollutants
•Plasma Disinfection and Sterilization of Surfaces, Air and Water Streams
•APPLICATIONS IN MATERIAL TREATMENT
•Plasma Polymerization and Processing of Polymers: Low Pressure vs. Atmospheric Pressure
•Plasma Processing of Electronic Materials
•Plasma in Tissue Engineering1mm
•PLASMA MEDICINE
•Plasma Sterilization of Living Tissue
•Plasma-Stimulated Blood Coagulation
Pl T t t f W d d Ski Di•Plasma Treatment of Wounds and Skin Diseases.
•NON-THERMAL ATMOSPHERIC PRESSURE DISCHARGES: How to Keep them Cool?•Cold Plasmas vs. Transitional (Warm) Plasmas: Specifics of Applications•Examples of Cold and Warm Plasma Sources•Examples of Cold and Warm Plasma Sources•Gliding Arc Tornado and FE-DBD as Examples of the Cold and Transitional (Warm) Plasma Sources
Slide 70

PLASMA MEDICINEPLASMA MEDICINE
Floating Electrode DBDFloating-Electrode DBD
1010--30 kHz30 kHz1010--30 kV30 kV
0.50.5--5mm gap5mm gap0 10 1--10 cm10 cm22 electrodeelectrode0.10.1--10 cm10 cm electrodeelectrode
1 W/cm1 W/cm22 plasma powerplasma power
Slide 72

DBD Tissue Treatment Electrodes
“Round” – 25mm diameter,any surface
“Wand” – 3mm tip,any small surface
“Roller” – 50cm width,large flat surface
Electrode modelElectrode model
FEFE--DBDDBD
Slide 73
Living TissueLiving Tissue
Tissue Sterilization
DBD: 12 KHz, 22KV,1W/cm2,
Atmospheric airSlide 74
Atmospheric air

Tissue SterilizationComplete sterilization in 4 seconds of DBD
treatment from skin flora:
St tStreptococcus (spherical gram-positive bacteria occurring in pairs or chains; cause e.g. scarlet fever and
tonsillitis)
St h l
Before DBD Treatment
Staphylococcus (spherical gram-positive parasitic bacteria that tend to form irregular colonies; some cause boils
or septicemia or infections)
YeastYeast (common name for an artificial assemblage of higher fungi which have temporarily or permanently
abandoned the use of hyphal thalli; they are unicellular, and
i d i i ll b b ddi fi i )vegetative reproduction is generally by budding or fission)
No Gross (visible) or microscopic tissue damage in up
i
to 5 minutes of DBD treatment
Tissue sources: cadaver abdomen, leg, and arm skin,
Slide 75
After 1-minuteDBD Treatment
gplastic surgery discards, wound tissue, and other
tissue samples.
Tissue Sterilization
No treatment controlNo treatment control
No treatment 15 DBD 15 DBDNo treatment 15 sec DBD 15 sec DBD
iSlide 76
Tissue Source: cadaver abdomen (stomach)
No treatment 5 min DBD 5 min DBD

Skin ToxicityComplete Sterilization in 4 seconds of
plasma
No tissue damage in 40 seconds of plasma and animal stays alive and well
Up to 10 minutes of continuous FE-DBD plasma
16 seconds of16 seconds ofFE-DBD treatment
40 seconds of
Slide 77
40 seconds ofFE-DBD treatment
Non-Destructive Blood Coagulation“…He is holding an electric cauterizing wand, which looks like a
g
cheap bank pen on a cord but functions like a scalpel. The wand b th t d b th t thboth cuts and burns, so that as the incision is made, any vessels that are severed are simultaneously meltedsevered are simultaneously melted shut. The result is that there is a good deal less bleeding and a good deal more smoke and smell. It’s not a bad smell, but simply a seared-meat sort of smell ”meat sort of smell…”
- Mary Roach in “Stiff. The Curious Lives of Human Cadavers”
Slide 78
Human Cadavers .

Non-Destructive Blood Coagulationg
Electrocautery/coagulation: Non-thermal Plasma:ec oc u e y/co gu o :
• 10,000+ °C – thermal damage
• Severe Pain – anesthetics required
No e s :
• Room temperature
• No painSevere Pain anesthetics required
• Smoke – endoscopic surgery is difficult or impossible
No pain
• No evaporation
• Wound remains wetp
• Post-operative healing problems –too much tissue damage
Wound remains wet
• Smell & look of burnt tissue –generates patient complaints
Slide 79
In Vitro Blood CoagulationIn-Vitro Blood Coagulation
Slide 80DBD: 12 KHz, 22KV, 1W/cm2, Atmospheric air

In-Vitro Blood CoagulationV o ood Co gu o
Gross/Visual examination:Gross/Visual examination:
Normal whole blood treated for 15 seconds completely coagulates in 2 minutes.
Untreated sample coagulates in 13 minutesSlide 81
Untreated sample coagulates in 13 minutes
“In-Vivo” Blood Coagulation
Slide 82DBD Treatment of Spleen (cadaver tissue).

“In-Vivo” Blood Coagulation
Slide 83DBD Treatment of Placenta (explanted tissue).
“In-Vivo” Blood Coagulation
epistaxis

In-Vitro Blood Coagulation
40 0
45.0
50.0
ec)
Prothrombin (Factor II) time
30.0
35.0
40.0in
Tim
e (s
e
Normal Whole Blood
H hili A Bl d
Na-Citrated Blood (with anti-coagulant binds Ca2+
20.0
25.0
Pro
trim
bi Hemophilia A Bloodanti-coagulant, binds Ca +,
Factor IV)
10.0
15.0
0 20 40 60 80 100 120
DBD Treatment TIme (sec)
Prothrombin Time (PT) analysis:Prothrombin Time (PT) analysis:
Prothrombin (Factor II) time of residual blood
Slide 85increases 3 times after 120 seconds of DBD
treatment.
Blood Coagulation Mechanismg
Natural CoagulationMechanism
BloodBloodVesselActivated plateletsActivated platelets
Resting plateletsResting platelets
Slide 86

CoagulationCascade
Slide 87
Blood Coagulation Modeling
Plasma generation ofCa2+ (Factor IV)
Phospholipid oxidation
( )
Phospholipid oxidation
Slide 88

Blood Coagulation Modeling
Natural Coagulation
1 W/cm2
DBD lDBD plasmaProthrombin Kinetics
(Clips Fibrinogen to Fibrin,( p g ,which provides for platelet aggregation)
Slide 89
Treatment of Skin Diseases
AliveAlive
DeadDead DBD Plasma Inactivation ofCutaneous Leishmaniasis
Slide 90
20 seconds of DBD Cutaneous Leishmaniasis

Leishmania Promastigote InactivationLeishmania Promastigote Inactivation
Slide 91
Treatment of Skin Diseasese e o S se ses20-second treatment: near-complete promastigote inactivation
)
4 00E+08
5.00E+08
ion
(1/
ml
3.00E+08
4.00E+08
cen
trac
ti
1.00E+08
2.00E+08
go
te c
on
0.00E+00
rom
asti
g
alive: dead: total:
P
Before treatment 3.48E+08 2.36E+07 3.72E+08
Plasma-treated 8.40E+06 3.80E+08 3.89E+08
Slide 92DBD Plasma Inactivation of Cutaneous Leishmaniasis

Treatment of Skin Diseases
DeadDead
20 seconds of DBD
Macrophage inactivation after 5 minutes of treatment:
Inactivates 100% ofLeishmania
P ti tSlide 93
Macrophage inactivation after 5 minutes of treatment:70% alive (inactivated macrophages are circled).
Promastigotes
Plasma Treatment of Melanoma Cancer CellsPlasma Treatment of Melanoma Cancer Cells
% f d d M l ll ft l% of dead Melanoma cells after plasma treatment
120
60
80
100
120
%
0.33
0 13
0
20
40
60% 0.13
0
0
0 sec 10 sec 20 sec 30 sec
dose of plasma
Slide 94

Apoptosis: Programmed Cancer Cell Death
15+15 sec in 24 hrs30 sec in 24 hrs
% of dead cells to control
15 15 sec in 24 hrs30 sec in 24 hrs
9000
10000
15+15 sec in 1 hr 30 sec in 1 hr 15+15 sec in 4 hrs5000
6000
7000
8000
% 15+15 sec in 1 hr 15 15 sec in 4 hrs30 sec in 4 hrs
2000
3000
4000
5000%
0
1000
2000
Melanoma cells continue dying even 24 hours after treatment
15+15 sec in 1 hr 30 sec in 1 hr 15+15 sec in 4 hrs
30 sec in 4 hrs 15+15 sec in 24 hrs 30 sec in 24 hrs
Slide 95
Melanoma cells continue dying even 24 hours after treatment
Apoptosis in Melanoma Cells
No PlasmaCell ApoptosisCell Apoptosis
TUNEL flow cytometry test: development of apoptosis in cell culture treated with low dose of plasma (5sec).
5 seconds of FE-DBD
TUNEL assay: development of apoptosis in cells culture 24+hrs after treatment with 5
d f l
Apoptosis begins developing at the end of day 1, reaches it maximum at day 2
Slide #96
seconds of plasma.Blue - normal cellsGreen- apoptotic cells

Wound Healing: Suppurated Burns Before Treatment
Phlegmonous Eyelid DefeatPhlegmonous Eyelid Defeat
Before TreatmentAfter 7 days of plasma therapy (5 sessions).
Wo nd Healing: Broad Necrotic S pp rated Ulcer
6 plasma treatments
Wound Healing:Trophic Venous Ulcers
Broad Necrotic Suppurated Ulcer(Diabetic Peripheral Neuropathy)
Before 21 Days 2 Months Before 5 Months (3 course, Treatment
y(10 sess.) (30 sess.) Treatment
( ,12 sess. per course)
FE-DBD Power Supplies
Sterilization ElectrodeSterilization Electrode
TransformerTransformer
Waveform GeneratorWaveform Generator
AmplifierAmplifierAmplifierAmplifier
StateState--ofof--thethe--art power supplyart power supply
Slide 98Portable power supplyPortable power supply
