no margin, no mission? a field experiment on incentives for public
TRANSCRIPT

Journal of Public Economics 120 (2014) 1–17
Contents lists available at ScienceDirect
Journal of Public Economics
j ourna l homepage: www.e lsev ie r .com/ locate / jpube
No margin, no mission? A field experiment on incentives for publicservice delivery
Nava Ashraf a,b,⁎, Oriana Bandiera c,d, B. Kelsey Jack b,e
a HBS, United Statesb NBER, United Statesc Department of Economics, LSE, United Kingdomd STICERD, LSE, United Kingdome Department of Economics, Tufts University, United States
⁎ Corresponding author at: Harvard Business School, BBoston MA, 02163. Tel.: (617) 495-5058; fax: (617) 495-6
E-mail addresses: [email protected] (N. Ashraf), [email protected] (B.K. Jack).
http://dx.doi.org/10.1016/j.jpubeco.2014.06.0140047-2727/© 2014 Published by Elsevier B.V.
a b s t r a c t
a r t i c l e i n f oArticle history:Received 31 May 2013Received in revised form 24 June 2014Accepted 25 June 2014Available online 8 August 2014
JEL classification:J33O15M52D82
Keywords:Financial incentivesNon-monetary rewardsPro-social motivationPublic service delivery
Weconduct a field experiment to evaluate the effect of extrinsic rewards, both financial and non-financial, on theperformance of agents recruited by a public health organization to promote HIV prevention and sell condoms. Inthis setting: (i) non-financial rewards are effective at improving performance; (ii) the effect of both types ofrewards is stronger for pro-socially motivated agents; and (iii) both types of rewards are effective when theirrelative value is high. The findings illustrate that extrinsic rewards can improve the performance of agentsengaged in public service delivery, and that non-financial rewards can be effective in settings where the powerof financial incentives is limited.
© 2014 Published by Elsevier B.V.
1. Introduction
Understanding what motivates individuals to devote time andeffort to work endeavors is a question that lies at the core of thesocial sciences. The answer is crucial both to understanding observedbehavior and to designing incentive mechanisms that align theindividuals' interests with the interests of the organization forwhich they work. As a consequence, the design of optimal incentivecontracts has been the subject of extensive theoretical and empiricalresearch.
Empirical contributions, however, mainly focus on the effect offinancial rewards in settings in which employee effort only benefitsthe employer (Bandiera et al., 2011; Oyer and Schaefer, 2011). Muchless attention has been paid to incentives in organizations, such asgovernmental and non-governmental organizations, which hire agents
aker Library 443, Soldiers Field,[email protected] (O. Bandiera),
to perform pro-social tasks; namely, tasks that create benefits enjoyedby those other than the employer and employees. A notable exceptionis the literature on the effect of monetary incentives on teachers'performance, which finds markedly mixed results (Duflo et al., 2012;Fryer, 2013; Lavy, 2002; Glewwe et al., 2010; Muralidharan andSundararaman, 2011).
The theoretical literature suggests reasonswhy the effect of extrinsicrewards on performance in private and pro-social tasks might differ.Mission-driven organizations benefit from matching with workerswhose interests are aligned with the mission, and these individualsmight respond less to incentives or even deliver a weaker performanceif incentives displace other sources of motivation. In particular, to theextent that agents aremotivated by the externalities generated throughpro-social tasks, this motivation may interact positively or negativelywith extrinsic incentives (Benabou and Tirole, 2003, 2006; Besley andGhatak, 2005; Dixit, 2002).
Informed by these insights, we design a field experiment to evaluatethe effect of extrinsic rewards on the performance of agents in a publichealth organization. The experiment is designed to compare the effectsof monetary and non-monetary incentives, as both are commonly used
2 N. Ashraf et al. / Journal of Public Economics 120 (2014) 1–17
in practice,1 but their relative effectiveness for public service delivery isunderstudied.2 The experiment is designed to measure the interactionbetween extrinsic rewards and the pro-social motivation of the agents,and to test whether this interaction differs between financial and non-financial rewards. We collaborate with a public health organizationbased in Lusaka, Zambia, which recruits and trains hairdressers andbarbers to provide information about HIV prevention and sell condomsin their shops.
The experiment randomly assigns 205 distinct geographical clusterscontaining 1222 agents to one of four groups that receive differentrewards based on condom sales. Agents in the control group receive norewards, while agents in the three treatment groups receive financialmargins at the bottom and the top of the feasible range, and non-financial rewards, respectively. The smaller and larger financial-margintreatments pay a 10% and 90%margin on each condom sale, respectively,whereas the non-financial scheme (“star” treatment) gives agents a“thermometer” display, showing condom sales and stamps, with onestar stamp for each sale.
The first part of our empirical analysis shows that non-financialrewards are effective at promoting sales: agents in the star treatmentsell over twice as many condoms as agents in any other group, onaverage. We track agents' performance over one year, and thus canseparate responses due to the novelty of the program from long-runresponses. The estimates are stable throughout the one-year period,thus ruling out novelty effects. The magnitude of the estimated treat-ment effects is such that, had all agents been offered non-financialincentives, they would have sold 23,102 condoms, compared to10,732/12,006/12,562 had they all been offered the volunteer contract,small financial margins and large financial margins, respectively.
That financial incentives are ineffective might be due to earningsfrom condom sales being a small fraction of overall earnings, becauseboth demand for the product and earnings from each sale are low.Since demand for the product and the cost of effort are orthogonal totreatment, our results imply that the agents' marginal utility of stars ishigher than their marginal utility of money, given their initial endow-ments of money and stars. In general, we expect there to be a thresholdlevel of financial rewards such that all rewards above that thresholdwould bemore effective at eliciting effort than non-financial incentives,and indeed, as we describe below, we find suggestive evidence thatfinancial rewards are effective for the poorest agents in the sample, forwhom the relative value is higher.
The second part of the analysis explores mechanisms driving theestimated treatment effects.We begin by assessingwhether treatmentsdiffer because they make the agents exert different levels of effort, orbecause they affect demand directly. We provide three pieces ofevidence on thismatter. First, we show that agents in the star treatmentbehave differently on dimensions correlated with sales effort, such asdisplaying promotional materials and filling in sales records. This rulesout that the star treatment increases sales exclusively by increasingdemand. Second, we survey a random sample of customers to probethe effectiveness of different promotional materials; most surveyedcustomers recall and correctly describe the promotional posters givento agents in all treatments, but only a negligible minority mentionsthe thermometer that is only given to agents in the star treatment.Third, we implement a “placebo” star-reward treatment; namely, werandomly provide a subsample of salons in the control and financial
1 Many organizations, ranging from large corporations to NGOs, use a range of non-financial performance rewards to motivate their employees. For example, Larkin (2011)uses observational data to study a non-linear incentive scheme that provides employeesof a software firmwith a “gold star” and company-wide recognition if theymeet an annualperformance threshold. His evidence suggests that employees forgo 27,000 USD worth ofrevenue to obtain the non-financial reward.
2 Kube et al. (2012) compare the effect of monetary and non-monetary rewards on theperformance of agents engaged in a task (book sorting) that has no pro-social elements.They find that the non-monetary reward, a water bottle, is more effective than the equiv-alent cash amount.
reward treatments with a thermometer that, to a third party, looksidentical to the treatment thermometer, and hence is an equallyeffective advertising tool, but carries no reward for the agent, as thestars stamped on it represent the average sales in the area. We findthat the placebo star treatment has no effect on sales, which allays theconcern that the star treatment increases sales by stimulating demand.
The next step of our analysis provides evidence on the interactionbetween extrinsic incentives and intrinsic motivation for the cause. Tothis purpose, we measure motivation through an adapted dictatorgame where agents can make a donation to an existing charity thatprovides care to HIV/AIDS patients.Wefind that the donation is a strongpredictor of sales performance; agents who donate more than themedian sell 51% more condoms than the average agent in the controlgroup. We find that agents who are motivated by the cause respondmore strongly to financial rewards, which is in direct contradiction tothe hypothesis that extrinsic incentives crowd out intrinsic motivation.We also find a positive interaction between high donation andnon-financial rewards, suggesting that extrinsic incentives are comple-mentary to pro-social motivation in this context.
Findings from the final step of our analysis reveal that the pointestimates of responses to both financial and non-financial incentives arelarger when the utility associated with financial and non-financial re-wards, respectively, is high. In particular, our results suggest thatfinancial incentives increase sales for the poorest agents in our sample,for whom the relative value of rewards is higher. To measure the relativevalue of non-financial incentives, we exploit the intuition that thesemight be more valuable when they are visible to a larger peer group. Toimplement this test, we exploit the naturally occurring variation in thenumber of salons in each neighborhood. We find suggestive evidencethat the marginal effect of non-financial incentives is increasing in thenumber of neighboring salons that also received non-financial incentives,whereas the response to the other incentive treatments is not affected bythe number of neighboring salons that receive the same treatment.
Our findings contribute to the broad literature evaluating the effectof incentives in for-profit firms and to the nascent literature studyinghow to motivate agents engaged in pro-social activities (see, for exam-ple, Gneezy and Rustichini, 2000; Lacetera et al., 2011; Meier, 2007;Mellström and Johannesson, 2008). Most of the related literature onpublic services delivery focuses on performance incentives for teachers(Duflo et al., 2012; Fryer, 2013; Lavy, 2002; Glewwe et al., 2010;Muralidharan and Sundararaman, 2011) with two recent exceptions,both of which analyze the delivery of health services. Miller et al.(2012) evaluate the effect of providing financial incentives to schoolprincipals to reduce anemia among students in rural China and find amodest effect. Olken et al. (forthcoming) study an intervention thatlinks the disbursement of aid to the performance of health services atthe village level in Indonesia and find that linking aid to performanceimproves health indicators.3 In the context of this literature, our paperprovides thefirstfield comparison ofmonetary and non-monetary incen-tives and how these interact with motivation for public services delivery.
The rest of the paper proceeds as follows. Section 2 describes thecontext, data and research design. Section 3 discusses the identificationstrategy. Sections 4 and 5 present the findings, and Section 6 concludeswith a discussion of costs and benefits of the different schemes and theexternal validity of our findings.
2. Context, data and research design
2.1. Context
The field experiment was run in collaboration with the Society forFamily Health (SFH), a public health organization based in Lusaka,
3 Related research examines the effect of salary levels on selection into the health sectorand performance (Propper and Van Reenen, 2010; Dal Bó et al., 2013).

7 SFH representatives were instructed to stop attempting to visit stylists who could notbe found for three consecutive visits, i.e., three consecutive months. By the end of the ex-perimental year, 218 salons fell in this category. These stylists, however,were still formallyenrolled in the program, and they could have called the toll-free number to resume thevisits or restock condoms and are included in the sample throughout with sales of zerofor each restocking visit.
3N. Ashraf et al. / Journal of Public Economics 120 (2014) 1–17
Zambia. The experiment was embedded in SFH's new program for HIVprevention through the distribution of female condoms by hair salons.Our setting is representative of many health delivery programs indeveloping countries, where embedded community agents are calledupon to deliver services and products, and where effective incentivedesign remains a significant challenge (Bhattacharyya and Winch,2001; Mathauer and Imhoff, 2006). We collaborated with SFH closelyat each stage of the program, including salon selection, training,incentive design and monthly restocking visits, for one year, fromDecember 2009 to December 2010.4 To ensure that behavior was notaffected by experimenter effects, we designed the experiment to fitwithin SFH standard procedures and agents were not aware that theywere part of an experiment.5
In the program under study, hairstylists were identified as idealagents for the delivery of this health service, both because thefamiliarity between the stylist and the client creates the potential forsuccessful targeting of female condoms to “at risk” customers, and be-cause during the period that a client is in the salon, he or she is a captiveaudience, allowing the stylist to provide information about HIVprevention generally, and specifically about the female condom.Finally, hair salons are numerous and distributed throughoutLusaka. Our census of salons, implemented as part of the researchdesign, found just over 2500 hair salons, serving a populationof about 2 million (2,198,996, according to the 2010 Census ofPopulation and Housing for Zambia).
In this context, the agents' choice variable is the level of effort todevote to the diffusion of information about HIV and to the sale offemale condoms. Since this product is new and unfamiliar to customers,the agents must exert effort in explaining the female condom's properuse and benefits in order to persuade customers to make a purchase.For repeat customers, the hair stylists have the opportunity to followup in order to encourage repeat use and troubleshoot any barriersto future purchase. Effort is costly in terms of forgone time spentdiscussing other topics that might be either more enjoyable or lead tothe sale of other products available in the salon, such as clothes or hairproducts. Promoting female condoms has a strong pro-social com-ponent, since the use of condoms creates positive externalities forsociety at large. Condoms are an effective means of preventing thespread of HIV/AIDS and Zambia has one of the world's highest adultHIV-prevalence rates at 14.3% (Government Republic of Zambia,2010). Stylists are aware of the pro-social nature of the task becauseof extensive informational campaigns run by the Ministry of Health onthe importance of condoms for HIV prevention.
The program has four stages: (i) SFH attempts to distributeinvitation letters to a one-day training program for the sale of femalecondoms to 1222 stylists; (ii) of these, 981 can be reached and receivethe letter; (iii) of these, 771 accept, undergo training, find out whichtype of reward they can earn (if any), and choose whether to purchasecondoms from SFH to sell in their salons; (iv) of these, 747 join, arerequired to purchase 12 packs at the subsidized price of 2000 ZMK6
(166 ZMK, or about 3.32 cents of a dollar per pack), and are given arange of promotional materials, including posters and display units.Thereafter, dispensers or single packs can be purchased at 500 ZMKper pack, either during a monthly restocking visit by SFH representa-tives or by calling a toll-free number dedicated to the female condomprogram. These are standard SFH practices for the distribution of health
4 Female condoms are embraced by many in the public health community as the onlyfemale-controlled tool for HIV/AIDS and other STI prevention (PATH UNFPA, 2006).Young, married women are the fastest growing demographic infected with HIV (UNAIDSet al., 2004). Adoption rates for female condoms are higher in Sub-Saharan Africa than inmost parts of the world and earlier work in Zambia indicates that both men and womenhave expressed interest in the female condom (HLSP, 2007).
5 The experiment is a “natural field experiment” in Harrison and List's (2004) taxono-my, in that all research activities were embedded in SFH's normal activities.
6 In 2010, USD 1was equivalent to about 5000 ZMK. Averagemonthly urban householdincome in Zambia in 2010 was 1,779,000 ZMK (Government of the Republic of Zambia,2010).
products.7 The retail price is set at 500 ZMK for a pack of two condoms,which is the same price as the male condom.
2.2. Data
Our sample consists of the 771 stylists who participated in thetraining program and were exposed to treatment. Our main outcomevariable is sales performance. Our preferred measure of sales is thenumber of packs each stylist restocks from SFH over the study period.Restocking is precisely measured from SFH inventory data and checkedagainst invoices signed by the agents upon purchase. Restocking ismechanically correlated with customer sales, as there is no reason foragents to buy stock if they do not plan to sell it. Most importantly,restocking is the performance measure used to compute financial andnon-financial rewards. Since rewards are not paid on the 12 packsagents were required to purchase at training, these 12 packs are exclud-ed from our restocking measure. Table 1 shows that, on average, agentsrestock 9 packs, and the median is 0; namely, more than half of theagents do not purchase condoms from SFH other than at training. Thestandard deviation is 18 packs, indicating a fair amount of variationin performance. These sales data illustrate that the demand for femalecondoms is low, but that some agents manage to overcome this.
Our alternative measure of performance is calculated by SFH salesrepresentatives, by subtracting the hairdresser's stock at month t fromthe sales representative's record of stock at t− 1. Sales representativesmeasure stock each time they visit the salon by counting the number ofpacks on display and confirmingwith the stylists that no other packs arestored elsewhere. This variable suffers from measurement error due tothe fact that unsold packsmight not be visible to the SFH representativeand/or hidden intentionally. Despite this potential for errors, the corre-lation between the calculated sales and the restockingmeasures is 0.92.Table 1 shows that the average calculated sales are 13.9 packs. Thediscrepancy between the two measures is due to the fact that thecalculated sales include the 12 packs purchased at training and that itis likely to be biased upward, as every pack the sales representativecannot see in the salon is counted as sold.
In addition to sales performance, Table 1 reports four variablescollected by SFH sales representatives to proxy for the agents' saleseffort: (i) the quantity of promotional materials displayed in the shop,such as posters and “sold here” signs (mean 2.26, sd 0.9); (ii) theprobability that the stylists fill in their logbooks as instructed (47% ofthem do); (iii) the sales representatives' subjective evaluation of thestylists' interest in selling and promoting the female condoms (meanof 2.15 out of 3); and (iv) their judgment of the stylists' attention levelat the time of the visit (mean of 2.52 out of 3).
Panel B, Table 1 reports descriptive statistics of the agents' andsalons' traits. These are collected via a census survey administered toall stylists in Lusaka before the start of the program.8 Panel B illustratesthat the salons in our sample are evenly split between hairdressers(only female clients) and barbers (only male clients) and a small
8 To minimize interference with the normal management of the condom distributionprogram, the survey was presented as a research activity and not linked in any way tothe condom distribution program. The census was carried out from July to September2009; the survey lasted for an average of 35 min. Two data collection teams worked con-currently. The first team consisted of scouts responsible for locating all salons andcollecting GPS data. The second team then visited the shop and carried out the interview.Questions regarding the business included the type and quantity of equipment owned(mirrors, chairs, roller trays, dryers, etc.), the number of employees, the number and typeof clients, the nature and prices of offered services and products, the monthly revenuesand profit, and the time since opening. Questions about the manager included demo-graphics, the stylist's peer network, employee status in the salon,monthly earnings, lengthof employment/ownership, other-regarding preferences/attitude, and living conditions.

10 Previous work by Lagarde and Blaauw (2013) on South African nurses shows that thedictator game is effective in identifying socially-motivated workers. They found that stu-dent nurseswhoweremore generous in an adapted dictator game to anonymous patientswere more likely to choose a rural hardship post, where both social impacts and personalsacrifices are larger.11 Specific instructions for the game were scripted and read aloud. The script read: “Wehave recently received additional money for today's training. As a consequence we havesufficient funds to give each of you an additional 12,500 ZMK. [This was in addition tothe 40,000 show up fee]. You can choose how much of this sum to keep for yourselvesand howmuch to donate to Our Lady's Hospice, a local charity that provides palliative carethat includes offering ART (antiretroviral therapy) for their HIV patients. If youwish to do-nate, please put your donation in the envelope provided with this form [form has pre-printed ID number on it] and drop it in the collection box. Note that the amount you do-nate is totally up to you: you can give nothing, part of the 12,500 ZMK, or the entire thing.The amount you contribute will be kept completely confidential. We will give you a fewminutes to think about it. When you've taken a decision, please drop your envelope inthe box at the front.”While instructionswere being read, the helpers distributed identicalpre-arranged packets of 12,500 ZMK in small bills to each participant. While the need tocollect individual measures of altruism obviously prevents us from guaranteeing full ano-nymity, the design ensured that individual choices were not observable by other partici-pants or by the training personnel. After receiving the money, stylists were guided one
Table 1Summary statistics.
Mean Median Min Max sd N
Panel A: outcome variablesPacks sold (restocked) 9.01 0.00 0.00 216.00 18.08 771Packs sold (calculated) 13.90 12.00 0.00 148.00 15.77 771Promoter attention 2.52 2.56 0.00 3.00 0.30 725Promoter interest 2.15 2.12 0.00 3.00 0.38 697Logbook filled 0.47 0.50 0.00 1.00 0.23 725Total displays (promotional material) 2.26 2.20 0.00 8.00 0.90 726
Panel B: control variablesSalon is a barbershop (0–1) 0.44 0.00 0.00 1.00 0.50 771Salon is near a bar (0–1) 0.88 1.00 0.00 1.00 0.32 770Salon size (number of employees) 1.75 2.00 1.00 9.00 0.99 770Number of trained salons in the same area 4.46 3.00 1.00 30.00 5.06 173Stylist sells other products in salon (0–1) 0.27 0.00 0.00 1.00 0.45 771Stylist is in bottom quartile of asset distribution (0–1) 0.21 0.00 0.00 1.00 0.40 771Stylist's socio-economic status is low (0–1) 0.19 0.00 0.00 1.00 0.40 771Stylist's dictator-game donation (Kwacha) 5728.94 5000.00 0.00 40,000.00 3744.67 767Stylist's reported work motivation is intrinsic (0–1) 0.58 1.00 0.00 1.00 0.49 771Stylist's religion is Catholic (0–1) 0.23 0.00 0.00 1.00 0.42 771
Panel C: other descriptorsMonthly income of the salon (Kwacha) 332,569 250,000 0 10,000,000 572,050 700Stylist can read and write in at least one language (0–1) 0.94 1.00 0.00 1.00 0.23 771Stylist can read and write in English (0–1) 0.85 1.00 0.00 1.00 0.35 770Total number of products sold 0.47 0.00 0.00 6.00 0.94 771
Notes: Sample includes all salons that attended training (N = 771). Packs sold (restocked) is the total number of packs (excluding the initial dispenser sold at training) that the stylistchooses to buy and restock over the study period, based on invoices. Packs sold (calculated) is thenumber of packs sold, including the initial dispenser sold at training, based on sales agents'calculations. Promoter attention is a measure of stylist's level of attention, on average, across all sales agent visits during the “interpersonal communication” session on a 0–3 scale (with 0being “not interested,” and 3 being “very interested”). Similarly, Promoter interest is the sales agent's subjective rating, on average, of the stylist's level of interest in promoting female con-doms on a scale of 0 to 3. Logbook filled is an indicator variable that takes a value of 1 if filled-in logbook sheets were collected by the sales agent, averaged across non-missing visits. Totaldisplays is the average number of posters, brochures, “sold here” signs, flipcharts, condom dispensers, and certificates visible in the shop during non-missing restocking visits. Salon is abarbershop equals 1 if the salon is marked as a barber (and not a hairdresser or mixed). A salonwas considered near a bar if there was a bar within a 5-minute walk. The number of trainedsalons in the same area average across the 173 neighborhoods used as the unit of randomization along with training attendance outcomes. Stylists were classified as having low socio-economic status if they could not read and write in English, or if they had not completed primary school. The asset quartilewas determined based on ownership of durables by the stylist.We define self-reportedworkmotivation to be intrinsic if the agent reports “being connected to the community” or “making people look nice” as their preferred aspect of the job, in contrastto “making money” and “being own boss.” Refer to online Appendix C for more details on variables.
4 N. Ashraf et al. / Journal of Public Economics 120 (2014) 1–17
minority (8%) caters to both men and women.We combine female andmixed salons in the analysis, to capture demand from female clients.88% of the sample salons are located near a bar, which is a strongdeterminant of demand for condoms. 23% of the sample agents areCatholic, which might be a hindrance to selling condoms, as thesewere not approved by the Catholic Church at the time of the experi-ment. Salon size is typically small: the average salon has 1.75 employeesand the median is 2. The average number of trained salons in the samearea, a proxy for competition in the market for female condoms, is 4.5.A substantial share of agents (27%) sell products in their salons, suggest-ing that at least some of these agents already have some experienceacting as sale agents. Panel C describes other products sold by agentsin the sample: none have experience selling health products or malecondoms, which could be substituted for by female condoms.
Panel B also shows that 19% of agents in the sample have “low socio-economic status,” which encompasses those who do not speak Englishor have not completed primary education. In the absence of a reliablemeasure of wealth, these are the best proxies of socio-economic statusin our setting. The next variable aims to measure the main source ofmotivation for the agents' day-to-day job. We asked stylists to identifywhat they enjoy most about their job among: “making money,” “beingown boss,” “making people look nice,” “being connected to the com-munity,” and “other”. The share of stylists choosing each of these are35%, 6%, 44%, 14% and 1%, respectively. To measure work motivationwe generate a dichotomous variable, coding the first two options asextrinsic and the second two as intrinsic.9 58% of agents report beingintrinsically motivated, according to this definition.
To elicit an incentive-compatible measure of pro-social motivationtoward HIV causes, we designed a contextualized dictator game,
9 Results are robust to alternative ways of coding the baseline survey responses, for in-stance by coding “being own boss” and “other” as separate motivations.
which was implemented by SFH personnel during the trainingprogram.10 Agents were told that, in addition to the training show-upfee (40,000 ZMK), each of them would receive 12,500 ZMK, whichthey could keep for themselves or donate, in part or in full, to a well-known charity in Lusaka that provides care toHIV/AIDS patients, includ-ing antiretroviral treatment.11 The amount donated is taken as a proxyfor the agents' motivation for the cause. Since this is likely to becorrelated with the agents' wealth, it is always used together withasset- and socio-economic-status measures in the analysis that follows.It is important to acknowledge thatwhile donationsmay be higher than
at a time to one offive boothswhere they counted the sumand separated the amount theykept from the amount they donated. The bills donated were placed in an envelope andsealed before leaving the booth. Each participant then deposited the envelope in a box sit-ting in front of the room, specially designed for this purpose.

14 Delaying the delivery of rewards by five weeks may lower the value of the reward ifstylists have high discount rates, though stylistsmaking regular sales receive rewards eachrestocking visit. Though restocking decisions are offset by fiveweeks from incentive deliv-ery, the different incentive treatments do have the potential to influence the impact of li-quidity constraints on restocking. Specifically, stylists in either of the financial incentivesmay have more cash on hand after the delivery of incentives from restocking during theprevious visit. Sales agents elicited restocking decisions before incentives were handedout to mitigate this problem. However, if stylists changed their mind about restocking af-ter receiving incentives, theywere allowed to purchasemore.We record these restockingdecisions separately. Stylists in the high financial-margins treatment do not change theirdecision significantly more than stylists in the volunteer control, which suggests that li-quidity constraint differences do not have a meaningful effect on restocking. Stylists in
5N. Ashraf et al. / Journal of Public Economics 120 (2014) 1–17
the individuals' truly-preferred amounts, because of social pressure(DellaVigna et al., 2012), the measure is still valid for our purposes aslong as ranks are preserved so that more motivated agents donatemore than agents who are less motivated, even if they all donate morethan theywould in the absence of social pressure. The average donationin the dictator game is 5729 ZMK; that is, 45% of the total endowment.More importantly for our purpose, the measure exhibits considerablevariation, as its standard deviation is 3745 ZMK.
Finally, panel C reports other agents' traits that, while not useddirectly in the analysis, can be helpful to put the experiment and theresults in context. The weekly income of the average salon is 332,569ZMK; 94% of the agents are literate and can thus easily read SFH'sinvitation letter and further communications, and 85% are literate inEnglish.
2.3. Research design: treatment groups
Agents are randomly assigned to one of four groups. Agents in thecontrol group are recruited as volunteers and receive no incentives,financial or otherwise.
Agents in the large financial-margin treatment receive 450 ZMK foreach condom pack sold, a 90 percent margin over the retail price. 450ZMK is the highest incentive-compatible margin, since agents wouldhave the incentive to buy and dispose of the condoms if the rewardwas larger than the purchase price. To put these numbers in context,consider that the average stylist in our sample charges 3000 ZMK for ahaircut. Whether devoting time to condom sales is more profitablethan devoting time to cutting hair therefore depends on whetherstylists can sell a pack in less than 1/6th of the time it takes them todo a haircut, other things equal. Thus the power of the rewards dependson other things that affect sales, including demand.12
Agents in the small financial-margin treatment receive 50 ZMK foreach condom pack sold, a 10 percent margin over the retail price. 50ZMK is the smallest bill commonly in circulation, making this thesmallest payment that is easily implementable. The comparison of thetwo financial incentive treatments allows us to test whether financialincentives crowd out motivation when they are low-powered, asfound in Gneezy and Rustichini (2000).
Agents in the non-financial reward (star) treatment group receivea star for each condom pack sold. These agents are provided with athermometer display, akin to those used in charitable fundraisers.Each sale is rewarded with a star stamped on the thermometer, whichis labeled as measuring the stylist's contribution to the health of theircommunity. The thermometer display is designed to create a visuallink between packs sold and health outcomes, making social impactsalient (Grant, 2007) and effectively rewarding stylists for marginalcontributions to the cause. In addition, stylists were told that all thosewho sell more than 216 packs over a year would be awarded a certifi-cate at a ceremony.
Three points are of note. First, rewards are a function of the numberof condoms each agent restocks every month from SFH's invoice data.Rewards are not paid for the packs purchased at a subsidized priceduring the training program.
Second, SFH representatives visit each salon once per month13 andpay rewards (financial and non-financial) based on the number of
12 Wenote that agents in the largefinancial-margin treatment face a lowermarginal cost(50 instead of 500) and can, in principle, boost sales by reducing the price. This incentive iscommon to all sales-based bonuses and quota schemes, i.e., sales people can increase salesby passing some of their reward to customers. This practice is not detrimental to the prin-cipal as long as they want to maximize sales revenues. We collect data on prices to testwhether agents implemented this strategy.13 Five full-time sales representatives were trained to carry out visits and they rotatedbetween salons and treatments. Restocking visits lasted approximately 1 h, during whichsales representatives followed a detailed script and recorded both observational and sur-vey data. Besides collecting data, representatives answered queries about the program,distributed promotional materials, allowed the stylists to restock and handed out incen-tive payments.
packs the agent bought during the previous restocking visit.14 Thisensures that rewards can be computed at headquarters and that thesales representatives carry the exact quantity of rewards to give ateach visit.15
Third, the design of the non-financial reward schemewas driven bythe need to balance two equally important considerations: realism andcomparability with the financial incentive schemes.We thus included acommonly observed feature of non-financial rewards (the certificate totop performers) while ensuring that agents in all treatments earn areward for each pack sold. Therefore, at low sale levels, financial andnon-financial incentives have the same linear structure; at high salelevels the non-financial scheme has an additional lump sum benefitpast a given threshold. Whether this difference can drive differencesin performance is a matter for empirical analysis.
2.4. Research design: randomization
Assignment to treatment is randomized at the neighborhood levelwith buffer zones between neighborhoods, so that all agents in thesame neighborhood are assigned to the same treatment and salons'neighbors are either in the same treatment or not part of the program.To implement the design, we first conducted a census of all hair salonsin Lusaka, collecting GPS coordinates and numerous salon and stylistcharacteristics. We then imposed a grid on the GPS-mapped locationsof the salons, to divide the city into equal geographical areas of 650 by650 m each. We excluded a buffer of 75 m on all sides of the grid cell,resulting in at least 150 m between salons in adjacent areas. Theresulting areas, each measuring 250,000 m2, served as the unit ofrandomization. Salons located in buffer areas were not invited to jointhe program. The final sample for randomization consists of 205 distinctneighborhoods, containing 1222 hair salons.16
To increase power, we balance on a vector of variables that are likelyto affect condom sales. These are: salon type (hairdresser or barber);salon size (proxied by the number of employees); whether the salonis located near a bar (a proxy for condom demand); the number of sa-lons in the same cell; the agents' total assets; whether the agent reportsgiving to charitable causes; and whether the agent sells other productsin their salon. Randomization is implemented via the minmax t-statmethod for the vector of balance variables across 1000 random draws.Fig. 1 illustrates the geographic outcome of the randomization. Appen-dix Table A.1 presents the means and standard deviations of all thebalance variables, for the additional control variables that we usein the analysis by treatment status, and for the additional summarystatistics described in Table 1. The table also includes the largest
the star reward treatment, on the other hand, do significantly increase their restocking de-cision after receiving their reward, relative to the volunteer control group.15 At the end of the restocking session, all agents in the control groupwere told: “Now, Ihave good news for you today. Because of your hard work and great sales performance inthe lastmonth, you have potentially protected…[# of packs x 2]…sexual intercourses. Youhave therefore helped your clients protect themselves against STIs and unplanned preg-nancies.” Agents in the reward treatments were told “Now, I have good news for you to-day. Because of your hard work and great sales performance in the last month, you haveearned a reward of ……(Kwacha or stars). In addition to that, you have potentiallyprotected….. [# of packs x 2] sexual intercourses. You have therefore helped your clientsprotect themselves against STIs and unplanned pregnancies.”16 Salons/shops that reported planning to close/move in the next six months were ex-cluded from the sample, as were neighborhoods that contained only one salon.
17 The training took place between October and December 2009 and lasted for 40 days,running fromMonday through Thursday for 10 weeks, with a maximum of 50 stylists at-tending in a single day. Training sessions were staggered and balanced across treatmentgroups, so that the timing of the training did not vary systematically between treatments.
6 N. Ashraf et al. / Journal of Public Economics 120 (2014) 1–17
normalized difference across treatment pairs, the p-values of the testsof equal means for all pairwise combinations and the p-value of thejoint test that all control variables are equal across the four groups.Normalized differences for all variables are small, and all but one arewell below the 0.25 critical value identified in Imbens and Wooldridge(2009). The pairwise differences illustrate that two out of the threetreatments (stars and large financial incentives) are well balancedwith respect to control and with respect to one another. In particular,we fail to reject the null of equal means between stars and large finan-cial margin for any of the fourteen variables while the comparisonsbetween stars and control and between large financial margin and con-trol reject the null of equal means at the 10% level for only one variableout of fourteen or 7%, i.e. less than expected by chance. The unbalancedvariable is the share of stylists who report “making people look nice”and “being connected to the community” as the factors they enjoy themost about their job over “making money” and “being my own boss”.We control for this variable in all specifications and, reassuringly, it isnot correlated with any of the outcomes of interest.
For the third treatment – small financial incentives – we rejectthe null of equal means vs. control at the 10% level for four variables:the share of stylists who report “making people look nice” and “beingconnected to the community” as the factors they enjoy the most abouttheir job, the number of products sold in the salons, the share of stylistswith low socioeconomic status, and the share of stylists who cannotspeak English. As the latter implies low socioeconomic status by defini-tion, the null of equal means vs. control is effectively rejected at the 10%level for 21% of the variables (3 out of 14).While none of these three arecorrelated with the outcomes of interest, it is important to bear thisin mind when comparing the small financial incentive treatment tocontrol. The comparison of interest, however, is the one between thetwo financial incentive treatments which allows us to test whetherfinancial incentives crowd out motivation when they are low-powered, as found in Gneezy and Rustichini (2000). Reassuringly, thetwo financial incentive treatments are balanced on all variables.
Finally, we present two tests of the null hypothesis that allpairwise differences of means are jointly equal to zero. The firstis the standard asymptotic test, and the second is based on theempirical distribution of the same test statistic derived from 10,000simulated random draws. We present both because asymptotictests tend to over-reject the null when the number of covariates islarge relative to the number of randomization units (Hansen andBowers, 2008). In our case the asymptotic test rejects the null ofbalance (p = 0.014), while the test based on the empirical distribu-tion fails to reject (p = 0.760).
3. Identification
To evaluate the effect of different incentive schemes on saleperformance we estimate:
yic ¼ α þX3
j¼1
δ0 jtreatjc þ Xiηi þ uic ð3:1Þ
where yic measures condom sales by agent i located in area c over theyear. Our main measure of sales performance is the same as that usedto compute rewards, that is, the number of packs each stylist buysfrom SFH over the study period, excluding the 12 packs purchasedat training. For robustness, we also estimate Eq. (3.1) using sales ascalculated by SFH sales representatives by subtracting the hairdresser'sstock at month t from the sales representative's record of stock at t− 1.Sales representatives measure stock each time they visit the salonby counting the number of packs on display and confirming with thestylists that no other packs are stored elsewhere. This measure includesthe 12 packs purchased at training.
treatcj denotes the three treatment groups andXi is a vector of agents'
characteristics that can be correlatedwith sales. These include: whethersalon is a barbershop (does not have female clients) and number ofemployees, stylist's sales experience, religion, socio-economic statusand wealth, and motivation for hairdressing and the HIV cause. Theoutcome variables and stylist- and salon-level characteristics arereported in Table 1.
Errors are clustered at the level of the randomization unit, thegeographical grid-cell area c, throughout. We estimate Eq. (3.1) on theentire sample of stylists who came to training and hence were exposedto treatment. Since agents choosewhether to participate in the programafter learning about incentives, the coefficients δ0j capture the effect ofincentives on sales performance through both the margins of selectionand effort. In this setting, however, the role of selection is limitedsince almost all the agents who were exposed to treatment joined theprogram. Section 4 presents detailed evidence on this issue.
The coefficients δ0j measure the causal effect of the treatments onsales performance under the identifying assumption that treatc
j isorthogonal to uic. This notwithstanding, the identifying assumptionfails if the decision to participate in the training program is not orthog-onal to treatment, or if there are spillovers between treatments. Wediscuss these in turn below.
3.1. Participation decision
The randomization algorithm yields a sample of 1222 hairstylists tobe invited to the one day training program and subsequently, to sellcondoms. SFH representatives managed to deliver the invitation letterto 981 stylists. The letter, reproduced in Appendix Fig. A.1, stressedboth private and public benefits of the program. In particular, the lettersuggested that joining the programmight attract new customers to thesalons and might help the community by facilitating HIV prevention. Inthe case of multi-stylist salons, the invitation is extended to the personresponsible for themanagement of the salon,who is either the owner orthe general manager. To attract the largest possible number of agentsand ensure a representative sample, stylists are offered 40,000 ZMK(USD8) to attend the one-day training. This is over 13 times the averageprice of a haircut and is therefore likely to exceed the stylists' expectedearnings for a weekday. Using information on self-reported earnings,40,000 ZMK corresponds to 69% of weekly earnings for the mediansalon.
Of the 981 stylists who received the invitation letter, 771 attendedthe training, perhaps as a result of the generous show-up fee and/orthe financial and social benefits from joining the program, as stated inthe letter. During training, stylists are provided with information onHIV/AIDS, female condompromotion, basic business skills, and programdetails, including the randomly assigned compensation package.17
Regardless of the high participation rate, the identifying assumptionfails if the treatments affect selection at either stage. However, sincestylists were not informed about treatments until the end of training,selection ought to be orthogonal to treatment. Appendix Table A.2reports the estimates of
pic ¼ α þX3
j¼1
θ0 jtreatjc þ Xiηþ εic ð3:2Þ
where pic is an indicator variable equal to 1 if the agent receives theinvitation letter in columns 1 and 2, and an indicator variable equalto 1 if the agent chooses to attend training in columns 3 and 4. Xi isa vector of agents' characteristics that can be correlated with theparticipation decision. Reassuringly, the estimates in Appendix

Fig. 1. Randomization of map cells into treatment groups. Notes: Treatment groups and volunteer control group are shown by the grayscale tones. The number of salons attending thetraining is written in each cell.
7N. Ashraf et al. / Journal of Public Economics 120 (2014) 1–17
Table A.2 clearly show that the participation decision is orthogonal totreatment: all coefficients θ0j are small and not significantly differentfrom zero.18
3.2. Spillovers
The identifying assumption fails if, because of spillovers, the controlgroup is not a proper counterfactual for how agents in the treatmentgroups would have behaved in the absence of treatment. This mightbe the case if, for instance, agents in the control group change theirbehavior as a result of knowing that other agents have been offeredrewards. Four design features were employed to minimize the risk ofspillovers across treatment groups.
First, we created a 150-meter buffer zone between each geo-graphical area in which salons are located to ensure that each agentneighbors either other stylists in the same treatment group or stylistswho are not part of the program. While the research design ensuresthat all stylists in the same geographical area are assigned to the sametreatment, this precaution can be undone by stylists relocating afterrandomization is carried out. Relocated stylists were allowed to stay
18 The decision to attend training is correlatedwith some individual characteristics, suchas gender (barbers are more likely to attend), and self-reported donations to HIV-relatedcauses. Stylists who attend training are five percentage points more likely to report givingto HIV charities. While this is in line with the theoretical literature that suggests thatagents in mission-driven organizations share an interest in the mission, the magnitudeof the difference between participants and non-participants is small, as the vast majorityof invited stylists choose to participate.
in the program only if they moved within the same geographical areaor to a new areawith the same treatment as their original assignment.19
Second, stylists attended the trainingwith other stylists belonging tothe same treatment group. Third, the enumerators who delivered theinvitation letters were themselves unaware of which training daypertained to which treatment. Fourth, the program was designed toappear similar across treatment groups to an outside observer. Mostimportantly, the sale price was identical across treatments and allstylists received the same promotional materials, which includedaprons, “sold here” signs, t-shirts and different types of posters. Thesole exception to this rule is the thermometer poster, which was givenonly to stylists in the star treatment.
To assess the potential for spillovers through the stylists' socialnetwork, our baseline survey asked respondents about their relation-ships with other stylists in Lusaka. Reassuringly, the median stylistreported only one connection,whether a relative, friend or acquaintance,with another stylist in the city. To monitor the evolution of this variableover the course of the program, we collected information on new con-nections with other stylists during each monthly visit. During the firstfour months of the program, 60 to 80% of stylists reported at least one
19 Only 12 cases occurred in which the salon moved and remained in operation andstaffed by the stylist involved in the research project. In 7 of these cases, the salonrelocated within the same treatment cell. Three of the cases involved movement into abuffer area and the remaining 2 cases involved relocation to a different treatment. Thesesalons were dropped from the study and all subsequent restocking observations are re-corded as zeros.
05
1015
20P
acks
sol
d (r
esto
cked
)
Volunteer Stars
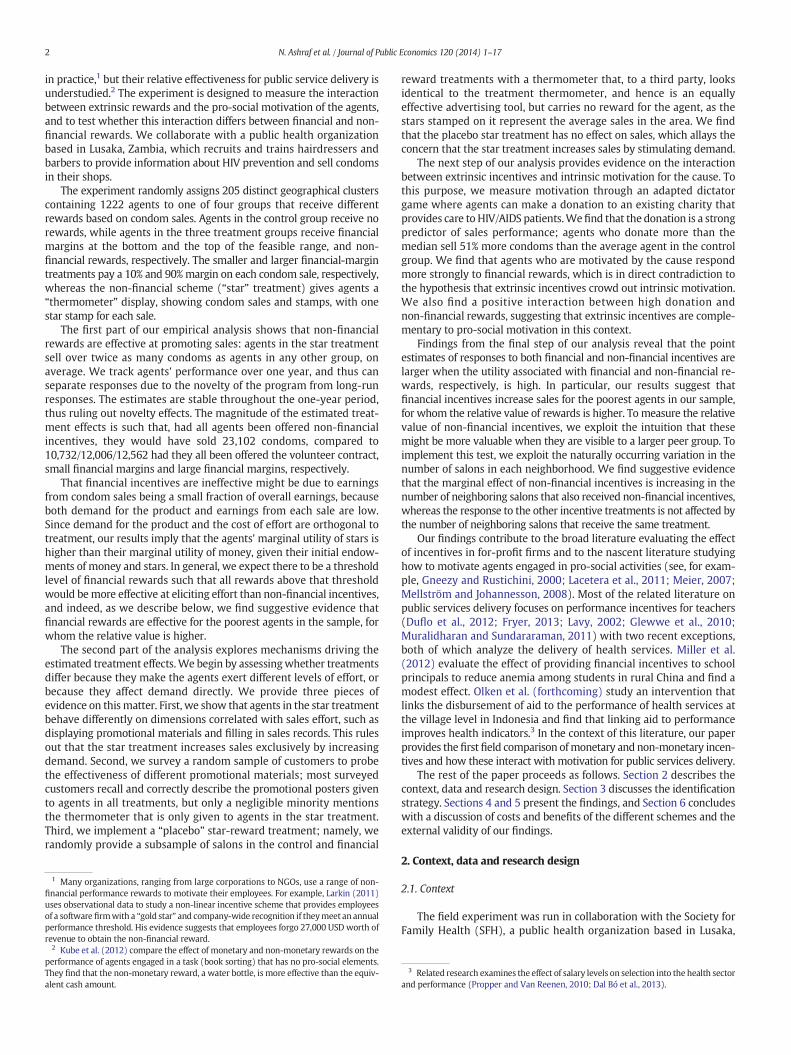
Fig. 2. Average yearly sales by treatment group. Notes: Each bar measures the averagenumber of packs sold over the year by agents in each of the four groups with 95% confi-dence intervals.
LF SF V S LF SF V S LF SF V S LF SF V S
0.2
.4.6
.81
Sha
re o
f tre
atm
ent
0 1 to 12 13 to 24 >24Packs sold
90% CI
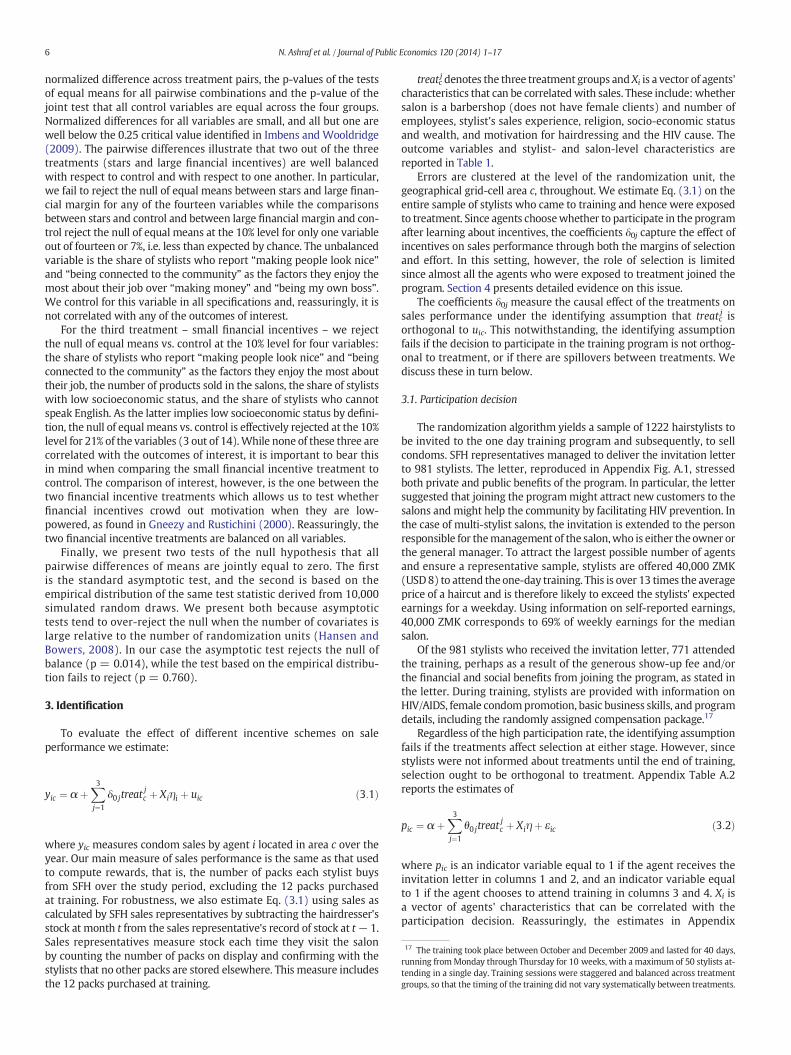
Fig. 3.Distribution of packs sold by treatment. Notes: For each treatment group, packs soldare binned into the four categories displayed on the x-axis. The height of the bars showsthe share of the treatment in each bin, which sum to one in each treatment. The errorbars correspond to the 90% confidence interval.
8 N. Ashraf et al. / Journal of Public Economics 120 (2014) 1–17
new connection with another stylist in the city. After the fourth month,very few new connections were reported. Over 90% of the new acquain-tances reported during the first fourmonthsmet during the training andare therefore in the same treatment group. Finally, to detect spilloversand identify the stylistswhomight be affected by themduring the courseof the experiment, we asked sales representatives to note all questionsand complaints at every monthly visit. In over 7000 restocking visits,only one stylist asked about different incentive schemes.20
While these three pieces of evidence are reassuring, they cannotcompletely rule out that agents in one treatment effectively respondedto not being assigned to another. In the next section, we will exploitvariation in treatments of neighboring areas to assess the empiricalrelevance of this concern.
4. The effect of incentives on sale performance
We begin by estimating Eq. (3.1) to evaluate the effect of thethree experimental reward treatments on overall sales performance.Throughout, we report estimates of δ0j, with and without a vector ofsalons' and agents' characteristics that can affect the willingness or abilityto sell female condoms, and therefore explain some of the variation insales.
As discussed above, we estimate Eq. (3.1) on the entire sample ofstylists who came to training and hence were exposed to treatment.This implies that the coefficients δ0j capture the effect of incentives onsales performance through both the margins of selection and effort.The next two sections provide evidence on the relative importance ofthese margins.
21 We obtain similar results if the top 1% of sellers are dropped from the sample.22 As noted in Footnote 12, agents in the large financial-margin treatment face a lowermarginal cost (50 instead of 500) and could, in principle, have boosted sales by reducingthe price. While this does not invalidate the identification of the effect of incentives onsales performance, it changes the interpretation of the effect of incentives on effort. Wedo not observe agents choosing this strategy in equilibrium. Our end-line survey showsthat only four stylists reported ever selling a pack at a price lower than 500 ZMK, and noneof themwere in the largefinancial-margin treatment. This, of course, does not rule out thatthe agents tried lowering the price, but this had no effect on sales,which is consistentwithdemand for this product being inelastic. The stylists' ability to take advantage of the lowelasticity to increase price was limited by the fact that the same product was availablefrom other outlets, e.g., chemists and drugstores, at 500 ZMK. Unbranded versions wereavailable free of charge fromhealth clinics. In our focus groups, both stylists and customersreport some sales at 1000 ZMK.We note that at this price, stylists in the control group andstar treatment also get a margin per pack sold (500 ZMK), but this is considerably lower
4.1. Selection
Of the 771 stylists attending the training, 747 (97%) joined. Notsurprisingly, columns 1 and 2 of Appendix Table A.3 show thatincentives had no impact on the decision to join. Stylists could alsochoose to quit during the course of the experimental year at no cost.Only 58 stylists (7.5% of those exposed to treatment) did so; of these,53 never made a sale. The effect of the incentive treatments on thechoice to select out is small for all treatments and significantly differentfrom zero (p = 0.084) only for agents in the small financial-margin
20 Most questions regardedqueries that originated fromcustomers on the characteristicsof the product. The most common complaint was that the condoms were difficult to sell.
treatment when accounting for individual and salon characteristics, asshown in column 4 of Appendix Table A.3.
Overall, only 10% of the 771 stylists whowere exposed to treatmentselected out of the program either at training or later during the year,and the incentive treatments did not affect either selection decision.This implies that the coefficients δ0j capture the effect of incentives onsales through effort rather than through selection.
4.2. Sales
Figs. 2 and 3, and Table 2 show the effect of incentives on averagesales and at different points of the sale distribution.
Beginning with average sales, Fig. 2 shows that there is a strikingdifference between stylists in the star treatment and all others. Agentsin the star treatment sell twice as many packs over the year. This isconfirmed by the estimates in columns 1 and 2 of Table 2. Four findingsare of note. First, agents in the star treatment sell 7.48 more packs,which is over twice as many packs as stylists in the control group. Thisresult is robust to the inclusion of stylist-, salon- and area characteris-tics, and is not driven by outliers in the star treatment group.21 Second,neither financial-incentive treatment affects sales.22 Both coefficientsare substantially smaller than the coefficient on the star treatment andare not significantly different from zero. The null hypothesis that theeffect of either financial treatment is equal to the effect of the star treat-ment can also be rejected at the 1% level or lower. The evidence thuscasts doubt on the relevance of a specific form of crowding-out effect,
than themargin received by stylists in HPFT (950 ZMK), so that the ranking of treatmentsin terms of incentive power is unchanged as long as stylists in all treatments are able to sellat the same price.

9N. Ashraf et al. / Journal of Public Economics 120 (2014) 1–17
namely that crowding-out only dominates when financial rewards arelow-powered, so that small rewards reduce performance while largerewards increase it (Gneezy and Rustichini, 2000).23
While the sales level of the average stylist is low, the difference be-tween treatments is large in aggregate. The estimates in column 2,Table 2 imply that if all of the 771 agents had been offered non-financial incentives, they would have sold 23,102 condoms; that is,12,416 more condoms than the counterfactual scenario, in which theywere all recruited as volunteers. Had they all been offered small orlarge financial margins, they would have sold 12,006 and 12,562 con-doms, respectively.24
Third, we find that our experimental measure of motivation is corre-latedwith sales and the effect is large: agentswhodonatemore than themedian amount to the HIV charity sell 3.35 more packs, which is equalto 42% of the effect of star rewards and almost 50% of the baselinemean of 6.96 in the control group. The fact that the donation in theexperimental game predicts sales reassures us that social pressure todonate, if any, did not mask actual differences in motivation. To allayconcerns that the donation measure captures differences in wealth,the regression includes a measure of the stylist's own assets. This is cor-relatedwith the value of donation, as expected, but not with sales. Sinceself-reported assets might be measured with substantial noise, we alsouse information on whether the agent has completed primary schooland whether they speak English, which are good proxies of socio-economic status in our setting. This measure is also correlated withdonation but not with sales. Fourth, the following agent characteristicsare correlated with sales: barbers sell 2.75 more packs, possiblyreflecting the fact that men are in charge of contraceptive choices inour setting, promoters with previous sales experience sell 5.11 morepacks and Roman Catholics sell 3.57 fewer packs. The effect of the startreatment is thus larger than the effect of any personal characteristic.
Fourth, column 3 shows that all results are robust to using salescalculated by SFH representatives as the outcome variable. Recall thatour main outcome variable does not include the 12 packs the agentspurchased at training, as all agents were required to do so and theseare not counted for the computation of rewards. In contrast, the calcu-lated salesmeasure includes these 12 packs (if sold) and itsmean is cor-respondingly higher. The qualitative results are unchanged, as agents inthe star treatment sell more than agents in any other treatment group.Consistently with the fact that the calculated sales variable is measuredwith error, both the estimated star-treatment effect and the effect ofother agents' traits (pro-social motivation, type of salon, religion, salesexperience) are somewhat smaller but precisely estimated throughout.Appendix Table A.4 shows that results are also robust to winsorizing (at90% and 95%), an alternative sample and SFH representative fixed effects.
Fig. 3 illustrates the distribution of sales in the four groups. The dis-tribution exhibits bunching at 0, 12 and 24 packs, probably due to thefact that while stylists could purchase one pack at a time from SFH, buy-ing one dispenser (12 packs) saves on transaction costs. Overall, 62% of
23 To be specific, our 95-percent confidence interval on low financial incentives relativeto the volunteer control group allows us to rule out negative coefficients greater than 2.2packs, or 0.12 standard deviations. As a comparison, Gneezy and Rustichini (2000) find acrowding-out effect of 0.54 standard deviations associated with paying a low financial in-centive, and Ariely et al. (2009) find a 0.16 standard deviation decrease associated withpublic payment of financial incentives. We are therefore able to rule out crowding-out ef-fects of the magnitudes found in these two papers at α b 0.025.24 To express these differences in a more relevant metric for comparing public healthoutcomes, our estimates imply that offering non-financial incentives to all agents wouldhave saved 116 disability-adjusted life years (DALYs), compared to 54 DALYs in the coun-terfactual volunteer scenario, 60 DALYs with small financial margins, and 63 DALYs withlarge financial margins. This calculation is based on a model calibrated for Zambia by Pop-ulation Service International (PSI, 2012). The costs per DALY saved by enrolling all 771agents in a single contract type, including both fixed and variable costs, are USD 2060 inthe volunteer contract group, USD 1843 in the low financial scheme, USD 1769 in the highfinancial scheme and USD 972 in the star reward group. To put this cost in context, Garberand Phelps (1997) estimate the value of a DALY at approximately twice annual income.The per-capita annual income in Zambia in 2010 was USD 1020, so the cost of the star re-ward treatment compares favorably to the value of the health benefits it generates.
stylists sell no packs other than those purchased at training, 22% sell be-tween 0 and 12, and 16% sell 24 or more.25 Conditional on selling any,stylists sell an average of 24 packs in addition to the 12 purchased attraining. Fig. 3 shows that the treatment effects differ on the extensiveand intensive margins. In particular, 47% of agents in the star treatmentsell at least one pack besides those purchased at training, compared to35% in the other groups. The figure also illustrates that the average dif-ference between the star treatment and the other three groups is drivenby agents who sell more than 12 packs. This is confirmed by the esti-mates in columns 4, 5 and 6 of Table 2.
Column 4 of Table 2 shows that the likelihood of selling at least onepack in addition to those purchased at training is 11.4 percentage pointshigher for agents in the star treatment; this represents a 31-percent in-crease over the mean of the control group. Agents in the high- and lowfinancial-margin treatments are equally likely to sell at least one pack asagents in the control group. Columns 5 and 6 show that the differenceacross treatments is stable at different points of the distribution in abso-lute value, but it increases in proportion to themean level in the controlgroup. Promoters in the star treatment are 13 percentage points morelikely to sell 12 ormore packs, which is 38%more than stylists in the vol-unteer treatment, and 10 percentage points more likely to sell 24 ormore, which is 79% more than stylists in the volunteer treatment. Pro-moters who are offered financial margins, either large or small, do notperform differently than stylists in the volunteer treatment. All coeffi-cients are precisely estimated and very close to zero.
A possible explanation for why financial rewards are not effective atpromoting sales is that even in the high margin treatment, earning po-tential was low because of low demand for the product. Even stylists inthe top quintile of sales and in the high margin treatment made only3.5% of self-reported annual earnings from condom sales. While fieldexperiments on performance typically analyze the effect of incentivesthat account for a substantial share of earnings, two other experimentsuse comparably small incentives and still find large positive effects.Chetty et al. (2014) show that offering academic referees a USD 100gift card to complete their reports on time decreases median survivaltimes by 43%. The value of the incentive is equivalent to 0.1% of theaverage assistant professor salary in the US.26 Goette and Stutzer(2008) show that offering a lottery ticket worth USD 4.3 increasesblood donations by 12% among a large sample of potential donors inSwitzerland.
More importantly for the interpretation of our results, low demandcannot explain why non-financial rewards are effective, unless thenon-financial reward treatment affects demand directly. Our researchdesign allows us to rule out that the star treatment increases sales by af-fecting demand, an issue we will return to in Section 6.
4.3. Spillovers and timing
Before delving into the mechanisms that underpin our findings, thissection presents evidence on two key issues for interpretation. First, weprovide evidence that allays the concern that the estimated effect of thenon-financial treatment might be contaminated by spillovers, namelyby agents in other treatments reacting to not having been given stars.As illustrated in Fig. 1, some non-star areas border neighbor areas inthe star treatments, whereas others do not. We exploit this variationto test whether the agents who are more likely to be affected by spill-overs have higher or lower sales. Reassuringly, we find that beingclose to agents in the star treatment does not affect sales for agents inother groups,which casts doubt on the relevance of spillovers in our set-ting. Of the 586 salons not in the star treatment, 41% are located in areasadjacent to star treatment areas, specifically in one of the 8 areas
25 Results are robust to estimating Tobit models.26 Data from Scott and Siegfried (2011) refer to themean salary of assistant professors inPhD-granting institutions. Mean salaries for associate and full professors are USD 117,231and USD 159,816, respectively.

28 We note that the observed pattern is consistent with agents in the star treatmentexerting effort only at the beginning to establish a regular customer base, and sell to thesame customers throughout the year. While this is not the only interpretation of the pat-terns, from the principal's point of view this is not less desirable than reaching new cus-tomers, but the interpretation of the effect of stars through time differs if this is the case.To shed light on this issue, we use the agents' reports onwhether the customers to whom
Table 2Average treatment effects on sales.
Dependent variable Packs sold (restocked) Packs sold(calculated)
=1 if sells atleast one pack
=1 if sells 12 ormore packs
=1 if sells 24 ormore packs
Mean in control group 6.93 6.96 13.30 .368 .341 .128
(1) (2) (3) (4) (5) (6)
Large financial reward 0.769 1.187 −0.653 −0.003 0.01 0.031[1.618] [1.759] [1.848] [0.067] [0.063] [0.042]
Small financial reward 0.378 0.826 −0.135 −0.025 −0.018 0.011[1.528] [1.530] [1.603] [0.066] [0.060] [0.040]
Star reward 7.482⁎⁎⁎ 8.022⁎⁎⁎ 6.283⁎⁎ 0.114⁎ 0.128⁎ 0.101⁎⁎
[2.448] [2.639] [2.451] [0.066] [0.065] [0.049]Salon is a barbershop (0–1) 2.751⁎ 3.193⁎⁎ 0.101⁎⁎ 0.098⁎⁎ 0.031
[1.600] [1.467] [0.039] [0.040] [0.031]Salon is near a bar (0–1) 0.544 0.772 −0.048 −0.031 −0.005
[2.108] [1.971] [0.074] [0.063] [0.050]Salon size (log number of employees) 2.379 1.195 −0.082 −0.069 0.037
[2.950] [2.917] [0.063] [0.063] [0.049]Number of trained salons in the same area 0.02 0.069 0.001 0.000 −0.001
[0.087] [0.094] [0.003] [0.003] [0.002]Stylist sells other products in salon (0–1) 5.110⁎⁎⁎ 2.758⁎ 0.084⁎⁎ 0.085⁎⁎ 0.073⁎⁎
[1.701] [1.542] [0.039] [0.041] [0.035]Stylist in the bottom quartile of asset distribution (0–1) 1.303 0.448 0.006 −0.001 0.018
[1.743] [1.639] [0.051] [0.052] [0.036]Stylist's socio-economic status is low (0–1) −1.048 −0.962 −0.008 −0.012 −0.042
[1.411] [1.212] [0.046] [0.047] [0.029]Stylist's dictator-game donation above the median (0–1) 3.353⁎⁎⁎ 2.210⁎⁎ 0.152⁎⁎⁎ 0.143⁎⁎⁎ 0.016
[1.125] [1.115] [0.031] [0.032] [0.028]Stylist's reported work motivation is intrinsic (0–1) −0.541 −0.458 −0.035 −0.034 −0.03
[1.298] [1.166] [0.036] [0.035] [0.031]Stylist's religion is Catholic (0–1) −3.567⁎⁎ −3.163⁎⁎⁎ −0.085⁎⁎ −0.074⁎ −0.035
[1.370] [1.185] [0.041] [0.040] [0.033]Constant 6.929⁎⁎⁎ 0.175 8.176⁎⁎ 0.355⁎⁎⁎ 0.313⁎⁎⁎ 0.086
[1.123] [4.002] [3.957] [0.098] [0.093] [0.073]R-squared 0.0285 0.0631 0.0526 0.0499 0.0482 0.0267Observations 771 765 743 765 765 765Large financial = small financial (p-value) 0.803 0.823 0.747 0.694 0.578 0.583Large financial = stars (p-value) 0.00719 0.0108 0.00502 0.0517 0.0501 0.145Small financial = stars (p-value) 0.00365 0.00548 0.00725 0.018 0.0119 0.0502
Notes: OLS estimates. Standard errors are clustered at cell level. The dependent variable in columns 1–5, Packs sold (restocked) is the total number of packs (excluding the initial dispensersold at training) that the stylist chooses to buy and restock during the study period, based on invoices. The dependent variable in column 6, Packs sold (calculated) is the total number ofpacks sold (including the initial dispenser sold at training), based on representatives' calculations. The sample size varies across columns because of missing values in some covariates.Variables are as described in Table 1. p-Values in the bottom three rows are from a Wald test for equality of coefficients between treatments.⁎ p b 0.10.⁎⁎ p b 0.05.⁎⁎⁎ p b 0.01.
10 N. Ashraf et al. / Journal of Public Economics 120 (2014) 1–17
bordering a star treatment area. The estimated treatment effect forbeing adjacent to a star treatment area is 1.30 (s.e. 1.39).27
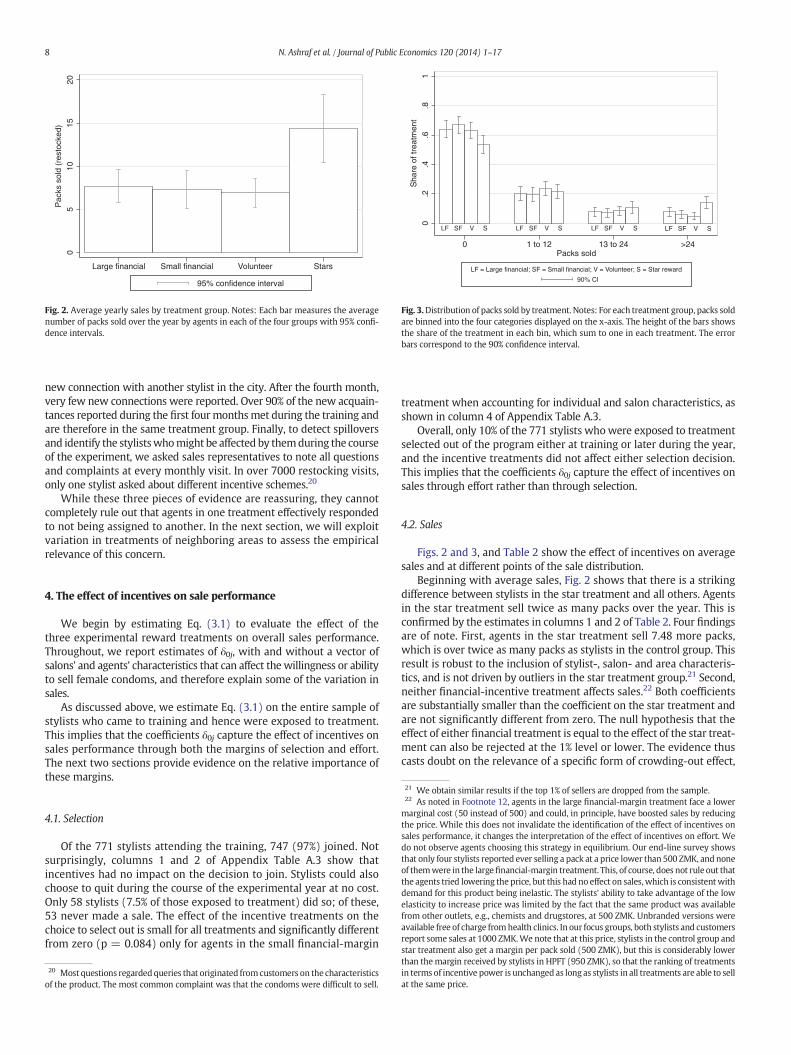
Second, we provide evidence that the treatment effects are stablethrough time, thus ruling out that the aggregate effect of non-financialrewards on sales is due to the novelty of being offered star rewards, orsimilar forms of Hawthorne effects. To do so, we exploit the fact thatthe SFH inventory files contain the exact dates of restocking andestimate Eq. (3.1) in each month, using the same set of controls andclustering errors at the same level of the randomization unit as above.Fig. 4 reports month-specific treatment effects. Two patterns are ofnote. First, the effect of the star treatment is positive and of similarmag-nitude in all months except the fifth, when it is close to zero. This mightbe due to the torrential rains inmonths 3 and 4 depressing sales, so thatagents could not sell the stock purchased in those months and did notneed to restock in month 5. The magnitude of the star treatment effectis somewhat higher in the first two months and above the mean ofthe control group inmostmonths, implying that agents in the star treat-ment sell at least twice as many packs as agents in the control group atany given point in time. Not surprisingly, however, the effect on
27 Although the concern for spillovers might be stronger from the star treatment, giventhe visibility of the thermometer, we also check for spillovers from the financial margintreatments. Being in a cell adjacent to any financial margin treatment has no statisticallysignificant effect on sales.
monthly sales is less precisely estimated than on yearly sales. Second,the effect of both large and small financial margins is close to zero inall months, suggesting again that the aggregate results do not hide sub-stantial heterogeneity through time.28
The stability over time of the effect of non-financial incentivessuggests that the effectiveness of the star reward is unlikely to be drivenby the prospect of qualifying for the ceremony. This can be inferred fromthe fact that, given the volume of sales, the threshold for being entitledto the ceremony (216 packs sold in one year) was unattainable for mostagents. Indeed, stylists who sold at least one pack and who wereassigned to star treatment sold on average 3.1 packs per month, andonly one stylist managed to sell enough to qualify for the ceremony.
they sold female condoms had used them before. The share of sales made to customerswho had never used a female condom is naturally higher in earlier months (80% inmonth1) but remains substantial in later months (44% by month 10), suggesting that agentswere reaching out to new customers throughout the program. More importantly for theinterpretation of the treatment effects, the share of new customers does not decline fasterfor agents in the star treatment.
(a) Star reward
-2-1
01
23
0 2 4 6 8 10
Month (monitoring round)
(b) Large financial margin
-2-1
01
23
0 2 4 6 8 10
Month (monitoring round)
(c) Small financial margin
-2-1
01
23
0 2 4 6 8 10
Month (monitoring round)
Fig. 4.Month-specific treatment effects. Notes: Each dot represents the estimated effect of the star treatment (panel a), large financial margin treatment (panel b) and small financial margin treatment (panel c) in a regressions of sales on the threetreatments, and controls listed in Table 2. The vertical lines represent 95% confidence intervals based on standard errors clustered at the cell level.
11N.A
shrafetal./JournalofPublicEconom
ics120
(2014)1–17
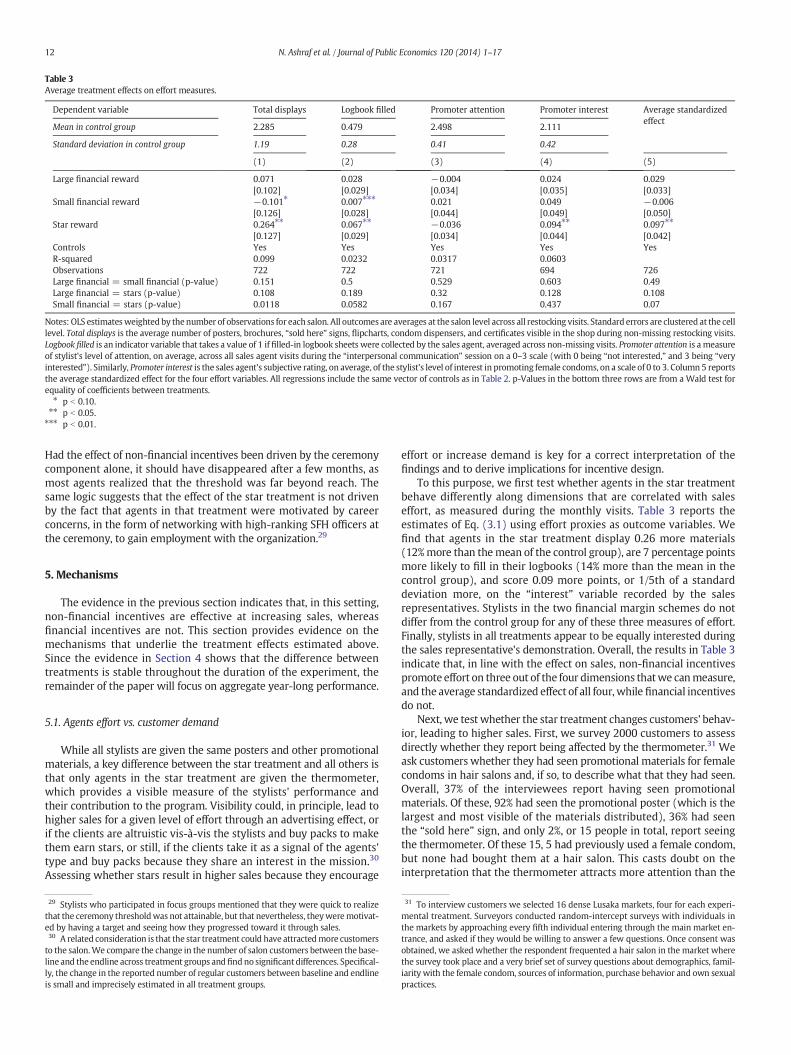
Table 3Average treatment effects on effort measures.
Dependent variable Total displays Logbook filled Promoter attention Promoter interest Average standardizedeffect
Mean in control group 2.285 0.479 2.498 2.111
Standard deviation in control group 1.19 0.28 0.41 0.42
(1) (2) (3) (4) (5)
Large financial reward 0.071 0.028 −0.004 0.024 0.029[0.102] [0.029] [0.034] [0.035] [0.033]
Small financial reward −0.101⁎ 0.007⁎⁎⁎ 0.021 0.049 −0.006[0.126] [0.028] [0.044] [0.049] [0.050]
Star reward 0.264⁎⁎ 0.067⁎⁎ −0.036 0.094⁎⁎ 0.097⁎⁎
[0.127] [0.029] [0.034] [0.044] [0.042]Controls Yes Yes Yes Yes YesR-squared 0.099 0.0232 0.0317 0.0603Observations 722 722 721 694 726Large financial = small financial (p-value) 0.151 0.5 0.529 0.603 0.49Large financial = stars (p-value) 0.108 0.189 0.32 0.128 0.108Small financial = stars (p-value) 0.0118 0.0582 0.167 0.437 0.07
Notes: OLS estimatesweighted by thenumber of observations for each salon. All outcomes are averages at the salon level across all restocking visits. Standard errors are clustered at the celllevel. Total displays is the average number of posters, brochures, “sold here” signs, flipcharts, condom dispensers, and certificates visible in the shop during non-missing restocking visits.Logbook filled is an indicator variable that takes a value of 1 if filled-in logbook sheets were collected by the sales agent, averaged across non-missing visits. Promoter attention is a measureof stylist's level of attention, on average, across all sales agent visits during the “interpersonal communication” session on a 0–3 scale (with 0 being “not interested,” and 3 being “veryinterested”). Similarly, Promoter interest is the sales agent's subjective rating, on average, of the stylist's level of interest in promoting female condoms, on a scale of 0 to 3. Column 5 reportsthe average standardized effect for the four effort variables. All regressions include the same vector of controls as in Table 2. p-Values in the bottom three rows are from a Wald test forequality of coefficients between treatments.⁎ p b 0.10.⁎⁎ p b 0.05.⁎⁎⁎ p b 0.01.
12 N. Ashraf et al. / Journal of Public Economics 120 (2014) 1–17
Had the effect of non-financial incentives been driven by the ceremonycomponent alone, it should have disappeared after a few months, asmost agents realized that the threshold was far beyond reach. Thesame logic suggests that the effect of the star treatment is not drivenby the fact that agents in that treatment were motivated by careerconcerns, in the form of networking with high-ranking SFH officers atthe ceremony, to gain employment with the organization.29
5. Mechanisms
The evidence in the previous section indicates that, in this setting,non-financial incentives are effective at increasing sales, whereasfinancial incentives are not. This section provides evidence on themechanisms that underlie the treatment effects estimated above.Since the evidence in Section 4 shows that the difference betweentreatments is stable throughout the duration of the experiment, theremainder of the paper will focus on aggregate year-long performance.
5.1. Agents effort vs. customer demand
While all stylists are given the same posters and other promotionalmaterials, a key difference between the star treatment and all others isthat only agents in the star treatment are given the thermometer,which provides a visible measure of the stylists' performance andtheir contribution to the program. Visibility could, in principle, lead tohigher sales for a given level of effort through an advertising effect, orif the clients are altruistic vis-à-vis the stylists and buy packs to makethem earn stars, or still, if the clients take it as a signal of the agents'type and buy packs because they share an interest in the mission.30
Assessing whether stars result in higher sales because they encourage
29 Stylists who participated in focus groups mentioned that they were quick to realizethat the ceremony thresholdwas not attainable, but that nevertheless, theyweremotivat-ed by having a target and seeing how they progressed toward it through sales.30 A related consideration is that the star treatment could have attractedmore customersto the salon.We compare the change in the number of salon customers between the base-line and the endline across treatment groups andfindno significant differences. Specifical-ly, the change in the reported number of regular customers between baseline and endlineis small and imprecisely estimated in all treatment groups.
effort or increase demand is key for a correct interpretation of thefindings and to derive implications for incentive design.
To this purpose, we first test whether agents in the star treatmentbehave differently along dimensions that are correlated with saleseffort, as measured during the monthly visits. Table 3 reports theestimates of Eq. (3.1) using effort proxies as outcome variables. Wefind that agents in the star treatment display 0.26 more materials(12%more than themean of the control group), are 7 percentage pointsmore likely to fill in their logbooks (14% more than the mean in thecontrol group), and score 0.09 more points, or 1/5th of a standarddeviation more, on the “interest” variable recorded by the salesrepresentatives. Stylists in the two financial margin schemes do notdiffer from the control group for any of these three measures of effort.Finally, stylists in all treatments appear to be equally interested duringthe sales representative's demonstration. Overall, the results in Table 3indicate that, in line with the effect on sales, non-financial incentivespromote effort on three out of the four dimensions thatwe canmeasure,and the average standardized effect of all four, while financial incentivesdo not.
Next, we test whether the star treatment changes customers' behav-ior, leading to higher sales. First, we survey 2000 customers to assessdirectly whether they report being affected by the thermometer.31 Weask customers whether they had seen promotional materials for femalecondoms in hair salons and, if so, to describe what that they had seen.Overall, 37% of the interviewees report having seen promotionalmaterials. Of these, 92% had seen the promotional poster (which is thelargest and most visible of the materials distributed), 36% had seenthe “sold here” sign, and only 2%, or 15 people in total, report seeingthe thermometer. Of these 15, 5 had previously used a female condom,but none had bought them at a hair salon. This casts doubt on theinterpretation that the thermometer attracts more attention than the
31 To interview customers we selected 16 dense Lusaka markets, four for each experi-mental treatment. Surveyors conducted random-intercept surveys with individuals inthe markets by approaching every fifth individual entering through the main market en-trance, and asked if they would be willing to answer a few questions. Once consent wasobtained, we asked whether the respondent frequented a hair salon in the market wherethe survey took place and a very brief set of survey questions about demographics, famil-iarity with the female condom, sources of information, purchase behavior and own sexualpractices.
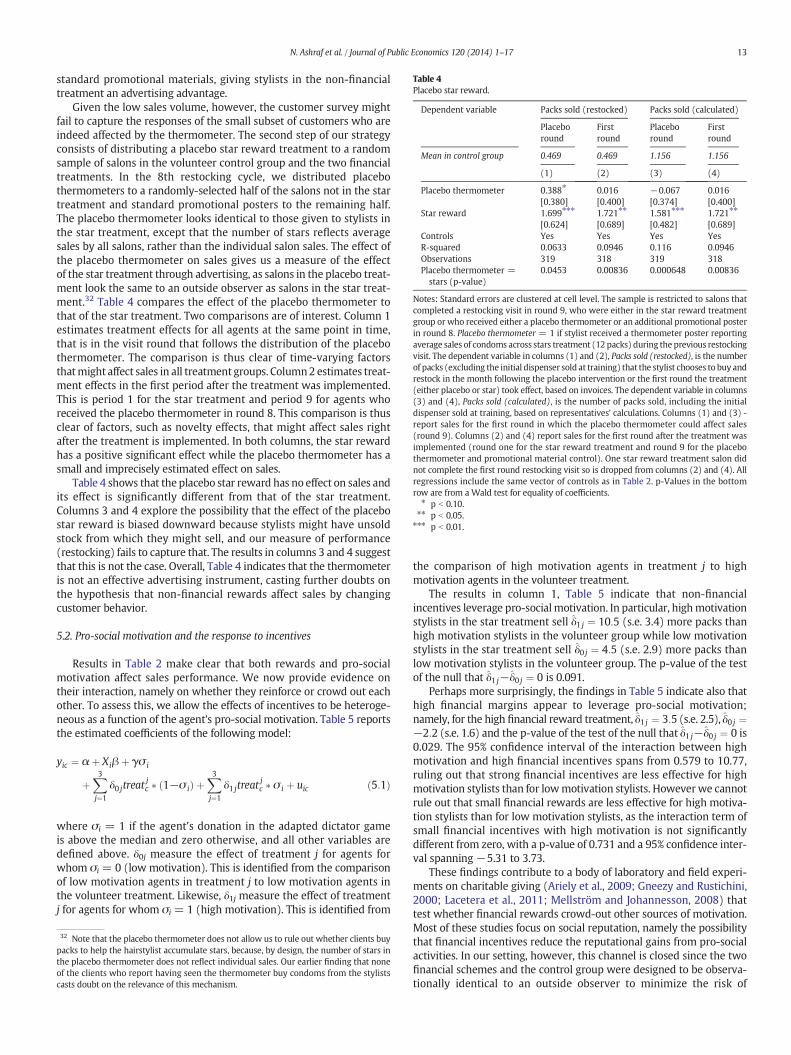
Table 4Placebo star reward.
Dependent variable Packs sold (restocked) Packs sold (calculated)
Placeboround
Firstround
Placeboround
Firstround
Mean in control group 0.469 0.469 1.156 1.156
(1) (2) (3) (4)
Placebo thermometer 0.388⁎ 0.016 −0.067 0.016[0.380] [0.400] [0.374] [0.400]
Star reward 1.699⁎⁎⁎ 1.721⁎⁎ 1.581⁎⁎⁎ 1.721⁎⁎
[0.624] [0.689] [0.482] [0.689]Controls Yes Yes Yes YesR-squared 0.0633 0.0946 0.116 0.0946Observations 319 318 319 318Placebo thermometer =stars (p-value)
0.0453 0.00836 0.000648 0.00836
Notes: Standard errors are clustered at cell level. The sample is restricted to salons thatcompleted a restocking visit in round 9, who were either in the star reward treatmentgroup or who received either a placebo thermometer or an additional promotional posterin round 8. Placebo thermometer = 1 if stylist received a thermometer poster reportingaverage sales of condoms across stars treatment (12 packs) during the previous restockingvisit. The dependent variable in columns (1) and (2), Packs sold (restocked), is the numberof packs (excluding the initial dispenser sold at training) that the stylist chooses to buy andrestock in the month following the placebo intervention or the first round the treatment(either placebo or star) took effect, based on invoices. The dependent variable in columns(3) and (4), Packs sold (calculated), is the number of packs sold, including the initialdispenser sold at training, based on representatives' calculations. Columns (1) and (3) -report sales for the first round in which the placebo thermometer could affect sales(round 9). Columns (2) and (4) report sales for the first round after the treatment wasimplemented (round one for the star reward treatment and round 9 for the placebothermometer and promotional material control). One star reward treatment salon didnot complete the first round restocking visit so is dropped from columns (2) and (4). Allregressions include the same vector of controls as in Table 2. p-Values in the bottomrow are from a Wald test for equality of coefficients.⁎ p b 0.10.⁎⁎ p b 0.05.⁎⁎⁎ p b 0.01.
13N. Ashraf et al. / Journal of Public Economics 120 (2014) 1–17
standard promotional materials, giving stylists in the non-financialtreatment an advertising advantage.
Given the low sales volume, however, the customer survey mightfail to capture the responses of the small subset of customers who areindeed affected by the thermometer. The second step of our strategyconsists of distributing a placebo star reward treatment to a randomsample of salons in the volunteer control group and the two financialtreatments. In the 8th restocking cycle, we distributed placebothermometers to a randomly-selected half of the salons not in the startreatment and standard promotional posters to the remaining half.The placebo thermometer looks identical to those given to stylists inthe star treatment, except that the number of stars reflects averagesales by all salons, rather than the individual salon sales. The effect ofthe placebo thermometer on sales gives us a measure of the effectof the star treatment through advertising, as salons in the placebo treat-ment look the same to an outside observer as salons in the star treat-ment.32 Table 4 compares the effect of the placebo thermometer tothat of the star treatment. Two comparisons are of interest. Column 1estimates treatment effects for all agents at the same point in time,that is in the visit round that follows the distribution of the placebothermometer. The comparison is thus clear of time-varying factorsthatmight affect sales in all treatment groups. Column2 estimates treat-ment effects in the first period after the treatment was implemented.This is period 1 for the star treatment and period 9 for agents whoreceived the placebo thermometer in round 8. This comparison is thusclear of factors, such as novelty effects, that might affect sales rightafter the treatment is implemented. In both columns, the star rewardhas a positive significant effect while the placebo thermometer has asmall and imprecisely estimated effect on sales.
Table 4 shows that the placebo star reward has no effect on sales andits effect is significantly different from that of the star treatment.Columns 3 and 4 explore the possibility that the effect of the placebostar reward is biased downward because stylists might have unsoldstock from which they might sell, and our measure of performance(restocking) fails to capture that. The results in columns 3 and 4 suggestthat this is not the case. Overall, Table 4 indicates that the thermometeris not an effective advertising instrument, casting further doubts onthe hypothesis that non-financial rewards affect sales by changingcustomer behavior.
5.2. Pro-social motivation and the response to incentives
Results in Table 2 make clear that both rewards and pro-socialmotivation affect sales performance. We now provide evidence ontheir interaction, namely on whether they reinforce or crowd out eachother. To assess this, we allow the effects of incentives to be heteroge-neous as a function of the agent's pro-social motivation. Table 5 reportsthe estimated coefficients of the following model:
yic ¼ α þ Xiβ þ γσ i
þX3
j¼1
δ0 jtreatjc � 1−σ ið Þ þ
X3
j¼1
δ1 jtreatjc � σ i þ uic ð5:1Þ
where σi = 1 if the agent's donation in the adapted dictator gameis above the median and zero otherwise, and all other variables aredefined above. δ0j measure the effect of treatment j for agents forwhom σi = 0 (low motivation). This is identified from the comparisonof low motivation agents in treatment j to low motivation agents inthe volunteer treatment. Likewise, δ1j measure the effect of treatmentj for agents for whom σi = 1 (high motivation). This is identified from
32 Note that the placebo thermometer does not allow us to rule out whether clients buypacks to help the hairstylist accumulate stars, because, by design, the number of stars inthe placebo thermometer does not reflect individual sales. Our earlier finding that noneof the clients who report having seen the thermometer buy condoms from the stylistscasts doubt on the relevance of this mechanism.
the comparison of high motivation agents in treatment j to highmotivation agents in the volunteer treatment.
The results in column 1, Table 5 indicate that non-financialincentives leverage pro-socialmotivation. In particular, highmotivationstylists in the star treatment sell δ̂1 j ¼ 10:5 (s.e. 3.4) more packs thanhigh motivation stylists in the volunteer group while low motivationstylists in the star treatment sell δ̂0 j ¼ 4:5 (s.e. 2.9) more packs thanlow motivation stylists in the volunteer group. The p-value of the testof the null that δ̂1 j−δ̂0 j ¼ 0 is 0.091.
Perhaps more surprisingly, the findings in Table 5 indicate also thathigh financial margins appear to leverage pro-social motivation;namely, for the high financial reward treatment, δ̂1 j ¼ 3:5 (s.e. 2.5), δ̂0 j ¼−2:2 (s.e. 1.6) and the p-value of the test of the null that δ̂1 j−δ̂0 j ¼ 0 is0.029. The 95% confidence interval of the interaction between highmotivation and high financial incentives spans from 0.579 to 10.77,ruling out that strong financial incentives are less effective for highmotivation stylists than for lowmotivation stylists. Howeverwe cannotrule out that small financial rewards are less effective for high motiva-tion stylists than for low motivation stylists, as the interaction term ofsmall financial incentives with high motivation is not significantlydifferent from zero, with a p-value of 0.731 and a 95% confidence inter-val spanning−5.31 to 3.73.
These findings contribute to a body of laboratory and field experi-ments on charitable giving (Ariely et al., 2009; Gneezy and Rustichini,2000; Lacetera et al., 2011; Mellström and Johannesson, 2008) thattest whether financial rewards crowd-out other sources of motivation.Most of these studies focus on social reputation, namely the possibilitythat financial incentives reduce the reputational gains from pro-socialactivities. In our setting, however, this channel is closed since the twofinancial schemes and the control group were designed to be observa-tionally identical to an outside observer to minimize the risk of

Table 5Heterogeneous treatment effects, by stylist motivation.
Dependent variable is packs sold (restocked)
Motivation variable Stylist's dictator game donation is above the median Stylist's socio-economic status is low
Mean in control group = 6.96 (1) (2)
Motivation variable 0.778⁎ −3.984⁎⁎
[1.518] [1.605]Effect of large financial when motivation variable = 0 −2.215 0.806
[1.633] [2.095]Effect of small financial when motivation variable = 0 1.141 −0.041
[1.933] [1.705]Effect of stars when motivation variable = 0 4.537 7.462⁎⁎
[2.859] [3.021]Effect of large financial when motivation variable = 1 3.462 3.542⁎⁎
[2.476] [1.780]Effect of small financial when motivation variable = 1 0.352 4.741⁎
[1.889] [2.858]Effect of stars when motivation variable = 1 10.480⁎⁎⁎ 11.110⁎⁎⁎
[3.411] [3.126]Controls Yes YesR-squared 0.07 0.064Observations 765 765Large financial: p-value of the null that difference by motivation variable = 0 0.029 0.326Small financial: p-value of the null that difference by motivation variable = 0 0.731 0.146Stars: p-value of the null that difference by motivation variable = 0 0.091 0.350
Notes: Standard errors are clustered at cell level. The dependent variable, Packs sold (restocked) is the total number of packs (excluding the initial dispenser sold at training) that the stylistchooses to buy and restock over the study period, based on invoices. All regressions include the same vector of controls as in Table 2. Variables are described in Table 1.⁎ p b 0.10.⁎⁎ p b 0.05.⁎⁎⁎ p b 0.01.
14 N. Ashraf et al. / Journal of Public Economics 120 (2014) 1–17
contamination via information spillovers. In particular, customers couldnot observe whether agents were receiving rewards for condom sales,and all condomswere sold at the same 500 ZMK price in all treatments.Since it is common practice for retail agents to receive a margin on theprice of the goods they sell, the most likely inference from thecustomer's perspective is that all hairstylists were paid monetary mar-gins, but we cannot pin down customers' beliefs in our setting (or,more germane for our analysis, hairstylists' beliefs about customers' be-liefs about their motivation). More importantly, we would not expectdifferential inference about incentives across the volunteer andfinancialtreatments, particularly since stylists in the volunteer control grouphave no way to credibly signal that they were not getting paid.33
Since it is unlikely that monetary incentives affected the agents'social image differentially across treatments in our setting, we are ableto assess the degree to which they might crowd out an agent's internalsense of motivation. This could happen through a self-signalingmecha-nism by which the agents receive less “warm glow” because financialincentives make them re-assess their own motives for devoting effortto the task (Deci, 1971; Andreoni, 1990). Our findings suggest thatthis is not the case.
5.3. Heterogeneous responses by the value of financial rewards
To provide evidence on the mechanisms that drive the response tofinancial incentives, we test whether the effectiveness of financial in-centives depends on their value for different agents. We exploit thefact that, under the assumption of concave utility, the same amount ofmoney is more valuable for poor stylists. To proxy for socio-economicstatus we use information on the education level and English-speaking ability of the stylist, and classify as “low socio-economicstatus” the 19% of stylists in our sample who either do not speak English
33 In addition, qualitative evidence from focus groups indicates no stigma attached to be-ing paid for pro-social tasks, possibly because Zambia is a very poor economy, and thattasks seem more valuable if a donor, NGO or government is willing to pay for them. Cus-tomers reported that theprice atwhich condomswere sold ruled out that stylistswere be-ing paid extremely well for performing the task, and that knowing that they were paid amargin similar to that paid for other products did not tarnish their reputation.
or have not completed primary education. In the absence of a reliablemeasure of wealth, these are the best proxies of socio-economic statusin our setting. We estimate:
yic ¼ α þ Xiβ þ γϕi
þX3
j¼1
δ0 jtreatjc � 1−ϕið Þ þ
X3
j¼1
δ1 jtreatjc � ϕi þ uic ð5:2Þ
where ϕi=1 if the agent's socio-economic status is low and zero other-wise, and all other variables are defined above. δ0j measure the effect oftreatment j for agents for whom ϕi = 0 (high socio-economic status)and δ1j measure the effect of treatment j for agents for whom ϕi = 1(low socio-economic status).
Column 2 of Table 5 suggests evidence in favor of the hypothesis thatfinancial incentives are effective when their relative value is higher, i.e.for low socio-economic status stylists. Compared to low socio-economicstatus stylists in the volunteer treatment, low socio-economic statusstylists sell δ̂1 j ¼ 3:5 (s.e. 1.8) more packs when offered large financialmargins and δ̂1 j ¼ 4:7 (s.e. 2.9)more packswhen offered small financialmargins. The difference between the effect of financial incentives onlow and high socio-economic status stylists is positive for both largeand small incentives, but it is not precisely estimated for eithertreatment (p-values are 0.146 and 0.326 for small and large financialincentives, respectively).
5.4. Heterogeneous responses by the value of non-financial rewards
In linewith the previous test, we now test whether the effectivenessof non-financial incentives depends on their relative value. To do so, weexploit the fact that treatments were randomized at the neighborhoodlevel and hence agents in different neighborhoods have a differentnumber of peers; that is, agents in the same treatment group, in theirvicinity. As the non-financial treatment enables stylists to make theirsale performance visible to third parties, its effectiveness might dependon the number of peers who can see it. For instance, social prestigeassociated with stars or reputational gains from contribution to societymight be higher when they can be shown-off to a larger number of
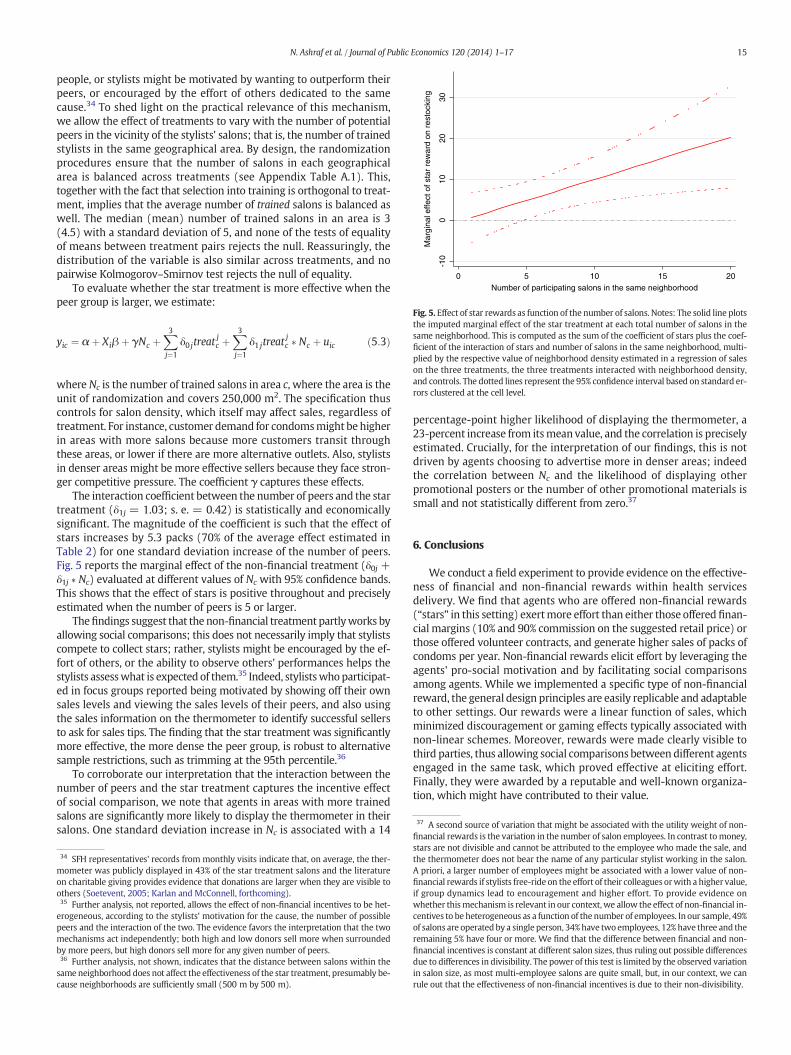
-10
010
2030
Mar
gina
l effe
ct o
f sta
r re
war
d on
res
tock
ing
0 5 10 15 20Number of participating salons in the same neighborhood
Fig. 5. Effect of star rewards as function of the number of salons. Notes: The solid line plotsthe imputed marginal effect of the star treatment at each total number of salons in thesame neighborhood. This is computed as the sum of the coefficient of stars plus the coef-ficient of the interaction of stars and number of salons in the same neighborhood, multi-plied by the respective value of neighborhood density estimated in a regression of saleson the three treatments, the three treatments interacted with neighborhood density,and controls. The dotted lines represent the 95% confidence interval based on standard er-rors clustered at the cell level.
37 A second source of variation that might be associated with the utility weight of non-financial rewards is the variation in the number of salon employees. In contrast tomoney,
15N. Ashraf et al. / Journal of Public Economics 120 (2014) 1–17
people, or stylists might be motivated by wanting to outperform theirpeers, or encouraged by the effort of others dedicated to the samecause.34 To shed light on the practical relevance of this mechanism,we allow the effect of treatments to vary with the number of potentialpeers in the vicinity of the stylists' salons; that is, the number of trainedstylists in the same geographical area. By design, the randomizationprocedures ensure that the number of salons in each geographicalarea is balanced across treatments (see Appendix Table A.1). This,together with the fact that selection into training is orthogonal to treat-ment, implies that the average number of trained salons is balanced aswell. The median (mean) number of trained salons in an area is 3(4.5) with a standard deviation of 5, and none of the tests of equalityof means between treatment pairs rejects the null. Reassuringly, thedistribution of the variable is also similar across treatments, and nopairwise Kolmogorov–Smirnov test rejects the null of equality.
To evaluate whether the star treatment is more effective when thepeer group is larger, we estimate:
yic ¼ α þ Xiβ þ γNc þX3
j¼1
δ0 jtreatjc þ
X3
j¼1
δ1 jtreatjc � Nc þ uic ð5:3Þ
where Nc is the number of trained salons in area c, where the area is theunit of randomization and covers 250,000 m2. The specification thuscontrols for salon density, which itself may affect sales, regardless oftreatment. For instance, customer demand for condomsmight be higherin areas with more salons because more customers transit throughthese areas, or lower if there are more alternative outlets. Also, stylistsin denser areas might be more effective sellers because they face stron-ger competitive pressure. The coefficient γ captures these effects.
The interaction coefficient between the number of peers and the startreatment (δ1j = 1.03; s. e. = 0.42) is statistically and economicallysignificant. The magnitude of the coefficient is such that the effect ofstars increases by 5.3 packs (70% of the average effect estimated inTable 2) for one standard deviation increase of the number of peers.Fig. 5 reports the marginal effect of the non-financial treatment (δ0j +δ1j ∗ Nc) evaluated at different values of Nc with 95% confidence bands.This shows that the effect of stars is positive throughout and preciselyestimated when the number of peers is 5 or larger.
Thefindings suggest that the non-financial treatment partlyworks byallowing social comparisons; this does not necessarily imply that stylistscompete to collect stars; rather, stylists might be encouraged by the ef-fort of others, or the ability to observe others' performances helps thestylists assesswhat is expected of them.35 Indeed, stylistswhoparticipat-ed in focus groups reported being motivated by showing off their ownsales levels and viewing the sales levels of their peers, and also usingthe sales information on the thermometer to identify successful sellersto ask for sales tips. The finding that the star treatment was significantlymore effective, the more dense the peer group, is robust to alternativesample restrictions, such as trimming at the 95th percentile.36
To corroborate our interpretation that the interaction between thenumber of peers and the star treatment captures the incentive effectof social comparison, we note that agents in areas with more trainedsalons are significantly more likely to display the thermometer in theirsalons. One standard deviation increase in Nc is associated with a 14
34 SFH representatives' records from monthly visits indicate that, on average, the ther-mometer was publicly displayed in 43% of the star treatment salons and the literatureon charitable giving provides evidence that donations are larger when they are visible toothers (Soetevent, 2005; Karlan and McConnell, forthcoming).35 Further analysis, not reported, allows the effect of non-financial incentives to be het-erogeneous, according to the stylists' motivation for the cause, the number of possiblepeers and the interaction of the two. The evidence favors the interpretation that the twomechanisms act independently; both high and low donors sell more when surroundedby more peers, but high donors sell more for any given number of peers.36 Further analysis, not shown, indicates that the distance between salons within thesameneighborhood does not affect the effectiveness of the star treatment, presumably be-cause neighborhoods are sufficiently small (500 m by 500 m).
percentage-point higher likelihood of displaying the thermometer, a23-percent increase from itsmean value, and the correlation is preciselyestimated. Crucially, for the interpretation of our findings, this is notdriven by agents choosing to advertise more in denser areas; indeedthe correlation between Nc and the likelihood of displaying otherpromotional posters or the number of other promotional materials issmall and not statistically different from zero.37
6. Conclusions
We conduct a field experiment to provide evidence on the effective-ness of financial and non-financial rewards within health servicesdelivery. We find that agents who are offered non-financial rewards(“stars” in this setting) exertmore effort than either those offered finan-cial margins (10% and 90% commission on the suggested retail price) orthose offered volunteer contracts, and generate higher sales of packs ofcondoms per year. Non-financial rewards elicit effort by leveraging theagents' pro-social motivation and by facilitating social comparisonsamong agents. While we implemented a specific type of non-financialreward, the general design principles are easily replicable and adaptableto other settings. Our rewards were a linear function of sales, whichminimized discouragement or gaming effects typically associated withnon-linear schemes. Moreover, rewards were made clearly visible tothird parties, thus allowing social comparisons between different agentsengaged in the same task, which proved effective at eliciting effort.Finally, they were awarded by a reputable and well-known organiza-tion, which might have contributed to their value.
stars are not divisible and cannot be attributed to the employee who made the sale, andthe thermometer does not bear the name of any particular stylist working in the salon.A priori, a larger number of employees might be associated with a lower value of non-financial rewards if stylists free-ride on the effort of their colleagues orwith a higher value,if group dynamics lead to encouragement and higher effort. To provide evidence onwhether thismechanism is relevant in our context, we allow the effect of non-financial in-centives to be heterogeneous as a function of thenumber of employees. In our sample, 49%of salons are operated by a single person, 34%have twoemployees, 12% have three and theremaining 5% have four or more. We find that the difference between financial and non-financial incentives is constant at different salon sizes, thus ruling out possible differencesdue to differences in divisibility. The power of this test is limited by the observed variationin salon size, as most multi-employee salons are quite small, but, in our context, we canrule out that the effectiveness of non-financial incentives is due to their non-divisibility.

16 N. Ashraf et al. / Journal of Public Economics 120 (2014) 1–17
We designed the incentive treatments to reward sales performancerather than usage, since sales performance can be precisely measuredwhile usage cannot. It is nevertheless important to discuss the linkbetween sales and usage, since the health impact of the treatmentsdepends on the latter.We can provide two pieces of evidence indicatingthat customers indeed used the condoms. First, the stylists' logbooks, inwhich they are asked to record customer characteristics for every sale,reveal that by the end of the experiment 56% of buyers had purchasedfemale condoms at least once before. This suggests the repeat customersused their previous purchases. Second, in line with this, 13% of respon-dents to our customer survey report using the condom.
The customer survey data also reveals that the effect of incentives onsales might actually underestimate the effect on usage. Indeed, while17% of the respondents report receiving information on femalecondoms from their stylists, only 0.5% report buying from them because(unbranded) female condoms were available at the same price throughother outlets such as chemists and bars, and available free of chargefrom health clinics. However, the share of respondents who ever useda female condom is more than double among those who report receiv-ing information from their stylists (27%) vs. those who do not (12%),suggesting that the effect of the agents' effort in promoting the condomson usage is larger than the effect on sales through hair salons.
Two considerations are important to inform the scaling-up ofthe non-financial reward treatment. First, the fact that stars are moreeffective when stylists are surrounded by other stylists in the sametreatment suggests that the effect estimated from a share of treatedstylists might be a lower bound for the effect stars would have whenoffered to all stylists, as the number of potential peers would be largerin the latter case. Second, the fact that the effect of stars is stablethroughout the experimental year provides reasons for cautious opti-mism that this scheme might be effective at motivating agents in thelong run. While we cannot measure the effect past the experimentalyear, the absence of a clear trend reassures us that the effect is unlikelyto discontinuously disappear as the treatment is extended past the year.
As is often the case in field experiments, the interpretation of thefindings and their wider applicability depends on the key features ofthe specific setting. In our case, two features are of note. The first keyfeature is that, to minimize the possibility of information spilloversamong agents in different treatment groups, agents were not informedof the existence or type of rewards when they were first invited toparticipate in the training for condom distribution. This reconciles ourfinding that incentives do not affect the selection of agents into thejob with earlier evidence from the private sector and from the laborato-ry that suggests substantial selection effects (Bandiera et al., 2007;Dohmen and Falk, 2011; Larkin and Leider, 2012; Lazear, 2000; Lazearet al., 2012). In general, we expect incentives to affect selection, sincedifferent schemes might attract different numbers and types of agents.This is likely to be particularly relevant in the social sector to the extentthat organizations are better off by hiring agents who are attracted bythe mission as opposed to a generous incentive scheme.
The secondkey feature of our setting is that the task at hand is not theagents' main occupation and the agents we study have selectedentrepreneurship in the private sector as their main occupation. Non-financial rewardsmight bemore effective for them because they rewardthe only pro-social component of their jobs. On the other hand, if non-financial rewards interact with the agents' pro-social motivation, theymight be even more effective for agents who self-select into the socialsector as their main occupation. Ultimately, to assess whether and hownon-financial rewards can be effective in other settings, future researchwill need to provide evidence on how the nature of the reward interactswith the nature of the task to attract, motivate and retain employees.
Acknowledgments
We thank Jim Andreoni, Anat Bracha, Tim Besley, Raj Chetty,Maitreesh Ghatak, Matt Gentzkow, Uri Gneezy, Emir Kamenica, Ian
Larkin, Imran Rasul and seminar participants at Harvard BusinessSchool, London School of Economics, London Business School, NYU,University of Chicago (Harris and Booth), University College London,University of Maryland, Cornell University, Stanford University, theBoston Federal Reserve Bank, Tufts University, the BEAM conference,Toulouse School of Economics, as well as from the University of Zurichand UCSD for helpful comments at different stages of this project.Financial support was provided by the 3ie, STICERD, WAPPP, HBSDRFD, and the Sustainability Science Program. Field implementationwould not have been possible without the support of Mannaseh Phiri,Pamela Chama, Charles Kalonga, Nicholas Shilya, Richard Harrison,Debbie Goldschmidt, Marie-Helene Cloutier, Lauren Gaydosh, ArneWeiss,MahjabeenHaji, Holly Hickling, and all of the SFH sales represen-tatives. The authors would like to especially acknowledge the dedica-tion of Patrick Mulenga.
Appendix A. Supplementary data
Supplementary data to this article can be found online at http://dx.doi.org/10.1016/j.jpubeco.2014.06.014.
References
Andreoni, J., 1990. Impure altruism and donations to public goods: a theory of warm-glow giving. Econ. J. 100 (401), 464–477.
Ariely, D., Bracha, A.,Meier, S., 2009. Doing good or doing well? Image motivation andmonetary incentives in behaving prosocially. Am. Econ. Rev. 99 (1), 544–555.
Bandiera, O.,Barankay, I., Rasul, I., 2007. Incentives for managers and inequality amongworkers: evidence from a firm-level experiment. Q. J. Econ. 122 (2), 729–773.
Bandiera, O.,Barankay, I.,Rasul, I., 2011. Field experiments with firms. J. Econ. Perspect. 25(3), 63–82.
Benabou, R., Tirole, J., 2003. Intrinsic and extrinsic motivation. Rev. Econ. Stud. 70 (3),489–520.
Benabou, R., Tirole, J., 2006. Incentives and prosocial behavior. Am. Econ. Rev. 96 (5),1652–1678.
Besley, T.,Ghatak, M., 2005. Competition and incentives with motivated agents. Am. Econ.Rev. 95 (3), 616–636.
Bhattacharyya, K.,Winch, P., 2001. Community health worker incentives and disincentives.Technical Report. BASICS II.
Chetty, R. and Saez, E. and Sandor, L. (2014). What policies motivate pro-social behavior?An experiment with referees at the Journal of Public Economics. Mimeo, HarvardUniversity.
Dal Bó, E., Finan, F., Rossi, M., 2013. Strengthening state capabilities: the role of financialincentives in the call to public service. Q. J. Econ. 128 (3), 1169–1218.
Deci, E., 1971. Effects of externally mediated rewards on intrinsic motivation. J. Pers. Soc.Psychol. 18 (1), 105–115.
DellaVigna, S., List, J.,Malmendier, U., 2012. Testing for altruism and social pressure incharitable giving. Q. J. Econ. 127 (1), 1–56.
Dixit, A., 2002. Incentives and organizations in the public sector: an interpretative review.J. Hum. Resour. 696–727.
Dohmen, T., Falk, A., 2011. Performance pay and multidimensional sorting: productivity,preferences, and gender. Am. Econ. Rev. 101 (2), 556–590.
Duflo, E.,Hanna, R.,Ryan, S., 2012. Incentives work: getting teachers to come to school.Am. Econ. Rev. 102 (4), 1241–1278.
Fryer, R., 2013. Teacher incentives and student achievement: EVIDENCE from New YorkCity public schools. J. Labor Econ. 31 (2), 373–427 (National Bureau of Economic Re-search Working Paper No. 16850).
Garber, A.,Phelps, C., 1997. Economic foundations of cost-effectiveness analysis. J. HealthEcon. 16 (1), 1–31.
Glewwe, P., Ilias, N.,Kremer, M., 2010. Teacher incentives. Am. Econ. J.: Appl. Econ. 2 (3),205–227.
Gneezy, U.,Rustichini, A., 2000. Pay enough or don't pay at all. Q. J. Econ. 115 (3), 791–810.Goette, L., Stutzer, A., 2008. Blood donations and incentives: evidence from a field
experiment. IZA Working Paper No. 3580.Government of the Republic of Zambia, 2010. Zambia country report: monitoring the
declaration of commitment on hiv and aids and the universal access biennial report.Technical report, (Lusaka, Zambia).
Grant, A., 2007. Relational job design and the motivation to make a prosocial difference.Acad. Manag. Rev. 32 (2), 393–417.
Hansen, B.,Bowers, J., 2008. Covariate balance in simple, stratified and clustered compar-ative studies. Stat. Sci. 23 (2), 219–236.
Harrison, G., List, J., 2004. Field experiments. J. Econ. Lit. 42 (4), 1009–1055.HLSP, 2007. Materials development for female condom marketing: a report on key
informant and focus group findings, Zambia. Technical Report. HLSP Limited.Imbens, G.,Wooldridge, J., 2009. Recent developments in the econometrics of program
evaluation. J. Econ. Lit. 47 (1), 5–86.Karlan, D.,McConnell, M., 2014. Hey look at me: the effect of giving circles on giving. J.
Econ. Behav. Organ. (forthcoming).

17N. Ashraf et al. / Journal of Public Economics 120 (2014) 1–17
Kube, S.,Marechal, M., Puppe, C., 2012. The currency of reciprocity: gift exchange in theworkplace. Am. Econ. Rev. 102 (4), 1644–1662.
Lacetera, N.,Macis, M.,Slonim, R., 2011. Rewarding altruism? A natural field experiment.National Bureau of Economic Research Working Paper No. 17636.
Lagarde, M. and D. Blaauw (2013). Pro-social preferences and self-selection in to ruraljobs: evidence from South African nurses. Mimeo, London School of Hygiene andTropical Medicine.
Larkin, I. (2011). Paying $30,000 for a gold star: an empirical investigation into the valueof peer recognition to software salespeople. Mimeo, Harvard Business School.
Larkin, I.,Leider, S., 2012. Incentive schemes, sorting, and behavioral biases of employees:experimental evidence. Am. Econ. J.: Microeconomics 4 (2), 184–214.
Lavy, V., 2002. Evaluating the effect of teachers? Group performance incentives on pupilachievement. J. Polit. Econ. 110 (6), 1286–1317.
Lazear, E., 2000. Performance pay and productivity. Am. Econ. Rev. 90 (5), 1346–1361.Lazear, E.,Malmendier, U.,Weber, R., 2012. Sorting in experiments with application to
social preferences. Am. Econ. J.: Appl. Econ. 4 (1), 136–163.Mathauer, I.,Imhoff, I., 2006. Health worker motivation in Africa: the role of non-financial
incentives and human resourcemanagement tools. Hum. Resour. Health 4 (1), 24–41.Meier, S., 2007. Do subsidies increase charitable giving in the long run? Matching
donations in a field experiment. J. Eur. Econ. Assoc. 5 (6), 1203–1222.Mellström, C.,Johannesson, M., 2008. Crowding out in blood donation: was Titmuss right?
J. Eur. Econ. Assoc. 6 (4), 845–863.
Miller, G.,Luo, R.,Zhang, L.,Sylvia, S.,Shi, Y.,Foo, P.,Zhao, Q.,Martorell, R.,Medina, A.,Rozelle,S., 2012. Effectiveness of provider incentives for anaemia reduction in rural China: acluster randomised trial. BMJ. Br. Med. J. 345, 1–10.
Muralidharan, K., Sundararaman, V., 2011. Teacher performance pay: experimentalevidence from India. J. Polit. Econ. 119 (1), 39–77.
Olken, B.,Onishi, J.,Wong, S., 2014. Should aid reward performance? Evidence from a fieldexperiment on health and education in Indonesia. Am. Econ. J.: Appl. Econ.(forthcoming).
Oyer, P., Schaefer, S., 2011. Personnel economics: hiring and incentives. volume 4.Elsevier, pp. 1769–1823.
Propper, C.,Van Reenen, J., 2010. Can pay regulation kill? Panel data evidence on the effectof labor markets on hospital performance. J. Polit. Econ. 118 (2), 222–273.
PSI, 2012. Family planning interventions impact estimation model. Technical Report.Population Services International.
Scott, C.E., Siegfried, J.J., 2011. American economic association universal academicquestionnaire summary statistics. Am. Econ. Rev. 101 (3), 664–667.
Soetevent, A., 2005. Anonymity in giving in a natural context: a field experiment in 30churches. J. Public Econ. 89 (11), 2301–2323.
UNAIDS,UNFPA,UNIFEM, 2004. Women and HIV/AIDS: confronting the crisis. TechnicalReport, A Joint Report by UNAIDS, UNFPA and UNIFEM.
UNFPA PATH, 2006. Female condom: a powerful tool for protection. Technical Report.UNFPA.