information, market incentives, and student performanceftp.iza.org/dp7941.pdf · information,...
TRANSCRIPT

DI
SC
US
SI
ON
P
AP
ER
S
ER
IE
S
Forschungsinstitut zur Zukunft der ArbeitInstitute for the Study of Labor
Information, Market Incentives,and Student Performance
IZA DP No. 7941
January 2014
Braz CamargoRafael CameloSergio FirpoVladimir Ponczek

Information, Market Incentives, and Student Performance
Braz Camargo Sao Paulo School of Economics – FGV
Rafael Camelo
Sao Paulo School of Economics – FGV
Sergio Firpo Sao Paulo School of Economics – FGV and IZA
Vladimir Ponczek
Sao Paulo School of Economics – FGV
Discussion Paper No. 7941 January 2014
IZA
P.O. Box 7240 53072 Bonn
Germany
Phone: +49-228-3894-0 Fax: +49-228-3894-180
E-mail: [email protected]
Any opinions expressed here are those of the author(s) and not those of IZA. Research published in this series may include views on policy, but the institute itself takes no institutional policy positions. The IZA research network is committed to the IZA Guiding Principles of Research Integrity. The Institute for the Study of Labor (IZA) in Bonn is a local and virtual international research center and a place of communication between science, politics and business. IZA is an independent nonprofit organization supported by Deutsche Post Foundation. The center is associated with the University of Bonn and offers a stimulating research environment through its international network, workshops and conferences, data service, project support, research visits and doctoral program. IZA engages in (i) original and internationally competitive research in all fields of labor economics, (ii) development of policy concepts, and (iii) dissemination of research results and concepts to the interested public. IZA Discussion Papers often represent preliminary work and are circulated to encourage discussion. Citation of such a paper should account for its provisional character. A revised version may be available directly from the author.

IZA Discussion Paper No. 7941 January 2014
ABSTRACT
Information, Market Incentives, and Student Performance* This paper uses a discontinuity on the test score disclosure rules of the National Secondary Education Examination in Brazil to test whether test score disclosure affects student performance, the composition of students in schools, and school observable inputs. We find that test score disclosure has a heterogeneous impact on test scores, but only increases average test scores in private schools. Since test score disclosure has no impact on student composition and school observable inputs in both public and private schools, our results suggest that test score disclosure changes the behavior of teachers and school managers in private schools by affecting the market incentives faced by such schools. We also develop a model of school and student behavior to help explain our empirical findings. JEL Classification: I20, I21 Keywords: test score disclosure, market incentives, public and private schools Corresponding author: Vladimir Ponczek Escola de Economia de São Paulo Rua Itapeva 474 São Paulo 01332-000 Brazil E-mail: [email protected]
* An earlier version of this paper circulated under the title “Test Score Disclosure and Student Performance.” We benefitted from conversations with Aureo de Paula, Juan Dubra, and Miguel Urquiola, and from the input of various conference and seminar participants. Performance.” We benefitted from conversations with Aureo de Paula, Juan Dubra, and Miguel Urquiola, and from the input of various conference and seminar participants. Camargo gratefully acknowledges financial support from CNPq. Camelo gratefully acknowledges financial support from FAPESP. Firpo gratefully acknowledges financial support from CNPq. Ponczek gratefully acknowledgesfinancial support from CNPq.

1 Introduction
The literature that studies the effect of school accountability on student performance is by now
large.1 There are two ways in which school accountability can have an impact on student perfor-
mance. First, to the extent that information about student performance provides information about
school quality, school accountability allows school actors to make better informed decisions.2 For
instance, parents can choose schools and students can adjust their effort based on information about
test scores. Second, a school accountability system that ties rewards and punishments to test scores
directly affects the incentives faced by teachers and school managers.
An important question is whether the disclosure of information about student performance is
enough to influence the behavior of teachers and school managers or one needs to provide direct,
explicit, incentives to these agents by tying pay to student performance. Test score disclosure
by itself can have an impact on the behavior of teachers and school managers if this disclosure
affects the (implicit) market incentives faced by schools. The disclosure of information about
student performance affects the market incentives faced by schools when school revenues depend
on (market) perceptions about school quality, in which case teachers and school managers can react
to test score disclosure even in the absence of an explicit link between pay and student performance.
In this paper, we take advantage of a discontinuity on the test score disclosure rules of the
National Secondary Education Exam (ENEM) in Brazil to test whether test score disclosure affects
the market incentives faced by schools in the Sao Paulo metropolitan area.3 The ENEM was created
in 1998 by the Brazilian Ministry of Education to assess the proficiency of high school graduates
in the country. In 2006 the Ministry of Education established that starting with the 2005 ENEM,
schools with 10 or more ENEM takers in a year would have their average ENEM score in the year
publicly released.
We use a regression discontinuity design to estimate the impact of the disclosure of the average
2005 ENEM scores on: (i) the performance of students in the 2007 ENEM; (ii) the composition of
1See Figlio and Loeb [2011] for a comprehensive survey.2It is not consensual that test scores provide a clear signal of school quality. Mizala et al. [2007] shows that in
Chile average test scores are very volatile and highly correlated with students’ socioeconomic status.3The Sao Paulo metropolitan area is the largest metropolitan area in Brazil, with close to 20 million inhabitants.
2

students in schools in 2007; and (iii) the school observable inputs in 2007. Our results indicate that
in the 2007 ENEM the treated private schools on average outperformed the control private schools
by 0.2 to 0.7 standard deviations of the private schools’ test score distribution.4 The treated public
schools did not outperform the control public schools in the 2007 ENEM, though. We also do
not find evidence that treated schools, whether public or private, adjusted their observable inputs
from 2005 to 2007, or that there were significant changes in the composition of students in treated
schools over the same period of time. Finally, we find heterogeneous effects on 2007 ENEM
scores among the treated schools. Treated private schools that had average 2005 ENEM scores
below the median average score of the private schools presented better results in 2007 than the
control private schools that had average 2005 ENEM scores in the same group. On the other hand,
treated public schools that had average 2005 ENEM scores above the median average score of the
public schools presented worse results in 2007 than the control public schools that had average
2005 ENEM scores in the same group.5
Taken together, our empirical results provide evidence that test score disclosure affects the
market incentives faced by private schools. Indeed, the fact that test score disclosure does not seem
to affect either the composition of students or the observable inputs in treated schools suggests that
test score disclosure acts by changing the behavior of students, teachers, and school managers
in treated schools. Since teachers and managers in Brazilian public schools have job stability
and their earnings are not related to student performance, market incentives should be stronger in
private schools.6 Moreover, the ENEM is disassociated from any hard accountability policies in
Brazil.7 Hence, the only channel through which the disclosure of average ENEM scores can have
an impact on the behavior of teachers and school managers is by affecting the market incentives
4We refer to the schools that had their average 2005 ENEM scores released in 2006 as the treated schools.5The disclosure of the average 2005 ENEM scores took place in February of 2006, roughly 6 months before the
2006 ENEM, when it was probably too late for the disclosure to have an impact on student performance in 2006.In order to check for this possibility, we ran all our regressions for the effect of test score disclosure on studentperformance using the 2006 sample instead of the 2007 sample and found no statistically significant results.
6The wages in Brazilian public schools are set by the government and vary exclusively with tenure and schoolinglevel. The lack of market incentives in public schools is not exclusive to Brazil. Podgursky and Springer [2011] discusshow in the U.S. the public school system is, in general, lacking in market incentives.
7In 2008, and so after the period we analyze, the state of Sao Paulo announced and implemented performance-based payments for teachers and principals in state schools. The payments depend on the schools’ average test scoresin the SARESP proficiency exam. The SARESP exam is mandatory for students in the 5th, 9th, and 12th grades but astudent’s score has no direct consequence for the student. Students in private schools do not take the exam.
3

faced by their schools. Consequently, a difference in the impact of test score disclosure on average
test scores between public and private schools indicates that test score disclosure has an effect on
the market incentives faced by private schools.
The heterogeneous impact of test score disclosure on test scores shows that it is not obvious
a priori how test score disclosure should affect average test scores. Moreover, the fact that public
schools face weaker market incentives implies that students in public schools should react differ-
ently to test score disclosure than students in private schools, and this can partly offset the impact
of the weaker reaction of public schools to test score disclosure. In order to address these issues,
in this paper we also develop a formal model of school and student behavior in which public and
private schools only differ in terms of the market incentives they face to help explain our empirical
findings. Namely, that test score disclosure can have a heterogeneous impact on test scores in both
public and private schools but only increase average test scores in private schools.
The rest of the paper is organized as follows. The remainder of the Introduction discusses
the related literature. Section 2 discusses the ENEM in more detail. Section 3 describes our data
and presents some descriptive statistics. Section 4 discusses our identification strategy. Section 5
presents and discusses our empirical results. Section 6 presents our model of school and student
behavior and discusses how the model can explain our empirical findings. Section 7 concludes.
The Appendix contains omitted details and proofs.
Related Literature
The literature has found evidence that test score disclosure influences perceptions about school
quality and can thus affect school revenues. For instance, Black [1999], Figlio and Lucas [2004],
and Fack and Grenet [2010] find that school test score reports affect housing prices. Hastings
and Weinstein [2008] find for schools in the Charlotte-Mecklenburg public school district in the
US that the fraction of parents choosing higher-performing schools increases after information on
school test scores becomes available. Machin and Salvanes [2010] find that in Oslo, allowing
parents greater freedom in choosing schools affects housing prices. Koning and van der Wiel
[2013] find for schools in the Netherlands that a drop in a publicly available ranking of school
quality is correlated with a decrease in the number of entering students. Figlio and Kenny [2009]
4

find that private contributions to schools in Florida are responsive to school grades.8
Our paper belongs to the literature that studies the impact of information disclosure on student
performance. Unlike the literature that investigates the impact of hard accountability systems on
student performance, we are able to analyze the informational effect of test score disclosure on
student performance; hard accountability systems not only change the information available to the
school actors, but also directly affect the incentives faced by teachers and school managers.9
The papers most closely related to ours are Andrabi et al. [2009] and Koning and Wiel [2012].
Koning and Wiel [2012] find that in the Netherlands, average grades go up in schools that are
poorly evaluated in a national newspaper ranking. Koning and Wiel [2012] do not distinguish
between public and private schools, though, and thus cannot evaluate the impact of test score
disclosure on the market incentives face by schools. Andrabi et al. [2009] study the impact of
releasing to parents report cards with student and school academic performance in Pakistan. They
find similar results to us. In particular, they find that the impact of test score disclosure on student
performance is much larger in private schools than in public schools. An important difference be-
tween Andrabi et al. [2009] our work is that while the release of report cards provides information
about student ability and school quality at the same time, the disclosure of the average ENEM
scores from a previous cohort of ENEM takers only provides information about school quality.
Finally, our paper is also related to the literature that studies how the disclosure of information
about the quality of public schools affects incentives in the public sector. Hussain [2009] shows
that disclosing school quality ratings affects the future wages of school principals in England.
However, unlike in Brazil, public schools in England have a governing board responsible for hiring
and setting principals’ wages. Firpo et al. [2012] find that the re-election probability of mayors
in Brazil depends on how the schools under their administration—municipalities in Brazil are
responsible for the public primary schools—are ranked according to a newly created index to
assess the quality of primary public schools.
8On the other hand, Mizala and Urquiola [2009] find no consistent effect on the enrollment, tuition, and socioeco-nomic characteristics of students in Chilean schools that are identified as being outstanding.
9There is a substantial literature that studies the impact of hard accountability systems on student performance.See, e.g., Hanushek and Raymond [2005], Dee and Jacob [2009], Bacolod et al. [2009], Chiang [2009], Rockoff andTurner [2010], and Muralidharan and Sundararaman [2011].
5
2 Institutional Background: ENEM
The ENEM is a non-mandatory exam organized by the National Institute of Educational Studies
and Research (INEP), which is part of the Brazilian Ministry of Education (MEC). Until 2008,
the ENEM was a one-day exam consisting of 63 multiple-choice questions covering four different
subjects and an essay, and its scores were in a 0 to 100 scale standardized to have a mean of 50.10
Only graduating high school students, that is, those students enrolled in the last grade of high
school, and students who have already graduated from high school can take the ENEM.
The number of universities in Brazil (public and private) that use the ENEM as an admission
exam has increased substantially since its creation and by now the ENEM is commonly used in
the admission process of universities.11 The ENEM is also used to select the beneficiaries of the
Federal College Voucher Program (ProUni).
The fact that the ENEM is non-mandatory may raise questions about the selectivity of our
sample. In this regard, we should note that the number of graduating high school students taking
the ENEM has greatly increased over time. From 2001 to 2008, the take-up rate in the Sao Paulo
metropolitan area increased from 26.1% to 70.9% in public schools and from 29.1% to 87.8% in
private schools.12
A school’s average ENEM score is computed using only the ENEM score of its graduating
students, that is, the ENEM scores of students from a given school who have already graduated do
not count towards the school’s average ENEM score. Moreover, for the purpose of determining
whether a school’s average ENEM score is publicized, the number of takers in the school is given
by its graduating students only. So, for example, a school that has 20 takers but only 9 of them are
graduating from high school in that year does not have its average ENEM score disclosed.
School average ENEM scores are available at the INEP’s website. Figure 1 shows how average
ENEM scores by school appear at the INEP’s website.13 Although the INEP’s website does not
10After 2008, the ENEM became a two-day exam consisting of 180 multiple-choice questions and an essay, with itsscores determined using Item Response Theory.
11The number of students admitted to universities based on their ENEM score was 741,013 in 2006.12Over the same period of time, the take-up rate in the whole country increased from 31.4% to 61.8% in public
schools and from 25.21% to 72% in private schools.13http://sistemasenem4.inep.gov.br/enemMediasEscola.
6
contain a ranking of schools based on their average ENEM scores, several newspapers in Brazil
produce local, regional, and national rankings. Figure 2 shows a newspaper ranking from a major
newspaper in Brazil that circulates in the state of Sao Paulo. Despite the fact that there is no
hard accountability system based on school average ENEM scores, managers, professors, parents,
and students care about their schools’ average ENEM scores. For instance, real state websites
inform the average ENEM score of the schools near a given location.14 Also, many private schools
advertise their average ENEM score on the media and in their websites.
[Insert Figures 1 and 2 around here]
3 Data
We use the 2005 and 2007 ENEM micro databases and the 2005 and 2007 School Census. The
ENEM databases have information on students’ test scores and schools, as well as information on
students’ socioeconomic characteristics such as age, race, and family income, among others. The
School Census has information on school observable inputs such as student-to-teacher ratio and
teachers’ and managers’ schooling, among others.
Using the ENEM micro database, we can calculate the number of takers for each school in a
given year. Therefore, we are able to recover individual ENEM scores for schools below and above
the cutoff point of 10 exam takers. Since we have access to individual results, we can calculate
school average scores. The ENEM micro databases only became available in 2010, so in 2007
students, teachers, and managers in schools with fewer than 10 exam takers had no access to their
schools’ average ENEM scores in 2005.
Tables 1 and 2 report some descriptive statistics for both public and private schools. First, as ex-
pected, students enrolled in larger private schools have higher scores and better socio-demographic
characteristics than students enrolled in smaller private schools. However, larger private schools
do not present better observable inputs than the smaller private schools. This first view of the data
suggests that for private schools, size maybe correlated with student composition, but not necessar-
ily with school observable inputs. For public schools, the pattern seems to be the opposite, though.14See www.zap.com.br, for example.
7

In the one hand, there is no clear association between school size and student composition. On the
other hand, the data suggests that larger public schools are better equipped than smaller ones.
Finally, as expected, we find large differences between private and public schools in Brazil.
On average, students in private schools have better socio-demographic characteristics and private
schools have better observable inputs.15
[Insert Tables 1 and 2 around here]
4 Empirical Strategy
We take advantage of the exogenous test score disclosure rule for the 2005 ENEM to estimate the
reduced-form causal effects of test score disclosure on: (i) the composition of students in schools
in 2007; (ii) the school observable inputs in 2007; and (iii) the 2007 ENEM scores. We also
investigate whether test score disclosure has a heterogeneous impact on student performance by
analyzing the effect of test score disclosure on the 2007 ENEM scores for two different sets of
schools, the set of schools with average 2005 ENEM scores above the median (average score) and
the set of schools with average 2005 ENEM scores below the median. In order to investigate the
impact of test score disclosure on the market incentives of schools, we work with public and private
schools separately.
Consider the following specification:
Yis = αY + βY · ds + φY (T2005s − 10) + ds · ψY (T2005s − 10) + εY,is, (1)
where T2005s is the number of graduating students taking the ENEM in 2005 in school s and
ds = 1 if, and only if, T2005s is at least 10. For a given outcome variable of interest Y in 2007,
we are interested in the impact on Y of the publication of the average 2005 ENEM score. The
functions φY and ψY are flexible functions of the running variable. We consider several different
specifications for φY and ψY , from non-parametric ones (local linear regressions) to higher-order
15Although the tables do not allow for a comparison of test scores between private and public schools, since testscores are standardized within each group of schools, the raw data shows that, on average, the test scores of studentsfrom private schools are almost one standard deviation above the test scores of students from public schools.
8

polynomials. The variable εY,is is an unobservable term that is mean-independent of d at T2005 =
10 under usual assumptions on the continuity of φY and ψY at T2005 = 10.16 The coefficient βY
measures the impact of test score disclosure on Y . We run the regressions at the student level (i)
and cluster the standard errors at the school level (s).
It is possible that any observable differences we find in 2007 between schools in the treated
and control groups are due to the fact that schools in these two groups face different probabilities
of having their average 2007 ENEM scores released. In Section 6, when we present our model
of school and student behavior, we discuss how different probabilities of test score disclosure in
2007 could affect the behavior of teachers and schools managers, leading to changes in effort and
school observable inputs. However, the relevant group of schools in our sample are the schools
close to the treatment discontinuity.17 As such, it is unlikely that managers and teachers in schools
where slightly less than 10 graduating students took the ENEM in 2005 and managers and teachers
in schools where slightly more than 10 graduating students took the ENEM in 2005 would (on
average) face different probabilities of test score disclosure in 2007. Thus, it seems reasonable
to conjecture that any differences we find between treated and control schools comes from the
informational shock associated with test score disclosure.
There two important conditions for the validity of the regression discontinuity design (RDD).
First, that there is no manipulation of the running variable. Second, that there are no pre-existing
systematic differences between schools above and below the treatment discontinuity. If either of
these conditions are not met, then we cannot assign to the disclosure of test scores a causal impact
on the outcome variables of interest; there would be confounding factors affecting the outcome
variables beyond test score disclosure.
We check the validity of the RDD by: (i) observing whether there are jumps in the histogram
of the running variable around the cutoff point of 10 ENEM takers; and (ii) using the 2005 ENEM
results, the composition of students in schools in 2005, and the school observable inputs in 2005
as outcome variables to see if there are any significant pre-existing differences between schools
16See Hahn et al. [2001], Imbens and Lemieux [2008], and Lee and Lemieux [2010] for a discussion of the regres-sion discontinuity design methodology.
17There are 436 schools close to the treatment discontinuity (with 1 to 19 ENEM takers). Out of those schools, 103are public and 333 are private.
9

above and below the treatment discontinuity. A jump in the histogram of the running variable
around the cutoff point of 10 ENEM takers would indicate that either students or schools were able
manipulate test score disclosure in 2005. In this case, any systematic difference between schools
above and below the treatment discontinuity could be attributed to unobserved factors correlated
with the decision to have test scores disclosed in 2005. Significant pre-existing differences between
schools above and below the treatment discontinuity would imply that test score disclosure is not
the causal factor explaining the differences in the outcomes variables observed in 2007.
Notice that even if the conditions for the validity of the RRD hold, this does not necessarily
mean that test score disclosure is the main mechanism explaining the differences in the outcome
variables observed in 2007. For instance, it is possible that any difference in 2007 ENEM scores
between schools above and below the treatment discontinuity happens by chance. To discard this
possibility, we run specification (1) using several false cutoff points as placebo tests.
5 Data Analysis
In this section, we first check the impact of test score disclosure on student composition, school
observable inputs, and average test scores. We then check how the effect of test score disclosure
on test scores depends on whether a school’s average 2005 ENEM score is above or below the
median. Finally, we check the validity of the RDD and the robustness of our results.
5.1 Student Composition and School Observable Inputs
Table 3 shows our estimates for differences in the characteristics of the 2007 ENEM takers between
treated and control groups for both types of schools (public or private). We consider the following
student characteristics: gender, average age, race, parental education, and family income. The first
three columns of the table show the results for private schools, while the last three columns show
the results for public schools. We report the results for local linear regressions and second-order
polynomial regressions.18
18As suggested by Fan and Gijbels [1996] and Imbens and Lemieux [2008], we use triangular kernels and optimalbandwidth for the local linear regressions. The results for other specifications corroborate our main findings and areavailable upon request.
10

We find that there are no consistently significant differences in student composition for both
types of schools. For private schools, we find that student age is lower for treated schools at the
10% significance level only for the local linear specification. Taking into account that we are
testing six student characteristics separately and using two specifications for each one, it comes as
no surprise that we find one significant difference. The same reasoning holds for public schools.
There, the only characteristic for which we find a significant difference between treated and control
schools is father’s income. However, the sign for the parametric specification is the opposite of the
sign for the non-parametric specification.
[Insert Table 3 around here]
The finding that test score disclosure has no impact on the composition of students in schools
is indicative that switching schools is not feasible in the short-run; not much time elapsed between
the release of the average 2005 ENEM scores in 2006 and the 2007 ENEM. In this case, students
(and their parents) could only react to test score disclosure by altering their effort.
Table 4 shows that test score disclosure had no consistently significant impact on school ob-
servable inputs in 2007. We consider the following inputs: the total number of enrolled students,
the number of students enrolled in the third grade, the proportion of teachers with college degree,
the ratios of computers, staff, and teachers to students, and the probability of having computer and
science labs. The significant impact of test score disclosure on student enrollment and staff-to-
student ratio in public schools is not robust to different specifications.
[Insert Table 4 around here]
In the same way that switching schools is likely to be infeasible for students in the short-run,
changing school observable inputs is also likely to be infeasible for schools in the short-run. This
can help explain why test score disclosure does not seem to affect school observable inputs.
5.2 Average Test Scores
Table 5 together with Figures 3 and 4 provide evidence that test score disclosure had a strong
positive impact on average 2007 ENEM scores for private schools, but no impact on average 2007
11

ENEM scores for public schools. Figures 3 and 4 depict the linear relationship between average
test scores and the number of graduating ENEM takers for private and public schools, respectively.
The increase on average test scores for private schools above the treatment discontinuity is evident.
[Insert Figures 3 and 4 around here]
Table 5 reports parametric and non-parametric specifications of the relationship between test
score disclosure and average 2007 ENEM scores.19 The result that for private schools, test score
disclosure had a positive impact on average test scores is robust across all specifications we consid-
ered. We find that for private schools, test score disclosure increased average 2007 ENEM scores
by 0.2 to 0.7 standard deviations of the private schools’ test score distribution.20 These are sizeable
effects. On the other hand, we find that for public schools, test score disclosure had no statis-
tically significant effect on average 2007 ENEM scores; test score disclosure increased average
2007 ENEM scores in public schools by -0.051 to 0.286 standard deviations of the public schools’
test score distribution.
[Insert Table 5 around here]
5.3 Heterogenous Effects
It is reasonable to expect that the reaction of a school actor to test score disclosure depends on the
average 2005 ENEM score in his school. In order to test for such heterogeneity, we split the sample
of schools of a given type in two sub-samples, the schools with average 2005 ENEM scores above
and below the median average score of the schools of the given type, and run the regression for
the effect of test score disclosure on test scores for each of the two sub-samples separately. Note
that when ranking schools according to their average 2005 ENEM scores, we included the schools
that did not have their average ENEM scores released in 2005, so that the comparison is between
schools that are similar ex-ante.19We also ran non-parametric regressions using two different bandwidths, two different kernels (rectangular and
triangular) and polynomial regressions of three different orders with two different windows for the running variable.The results are available upon request.
20The results do not change if we condition on student and school characteristics.
12
Table 6 reports the impact of test score disclosure on 2007 ENEM scores for the two sub-
samples under consideration. For private schools, the impact of test score disclosure is positive
for the schools below the median, but not significant for the schools above the median.21 For
public schools, the impact of test score disclosure on test scores is negative for the schools above
the median (local linear regressions), but not significant for the schools below the median. These
results suggest that school actors perceive effort as a substitute for school quality.
[Insert Table 6 around here]
5.4 Confounding Factors and Robustness
We make use of a discontinuity in the disclosure rule for the average ENEM scores of schools to
test for the impact of test score disclosure on a number of variables of interest. In order to test
whether schools manipulated their number of ENEM takers in 2005, we check whether there is a
jump in the frequency of schools at the treatment discontinuity. Figure 5 shows that there is no
discernible jump at the treatment discontinuity. This evidence is not surprising. The ENEM is a
voluntary exam and schools only learned about the test disclosure rule several months after the
2005 ENEM took place.
[Insert Figure 5 around here]
As further evidence that schools did not manipulate their number of ENEM takers in 2005,
Figures 6 and 7 show that there is no discontinuity in the 2005 ENEM scores at the treatment
discontinuity. Furthermore, we do not find statistically significant differences in student character-
istics and school observable inputs in 2005 between treated and control schools.22
21One could argue that the effect we find for the below-the-median treated private schools is due to a “catching up”effect. If this were the case, then one should also expect catching up to take place in control private schools, implyingan insignificant impact of treatment on below-the-median private schools. It is possible that treatment may strengthenthe catching up effect in private schools, though. This, however, would mean that test score disclosure does have animpact on student performance in private schools.
22Tables with the regression results are available upon request. Another concern is that schools manipulated theirnumber of ENEM takers in 2007. However, as already discussed in the text, the ENEM is a voluntary exam and thetake-up rate is high. Besides, there is no reason to believe that treated and control schools could affect their students’decision to participate in the 2007 ENEM differently.
13

[Insert Figures 6 and 7 around here]
One could also conjecture that treated private schools with low average 2005 ENEM scores
were more likely to close before 2007. If this were the case, then our results on the impact of
test score disclosure on the average test scores of private schools would be biased due to selection
among treated private schools. However, only 50 private schools in the entire sample close between
2005 and 2007. Moreover, there is no significant difference in school mortality between treated
and control private schools. No public school closes between 2005 and 2007.
Finally, we falsify the treatment discontinuity and use cutoff points other than 10 (ENEM)
takers for private schools. We run the non-parametric regression (local linear regressions with
optimal bandwidth) for the impact of test score disclosure on test scores for all false cutoff points
from 1 to 19 takers. Except for the false cutoff point of 12 takers, we find that the placebo treatment
has no significant effect on test scores. Figure 8 depicts the z-test for the treatment effect for all
false cutoff points tested.23 The likely reason for why we find that test score disclosure has a
negative impact on average test scores with the false cutoff point of 12 takers is the large increase
in the average 2007 ENEM score for the private schools with 11 takers in 2005. One can then
conjecture that this increase explains the effect of test score disclosure on test scores that we find
for private schools. In order to test for this possibility, we run the true regression dropping from
the sample the private schools with 9 and 11 takers in 2005. The effect remains. However, when
we do the same with the false cutoff of 12 takers (now dropping the schools with 11 and 13 takers
in 2005), the results become insignificant.24
[Insert Figure 8 around here]
6 Test Score Disclosure and Market Incentives
We now develop a model of school and student behavior to help explain how test score disclosure
can have a heterogeneous impact on test scores but, because of differences in market incentives
23We do the same exercise for public schools and find no significant results for all false cutoff points tested forprivate schools. Results and graphs are available upon request.
24Results are available upon request.
14

between public and private schools, increase average test scores only in private schools. The model
we develop abstracts from the impact of test score disclosure on both the composition of students
in schools and the school observable inputs. Doing so is reasonable given that we find no evidence
that the observable characteristics of students or the school observable inputs changed from 2005
to 2007 in treated schools.
The rest of this section is organized as follows. We introduce the model in Subsection 6.1 and
determine its unique equilibrium in Subsection 6.2. In Subsection 6.3, we use the model to study
the impact of test score disclosure on test scores.
6.1 Setup
There is a finite number of schools, which are either public or private. For simplicity, we assume
that each school has a representative (average) student. We do not distinguish between teachers and
school managers and assume that each school has a single agent, which we refer to as a manager,
responsible for the school’s functioning. The only difference between public and private schools
will be in terms of the incentives faced by their managers.
A student cares about his test (ENEM) score since it affects his future career. A manager in a
private school also cares about the test score of the student in his school through a career concerns
mechanism in which test scores signal school quality, and so affect school revenues.25 Managers
in public schools do not care about test scores.
Test Scores and School Quality The (expected) test score of a student in a given school is
τ = τ − 1
2(vmax − v + emax − e+ amax − a)2,
where τ > 0 is a constant, a ∈ [0, amax] is the student’s effort, e ∈ [0, emax] is the (school)
manager’s effort, and v ∈ [0, vmax] measures the school’s quality.26 A higher v means higher
25The model we consider can be thought of as a reduced-form version of a dynamic model of managerial effortalong the lines of Holmstrom [1999]. Considering a dynamic model of managerial effort would complicate the analysiswithout bringing any new insights.
26School managers can also engage in costly changes of school observable inputs such as hiring more qualifiedteachers. Since school quality and manager effort are substitutes, it does not matter for our analysis whether costlychanges of school observable inputs represent changes in v or changes in e. Besides, we found no evidence that test
15
school quality in the sense that smaller effort, whether from the student or from the manager, is
necessary for the same grade. The disutility of effort a for the student is c(a), while the disutility
of effort e for the manager is λ(e). The functions c and λ are two times differentiable, strictly
increasing, and strictly convex, with λ′(0) = c′(0) = 0. We also assume that c′(a) is convex in a.27
A school’s quality depends on both observable and unobservable characteristics of the school.
The observable characteristics of a school are its observable inputs, while the unobservable char-
acteristics of a school are the ability of its manager. Controlling for school observable inputs, the
only differences in school quality are idiosyncratic differences in unobservable quality. Since we
are interested in studying the impact of the disclosure of information about the unobservable com-
ponent of school quality on the behavior of school actors, we omit the dependence of v on school
observable inputs for ease of exposition. We assume that v is unknown to students and managers
and that the value of v for each school is an independent random draw from a strictly positive
probability density function ω.
Information Disclosure Besides being public or private, schools also differ in the information
their students and managers have before making their effort choices. A school is treated if its
manager and student observe a signal ξ ∈ [ξmin, ξmax] about v before choosing their effort. The
signal ξ captures the information about the ability of a school’s manager that comes from observing
the test score from a previous student of the school; a high ξ corresponds to a high test score. For
each v ∈ [0, vmax], the signal ξ ∈ [ξmin, ξmax] is drawn from a strictly positive probability density
function `(·|v). We describe the event that a school is in the control group by saying that its
manager and student observe the signal ξ = ∅.
We know from the empirical analysis that treated and control schools of each type do not differ
in terms of their observable inputs and the characteristics of their students. This evidence validates
the exogeneity of the treatment assignment. Hence, we assume that an independent random draw
by nature determines whether a school is treated.
score disclosure has an impact on school observable inputs.27Note that a student’s test score does not depend on her ability. Our analysis immediately extends to the case
in which student ability affects test scores through τ . More generally, we can interpret the results of our model asdescribing the effect of test score disclosure on test scores controlling for student ability.
16

Let µ(ξ) be the posterior belief about v for a school with signal ξ. We assume the family
`(·|v)v of density functions is such that the likelihood ratio `(ξ1|v)/`(ξ2|v) is strictly increasing
in v for all ξ1 > ξ2 in [ξmin, ξmax], that is, the family `(·|v)v has the strict monotone likelihood
ratio property (MLRP). In words, the greater the value added of a treated school, the more likely
it is that its manager and student observe a high signal of school quality. Well-known results, see
Milgrom [1981], show that if the family `(·|v)v has the strict MLRP, then µ(ξ1) dominates µ(ξ2)
in the strict first-order stochastic sense for all ξ1 > ξ2 in [ξmin, ξmax].
Timing, Strategies, and Equilibrium The timing of events in a school is as follows. First,
nature determines whether the school is treated or not. Then, the school’s manager makes his
choice of effort, followed by the student. This order of moves seems reasonable since it is much
easier for a student to observe the effort of her school than the other way around. A strategy for a
manager is a map e : ∅∪[ξmin, ξmax]→ [0, emax] such that e(ξ) is the manager’s effort if the signal
he observes is ξ, while a strategy for a student is a map a : [0, emax]×(∅∪[ξmin, ξmax])→ [0, amax]
such that a(e, ξ) is the student’s effort if the manager’s effort is e and the signal the student observes
is ξ. An equilibrium for a school of a given type (public or private) is a strategy pair (e, a) such
that: (i) for all ξ, e(ξ) is optimal for the manager given the school’s type and the strategy a for the
student; and (ii) for all pairs (e, ξ), a(e, ξ) is optimal for the student.
6.2 Equilibrium Behavior
Here, we compute the unique equilibrium of the game under consideration. We first determine the
optimal choice of effort for a student given the signal ξ about the quality of her school and the
effort e of her school’s manager. Given the solution to the students’ problem, we determine the
optimal choice of effort for a manager as a function of the signal ξ about the quality of his school.
Student Effort Let u(a, e, ξ) be the expected payoff to a student who chooses effort a when the
manager in his school exerts effort e and the signal about school quality is ξ. Then
u(a, e, ξ) = τ − 1
2Eµ(ξ)
[(vmax − v + emax − e+ amax − a)2
]− c(a),
17

where Eµ(ξ) denotes the expectation with respect to µ(ξ). Now let ν(ξ) = Eµ(ξ)[v] and denote the
inverse of g(a) = c′(a) + a by h(x). Since g(a) is strictly increasing and convex in a, h(x) is
strictly increasing and concave in x. Besides, h′(x) = [1 + c′′(h(x))]−1 < 1, and so h(x) < x for
all x ∈ [0, g(amax)] given that h(0) = 0. When vmax − ν(ξ) + emax − e < c′(amax), the choice
a∗(e, ξ) of student effort that maximizes u(a, e, ξ) is
a∗(e, ξ) = h(vmax − ν(ξ) + emax − e+ amax) (2)
We assume that vmax + emax < c′(amax), so that (2) holds regardless of e and ξ.
Let Eξ denote the unconditional expectation with respect to ξ for treated schools. We show
in Lemma 6 in the Appendix that Eξ[ν] = ν(∅), and that ν(ξ) is strictly increasing in ξ when
ξ ∈ [ξmin, ξmax], with ν(ξmin) < ν(∅) < ν(ξmax). Lemma 1 below follows immediately from the
properties of h(x) and ν(ξ).
Lemma 1. a∗(e, ξ) is strictly decreasing in both e and ξ. Moreover, ∂a∗(e, ξ)/∂e > −1 and
∂a∗(e, ξ)/∂ξ > −ν ′(ξ).
The intuition for Lemma 1 is simple. By assumption, school quality, manager effort, and
student effort are substitutes. Moreover, the production function for test scores is strictly concave
in school quality and in student and manager effort. Hence, the (expected) marginal benefit of
student effort is strictly decreasing in manager effort and expected school quality. However, the
marginal cost of effort for a student is strictly increasing in the student’s effort, and so the rate at
which a student decreases her effort in response to an increase in either manager effort or expected
school quality is smaller than the rate at which manager effort and expected school quality increase.
Manager Effort It is clear that the optimal choice of effort for managers in public schools is zero
regardless of the signal they observe. Consider now the behavior of managers in private schools.
Let π(e, ξ) be the expected payoff to a manager who exerts effort e when the signal about school
quality is ξ and the effort choice of the student in the manager’s school is given by (2). Then
π(e, ξ) = τ − 1
2Eµ(ξ)
[(vmax − v + emax − e+ amax − a∗(e, ξ))2
]− λ(e).
18
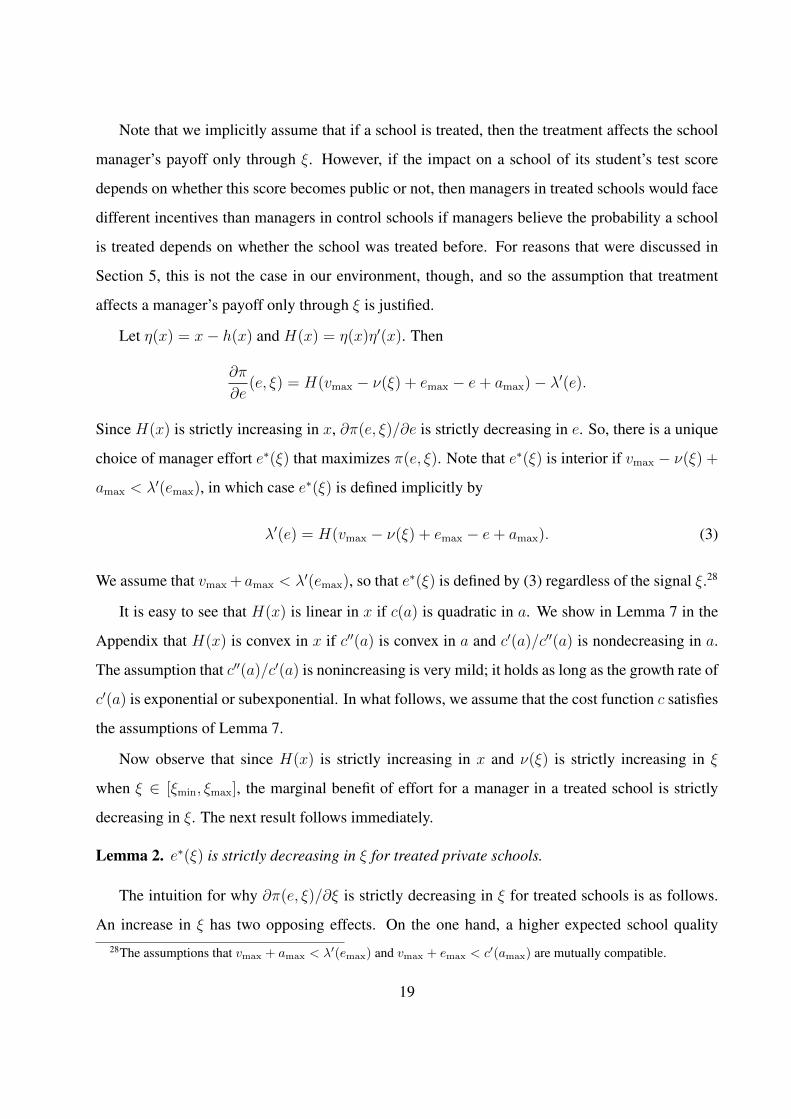
Note that we implicitly assume that if a school is treated, then the treatment affects the school
manager’s payoff only through ξ. However, if the impact on a school of its student’s test score
depends on whether this score becomes public or not, then managers in treated schools would face
different incentives than managers in control schools if managers believe the probability a school
is treated depends on whether the school was treated before. For reasons that were discussed in
Section 5, this is not the case in our environment, though, and so the assumption that treatment
affects a manager’s payoff only through ξ is justified.
Let η(x) = x− h(x) and H(x) = η(x)η′(x). Then
∂π
∂e(e, ξ) = H(vmax − ν(ξ) + emax − e+ amax)− λ′(e).
Since H(x) is strictly increasing in x, ∂π(e, ξ)/∂e is strictly decreasing in e. So, there is a unique
choice of manager effort e∗(ξ) that maximizes π(e, ξ). Note that e∗(ξ) is interior if vmax − ν(ξ) +
amax < λ′(emax), in which case e∗(ξ) is defined implicitly by
λ′(e) = H(vmax − ν(ξ) + emax − e+ amax). (3)
We assume that vmax + amax < λ′(emax), so that e∗(ξ) is defined by (3) regardless of the signal ξ.28
It is easy to see that H(x) is linear in x if c(a) is quadratic in a. We show in Lemma 7 in the
Appendix that H(x) is convex in x if c′′(a) is convex in a and c′(a)/c′′(a) is nondecreasing in a.
The assumption that c′′(a)/c′(a) is nonincreasing is very mild; it holds as long as the growth rate of
c′(a) is exponential or subexponential. In what follows, we assume that the cost function c satisfies
the assumptions of Lemma 7.
Now observe that since H(x) is strictly increasing in x and ν(ξ) is strictly increasing in ξ
when ξ ∈ [ξmin, ξmax], the marginal benefit of effort for a manager in a treated school is strictly
decreasing in ξ. The next result follows immediately.
Lemma 2. e∗(ξ) is strictly decreasing in ξ for treated private schools.
The intuition for why ∂π(e, ξ)/∂ξ is strictly decreasing in ξ for treated schools is as follows.
An increase in ξ has two opposing effects. On the one hand, a higher expected school quality28The assumptions that vmax + amax < λ′(emax) and vmax + emax < c′(amax) are mutually compatible.
19

decreases the marginal benefit of manager effort. On the other hand, by Lemma 1, an increase in
ξ reduces student effort, which increases the marginal benefit of manager effort. However, also by
Lemma 1, the rate at which student effort decreases with an increase in ξ is smaller than the rate at
which expected school quality increases with an increase in ξ. Thus, the first, negative, effect of an
increase in ξ on the marginal benefit of manager effort dominates and e∗(ξ) is strictly decreasing
in ξ for treated private schools.
Since ν(ξmin) < ν(∅) < ν(ξmax), managers in treated private schools can exert more or less
effort than managers in control private schools depending on the signal ξ they observe. Thus, it is
not clear how the average effort of managers in treated private schools compares with the effort of
managers in control private schools. Lemma 3 below provides conditions under which the average
effort of managers in treated private schools is greater than the effort of managers in control private
schools. This result is important when we study the impact of test score disclosure on average test
scores. Let G1(y) and G2(y) be two functions, with G1(y) strictly increasing and G2(y) convex.
We say that G1(y) is less convex than G2(y) if G−11 (G2(y)) is strictly convex. The proof of Lemma
3 is in the Appendix.
Lemma 3. Suppose λ′(e) is less convex than H(x). Then Eξ[e∗] > e∗(∅).
Note that regardless of the function H(x), the assumption of Lemma 3 is satisfied if λ′(e) is
strictly concave in e. Also note that if c(a) is quadratic in a, then the assumption of Lemma 3
only holds if λ′(e) is strictly concave in e. It follows immediately from the proof of Lemma 7
in the Appendix that H(x) is strictly convex in x if c′(a) is strictly convex in a. In this case, the
assumption of Lemma 3 can be satisfied when λ′(e) is strictly convex.
The Equilibrium Putting together the optimal behavior of students and managers derived above,
we obtain the equilibria for public and private schools. Let (e0, a0) be the strategy pair given by
e0 ≡ 0 and a0(e, ξ) = a∗(e, ξ). By construction, (e0, a0) is the unique equilibrium for public
schools. Now let (e1, a1) be such that e1(ξ) is given by (3) and a1 = a0. By construction, (e1, a1) is
the unique equilibrium for private schools. In what follows, for ease of exposition, we sometimes
refer to public schools as schools of type 0 and to private schools as schools of type 1, and use
superscripts to denote a school’s type.
20
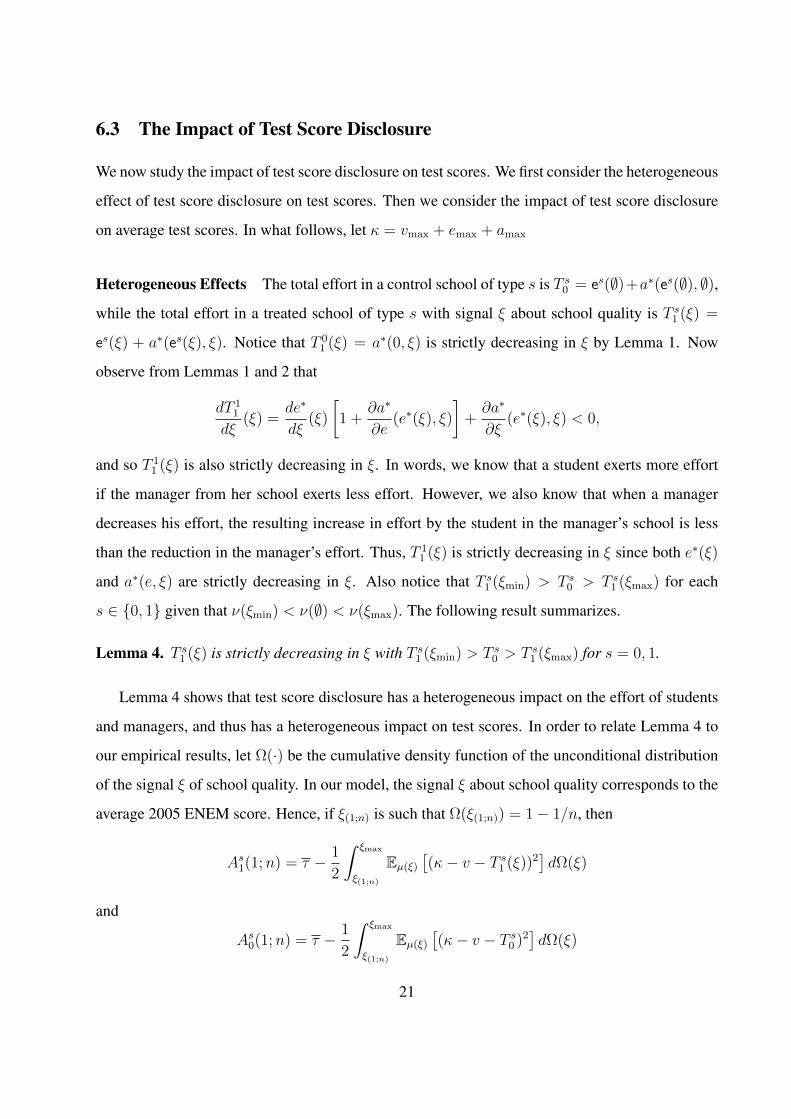
6.3 The Impact of Test Score Disclosure
We now study the impact of test score disclosure on test scores. We first consider the heterogeneous
effect of test score disclosure on test scores. Then we consider the impact of test score disclosure
on average test scores. In what follows, let κ = vmax + emax + amax
Heterogeneous Effects The total effort in a control school of type s is T s0 = es(∅)+a∗(es(∅), ∅),
while the total effort in a treated school of type s with signal ξ about school quality is T s1 (ξ) =
es(ξ) + a∗(es(ξ), ξ). Notice that T 01 (ξ) = a∗(0, ξ) is strictly decreasing in ξ by Lemma 1. Now
observe from Lemmas 1 and 2 that
dT 11
dξ(ξ) =
de∗
dξ(ξ)
[1 +
∂a∗
∂e(e∗(ξ), ξ)
]+∂a∗
∂ξ(e∗(ξ), ξ) < 0,
and so T 11 (ξ) is also strictly decreasing in ξ. In words, we know that a student exerts more effort
if the manager from her school exerts less effort. However, we also know that when a manager
decreases his effort, the resulting increase in effort by the student in the manager’s school is less
than the reduction in the manager’s effort. Thus, T 11 (ξ) is strictly decreasing in ξ since both e∗(ξ)
and a∗(e, ξ) are strictly decreasing in ξ. Also notice that T s1 (ξmin) > T s0 > T s1 (ξmax) for each
s ∈ 0, 1 given that ν(ξmin) < ν(∅) < ν(ξmax). The following result summarizes.
Lemma 4. T s1 (ξ) is strictly decreasing in ξ with T s1 (ξmin) > T s0 > T s1 (ξmax) for s = 0, 1.
Lemma 4 shows that test score disclosure has a heterogeneous impact on the effort of students
and managers, and thus has a heterogeneous impact on test scores. In order to relate Lemma 4 to
our empirical results, let Ω(·) be the cumulative density function of the unconditional distribution
of the signal ξ of school quality. In our model, the signal ξ about school quality corresponds to the
average 2005 ENEM score. Hence, if ξ(1;n) is such that Ω(ξ(1;n)) = 1− 1/n, then
As1(1;n) = τ − 1
2
∫ ξmax
ξ(1;n)
Eµ(ξ)[(κ− v − T s1 (ξ))2
]dΩ(ξ)
and
As0(1;n) = τ − 1
2
∫ ξmax
ξ(1;n)
Eµ(ξ)[(κ− v − T s0 )2
]dΩ(ξ)
21

are, respectively, the average test scores of the treated and control schools with a signal ξ of school
quality in the highest n-quantile. Since limn→∞ ξ(1;n) = ξmax, Lemma 4 implies that As1(1;n) <
As0(1;n) if n is large enough. Similarly, if As1(n − 1;n) and As0(n − 1;n) are, respectively, the
average test scores of the treated and control schools with a signal ξ of school quality in the lowest
n-quantile, then Lemma 4 implies that As1(n − 1;n) > As0(n − 1;n) if n is large enough.29 We
have then established the following result.
Proposition 1. As1(n) < As
0(n) and As1(n) > As0(n) if n is large enough.
Proposition 1 shows that our model can explain our empirical findings concerning the hetero-
geneous effect of test score disclosure on student performance.30
Average Test Scores The average test score As0 in a control school of type s and the average test
score As1 in a treated school of type s are
As0 = τ − 1
2Eµ(∅)
[(κ− v − T s0 )2
]and
As1 = τ − 1
2EξEµ(ξ)
[(κ− v − T s1 (ξ))2
].
Since managers in public schools never exert effort, only the students in public schools react to test
score disclosure. The assumption that c′′(a)/c′(a) is nonincreasing in a implies that the average
test score in a treated public school is never smaller than the average test score in a control public
school; see the Appendix for a proof.
Lemma 5. A01 ≥ A0
0.
In private schools, both managers and students react to test score disclosure. Given that h(x)
is strictly concave in x, Jensen’s inequality implies that if the average effort of managers in treated
private schools is greater than the effort of managers in control private schools, then the average
29The average Ask(n− 1;n) is obtained from the average As
k(1;n) by changing the integration limits from ξ(1;n) toξmax to ξmin to ξ(n−1;n), where ξ(n−1;n) is such that Ω(ξ(n−1;n)) = 1/n.
30Table 6 only reports the heterogenous effect of test score disclosure for the case of n = 2. We obtain similarresults for higher quantiles. These results are available upon request.
22
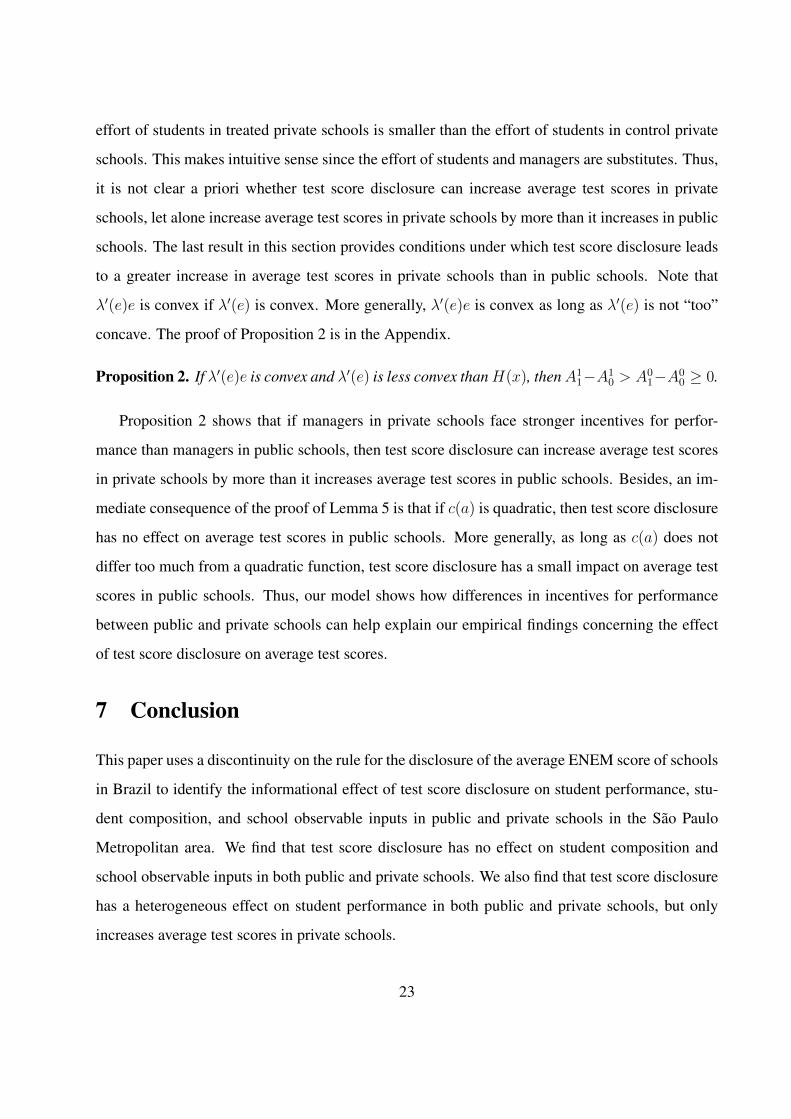
effort of students in treated private schools is smaller than the effort of students in control private
schools. This makes intuitive sense since the effort of students and managers are substitutes. Thus,
it is not clear a priori whether test score disclosure can increase average test scores in private
schools, let alone increase average test scores in private schools by more than it increases in public
schools. The last result in this section provides conditions under which test score disclosure leads
to a greater increase in average test scores in private schools than in public schools. Note that
λ′(e)e is convex if λ′(e) is convex. More generally, λ′(e)e is convex as long as λ′(e) is not “too”
concave. The proof of Proposition 2 is in the Appendix.
Proposition 2. If λ′(e)e is convex and λ′(e) is less convex thanH(x), thenA11−A1
0 > A01−A0
0 ≥ 0.
Proposition 2 shows that if managers in private schools face stronger incentives for perfor-
mance than managers in public schools, then test score disclosure can increase average test scores
in private schools by more than it increases average test scores in public schools. Besides, an im-
mediate consequence of the proof of Lemma 5 is that if c(a) is quadratic, then test score disclosure
has no effect on average test scores in public schools. More generally, as long as c(a) does not
differ too much from a quadratic function, test score disclosure has a small impact on average test
scores in public schools. Thus, our model shows how differences in incentives for performance
between public and private schools can help explain our empirical findings concerning the effect
of test score disclosure on average test scores.
7 Conclusion
This paper uses a discontinuity on the rule for the disclosure of the average ENEM score of schools
in Brazil to identify the informational effect of test score disclosure on student performance, stu-
dent composition, and school observable inputs in public and private schools in the Sao Paulo
Metropolitan area. We find that test score disclosure has no effect on student composition and
school observable inputs in both public and private schools. We also find that test score disclosure
has a heterogeneous effect on student performance in both public and private schools, but only
increases average test scores in private schools.
23

Our empirical findings suggest that test score disclosure affects student performance by chang-
ing the effort of students (and their parents), teachers, and school managers. Since in Brazil,
teachers and managers in public schools face weaker market incentives than teachers and man-
agers in private schools, our results provide evidence that test score disclosure has an impact on
the market incentives faced by private schools. We develop a model of school and student behavior
to show how differences in incentives faced by teachers and managers in different types of school
can help explain how test score disclosure can have a heterogeneous impact on test scores in both
public and private schools, but only increase average test scores in private schools.
8 Appendix
Lemma 6 and Proof
Lemma 6. Eξ[ν] = ν(∅). Moreover, ν(ξ) is strictly increasing in ξ when ξ ∈ [ξmin, ξmax], with
ν(ξmin) < ν(∅) < ν(ξmax).
Proof. The fact that ν(ξ) is strictly increasing in ξ follows immediately from the fact that if ξ1, ξ2 ∈
[ξmin, ξmax] are such that ξ1 > ξ2, then µ(ξ1) dominates µ(ξ2) in the strict first-order stochastic
sense. The fact that Eξ[ν] = ν(∅) follows easily from Bayes’ rule. To finish, note that if ν(ξmin) ≥
ν(∅), then ν(ξ) strictly increasing in ξ implies that Eξ[ν] > ν(∅), a contradiction. Thus, ν(ξmin) <
ν(∅). The same argument shows that ν(ξmax) > ν(∅).
Proof of Lemma 3
Let F = (λ′)−1 H , X(ξ) = −F ′(vmax − ν(∅) + emax − e∗(ξ) + amax), and Y (ξ) = ν(ξ)− ν(∅).
Now note that
Eξ[e∗] = Eξ [F (vmax − ν + emax − e∗ + amax)]
> Eξ [F (vmax − ν(∅) + emax − e∗ + amax)] + Eξ [XY ]
≥ F (vmax − ν(∅) + emax − Eξ[e∗] + amax) + Eξ [XY ] ,
24

where the equality follows from (3), the first inequality follows from the strict convexity of F , and
the second inequality follows from Jensen’s inequality. Since X(ξ) and Y (ξ) are nondecreasing
in ξ, Theorem 22 in Milgrom and Weber [1982] implies that Eξ[XY ] ≥ Eξ[X]Eξ[Y ]. Moreover,
Eξ[ν] = ν(∅) by Lemma 6. Therefore,
Eξ[e∗] > F (vmax − ν(∅) + emax − Eξ[e∗] + amax).
The desired result follows from (3).
Lemma 7 and Proof
Lemma 7. H is convex if c′′(a) is convex in a and c′′(a)/c′(a) is nonincreasing in a.
Proof. Note that g(h(x)) = x implies that η(x) = c′(h(x)). Hence, H(x) = c′(h(x))[1 − h′(x)].
Given that h′(x) = [1 + c′′(h(x))]−1, straightforward algebra shows that H ′(x) = Λ(h(x)), where
Λ(h) =c′′(h)2
[1 + c′′(h)]2+
c′′′(h)c′(h)
[1 + c′′(h)]3,
Now note that
Λ′(h) =3c′′′(h)c′′(h) + c(iv)(h)c′(h)
[1 + c′′(h)]3− 3c′′′(h)c′(h)
[1 + c′′(h)]4.
Then Λ′(h) ≥ 0, since c′′(a) is convex and c′(a)/c′′(a) nondecreasing in a implies that c′′′(a)c′(a) ≤
(c′′(a))2. The desired results follows from the fact that h(x) is strictly increasing in x.
Proof of Lemma 5
It follows from Bayes’ rule that Eµ(∅)[f ] = EξEµ(ξ)[f ]
for any (measurable) function f . Hence,
Eµ(∅)[(κ− v)2] = EξEµ(ξ)[(κ− v)2]
, and so
A01 − A0
0 ∝ −2(κ− ν(∅))h(κ− ν(∅)) + h(κ− ν(∅))2 + Eξ[2(κ− ν)h(κ− ν)− h(κ− ν)2]
= Eξ[M(κ− ν)]−M(κ− ν(∅)),
where M(x) = x2 − η(x)2. Since Eξ[ν] = ν(∅), Jensen’s inequality implies that A01 ≥ A0
0
when M(x) is convex. Now observe that M(x) is convex if, and only if, H ′(x) ≤ 1. It follows
25

immediately from the proof of Lemma 7 that H ′(x) ≤ 1 if, and only if,
c′′(h(x))2 + c′′(h(x))3 + c′′′(h(x))c′(h(x)) ≤ [1 + c′′(h(x))]3,
which is satisfied since h(x) is strictly increasing in x and c′′′(a)c′(a) ≤ (c′′(a))2 by assumption.
Proof of Proposition 2
For each z ∈ [0, 1] and ξ ∈ [ξmin, ξmax], let
Γz0 =1
2Eµ(∅)
[(κ− v − ze1(∅)− h(κ− ν(∅)− ze1(∅))
)2]and
Γz1(ξ) =1
2Eµ(ξ)
[(κ− v − ze1(ξ)− h(κ− ν(ξ)− ze1(ξ))
)2].
Now let ∆(z), with z ∈ [0, 1], be such that ∆(z) = Γz0−Eξ[Γz1]. By construction, ∆(1) = A11−A1
0
and ∆(0) = A01 − A0
0. Straightforward algebra shows that
∆′(z) = −H(κ− ν(∅)− ze1(∅))e1(∅) + Eξ[H(κ− ν − ze1)e1
]= Eξ[λ′(ze1)e1]− λ′(ze1(∅))e1(∅)
≥ λ′(zEξ[e1]
)Eξ[e1]− λ′(ze1(∅))e1(∅),
where the second equality follows from (3) and the inequality follows from Jensen’s inequality.
Hence, ∆′(z) > 0 for all z ∈ (0, 1], so that ∆(1) > ∆(0).
References
Tahhir Andrabi, Jishnu Das, and Asim Kwwaja. Report cards: The impact of providing school and
child test-scores on educational markets. Technical report, BREAD, February 2009.
Marigee Bacolod, John DiNardo, and Mireille Jacobson. Beyond incentives: Do schools use
accountability rewards productively? NBER Working Papers 14775, National Bureau of Eco-
nomic Research, Inc, March 2009. URL http://ideas.repec.org/p/nbr/nberwo/
14775.html.
26

Sandra E. Black. Do better schools matter? parental valuation of elementary education. The Quar-
terly Journal of Economics, 114(2):577–599, May 1999. URL http://ideas.repec.
org/a/tpr/qjecon/v114y1999i2p577-599.html.
Hanley Chiang. How accountability pressure on failing schools affects student achievement.
Journal of Public Economics, 93(9-10):1045–1057, October 2009. URL http://ideas.
repec.org/a/eee/pubeco/v93y2009i9-10p1045-1057.html.
Thomas Dee and Brian Jacob. The impact of no child left behind on student achievement. NBER
Working Papers 15531, National Bureau of Economic Research, Inc, November 2009. URL
http://ideas.repec.org/p/nbr/nberwo/15531.html.
Gabrielle Fack and Julien Grenet. When do better schools raise housing prices? evidence from
paris public and private schools. Journal of Public Economics, 94(1-2):59–77, February 2010.
URL http://ideas.repec.org/a/eee/pubeco/v94y2010i1-2p59-77.html.
Jianqing Fan and Irı¿12ne Gijbels. Local polynomial modelling and its applications. Num-
ber 66 in Monographs on statistics and applied probability series. Chapman & Hall, Lon-
don [u.a.], 1996. ISBN 0412983214. URL http://gso.gbv.de/DB=2.1/CMD?ACT=
SRCHA&SRT=YOP&IKT=1016&TRM=ppn+19282144X&sourceid=fbw_bibsonomy.
David Figlio and Susanna Loeb. School Accountability, volume 3 of Handbook of the Economics
of Education, chapter 8, pages 383–421. Elsevier, December 2011. URL http://ideas.
repec.org/h/eee/educhp/3-08.html.
David N. Figlio and Lawrence W. Kenny. Public sector performance measurement and stakeholder
support. Journal of Public Economics, 93:1069 – 1077, 2009. ISSN 0047-2727. doi: http:
//dx.doi.org/10.1016/j.jpubeco.2009.07.003. URL http://www.sciencedirect.com/
science/article/pii/S0047272709000863.
David N. Figlio and Maurice E. Lucas. What’s in a grade? school report cards and the housing
market. American Economic Review, 94(3):591–604, June 2004. URL http://ideas.
repec.org/a/aea/aecrev/v94y2004i3p591-604.html.
27
Sergio Firpo, Renan Pieri, and Andrı¿12
Portela Souza. Electoral impacts of uncovering public
school quality: Evidence from brazilian municipalities. IZA Discussion Papers 6524, Institute
for the Study of Labor (IZA), April 2012. URL http://ideas.repec.org/p/iza/
izadps/dp6524.html.
Jinyong Hahn, Petra Todd, and Wilbert Van der Klaauw. Identification and estimation of treatment
effects with a regression-discontinuity design. Econometrica, 69(1):201–09, January 2001. URL
http://ideas.repec.org/a/ecm/emetrp/v69y2001i1p201-09.html.
Eric A. Hanushek and Margaret E. Raymond. Does school accountability lead to improved student
performance? Journal of Policy Analysis and Management, 24(2),:297–327., 2005.
Justine S. Hastings and Jeffrey M. Weinstein. Information, school choice, and academic
achievement: Evidence from two experiments. The Quarterly Journal of Economics, 123
(4):1373–1414, November 2008. URL http://ideas.repec.org/a/tpr/qjecon/
v123y2008i4p1373-1414.html.
Bengt Holmstrom. Managerial incentive problems: A dynamic perspective. Review of Economic
Studies, 66(1):169–182, 1999.
Iftikhar Hussain. School quality, school choice and the teacher labour market: Evidence from a
novel disclosure regime. Research Institute of Industrial Economics, March 2009.
Guido W. Imbens and Thomas Lemieux. Regression discontinuity designs: A guide to practice.
Journal of Econometrics, 142(2):615–635, February 2008. URL http://ideas.repec.
org/a/eee/econom/v142y2008i2p615-635.html.
Pierre Koning and Karen van der Wiel. Ranking the schools: How school-quality information
affects school choice in the netherlands. Journal of the European Economic Association, 11
(2):466–493, 04 2013. URL http://ideas.repec.org/p/iza/izadps/dp4984.
html.
28

Pierre Koning and Karen Wiel. School responsiveness to quality rankings: An empirical analysis of
secondary education in the netherlands. De Economist, 160(4):339–355, December 2012. URL
http://ideas.repec.org/a/kap/decono/v160y2012i4p339-355.html.
David S. Lee and Thomas Lemieux. Regression discontinuity designs in economics. Journal of
Economic Literature, 48(2):281–355, June 2010. URL http://ideas.repec.org/a/
aea/jeclit/v48y2010i2p281-355.html.
Stephen Machin and Kjell G. Salvanes. Valuing school quality via a school choice reform. IZA
Discussion Papers 4719, Institute for the Study of Labor (IZA), January 2010. URL http:
//ftp.iza.org/dp4719.pdf.
Paul R. Milgrom. Good news and bad news: Representation theorems and applications. The Rand
Journal of Economics, 12(2):380–391, 1981.
Paul R. Milgrom and Robert J. Weber. A theory of auctions and competitive bidding. Economet-
rica, 50(5):1089–1122, 1982.
Alejandra Mizala and Miguel Urquiola. Parental choice and school markets: The impact of
information approximating school effectiveness. Documentos de Trabajo 239, Centro de
Economı¿12a Aplicada, Universidad de Chile, 2009. URL http://ideas.repec.org/
p/edj/ceauch/239.html.
Alejandra Mizala, Pilar Romaguera, and Miguel Urquiola. Socioeconomic status or noise? trade-
offs in the generation of school quality information. Journal of Development Economics,
84(1):61–75, September 2007. URL http://ideas.repec.org/a/eee/deveco/
v84y2007i1p61-75.html.
Karthik Muralidharan and Venkatesh Sundararaman. Teacher performance pay: Experimental
evidence from india. Journal of Political Economy, 119(1):pp. 39–77, 2011. ISSN 00223808.
URL http://www.jstor.org/stable/10.1086/659655.
Michael Podgursky and Matthew Springer. Teacher compensation systems in the united states k-12
public school system. National Tax Journal, 64:165–192, 2011.
29

Jonah Rockoff and Lesley J. Turner. Short-run impacts of accountability on school quality.
American Economic Journal: Economic Policy, 2(4):119–47, November 2010. URL http:
//ideas.repec.org/a/aea/aejpol/v2y2010i4p119-47.html.
Tables and Figures
Table 1: Descriptive Statistics - Private SchoolsLess than 10 exam takers 10 to 19 exam takers More than 19 takers
N Mean S.D. N Mean S.D. N Mean S.D.Standardized Test Score 2,310 -0.55 0.99 5,125 -0.37 0.99 44,371 0.07 0.98Male 1,879 0.45 0.5 4,256 0.43 0.5 35,873 0.44 0.5Age 1,874 17.39 0.81 4,241 17.39 0.9 35,799 17.37 0.83White 1,864 0.76 0.43 4,231 0.78 0.42 35,672 0.79 0.41Father w/ College Degree 1,790 0.36 0.48 4,091 0.42 0.49 34,822 0.54 0.5Mother w/ College Degree 1,827 0.38 0.49 4,178 0.42 0.49 35,322 0.52 0.5Income ≤ 10×Minimum Wage 1,846 0.7 0.46 4,159 0.64 0.48 35,125 0.49 0.5# of Students who Work 411 0.67 0.47 834 0.67 0.47 5,883 0.69 0.46# of Students Enrolled in Extra Classes 1,846 0.16 0.37 4,211 0.17 0.38 35,529 0.22 0.41# of Students at High School 2,304 62.04 36.44 5,101 89.57 52.32 44,060 447.62 414.96# of Teachers 2,304 25.45 16.82 5,101 27.2 19.47 44,060 93.23 133.89% of Teachers w/ College Degree 2,304 1.01 0.36 5,101 1.02 0.38 44,060 0.92 0.42# of Computers 2,282 20.03 32.73 5,091 29.18 35.54 44,056 91 108.64Teacher-to-Student ratio 2,304 0.47 0.34 5,101 0.35 0.37 44,060 0.25 0.24Computer Lab 2,310 0.71 0.45 5,125 0.81 0.4 44,371 0.81 0.4Science Lab 2,310 0.23 0.42 5,125 0.28 0.45 44,371 0.21 0.4Library 2,310 0.51 0.5 5,125 0.48 0.5 44,371 0.38 0.49Internet Access 2,304 0.99 0.06 5,124 1 0 44,265 0.99 0.02% of ENEM Takers 2,289 0.61 0.22 5,070 0.69 0.18 44,056 0.81 0.18Sources: ENEM microdata and School Census
30
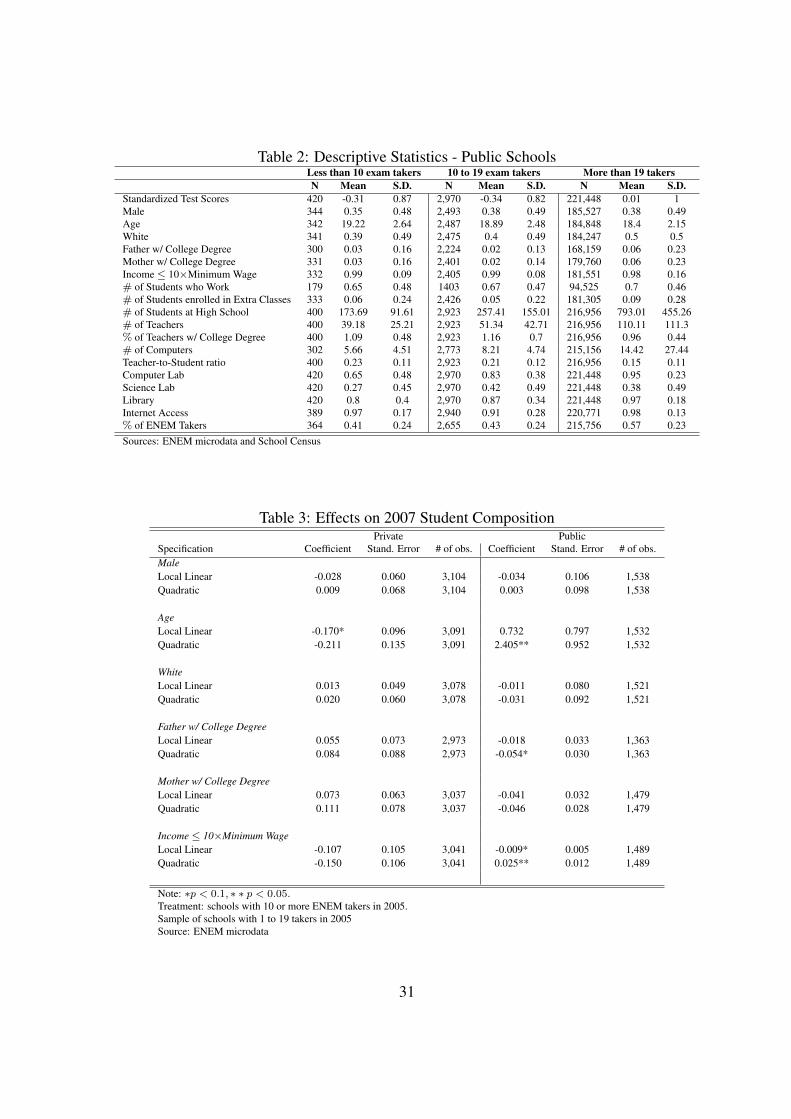
Table 2: Descriptive Statistics - Public SchoolsLess than 10 exam takers 10 to 19 exam takers More than 19 takersN Mean S.D. N Mean S.D. N Mean S.D.
Standardized Test Scores 420 -0.31 0.87 2,970 -0.34 0.82 221,448 0.01 1Male 344 0.35 0.48 2,493 0.38 0.49 185,527 0.38 0.49Age 342 19.22 2.64 2,487 18.89 2.48 184,848 18.4 2.15White 341 0.39 0.49 2,475 0.4 0.49 184,247 0.5 0.5Father w/ College Degree 300 0.03 0.16 2,224 0.02 0.13 168,159 0.06 0.23Mother w/ College Degree 331 0.03 0.16 2,401 0.02 0.14 179,760 0.06 0.23Income ≤ 10×Minimum Wage 332 0.99 0.09 2,405 0.99 0.08 181,551 0.98 0.16# of Students who Work 179 0.65 0.48 1403 0.67 0.47 94,525 0.7 0.46# of Students enrolled in Extra Classes 333 0.06 0.24 2,426 0.05 0.22 181,305 0.09 0.28# of Students at High School 400 173.69 91.61 2,923 257.41 155.01 216,956 793.01 455.26# of Teachers 400 39.18 25.21 2,923 51.34 42.71 216,956 110.11 111.3% of Teachers w/ College Degree 400 1.09 0.48 2,923 1.16 0.7 216,956 0.96 0.44# of Computers 302 5.66 4.51 2,773 8.21 4.74 215,156 14.42 27.44Teacher-to-Student ratio 400 0.23 0.11 2,923 0.21 0.12 216,956 0.15 0.11Computer Lab 420 0.65 0.48 2,970 0.83 0.38 221,448 0.95 0.23Science Lab 420 0.27 0.45 2,970 0.42 0.49 221,448 0.38 0.49Library 420 0.8 0.4 2,970 0.87 0.34 221,448 0.97 0.18Internet Access 389 0.97 0.17 2,940 0.91 0.28 220,771 0.98 0.13% of ENEM Takers 364 0.41 0.24 2,655 0.43 0.24 215,756 0.57 0.23Sources: ENEM microdata and School Census
Table 3: Effects on 2007 Student CompositionPrivate Public
Specification Coefficient Stand. Error # of obs. Coefficient Stand. Error # of obs.MaleLocal Linear -0.028 0.060 3,104 -0.034 0.106 1,538Quadratic 0.009 0.068 3,104 0.003 0.098 1,538
AgeLocal Linear -0.170* 0.096 3,091 0.732 0.797 1,532Quadratic -0.211 0.135 3,091 2.405** 0.952 1,532
WhiteLocal Linear 0.013 0.049 3,078 -0.011 0.080 1,521Quadratic 0.020 0.060 3,078 -0.031 0.092 1,521
Father w/ College DegreeLocal Linear 0.055 0.073 2,973 -0.018 0.033 1,363Quadratic 0.084 0.088 2,973 -0.054* 0.030 1,363
Mother w/ College DegreeLocal Linear 0.073 0.063 3,037 -0.041 0.032 1,479Quadratic 0.111 0.078 3,037 -0.046 0.028 1,479
Income ≤ 10×Minimum WageLocal Linear -0.107 0.105 3,041 -0.009* 0.005 1,489Quadratic -0.150 0.106 3,041 0.025** 0.012 1,489
Note: ∗p < 0.1, ∗ ∗ p < 0.05.Treatment: schools with 10 or more ENEM takers in 2005.Sample of schools with 1 to 19 takers in 2005Source: ENEM microdata
31

Table 4: Effects on 2007 School InputsPrivate Public
Specification Coefficient Stand. Error # of obs. Coefficient Stand. Error # of obs.Number of StudentsLocal Linear 25.823 16.524 3,261 114.387** 55.773 1,670Quadratic 18.184 20.992 3,273 68.037 102.069 1,670
Number of Students in 3rd GradeLocal Linear 4.189 3.851 3,261 18.796 21.906 1,638Quadratic 3.380 7.649 3,261 -5.621 18.794 1,638
Proportion of Teachers w/ College DegreeLocal Linear -0.000 0.032 3,273 0.003 0.006 1,670Quadratic 0.012 0.022 3,273 0.003* 0.013 1,670
Computer-to-Student RatioLocal Linear 0.181 0.157 3,218 -0.035 0.035 1,464Quadratic 0.198 0.169 3,218 -0.040 0.030 1,464
Staff-to-Student RatioLocal Linear 0.008 0.141 3,273 - − 1,670Quadratic 0.043 0.280 3,273 0.266** 0.126 1,670
Teacher-to-Student RatioLocal Linear -0.064 0.078 3,273 0.021 0.039 1,670Quadratic -0.004 0.094 3,273 0.045 0.039 1,670
Computer LabLocal Linear 0.079 0.237 3,302 -0.166 0.127 1,737Quadratic 0.013 0.229 3,302 -0.241 0.177 1,737
Science LabLocal Linear 0.042 0.169 3,302 -0.031 0.029 1,737Quadratic 0.124 0.206 3,302 0.014 0.058 1,737
Note: ∗p < 0.1, ∗ ∗ p < 0.05.Treatment: schools with 10 or more ENEM takers in 2005.Sample of schools with 1 to 19 takers in 2005Source: School Census
Table 5: Effects on 2007 Average Test ScorePrivate Public
Specification Coefficient Stand. Error # of obs. Coefficient Stand. Error # of obs.Local Linear (Opt. BW) 0.536** 0.271 3,302 0.162 0.240 1,737Local Linear (2 × Opt. BW) 0.371** 0.169 3,302 0.086 0.163 1,737
10-Takers WindowMean Differences 0.166** 0.070 3,302 -0.042 0.066 1,737Linear 0.161 0.136 3,302 0.139 0.131 1,737Quadratic 0.518** 0.219 3,302 -0.051 0.255 1,737
5-Takers WindowMean Differences 0.130 0.084 2,080 0.019 0.067 836Linear 0.380** 0.175 2,080 0.117 0.217 836Quadratic 0.749** 0.339 2,080 0.286 0.309 836
Note: ∗p < 0.1, ∗ ∗ p < 0.05.Treatment: schools with 10 or more ENEM takers in 2005.10-Takers Window: Sample of schools with 1 to 19 takers in 20055-Takers Window: Sample of schools with 5 to 14 takers in 2005
32
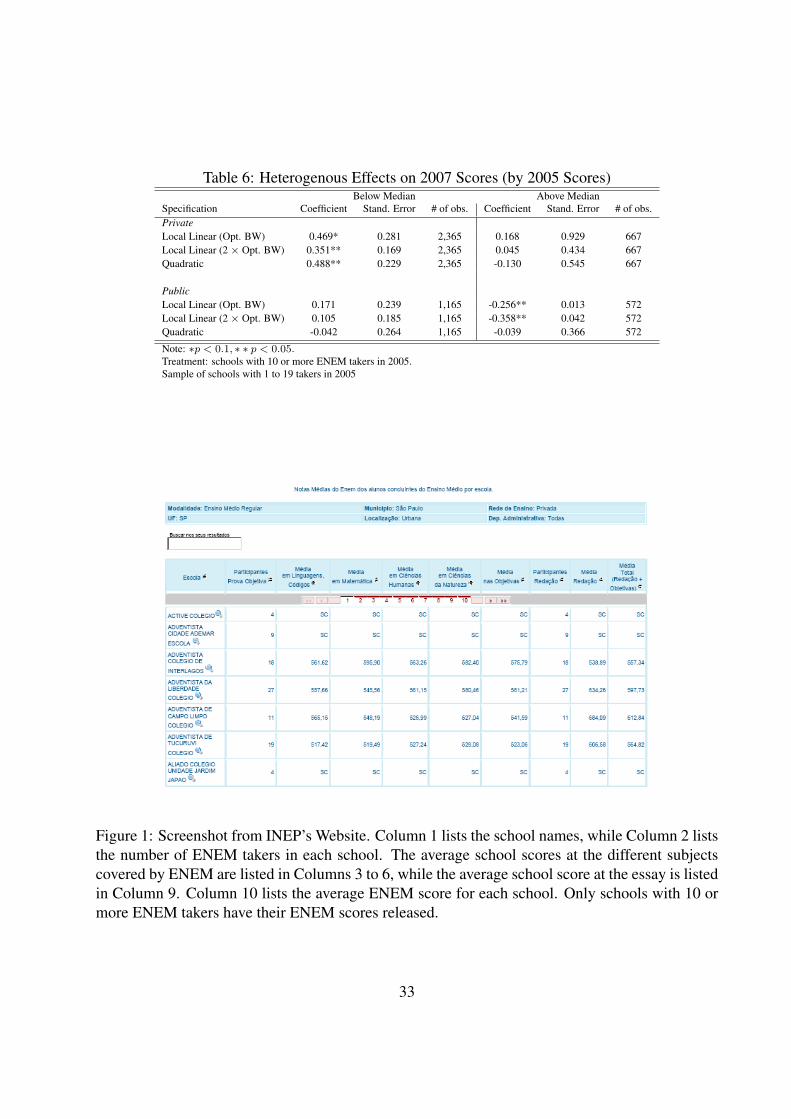
Table 6: Heterogenous Effects on 2007 Scores (by 2005 Scores)Below Median Above Median
Specification Coefficient Stand. Error # of obs. Coefficient Stand. Error # of obs.PrivateLocal Linear (Opt. BW) 0.469* 0.281 2,365 0.168 0.929 667Local Linear (2 × Opt. BW) 0.351** 0.169 2,365 0.045 0.434 667Quadratic 0.488** 0.229 2,365 -0.130 0.545 667
PublicLocal Linear (Opt. BW) 0.171 0.239 1,165 -0.256** 0.013 572Local Linear (2 × Opt. BW) 0.105 0.185 1,165 -0.358** 0.042 572Quadratic -0.042 0.264 1,165 -0.039 0.366 572
Note: ∗p < 0.1, ∗ ∗ p < 0.05.Treatment: schools with 10 or more ENEM takers in 2005.Sample of schools with 1 to 19 takers in 2005
Figure 1: Screenshot from INEP’s Website. Column 1 lists the school names, while Column 2 liststhe number of ENEM takers in each school. The average school scores at the different subjectscovered by ENEM are listed in Columns 3 to 6, while the average school score at the essay is listedin Column 9. Column 10 lists the average ENEM score for each school. Only schools with 10 ormore ENEM takers have their ENEM scores released.
33

Figure 2: Newspaper ranking from O Estado de Sao Paulo, one of the four major newspapers inBrazil, published on February 9th of 2006 showing average 2005 ENEM scores for schools in thecity of Sao Paulo. The column on the left shows the 10 public schools with the highest averagescore, as well as the public school with the lowest average score. The column on the right does thesame for private schools.
Figure 3: 2007 ENEM Performance for Private Schools
34

Figure 4: 2007 ENEM Performance for Public Schools
Figure 5: Frequency of Schools
35

Figure 6: 2005 ENEM Performance for Private Schools
Figure 7: 2005 ENEM Performance for Public Schools
36

Figure 8: 2007 Placebo Cutoffs for Private Schools
37