nmr metabolomics and drug discovery
TRANSCRIPT

S2
ReviewReceived: 18 September 2008 Accepted: 7 May 2009 Published online in Wiley Interscience: 5 June 2009
(www.interscience.com) DOI 10.1002/mrc.2461
NMR metabolomics and drug discoveryRobert Powers∗
NMR is an integral component of the drug discovery process with applications in lead discovery, validation, and optimization.NMR is routinely used for fragment-based ligand affinity screens, high-resolution protein structure determination, and rapidprotein-ligand co-structure modeling. Because of this inherent versatility, NMR is currently making significant contributionsin the burgeoning area of metabolomics, where NMR is successfully being used to identify biomarkers for various diseases, toanalyze drug toxicity and to determine a drug’s in vivo efficacy and selectivity. This review describes advances in NMR-basedmetabolomics and discusses some recent applications. Copyright c© 2009 John Wiley & Sons, Ltd.
Keywords: NMR; metabolomics; drug discovery; disease biomarkers; drug toxicity; principal component analysis; differential NMRmetabolomics
Introduction
NMR spectroscopy is playing an integral and continually expandingrole in the pharmaceutical industry, especially since high-throughput screening[1 – 5] and structure-based drug discovery[6 – 8]
have evolved to be the driving forces behind the discoveryprocess for new therapeutics.[9] This process can be dividedinto three major steps: lead discovery, drug optimization, andclinical validation, and NMR makes invaluable contributions at allstages.[10 – 15] NMR is the primary analytical tool used to confirm thechemical structure and composition of both synthetic and naturalproduct chemical leads.[16,17] NMR high-throughput ligand affinityscreens high-throughput ligand affinity screens (HTS), especiallygiven the growing popularity of fragment-based libraries, area well-established component of the discovery process.[18,19]
NMR HTS are routinely used to both validate and identify novelchemical leads.[20,21] The universal adoption of the fragment-based approach means that the rapid screening of small chemicallibraries by NMR enables an exponential growth in the explorationof structural space, well beyond traditional HTS methods.[22 – 24] Inaddition to the validation and identification of chemical leads, NMRcontinues to contribute to lead optimization by determining high-resolution protein solution structures and rapid protein–ligandco-structures.[25,26]
The recent expansion into the analysis of the metabolomehas also enabled NMR to contribute to the clinical validationstep.[13,27,28] By far, this stage is the most challenging andexpensive component of the drug discovery process, where asignificant number of failures occur.[29,30] From the analysis ofbiofluids, tissues, and cell extracts, NMR can measure changes inthe metabolome resulting from the biological activity of the druglead.[31 – 33] The relative concentration and flux of the hundreds tothousands of small-molecular-weight compounds that comprisethe metabolome reflect the state of the system.[34 – 37] As anillustration, a compound designed to inhibit a specific enzymewill result in changes in the concentration of substrates andproducts associated with the enzyme’s activity. Thus, perturbationsin the metabolome result from drug efficacy, selectivity, andtoxicity. Additionally, the comparative analysis of the metabolomebetween healthy and diseased individuals identifies metabolitesthat can be used as biomarkers for the disease.[38 – 43]
A major advantage of NMR-based metabolomic studies is thegeneral ease and simplicity of the methodology.[44] In general,biofluids or cell lysates are simply added to a deuterated aqueousbuffer to maintain pH and provide a lock signal before transferringto an NMR sample tube to collect a one dimensional (1D)1H NMR spectrum.[45 – 47] Because of the inherent variability inbiological samples, it is necessary to obtain 10–20 replicates andcollect a similar number of NMR spectra so that any observedtrends are statistically relevant. This collection of NMR spectrais typically analyzed using an unsupervised statistical technique,such as principal component analysis (PCA).[48,49] PCA reducesthe multivariable NMR spectra into the lower dimensional PCAspace. Specifically, an NMR spectrum is reduced to a singlepoint in a standard two dimensional (2D) or three dimensional(3D) scores plot. The clustering of NMR spectra in a scores plotdetermines the relative similarity between the data, where spectrathat cluster together indicate a similar metabolome. Accuratelyinterpreting the PCA analysis of NMR spectra requires consistencyof sample preparation, data collection, and data processing.[50] Itis essential that the observed clustering pattern in the PCA scoresplot reflects the anticipated perturbations in the metabolomedue to drug activity instead of an artifact from data handlingor processing.[51 – 53] Thus, an additional benefit of NMR-basedmetabolomics is the minimal sample manipulation, which reduceserrors in PCA clustering patterns.
In addition to monitoring global perturbations in themetabolome based on the statistical analysis of NMR spectra,the identity and concentration of the major metabolites affectedby the drug are also explored by NMR.[54,55] This enables specificmetabolites to be identified as potential disease biomarkers,[38 – 43]
to determine if the drug therapy has toxic side effects,[56,57] and toidentify metabolic pathways affected by the drug.[58,59] The abilityto rapidly and easily monitor the in vivo activity of potential drugcandidates at the early stage of drug discovery has significant
∗ Correspondence to: Robert Powers, Department of Chemistry University ofNebraska-Lincoln, 722 Hamilton Hall, Lincoln, NE 68588-0304, USA.E-mail: [email protected]
Department of Chemistry, University of Nebraska-Lincoln, 722 Hamilton Hall,Lincoln, NE 68588-0304, USA
Magn. Reson. Chem. 2009, 47, S2–S11 Copyright c© 2009 John Wiley & Sons, Ltd.
S3
NMR metabolomics and drug discovery
benefits for the effective treatment of human diseases.[60] Clearly,identifying compounds that exhibit diminished in vivo activity,poor specificity, or toxicity prior to conducting clinical trials ishighly desirable and extremely cost effective.[61] Similarly, usingNMR to develop accurate and non-invasive protocols for earlydisease diagnostics by identifying biomarkers is tremendouslybeneficial to human health. This review will discuss recent devel-opments and applications of NMR metabolomics that are strivingto achieve these goals.
Methodology
Processing of NMR spectra
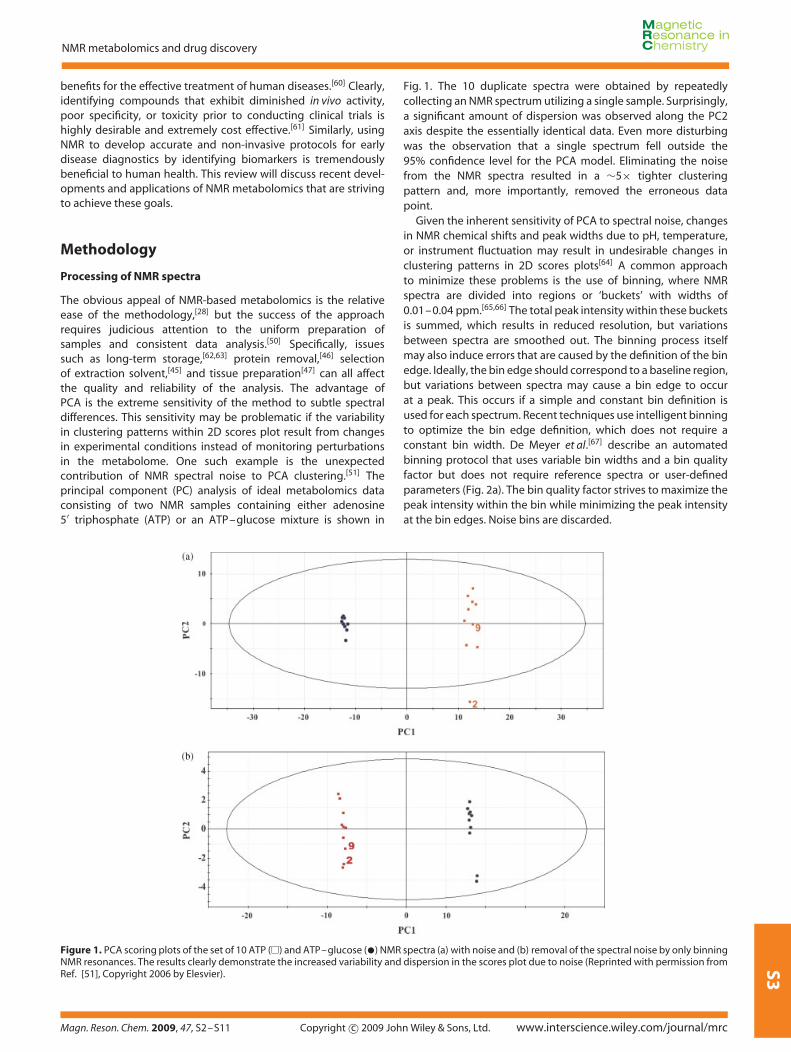
The obvious appeal of NMR-based metabolomics is the relativeease of the methodology,[28] but the success of the approachrequires judicious attention to the uniform preparation ofsamples and consistent data analysis.[50] Specifically, issuessuch as long-term storage,[62,63] protein removal,[46] selectionof extraction solvent,[45] and tissue preparation[47] can all affectthe quality and reliability of the analysis. The advantage ofPCA is the extreme sensitivity of the method to subtle spectraldifferences. This sensitivity may be problematic if the variabilityin clustering patterns within 2D scores plot result from changesin experimental conditions instead of monitoring perturbationsin the metabolome. One such example is the unexpectedcontribution of NMR spectral noise to PCA clustering.[51] Theprincipal component (PC) analysis of ideal metabolomics dataconsisting of two NMR samples containing either adenosine5′ triphosphate (ATP) or an ATP–glucose mixture is shown in
Fig. 1. The 10 duplicate spectra were obtained by repeatedlycollecting an NMR spectrum utilizing a single sample. Surprisingly,a significant amount of dispersion was observed along the PC2axis despite the essentially identical data. Even more disturbingwas the observation that a single spectrum fell outside the95% confidence level for the PCA model. Eliminating the noisefrom the NMR spectra resulted in a ∼5× tighter clusteringpattern and, more importantly, removed the erroneous datapoint.
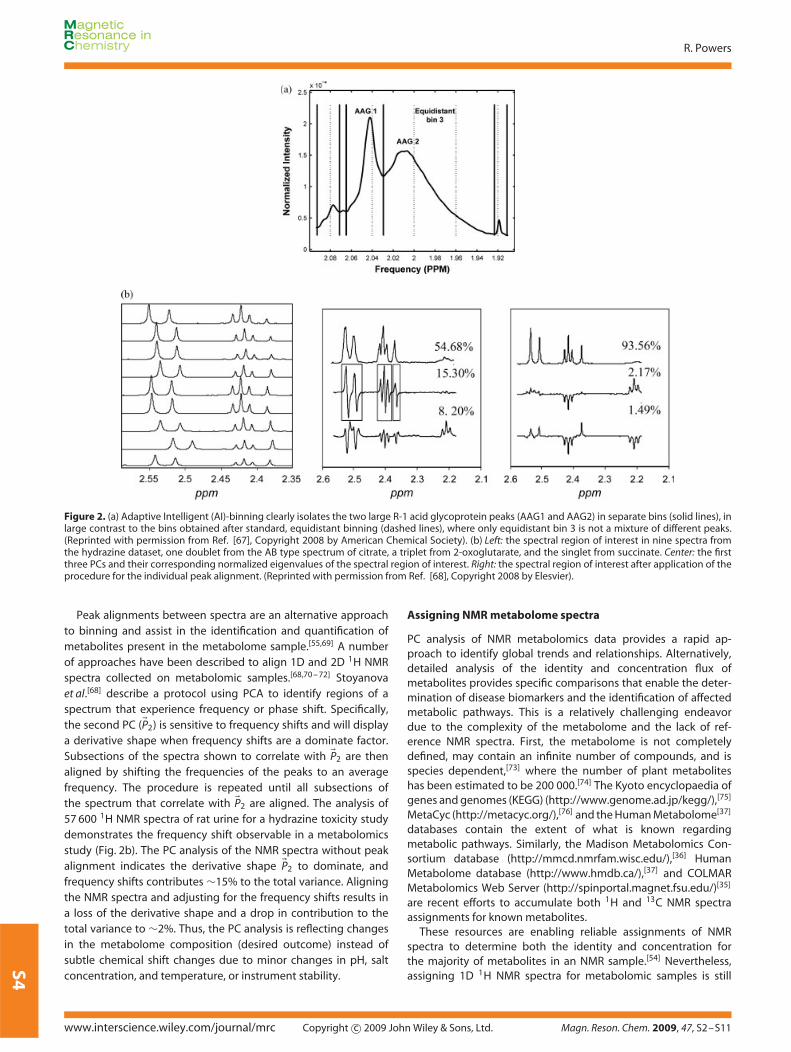
Given the inherent sensitivity of PCA to spectral noise, changesin NMR chemical shifts and peak widths due to pH, temperature,or instrument fluctuation may result in undesirable changes inclustering patterns in 2D scores plots[64] A common approachto minimize these problems is the use of binning, where NMRspectra are divided into regions or ‘buckets’ with widths of0.01–0.04 ppm.[65,66] The total peak intensity within these bucketsis summed, which results in reduced resolution, but variationsbetween spectra are smoothed out. The binning process itselfmay also induce errors that are caused by the definition of the binedge. Ideally, the bin edge should correspond to a baseline region,but variations between spectra may cause a bin edge to occurat a peak. This occurs if a simple and constant bin definition isused for each spectrum. Recent techniques use intelligent binningto optimize the bin edge definition, which does not require aconstant bin width. De Meyer et al.[67] describe an automatedbinning protocol that uses variable bin widths and a bin qualityfactor but does not require reference spectra or user-definedparameters (Fig. 2a). The bin quality factor strives to maximize thepeak intensity within the bin while minimizing the peak intensityat the bin edges. Noise bins are discarded.
Figure 1. PCA scoring plots of the set of 10 ATP (�) and ATP–glucose (•) NMR spectra (a) with noise and (b) removal of the spectral noise by only binningNMR resonances. The results clearly demonstrate the increased variability and dispersion in the scores plot due to noise (Reprinted with permission fromRef. [51], Copyright 2006 by Elesvier).
Magn. Reson. Chem. 2009, 47, S2–S11 Copyright c© 2009 John Wiley & Sons, Ltd. www.interscience.wiley.com/journal/mrc
S4
R. Powers
Figure 2. (a) Adaptive Intelligent (AI)-binning clearly isolates the two large R-1 acid glycoprotein peaks (AAG1 and AAG2) in separate bins (solid lines), inlarge contrast to the bins obtained after standard, equidistant binning (dashed lines), where only equidistant bin 3 is not a mixture of different peaks.(Reprinted with permission from Ref. [67], Copyright 2008 by American Chemical Society). (b) Left: the spectral region of interest in nine spectra fromthe hydrazine dataset, one doublet from the AB type spectrum of citrate, a triplet from 2-oxoglutarate, and the singlet from succinate. Center: the firstthree PCs and their corresponding normalized eigenvalues of the spectral region of interest. Right: the spectral region of interest after application of theprocedure for the individual peak alignment. (Reprinted with permission from Ref. [68], Copyright 2008 by Elesvier).
Peak alignments between spectra are an alternative approachto binning and assist in the identification and quantification ofmetabolites present in the metabolome sample.[55,69] A numberof approaches have been described to align 1D and 2D 1H NMRspectra collected on metabolomic samples.[68,70 – 72] Stoyanovaet al.[68] describe a protocol using PCA to identify regions of aspectrum that experience frequency or phase shift. Specifically,the second PC (�P2) is sensitive to frequency shifts and will displaya derivative shape when frequency shifts are a dominate factor.Subsections of the spectra shown to correlate with �P2 are thenaligned by shifting the frequencies of the peaks to an averagefrequency. The procedure is repeated until all subsections ofthe spectrum that correlate with �P2 are aligned. The analysis of57 600 1H NMR spectra of rat urine for a hydrazine toxicity studydemonstrates the frequency shift observable in a metabolomicsstudy (Fig. 2b). The PC analysis of the NMR spectra without peakalignment indicates the derivative shape �P2 to dominate, andfrequency shifts contributes ∼15% to the total variance. Aligningthe NMR spectra and adjusting for the frequency shifts results ina loss of the derivative shape and a drop in contribution to thetotal variance to ∼2%. Thus, the PC analysis is reflecting changesin the metabolome composition (desired outcome) instead ofsubtle chemical shift changes due to minor changes in pH, saltconcentration, and temperature, or instrument stability.
Assigning NMR metabolome spectra
PC analysis of NMR metabolomics data provides a rapid ap-proach to identify global trends and relationships. Alternatively,detailed analysis of the identity and concentration flux ofmetabolites provides specific comparisons that enable the deter-mination of disease biomarkers and the identification of affectedmetabolic pathways. This is a relatively challenging endeavordue to the complexity of the metabolome and the lack of ref-erence NMR spectra. First, the metabolome is not completelydefined, may contain an infinite number of compounds, and isspecies dependent,[73] where the number of plant metaboliteshas been estimated to be 200 000.[74] The Kyoto encyclopaedia ofgenes and genomes (KEGG) (http://www.genome.ad.jp/kegg/),[75]
MetaCyc (http://metacyc.org/),[76] and the Human Metabolome[37]
databases contain the extent of what is known regardingmetabolic pathways. Similarly, the Madison Metabolomics Con-sortium database (http://mmcd.nmrfam.wisc.edu/),[36] HumanMetabolome database (http://www.hmdb.ca/),[37] and COLMARMetabolomics Web Server (http://spinportal.magnet.fsu.edu/)[35]
are recent efforts to accumulate both 1H and 13C NMR spectraassignments for known metabolites.
These resources are enabling reliable assignments of NMRspectra to determine both the identity and concentration forthe majority of metabolites in an NMR sample.[54] Nevertheless,assigning 1D 1H NMR spectra for metabolomic samples is still
www.interscience.wiley.com/journal/mrc Copyright c© 2009 John Wiley & Sons, Ltd. Magn. Reson. Chem. 2009, 47, S2–S11

S5
NMR metabolomics and drug discovery
Figure 3. (a) One-dimensional 1H NMR spectrum of an equimolar mixture of the 26 small-molecule standards. (b) Two-dimensional 1H–13C HSQC NMRspectra of the same synthetic mixture (red) overlaid onto a spectrum of aqueous whole-plant extract from A. thaliana (blue). (Reprinted with permissionfrom Ref. [69], Copyright 2008 by American Chemical Society).
considerably challenging because of significant peak overlap andthe presence of uncharacterized metabolites.[77] Instead, the use of2D NMR techniques is commonly used to analyze the compositionof metabolomic samples. The fast metabolite quantification (FMQ)by NMR method described by Lewis et al.[69] uses a series of 2D1H–13C heteronuclear single quantum coherence (HSQC) spectracollected for mixtures of standard metabolites over a range ofconcentrations.[69] An experimental biological sample is then usedto collect a 2D 1H–13C HSQC spectrum, where peak intensity andchemical shifts are compared against the reference set to identifythe metabolites and their corresponding concentration (Fig. 3).Fifty metabolites were identified in the biological extracts fromArabidopsis, alfalfa sprouts, and yeast with concentrations rangingfrom 230 mM to 40 µM.
Integrating NMR and MS metabolomic data
Mass spectroscopy (MS) has traditionally been used to detectperturbations in the metabolome,[78,79] where NMR and MSprovide complimentary approaches to the analysis of metabolomicdata.[80] An advantage of MS is its relatively high sensitivity andability to monitor concentration fluxes for minor componentsthat are typically undetected by NMR.[78,79] Conversely, MS
typically requires a hybrid approach because of the low-molecular-weight distribution of metabolites (Fig. 4a). Including gas or liquidchromatography to separate compounds with similar molecularweight (MW) may remove or perturb the relative concentration ofmetabolites. Also, MS is limited to detecting metabolites that areable to ionize well. NMR has similar limitations and is generallyrestricted to observing metabolites of high concentration. As aresult, a number of techniques have been proposed that combineNMR and MS data for the analysis of metabolomic samples.[81 – 85]
A PCA approach that combines 1D 1H NMR data with desorptionelectrospray ionization mass spectrometry (DESI-MS) data wasdescribed by Chen et al.[81] The approach was applied to urinesamples collected from mice to differentiate between healthymice and mice with lung cancer (Fig. 4b). Simply, 2D scoresplot are calculated separately for the NMR and DESI-MS datasetsusing a reduced compound dataset. The reduced compounddataset is simply subregions from both the NMR and MS spectrathat corresponds to peaks associated with six compounds thatdistinguish the biological samples. Since the PCs from the NMR 2Dscores plots are independent of the DESI-MS data, the NMR PC1values are simply added to the DESI-MS PC values and becomethe third dimension in a 3D scores plot. The result is a higherseparation of the biological samples in the PC space.
Magn. Reson. Chem. 2009, 47, S2–S11 Copyright c© 2009 John Wiley & Sons, Ltd. www.interscience.wiley.com/journal/mrc

S6
R. Powers
(a)
(b)
Figure 4. (a) Histogram of molecular weights of typical microbial metabo-lites (Reprinted with permission from Ref. [73], Copyright 2004 by Elsevier).(b) 3-D score plot combining PCA of NMR and DESI-MS data comparinghealthy mice (C1 and C3) with mice with lung cancer (T2 and T4) (Reprintedwith permission from Ref. [81], Copyright 2006 by John Wiley & Sons).
Applications
Disease biomarkers
One major promise of NMR metabolomics is the identificationof biomarkers from biofluids for early disease diagnosis.[28] Theapproach is straightforward in concept: compare biofluids fromhealthy and diseased individuals to identify metabolites uniquelycorrelated with the disease state. Furthermore, it has the addedadvantage of being rapid and non-invasive, requiring the simplecollection of urine, blood, or saliva samples from patients. Ofcourse, there are inherent challenges and limitations in theuse of biomarkers.[86] Fundamental variabilities in an individual’smetabolome resulting from age, gender, genetics, environmentalexposure, behavior, or diet differences may mask the impact of adisease or incorrectly imply the presence of a disease. Other factors,such as the collection, storage, and handling of the biologicalsamples[62,63] or measurement errors,[51,64] may also compromisethe correct identification and utility of biomarkers.
NMR-based metabolomics have been used to identify bio-markers associated with a variety of diseases including asthma,[87]
(a)
(b)
Figure 5. (a) Results of supervised principal component discriminantanalysis (PC-DA) of plasma samples from run-in visits (visits 1 and 2).A good distinction between diabetic patients and healthy volunteers aswell as separation by gender is observed (Reprinted with permission fromRef. [95], Copyright 2006 by Blackwell Publishing Ltd). (b) 3D PCA scoresplot based on covariances of the five NMR bin intensities used in thecancer models. Pancreatic control samples are shown as open circles,while pancreatic cancer samples are shown as solid black circles (Reprintedwith permission from Ref. [89], Copyright 2006 by Springer Science).
arthritis,[88] cancer,[89 – 91] cardiovascular,[92] diabetes,[93 – 95]
neurodegenerative,[96,97] and pathogen infections.[98] As anillustration, a clinical study described by van Doorn et al.[95] demon-strates the use of 1D 1H NMR analysis of blood serum samples todistinguish between healthy volunteers and type 2 diabetes melli-tus (T2DM) patients. Eight healthy male and female volunteers andeight male and female patients diagnosed with T2DM had bloodserum drawn twice a week over a 6-week period. A PCA of theNMR spectra (Fig. 5a) shows a large differentiation based on boththe disease state and gender of the participants in the study. Thediscrimination is maintained even if the glucose resonances areremoved from the NMR spectra. The T2DM biomarkers permitted afurther study to determine the effect of thiazolidinedione therapyto treat T2DM. A similar clinical study described by Beger et al.[89]
was conducted to identify biomarkers for pancreatic cancer, adisease with a high mortality rate (1-year survival rate of 20%) be-cause of difficulties related to early diagnosis. Lipid extracts fromplasma samples were collected from 90 healthy volunteers and100 patients with pancreatic cancer. A subset of only four or fivebins from the complete NMR spectra was used to create a partialleast squares-discriminant function (PLS-DF) model that statisti-
www.interscience.wiley.com/journal/mrc Copyright c© 2009 John Wiley & Sons, Ltd. Magn. Reson. Chem. 2009, 47, S2–S11
S7
NMR metabolomics and drug discovery
cally discriminated between healthy individuals and patients withpancreatic cancer (Fig. 5b).
Drug toxicity
Drug toxicity is a very challenging, costly, and pervasive problemin drug discovery,[29,30,99 – 101] which is primarily caused bythe inherent variability in a patient’s response to a specifictherapy.[102 – 104] Even in some recent high-profile cases thatresulted in the removal of drugs from the market,[105] the vastnumber of individuals administered the drug did not sufferserious side effects.[106] Generally, only a small percentage ofthe population suffers serious complications caused by a drug.Ideally, it would be best to identify these individuals prior tostarting a drug therapy.[107,108] This would permit general accessto the drug and its corresponding benefits to the majority of thepopulation. It is also highly desirable to identify potential drug
toxicity events prior to a treatment progressing to serious injuryor death.
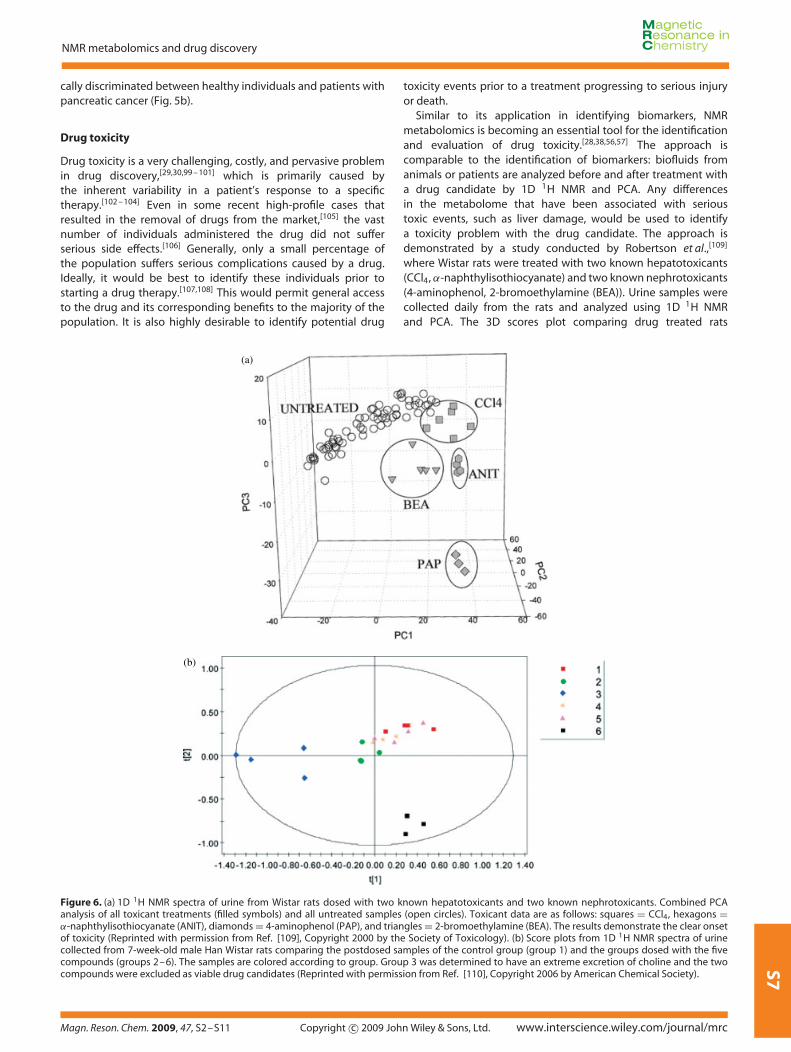
Similar to its application in identifying biomarkers, NMRmetabolomics is becoming an essential tool for the identificationand evaluation of drug toxicity.[28,38,56,57] The approach iscomparable to the identification of biomarkers: biofluids fromanimals or patients are analyzed before and after treatment witha drug candidate by 1D 1H NMR and PCA. Any differencesin the metabolome that have been associated with serioustoxic events, such as liver damage, would be used to identifya toxicity problem with the drug candidate. The approach isdemonstrated by a study conducted by Robertson et al.,[109]
where Wistar rats were treated with two known hepatotoxicants(CCl4, α-naphthylisothiocyanate) and two known nephrotoxicants(4-aminophenol, 2-bromoethylamine (BEA)). Urine samples werecollected daily from the rats and analyzed using 1D 1H NMRand PCA. The 3D scores plot comparing drug treated rats
(a)
(b)
Figure 6. (a) 1D 1H NMR spectra of urine from Wistar rats dosed with two known hepatotoxicants and two known nephrotoxicants. Combined PCAanalysis of all toxicant treatments (filled symbols) and all untreated samples (open circles). Toxicant data are as follows: squares = CCl4, hexagons =α-naphthylisothiocyanate (ANIT), diamonds = 4-aminophenol (PAP), and triangles = 2-bromoethylamine (BEA). The results demonstrate the clear onsetof toxicity (Reprinted with permission from Ref. [109], Copyright 2000 by the Society of Toxicology). (b) Score plots from 1D 1H NMR spectra of urinecollected from 7-week-old male Han Wistar rats comparing the postdosed samples of the control group (group 1) and the groups dosed with the fivecompounds (groups 2–6). The samples are colored according to group. Group 3 was determined to have an extreme excretion of choline and the twocompounds were excluded as viable drug candidates (Reprinted with permission from Ref. [110], Copyright 2006 by American Chemical Society).
Magn. Reson. Chem. 2009, 47, S2–S11 Copyright c© 2009 John Wiley & Sons, Ltd. www.interscience.wiley.com/journal/mrc

S8
R. Powers
Figure 7. Illustration of the differential NMR metabolomics method. Different clustering patterns in PCA scores plot determine the activity and selectivityof drug candidates. Hypothetical PCA scores plot depict the following scenarios: (a) inactive compound, (b) active and selective inhibitor, (c) active,non-selective inhibition of target and secondary protein, and (d) active, non-selective preferential inhibition of secondary protein. Labels correspond towild-type cells (wt) and mutant cells (mut) (Reprinted with permission from Ref. [31], Copyright 2006 by American Chemical Society).
Figure 8. (a) Analysis of the in vivo activity of 8-azaxanthine (AZA) in A. nidulans targeting urate oxidase. The PCA scores plot comparing A. nidulansinactive urate oxidase mutant (uaZ14) (×), wild-type with AZA ( ), uaZ14 mutant with AZA (•), and wild-type cells (�). Results clearly demonstratethe selective activity (see Fig.7b) of AZA (Reprinted with permission from Ref. [31], Copyright 2006 by American Chemical Society). (b) Analysis of thein vivo activity of D-cycloserine (DCS) in mycobacteria targeting alanine racemase. PCA scores plot comparing wild-type (mc2155) (�), inactive D-alanineracemase mutant (TAM23) (•), DCS resistant mutants (GPM14 ( ), GPM16 (�)), restored D-alanine racemase activity mutant (TAM23 pTAMU3) ( )mc2155 with DCS (�), and TAM23 with DCS (•), GPM14 with DCS (�), GPM16 with DCS ( ), and TAM23 pTAMU3 with DCS ( ). The results clearlydemonstrate the active, non-selective inhibition of DCS (see Fig. 7c). The secondary target of DCS is predicted to be D-alanine-D-alanine ligase (Reprintedwith permission from Ref. [32], Copyright 2006 by American Chemical Society).
www.interscience.wiley.com/journal/mrc Copyright c© 2009 John Wiley & Sons, Ltd. Magn. Reson. Chem. 2009, 47, S2–S11
S9
NMR metabolomics and drug discovery
relative to control samples demonstrates a clear differentiationbetween healthy rats and those with the onset of toxicity (Fig. 6a).Dieterle et al.[110] used a similar approach to evaluate potentialdrug candidates during the early stage of development. Again,Wistar rats were dosed with five different compounds, whereurine samples were collected and analyzed by 1D 1H NMR andPCA. A 2D scores plot identified two compounds in Group 3that were outliers (Fig. 6b). Further NMR analysis determinedthat the two compounds induced an extreme excretion ofcholine, which eliminated the two compounds as viable drugleads.
Differential NMR metabolomics
Establishing a drug candidate’s in vivo efficacy and identifyingcompounds with toxicity problems at the earliest stages of thedrug discovery process is preferable to encountering problemsduring animal or clinical trials.[111,112] While multiple approachesare being developed to address this challenging endeavor, includ-ing in silco absorption, distribution, metabolism, and excretion(ADME) protocols,[113 – 115] the differential NMR metabolomicsmethodology[31,32] provides a straightforward experimental ap-proach to rapidly ascertain the in vivo efficacy and selectivity ofdrug candidates and to identify potential toxicity issues. The ap-proach compares the metabolome of wild-type (wt) and mutant(mut) cell lines under various environmental stress conditions in-cluding drug treatments. In principle, the method can be appliedto any type of competent cells (bacteria, fungi, or human tissues).Simply, 1D 1H NMR spectra are collected from a series of celllysates followed by PCA, where different clustering patterns in the2D scores plot determines the activity and selectivity of the drugcandidate (Fig. 7). In general, four different cell lines correspondingto (i) wt cells, (ii) mutant cells, (iii) wt cells with the drug candi-date, and (iv) mutant cells with the drug candidate are grown in∼10–50 ml of culture media. Typically, 10 replicates are preparedfor each cell line. The mutant cells have the drug’s protein targetinactivated. In this manner, if the drug is active and selective, thewt cells in the presence of the drug are expected to cluster withthe mutant cells with or without the drug (Fig. 7b). Effectively, thetarget protein has been inactivated either chemically or geneti-cally resulting in essentially identical changes in the metabolome.Different clustering patterns in the 2D scores plot occur if thedrug is inactive, non-selective, or inhibiting an alternative protein(Fig. 7).
Forgue et al.[31] demonstrated the general application of thedifferential NMR metabolomics technique by validating the in vivoactivity of 8-azaxanthine (AZA), an inhibitor of urate oxidase, inAspergillus nidulans. Small volumes of A. nidulans mycelia wereprepared in the presence and absence of AZA using wt and auaZ14 mutant coding for urate oxidase. As expected, wt cells inthe presence of AZA cluster together in the 2D scores plot with theuaZ14 mutant mycelia with or without the addition of AZA (Fig. 8a).This result suggests AZA is both active and selective in vivo (Fig. 7b).A similar study was performed by Halouska et al.[32] to determinethe in vivo target of D-cycloserine (DCS) in mycobacteria. DCS isknown to inhibit multiple proteins in vitro, but despite being usedas a second-tier antibiotic for 50 years, the in vivo lethal target isunknown. Both D-alanine racemase (alr) and D-alanine-D-alanineligase (ddl) are potential targets, where a alr deletion mutantwas used to determine whether alr is the in vivo target of DCS.Again, the differential NMR metabolomics protocol uses 1D 1HNMR spectra from cell lysates of wt and mutant Mycobacterium
smegmatis in the presence and absence of DCS followed by PCA.Interestingly, all cell cultures in the presence of DCS formeda distinct and separate cluster from the wt and mutant cells(Fig. 8b). This result implies that DCS inhibited a second proteintarget in M. smegmatis (Fig. 7c), where alr was not the lethalin vivo target of DCS and ddl is the likely source of DCS activity inmycobacteria.
Conclusion
The versatility of NMR has enabled the technique to makesignificant and valuable contributions to the discovery, validation,and optimization of drug leads. In a similar manner, NMRmetabolomic methodologies are aiding in the discovery of diseasebiomarkers, evaluating in vivo drug toxicity and assisting inthe early evaluation of lead candidates for in vivo efficacy andselectivity. The drug discovery process is an extremely challengingand costly endeavor, but these high-risk efforts, when successful,yield tremendous benefits to human health. NMR will continueto expand its important role in drug discovery as evident by therecent advances in NMR-based metabolomics.
References[1] J. W. Armstrong, Am. Biotechnol. Lab. 1999, 17, 26.[2] J. E. Gonzalez, P. A. Negulescu, Curr. Opin. Biotechnol. 1998, 9, 624.[3] K. R. Oldenburg, Annu. Rep. Med. Chem. 1998, 33, 301.[4] P. B. Fernandes, Curr. Opin. Chem. Biol. 1998, 2, 597.[5] B. A. Kenny, M. Bushfield, D. J. Parry-Smith, S. Fogarty,
J. M. Treherne, Prog. Drug Res. 1998, 51, 245.[6] K. Gubernator, H. J. Boehm, Methods Princ. Med. Chem. 1998, 6, 15.[7] H. Kubinyi, Curr. Opin. Drug Discov. Dev. 1998, 1, 4.[8] H. Kubinyi, Die Pharm. 1995, 50, 647.[9] E. Ratti, D. Trist, Pure Appl. Chem. 2001, 73, 67.
[10] M. Pellecchia, D. S. Sem, K. Wuthrich, Nat. Rev. Drug Discov. 2002,1, 211.
[11] B. J. Stockman, C. Dalvit, Prog. Nucl. Magn. Reson. Spectrosc. 2002,41, 187.
[12] D. Wishart, Curr. Pharm. Biotechnol. 2005, 6, 105.[13] M. Betz, K. Saxena, H. Schwalbe, Curr. Opin. Cell Biol. 2006, 10, 219.[14] R. Powers, M. M. Siegel, in Novel Anticancer Agents: Strategies for
Discovery and Clinical Testing, (Eds: A. A. Adjei, J. K. Buolamwinis),Elsevier Science: New York, 2006, p 107.
[15] R. Powers, J. Struct. Funct. Genomics 2002, 2, 113.[16] E. Fukushi, Biosci. Biotechnol. Biochem. 2006, 70, 1803.[17] E. E. Kwan, S. G. Huang, Eur. J. Org. Chem. 2008, 16, 2671.[18] P. J. Hajduk, J. Greer, Nat. Rev. Drug Discov. 2007, 6, 211.[19] J. Klages, M. Coles, H. Kessler, Analyst (Cambridge, U.K.) 2007, 132,
693.[20] H. O. Villar, J. Yan, M. R. Hansen, Curr. Opin. Cell Biol. 2004, 8,
387.[21] K. A. Mercier, M. Shortridge, R. Powers, Comb. Chem. High
Throughput Screen. 2008, 12, 285.[22] K. A. Mercier, K. Germer, R. Powers, Comb. Chem. High Throughput
Screen. 2006, 9, 515.[23] N. Baurin, F. Aboul-Ela, X. Barril, B. Davis, M. Drysdale, B. Dymock,
H. Finch, C. Fromont, C. Richardson, H. Simmonite, R. E. Hubbard,J. Chem. Inf. Comput. Sci. 2004, 44, 2157.
[24] A. Schuffenhauer, S. Ruedisser, A. L. Marzinzik, W. Jahnke,M. Blommers, P. Selzer, E. Jacoby, Curr. Top. Med. Chem. (Sharjah,United Arab Emirates) 2005, 5, 751.
[25] A. E. Ferentz, G. Wagner, Q. Rev. Biophys. 2000, 33, 29.[26] J. Stark, R. Powers, J. Am. Chem. Soc. 2008, 130, 535.[27] D. G. Robertson, M. D. Reily, J. D. Baker, Exp. Opin. Drug Metabol.
Toxicol. 2005, 1, 363.[28] J. C. Lindon, E. Holmes, M. E. Bollard, E. G. Stanley, J. K. Nicholson,
Biomarkers 2004, 9, 1.[29] A. DiMasi Joseph, W. Hansen Ronald, G. Grabowski Henry, J. Health
Econ. 2003, 22, 151.
Magn. Reson. Chem. 2009, 47, S2–S11 Copyright c© 2009 John Wiley & Sons, Ltd. www.interscience.wiley.com/journal/mrc

S10
R. Powers
[30] W. Brains, Drug Discov. World 2004, 5, 9.[31] P. Forgue, S. Halouska, M. Werth, K. Xu, S. Harris, R. Powers,
J. Proteome Res. 2006, 5, 1916.[32] S. Halouska, O. Chacon, R. J. Fenton, D. K. Zinniel, R. G. Barletta,
R. Powers, J. Proteome Res. 2007, 6, 4608.[33] D. G. Robertson, M. D. Reily, J. D. Baker, J. Proteome Res. 2007, 6,
526.[34] V. S. Gomase, S. S. Changbhale, S. A. Patil, K. V. Kale, Curr. Drug
Metab. 2008, 9, 89.[35] S. L. Robinette, F. Zhang, L. Bruschweiler-Li, R. Bruschweiler, Anal.
Chem. 2008, 80, 3606.[36] Q. Cui, I. A. Lewis, A. D. Hegeman, M. E. Anderson, J. Li,
C. F. Schulte, W. M. Westler, H. R. Eghbalnia, M. R. Sussman,J. L. Markley, Nat. Biotechnol. 2008, 26, 162.
[37] D. S. Wishart, D. Tzur, C. Knox, R. Eisner, A. C. Guo, N. Young,D. Cheng, K. Jewell, D. Arndt, S. Sawhney, C. Fung, L. Nikolai,M. Lewis, M.-A. Coutouly, I. Forsythe, P. Tang, S. Shrivastava,K. Jeroncic, P. Stothard, G. Amegbey, D. Block, D. D. Hau,J. Wagner, J. Miniaci, M. Clements, M. Gebremedhin,N. Guo, Y. Zhang, G. E. Duggan, G. D. MacInnis, A. M. Weljie,R. Dowlatabadi, F. Bamforth, D. Clive, R. Greiner, L. Li, T. Marrie,B. D. Sykes, H. J. Vogel, L. Querengesser, Nucleic Acids Res. 2007,35, D521.
[38] S. Vangala, A. Tonelli, AAPS J. 2007, 9, E284.[39] J. P. Shockcor, E. Holmes, Curr. Top. Med. Chem. (Hilversum,
Netherlands) 2002, 2, 35.[40] G. Navon, H. Burrows, J. S. Cohen, FEBS Lett. 1983, 162, 320.[41] J. Pfeuffer, I. Tkac, S. W. Provencher, R. Gruetter, J. Magn. Reson.
1999, 141, 104.[42] H. C. Keun, T. M. D. Ebbels, H. Antti, M. E. Bollard, O. Beckonert,
E. Holmes, J. C. Lindon, J. K. Nicholson, Anal. Chim. Acta 2003, 490,265.
[43] R.-J. A. N. Lamers, J. DeGroot, E. J. Spies-Faber, R. H. Jellema,V. B. Kraus, N. Verzijl, J. M. TeKoppele, G. K. Spijksma, J. T. W. E.Vogels, J. van der Greef, J. H. J. van Nesselrooij, J. Nutr. 2003,133, 1776.
[44] J. C. Lindon, J. K. Nicholson, Trends Anal. Chem. 2008, 27, 194.[45] H. Wu, A. D. Southam, A. Hines, M. R. Viant, Anal. Biochem. 2008,
372, 204.[46] S. Tiziani, A.-H. Emwas, A. Lodi, C. Ludwig, C. M. Bunce, M. R. Viant,
U. L. Guenther, Anal. Biochem. 2008, 377, 16.[47] C. Y. Lin, H. Wu, R. S. Tjeerdema, M. R. Viant, Metabolomics 2007, 3,
55.[48] R. Stoyanova, T. R. Brown, NMR Biomed. 2001, 14, 271.[49] J. C. Lindon, E. Holmes, J. K. Nicholson, Prog. Nucl. Magn. Reson.
Spectrosc. 2001, 39, 1.[50] B. C. M. Potts, A. J. Deese, G. J. Stevens, M. D. Reily, D. G. Robertson,
J. Theiss, J. Pharm. Biomed. Anal. 2001, 26, 463.[51] S. Halouska, R. Powers, J. Magn. Reson. 2006, 178, 88.[52] M.-E. Dumas, E. C. Maibaum, C. Teague, H. Ueshima, B. Zhou,
J. C. Lindon, J. K. Nicholson, J. Stamler, P. Elliott, Q. Chan,E. Holmes, Anal. Chem. 2006, 78, 2199.
[53] A. C. Kuesel, R. Stoyanova, N. R. Aiken, C.-W. Li, B. S. Szwergold,C. Shaller, T. R. Brown, NMR Biomed. 1996, 9, 93.
[54] T. W. M. Fan, A. N. Lane, Prog. Nucl. Magn. Reson. Spectrosc. 2008,52, 69.
[55] D. S. Wishart, Trends Anal. Chem. 2008, 27, 228.[56] J. L. Griffin, M. E. Bollard, Curr. Drug Metab. 2004, 5, 389.[57] M. Coen, E. Holmes, J. C. Lindon, J. K. Nicholson, Chem. Res. Toxicol.
2008, 21, 9.[58] L. M. Raamsdonk, B. Teusink, D. Broadhurst, N. Zhang, A. Hayes,
M. C. Walsh, J. A. Berden, K. M. Brindle, D. B. Kell, J. J. Rowland,H. V. Westerhoff, K. Van Dam, S. G. Oliver, Nat. Biotechnol. 2001,19, 45.
[59] J. K. Nicholson, J. Connelly, J. C. Lindon, E. Holmes, Nat. Rev. DrugDiscov. 2002, 1, 153.
[60] D. S. Wishart, Drugs R&D 2007, 8, 349.[61] M. Segall, Eur. Biopharm. Rev. 2008, 72.[62] E. J. Saude, B. D. Sykes, Metabolomics 2007, 3, 19.[63] A. D. Maher, S. F. M. Zirah, E. Holmes, J. K. Nicholson, Anal. Chem.
2007, 79, 5204.[64] R. A. van den Berg, H. C. J. Hoefsloot, J. A. Westerhuis, A. K. Smilde,
M. J. van der Werf, BMC Genomics 2006, 7, 142.
[65] E. Holmes, P. J. D. Foxall, J. K. Nicholson, G. H. Neild, S. M. Brown,C. R. Beddell, B. C. Sweatman, E. Rahr, J. C. Lindon, M. Spraul,P. Neidig, Anal. Biochem. 1994, 220, 284.
[66] A. Ross, G. Schlotterbeck, W. Klaus, H. Senn, J. Biomol. NMR 2000,16, 139.
[67] T. De Meyer, D. Sinnaeve, B. Van Gasse, E. Tsiporkova,E. R. Rietzschel, M. L. De Buyzere, T. C. Gillebert, S. Bekaert,J. C. Martins, W. Van Criekinge, Anal. Chem. 2008, 80, 3783.
[68] R. Stoyanova, A. W. Nicholls, J. K. Nicholson, J. C. Lindon,T. R. Brown, J. Magn. Reson. 2004, 170, 329.
[69] I. A. Lewis, S. C. Schommer, B. Hodis, K. A. Robb, M. Tonelli,W. M. Westler, M. R. Sussman, J. L. Markley, Anal. Chem. 2007, 79,9385.
[70] L. Csenki, E. Alm, R. J. O. Torgrip, K. M. Aaberg, L. I. Nord,I. Schuppe-Koistinen, J. Lindberg, Anal. Bioanal. Chem. 2007, 389,875.
[71] M. Zheng, P. Lu, Y. Liu, J. Pease, J. Usuka, G. Liao, G. Peltz,Bioinformatics 2007, 23, 2926.
[72] J. Forshed, I. Schuppe-Koistinen, S. P. Jacobsson, Anal. Chim. Acta2003, 487, 189.
[73] D. B. Kell, Curr. Opin. Microbiol. 2004, 7, 296.[74] W. Weckwerth, Annu. Rev. Plant Biol. 2003, 54, 669.[75] J. Wixon, D. Kell, Yeast 2000, 17, 48.[76] R. Caspi, H. Foerster, C. A. Fulcher, P. Kaipa, M. Krummenacker,
M. Latendresse, S. Paley, S. Y. Rhee, A. G. Shearer, C. Tissier,T. C. Walk, P. Zhang, P. D. Karp, Nucleic Acids Res. 2008, 36,D623.
[77] A. Vehtari, V.-P. Makinen, P. Soininen, P. Ingman, S. M. Makela,M. J. Savolainen, M. L. Hannuksela, K. Kaski, M. Ala-Korpela, BMCBioinformatics 2007, 8.
[78] I. D. Wilson, R. Plumb, J. Granger, H. Major, R. Williams, E. M. Lenz,J. Chromatogr., B: Anal. Technol. Biomed. Life Sci. 2005, 817, 67.
[79] J. M. Halket, D. Waterman, A. M. Przyborowska, R. K. P. Patel,P. D. Fraser, P. M. Bramley, J. Exp. Bot. 2005, 56, 219.
[80] Z. Pan, D. Raftery, Anal. Bioanal. Chem. 2007, 387, 525.[81] H. Chen, Z. Pan, N. Talaty, D. Raftery, R. G. Cooks, Rapid Commun.
Mass Spectrom. 2006, 20, 1577.[82] D. J. Crockford, E. Holmes, J. C. Lindon, R. S. Plumb, S. Zirah,
S. J. Bruce, P. Rainville, C. L. Stumpf, J. K. Nicholson, Anal. Chem.2006, 78, 363.
[83] D. J. Crockford, A. D. Maher, K. R. Ahmadi, A. Barrett, R. S. Plumb,I. D. Wilson, J. K. Nicholson, Anal. Chem. 2008, 80, 6835.
[84] Z. Pan, H. Gu, N. Talaty, H. Chen, N. Shanaiah, B. E. Hainline,R. G. Cooks, D. Raftery, Anal. Bioanal. Chem. 2007, 387, 539.
[85] M.-E. Dumas, C. Canlet, L. Debrauwer, P. Martin, A. Paris,J. Proteome Res. 2005, 4, 1485.
[86] R. Mayeux, NeuroRx 2004, 1, 182.[87] S. Carraro, S. Rezzi, F. Reniero, K. Heberger, G. Giordano,
S. Zanconato, C. Guillou, E. Baraldi, Am. J. Respir. Crit. Care Med.2007, 175, 986.
[88] A. M. Weljie, R. Dowlatabadi, B. J. Miller, H. J. Vogel, F. R. Jirik,J. Proteome Res. 2007, 6, 3456.
[89] R. D. Beger, L. K. Schnackenberg, R. D. Holland, D. Li, Y. Dragan,Metabolomics 2006, 2, 125.
[90] K. W. Jordan, L. L. Cheng, Exp. Rev. Proteomics 2007, 4, 389.[91] T. M. O’Connell, F. Ardeshirpour, S. A. Asher, J. H. Winnike, X. Yin,
J. George, D. C. Guttridge, W. He, A. Wysong, M. S. Willis,M. E. Couch, Metabolomics 2008, 4, 216.
[92] I. Barba, G. de Leon, E. Martin, A. Cuevas, S. Aguade, J. Candell-Riera, J. A. Barrabes, D. Garcia-Dorado, Magn. Reson. Chem. 2008,60, 27.
[93] V.-P. Makinen, P. Soininen, C. Forsblom, M. Parkkonen, P. Ingman,K. Kaski, P.-H. Groop, M. Ala-Korpela, Mol. Syst. Biol. 2008.
[94] R. M. Salek, M. L. Maguire, E. Bentley, D. V. Robtsov, T. Hough,M. Cheeseman, D. Nunez, B. C. Sweatman, J. N. Haselden,R. D. Cox, S. C. Connor, J. L. Griffin, Physiol. Genomics 2007, 29,99.
[95] M. van Doorn, J. Vogels, A. Tas, E. J. van Hoogdalem, J. Burggraaf,A. Cohen, J. van der Greef, Br. J. Clin. Pharmacol. 2007, 63,562.
[96] A. A. Mahdi, S. Annarao, S. Tripathi, A. Nawab, F. Mahdi, M. Hasan,R. Roy, C. L. Khetrapal, Open Magn. Reson. J. 2008, 1, 71.
[97] N. Jiang, X. Yan, W. Zhou, Q. Zhang, H. Chen, Y. Zhang, X. Zhang,J. Proteome Res. 2008, 7, 3678.
www.interscience.wiley.com/journal/mrc Copyright c© 2009 John Wiley & Sons, Ltd. Magn. Reson. Chem. 2009, 47, S2–S11

S11
NMR metabolomics and drug discovery
[98] X. X. Gao, H. M. Ge, W. F. Zheng, R. X. Tan, Helicobacter 2008, 13,103.
[99] M. R. Fielden, K. L. Kolaja, Exp. Opin. Drug Saf. 2008, 7, 107.[100] J. L. Stevens, Chem. Res. Toxicol. 2006, 19, 1393.[101] I. Kola, J. Landis, Nat. Rev. Drug Discov. 2004, 3, 711.[102] S. T. Weiss, H. L. McLeod, D. A. Flockhart, M. E. Dolan,
N. L. Benowitz, J. A. Johnson, M. J. Ratain, K. M. Giacomini,Nat. Rev. Drug Discov. 2008, 7, 568.
[103] S.-F. Zhou, J. Fulcher, Curr. Pharmacogenomics Person. Med. 2008,6, 134.
[104] D. L. Mendrick, Toxicology 2008, 245, 175.[105] B. Hinz, B. Renner, K. Brune, Nat. Clin. Pract. Rheumatol. 2007, 3,
552.[106] M. Meadows, FDA Consum 2002, 36, 11.[107] T. A. Clayton, J. C. Lindon, O. Cloarec, H. Antti, C. Charuel,
G. Hanton, J.-P. Provost, J.-L. Le Net, D. Baker, R. J. Walley,J. R. Everett, J. K. Nicholson, Nature 2006, 440, 1073.
[108] J. K. Nicholson, E. Holmes, I. D. Wilson, Nat. Rev. Microbiol. 2005, 3,431.
[109] D. G. Robertson, M. D. Reily, R. E. Sigler, D. F. Wells, D. A. Paterson,T. K. Braden, Toxicol. Sci. 2000, 57, 326.
[110] F. Dieterle, G. Schlotterbeck, A. Ross, U. Niederhauser, H. Senn,Chem. Res. Toxicol. 2006, 19, 1175.
[111] K. Burley Stephen, F. Park, Genome Biol. 2005, 6, 330.[112] K. Sun, J.-H. Pan, Zhongguo Xinyao Yu Linchuang Zazhi 2007, 26,
783.[113] B. Singh, A. S. Dhake, D. Sethi, Y. Paul, Pharma Rev. 2007, 5, 93.[114] B. Singh, M. Parle, Y. Paul, L. Khurana, Pharma Rev. 2007, 5, 63.[115] B. Singh, Y. Paul, M. Grover, D. Sethi, Pharma Rev. 2007, 6, 179.
Magn. Reson. Chem. 2009, 47, S2–S11 Copyright c© 2009 John Wiley & Sons, Ltd. www.interscience.wiley.com/journal/mrc