using a 1 h nmr metabolomics approach - hindawi
TRANSCRIPT

Research ArticleAn Investigation into the Antiobesity Effects of Morindacitrifolia L. Leaf Extract in High Fat Diet Induced Obese RatsUsing a 1H NMR Metabolomics Approach
Najla Gooda Sahib Jambocus,1 Nazamid Saari,1 Amin Ismail,2 Alfi Khatib,3
Mohamad Fawzi Mahomoodally,4 and Azizah Abdul Hamid1,5
1Faculty of Food Science and Technology, Universiti Putra Malaysia, 43400 Serdang, Selangor, Malaysia2Faculty of Medicine and Health Sciences, Universiti Putra Malaysia, 43400 Serdang, Selangor, Malaysia3Department of Pharmaceutical Chemistry, Kulliyyah of Pharmacy, International Islamic University Malaysia,25200 Kuantan, Pahang, Malaysia4Department of Health Sciences, Faculty of Science, University of Mauritius, 230 Reduit, Mauritius5Halal Products Research Institute, Universiti Putra Malaysia, 43400 Serdang, Selangor, Malaysia
Correspondence should be addressed to Najla Gooda Sahib Jambocus; [email protected] Azizah Abdul Hamid; [email protected]
Received 14 June 2015; Revised 13 September 2015; Accepted 13 September 2015
Academic Editor: Michal Ciborowski
Copyright © 2016 Najla Gooda Sahib Jambocus et al. This is an open access article distributed under the Creative CommonsAttribution License, which permits unrestricted use, distribution, and reproduction in any medium, provided the original work isproperly cited.
Theprevalence of obesity is increasingworldwide, with high fat diet (HFD) as one of themain contributing factors.Obesity increasesthe predisposition to other diseases such as diabetes through various metabolic pathways. Limited availability of antiobesity drugsand the popularity of complementary medicine have encouraged research in finding phytochemical strategies to this multifaceteddisease. HFD induced obese Sprague-Dawley rats were treated with an extract of Morinda citrifolia L. leaves (MLE 60). After9 weeks of treatment, positive effects were observed on adiposity, fecal fat content, plasma lipids, and insulin and leptin levels.The inducement of obesity and treatment with MLE 60 on metabolic alterations were then further elucidated using a 1H NMRbased metabolomics approach. Discriminating metabolites involved were products of various metabolic pathways, includingglucose metabolism and TCA cycle (lactate, 2-oxoglutarate, citrate, succinate, pyruvate, and acetate), amino acid metabolism(alanine, 2-hydroxybutyrate), choline metabolism (betaine), creatinine metabolism (creatinine), and gut microbiome metabolism(hippurate, phenylacetylglycine, dimethylamine, and trigonelline). Treatment with MLE 60 resulted in significant improvementin the metabolic perturbations caused obesity as demonstrated by the proximity of the treated group to the normal group in theOPLS-DA score plot and the change in trajectory movement of the diseased group towards the healthy group upon treatment.
1. Introduction
The new understanding of obesity and its related disordershas resulted in a renewed interest in finding antiobesityagents from nature, with partial success [1]. An establishedantiobesity agent, such as green tea polyphenols, is one ofthe few plants extracts reported to reduce weight in bothanimals and human subjects [2–4]. Others include extractsof Nomame Herba, cocoa, and chitin/chitosan [5–7]. Whilethese studies yielded significant information on the effectof those plants on diet induced obesity and its biochemical
changes, the overall effect onmetabolic responses is relativelyunknown.
Metabolomics as a new bioanalytical technique in obe-sity research is still largely unexplored. This “omics” tech-nique is concerned with the high throughput identificationand quantification of small molecules (<1500Da) in themetabolome, the collection of small metabolites present ina cell, organ, or organism [8]. So far, the main applica-tion of the metabolomics approach has been in toxicolog-ical and pharmaceutical research, having the potential of
Hindawi Publishing CorporationJournal of Diabetes ResearchVolume 2016, Article ID 2391592, 14 pageshttp://dx.doi.org/10.1155/2016/2391592

2 Journal of Diabetes Research
“bridging Traditional Chinese Medicine (TCM) and molec-ular pharmacology” [9]. Metabolomics has been appliedfor extracts characterisation and quality control of herbalsupplements [10]. In regard to disease biomarkers discov-ery, metabolomics, in combination with multivariate dataanalysis, has been used for the profiling of various biofluids[11, 12]. More specifically to obesity research, it has beenused to discriminate betweenmetabolites of the obesemodelsand the healthy models [13–15]. Metabolites such as betaine,taurine, acetone/acetoacetate, phenylacetylglycine, pyruvate,lactate, and citrate were the main discriminating metabolitesbetween the obese and lean groups [13]. There is also theemerging trend of using metabolomics as a platform tostudy the holistic efficacy of traditional medicine. 1H NMRbased metabolomics approach was used to assess the effectof Xue-Fu-Zhu-Yu decoction (XFZYD) on high fat dietinduced hyperlipidemia in rats. Metabolomics analysis of theplasma, combined with multivariate data analysis, revealedthat XFZYD improved hyperlipidemia by regulating majormetabolic pathways such as decreasing the accumulationof ketone bodies, enhancing glutathione biosynthesis, andreversing disturbances in lipid and energy metabolism [16].
Morinda citrifolia L., commonly called noni or IndianMulberry, was discovered by the Polynesians more than 2000years ago and brought to southeast Asia during migration[17]. Different parts of the plant have a long history ofsafe use and were reported to have many health promotingproperties [18] including antidyslipidemic effects in rats [19]and inhibition of digestive and metabolic lipases in vitro[20–22]. We recently showed (results under publication) thata rutin rich extract of Morinda citrifolia leaves (MLE60)prevented weight and fat mass gain in lean Sprague-Dawleyrats fed with a high fat diet with an improvement in plasmalipids, leptin, and insulin profiles and increased fecal fatoutput.
In this study, we assessed the effects of the leaf extract inhigh fat diet induced obesemale Sprague-Dawley rats, using a1HNMRmetabolomics approach, analysing urine and serumfor markers metabolites.
2. Methodology
2.1. Preparation of Morinda citrifolia Leaf Extract (MLE 60).Mature M. citrifolia leaves were obtained from 5 represen-tative trees from Bukit Expo, Universiti Putra Malaysia, Ser-dang, Selangor, Malaysia. Voucher specimens were depositedat the herbarium, Institute of Bioscience, Universiti PutraMalaysia (SK2197/13), and species were confirmed as M.citrifolia L. The leaves were immediately quenched usingliquid nitrogen and lyophilised under pressure (−50∘C, 48–72 hours, LABONCO, Labonco Corporation, Kansas City,Missouri, USA) until constant weight.The dried plant samplewas ground using a commercial grinder, sieved, and stored at−80∘C until further use.
Dried plant materials were extracted with 60% ethanol atroom temperature for 72 hours. Filtrate was collected every24 hours and the pooled filtrate was rotary-evaporated undervacuum until being concentrated. The aqueous phase was
frozen at −80∘C and lyophilised under pressure (−50∘C, 48hours) and stored at −80∘C until future use. Extracts wereprepared by dissolving weighed amount of extract in 0.03%carboxymethyl cellulose (CMC).
2.2. Animal Experiment. Male Sprague-Dawley rats (3 weeksold) were purchased from Sapphire Enterprise, Malaysia, andacclimatized for 10 days under standard laboratory conditions(12 h light/dark cycle, 55–60% relative humidity, 23–25∘C).After acclimatization, rats were randomly divided into 2groups based on assigned diets: standard rat chow (GoldCoin,Malaysia) and a high saturated fat diet for 12 weeks (MPDiets, USA). The body weight of each rat in both groups wasrecordedweekly to ensure development of obesity in theHFDgroup. After 12 weeks of the assigned diet, rats in the HFDgroup were then further divided into the following groups(𝑛 = 6), based on supplementation or nonsupplementationwith MLE 60/Orlistat, and rats in both HFD and ND groupswere continued on their respective diets:
(i) ND: normal diet only.(ii) HFD: high fat diet only.(iii) HFD + 250: high fat diet + 250mg/kg body weight
MLE 60.(iv) HFD + 500: high fat diet + 500mg/kg body weight
MLE 60.(v) HFD + OR: high fat diet + 30mg/kg body weight
Orlistat.
Orlistat, the currently available pancreatic lipase inhibitor,was used as positive control. An overview of the experimentis given in Figure 1.
2.3. Administration of MLE 60. Animals were allowed theirrespective diets ad libitum and required dosage of MLE 60was given through gastric intubation. Volume of extractsgiven per day did not exceed 3mL. Control groups (NDand HFD) received the vehicle (0.03% CMC) through gastricintubation. Body weight and food intake of each rat wererecorded weekly.
2.4. Urine, Serum, and Feces Collection. Animals were placedin individual metabolic cages at the initial, middle, and finalstages of the experiment. Urine was collected over 24 hoursin tubes containing 1% sodium azide, transferred to urinespecimen bottles, and stored at −80∘C until being analysed.Blood samples were collected by cardiac puncture and serumand plasma samples were separated at 1500×g for 15 minutesand stored at −80∘C for further analysis. Feces were collectedand stored in airtight containers at−80∘C for further analysis.
2.5. Sacrifice of Animals. After 12 weeks of obesity induc-tion and 9 weeks of treatment, animals were weighed andsacrificed by cardiac puncture under an anaesthetic effect(xylazine + ketamine). Rats were deprived of food for12 h prior to sacrifice. Serum and plasma samples wereseparated at 1500×g for 15 minutes and stored at −80∘C

Journal of Diabetes Research 3
Sacrifice and analysisCollection of organs, serum, and plasma for further analysis
High fat diet (HFD)
Normal diet
10-day acclimatization
onlyND only mg/kg mg/kg HFD
12-week HFD or ND
9-week treatment 30mg/kgHFD + ORHFD + 500HFD + 250
(ND) n = 12n = 24
Male Sprague-Dawley rats (n = 36)
Figure 1: Schematic diagram of the experimental design to assess the antiobesity effect of MLE 60 in HFD induced obese male Sprague-Dawley rats.
for further analysis. All animals were handled accordingto the international principles of the Use and Handling ofExperimental Animals (United States National Institute ofHealth, 1985) and all the protocols were approved by theAnimalHouse andUseCommittee of the Faculty ofMedicineand Health Sciences, Universiti Putra Malaysia (Approvalnumber UPM/FPSK/PADS/BR.UUH/00462).
2.6. Clinical Chemistry Measurements. Various biochemi-cal parameters were measured, including blood glucose(One Touch Basic glucose monitor, LifeScan), lipids profiles(Roche Diagnostics GmbH, Sandhofer Strasse, Mannheim),total cholesterol (TC), total triglycerides (TG), low den-sity lipoprotein (LDL), high density lipoprotein (HDL),kidney function tests (creatinine and urea), liver functiontests 𝛾-glutamyltransferase (GGT), alanine aminotransferase(ALT), aspartate aminotransferase (AST), alkaline phos-phatase (ALP), leptin (RayBio Rat Leptin ELISA kit, Cat#ELR-Leptin-001, Norcross, GA, USA), insulin (Mercodia RatInsulin ELISA, Uppsala, Sweden), adiponectin (Assay-MaxRat Adiponectin ELISA kit, Cat# ERA2500-1), and ghrelin(RayBio Rat Ghrelin ELISA kit, Cat# EIA-GHR-1, Norcross,GS,USA). All procedureswere carried out in accordancewiththe manufacturers’ instruction.
2.7. Determination of Fecal Fat Content. Fecal lipid contentwas determined according to a modified method of Tsujita
et al. [23]. Feces were collected at the initial and final stagesof the experiment and stored at −80∘C until further analysis.Feces (0.5 g) were soaked in 2mL of deionized water for24 hours at 4∘C, followed by homogenisation by vortexingat high speed for 60 seconds. Lipids were extracted with7.5mL of methanol : chloroform (2 : 1, v : v) and shaken for30 minutes, followed by addition of 2.5mL of deionizedwater and 2.5mL of chloroform and further shaking for 30minutes. Mixture was then centrifuged at 2000 g for 15minand the lipophilic layer from the extraction was collected anddried under vacuum. Total fat content was weighed using alaboratory balance.
2.8. 1H NMR Analysis of Urine and Serum. 1HNMR analysisof urine and serum was carried out following the methodof Beckonert et al. [12]. Urine samples were thawed andcentrifuged at 12 000×g for 10 minutes. 400𝜇L of thesupernatantwasmixedwith 200𝜇Lphosphate buffer solutionconsisting of 0.1% of 3-trimethylsilyl propionic-2,2,3,3-d4acid sodium salt (TSP) as internal standard (adjusted to pH7.4 using NaOD) and transferred into 5mm NMR tubes.Spectra were acquired at 27∘C on a Varian Unity INOVA500MHz spectrometer (Varian Inc., CA), with a frequency of499.887MHz. Standard one-dimensional (1D)NOESY-presatpulse sequence was used for suppression of the water peak.For each sample, 64 scans were recorded with an acquisition

4 Journal of Diabetes Research
time of 1.36 s, pulse width of 3.75 𝜇s, and relaxation delay of1.0 s.
For serum, thawed samples were centrifuged at 12 000×gfor 10 minutes and 200𝜇L of the supernatant was mixedwith 400𝜇L of phosphate buffer containing 0.2% TSP andtransferred into 5mm NMR tubes. In addition to theNOESY-presat experiments, water suppressed Carr-Purcell-Meiboom-Gill (CPMG) spin-echo pulse was performed tosuppress broad signals from macromolecules. The CPMGspectra were acquired with 128 transients, with an acquisitiontime of 1.36 s, relaxation delay of 2.0 s, and number of loopsof 𝑛 = 80.
Additional two-dimensional 1H-1H J resolved and 1H-13C HMBC analysis was performed to confirm the identityof certain metabolites.
2.9. NMR Spectral Data Reduction and Multivariate DataAnalysis. Chenomx NMR Suite (Chenomx, Calgary,Canada) was used for metabolite identification andquantification. Nonzero filled spectra were manually phasedand baseline corrected, calibrated to TSP at 0.00 ppm.Processed spectra (𝛿 0−10 ppm) were segmented (0.04 ppm)using the profiler module. Residual signals of water (𝛿4.75–𝛿 4.85) and urea (𝛿 5.50–𝛿 6.00 ppm) were excludedfrom analysis. Remaining bins were normalized to the sumof spectral integrals, extracted with Microsoft Excel, andimported into Simca-P software (Umetrics, Umea, Sweden)for multivariate data analysis.
Multivariate data analysis was performed using the meancentering with Pareto scaling. Principal component anal-ysis (PCA) was selected as the initial clustering method.Partial Least Squares Discriminant Analysis (PLS-DA) wasfurther performed as a supervised pattern recognition anal-ysis, which maximizes the variation between the differentgroups and identifies variables responsible for the separation.Orthogonal projections to latent structures-discriminantanalysis (OPLS-DA) were also performed for biomarkersanalysis between the obese and lean groups and any metabo-lite changes associated with MLE 60 treatment [24].
2.10. Statistical Analysis. Data are expressed as mean ± stan-dard deviation (SD). Difference between groups was deter-mined by one-way analysis of variance (ANOVA, MinitabVersion 14.0). Values were considered to be significantlydifferent at the level of 𝑝 < 0.05. For analysis of fecalfat content (week 6 and week 12) and body weight (beforeand after treatment), significance was further confirmed withone-sample 𝑡-test.
3. Results and Discussion
3.1. Induction of Obesity in Sprague-Dawley Rats Using a HighSaturated Fat Diet. After 12 weeks of either the HFD or theND, rats on the HFD had significantly higher weight gainas compared to rats on the ND. Sprague-Dawley rats onthe HFD put on 157.54 ± 39.54% of their original weightwhereas rats on the ND gained 93.34±13.82%. Other obesityrelated biomarkers such as total triglycerides (TG), total
Table 1: The plasma biochemistry of rats fed a normal diet (ND) ora high fat diet (HFD) for 12 weeks to induce obesity.
ND HFDTotal cholesterol (mmol/L) 1.28 ± 0.15a 1.16 ± 0.09a
HDL (mmol/L) 0.99 ± 0.16a 0.66 ± 0.08b
LDL (mmol/L) 0.28 ± 0.02a 0.23 ± 0.03a
Triglycerides (mmol/L) 0.43 ± 0.07a 0.91 ± 0.15b
Leptin (pg/mL) 719.30 ± 150.1a 1819.50 ± 150.1b
Insulin (𝜇g/L) 0.20 ± 0.02a 1.30 ± 0.09b
Adiponectin (ng/mL) 7.40 ± 0.50a 6.11 ± 0.07b
Glucose (mmol/L) 5.68 ± 0.33a 6.26 ± 0.13b
Urea (𝜇mol/L) 6.26 ± 0.81a 5.14 ± 0.80a
Creatinine (mmol/L) 55.20 ± 2.17a 51.60 ± 2.41a
GGT (U/L) 1.00 ± 0.00a 6.00 ± 0.84b
AST (U/L) 76.36 ± 3.16a 75.40 ± 1.29a
ALT (U/L) 37.64 ± 5.26a 30.82 ± 1.48b
ALP (U/L) 69.14 ± 9.98a 127.20 ± 5.07b
Different small letters indicate significant difference (𝑝 < 0.05) between NDand HFD groups as shown by analysis of variance (ANOVA) using MinitabVersion 14.
cholesterol (TC), low density lipoprotein (LDL), and highdensity lipoprotein (HDL) levels in the plasma were alsoaffected by the diet intervention (Table 1). Obese rats hadlower HDL level (0.65 ± 0.08mmol/L) as compared to leanrats (0.986 ± 0.16). There was no significant difference in theplasma TC and LDL content in both groups.TheTG level wassignificantly (𝑝 < 0.05) elevated in the group fed the HFD(0.908±0.15mmol/L) as compared to rats fed theND (0.432±0.07). Obese rats had higher fasting glucose levels than leanrats, though still in the normal range. Other obesity relatedadipocytic factors such as leptin and insulin were elevatedin the obese models. Kidney function tests as measured byplasma urea and creatinine levels appeared normal, withno significant difference between the groups. In terms ofliver function, GGT, ALT, and ALP levels were increasedin obese rats fed the HFD. Hypercaloric diets ranging from3.7 to 5.5 kcal/g result in models of obesity, which representthe aetiology of obesity at its best and reproduce its patho-physiological characteristics [25]. The increase in weightgain is gradual as the intervention progresses. Based on thechanges in lipid profiles and other plasma biochemistries,our study, which uses HFD containing 36% of total caloriesfrom coconut oil, supports the theory that coconut/lard basedhigh fat diets do model the metabolic disorders of humanobesity in rodents [26, 27]. More specifically, a hydrogenatedcoconut oil (HCO) based HFD has previously caused weightgain, increased liver weight, and hyperlipidaemia in rats [28].Based on the significant increase in body weight and otherbiochemical parametersmeasured, we can conclude that highfat diet induced obesity was successfully achieved in maleSprague-Dawley rats after a feeding period of 12 weeks.
3.2. 1H NMR Spectra of Urine and Serum Metabolites ofSprague-Dawley Rats FedHFDorND for 12Weeks. Represen-tatives of 1H NMR spectra for the serum and urine samples

Journal of Diabetes Research 5
Lean
Obese
2.0 1.04.0 3.05.0
2.0 1.04.0 3.05.0
f1 (ppm)
f1 (ppm)
Figure 2: Typical 500MHz 1H NMR spectra of serum collectedfrom a Sprague-Dawley rat fed a normal diet (lean) and a Sprague-Dawley rat fed a high fat diet (obese).
Urea
Obese
Lean
5.0 0.010.0
5.0 0.010.0f1 (ppm)
f1 (ppm)
Figure 3: Typical 500MHz 1HNMR spectra of urine collected froma Sprague-Dawley rat fed a high fat diet (obese) and a Sprague-Dawley rat fed a normal diet (lean).
from an obese rat fed HFD and a lean rat fed ND for 12weeks are shown in Figures 2 and 3, respectively. Expandedregions for better comparison are available in SupplementaryData sections in Supplementary Material available onlineat http://dx.doi.org/10.1155/2016/2391592. Metabolites wereassigned based on previous studies [29, 30], the ChenomxNMR Suite, Version 7.7 (Chenomx Inc., Edmonton, AB,Canada), and the Human Urine and Serum MetabolomeDatabases [31, 32]. Additional two-dimensional 1H-1H Jresolved and HMBC analysis was performed to aid in theidentification of certain metabolites. A list of the identifiedmetabolites, including their chemical shifts, is represented inTable 2.
CV ANOVA was used to test the significance of themodels, whereby significance is achieved with a 𝑝 value lessthan 0.05. Both PLS-DA and OPLS-DAmodels for urine andserum were validated accordingly (Table 3).
Table 2: 1H NMR assignments of metabolites in rat’s serum andurine.
Metabolites Assignments Chemical shifts SamplesUrea NH
25.78 (s) U
Phenylacetylglycine
2,6-CH 7.42 (m)
U3,5-CH, 7.57 (m)7-CH 7.65 (m)10-CH 7.84 (m)
Trigonelline
𝛾CH3
4.43 (s)
UC2H 8.1 (m)
C4H 8.8 (m)
C5H, 9.1 (s)
HippurateCH2, 3.98 (d)
UCH 7.54 (d)CH 7.65 (t)
Acetate CH3
1.93 (s) U, SDimethylamine CH
32.71 (s) U
Citrate 1/2CH2
2.54 (d) U1/2CH
22.66 (d)
2-Oxoglutarate CH2
2.45 (t) UCH3
3.02 (t)
Creatinine CH3, 3.06 (s) U
CH2
4.06 (s)
Lactate CH3, 1.34 (d) U, S
CH 4.11 (dd)Β-Glucose 1-CH 4.66 (d) U, S𝛼-Glucose 1-CH 5.22 (d) U, SAllantoin CH 5.38 (s) UGlycine CH
23.57 (s) U
Taurine CH2S, 3.26 (t) U, S
CH2-N 3.40 (t)
TMAO N (CH3)3 3.26 (s) U
Alanine 𝛽CH3, 3.78 (dd) S
𝛼CH 1.48 (d)Pyruvate 𝛽CH
32.38 (s) S
Succinate CH 2.41 (s) SAcetoacetate CH
32.27 (s) S
3-Hydroxybutyrate
𝛾CH3
1.18 (d)
S𝛽CH 4.23 (m)𝛼CH2
2.31 (d)𝛼CH2
2.38 (dd)2-Hydroxyisobutyrate CH
31.34 (s) S
Lipoprotein CH3 (CH2)𝑛 0.89 (m) SLDL/VLDL CH
3CH2CH2C= 1.2–1.30 (m) S
s: singlet; d: doublet; t: triplet; dd: doublet of doublets; m: multiplet.S: serum; U: urine.
The variable importance in project (VIP) plots weregenerated to identify metabolites contributing significantlyto the separation of the obese and the lean groups. A cut-off value of 0.7-0.8 for the VIP is generally acceptable. In thisstudy, the cut-off value was set at 1.0 [24].

6 Journal of Diabetes Research
Obese (HFD) Lean (ND)
HFDND
0−1 0.40.2 0.6 0.8−0.2−0.4−0.8 −0.6
PC1 (37.6%)
−0.4
−0.3
−0.2
−0.1
0
0.1
0.2
0.3PC
2(7.42
%)
(a)
Lactate
Betaine
Taurine
Acetate
VLDL/LDL
PyruvateSuccinate
Obese (HFD) Lean (ND)
Acetoacetate
2-Hydroxyisobutyrate
−0.3 −0.2 −0.1 0.20.1 0.3−0.4−0.5 0
W∗ C[1]
−0.3
−0.2
−0.1
0
0.1
0.2
0.3
0.4
0.5
W∗C[2]
(b)
9.989.94
9.9
9.86
9.829.78
9.749.7
9.669.62
9.58
9.549.5
9.469.429.389.34
9.39.269.229.189.149.19.06
9.028.98
8.948.9
8.86
8.82
8.78
8.748.78.668.628.58
8.54
8.5
8.468.428.38
8.34
8.3
8.268.22
8.188.148.1
8.068.027.987.947.9
7.867.82
7.78
7.74
7.7
7.66
7.62
7.58
7.547.5
7.46
7.42
7.38
7.347.3
7.26
7.227.18
7.14
7.1
7.06
7.026.98
6.94
6.9
6.866.826.78
6.746.76.66
6.626.586.54
6.56.466.426.386.346.36.266.22
6.186.146.1
6.06
6.025.98
5.945.95.86
5.825.785.74
5.7
5.66
5.625.585.54
5.5
5.465.425.38
5.345.3
5.26
5.22
5.185.145.1
5.065.02
4.69
4.664.62
4.58
4.54
4.54.464.42
4.38
4.344.3
4.26
4.22
4.184.14
4.1
4.06
4.023.98
3.943.9
3.86
3.82
3.78
3.74
3.7
3.66
3.62
3.58
3.54
3.53.46
3.423.38
3.34
3.3
3.26
3.223.18
3.14
3.13.06
3.02
2.98
2.94
2.9
2.86
2.822.78
2.74
2.72.66
2.62
2.58
2.54
2.52.46
2.42 2.38
2.34
2.3
2.26
2.22
2.18
2.14
2.1
2.062.021.98
1.94
1.9
1.86
1.821.78
1.741.7
1.661.62
1.58
1.54
1.51.46
1.42
1.38
1.341.3
1.26
1.22
1.18
1.14
1.1
1.061.020.980.94
0.9
0.86
0.82
0.78
0.74
0.7
0.660.62
0.58
0.54
0.5
0.460.420.38
0.340.3
0.260.220.18
0.140.1
0.060.02
Lactate3-HydroxybutyrateBetaineTaurine
PyruvateSuccinateAcetoacetateAcetate
−0.4 −0.3 −0.2 −0.1 0 0.1 0.2 0.3 0.4−0.5
p[1]
−1
−0.8
−0.6
−0.4
−0.2
0
0.2
0.4
0.6
0.8
p(c
orr)
[1]
(c)
Figure 4: OPLS-DA derived score plot (a), loading plot (b), and 𝑆 plot (c) obtained using 1H NMR data for serum samples from Sprague-Dawley rats fed a high fat diet (HFD) or a normal diet (ND) for 12 weeks.
Table 3: PLSDA and OPLS-DA models validation for serum andurine of Sprague-Dawley rats fed a high fat diet (HFD) or a normaldiet (ND) for 12 weeks.
Samples/models 𝑅2𝑌 𝑄2𝑌
p CVANOVA
Number ofcomponents
SerumPLS-DA 0.830 0.752 3.32 × 10⁻⁶ 2OPLS-DA 0.987 0.936 4.26 × 10⁻⁷ 2
UrinePLS-DA 0.917 0.874 3.18 × 10⁻¹² 3OPLS-DA 0.959 0.923 1.89 × 10⁻¹² 3
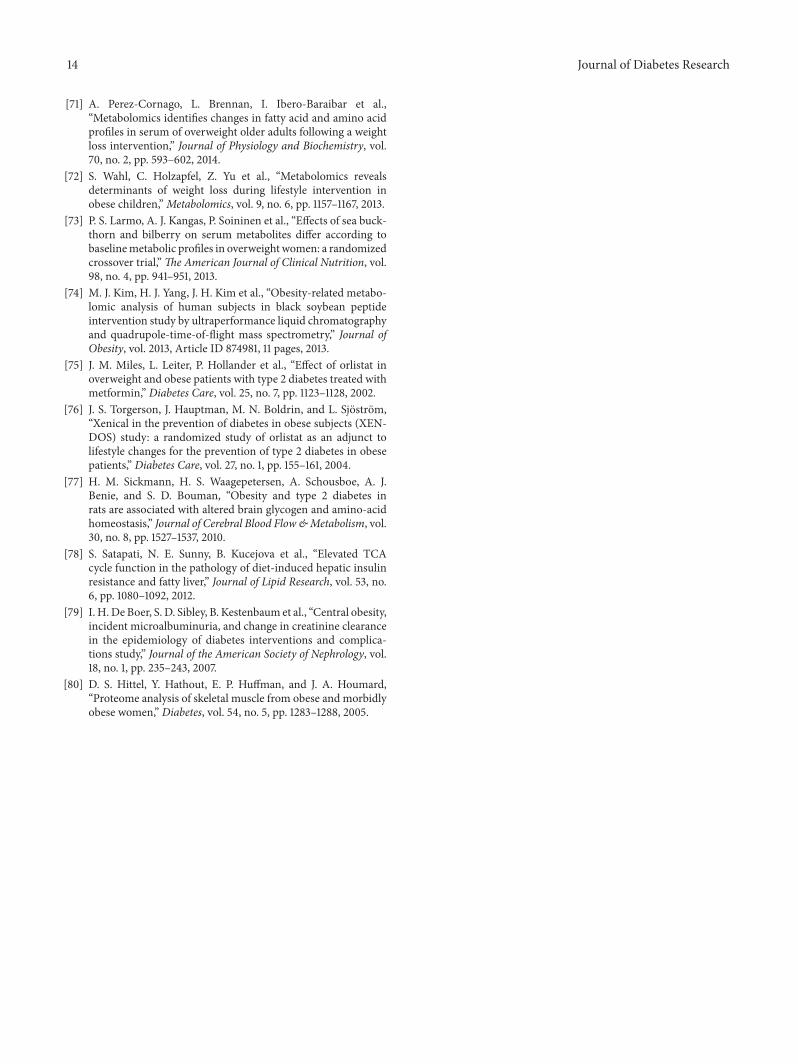
An OPLS-DA model was used to identify discriminatingmetabolites between the 2 groups fed the different diets. TheOPLS-DA method is useful for biomarkers identification.The 𝑆 plot was further used to visualise the influence of thevariables in the model by considering both covariance 𝑝(1)and correlation 𝑝(corr) loadings profiles from the OPLS-DA model. This enables filtering interesting metabolites in
the projection. Ideal biomarkers have high magnitude andreliability values (Figures 4 and 5).
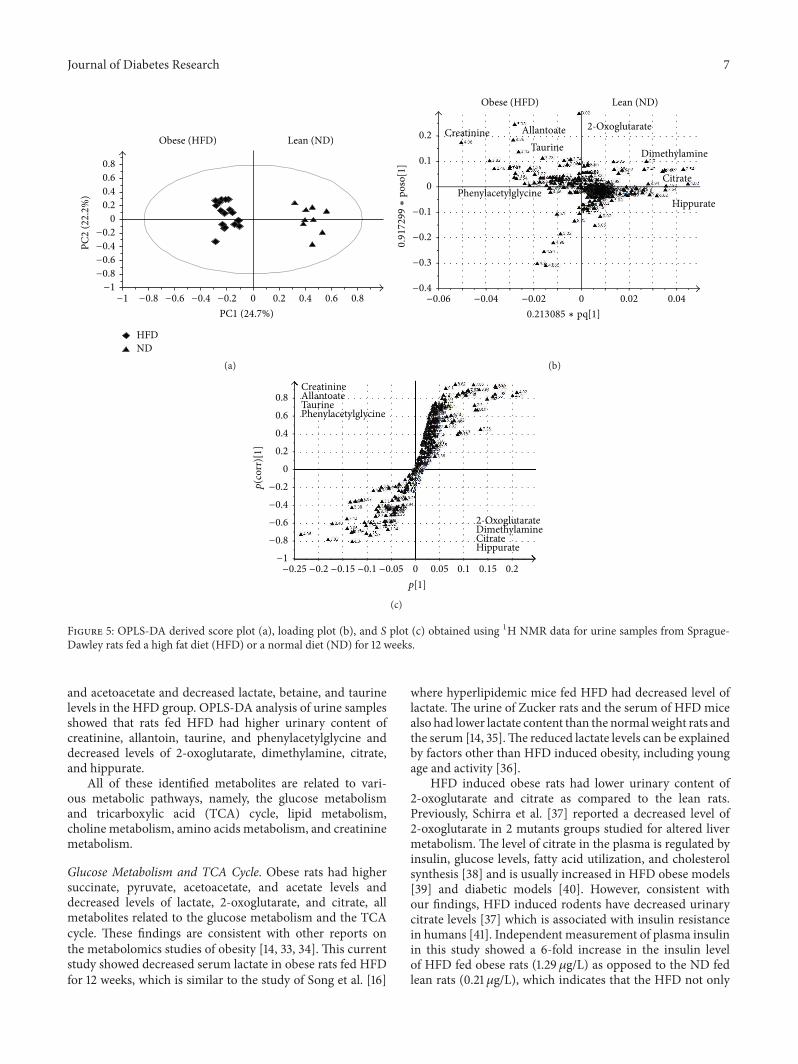
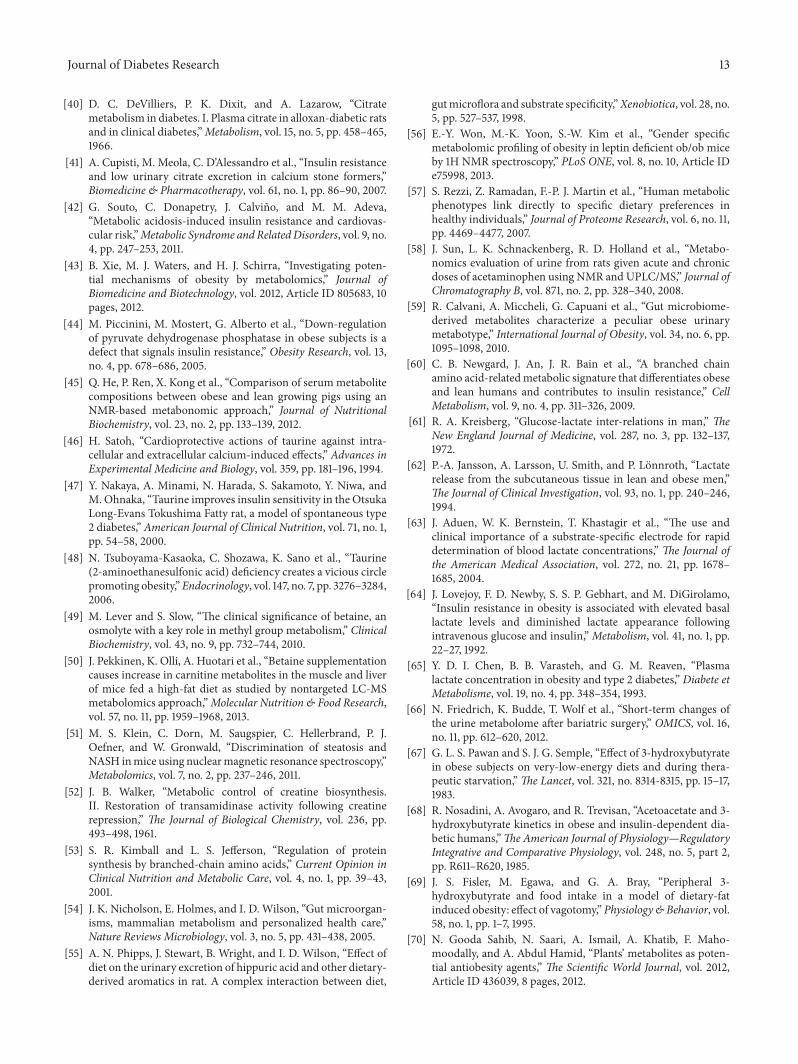
Induction of obesity was associated with increasedserum levels of acetate, succinate, pyruvate, VLDL/LDL, andacetoacetate and decreased levels of lactate, 2-hydroxyis-obutyrate, and betaine, among others (Figure 4). The sameprinciple was applied to the analysis of urine and clearseparation was obvious in the 1H NMR profiles (Figure 5).Among the increased metabolites in the HFD group werethe levels of creatinine, allantoin, taurine, and phenylacetyl-glycine, while the levels of 2-oxoglutarate, dimethylamine,citrate, and hippurate were decreased.
After 12 weeks of feeding on the HFD, male Sprague-Dawley rats had a significantly (𝑝 < 0.05) higher increasein body weight as compared to rats fed ND. Obese ratshad higher plasma level of TG and lower level of HDL ascompared to their lean counterparts. TC and LDL levelswere not significantly changed in the 2 groups fed NDand HFD. 1H NMR analysis of urine and serum revealedadditional metabolic changes, beyond the measured smallset of parameters. OPLS-DA analysis of serum 1H NMRspectra revealed increased succinate, pyruvate, VLDL/LDL,
Journal of Diabetes Research 7
Lean (ND) Obese (HFD)
HFDND
−0.8 −0.6 −0.4 −0.2 0.80.2 0.4 0.6−1 0
PC1 (24.7%)
−1
−0.8
−0.6
−0.4
−0.2
0
0.2
0.4
0.6
0.8
PC2
(22.2
%)
(a)
2-Oxoglutarate
Dimethylamine
Citrate
Hippurate
Creatinine AllantoateTaurine
Phenylacetylglycine
Obese (HFD) Lean (ND)
−0.4
−0.3
−0.2
−0.1
0
0.1
0.2
0.917299∗
poso[1]
0 0.02 0.04−0.02−0.04−0.06
0.213085 ∗ pq[1]
(b)
2-OxoglutarateDimethylamineCitrateHippurate
CreatinineAllantoateTaurinePhenylacetylglycine
0 0.1 0.20.05 0.15−0.2 −0.1 −0.05−0.15−0.25
p[1]
−1
−0.8
−0.6
−0.4
−0.2
0
0.2
0.4
0.6
0.8
p(c
orr)
[1]
(c)
Figure 5: OPLS-DA derived score plot (a), loading plot (b), and 𝑆 plot (c) obtained using 1H NMR data for urine samples from Sprague-Dawley rats fed a high fat diet (HFD) or a normal diet (ND) for 12 weeks.
and acetoacetate and decreased lactate, betaine, and taurinelevels in the HFD group. OPLS-DA analysis of urine samplesshowed that rats fed HFD had higher urinary content ofcreatinine, allantoin, taurine, and phenylacetylglycine anddecreased levels of 2-oxoglutarate, dimethylamine, citrate,and hippurate.
All of these identified metabolites are related to vari-ous metabolic pathways, namely, the glucose metabolismand tricarboxylic acid (TCA) cycle, lipid metabolism,choline metabolism, amino acids metabolism, and creatininemetabolism.
Glucose Metabolism and TCA Cycle. Obese rats had highersuccinate, pyruvate, acetoacetate, and acetate levels anddecreased levels of lactate, 2-oxoglutarate, and citrate, allmetabolites related to the glucose metabolism and the TCAcycle. These findings are consistent with other reports onthe metabolomics studies of obesity [14, 33, 34]. This currentstudy showed decreased serum lactate in obese rats fed HFDfor 12 weeks, which is similar to the study of Song et al. [16]
where hyperlipidemic mice fed HFD had decreased level oflactate. The urine of Zucker rats and the serum of HFD micealso had lower lactate content than the normalweight rats andthe serum [14, 35].The reduced lactate levels can be explainedby factors other than HFD induced obesity, including youngage and activity [36].
HFD induced obese rats had lower urinary content of2-oxoglutarate and citrate as compared to the lean rats.Previously, Schirra et al. [37] reported a decreased level of2-oxoglutarate in 2 mutants groups studied for altered livermetabolism. The level of citrate in the plasma is regulated byinsulin, glucose levels, fatty acid utilization, and cholesterolsynthesis [38] and is usually increased in HFD obese models[39] and diabetic models [40]. However, consistent withour findings, HFD induced rodents have decreased urinarycitrate levels [37] which is associated with insulin resistancein humans [41]. Independent measurement of plasma insulinin this study showed a 6-fold increase in the insulin levelof HFD fed obese rats (1.29 𝜇g/L) as opposed to the ND fedlean rats (0.21 𝜇g/L), which indicates that the HFD not only

8 Journal of Diabetes Research
induced obesity in the rodents, but also caused the model tobe insulin resistant, most likely caused by decreased urinarycitrate excretion due to an increase inmetabolic acidosis [42].
With lactate being the precursor for gluconeogenesis,any fluctuation in lactate levels indicates perturbations inglucose production and lipid synthesis in the liver [43].The downregulation of pyruvate dehydrogenase phosphatasein obese subjects has been reported to be a defect, whichsignals insulin resistance [44]. Elevated concentrations ofpyruvate suggest increased glycogenolysis and glycolysis tomeet exceeding energy demands, similarly to the observationof serum profile of obese growing pigs [45].
Lipid Metabolism. The levels of betaine and taurine werechanged as a result of the HFD, revealing changes in lipidmetabolic pathways. Serum profiles showed lower levels oftaurine, while there was an increased level of urinary taurinecontent. Previous studies have reported reduced taurinecontent in the serum, urine, and liver of various rodentmodels [14]. However, also in accordance with our findings,Kim et al. [13] reported increased levels of taurine in theurine of HFD fed rats. Taurine plays various biological rolesin the conjugation of cholesterol, antioxidation of bile acids,osmoregulation, and calcium signalling pathways [46, 47].The supplementation of taurine showed amelioration in obe-sity most likely mediated by the ability of taurine to increasefatty acid oxidation [48]. This study shows decreased taurinein the obese group, suggesting decreased fatty acids oxidationand inhibition of taurine biosynthetic enzymes related toobesity, as observed by increased levels of LDL/VLDL shownin both serum spectra and actual measured values.
Choline Metabolism. Pertaining to choline metabolism, thelevel of betaine was decreased in the HFD group, simi-larly to most metabolomics based obesity studies reportingdecreased hepatic and urinary betaine content in HFD fedrodents [33, 34] and decreased hippurate in the serumofHFDmice [38]. In humans, lowered betaine levels are associatedwith obesity related disorders such as metabolic disorders,lipid disorders, and type 2 diabetes [49]. Supplementationof betaine causes increase in metabolites in the carnitinebiosynthesis pathway, reduced accumulation of triglyceridesin the liver, with no effect on body weight gain and increasein adipose tissue mass [50].
Creatinine Metabolism. Feeding of HFD diet for 12 weeksresulted in increased creatinine levels in the urine samples,in line with other reports [37, 51, 52].
Amino Acids Metabolism. High level of serum acetoacetatemight be the indication of depletion in leucine level, anamino acid involved in insulin signalling, protein synthesis ofmuscle mass, and production of alanine and glutamine [53].Alanine peaks were more prominent in the serum spectra ofthe lean rats as compared to obese subjects.
Gut Microbiome Metabolism. Changes in specific metabolitessupport the idea that there is a link between obesity andthe gut microbiome. HFD induced obese rats showed high
urinary content of phenylacetylglycine and decreased levelsof hippurate and dimethylamines, metabolites involved inthe gut microbiome metabolism. Hippurate is produced inthe gut by microorganisms using glycine and benzoic acid asbuilding blocks [54]. Increased hippurate level in the urinehas been associated with leanness [34] and this study con-firms the findings from other studies [38] that HFD inducedobesity is associatedwith decreased urinary level of hippuratein rodent models of obesity. Increased levels of phenylacetyl-glycine in Sprague-Dawley rats fedHFDhave been previouslyreported [13]. High gainers fed HFD were associated withincreased levels of phenylacetylglycine as compared to lowgainers on ND, which indicates an increase in the precursorsproduced by gut microorganisms [55]. Moreover, reduceddimethylamine levels in the obese group reflect changes inthe gut microbiome derived metabolism, similarly to whatis observed in leptin-deficient ob/ob mice [56]. Trigonellinewas also identified in the urine samples of lean rats. Itis an indicator of niacin metabolism, an essential vitaminneeded as coenzyme in carbohydrate and lipid metabolism.The body’s requirements for niacin can be met by dietaryintake or endogenous biosynthesis through tryptophan-mediated metabolism carried out by the liver and the gutmicroorganisms [57]. Obesity related stress causes depletionin the glutathione stores and the decrease of trigonelline isrelated to depletion of 𝑆-adenosylmethionine, used to makeup the energy stores [58]. A strong link between humangut microbiome and obesity was established with decreasedurinary excretion of hippurate, trigonelline, and xanthineand increased urinary excretion of 2-hydroxybutyrate andbariatric surgery induced weight loss resulted in the loss oftypical obese metabotype [59].
3.3. Effect of 9-Week Treatment with 250/500mg/kg of MLEin the Obese Rats Models. After 12 weeks of inducing obesity,rats on the HFD were further divided and received eitherMLE 60 (250 and 500mg/kg), Orlistat (30mg/kg), or thecarrier vehicle (CMC). Obese rats were kept on the HFDwhile lean rats were continued on the ND. Body weightand food intake were recorded weekly and the plasmabiochemistry was analysed at the end of the experiment(Table 4).
Although there was no significant weight loss in the obesegroup, receiving MLE 60 or Orlistat, further weight gain wasprevented in theHFD+ 500 andHFD+ORgroup. Treatmentresulted in reduced visceral fat, with the HFD group havingthe highest amount (6.62 ± 1.54%). The treated groups hada reduced % of visceral fat ranging from 3.34 ± 0.99 forthe HFD + OR group to 4.87 ± 0.96% for the HFD + 500group. There was no significant difference in decrease ofvisceral fat between the obese rats receiving 500mg/kg MLE60 and rats receiving standard antiobesity drug, Orlistat. Nosignificant difference was recorded in the daily food intakeamong all groups. At baseline (before treatment), there wasno significant difference in the fecal fat excretion in the leanand obese rats. Treatment with 500mg/kgMLE increased thefecal fat excretion (12.64±1.73%), with a comparable effect totreatment with Orlistat (15.89 ± 1.62%). The fecal fat content

Journal of Diabetes Research 9
Table 4:The body weight, % visceral fat, food intake, % fecal fat excretion, and plasma biochemistry of HFD induced obese rats after 9 weeksof treatment with MLE 60 at 250mg/kg and 500mg/kg body and 30mg Orlistat/kg body weight.
HFD HFD + 250 HFD + 500 HFD + OR NDBody weight (g)Initial (week 12) 559.20 ± 25.89Bb 546.85 ± 83.20Bb 544.29 ± 78.74Bb 537.25 ± 93.83Bb 379.33 ± 34.82Aa
Final (week 21) 614.20 ± 131.58Bb 605.57 ± 101.50Bb 565.85 ± 87.47Bb 553.13 ± 98.93Bb 417.16 ± 32.99Aa
Visceral fat (%) 6.62 ± 1.54c 5.18 ± 0.40bc 4.87 ± 0.963b 3.34 ± 0.99b 1.70 ± 0.28a
Food intake (g/rat/day) 20.00 ± 3.09a 19.08 ± 2.29a 19.38 ± 2.01a 19.08 ± 0.86a 20.17 ± 1.35a
Fecal fat content (%)Initial 6.18 ± 1.19aA 7.35 ± 1.14aA 6.31 ± 1.40aA 6.12 ± 1.52aA 7.64 ± 0.70aA
Final 7.23 ± 1.01aC 9.44 ± 1.07aC 12.64 ± 1.73bB 15.89 ± 1.62bA 8.99 ± 0.61aC
Total cholesterol (mmol/L) 1.43 ± 0.08b 1.04 ± 0.01a 0.94 ± 0.02a 0.92 ± 0.07a 1.29 ± 0.13b
HDL (mmol/L) 0.82 ± 0.06b 0.57 ± 0.12bc 0.69 ± 0.07b 0.56 ± 0.01c 1.02 ± 0.09a
LDL (mmol/L) 0.33 ± 0.07b 0.22 ± 0.03ab 0.17 ± 0.03a 0.20 ± 0.04a 0.21 ± 0.05a
Triglycerides (mmol/L) 0.93 ± 0.16c 0.72 ± 0.12bc 0.50 ± 0.11ab 0.58 ± 0.01ab 0.42 ± 0.09a
Leptin (pg/mL) 2119.50 ± 176.3b 1563.30 ± 556.9ab 1050.00 ± 229.3a 1263.30 ± 30.10a 1125.00 ± 117.60a
Insulin (𝜇g/L) 1.83 ± 0.10c 0.71 ± 0.01b 0.37 ± 0.13a 0.47 ± 0.22ab 0.31 ± 0.01a
Ghrelin (ng/mL) 25.7 ± 3.71c 54.57 ± 4.19a 35.74 ± 1.68b 37.63 ± 0.98b 53.01 ± 1.95a
Adiponectin (ng/mL) 8.61 ± 0.77b 9.50 ± 0.23ab 9.25 ± 0.50ab 8.25 ± 0.44b 9.87 ± 0.20a
Glucose (mmol/L) 7.70 ± 0.78c 6.85 ± 0.71bc 5.83 ± 0.53ab 4.98 ± 0.17a 6.03 ± 0.17b
Different small letters indicate significant difference (𝑝 < 0.05) between different groups and different capital letters indicate significant difference among thesame group at different time points, as shown by analysis of variance (ANOVA) using Minitab Version 14.
in the control group (HFD only) remained unchanged after 9weeks (7.23 ± 1.01%).
Few plasma parameters were measured after 9 weeks oftreatment (Table 4). With regard to lipid profiles, treatmentwith both 500mg MLE 60/kg and Orlistat improved theplasma LDL level, reducing its levels to the LDL profile of leanrats. The treatment, however, failed to improve HDL levels,with the HFD + OR group having the lowest plasma HDLcontent of 0.56 ± 0.01mmol/L. Lean rats on the ND have thehighest level of HDL, 1.02 ± 0.09mmol/L. The most markedeffect was in the TG content, wherebyHFD+ 500 (0.50±0.11)significantly improved the plasma TG level as compared torats receiving the HFD only (0.93 ± 0.12).
The plasma insulin level was significantly improved inthe HFD + 500 group (0.37 ± 0.13), which was similarto the ND group (0.31 ± 0.02). Similarly, plasma leptinlevels were significantly improved in both HFD + 500group (1050 ± 229 pg/mL) and HFD + OR group (1263 ±30.10 pg/mL) as compared with the HFD group (2119 ±176 pg/mL). Ghrelin levels were improved in all treatedgroups, with 250mg/kg dosage being more potent, restoringthe ghrelin levels to 54.57 ng/mL, not significantly differentfrom the lean group (53.01 ng/mL). Adiponectin levels werenot significantly different in the lean groups and the treatedgroups (9.25–9.87 ng/mL), except in the group treated withOrlistat (8.25 ng/mL), where the adiponectin level was notsignificantly different from the obese group (8.61 ng/mL).Treatmentwith 30mg/kgOrlistat and 500mg/kgMLE60 hadthe most significant improvement.
In the previous section, rats fedHFDwere associatedwithhigher acetate and pyruvate and surprisingly lower lactatelevels as opposed to lean rats fed ND. After an additional
9 weeks, rats fed HFD were still associated with higheracetate and pyruvate and also higher lactate level. Lactateis one of the key metabolites related to glucose metabolismand the TCA cycle, which has been reported to be higherin obese humans [60]. Increased lactate concentration hasbeen attributed to the upregulation in anaerobic glycolysisin obese subjects and the balance between lactate productionand lactate removal [14, 61]. The adipose tissue is one of thesites of lactate production, together with the skeletal muscles,erythrocytes, and brain [61, 62]. Increased lactate productioncan also reflect perturbations in glucose and lipid productionin the liver due to the involvement of lactate as a precursorin gluconeogenesis [43] with increased serum lactate beingassociated with increased risk of mortality [63]. In this study,increased serum lactate in the HFD group can be attributedto the higher percentage of body fat as compared to thelean rats. Lactate levels in obese subjects are also highlydependent on insulin resistance [64]. In a study by Chen etal., normal weight subjects with normal blood glucose hadthe lowest plasma lactate levels, obese subjects with normalblood glucose had intermediate plasma lactate levels, andobese subjects with impaired blood glucose had the highestlactate levels. Consistent with these reports, this study showsthat, after 21 weeks of feeding HFD, rats had higher insulinlevels (1.83 𝜇g/L) as compared to after 12 weeks of feeding(1.30 𝜇g/L), which explains the elevated lactate levels in theobese groups. Treated groups had significant decrease in % ofbody fat and plasma insulin levels, which contributes to thedecreased lactate plasma content [65].
Another metabolite, which was found to be stronglyassociatedwith obesity, is 2-hydroxyisobutyrate. It is involvedin the gut microbiome metabolism and has been reported to

10 Journal of Diabetes Research
Table 5: Relative quantification of significant discriminating metabolites based on the concentration of 0.1% of 3-trimethylsilyl propionic-2,2,3,3-d4 acid sodium salt (TSP) as internal standard and quantified using Chenomx NMR Suite.
Metabolites Chemical shifts VIP value HFD ND HFD + 250 HFD + OR p value
Lactate 1.34 (d) 2.46 1662.9 ± 51.9c 493.4 ± 73.1a 482.1 ± 55.9a 761.0 ± 33.6b 0.0004.11 (dd)
Alanine 3.78 (dd) 1.63 94.0 ± 3.03b 53.3 ± 13.48a 55.6 ± 3.52a 47.0 ± 2.50a 0.0021.48 (d)
3-Hydroxybutyrate
1.18 (d)
3.48 316.8 ± 23.17b 513.8 ± 74.20a 368.7 ± 24.00ab 396.9 ± 73.54ab 0.0234.23 (m)2.31 (d)2.38 (dd)
2-Hydroxyisobutyrate 1.34 (s) 5.60 232.5 ± 25.36b 153.8 ± 15.12a 143.9 ± 21.54a 182.1 ± 49.43ab 0.036Pyruvate 2.38 (s) 2.19 55.6 ± 3.62c 18.7 ± 2.16a 31.1 ± 1.03b 28.3 ± 7.21b 0.000
Creatinine/creatine 3.06 (s) 1.28 45.1 ± 2.43b 25.6 ± 3.64a 23.3 ± 0.60a 39.5 ± 0.04b 0.0004.06 (s)
𝛼-Glucose 5.22 (d) 1.09 1116.4 ± 27.4c 458.1 ± 27.6b 511.7 ± 20.6b 206.4 ± 44.3a 0.000Acetate 1.93 (s) 1.28 38.9 ± 2.80b 26.8 ± 4.42a 35.4 ± 1.50b 38.9 ± 2.61b 0.013Different small letters indicate significant difference (𝑝 < 0.05) between different groups as shown by the analysis of variance (ANOVA) usingMinitab Version14.
be altered in leptin-deficient ob/ob mice [56] and increasedin obese patients [66].
Regarding amino acid metabolism, serum alanine wasincreased in HFD group as compared to the lean group, inline with previous studies reporting increased alanine in theserum and liver of HFD induced mice and rats [39].
Obesity was characterised by decreased levels of 3-hydroxybutyrate, a metabolite of amino acid metabolism,which is associated with leanness and weight loss, whereobese patients expressed the highest 3-hydroxybutyrate levelsfollowing bariatric surgery [66]. Early studies have alsoreported on the link between obesity and 3-hydroxybutyrate.Administration of the compound in obese subjects onlow energy diets resulted in improved fat : lean ratio whilenot affecting weight loss [67]. The roles of acetoacetateand 3-hydroxybutyrate were further studied in obese andinsulin dependent diabetic humans using a kinetic approach,to investigate ketone body metabolism. Obese subjectshad lower ketone body de novo synthesis, with no sig-nificant clearance of 3-hydroxybutyrate from the normalhealthy subjects, with 3-hydroxybutyrate being an impor-tant determinant in diabetic ketoacidosis [68]. Moreover, 3-hydroxybutyrate has also been associated with reduced foodintake in obese subjects [69] and involved in the short-termand long-term effects of high fat diet in mice [14]. Won etal. also reported the downregulation of 2-hydroxybutyrate inboth male and female leptin-deficient ob/ob mice [56].
In the metabolites identification, OPLS-DA model con-sisting of 2 groups at a time was employed, followed bythe Shared and Unique Structure (SUS) plots, to comparebiomarkers from 2 models.
Key discriminating metabolites as potential biomarkersin rat serum based on 1H NMR loading plots in the HFD,HFD + 500, and ND groups were quantified, relative tothe TSP in the serum samples. Statistical analysis (MinitabVersion 14) was further employed to detect significance.
Focus was placed on metabolites with a VIP value of >1,as metabolites contributing more to the clustering of thedifferent groups (Table 5).
There are limited studies, which have used a metabo-lomics approach to identify metabolic changes followingintervention with drugs and therapeutics, including the phy-tochemical strategies for obesity, though the potential is vast[70]. However, there are few metabolomics based reports onweight loss as a result of weight loss intervention, includingexercise and surgery. An energy-restricted diet for 8 weeksresulted in an improvement in glucose and lipid metabolismin overweight obese adults. Saturated fatty acids such aspalmitic acid and stearic acid were significantly decreased aswell as branched amino acid, isoleucine [71]. A lifestyle inter-vention in obese children, “Obeldicks,” resulted in significantweight loss and abdominal obesity, modulated by the roleof phosphatidylcholine metabolism. This particular studyalso highlights the large interindividual variation to lifestyleintervention and the possible need of a more individualisedapproach to lifestyle interventions [72]. 1H NMR analysisalso showed that while exercise can improve the metabolicdisruptions associated with diet induced obesity, the effectcannot be cancelled out and diet predicts obesity better with astronger influence onmetabolites’ profiles than exercise alone[14].
One of the few studies reporting the response of natu-ral therapeutic agents in obese subjects assessed the effectof sea buckhorn and bilberry on serum metabolites inoverweight women. No significant changes were observedin individual metabolites, though improvements in serumlipids and lipoproteins were observed [73]. The treatmentof high fat diet induced hyperlipidemia with Xue-Fu-Zhu-Yu decoction was studied using a NMR based metabolomicsapproach. OPLS-DA analysis revealed the beneficial effectsof the decoction, mainly through decrease in ketone bodiesproduction, enhancement of biosynthesis, andmodulation of

Journal of Diabetes Research 11
lipid metabolism [16]. Dietary intervention of black soybeanpeptides in overweight human showed an increase in betaine,benzoic acid, pyroglutamic acid, and pipecolic acid, amongothers. VIP analysis showed L-proline, betaine, and lyso-PCsto be more correlated to the discrimination before and aftertreatment [74].
Treatment with MLE 60 at 250mg/kg body weightimproved serum levels of lactate, alanine, pyruvate, crea-tinine, and 𝛼-glucose, bringing their levels closer to thenormal control whereas the level of 3-hydroxyisobutyrate,3-hydroxybutyrate, and acetate remained unchanged. Sim-ilar improvements were achieved in the groups receiving30mg/kg body weight of Orlistat. The relative concentrationof 𝛼-glucose was found to be most reduced, consistentwith the actual biochemical measurement done previouslywhere the Orlistat treated group had significantly lowerplasma glucose (4.97mmol/L) as compared to the lean group(6.02mmol/L).This is consistent with the literature reportingthat Orlistat in a weight loss regimen can significantlyimprove glucose tolerance and slows down the progressionof type 2 diabetes and impaired glucose tolerance in clinicalcases of obesity [75, 76].
Based on the relative quantification of certainmetabolites(lactate, pyruvate, and glucose) in the treated groups, it isapparent that treatment with MLE 60 improved perturba-tions in various metabolic pathways, predominantly in theglucose and TCA cycle as reflected by positive modulationsin lactate, pyruvate, and glucose levels. Disruptions in thecreatinine and amino acid metabolic pathways were alsoimproved as indicated by a reduction of creatinine andalanine accumulation in the obese groups treated with MLE60. The levels of 3-hydroxyisobutyrate, a metabolite of thegut microbiome metabolism, were unchanged in the treatedgroups, suggesting that MLE 60 did not impact on theobesity-induced disruptions in the gut microbiome. Simi-larly, the levels of 2-hydroxybutyrate, a metabolite of aminoacid metabolism, were also unchanged.
Obesity has been characterised by an elevated TCAfunction in diet induced hepatic insulin and fatty liver aswell as decreased brain glucose metabolism, predominantlythrough the TCA cycle [77, 78]. Treatment with MLE 60improved serum creatinine profiles as shown by 1H NMRmeasurement as compared to nonsignificance observedwhenblood creatinine level was measured. Poor creatinine clear-ance is associated with weight gain and central obesity dueto increased metabolic abnormalities as risk factors [79]. Anincrease in creatine kinase and adenylate kinase 1 activitywas observed in obese subjects, attributed to a compensatoryeffect of the downregulation of muscle mitochondrial func-tion, associated with obesity [80].
Hence, antiobesity agent which can positively influencethese pathways as well as other parameters such as adipocytesfactors and weight loss shows promise for weight manage-ment.
4. Conclusion
Based on the reported health properties of M. citrifolia,including the antiobesity activities, the aim of this study was
to further explore the effect of a leaf extract, MLE 60, onobesity using a 1H NMR metabolomic approach. 1H NMRspectroscopy and multivariate data analysis revealed clearmetabolic differences in the urine and serum samples of theHFD induced obese and lean rats. An OPLS-DAmethod waschosen to project maximum separation between the groupsand to identify discriminating biomarkers. All multivariatemodels including PLS-DA and OPLS-DA were duly vali-dated, using permutation tests, 𝑅2𝑌,𝑄2𝑌, and 𝑝CVANOVAvalues. Several metabolites were identified in both the serumand urine samples, which were the basis of difference amongthe groups. These metabolites were involved in the glucosemetabolism and TCA cycle (lactate, 2-oxoglutarate, citrate,succinate, pyruvate, and acetate), amino acid metabolism(alanine, 2-hydroxybutyrate), choline metabolism (betaine),creatinine metabolism (creatinine), and gut microbiomemetabolism (hippurate, phenylacetylglycine, dimethylamine,and trigonelline). Some key metabolites were identified andquantified showing a statistically (𝑝 < 0.05) significantimprovement in this treated group (500mg/kg). This study,therefore, confirms the metabolic alteration caused by HFDinduced obesity in a rat model and the improvement in cer-tainmetabolic pathways, upon treatmentwithMLE 60. It alsoprovides additional information that 1HNMRmetabolomicscan be a good approach to study the development of diseaseand response to treatment in obese subjects.
Conflict of Interests
The authors declare that there is no conflict of interestsregarding the publication of this paper.
References
[1] J. W. Yun, “Possible anti-obesity therapeutics from nature—areview,” Phytochemistry, vol. 71, no. 14-15, pp. 1625–1641, 2010.
[2] A. G. Dulloo, C. Duret, D. Rohrer et al., “Efficacy of a green teaextract rich in catechin polyphenols and caffeine in increasing24-h energy expenditure and fat oxidation in humans,” TheAmerican Journal of Clinical Nutrition, vol. 70, no. 6, pp. 1040–1045, 1999.
[3] P. Chantre and D. Lairon, “Recent findings of green tea extractAR25 (Exolise) and its activity for the treatment of obesity,”Phytomedicine, vol. 9, no. 1, pp. 3–8, 2002.
[4] C. Lu, W. Zhu, C.-L. Shen, andW. Gao, “Green tea polyphenolsreduce body weight in rats by modulating obesity-relatedgenes,” PLoS ONE, vol. 7, no. 6, Article ID e38332, 2012.
[5] L.-K. Han, Y. Kimura, and H. Okuda, “Reduction in fat storageduring chitin-chitosan treatment in mice fed a high-fat diet,”International Journal of Obesity, vol. 23, no. 2, pp. 174–179, 1999.
[6] M. Yamamoto, S. Shimura, Y. Itoh, T. Ohsaka, M. Egawa, and S.Inoue, “Anti-obesity effects of lipase inhibitor CT-II, an extractfrom edible herbs, Nomame Herba, on rats fed a high-fat diet,”International Journal of Obesity, vol. 24, no. 6, pp. 758–764,2000.
[7] A. M. M. Jalil, A. Ismail, P. P. Chong, M. Hamid, and S. H. S.Kamaruddin, “Effects of cocoa extract containing polyphenolsand methylxanthines on biochemical parameters of obese-diabetic rats,” Journal of the Science of Food and Agriculture, vol.89, no. 1, pp. 130–137, 2009.

12 Journal of Diabetes Research
[8] J. B. German, B. D. Hammock, and S. M. Watkins, “Metabo-lomics: building on a century of biochemistry to guide humanhealth,”Metabolomics, vol. 1, no. 1, pp. 3–9, 2005.
[9] M. Wang, R.-J. A. N. Lamers, H. A. A. J. Korthout et al.,“Metabolomics in the context of systems biology: bridgingtraditional Chinese medicine and molecular pharmacology,”Phytotherapy Research, vol. 19, no. 3, pp. 173–182, 2005.
[10] B. Wu, S. Yan, Z. Lin et al., “Metabonomic study on ageing:NMR-based investigation into rat urinary metabolites and theeffect of the total flavone of Epimedium,”Molecular BioSystems,vol. 4, no. 8, pp. 855–861, 2008.
[11] K. S. Solanky, N. J. C. Bailey, B. M. Beckwith-Hall et al.,“Application of biofluid 1H nuclear magnetic resonance-basedmetabonomic techniques for the analysis of the biochemicaleffects of dietary isoflavones on human plasma profile,” Analyt-ical Biochemistry, vol. 323, no. 2, pp. 197–204, 2003.
[12] O. Beckonert, H. C. Keun, T. M. D. Ebbels et al., “Metabolicprofiling, metabolomic andmetabonomic procedures for NMRspectroscopy of urine, plasma, serum and tissue extracts,”Nature protocols, vol. 2, no. 11, pp. 2692–2703, 2007.
[13] S.-H. Kim, S.-O. Yang, H.-S. Kim, Y. Kim, T. Park, and H.-K. Choi, “ 1H-nuclear magnetic resonance spectroscopy-basedmetabolic assessment in a rat model of obesity induced by ahigh-fat diet,” Analytical and Bioanalytical Chemistry, vol. 395,no. 4, pp. 1117–1124, 2009.
[14] G. E. Duggan, D. S. Hittel, C. C. Hughey, A. Weljie, H. J. Vogel,and J. Shearer, “Differentiating short- and long-term effects ofdiet in the obese mouse using 1H-nuclear magnetic resonancemetabolomics,”Diabetes, Obesity and Metabolism, vol. 13, no. 9,pp. 859–862, 2011.
[15] E.-Y. Won, M.-K. Yoon, S.-W. Kim et al., “Gender specificmetabolomic profiling of obesity in leptin deficient ob/ob miceby 1H NMR spectroscopy,” PLoS ONE, vol. 8, no. 10, Article IDe75998, 2013.
[16] X. Song, J. Wang, P. Wang, N. Tian, M. Yang, and L. Kong, “1H NMR-based metabolomics approach to evaluate the effectof Xue-Fu-Zhu-Yu decoction on hyperlipidemia rats inducedby high-fat diet,” Journal of Pharmaceutical and BiomedicalAnalysis, vol. 78-79, pp. 202–210, 2013.
[17] J. Gerlach, “Native or introduced plant species,” Phelsuma, vol.4, pp. 70–74, 1996.
[18] A. R. Dixon, H. McMillen, and N. L. Etkin, “Ferment this:the transformation of Noni, a traditional Polynesian medicine(Morinda citrifolia, Rubiaceae),” Economic Botany, vol. 53, no. 1,pp. 51–68, 1999.
[19] S.-U. R. Mandukhail, N. Aziz, and A.-H. Gilani, “Studies onantidyslipidemic effects ofMorinda citrifolia (Noni) fruit, leavesand root extracts,” Lipids in Health andDisease, vol. 9, article 88,2010.
[20] M. S. Pak-Dek, A. Abdul-Hamid, A. Osman, and C. S. Soh,“Inhibitory effect of Morinda citrifolia L. on lipoprotein lipaseactivity,” Journal of Food Science, vol. 73, no. 8, pp. C595–C598,2008.
[21] N. G. Sahib, A. A. Hamid, D. Kitts, M. Purnama, N. Saari, andF. Abas, “The effects ofMorinda citrifolia,Momordica charantiaand Centella asiatica extracts on lipoprotein lipase and 3T3-L1preadipocytes,” Journal of Food Biochemistry, vol. 35, no. 4, pp.1186–1205, 2011.
[22] N. Gooda Sahib, A. Abdul Hamid, N. Saari, F. Abas, M. S. PakDek, and M. Rahim, “Anti-pancreatic lipase and antioxidantactivity of selected tropical herbs,” International Journal of FoodProperties, vol. 15, no. 3, pp. 569–578, 2012.
[23] T. Tsujita, H. Takaichi, T. Takaku, S. Aoyama, and J. Hiraki,“Antiobesity action of epsilon-polylysine, a potent inhibitor ofpancreatic lipase,” Journal of Lipid Research, vol. 47, no. 8, pp.1852–1858, 2006.
[24] L. Ericksson, E. Johansson, N. Kettanen-Wold, J. Trygg, C.Wikstrom, and S. Wold,Multi- and Megavariate Data Analysis,Part 1. Basic Principles & Applications, Umetrics Academy,Umea, Sweden, 2006.
[25] V. Von Diemen, E. N. Trindade, and M. R. M. Trindade,“Experimental model to induce obesity in rats,” Acta CirurgicaBrasileira, vol. 21, no. 6, pp. 425–429, 2006.
[26] S. C. Woods, R. J. Seeley, P. A. Rushing, D. D’Alessio, and P. Tso,“A controlled high-fat diet induces an obese syndrome in rats,”Journal of Nutrition, vol. 133, no. 4, pp. 1081–1087, 2003.
[27] R. Buettner, J. Scholmerich, and L. C. Bollheimer, “High-fatdiets: modeling the metabolic disorders of human obesity inrodents,” Obesity, vol. 15, no. 4, pp. 798–808, 2007.
[28] P. Yaqoob, E. J. Sherrington, N. M. Jeffery et al., “Comparisonof the effects of a range of dietary lipids upon serum andtissue lipid composition in the rat,”The International Journal ofBiochemistry and Cell Biology, vol. 27, no. 3, pp. 297–310, 1995.
[29] J.-S. Tian, B.-Y. Shi, H. Xiang, S. Gao, X.-M. Qin, and G.-H. Du,“1H-NMR-based metabonomic studies on the anti-depressanteffect of genipin in the chronic unpredictable mild stress ratmodel,” PLoS ONE, vol. 8, no. 9, Article ID e75721, 2013.
[30] N. Tian, J. Wang, P. Wang, X. Song, M. Yang, and L. Kong,“NMR-based metabonomic study of Chinese medicine GegenQinlian Decoction as an effective treatment for type 2 diabetesin rats,”Metabolomics, vol. 9, no. 6, pp. 1228–1242, 2013.
[31] S. Bouatra, F. Aziat, R. Mandal et al., “The human urinemetabolome,” PLoS ONE, vol. 8, no. 9, Article ID e73076, 2013.
[32] N. Psychogios, D. D. Hau, J. Peng et al., “The human serummetabolome,” PLoS ONE, vol. 6, no. 2, Article ID e16957, 2011.
[33] N. J. Serkova, M. Jackman, J. L. Brown et al., “Metabolicprofiling of livers and blood from obese Zucker rats,” Journalof Hepatology, vol. 44, no. 5, pp. 956–962, 2006.
[34] A. Waldram, E. Holmes, Y. Wang et al., “Top-down systemsbiology modeling of host metabotype-microbiome associationsin obese rodents,” Journal of Proteome Research, vol. 8, no. 5, pp.2361–2375, 2009.
[35] L.-C. Zhao, X.-D. Zhang, S.-X. Liao, H.-Y.Wang, D.-H. Lin, andH.-C. Gao, “A metabonomic comparison of urinary changes inZucker and GK rats,” Journal of Biomedicine and Biotechnology,vol. 2010, Article ID 431894, 6 pages, 2010.
[36] A. A. Mahdi, S. Annarao, S. Tripathi et al., “Correlation of agerelated metabonomic changes in 1H NMR serum and urineprofiles of rats with cognitive function,” The Open MagneticResonance Journal, vol. 1, no. 1, pp. 71–76, 2008.
[37] H. J. Schirra, C. G. Anderson, W. J. Wilson et al., “Alteredmetabolism of growth hormone receptor mutant mice: a com-bined NMR metabonomics and microarray study,” PLoS ONE,vol. 3, no. 7, Article ID e2764, 2008.
[38] J. Shearer, G. Duggan, A. Weljie, D. S. Hittel, D. H. Wasserman,and H. J. Vogel, “Metabolomic profiling of dietary-inducedinsulin resistance in the high fat-fedC57BL/6Jmouse,”Diabetes,Obesity and Metabolism, vol. 10, no. 10, pp. 950–958, 2008.
[39] H. Li, Z. Xie, J. Lin et al., “Transcriptomic and metabonomicprofiling of obesity-prone and obesity-resistant rats under highfat diet,” Journal of Proteome Research, vol. 7, no. 11, pp. 4775–4783, 2008.
Journal of Diabetes Research 13
[40] D. C. DeVilliers, P. K. Dixit, and A. Lazarow, “Citratemetabolism in diabetes. I. Plasma citrate in alloxan-diabetic ratsand in clinical diabetes,”Metabolism, vol. 15, no. 5, pp. 458–465,1966.
[41] A. Cupisti, M. Meola, C. D’Alessandro et al., “Insulin resistanceand low urinary citrate excretion in calcium stone formers,”Biomedicine & Pharmacotherapy, vol. 61, no. 1, pp. 86–90, 2007.
[42] G. Souto, C. Donapetry, J. Calvino, and M. M. Adeva,“Metabolic acidosis-induced insulin resistance and cardiovas-cular risk,”Metabolic Syndrome and RelatedDisorders, vol. 9, no.4, pp. 247–253, 2011.
[43] B. Xie, M. J. Waters, and H. J. Schirra, “Investigating poten-tial mechanisms of obesity by metabolomics,” Journal ofBiomedicine and Biotechnology, vol. 2012, Article ID 805683, 10pages, 2012.
[44] M. Piccinini, M. Mostert, G. Alberto et al., “Down-regulationof pyruvate dehydrogenase phosphatase in obese subjects is adefect that signals insulin resistance,” Obesity Research, vol. 13,no. 4, pp. 678–686, 2005.
[45] Q. He, P. Ren, X. Kong et al., “Comparison of serummetabolitecompositions between obese and lean growing pigs using anNMR-based metabonomic approach,” Journal of NutritionalBiochemistry, vol. 23, no. 2, pp. 133–139, 2012.
[46] H. Satoh, “Cardioprotective actions of taurine against intra-cellular and extracellular calcium-induced effects,” Advances inExperimental Medicine and Biology, vol. 359, pp. 181–196, 1994.
[47] Y. Nakaya, A. Minami, N. Harada, S. Sakamoto, Y. Niwa, andM. Ohnaka, “Taurine improves insulin sensitivity in the OtsukaLong-Evans Tokushima Fatty rat, a model of spontaneous type2 diabetes,” American Journal of Clinical Nutrition, vol. 71, no. 1,pp. 54–58, 2000.
[48] N. Tsuboyama-Kasaoka, C. Shozawa, K. Sano et al., “Taurine(2-aminoethanesulfonic acid) deficiency creates a vicious circlepromoting obesity,”Endocrinology, vol. 147, no. 7, pp. 3276–3284,2006.
[49] M. Lever and S. Slow, “The clinical significance of betaine, anosmolyte with a key role in methyl group metabolism,” ClinicalBiochemistry, vol. 43, no. 9, pp. 732–744, 2010.
[50] J. Pekkinen, K. Olli, A. Huotari et al., “Betaine supplementationcauses increase in carnitine metabolites in the muscle and liverof mice fed a high-fat diet as studied by nontargeted LC-MSmetabolomics approach,”Molecular Nutrition & Food Research,vol. 57, no. 11, pp. 1959–1968, 2013.
[51] M. S. Klein, C. Dorn, M. Saugspier, C. Hellerbrand, P. J.Oefner, and W. Gronwald, “Discrimination of steatosis andNASH inmice using nuclearmagnetic resonance spectroscopy,”Metabolomics, vol. 7, no. 2, pp. 237–246, 2011.
[52] J. B. Walker, “Metabolic control of creatine biosynthesis.II. Restoration of transamidinase activity following creatinerepression,” The Journal of Biological Chemistry, vol. 236, pp.493–498, 1961.
[53] S. R. Kimball and L. S. Jefferson, “Regulation of proteinsynthesis by branched-chain amino acids,” Current Opinion inClinical Nutrition and Metabolic Care, vol. 4, no. 1, pp. 39–43,2001.
[54] J. K. Nicholson, E. Holmes, and I. D. Wilson, “Gut microorgan-isms, mammalian metabolism and personalized health care,”Nature Reviews Microbiology, vol. 3, no. 5, pp. 431–438, 2005.
[55] A. N. Phipps, J. Stewart, B. Wright, and I. D. Wilson, “Effect ofdiet on the urinary excretion of hippuric acid and other dietary-derived aromatics in rat. A complex interaction between diet,
gutmicroflora and substrate specificity,”Xenobiotica, vol. 28, no.5, pp. 527–537, 1998.
[56] E.-Y. Won, M.-K. Yoon, S.-W. Kim et al., “Gender specificmetabolomic profiling of obesity in leptin deficient ob/ob miceby 1H NMR spectroscopy,” PLoS ONE, vol. 8, no. 10, Article IDe75998, 2013.
[57] S. Rezzi, Z. Ramadan, F.-P. J. Martin et al., “Human metabolicphenotypes link directly to specific dietary preferences inhealthy individuals,” Journal of Proteome Research, vol. 6, no. 11,pp. 4469–4477, 2007.
[58] J. Sun, L. K. Schnackenberg, R. D. Holland et al., “Metabo-nomics evaluation of urine from rats given acute and chronicdoses of acetaminophen using NMR and UPLC/MS,” Journal ofChromatography B, vol. 871, no. 2, pp. 328–340, 2008.
[59] R. Calvani, A. Miccheli, G. Capuani et al., “Gut microbiome-derived metabolites characterize a peculiar obese urinarymetabotype,” International Journal of Obesity, vol. 34, no. 6, pp.1095–1098, 2010.
[60] C. B. Newgard, J. An, J. R. Bain et al., “A branched chainamino acid-relatedmetabolic signature that differentiates obeseand lean humans and contributes to insulin resistance,” CellMetabolism, vol. 9, no. 4, pp. 311–326, 2009.
[61] R. A. Kreisberg, “Glucose-lactate inter-relations in man,” TheNew England Journal of Medicine, vol. 287, no. 3, pp. 132–137,1972.
[62] P.-A. Jansson, A. Larsson, U. Smith, and P. Lonnroth, “Lactaterelease from the subcutaneous tissue in lean and obese men,”The Journal of Clinical Investigation, vol. 93, no. 1, pp. 240–246,1994.
[63] J. Aduen, W. K. Bernstein, T. Khastagir et al., “The use andclinical importance of a substrate-specific electrode for rapiddetermination of blood lactate concentrations,” The Journal ofthe American Medical Association, vol. 272, no. 21, pp. 1678–1685, 2004.
[64] J. Lovejoy, F. D. Newby, S. S. P. Gebhart, and M. DiGirolamo,“Insulin resistance in obesity is associated with elevated basallactate levels and diminished lactate appearance followingintravenous glucose and insulin,”Metabolism, vol. 41, no. 1, pp.22–27, 1992.
[65] Y. D. I. Chen, B. B. Varasteh, and G. M. Reaven, “Plasmalactate concentration in obesity and type 2 diabetes,” Diabete etMetabolisme, vol. 19, no. 4, pp. 348–354, 1993.
[66] N. Friedrich, K. Budde, T. Wolf et al., “Short-term changes ofthe urine metabolome after bariatric surgery,” OMICS, vol. 16,no. 11, pp. 612–620, 2012.
[67] G. L. S. Pawan and S. J. G. Semple, “Effect of 3-hydroxybutyratein obese subjects on very-low-energy diets and during thera-peutic starvation,”The Lancet, vol. 321, no. 8314-8315, pp. 15–17,1983.
[68] R. Nosadini, A. Avogaro, and R. Trevisan, “Acetoacetate and 3-hydroxybutyrate kinetics in obese and insulin-dependent dia-betic humans,”TheAmerican Journal of Physiology—RegulatoryIntegrative and Comparative Physiology, vol. 248, no. 5, part 2,pp. R611–R620, 1985.
[69] J. S. Fisler, M. Egawa, and G. A. Bray, “Peripheral 3-hydroxybutyrate and food intake in a model of dietary-fatinduced obesity: effect of vagotomy,” Physiology&Behavior, vol.58, no. 1, pp. 1–7, 1995.
[70] N. Gooda Sahib, N. Saari, A. Ismail, A. Khatib, F. Maho-moodally, and A. Abdul Hamid, “Plants’ metabolites as poten-tial antiobesity agents,” The Scientific World Journal, vol. 2012,Article ID 436039, 8 pages, 2012.
14 Journal of Diabetes Research
[71] A. Perez-Cornago, L. Brennan, I. Ibero-Baraibar et al.,“Metabolomics identifies changes in fatty acid and amino acidprofiles in serum of overweight older adults following a weightloss intervention,” Journal of Physiology and Biochemistry, vol.70, no. 2, pp. 593–602, 2014.
[72] S. Wahl, C. Holzapfel, Z. Yu et al., “Metabolomics revealsdeterminants of weight loss during lifestyle intervention inobese children,”Metabolomics, vol. 9, no. 6, pp. 1157–1167, 2013.
[73] P. S. Larmo, A. J. Kangas, P. Soininen et al., “Effects of sea buck-thorn and bilberry on serum metabolites differ according tobaselinemetabolic profiles in overweight women: a randomizedcrossover trial,”The American Journal of Clinical Nutrition, vol.98, no. 4, pp. 941–951, 2013.
[74] M. J. Kim, H. J. Yang, J. H. Kim et al., “Obesity-related metabo-lomic analysis of human subjects in black soybean peptideintervention study by ultraperformance liquid chromatographyand quadrupole-time-of-flight mass spectrometry,” Journal ofObesity, vol. 2013, Article ID 874981, 11 pages, 2013.
[75] J. M. Miles, L. Leiter, P. Hollander et al., “Effect of orlistat inoverweight and obese patients with type 2 diabetes treated withmetformin,” Diabetes Care, vol. 25, no. 7, pp. 1123–1128, 2002.
[76] J. S. Torgerson, J. Hauptman, M. N. Boldrin, and L. Sjostrom,“Xenical in the prevention of diabetes in obese subjects (XEN-DOS) study: a randomized study of orlistat as an adjunct tolifestyle changes for the prevention of type 2 diabetes in obesepatients,” Diabetes Care, vol. 27, no. 1, pp. 155–161, 2004.
[77] H. M. Sickmann, H. S. Waagepetersen, A. Schousboe, A. J.Benie, and S. D. Bouman, “Obesity and type 2 diabetes inrats are associated with altered brain glycogen and amino-acidhomeostasis,” Journal of Cerebral Blood Flow&Metabolism, vol.30, no. 8, pp. 1527–1537, 2010.
[78] S. Satapati, N. E. Sunny, B. Kucejova et al., “Elevated TCAcycle function in the pathology of diet-induced hepatic insulinresistance and fatty liver,” Journal of Lipid Research, vol. 53, no.6, pp. 1080–1092, 2012.
[79] I. H. De Boer, S. D. Sibley, B. Kestenbaum et al., “Central obesity,incident microalbuminuria, and change in creatinine clearancein the epidemiology of diabetes interventions and complica-tions study,” Journal of the American Society of Nephrology, vol.18, no. 1, pp. 235–243, 2007.
[80] D. S. Hittel, Y. Hathout, E. P. Huffman, and J. A. Houmard,“Proteome analysis of skeletal muscle from obese and morbidlyobese women,” Diabetes, vol. 54, no. 5, pp. 1283–1288, 2005.

Submit your manuscripts athttp://www.hindawi.com
Stem CellsInternational
Hindawi Publishing Corporationhttp://www.hindawi.com Volume 2014
Hindawi Publishing Corporationhttp://www.hindawi.com Volume 2014
MEDIATORSINFLAMMATION
of
Hindawi Publishing Corporationhttp://www.hindawi.com Volume 2014
Behavioural Neurology
EndocrinologyInternational Journal of
Hindawi Publishing Corporationhttp://www.hindawi.com Volume 2014
Hindawi Publishing Corporationhttp://www.hindawi.com Volume 2014
Disease Markers
Hindawi Publishing Corporationhttp://www.hindawi.com Volume 2014
BioMed Research International
OncologyJournal of
Hindawi Publishing Corporationhttp://www.hindawi.com Volume 2014
Hindawi Publishing Corporationhttp://www.hindawi.com Volume 2014
Oxidative Medicine and Cellular Longevity
Hindawi Publishing Corporationhttp://www.hindawi.com Volume 2014
PPAR Research
The Scientific World JournalHindawi Publishing Corporation http://www.hindawi.com Volume 2014
Immunology ResearchHindawi Publishing Corporationhttp://www.hindawi.com Volume 2014
Journal of
ObesityJournal of
Hindawi Publishing Corporationhttp://www.hindawi.com Volume 2014
Hindawi Publishing Corporationhttp://www.hindawi.com Volume 2014
Computational and Mathematical Methods in Medicine
OphthalmologyJournal of
Hindawi Publishing Corporationhttp://www.hindawi.com Volume 2014
Diabetes ResearchJournal of
Hindawi Publishing Corporationhttp://www.hindawi.com Volume 2014
Hindawi Publishing Corporationhttp://www.hindawi.com Volume 2014
Research and TreatmentAIDS
Hindawi Publishing Corporationhttp://www.hindawi.com Volume 2014
Gastroenterology Research and Practice
Hindawi Publishing Corporationhttp://www.hindawi.com Volume 2014
Parkinson’s Disease
Evidence-Based Complementary and Alternative Medicine
Volume 2014Hindawi Publishing Corporationhttp://www.hindawi.com