nmllen's environmental scan august 2012
DESCRIPTION
This report outlines details on the NMLLEN region and its industry base; analyses education and employment issues; identifies key problems and program requirements; and outlines directions for action by NMLLEN and its partners.TRANSCRIPT

NMLLEN Environment Scan 2012 Draft 1: January 27 2012
NMLLEN
Environmental Scan 2012 August 2012

NMLLEN Environment Scan 2012
August 2012
1
Table of Contents
Table of Contents 1 Executive Summary 3 1 Introduction 12 2 Overview of the Region 13
2.1 Northern Mallee LLEN Area ...............................................................................................................................................13 2.2 Regional Population ...........................................................................................................................................................14
2.2.1 Population Trends ..............................................................................................................................................................14 2.3 Regional Labour Force ......................................................................................................................................................15
2.3.1 Labourforce Structure ........................................................................................................................................................15 2.3.2 Current Unemployment ......................................................................................................................................................15 2.3.3 Schooling and Qualifications .............................................................................................................................................16
2.4 Labourforce Groups ...........................................................................................................................................................18 2.4.1 Overview ............................................................................................................................................................................18 2.4.2 Indigenous Youth ...............................................................................................................................................................19 2.4.3 Disengaged Youth .............................................................................................................................................................21 2.4.4 Migrants and Refugees ......................................................................................................................................................21
2.5 Robinvale Area ..................................................................................................................................................................22 2.5.1 Population ..........................................................................................................................................................................22 2.5.2 Industry and Jobs...............................................................................................................................................................22
3 Industry Profile 24 3.1 Overview ............................................................................................................................................................................24 3.2 Industry Structure and Trends ...........................................................................................................................................24
3.2.1 Businesses in the Region ..................................................................................................................................................24 3.2.2 Jobs in the Region .............................................................................................................................................................26 3.2.3 Occupations .......................................................................................................................................................................31 3.2.4 Employment Trends ...........................................................................................................................................................32
3.3 Key Industry Sectors ..........................................................................................................................................................34 3.4 Agribusiness ......................................................................................................................................................................35
3.4.1 Horticulture .........................................................................................................................................................................35 3.4.2 Olive Industry .....................................................................................................................................................................35 3.4.3 Wine Industry .....................................................................................................................................................................36 3.4.4 Beverage Industry ..............................................................................................................................................................37 3.4.5 Support Industries ..............................................................................................................................................................37
3.5 Manufacturing ....................................................................................................................................................................38 3.5.1 Food Processing ................................................................................................................................................................38 3.5.2 Packaging ..........................................................................................................................................................................38 3.5.3 Machinery and Equipment .................................................................................................................................................38
3.6 Other Sectors .....................................................................................................................................................................39 3.6.1 Transport and Logistics......................................................................................................................................................39 3.6.2 Tourism ..............................................................................................................................................................................40 3.6.3 Construction .......................................................................................................................................................................40 3.6.4 Retail ..................................................................................................................................................................................40 3.6.5 Health and Community Services .......................................................................................................................................41 3.6.6 Education ...........................................................................................................................................................................41
3.7 Emerging Industries ...........................................................................................................................................................42 3.7.1 Solar Power .......................................................................................................................................................................42 3.7.2 Mineral Sands ....................................................................................................................................................................42
3.8 Occupations and Skills.......................................................................................................................................................43 3.8.1 Occupation Mix ..................................................................................................................................................................43 3.8.2 Skill Issues in the Region ...................................................................................................................................................43
3.9 Future Directions and Opportunities ..................................................................................................................................45 3.9.1 Skill Shortages and Gaps ..................................................................................................................................................45 3.9.2 Employment Opportunities ................................................................................................................................................45
4 Education and Training 47 4.1 Education in the Region .....................................................................................................................................................47
4.1.1 Overview ............................................................................................................................................................................47 4.1.2 Schools Education .............................................................................................................................................................47 4.1.3 Vocational Education and Training ....................................................................................................................................48 4.1.4 Higher Education ...............................................................................................................................................................50
4.2 Secondary Education in the Region ..................................................................................................................................51 4.2.1 School Enrolments .............................................................................................................................................................51
NMLLEN Environment Scan 2012
August 2012
2
4.2.2 Year 12 Completion Rates .................................................................................................................................................52 4.2.3 Destinations of School Students - Year 12 Completions ...................................................................................................52 4.2.4 Destinations of School Students - Early Leavers...............................................................................................................53 4.2.5 Student Family Data ..........................................................................................................................................................54
4.3 VET in Schools Delivery ....................................................................................................................................................55 4.3.1 Overview ............................................................................................................................................................................55 4.3.2 Trends in VET Delivery ......................................................................................................................................................56 4.3.3 VET Clusters ......................................................................................................................................................................57
4.4 Indigenous Programs .........................................................................................................................................................57 4.5 Parents and Families .........................................................................................................................................................58
4.5.1 Issues .................................................................................................................................................................................58 4.5.2 Programs ...........................................................................................................................................................................59
5 Existing Programs 60 5.1 NMLLEN Programs ............................................................................................................................................................60
5.1.1 Overview ............................................................................................................................................................................60 5.1.2 Existing Programs ..............................................................................................................................................................60 5.1.3 Facilitation ..........................................................................................................................................................................61 5.1.4 Partnerships .......................................................................................................................................................................63
6 Challenges and Opportunities 64 6.1 Major Challenges ...............................................................................................................................................................64
6.1.1 Economic Context ..............................................................................................................................................................64 6.1.2 Policy Context ....................................................................................................................................................................65 6.1.3 Indicators - Retention and Transitions ...............................................................................................................................66
6.2 Future Directions ................................................................................................................................................................68 6.2.1 Strategy Goals ...................................................................................................................................................................68 6.2.2 Major Initiatives 2012 .........................................................................................................................................................69
References 72 Appendix A: Robinvale Economy 73
A.1 Jobs in Robinvale Area .......................................................................................................................................................................73 A.2 Residents in Employment - Robinvale Area ......................................................................................................................................76
Appendix B Indigenous Population - Mildura Region 77 B.1 Indigenous Population...................................................................................................................................................................77
B.2 Indigenous Education Participation.....................................................................................................................................................78 B.3 Indigenous Employment .....................................................................................................................................................................80
Appendix C Indigenous Population - Robinvale Region 82 C.1 Indigenous Population ........................................................................................................................................................................82 C.2 Indigenous Education Participation ....................................................................................................................................................83 C.3 Indigenous Employment .....................................................................................................................................................................83
Appendix D Community Organisations and Networks 85 D.1 Education and Training .......................................................................................................................................................................85 D.2 Employment Services .........................................................................................................................................................................86 D.3 Youth Services ....................................................................................................................................................................................86 D.4 NMLLEN Partners ...............................................................................................................................................................................87
D.4.1 Existing Partners ........................................................................................................................................................................87 D.4.2 New Partners .............................................................................................................................................................................88

NMLLEN Environment Scan 2012
August 2012
3
Executive Summary
This report provides an environment scan for the Northern Mallee Local Learning and Employment Network (NMLLEN). The report outlines details on the region and its industry base; analyses education and employment issues; identifies key problems and program requirements; and outlines directions for action by NMLLEN and its partners. The Region The NMLLEN Region covers Mildura Rural City Council LGA and Robinvale (part of Swan Hill Rural City Council LGA). The towns included are Mildura, Merbein, Irymple, Red Cliffs and outlying towns of Ouyen, Murrayville, Werrimull and Robinvale. Mildura borders the NSW LGA of Wentworth Shire, which includes the towns of Wentworth, Dareton, Buronga, Gol Gol and Euston. From an education perspective, the NMLLEN Region is serviced by schools, training organisations, a major TAFE Institute and a University. The broader economic region of Mildura is defined to include the cross-border location of Wentworth Shire. In 2011, the population of this broader Mildura Region was estimated at 60,601 (Mildura LGA 53,351 and Wentworth LGA 7,250 and is growing at an average rate of 1.1% per year.
1 The population is expected to continue growing into the future, reaching
almost 63,000 by 2026, with most of this growth occurring in Mildura LGA. The 2006 ABS Census indicated that there were 1,433 Indigenous persons located in the Mildura LGA, representing 3% of the population.
There are a number of characteristics of Mildura’s population: the population is growing (whereas smaller centres are static or declining) and this is being driven by a combination of regional economic growth and retirement living; the LGA has a younger population (aged 24 years and below) compared with other areas; there is a significant Indigenous population (in Mildura, Wentworth and Robinvale)
2; and there are emerging communities with the increased
rates of international migration into the region.
Overall, there is a significant disadvantage in the region. Mildura is ranked among the twenty most disadvantaged LGAs in Victoria based on the ABS SEIFA Index of Relative Disadvantage.
3 While the unemployment rate has declined and was 7.1% in September
2011, youth unemployment rates are double this rate.
Regional Economy The Mildura Region has a diverse economy. Mildura is an irrigation-based horticultural area, with dry land cropping located in the outer areas. Irrigated agriculture in the area produces approximately 20% of Australia's total wine grape crush, 20% of citrus production and around 95% of Australia's dried vine fruit production. There are a range of linked support industries in packaging, transport, engineering and technical services. Key sectors in terms of jobs include agriculture/horticulture, food and beverage processing, manufacturing, construction and tourism. With its regional role and population size, Mildura is a major centre for health services, retail and business services. The retail sector has seen the opening of several larger operations (supermarkets and discount department stores), however smaller specialist retailers have been impacted by a slowdown in consumer spending. Major emerging industries in the area are solar power and mineral sands mining.
Mildura is developing as a major hub for solar power projects.4 Mildura has a number
of assets for solar energy including: the highest solar radiation per square metre in Victoria; flat land; and access to the national electricity grid.
5
1 Mildura Region Economic Profile 2009, Mildura Development Corporation 2 These populations are significantly understated in the Murray River communities, due to lower rates of participation in the ABS Census 2006. 3 This index ranks LGAs by their income, occupation, education, wealth and living conditions. 4 http://www.abc.net.au/news/2011-07-20/mildura-to-be-centre-for-solar-power-excellence/2802396

NMLLEN Environment Scan 2012
August 2012
4
Major deposits of mineral sands, which are located North West of Wentworth and South of Mildura, will ensure the future development of this sector. The Murray Basin has considerable mineral sands deposits (rutile, zircon, ilmenite and titanium).
Mildura has a trade exposed sector, with the higher exchange rate impacting on export sales in the fruit sector and for processed products. The agriculture sector is recovering from drought, and full recovery will take several years to come through. The area also faces future policy decisions on the water allocation in the Murray-Darling Basin. The Robinvale Statistical Local Area has a population of around 4,000 (including an Indigenous population of 342). Robinvale is mainly a horticulture area with a focus on table grapes and some wine grape plantings. There are also plantings of olives in the area and almond crops (between Robinvale and Swan Hill and around Wemen). Reflecting this horticulture base of the 1,562 jobs located Robinvale in 2006, almost 40% of these jobs were in agriculture (608). The other major concentrations were in services for the population: retail (10%); health and social assistance (9%); education and training (7%); and construction 6%. Labour Demand With a combination of industry factors and the impacts of recession, recent trends have seen a softening in the jobs market. There have also been employment reductions in the food processing sector and subdued conditions in the support industries, including engineering. A slowdown in construction activity has also impacted on employment in building and construction and in supplying industries. The retail sector situation is mixed with several new larger operations (supermarkets and discount department stores) recruiting. Employment in smaller specialist retailers has been affected by a slowdown in consumer spending.
There is a continued demand for skilled professionals and some organisations experience difficulties in attracting professionals because the region is considered remote and far from Melbourne and Adelaide. Skilled tradespersons have also been attracted out of the region with the continued growth in the mining and resources sector.
Overall, the immediate outlook is for stable employment levels. Skill Issues Recent studies have identified skills gaps and skills shortages in the region.
6 A 2006 study,
identified recruitment difficulties in a number of categories.7 These included: tradespersons;
intermediate production and transport workers; and professionals. The major issues related to: lack of experience; inadequate qualifications; lack of relevant technical skills; and poor attitudes. There are several issues affecting future skills in the Mildura Region:
Skills shortages of experienced professionals, with some turnover of employees and difficulties in attracting persons to the area.
Young people leaving the region for higher education or to take up entry level jobs in professional areas of employment.
A decline in the number of apprentice positions as a result of subdued economic conditions.
A narrow range of entry level positions being available in industries in the region.
With an ageing workforce, there is a need for improved workforce planning to meet current skill shortages and to ensure a sustainable future workforce. This process has commenced in
5 Loddon Mallee Regional Strategic Plan Northern Region, Loddon Mallee Regional Development Australia Committee. P24 6 Sunraysia Study Area Report, June 2007, Department of Innovation, Industry and Regional Development - Victoria 7 Regional Skills Shortage Survey Summary Mildura and Region, Department for Victorian Communities, April 2006 P6
NMLLEN Environment Scan 2012
August 2012
5
the wine, olive and beverage industries with the implementation of a Workforce Development Strategy. Future Employment The future growth of the Mildura Region will create opportunities in a number of areas, including traditional trades, technical occupations and professional occupations. These opportunities will arise because of: an ageing workforce; continued population growth in the region; changes in the industry mix; and changes in skill requirements. There are a number of areas of opportunity:
Mining: with the opening of new mineral sand mines near Mildura, a number of new positions are becoming available including engineers, equipment operators, electrical and mechanical trades, metallurgists and environmental specialists.
Solar power: the development of the sector in the region will generate jobs in the construction phase and a number of specialist jobs in the operations phase.
Transport: the transport and logistics industry is a significant employer in the Mildura region due to the strategic location. There are opportunities for truck drivers, logistics personnel and warehousing employees.
Manufacturing: the region has a specialisation in food and wine manufacturing and in related support industries including packaging and containers, and engineering support. The sector creates jobs for skilled trades, technicians and professionals.
Building and construction: continued population growth and the location of Mildura create opportunities for building and construction trades in the region.
Business services: Mildura’s role as a regional centre generates jobs in a range of professional services (e.g. accounting, finance, law) and technical services.
Health services: as a major regional centre, the region has strong demand for health professionals (e.g. general practitioners, registered nurses, podiatrists, occupational therapists, physiotherapists) and for allied health assistants. There is also a demand for carers in aged care.
Agribusiness: viticulture and horticulture remain as major activities in the region. Changes in water availability are generating changes in the sectors, with opportunities in areas of horticulture, conservation and land management, and irrigation. There is a demand for skilled labour in the wine, beverage and food processing sectors. The recent jobs brochures highlight employment opportunities and pathways in: production and manufacturing; administration and planning;
technical and quality support; other support and general management.8
Tourism: is a major industry in the region with a significant accommodation and restaurant sector. This creates major opportunities for full and part time employment in commercial cookery and in front of house.
8 Working in the Olive Industry, Mildura Development Corporation; Working in the Beverage Industry, Mildura Development Corporation; Working in the Wine Industry, Mildura Development Corporation.

NMLLEN Environment Scan 2012
August 2012
6
Young People There are several key issues in relation to young people in the workforce in the region.
In comparison with other areas, completion rates for education and transitions to post school education are significantly lower in the Mildura Region and Robinvale.
There is a need to ensure increased retention rates in schools to increase Year 12 or equivalent completions and to improved transitions to higher education, vocational education and training (VET) and employment.
The creation of more entry level local employment opportunities for young people (including apprenticeships) is required.
In the case of young persons there is a need to develop linked-up programs (covering training/employment experience/counselling) for those young persons, who are disengaged from education.
A major requirement is improving the education and employment outcomes for Indigenous youth (who make up a large share of disengaged young persons in the region).
Providing support for young migrants and refugees to complete their education and obtain work skills is an emerging priority.
Mildura has a high teenage birth rate, which has social and economic impacts, as young mothers withdraw from education and training.
The participation of Indigenous young persons in education and training is much lower than for the general population. They also make up a high proportion of disengaged youth in the region. There are a range of programs that provide support for young people to enable them: to remain in school; to transition to further education and training; and to secure employment. Data on education participation shows a low rate of retention into senior years and a very low rate of Year 12 completion for local Indigenous students.
NMLLEN along with schools and other organisations in the region have identified Indigenous education, training and employment transitions as a major priority. Use is made of a number of Australian Government and Victoria Government programs including: Dare to Lead (Transition for Koories from Year 10 to Year 11); Wannik Strategy (Indigenous students in Department of Education and Early Childhood Development (DEECD) schools); the Indigenous Employment Program (Department of Education, Employment and Workplace Relations (DEEWR)); and the Clontarf Foundation’s Clontarf Academy.
Indicators The following shows some education and training indicators for the NMLLEN Region. The indicators highlight that more needs to be done:
To increase completion rates of Year 12 or its equivalent, and this involves increasing retention rates at schools.
To improve the transitions to post compulsory education and training.
To improve education and training experiences and outcomes for Indigenous young people.
To re-engage those young people who are disengaged from education, training and employment in the NMLLEN Region.
To lift the involvement of businesses with schools, including more work placements and school based apprenticeships.

NMLLEN Environment Scan 2012
August 2012
7
Indicators for the NMLLEN Region Indicator Performance Data Source
Current retention rates for schools
2010 Retention NMLLEN Region
Years 11-12 School 69.9%
Years 7-12 Schools 65.7%
Years 7-10 Schools 82.6%
DEECD Data
Attainment rates – Year 12 or equivalent.
2009: Attainment NMLLEN Region
Year 12 or equivalent attainment rates for young people for the NMLLEN region are among the lowest for the State at 63.7% (2009).
Compares with Regional Victoria (74.1%) and Victoria (79.8%).
DEECD Report 2010
Disengagement 2006: Disengaged Persons NMLLEN Region
Relatively high levels of disengagement among
young people with 24.8% of 15-19 year olds not in
education, training or employment compared with
Loddon Mallee Region (21.5%) and Victoria (15.4%).
Community Indicators Victoria 2006
Transitions 2010 Year 12 Completers NMLLEN Region
Fewer go to university (NMLLEN 37.1% Victoria 49.0%). <NMLLEN rates have risen by 6.3% compared with Victorian rise of 3.4% since the previous year>.
Fewer undertake Certificate IV and above (NMLLEN 9.8%, Victoria 14.1%). <NMLLEN rates have risen by 3.2% compared with Victorian fall of 0.1%>.
More go into traineeships (NMLLEN 6.6%, Victoria 3.3%).
More go into full time employment (NMLLEN 11.1%, Victoria 7.6%).
More go into part time employment (NMLLEN 19.4%, Victoria 11.8%).
More are looking for work (NMLLEN 5.7%, Victoria 4.9%).
More defer their University studies (NMLLEN 13.0%, Victoria 9.0%), with the main reason being financial.
On Track 2010 Data
Early Leavers 2010 Year 12 Early Leavers NMLLEN Region
More took up apprenticeships (NMLLEN 30.3%, Victoria 28.2%).
More went to TAFE/VET (NMLLEN 30.3%, Victoria 21.2%).
Fewer took up traineeships (NMLLEN 3.0%, Victoria 6.4%).
Less took up full time employment (NMLLEN 6.1%, Victoria 13.3%).
Fewer took up part time employment (NMLLEN 6.1%, Victoria 14.2%).
More were looking for work (NMLLEN 24.2%,
Victoria 16.7%).
On Track 2010 Data
NMLLEN Environment Scan 2012
August 2012
8
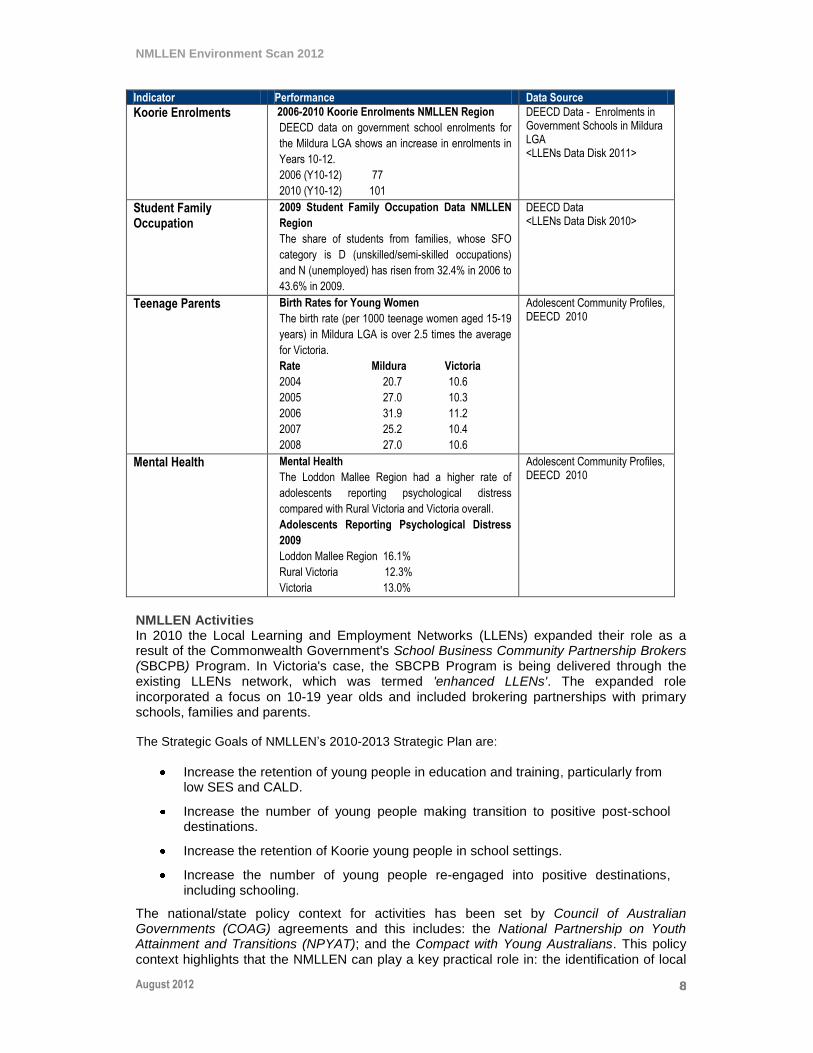
Indicator Performance Data Source
Koorie Enrolments 2006-2010 Koorie Enrolments NMLLEN Region
DEECD data on government school enrolments for
the Mildura LGA shows an increase in enrolments in
Years 10-12.
2006 (Y10-12) 77
2010 (Y10-12) 101
DEECD Data - Enrolments in Government Schools in Mildura LGA <LLENs Data Disk 2011>
Student Family Occupation
2009 Student Family Occupation Data NMLLEN
Region
The share of students from families, whose SFO
category is D (unskilled/semi-skilled occupations)
and N (unemployed) has risen from 32.4% in 2006 to
43.6% in 2009.
DEECD Data <LLENs Data Disk 2010>
Teenage Parents Birth Rates for Young Women
The birth rate (per 1000 teenage women aged 15-19
years) in Mildura LGA is over 2.5 times the average
for Victoria.
Rate Mildura Victoria
2004 20.7 10.6
2005 27.0 10.3
2006 31.9 11.2
2007 25.2 10.4
2008 27.0 10.6
Adolescent Community Profiles, DEECD 2010
Mental Health Mental Health
The Loddon Mallee Region had a higher rate of
adolescents reporting psychological distress
compared with Rural Victoria and Victoria overall.
Adolescents Reporting Psychological Distress
2009
Loddon Mallee Region 16.1%
Rural Victoria 12.3%
Victoria 13.0%
Adolescent Community Profiles, DEECD 2010
NMLLEN Activities In 2010 the Local Learning and Employment Networks (LLENs) expanded their role as a result of the Commonwealth Government's School Business Community Partnership Brokers (SBCPB) Program. In Victoria's case, the SBCPB Program is being delivered through the existing LLENs network, which was termed 'enhanced LLENs'. The expanded role incorporated a focus on 10-19 year olds and included brokering partnerships with primary schools, families and parents. The Strategic Goals of NMLLEN’s 2010-2013 Strategic Plan are:
Increase the retention of young people in education and training, particularly from low SES and CALD.
Increase the number of young people making transition to positive post-school destinations.
Increase the retention of Koorie young people in school settings.
Increase the number of young people re-engaged into positive destinations, including schooling.
The national/state policy context for activities has been set by Council of Australian Governments (COAG) agreements and this includes: the National Partnership on Youth Attainment and Transitions (NPYAT); and the Compact with Young Australians. This policy context highlights that the NMLLEN can play a key practical role in: the identification of local

NMLLEN Environment Scan 2012
August 2012
9
issues; the formulation and brokering of solutions; the development of local partnerships and the delivery of programs on the ground (directly or in partnership with other organisations). This is particularly the case with DEEWR and its education and employment programs and its coordination through its regional office.
NMLLEN delivers several major programs and facilitates the take up of other programs in the region.
The major programs being delivered by NMLLEN are the Workplace Learning Coordinator Program; the Mildura Trade Training Centre (MRTTC); and School Business Community Partnership Brokers Program. NMLLEN is involved with schools, business and the community in facilitating the delivery of Youth Career and Transition Programs - Youth Connections; and Youth Partnerships.
The major programs being facilitated by NMLLEN are: Unlocking Sunraysia’s Potential (USP); Youth Connections; Youth Partnerships; and the Workforce Development Strategy for the Mildura wine, olive and beverage industries. NMLLEN has been active in the community in bringing organisations together to identify key education, training and employment issues; to develop solutions; and to access government programs (Australian Government and Victorian Government).
NMLLEN has several key strategic partnerships and this includes DEECD and DEEWR. The partnership with DEEWR Regional Education Skills Jobs Coordinator for the Loddon Mallee Region is important in terms of ensuring accessibility to Australian Government programs and funding for initiatives to be delivered in the Mildura and Robinvale areas.
NMLLEN has an active program for 2012. The major initiatives for 2012 continue the work commenced over the last two years and include: managing the design, construction and systems development for the MRTTC; shaping integrated programs to implement the Unlocking Sunraysia’s Potential Strategy; assisting the development of a Flexible Learning Options (FLO) model; developing quality work placements with the Workplace Learning Coordinator Program; implementing activities in the School Business Community Partnership Brokers Program; and working on Indigenous programs.
Future Initiatives
Priorities and Directions
Key Roles
Program Delivery Models Shaping innovative approaches
NMLLEN provides a vehicle for the development of local strategies, action plans and programs. A key role is identifying gaps in programs and brokering/developing solutions.
Integration of Programs Taking a lead
A key role that NMLLEN can play is in developing models for improved integration of programs to achieve a linked-up approach.
- Currently programs for early years and those for young people disengaged from education or at risk are fragmented.
- There is a need to define problems and issues and be responsive to local industry needs rather than being reactive to government funded programs.
Key Priorities
Mildura Region Trade Training Centre Supporting the establishment of the centre
NMLLEN continues to manage the project and this includes: - Project management of design and construction phase. - Facilitation of development of operational guidelines and systems
for the centre. - Development of industry linkages for the centre. - Securing work placements for the MRTTC. - Providing guidance on management models for the facility.

NMLLEN Environment Scan 2012
August 2012
10
Future Initiatives
Priorities and Directions
Key Priorities
Workplace Learning Coordinator Program Securing more quality work placements
Continuation of an active program:
- Developing work placements across a range of industry sectors.
- Securing of work placements for the MRTTC.
- Developing a streamlined coordinated workplace model for schools and for businesses.
- Developing participation of larger regional employers in programs (e.g. national retailers, banks). Targeting of key sectors including agribusiness, retail services and mining.
Unlocking Sunraysia's Potential Blueprint Implementation Implementing an action plan
NMLLEN is participating with Mildura Rural City Council, and other stakeholders on the implementation of the USP Strategy, particularly as it relates to vulnerable young persons.
This includes: the development of transitions programs, the development of a Flexible Learning Options (FLO) model and developing new training and support programs for vulnerable young persons (to develop their skills for employment and life).
Youth Partnerships / Flexible Learning Options (FLO) Improving support through better integration
NMLLEN has been active in facilitating meetings for schools, RTOs and community organisations to explore options for an FLO type model in Mildura and to determine ways in which community organisations could deliver the model effectively.
- This model is consistent with Unlocking Sunraysia’s Potential and Mildura Rural City Council has taken a lead role on the Northern Mallee Youth Partnerships Project which seeks to develop a FLO model for local implementation.
- Innovative Community Action Networks (ICANs) have been developed in South Australia and bring together young people, families, schools, community groups, businesses and different levels of government to find solutions to local issues that prevent young people from completing their education.
- A key objective of the Northern Mallee Youth Partnerships Project is to develop a linked-up program for youth at risk of disengaging from school, based on the South Australian ICAN model.
- The ICAN model provides students with a holistic approach with access to: individual case management services, life skills training, literacy and numeracy support, e-learning opportunities, and flexible learning programs in school and/or in a community setting. Community Partnerships at Work provides a model for delivery (http://www.cpatw.com.au).
A major requirement is to identify the community based programs and services available in the region to support young people engaged on the FLO program. A key issue is training for staff involved in program delivery (e.g. Certificate IV Youth Work).

NMLLEN Environment Scan 2012
August 2012
11
Future Initiatives
Priorities and Directions
Key Priorities
School Business Community Partnership Brokers Program
Implementing the program and building strategic partnerships. This includes a priority project focused on developing new models for parent involvement.
Models for School/Parent Engagement Building active engagement
There is a need to improve school/parent engagement in the region. - NMLLEN is in a position to work with schools on the development of
more effective models for parent engagement with schools and education.
Schools Programs Years 5-9 Improving transitions
Resources are currently focused on Years 10-12 however there is a need for earlier year interventions.
- There is a need to develop early year’s programs for transitions of primary students to secondary schools.
- This includes the development of knowledge of industry and careers and support for education programs.
Indigenous programs Closing the gap
Closing the education, employment and living standards gap is a major priority.
- NMLLEN continues to work on programs to increase the retention of Indigenous young persons in education and training.
- Programs need to be from early learning through to Year 12 and for transitions to post school education and training and employment.
NMLLEN is in a position to work with the DEEWR regional office, DEECD and service providers on improving the local delivery of programs.
Refugees Developing skills
There is growth in immigrants and refugees settling in the Mildura Region. This includes young persons, with often disrupted education.
- NMLLEN can provide a support role to these groups.
- This includes brokering programs to assist young refugees in education and training and in transitions to employment.
Agribusiness Sector Securing a future workforce
Working with the agribusiness sector and Mildura Development Corporation on the implementation of the Industry Workforce Development Strategy. This relates to exposing young people to career paths in different segments of agribusiness.
Smaller Towns Ensuring local delivery
Ensuring delivery of programs for smaller areas (e.g. Robinvale, Ouyen, and Werrimull).
Young Parents Facilitating access to education and training
The NMLLEN area has one of the highest teenage pregnancy rates in Victoria. Young mothers have special needs if they are to engage in education and training.
- Research: NMLLEN was active in 2011: in supporting research (thesis by Anne Webster, La Trobe University Social Work Honours student); and delivering a forum on the issue.
- Support: following on the research, a 2012 priority is to develop partnerships and support arrangements to enable young parents to return to education and training (e.g. support - childcare, counselling, flexible learning options, transport and housing).
Mental Health Supporting young people in schools
Mental health is a major issue in all communities. NMLLEN has a focus on mental health issues of young people in schools.
- Workshops - in 2011 NMLLEN partnered with other organisations for two workshops on mental health at work.
- Youth mental health is a priority for 2012, with key priorities being: mental health of young people in schools; development of programs with partner organisations; and the provision of information and support for teachers (information and training programs).
- A youth mental health forum (with a focus on the education community) was held in May 2012 and brought together a number of education, health and community organisations.
NMLLEN Environment Scan 2012
August 2012
12
1 Introduction
This report provides a detailed environment scan for the Northern Mallee Local Learning and Employment Network (NMLLEN). The report: covers details of the region and its industries; analyses the key education and employment issues for the region; identifies major problems and program gaps; and outlines directions for action by NMLLEN and its partners. The report outlines the strategic context for operations in 2012. NMLLEN continues to play a practical role in: identifying local issues and problems; formulating and brokering of solutions; developing strong business, education and community partnerships; and delivering programs (directly or with other organisations). Major priorities for 2012 and into 2013 are: the successful construction of the Mildura Region Trade Training Centre and development of its operating systems; securing more industry involvement in programs; developing models for better parent engagement in education; and introducing new linked-up approaches to address the problems of disengaged young people. NMLLEN will continue with its partnerships approach including: engagement with DEEWR on its education and employment programs and Indigenous programs; and ongoing involvement with DEECD’s Loddon Mallee Regional Office. This report was prepared by MCa <Michael Connell & Assocs.>

NMLLEN Environment Scan 2012
August 2012
13
2 Overview of the Region
2.1 Northern Mallee LLEN Area
The Northern Mallee LLEN Region is located in North West Victoria, 550 km from Melbourne and covers Mildura Rural City Council LGA and Robinvale (part of Swan Hill Rural City Council LGA). The towns included in the region are Mildura, Merbein, Irymple, Red Cliffs and outer towns of Ouyen, Murrayville, Werrimull and Robinvale. Mildura borders the NSW LGA of Wentworth Shire, which includes the towns of Wentworth, Dareton, Buronga, Gol Gol and Euston. While the Wentworth Shire in NSW is not included in the NMLLEN Region, it borders Mildura and there are considerable cross-border flows in both directions between Mildura and the Wentworth, Dareton, Buronga and Gol Gol areas. For example, some Mildura young people go to school in NSW and vice-versa. Some jobs in Wentworth, Dareton, Buronga and Gol Gol are filled by residents of Mildura and there is a significant flow from NSW into Mildura. The broader Mildura Region (including Wentworth LGA) has a total population of 60,281 (Mildura LGA 53,351 and Wentworth LGA 7,250), and is growing at an average rate of 1.1% per year.
9
From an education perspective, the NMLLEN Region is serviced by schools, training organisations, a major TAFE Institute and a University.
Education
Schools
Government Schools (DEECD) Government (DEECD): six secondary schools (one senior college Years 11-12; two feeder Years 7-10 schools; one secondary school Years 7-12; 18 primary schools; one P-10 college; one P-12 school; a special school (students with disabilities) and a Koorie pathway school (Two Rivers College); and Mildura English Language School (for recent arrivals).
Catholic Schools Catholic: one secondary school Years 7-12; five primary schools.
Independent Schools Independent: three P-10 schools.
Higher Education
University University: La Trobe University Mildura Campus
University: Monash University School of Rural Health in Mildura which is equipped to train medical professions, including nursing.
Registered Training Organisations
Registered Training Organisations Registered Training Organisations: one TAFE Institute (Sunraysia with campuses in Mildura, Robinvale, Ouyen and Swan Hill), one Group Training Company (Sunraysia Murray Group Training) which recently incorporated Australian National Institute (RTO), an Adult and Community Education provider (MADEC), and Aust-Link (specialising in transport and logistics training).
9 Mildura Region Economic Profile 2009, Mildura Development Corporation.
NMLLEN Environment Scan 2012
August 2012
14
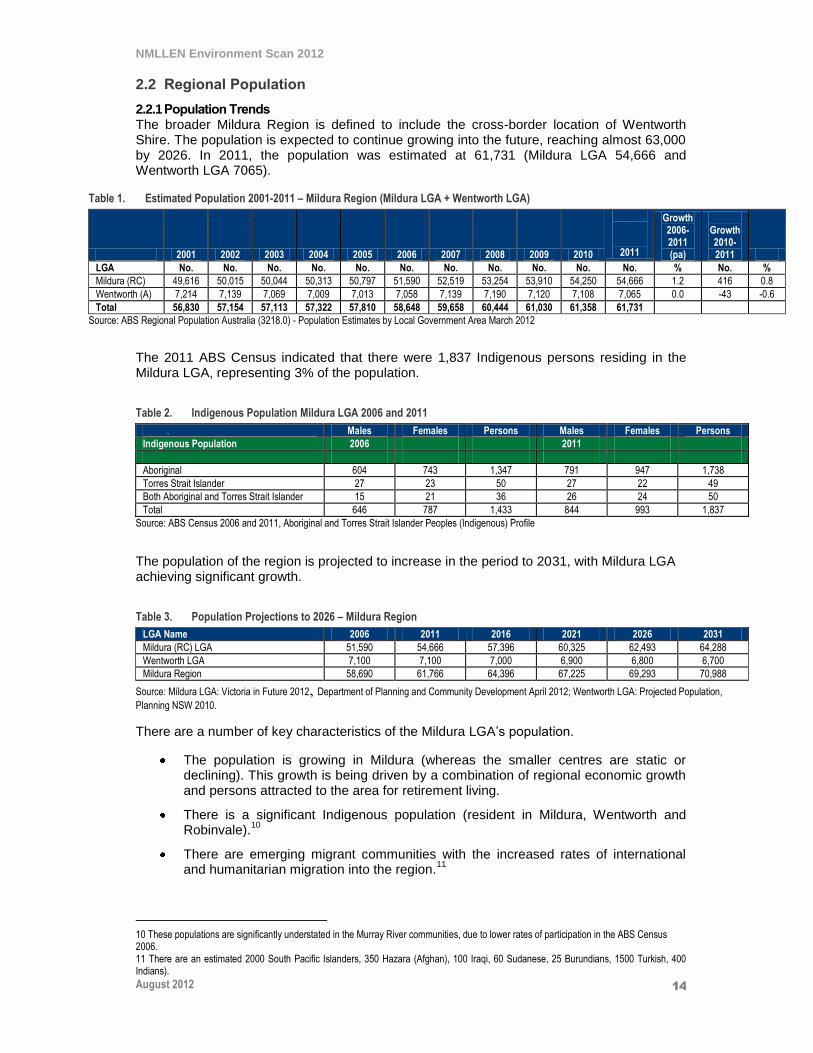
2.2 Regional Population
2.2.1 Population Trends The broader Mildura Region is defined to include the cross-border location of Wentworth Shire. The population is expected to continue growing into the future, reaching almost 63,000 by 2026. In 2011, the population was estimated at 61,731 (Mildura LGA 54,666 and Wentworth LGA 7065).
Table 1. Estimated Population 2001-2011 – Mildura Region (Mildura LGA + Wentworth LGA)
2001 2002 2003 2004 2005 2006 2007 2008 2009 2010
2011
Growth 2006-2011 (pa)
Growth 2010-2011
LGA No. No. No. No. No. No. No. No. No. No. No. % No. %
Mildura (RC) 49,616 50,015 50,044 50,313 50,797 51,590 52,519 53,254 53,910 54,250 54,666 1.2 416 0.8
Wentworth (A) 7,214 7,139 7,069 7,009 7,013 7,058 7,139 7,190 7,120 7,108 7,065 0.0 -43 -0.6
Total 56,830 57,154 57,113 57,322 57,810 58,648 59,658 60,444 61,030 61,358 61,731 Source: ABS Regional Population Australia (3218.0) - Population Estimates by Local Government Area March 2012
The 2011 ABS Census indicated that there were 1,837 Indigenous persons residing in the Mildura LGA, representing 3% of the population.
Table 2. Indigenous Population Mildura LGA 2006 and 2011
. Males Females Persons Males Females Persons
Indigenous Population 2006 2011
Aboriginal 604 743 1,347 791 947 1,738
Torres Strait Islander 27 23 50 27 22 49
Both Aboriginal and Torres Strait Islander 15 21 36 26 24 50
Total 646 787 1,433 844 993 1,837
Source: ABS Census 2006 and 2011, Aboriginal and Torres Strait Islander Peoples (Indigenous) Profile
The population of the region is projected to increase in the period to 2031, with Mildura LGA achieving significant growth.
Table 3. Population Projections to 2026 – Mildura Region
LGA Name 2006 2011 2016 2021 2026 2031
Mildura (RC) LGA 51,590 54,666 57,396 60,325 62,493 64,288
Wentworth LGA 7,100 7,100 7,000 6,900 6,800 6,700
Mildura Region 58,690 61,766 64,396 67,225 69,293 70,988
Source: Mildura LGA: Victoria in Future 2012, Department of Planning and Community Development April 2012; Wentworth LGA: Projected Population,
Planning NSW 2010.
There are a number of key characteristics of the Mildura LGA’s population.
The population is growing in Mildura (whereas the smaller centres are static or declining). This growth is being driven by a combination of regional economic growth and persons attracted to the area for retirement living.
There is a significant Indigenous population (resident in Mildura, Wentworth and Robinvale).
10
There are emerging migrant communities with the increased rates of international and humanitarian migration into the region.
11
10 These populations are significantly understated in the Murray River communities, due to lower rates of participation in the ABS Census 2006. 11 There are an estimated 2000 South Pacific Islanders, 350 Hazara (Afghan), 100 Iraqi, 60 Sudanese, 25 Burundians, 1500 Turkish, 400 Indians).

NMLLEN Environment Scan 2012
August 2012
15
There is significant disadvantage in the region. Mildura is ranked among the twenty most disadvantaged LGAs in Victoria based on the ABS SEIFA Index of Relative Disadvantage.
12
2.3 Regional Labour Force
2.3.1 Labour Force Structure The following table shows features of the labour force situation in 2006. Mildura LGA had a total labour force of 22,839 persons. There were 1,549 persons aged 15-19 years in employment (with around two thirds of these working part-time). Of persons aged 20-24 years in employment (1,832), around two thirds were working full time. The youth unemployment rate was 13.5% for 15-19 year old persons and 10.3% for 20-24 year olds, and the overall unemployment rate was 5.7%. The data shows that 1,653 persons aged 15-19 years were not in the labour force, with most of these being in secondary education or tertiary education.
Table 4. Labour Force 2006 - Mildura LGA
Residents (persons aged 15 years +)
Employed worked
full time (a)
Worked part time
Away from work (b)
Hours worked
not stated
Total
Unemp. looking for full time work
Looking for
part time work
Total
Unemp. rate %
Total labour force
Not in the
labour force
Labour force status
not stated
Total persons
15 years+
15-19 years 503 924 51 71 1,549 139 102 241 13.5 1,790 1,653 163 3,606
20-24 years 1,235 461 71 65 1,832 163 48 211 10.3 2,043 447 174 2,664
25-29 years 1,405 388 68 46 1,907 101 31 132 6.5 2,039 483 143 2,665
30-34 years 1,444 582 99 48 2,173 97 51 148 6.4 2,321 624 141 3,086
35-39 years 1,652 773 79 67 2,571 93 51 144 5.3 2,715 636 147 3,498
40-44 years 1,786 800 92 65 2,743 96 44 140 4.9 2,883 556 153 3,592
45-49 years 2,006 753 84 79 2,922 57 30 87 2.9 3,009 512 155 3,676
50-54 years 1,690 545 84 54 2,373 51 25 76 3.1 2,449 589 122 3,160
55-59 years 1,221 522 68 40 1,851 34 39 73 3.8 1,924 938 157 3,019
60-64 years 555 335 49 41 980 16 11 27 2.7 1,007 1,196 137 2,340
65-69 years 182 143 15 23 363 0 13 13 3.5 376 1,475 173 2,024
70-74 years 60 56 9 8 133 3 0 3 2.2 136 1,429 165 1,730
75 years and over 61 58 12 16 147 0 0 0 0.0 147 2,945 519 3,611
Total 13,800 6,340 781 623 21,544 850 445 1,295 5.7 22,839 13,483 2,349 38,671
Source: ABS Census 2006, Resident Population Data. Notes: (a) 'Employed, worked full-time' is defined as having worked 35 hours or more in all jobs during the week prior to Census Night . (b) Comprises employed persons who did not work any hours in the week prior to Census Night.
2.3.2 Current Unemployment Small area data shows that the unemployment rate has declined over 2011.
13 The rate was
7.3% in March 2012 (a decline on the 9.1% rate in December 2010). The current unemployment rate for 15-19 year olds is estimated at around 15%-17% and around 12-13% for persons aged 20-24 years. Growth since the 2006 Census has seen the labour force increase from 22,839 in June 2006 to 26,834 in March 2012.
Table 5. Unemployment - Mildura LGA March 2012 (Smoothed)
Unemployed Persons Unemployment Rate (%) Labour Force
Statistical Local Area Sep Mar Jun Sep
Dec
Mar Sep Dec Mar Jun Sep
Dec
Mar Sep Sep
Mar
2010 2011 2011 2011 2011 2012 2010 2010 2011 2011 2011 2011 2012 2010 2011 2012
Mildura (RC) - Part A
2,190
2,190
1,956
1,916
1,909
1,963
8.8
9.1
8.6
7.6
7.3
7.1
7.3 24,845 26,332
26,834
Mildura (RC) - Part B
111
104
90
87
88
91
4.9
4.9
4.5
3.8
3.6
3.6
3.7 2,259 2,394
2,441
Source: DEEWR Small Area Statistics March 2012 http://www.deewr.gov.au/employment/lmi/pages/salm.aspx
12 This index ranks LGAs by their income, occupation, education, wealth and living conditions. 13 DEEWR Small Area Statistics March 2012 http://www.deewr.gov.au/employment/lmi/pages/salm.aspx

NMLLEN Environment Scan 2012
August 2012
16
2.3.3 Schooling and Qualifications The following tables show the highest level of schooling completed by residents aged over 15 years in the Mildura LGA (for 2011). It shows that females have a significantly higher level of Year 12 completions in all of the age categories, compared with males. The 2006 data on post school qualifications show that: females (1,960) are more likely to have higher education qualifications compared with males (1,269); males are more likely to have a VET qualification at Certificate III or IV level (3,855), compared with females (1,597); and more females (1,141) have an Advanced Diploma or Diploma, compared with males (775).
14
Table 6. Highest Level of Schooling - Selected Age Groups - Mildura LGA 2011
Residents (15 years +)
Total all persons aged 15 years +
Total all persons aged 15 years +
15-19 years
20-24 years
25-34 years
35-44 years
Highest Level of Schooling 2006
No. %
No. % No. % No. % No. %
Males
Year 12 or equivalent 5,332 28.9 229 26.5 663 46.4 1,224 47.2 1,179 36.8
Year 11 or equivalent 2,871 15.6 156 18.0 259 18.1 375 14.5 645 20.1
Year 10 or equivalent 4,317 23.4 239 27.6 275 19.2 529 20.4 750 23.4
Year 9 or equivalent 1,992 10.8 101 11.7 85 5.9 167 6.4 249 7.8
Year 8 or below 2,006 10.9 45 5.2 37 2.6 96 3.7 113 3.5
Did not go to school 169 0.9 0 0.0 0 0.0 17 0.7 25 0.8
Highest year of school not stated
1,749 9.5 95 11.0 110 7.7 187 7.2 243 7.6
Total 18,436 100.0 865 100.0 1429 100.0 2,595 100.0 3,204 100.0
Females
Year 12 or equivalent 6,770 34.1 320 37.8 838 58.9 1,775 60.7 1,666 48.5
Year 11 or equivalent 2,985 15.1 120 14.2 161 11.3 335 11.4 672 19.5
Year 10 or equivalent 4,012 20.2 176 20.8 216 15.2 421 14.4 585 17.0
Year 9 or equivalent 1,842 9.3 71 8.4 84 5.9 129 4.4 209 6.1
Year 8 or below 2,094 10.6 38 4.5 20 1.4 59 2.0 79 2.3
Did not go to school 206 1.0 7 0.8 6 0.4 17 0.6 23 0.7
Highest year of school not stated
1,924 9.7 114 13.5 98 6.9 190 6.5 204 5.9
Total 19,833 100.0 846 100.0 1,423 100.0 2,926 100.0 3,438 100.0
Persons
Year 12 or equivalent 12,102 31.6 549 32.1 1,501 52.6 2,999 54.3 2,845 42.8
Year 11 or equivalent 5,856 15.3 276 16.1 420 14.7 710 12.9 1,317 19.8
Year 10 or equivalent 8,329 21.8 415 24.3 491 17.2 950 17.2 1,335 20.1
Year 9 or equivalent 3,834 10.0 172 10.1 169 5.9 296 5.4 458 6.9
Year 8 or below 4,100 10.7 83 4.9 57 2.0 155 2.8 192 2.9
Did not go to school 375 1.0 7 0.4 6 0.2 34 0.6 48 0.7
Highest year of school not stated
3,673 9.6 209 12.2 208 7.3 377 6.8 447 6.7
Total 38,269 100.0 1,711 100.0 2,852 100.0 5,521 100.0 6,642 100.0
Source: ABS Census 2011, Resident Population Data, Basic Community Profile
14 2011 ABS Census Data on qualifications will not be released until October 2012
NMLLEN Environment Scan 2012
August 2012
17
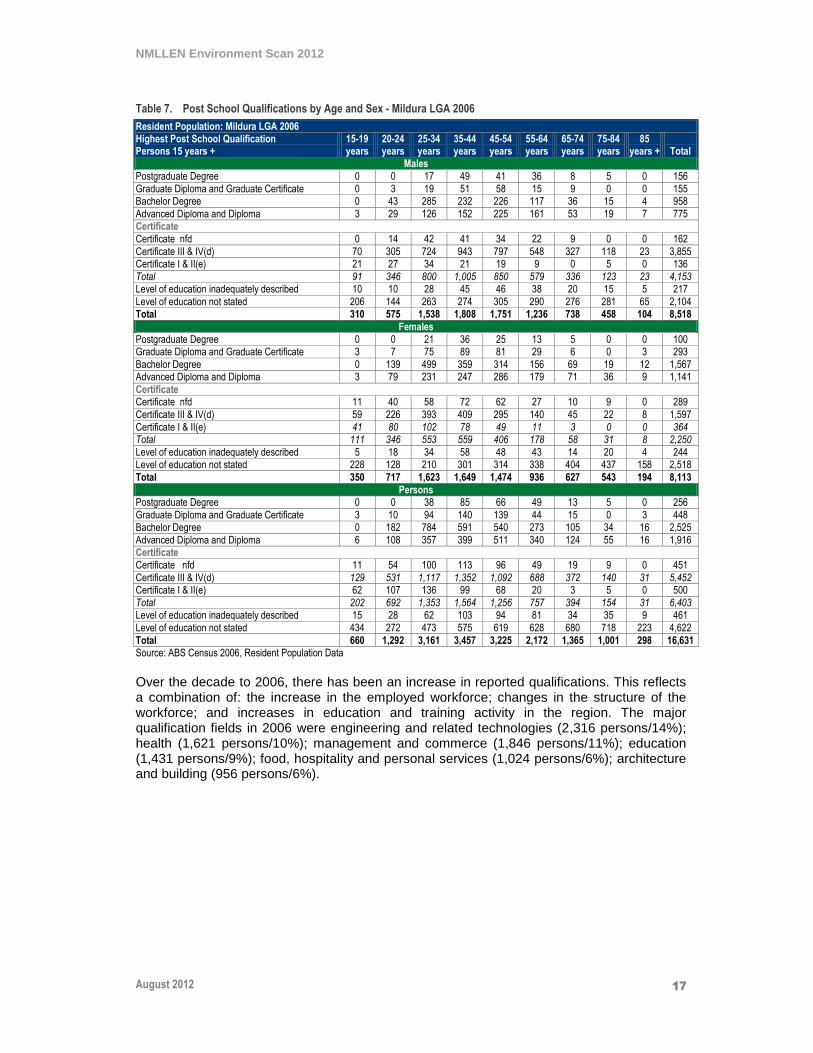
Table 7. Post School Qualifications by Age and Sex - Mildura LGA 2006
Resident Population: Mildura LGA 2006 Highest Post School Qualification Persons 15 years +
15-19 years
20-24 years
25-34 years
35-44 years
45-54 years
55-64 years
65-74 years
75-84 years
85 years +
Total
Males
Postgraduate Degree 0 0 17 49 41 36 8 5 0 156
Graduate Diploma and Graduate Certificate 0 3 19 51 58 15 9 0 0 155 Bachelor Degree 0 43 285 232 226 117 36 15 4 958
Advanced Diploma and Diploma 3 29 126 152 225 161 53 19 7 775 Certificate
Certificate nfd 0 14 42 41 34 22 9 0 0 162
Certificate III & IV(d) 70 305 724 943 797 548 327 118 23 3,855 Certificate I & II(e) 21 27 34 21 19 9 0 5 0 136
Total 91 346 800 1,005 850 579 336 123 23 4,153 Level of education inadequately described 10 10 28 45 46 38 20 15 5 217
Level of education not stated 206 144 263 274 305 290 276 281 65 2,104 Total 310 575 1,538 1,808 1,751 1,236 738 458 104 8,518
Females
Postgraduate Degree 0 0 21 36 25 13 5 0 0 100 Graduate Diploma and Graduate Certificate 3 7 75 89 81 29 6 0 3 293
Bachelor Degree 0 139 499 359 314 156 69 19 12 1,567 Advanced Diploma and Diploma 3 79 231 247 286 179 71 36 9 1,141
Certificate Certificate nfd 11 40 58 72 62 27 10 9 0 289
Certificate III & IV(d) 59 226 393 409 295 140 45 22 8 1,597
Certificate I & II(e) 41 80 102 78 49 11 3 0 0 364 Total 111 346 553 559 406 178 58 31 8 2,250
Level of education inadequately described 5 18 34 58 48 43 14 20 4 244 Level of education not stated 228 128 210 301 314 338 404 437 158 2,518
Total 350 717 1,623 1,649 1,474 936 627 543 194 8,113
Persons Postgraduate Degree 0 0 38 85 66 49 13 5 0 256
Graduate Diploma and Graduate Certificate 3 10 94 140 139 44 15 0 3 448 Bachelor Degree 0 182 784 591 540 273 105 34 16 2,525
Advanced Diploma and Diploma 6 108 357 399 511 340 124 55 16 1,916 Certificate
Certificate nfd 11 54 100 113 96 49 19 9 0 451
Certificate III & IV(d) 129 531 1,117 1,352 1,092 688 372 140 31 5,452 Certificate I & II(e) 62 107 136 99 68 20 3 5 0 500
Total 202 692 1,353 1,564 1,256 757 394 154 31 6,403 Level of education inadequately described 15 28 62 103 94 81 34 35 9 461
Level of education not stated 434 272 473 575 619 628 680 718 223 4,622
Total 660 1,292 3,161 3,457 3,225 2,172 1,365 1,001 298 16,631 Source: ABS Census 2006, Resident Population Data
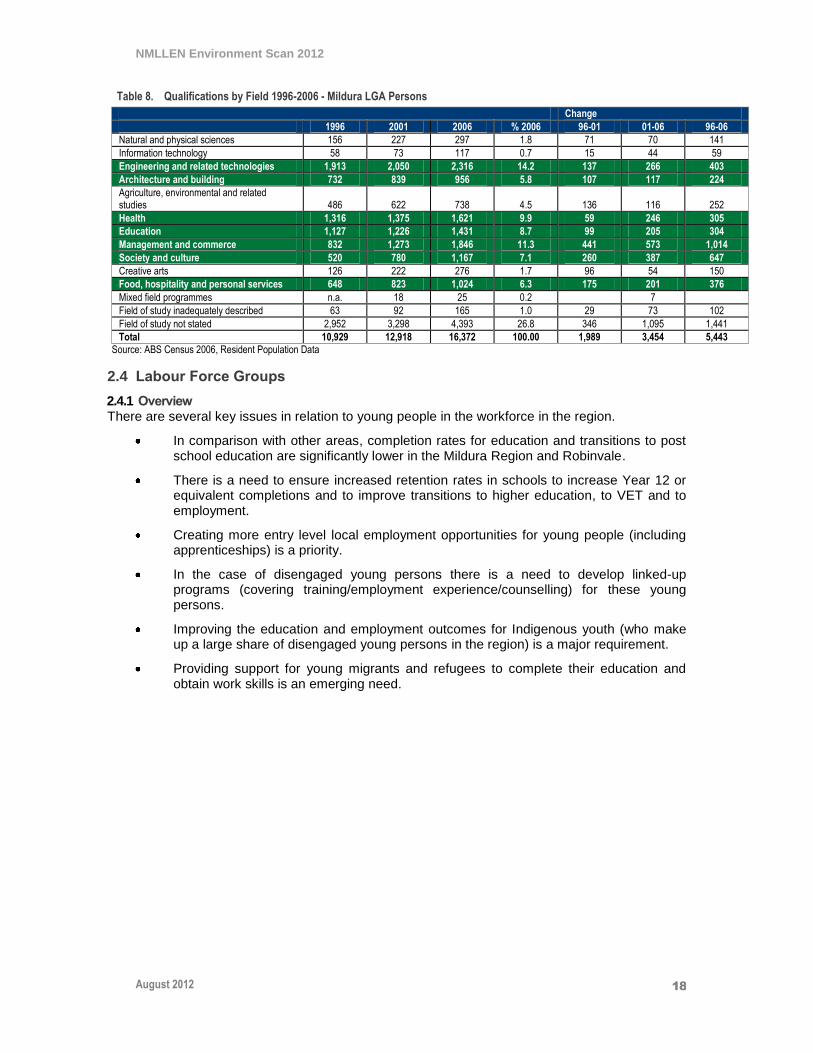
Over the decade to 2006, there has been an increase in reported qualifications. This reflects a combination of: the increase in the employed workforce; changes in the structure of the workforce; and increases in education and training activity in the region. The major qualification fields in 2006 were engineering and related technologies (2,316 persons/14%); health (1,621 persons/10%); management and commerce (1,846 persons/11%); education (1,431 persons/9%); food, hospitality and personal services (1,024 persons/6%); architecture and building (956 persons/6%).
NMLLEN Environment Scan 2012
August 2012
18
Table 8. Qualifications by Field 1996-2006 - Mildura LGA Persons
Change
1996 2001 2006 % 2006 96-01 01-06 96-06
Natural and physical sciences 156 227 297 1.8 71 70 141
Information technology 58 73 117 0.7 15 44 59
Engineering and related technologies 1,913 2,050 2,316 14.2 137 266 403
Architecture and building 732 839 956 5.8 107 117 224
Agriculture, environmental and related studies 486 622 738 4.5 136 116 252
Health 1,316 1,375 1,621 9.9 59 246 305
Education 1,127 1,226 1,431 8.7 99 205 304
Management and commerce 832 1,273 1,846 11.3 441 573 1,014
Society and culture 520 780 1,167 7.1 260 387 647
Creative arts 126 222 276 1.7 96 54 150
Food, hospitality and personal services 648 823 1,024 6.3 175 201 376
Mixed field programmes n.a. 18 25 0.2 7
Field of study inadequately described 63 92 165 1.0 29 73 102
Field of study not stated 2,952 3,298 4,393 26.8 346 1,095 1,441
Total 10,929 12,918 16,372 100.00 1,989 3,454 5,443
Source: ABS Census 2006, Resident Population Data
2.4 Labour Force Groups
2.4.1 Overview There are several key issues in relation to young people in the workforce in the region.
In comparison with other areas, completion rates for education and transitions to post school education are significantly lower in the Mildura Region and Robinvale.
There is a need to ensure increased retention rates in schools to increase Year 12 or equivalent completions and to improve transitions to higher education, to VET and to employment.
Creating more entry level local employment opportunities for young people (including apprenticeships) is a priority.
In the case of disengaged young persons there is a need to develop linked-up programs (covering training/employment experience/counselling) for these young persons.
Improving the education and employment outcomes for Indigenous youth (who make up a large share of disengaged young persons in the region) is a major requirement.
Providing support for young migrants and refugees to complete their education and obtain work skills is an emerging need.

NMLLEN Environment Scan 2012
August 2012
19
2.4.2 Indigenous Youth The Mildura Region has a significant Indigenous population. The Indigenous population in the LGA is increasing and has a much younger age structure than the general population.
Table 9. Selected Medians and Averages - Mildura LGA 2011
Indigenous persons/ households with
Indigenous persons
Non-Indigenous persons/
other households Total
Median age of persons 18 40 39
Median individual income ($/weekly) 332 468 463
Median household income ($/weekly) 710 887 878
Median housing loan repayment ($/monthly) 1,218 1,268 1,268
Median rent ($/weekly) 160 175 170
Average number of persons per bedroom 1.2 1.1 1.1
Average household size 3.1 2.4 2.5
Source: ABS Census 20011, Resident Population Data, Aboriginal and Torres Strait Islander Peoples (Indigenous) Profile
Table 10. Indigenous Population by Age - Mildura LGA 2011-2010 (10)
2001 2006
2011
Age Males Females Persons Males Females Persons Males Females Persons
0-4 years 80 80 160 107 106 213 156 130 286
5-9 years 83 86 169 102 82 184 152 125 277
10-14 years 74 78 152 95 103 198 110 116 226
15-19 years 68 65 133 72 87 159 80 105 185
20-24 years 46 36 82 55 76 131 64 106 170
25-29 years 31 48 79 42 51 93 42 75 117
30-34 years 28 52 80 48 50 98 48 50 98
35-39 years 30 39 69 29 59 88 43 49 92
40-44 years 28 33 61 22 42 64 40 72 112
45-49 years 17 18 35 26 47 73 29 52 81
50-54 years 14 17 31 20 18 38 31 38 69
55-59 years 9 10 19 17 24 41 25 17 42
60-64 years 4 10 14 4 14 18 17 25 42
65 years and over 7 16 23 11 21 32 6 34 40
Total 519 588 1,107 650 780 1,430 843 994 1,837
Source: ABS Census 1996-2011, Resident Population Data, Aboriginal and Torres Strait Islander Peoples (Indigenous) Profile
ABS 2006 Census data indicates significantly higher Indigenous unemployment rates in the region and lower workforce participation compared to the rates for the total population: unemployment rate - Indigenous 22.4% and Non-Indigenous 5.4%; labour force participation rate - Indigenous 38.5% and Non-Indigenous 61.8%; and employment to population ratio - Indigenous 29.9% and Non-Indigenous 58.5%.
15
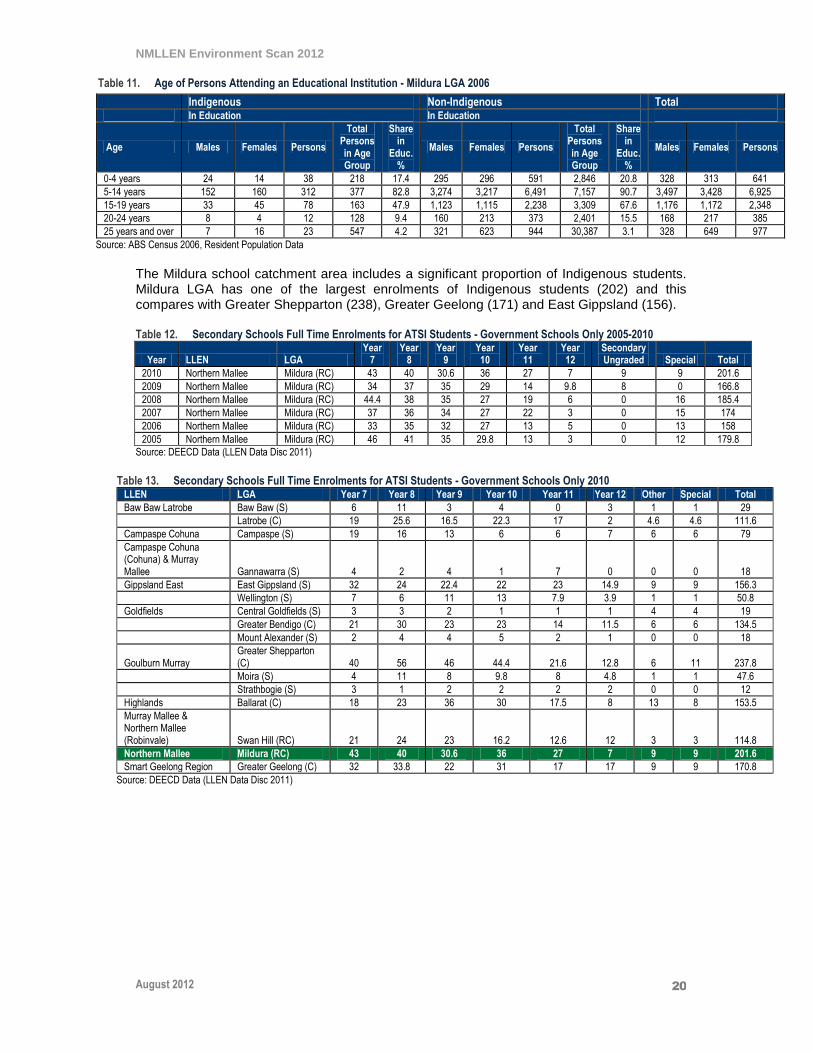
The following table shows participation in education for Indigenous and the general population. Indigenous participation in education is significantly lower for all age groups (from early learning to post school education). The lower participation rate for the 15-19 age group is indicative of disengagement from education. In 2006, 48% of Indigenous youth were in education compared with 68% of the general population. The data reflects decreasing engagement for many Indigenous students, particularly boys, as each cohort moves up through successive age levels.
16
The results of lower attendance and completions are captured in aggregate population data. In 2006 11% of the local Indigenous population reached Year 12 as the highest year of school completed, compared with 29% of the total local non-Indigenous population.
15 Australian Bureau of Statistics 2006 Census of Population and Housing, Mildura (RC) LGA 24780), Highest Year of School Completed by Indigenous Status by Sex. 16 Australian Bureau of Statistics 2006 Census of Population and Housing, Mildura (RC) LGA 24780), Highest Year of School Completed by Indigenous Status by Sex.
NMLLEN Environment Scan 2012
August 2012
20
Table 11. Age of Persons Attending an Educational Institution - Mildura LGA 2006
Indigenous Non-Indigenous Total
In Education In Education
Age Males Females Persons
Total Persons in Age Group
Share in
Educ. %
Males Females Persons
Total Persons in Age Group
Share in
Educ. %
Males Females Persons
0-4 years 24 14 38 218 17.4 295 296 591 2,846 20.8 328 313 641
5-14 years 152 160 312 377 82.8 3,274 3,217 6,491 7,157 90.7 3,497 3,428 6,925
15-19 years 33 45 78 163 47.9 1,123 1,115 2,238 3,309 67.6 1,176 1,172 2,348
20-24 years 8 4 12 128 9.4 160 213 373 2,401 15.5 168 217 385
25 years and over 7 16 23 547 4.2 321 623 944 30,387 3.1 328 649 977
Source: ABS Census 2006, Resident Population Data
The Mildura school catchment area includes a significant proportion of Indigenous students. Mildura LGA has one of the largest enrolments of Indigenous students (202) and this compares with Greater Shepparton (238), Greater Geelong (171) and East Gippsland (156). Table 12. Secondary Schools Full Time Enrolments for ATSI Students - Government Schools Only 2005-2010
Year LLEN LGA Year
7 Year
8 Year
9 Year 10
Year 11
Year 12
Secondary Ungraded Special Total
2010 Northern Mallee Mildura (RC) 43 40 30.6 36 27 7 9 9 201.6
2009 Northern Mallee Mildura (RC) 34 37 35 29 14 9.8 8 0 166.8
2008 Northern Mallee Mildura (RC) 44.4 38 35 27 19 6 0 16 185.4
2007 Northern Mallee Mildura (RC) 37 36 34 27 22 3 0 15 174
2006 Northern Mallee Mildura (RC) 33 35 32 27 13 5 0 13 158
2005 Northern Mallee Mildura (RC) 46 41 35 29.8 13 3 0 12 179.8
Source: DEECD Data (LLEN Data Disc 2011)
Table 13. Secondary Schools Full Time Enrolments for ATSI Students - Government Schools Only 2010
LLEN LGA Year 7 Year 8 Year 9 Year 10 Year 11 Year 12 Other Special Total
Baw Baw Latrobe Baw Baw (S) 6 11 3 4 0 3 1 1 29
Latrobe (C) 19 25.6 16.5 22.3 17 2 4.6 4.6 111.6
Campaspe Cohuna Campaspe (S) 19 16 13 6 6 7 6 6 79
Campaspe Cohuna (Cohuna) & Murray Mallee Gannawarra (S) 4 2 4 1 7 0 0 0 18
Gippsland East East Gippsland (S) 32 24 22.4 22 23 14.9 9 9 156.3
Wellington (S) 7 6 11 13 7.9 3.9 1 1 50.8
Goldfields Central Goldfields (S) 3 3 2 1 1 1 4 4 19
Greater Bendigo (C) 21 30 23 23 14 11.5 6 6 134.5
Mount Alexander (S) 2 4 4 5 2 1 0 0 18
Goulburn Murray Greater Shepparton (C) 40 56 46 44.4 21.6 12.8 6 11 237.8
Moira (S) 4 11 8 9.8 8 4.8 1 1 47.6
Strathbogie (S) 3 1 2 2 2 2 0 0 12
Highlands Ballarat (C) 18 23 36 30 17.5 8 13 8 153.5
Murray Mallee & Northern Mallee (Robinvale) Swan Hill (RC) 21 24 23 16.2 12.6 12 3 3 114.8
Northern Mallee Mildura (RC) 43 40 30.6 36 27 7 9 9 201.6
Smart Geelong Region Greater Geelong (C) 32 33.8 22 31 17 17 9 9 170.8
Source: DEECD Data (LLEN Data Disc 2011)
NMLLEN Environment Scan 2012
August 2012
21
2.4.3 Disengaged Youth Disengaged youth is a major issue in the region, with many of these persons being Indigenous youth. These are young people who have left school early and who are not in employment. They often have few employment skills, low levels of literacy and numeracy and other social problems. These individuals have disconnected with traditional education and training. Estimates from agencies in the area have this group at around 200 persons at any time (including males and young mothers).
Skills development for this group requires a high level of intervention and a linked-up approach covering counselling, training and work experience. This is a recognised priority of NMLLEN and organisations, including DEECD, MADEC, Mallee Family Care and Mildura Rural City Council. A pilot program for a FLO Model approach, to assist young people who are at risk from disengaging from education through a tailored case management approach, is currently in progress through the Northern Mallee Youth Partnerships Project.
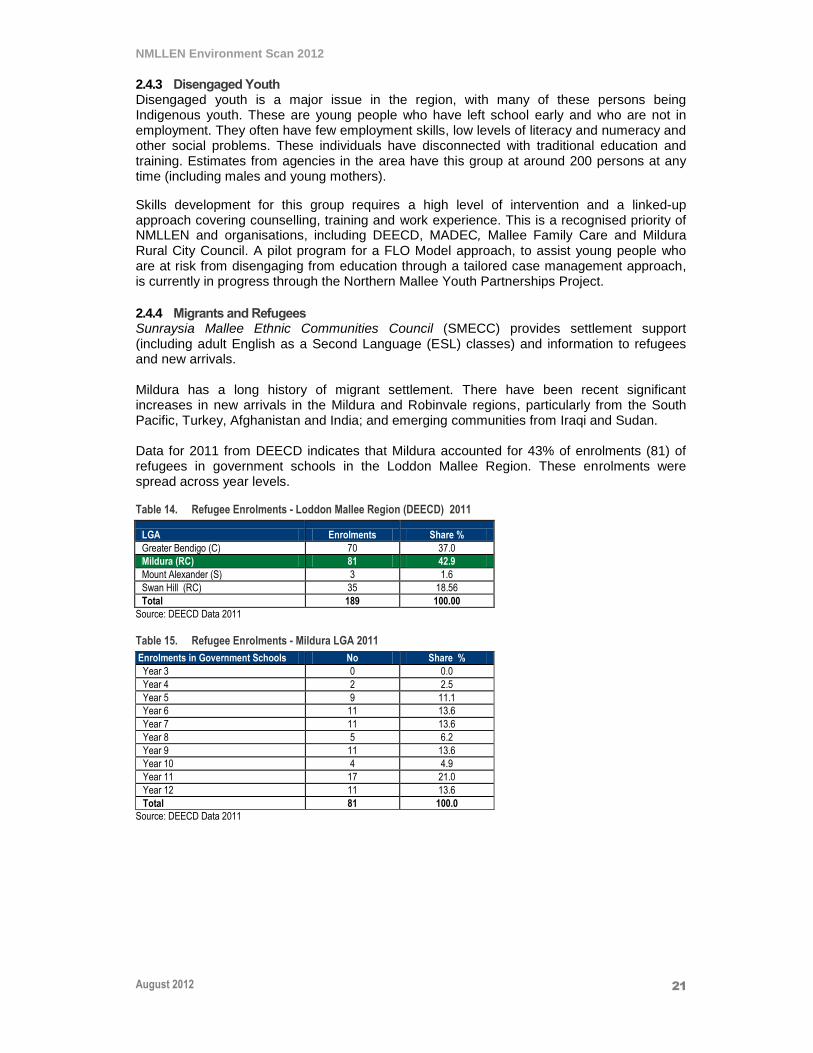
2.4.4 Migrants and Refugees Sunraysia Mallee Ethnic Communities Council (SMECC) provides settlement support (including adult English as a Second Language (ESL) classes) and information to refugees and new arrivals. Mildura has a long history of migrant settlement. There have been recent significant increases in new arrivals in the Mildura and Robinvale regions, particularly from the South Pacific, Turkey, Afghanistan and India; and emerging communities from Iraqi and Sudan. Data for 2011 from DEECD indicates that Mildura accounted for 43% of enrolments (81) of refugees in government schools in the Loddon Mallee Region. These enrolments were spread across year levels.
Table 14. Refugee Enrolments - Loddon Mallee Region (DEECD) 2011
LGA Enrolments Share %
Greater Bendigo (C) 70 37.0
Mildura (RC) 81 42.9
Mount Alexander (S) 3 1.6
Swan Hill (RC) 35 18.56
Total 189 100.00
Source: DEECD Data 2011
Table 15. Refugee Enrolments - Mildura LGA 2011
Enrolments in Government Schools No Share %
Year 3 0 0.0
Year 4 2 2.5
Year 5 9 11.1
Year 6 11 13.6
Year 7 11 13.6
Year 8 5 6.2
Year 9 11 13.6
Year 10 4 4.9
Year 11 17 21.0
Year 12 11 13.6
Total 81 100.0
Source: DEECD Data 2011

NMLLEN Environment Scan 2012
August 2012
22
2.5 Robinvale Area
Robinvale is part of the NMLLEN Region. It has an agribusiness based local economy and a significant Indigenous and migrant population.
2.5.1 Population Robinvale is in the Swan Hill Rural City LGA. It is 84 km from Mildura, and 137 km from Swan Hill. Given the proximity to Mildura, most residents come to Mildura to shop and to access business and professional services. In 2011 the Robinvale Statistical Local Area had a population of around 3747 (including an Indigenous population of 296). The Census data is likely to underestimate the population due to seasonal nature of agricultural work and the Indigenous and migrant mix in the area. The long term population projections show a marginal decrease in the period to 2026.
Table 16. Population by Sex - Robinvale (SLA) 2011
Males Females Persons
Indigenous:
Aboriginal 110 154 264
Torres Strait Islander 7 8 15
Both Aboriginal and Torres Strait Islander(a) 6 11 17
Total 123 173 296
Non-Indigenous 1,652 1,468 3,120
Indigenous status not stated 163 168 331
Total Population 1,938 1,809 3,747
Source: ABS Census 2011, Resident Population Data, Aboriginal and Torres Strait Islander Peoples (Indigenous) Profile
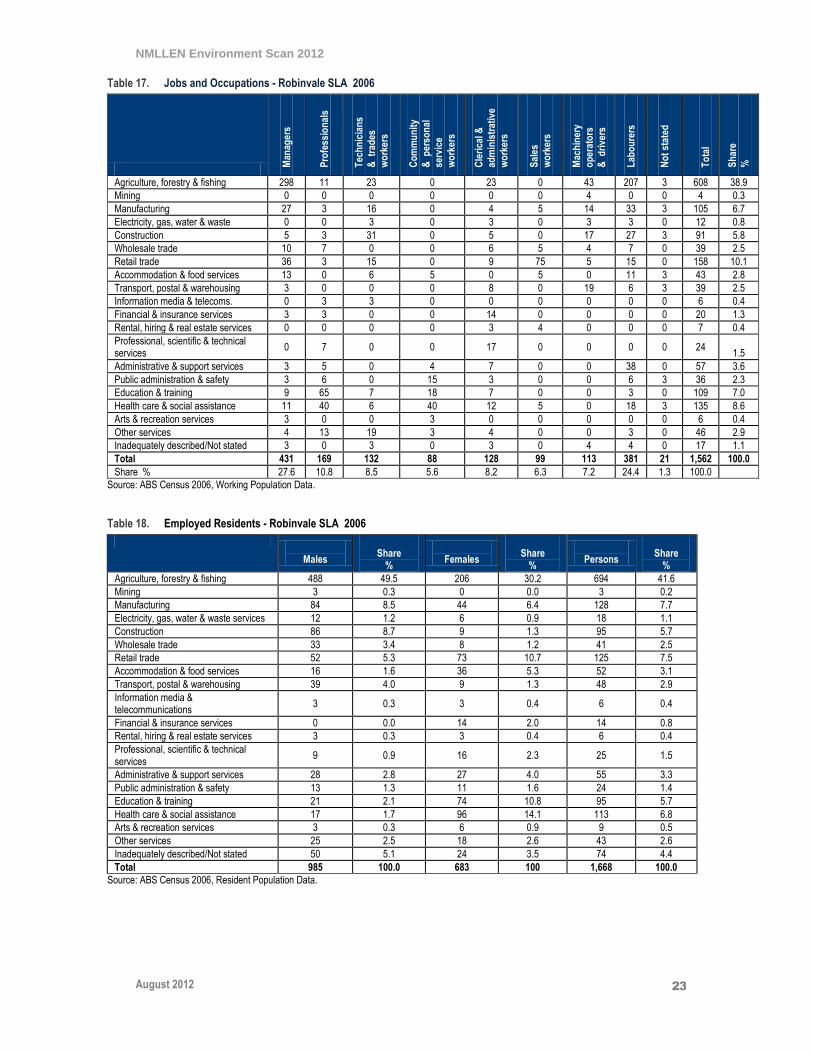
2.5.2 Industry and Jobs Robinvale is mainly a horticulture area, with a focus on table grapes and some wine grape plantings. There are also plantings of olives and almond crops (located between Robinvale and Swan Hill and around Wemen). Reflecting this horticulture base of the 1,562 jobs located in Robinvale in 2006, almost 40% of these jobs were in agriculture (608). The other major concentrations were in services for the population: retail (10%); health and social assistance (9%); education and training (7%); and construction 6%.
NMLLEN Environment Scan 2012
August 2012
23
Table 17. Jobs and Occupations - Robinvale SLA 2006
Man
ager
s
Pro
fess
ion
als
Tec
hn
icia
ns
& t
rad
es
wo
rker
s
Co
mm
un
ity
& p
erso
nal
se
rvic
e
wo
rker
s
Cle
rica
l &
adm
inis
trat
ive
wo
rker
s
Sal
es
wo
rker
s
Mac
hin
ery
op
erat
ors
&
dri
vers
Lab
ou
rers
No
t st
ated
To
tal
Sh
are
%
Agriculture, forestry & fishing 298 11 23 0 23 0 43 207 3 608 38.9
Mining 0 0 0 0 0 0 4 0 0 4 0.3
Manufacturing 27 3 16 0 4 5 14 33 3 105 6.7
Electricity, gas, water & waste 0 0 3 0 3 0 3 3 0 12 0.8
Construction 5 3 31 0 5 0 17 27 3 91 5.8
Wholesale trade 10 7 0 0 6 5 4 7 0 39 2.5
Retail trade 36 3 15 0 9 75 5 15 0 158 10.1
Accommodation & food services 13 0 6 5 0 5 0 11 3 43 2.8
Transport, postal & warehousing 3 0 0 0 8 0 19 6 3 39 2.5
Information media & telecoms. 0 3 3 0 0 0 0 0 0 6 0.4
Financial & insurance services 3 3 0 0 14 0 0 0 0 20 1.3
Rental, hiring & real estate services 0 0 0 0 3 4 0 0 0 7 0.4
Professional, scientific & technical services
0 7 0 0 17 0 0 0 0 24 1.5
Administrative & support services 3 5 0 4 7 0 0 38 0 57 3.6
Public administration & safety 3 6 0 15 3 0 0 6 3 36 2.3
Education & training 9 65 7 18 7 0 0 3 0 109 7.0
Health care & social assistance 11 40 6 40 12 5 0 18 3 135 8.6
Arts & recreation services 3 0 0 3 0 0 0 0 0 6 0.4
Other services 4 13 19 3 4 0 0 3 0 46 2.9
Inadequately described/Not stated 3 0 3 0 3 0 4 4 0 17 1.1
Total 431 169 132 88 128 99 113 381 21 1,562 100.0
Share % 27.6 10.8 8.5 5.6 8.2 6.3 7.2 24.4 1.3 100.0
Source: ABS Census 2006, Working Population Data.
Table 18. Employed Residents - Robinvale SLA 2006
Males
Share
%
Females
Share
%
Persons
Share
%
Agriculture, forestry & fishing 488 49.5 206 30.2 694 41.6
Mining 3 0.3 0 0.0 3 0.2
Manufacturing 84 8.5 44 6.4 128 7.7
Electricity, gas, water & waste services 12 1.2 6 0.9 18 1.1
Construction 86 8.7 9 1.3 95 5.7
Wholesale trade 33 3.4 8 1.2 41 2.5
Retail trade 52 5.3 73 10.7 125 7.5
Accommodation & food services 16 1.6 36 5.3 52 3.1
Transport, postal & warehousing 39 4.0 9 1.3 48 2.9
Information media & telecommunications
3 0.3 3 0.4 6 0.4
Financial & insurance services 0 0.0 14 2.0 14 0.8
Rental, hiring & real estate services 3 0.3 3 0.4 6 0.4
Professional, scientific & technical services
9 0.9 16 2.3 25 1.5
Administrative & support services 28 2.8 27 4.0 55 3.3
Public administration & safety 13 1.3 11 1.6 24 1.4
Education & training 21 2.1 74 10.8 95 5.7
Health care & social assistance 17 1.7 96 14.1 113 6.8
Arts & recreation services 3 0.3 6 0.9 9 0.5
Other services 25 2.5 18 2.6 43 2.6
Inadequately described/Not stated 50 5.1 24 3.5 74 4.4
Total 985 100.0 683 100 1,668 100.0
Source: ABS Census 2006, Resident Population Data.

NMLLEN Environment Scan 2012
August 2012
24
3 Industry Profile
3.1 Overview
The Mildura Region has a diverse economy. Key sectors in the regional economy include agriculture, food processing, manufacturing, construction and tourism. With its regional role and population size, Mildura is a major centre for health services, retail and business services.
The region is an irrigation-based horticultural area, with dry land cropping located in the outer areas. Irrigated agriculture in the area produces: approximately 20% of Australia's total wine grape crush; 20% of citrus production; and around 95% of Australia's dried vine fruit production. There is a range of linked support industries in packaging, transport, engineering and technical services located in the area. Due to its specialised horticultural base, the Mildura Region has become a service hub for the wine regions of the Barossa, Clare and MIA. This covers services including: viticultural services; vine nurseries; irrigation services; contract processing; wine tank manufacture and engineering; bottling and packing; warehousing; and transport and logistics.
As a major regional centre, Mildura has a significant service sector covering health, education, professional services and retail. This regional service role has extended, with population growth driving an expansion in retail and other services.
Mildura has also developed as a tourism destination based on climate, river proximity and food and wine. Major emerging industries in the area are solar power and mineral sands mining.
Ensuring a skilled workforce for key industries is a major issue for the region. Workforce development and skills issues for the wine, olive and beverage processing sectors have been examined in a recent report.
17 Meeting future skills needs will involve the recruitment and
training of young persons in skilled trades occupations and in professional occupations.
The projects, involving NMLLEN including the Mildura Region Trade Training Centre and the Workplace
Learning Coordinator Program are directed at providing education and work opportunities for young people,
which meet long term industry requirements.
3.2 Industry Structure and Trends
3.2.1 Businesses in the Region There were a total of 5,267 businesses in Mildura LGA with 2,373 being employing businesses (2,894 were non-employing). Of the 2,373 employing businesses:
877 (37%) were in agriculture; 274 (12%) were in construction; and 238 (10%) were in retail.
Half of these businesses employed between one and four persons (1,193 businesses) and 37% employed between 5-19 employees (877 businesses).
Only 93 businesses employed more than 50 persons and 210 employed between
20 and 49 persons.
The larger businesses (50+ employees) were concentrated in: agriculture (36);
manufacturing (12); accommodation and food services (9); administrative and
support services (12).
17 A Workforce Development Strategy for the Mildura Wine, Olive and Beverage Industries, Mildura Development Corporation, December 2009

NMLLEN Environment Scan 2012
August 2012
25
Medium sized businesses (20-49 employees) were focused in agriculture (87);
retail (30); accommodation and food services (24); rental, hiring and real estate
services (12); and wholesale trade (12).
As Mildura is a major regional business centre there are a significant number of medium sized businesses
and larger businesses. This business base provides a foundation for developing work placements for
students and the potential to develop school based apprenticeships. An increase in business participation in
work placements will be needed to support the operations of the Mildura Region Trade Training Centre.
Table 19. Businesses by Industry and Employment Size June 2009 - Mildura LGA
Industry N
on
emp
loyi
ng
1-4
5-19
20-4
9
50-9
9
100-
199
200+
To
tal
Bu
sin
esse
s
Em
plo
yin
g
Bu
sin
esse
s
Sh
are
%
A Agriculture, Forestry and Fishing 995 373 381 87 24 9 3 1,872 877 37.0
B Mining 6 0 3 0 0 0 0 9 3 0.1
C Manufacturing 78 30 24 9 12 0 0 153 75 3.2
D Electricity, Gas, Water and Waste Services 6 9 0 0 0 0 0 15 9 0.4
E Construction 405 185 77 6 3 3 0 679 274 11.5
F Wholesale Trade 39 30 36 12 6 0 0 123 84 3.5
G Retail Trade 132 117 88 30 3 0 0 370 238 10.0
H Accommodation and Food Services 51 55 62 24 6 3 0 201 150 6.3
I Transport, Postal and Warehousing 127 79 30 3 0 0 0 239 112 4.7
J Information Media and Telecoms 3 3 0 0 0 3 0 9 6 0.3
K Financial and Insurance Services 204 27 9 0 0 0 0 240 36 1.5
L Rental, Hiring and Real Estate Services 405 30 21 12 3 0 0 471 66 2.8
M Prof., Scientific and Technical Services 131 72 46 6 0 0 0 255 124 5.2
N Administrative and Support Services 52 33 30 6 9 3 0 133 81 3.4
O Public Administration and Safety 9 6 0 3 0 0 0 18 9 0.4
P Education and Training 24 3 6 6 0 0 0 39 15 0.6
Q Health Care and Social Assistance 84 53 21 6 0 3 0 167 83 3.5
R Arts and Recreation Services 33 12 15 0 0 0 0 60 27 1.1
S Other Services 110 76 28 0 0 0 0 214 104 4.4
Total 2,894 1,193 877 210 66 24 3 5,267 2,373 100.0
Share % 50.3 37.0 8.8 2.8 1.0 0.1 100.0
Source: ABS Business Register Data 2009
There are 395 businesses in Robinvale, with 203 being employing businesses. Most local businesses are small businesses (84 with 1-4 employees and 86 with 5-19 employees). There were only 30 businesses employing 20-49 persons (with most of these in agriculture - 24). Only three businesses (all in agriculture) employed 50-99 employees.

NMLLEN Environment Scan 2012
August 2012
26
Table 20. Businesses by Industry and Employment Size June 2009 - Robinvale SLA
Industry
No
n
emp
loyi
ng
1-4
5-19
20-4
9
50-9
9
100-
199
200+
To
tal
Em
plo
yin
g
Bu
sin
esse
s
Sh
are
%
A Agriculture, Forestry and Fishing 93 33 62 24 3 0 0 215 122 60.1
B Mining 0 0 0 0 0 0 0 0 0 0.0
C Manufacturing 3 6 0 0 0 0 0 9 6 3.0
D Electricity, Gas, Water and Waste Services 0 0 0 0 0 0 0 0 0 0.0
E Construction 12 15 3 0 0 0 0 30 18 8.9
F Wholesale Trade 0 6 3 0 0 0 0 9 9 4.4
G Retail Trade 18 3 6 0 0 0 0 27 9 4.4
H Accommodation and Food Services 6 6 3 0 0 0 0 15 9 4.4
I Transport, Postal and Warehousing 12 0 0 3 0 0 0 15 3 1.5
J Information Media and Telecoms 3 0 0 0 0 0 0 3 0 0.0
K Financial and Insurance Services 9 0 0 0 0 0 0 9 0 0.0
L Rental, Hiring and Real Estate Services 12 0 3 0 0 0 0 15 3 1.5
M Professional Scientific and Technical Services 6 3 3 0 0 0 0 12 6 3.0
N Administrative and Support Services 6 3 0 3 0 0 0 12 6 3.0
Q Health Care and Social Assistance 0 0 0 0 0 0 0 0 0 0.0
R Arts and Recreation Services 0 0 0 0 0 0 0 0 0 0.0
S Other Services 12 9 3 0 0 0 0 24 12 5.9
Total 192 84 86 30 3 0 0 395 203 100.0
Share % 94.6 41.4 42.4 14.8 1.5 0.0 0.0 100.0
Source: ABS Business Register Data 2009
3.2.2 Jobs in the Region In 2006 there were a total of 19,407 jobs in the Mildura LGA. Of these 16,660 were private sector jobs and 2,747 jobs were in the government sector. Over 2,000 of these jobs were in the State Government (including education and health), 396 in Local Government and 310 in Commonwealth Government.
Table 21. Government and Private Employment - Mildura LGA 2006
Man
ager
s
Pro
fess
ion
als
Tec
hn
icia
ns
& t
rad
es
wo
rker
s
Co
mm
un
ity
& p
erso
nal
se
rvic
e
wo
rker
s
Cle
rica
l &
adm
inis
trat
ive
wo
rker
s
Sal
es
wo
rker
s
Mac
hin
ery
op
erat
ors
& d
rive
rs
Lab
ou
rers
Inad
equ
atel
y
des
crib
ed/
No
t st
ated
To
tal
Commonwealth Government 21 84 38 55 93 10 0 9 0 310
State Government 115 1,121 99 349 224 10 31 83 9 2,041
Local Government 28 64 44 72 96 5 41 46 0 396
Total Government 164 1269 181 476 413 25 72 138 9 2,747
Private Sector 3,321 1,732 2,303 1,185 2,042 2,268 1,048 2,626 135 16,660
Total 3,485 3,001 2,484 1,661 2,455 2,293 1,120 2,764 144 19,407
Source: ABS Census 2006, Working Population Data.
Of the total 19,419 jobs, 3,434 were held by owner managers and this reflects the small
business structure of the regional economy. The following table shows the local jobs held by
different age groups. In the case of young persons:
1,354 jobs (7% of all jobs) were held by persons aged 15-19 years and 1,548 (8% of all jobs) by persons aged 20-24 years.
There were 439 full time jobs held by persons aged 15-19 years and 873 part time
jobs held by this age group (this is largely students at school who are working in part
time jobs in retail or food services).
Of the 1,548 jobs held by persons aged 20-24 years, 1,087 of these were full time
and 387 were part time jobs. This full time component reflects young persons who
have gone into full time employment after completing education and training.

NMLLEN Environment Scan 2012
August 2012
27
The jobs held by persons in these two younger age groups tend to be the entry level jobs in
industry sectors in the region.
Table 22. Job Type by Age and Sex - Mildura LGA 2006
Employee not
owning business
Owner managers of incorporated enterprises
Owner managers of
unincorporated enterprises
Contributing family
workers
Employment type not stated Total
Employed, worked full time
15-19 years 439 0 3 6 3 451
20-24 years 1,087 12 28 9 4 1,140
25-29 years 1,140 26 69 18 12 1,265
30-34 years 1,100 82 113 24 7 1,326
35-39 years 1,112 143 146 58 4 1,463
40-44 years 1,145 163 225 74 6 1,613
45-49 years 1,288 211 256 80 11 1,846
50-54 years 1,071 180 250 70 8 1,579
55-59 years 711 143 206 61 3 1,124
60-64 years 264 69 111 49 0 493
65-69 years 58 26 58 36 0 178
70-74 years 9 9 17 14 0 49
75 years and over 8 8 19 18 0 53
Total 9,432 1,072 1,501 517 58 12,580
Employed, worked part time
15-19 years 873 3 9 10 8 903
20-24 years 387 0 18 0 3 408
25-29 years 309 12 17 5 0 343
30-34 years 465 14 48 15 3 545
35-39 years 567 39 49 43 9 707
40-44 years 601 40 58 28 3 730
45-49 years 573 30 58 29 3 693
50-54 years 408 26 46 20 5 505
55-59 years 341 40 61 38 4 484
60-64 years 197 18 47 36 6 304
65-69 years 70 13 31 17 0 131
70-74 years 22 3 11 11 0 47
75 years and over 20 6 15 11 0 52
Total 4,833 244 468 263 44 5,852
Employed, away from work(b) 518 33 61 29 10 651
Hours worked not stated 238 18 37 34 9 336
Total 15,021 1,367 2,067 843 121 19,419
Source: ABS Census 2006, Working Population Data. <Persons aged 15 year and over>
Major sectors of employment in Mildura LGA were:
Agriculture (2,482 jobs/13%), manufacturing (2,024 jobs/10%) and transport (772
jobs/4%), reflecting agribusiness activity (growing, processing, distribution) in the
region.
Retail (2,890 jobs/15%), health care and social assistance (2,104 jobs/11%),
education and training (1,630 jobs/8%) reflecting population size and Mildura’s role
as a regional service centre.
Accommodation and food services accounted for 1,281 jobs (7%), reflecting both the tourism sector and the servicing of the regional population.

NMLLEN Environment Scan 2012
August 2012
28
Table 23. Jobs by Industry and Occupation - Mildura LGA 2006 Persons
Man
ager
s
Pro
fess
ion
als
Tec
hn
icia
ns
& t
rad
es
wo
rker
s
Co
mm
un
ity
& p
erso
nal
se
rvic
e
wo
rker
s
Cle
rica
l &
Ad
min
wo
rker
s
Sal
es
wo
rker
s
Mac
hin
ery
op
erat
ors
& d
rive
rs
Lab
ou
rers
No
t st
ated
To
tal
Sh
are
(%)
Agriculture, forestry & fishing 1,581 33 72 4 80 15 47 634 16 2,482 12.8
Mining 4 11 5 0 6 0 9 7 0 42 0.2
Manufacturing 324 102 483 15 197 96 239 537 31 2,024 10.4
Electricity, gas, water & waste services
30 23 70 0 38 3 38 37 3 242 1.2
Construction 109 26 504 3 129 14 73 141 9 1,008 5.2
Wholesale trade 140 32 80 3 118 136 81 108 12 710 3.7
Retail trade 455 56 249 30 184 1,568 60 274 14 2,890 14.9
Accommodation & food services
233 12 132 275 62 190 26 343 8 1,281 6.6
Transport, postal & warehousing 81 14 37 7 165 37 391 36 4 772 4.0
Information media & telecommunications
23 49 69 0 33 25 3 10 3 215 1.1
Financial & insurance services 65 78 5 0 249 24 0 4 5 430 2.2
Rental, hiring & real estate services
27 16 7 0 47 113 4 8 3 225 1.2
Professional, scientific & technical services
40 308 97 0 224 14 5 19 0 707 3.6
Administrative & support services
65 98 57 38 94 3 52 294 3 704 3.6
Public administration & safety 63 177 64 299 239 14 42 68 8 974 5.0
Education & training 90 1,060 46 245 141 4 7 34 3 1,630 8.4
Health care & social assistance
74 838 76 647 327 3 11 116 12 2,104 10.8
Arts & recreation services 20 29 21 41 20 12 0 12 3 158 0.8
Other services 28 33 390 49 58 16 6 38 0 618 3.2
Inadequately described/Not stated
35 9 23 3 46 6 23 45 13 203 1.0
Total 3,487 3,004 2,487 1,659 2,457 2,293 1,117 2,765 150 19,419 100.0
Share (%) 18.0 15.5 12.8 8.5 12.7 11.8 5.8 14.2 0.8 100.0
Source: ABS Census 2006, Working Population Data. <Persons aged 15 year and over>
There is a division in jobs on a gender basis.
Males (9,982 jobs) mainly held the jobs in agriculture (1,751/17%); manufacturing (1,477/15%); construction (842/8%); retail (1,166/12%); transport (608/6%); and government (477/5%).
Females (9,438 jobs) mainly held the jobs in health care and social assistance (1,721/18%); retail (1,725/18%); education and training (1,170/12%); and accommodation and food services (810/9%).
Males are more likely to be in managerial jobs (24%); technicians and trades workers (20%); labourers (16%); or machinery operators and drivers (11%) jobs.
Females are concentrated in professional jobs (20%-mainly in health and education); clerical and administrative workers (21%); or sales (16%) jobs.
The jobs held by males were more likely to be full time (35 hours+), with 80% of jobs in this category (8,007). In the case of the jobs in the region held by females, only 48% of these were full time (4,577). Full details of jobs by industry sector are provided in the following table.

NMLLEN Environment Scan 2012
August 2012
29
Table 24. Jobs by Industry - Mildura LGA 2006 Males Females Persons Males Females Persons
Agriculture, forestry and fishing Electricity, gas, water and waste services
Agriculture, forestry and fishing, nfd 0 0 0 Electricity, gas, water and waste services, nfd
0 0 0
Agriculture 1,655 700 2,355 Electricity supply 41 0 41
Aquaculture 0 0 0 Gas supply 0 0 0
Forestry and logging 0 0 0 Water supply, sewerage and drainage services
140 35 175
Fishing, hunting and trapping 0 0 0 Waste collection, treatment and disposal services
20 8 28
Agriculture, forestry and fishing support services
96 27 123 Total 201 43 244
Total 1,751 727 2,478 Construction
Mining Construction, nfd 18 3 21
Mining, nfd 9 0 9 Building construction 228 63 291
Coal mining 0 0 0 Heavy and civil engineering construction
58 11 69
Oil and gas extraction 0 0 0 Construction services 538 91 629
Metal ore mining 9 11 20 Total 842 168 1,010
Non-metallic mineral mining and quarrying
8 4 12 Wholesale trade
Exploration and other mining support services
0 0 0 Wholesale trade, nfd
15 15 30
Total 26 15 41 Basic material wholesaling 103 52 155
Manufacturing Machinery and equipment wholesaling
119 26 145
Manufacturing, nfd 108 29 137 Motor vehicle and motor vehicle parts wholesaling
55 10 65
Food product manufacturing 296 182 478 Grocery, liquor and tobacco product wholesaling
150 102 252
Beverage and tobacco product manufacturing
508 217 725 Other goods wholesaling
23 21 44
Textile, leather, clothing and footwear manufacturing
7 17 24 Commission-based wholesaling
18 0 18
Wood product manufacturing 62 11 73 Total 483 226 709
Pulp, paper and converted paper product manufacturing
15 7 22 Retail trade
Printing (including the reproduction of recorded media)
37 19 56 Retail trade, nfd
57 64 121
Petroleum and coal product manufacturing 4 0 4 Motor vehicle and motor vehicle parts retailing
194 53 247
Basic chemical and chemical product manufacturing
26 4 30 Fuel retailing
53 42 95
Polymer product and rubber product manufacturing
45 0 45 Food retailing
350 546 896
Non-metallic mineral product manufacturing
69 5 74 Other store-based retailing
512 1,020 1,532
Primary metal and metal product manufacturing
34 7 41 Non-store retailing and retail commission-based buying and/or selling
0 0 0
Fabricated metal product manufacturing 75 13 88 Total 1,166 1,725 2,891
Transport equipment manufacturing 50 6 56
Machinery and equipment manufacturing 108 21 129
Furniture and other manufacturing 33 12 45
Total 1,477 550 2,027
Source: ABS Census 2006, Working Population Data. <Persons aged 15 years and over>

NMLLEN Environment Scan 2012
August 2012
30
Jobs by Industry - Mildura LGA 2006
Males Females Persons Males Females Persons
Accommodation and food services Rental, hiring and real estate services
Accommodation and food services, nfd
0 0 0 Rental, hiring and real estate services, nfd
0 0 0
Accommodation 120 254 374 Rental and hiring services (except real estate)
42 21 63
Food and beverage services 350 556 906 Property operators and real estate services
68 92 160
Total 470 810 1,280 Total 110 113 223
Transport, postal and warehousing Professional, scientific and technical services
Transport, postal and warehousing, nfd
4 0 4 Professional, scientific and technical services, nfd
3 0 3
Road transport 459 93 552 Professional, scientific and technical services (except
Rail transport 17 0 17
computer system design and related services)
309 361 670
Water transport 0 0 0
Computer system design and related services
24 10 34
Air and space transport 26 8 34 Total 336 371 707
Other transport 3 0 3 Administrative and support services
Postal and courier pick-up and delivery services
48 52 100 Administrative and support services, nfd 0 0 0
Transport support services 21 7 28 Administrative services 122 160 282
Warehousing and storage services 30 5 35
Building cleaning, pest control and other support services
220 204 424
Total 608 165 773 Total 342 364 706
Information media and telecommunications Public administration and safety
Information media and telecommunications, nfd
0 4 4 Public administration and safety, nfd 0 0 0
Publishing (except internet and music publishing)
41 38 79 Public administration
300 436 736
Motion picture and sound recording activities
10 7 17 Defence
0 0 0
Broadcasting (except internet) 23 15 38 Public order, safety and regulatory services
177 58 235
Internet publishing and broadcasting 0 0 0 Total 477 494 971
Telecommunications services 55 12 67 Education and training
Internet service providers, web search portals and data processing services
3 3 6 Education and training, nfd
3 6 9
Library and other information services
0 4 4 Preschool and school education
332 968 1,300
Total 132 83 215 Tertiary education 84 130 214
Financial and insurance services Adult, community and other education 40 66 106
Financial and insurance services, nfd 0 6 6 Total 459 1,170 1,629
Finance 75 173 248 Health care and social assistance
Insurance and superannuation funds 29 54 83 Health care and social assistance, nfd 8 40 48
Auxiliary finance and insurance services
51 44 95 Hospitals
107 500 607
Total 155 277 432 Medical and other health care services 162 495 657
Arts and recreation services Residential care services 38 280 318
Arts and recreation services, nfd 3 3 6 Social assistance services 70 406 476
Heritage activities 21 14 35 Total 385 1,721 2,106
Creative &performing arts activities 6 9 15 Other services
Sports and recreation activities 50 49 99 Other services, nfd 0 0 0
Gambling activities 0 5 5 Repair and maintenance 300 56 356
Total 80 80 160 Personal and other services 67 195 262
Inadequately described Total 367 254 621
Inadequately described 112 72 184 Total All Jobs 9,982 9,438 19,420
Source: ABS Census 2006, Working Population Data. <Persons aged 15 year and over>

NMLLEN Environment Scan 2012
August 2012
31
3.2.3 Occupations The following table shows details of jobs by occupations, with the major groups being: farm managers (1,727); education professionals (1,024); and health professionals (775). Tradespersons were mainly automotive and engineering trades (655) and construction trades (408). Community and personal service workers were carers (758) and health support workers (258). Labourers were mainly factory process workers (775) and farm workers (725).
Table 25. Jobs by Occupation - Mildura LGA 2006
Males Females Persons Males Females Persons
Managers Clerical and administrative workers
Managers nfd 42 6 48 Clerical and administrative workers nfd 3 4 7
Chief executives, general managers and legislators
103 22 125 Office managers and program administrators
60 256 316
Farmers and farm managers 1,273 454 1,727 Personal assistants and secretaries 4 202 206
Specialist managers 489 208 697 General clerical workers 49 425 474
Hospitality, retail and service managers 480 410 890 Inquiry clerks and receptionists 22 386 408
Total 2,387 1,100 3,487 Numerical clerks 95 520 615
Professionals Clerical and office support workers 76 70 146
Professionals nfd 3 14 17 Other clerical and administrative workers
128 158 286
Arts and media professionals 31 23 54 Total 437 2,021 2,458
Business, human resource and marketing professionals
278 238 516 Sales workers
Design, engineering, science and transport professionals
239 96 335 Sales workers nfd
3 3 6
Education professionals 307 717 1,024 Sales representatives and agents 187 102 289
Health professionals 156 619 775 Sales assistants and salespersons 547 1,206 1,753
Information and Communication Technology (ICT)professionals
32 4 36 Sales support workers
62 185 247
Legal, social and welfare professionals 96 149 245 Total 799 1,496 2,295
Total 1,142 1,860 3,002 Machinery operators and drivers
Technicians and trades workers Machinery operators and drivers nfd 17 0 17
Technicians and trades workers nfd 40 0 40 Machine and stationary plant operators 153 25 178
Engineering, ICT and science technicians
162 125 287 Mobile plant operators
278 8 286
Automotive and engineering trades workers
645 10 655 Road and rail drivers
480 32 512
Construction trades workers 399 9 408 Store persons 117 9 126
Electro technology and telecommunications trades workers
315 0 315 Total 1,045 74 1,119
Food trades workers 189 92 281 Labourers
Skilled animal and horticultural workers 117 56 173 Labourers nfd 40 9 49
Other technicians and trades workers 155 173 328 Cleaners and laundry workers 124 293 417
Total 2,022 465 2,487 Construction and mining labourers 180 3 183
Community and personal service workers Factory process workers 410 365 775
Community and personal service workers nfd
0 0 0 Farm, forestry and garden workers
535 190 725
Health and welfare support workers 74 184 258 Food preparation assistants 116 143 259
Carers and aides 67 691 758 Other labourers 245 112 357
Hospitality workers 65 238 303 Total 1,650 1,115 2,765
Protective service workers 156 37 193
Sports and personal service workers 42 107 149 Inadequately described 71 32 103
Total 404 1,257 1,661
Not stated 24 18 42
Total All Jobs 9,981 9,438 19,419
Source: ABS Census 2006, Working Population Data. <Persons aged 15 year and over>

NMLLEN Environment Scan 2012
August 2012
32
3.2.4 Employment Trends
Jobs in the Region In the period 2001-2006 there was a net increase of 652 jobs in the region (from 18,768 to 19,420). This was made up of a net decline in jobs held by males (-138) and an increase in jobs held by females (+790). The major drivers of this result were: a decline in jobs in the more male intensive sectors (e.g. males in agriculture -508; wholesale trade -290); and growth in jobs in areas of the service sector that are female intensive (e.g. females in health +137, education +158) and some growth in female employment in most other areas of services.
Table 26. Jobs in Mildura LGA 2001 and 2006
Males Females Persons
Total Jobs 2006 9,982 9,438 19,420
Total Jobs 2001 10,120 8,648 18,768
Change (no) -138 790 652
Change (%) -1.4 +9.1 +3.5
Source: ABS Census 2006 and 2001, Working Population Data.
It should be noted that a comparison of all sectors is not possible due to a reclassification of industry data between 2001 and 2006 for ABS working population data. This affects direct employment comparisons for sectors including retail, food service, professional services and government employment. An examination of comparable data for the other sectors indicates growth in construction jobs (+178) and in manufacturing jobs (+179), and in transport jobs (+190) in the LGA. The number of jobs in professional services, financial services and other services was largely stable.
Jobs Held by Residents Another way of looking at job trends is data on the industry of employment of employed residents. The following table shows employed persons by industry of employment over the period 1996-2006 for the Mildura LGA. It shows that the total number of persons in employment increased by 3,357 or 18% over the period. The number of males in employment increased by 12% and there was a 26% increase in the number of females in employment. The major sectors of employment for residents that have shown significant growth were manufacturing, construction, retail, transport, government, administrative services, health, accommodation and food services. The sectors with a decline in employment were agriculture, wholesale trade, information media and telecommunications. This growth pattern reflects a combination of regional population growth, the increased regional services role played by Mildura and structural changes in agriculture and horticulture. The main trends in the employment of residents over the period 1996-2006 were:
A decline in residents employed in agriculture (-662), as consolidation occurred in the sector and a reduction in residents employed in wholesaling (-757).
Growth in manufacturing (processing), with an additional 873 residents employed in the sector and growth in residents holding transport jobs (+291).
Services saw an increase in residents employed in: retail jobs (+834); health and social assistance jobs (+434); and education and training (+398).
Residents holding construction sector jobs increased by 522, reflecting levels of activity in commercial building and in housing construction.

NMLLEN Environment Scan 2012
August 2012
33
Several of these sectors that have experienced growth are those that use the skills that the Mildura Region
Trade Training Centre is aimed at and include: construction and building trades (in construction); engineering
and electro technologies (in manufacturing, building and construction and agriculture support); and
commercial cookery and hospitality (in accommodation and food services).
Table 27. Employed Residents by Industry - Mildura LGA 1996-2006
1996 2001 2006 Change 96-2006
% Change 96-2006
Mal
es
Fem
ales
Per
son
s
Mal
es
Fem
ales
Per
son
s
Mal
es
Fem
ales
Per
son
s
Mal
es
Fem
ales
Per
son
s
Mal
es
Fem
ales
To
tal
Agriculture, forestry & fishing
2,519 1,035 3,554 2,597 1,085 3,682 2,071 821 2,892 -448 -214 -662 -17.8 -20.7 -18.6
Mining 27 12 39 82 19 101 49 13 62 22 1 23 81.5 8.3 59.0
Manufacturing 1,008 414 1,422 1,500 513 2,013 1,699 596 2,295 691 182 873 68.6 44.0 61.4
Electricity, gas, water & waste services
219 37 256 240 43 283 231 46 277 12 9 21 5.5 24.3 8.2
Construction 802 118 920 987 148 1,135 1,267 175 1,442 465 57 522 58.0 48.3 56.7
Wholesale trade 994 538 1,532 786 445 1,231 516 259 775 -478 -279 -757 -48.1 -51.9 -49.4
Retail trade 910 1,141 2,051 1,090 1,399 2,489 1,177 1,708 2,885 267 567 834 29.3 49.7 40.7
Accommodation & food services
408 653 1,061 481 797 1,278 496 873 1,369 88 220 308 21.6 33.7 29.0
Transport, postal & warehousing
555 150 705 683 165 848 814 182 996 259 32 291 46.7 21.3 41.3
Information media & telecommunications
182 139 321 157 86 243 125 84 209 -57 -55 -112 -31.3 -39.6 -34.9
Financial & insurance services
149 231 380 145 224 369 144 254 398 -5 23 18 -3.4 10.0 4.7
Rental, hiring & real estate services
98 83 181 121 106 227 114 107 221 16 24 40 16.3 28.9 22.1
Professional, scientific & technical services
296 238 534 356 313 669 346 362 708 50 124 174 16.9 52.1 32.6
Administrative & support services
200 186 386 288 293 581 423 429 852 223 243 466 111.5 130.6 120.7
Public administration & safety
510 226 736 417 303 720 559 533 1,092 49 307 356 9.6 135.8 48.4
Education & training 439 820 1,259 480 1,032 1,512 480 1,177 1,657 41 357 398 9.3 43.5 31.6
Health care & social assistance
369 1,311 1,680 341 1,570 1,911 398 1,716 2,114 29 405 434 7.9 30.9 25.8
Arts & recreation services
66 49 115 111 75 186 104 82 186 38 33 71 57.6 67.3 61.7
Other services 389 232 621 415 261 676 371 258 629 -18 26 8 -4.6 11.2 1.3
Inadequately described/Not stated
337 241 578 270 237 507 365 264 629 28 23 51 8.3 9.5 8.8
Total 10,477 7,854 18,331 11,547 9,114 20,661 11,749 9,939 21,688 1,272 2,085 3,357 12.1 26.5 18.3
Source: ABS Census 2006, Resident Population Data.

NMLLEN Environment Scan 2012
August 2012
34
Occupation Trends The data shows that there has been growth in the number of residents holding jobs in several occupation groups: professionals (+797); technicians and trades workers (+674); community and personal service workers (+570); and sales workers (+565). Overall the number of females in employment is increasing at a faster rate than that for males.
Table 28. Employed Residents by Occupation - Mildura LGA 1996 and 2006
1996 Census 2006 Census Change 96-06
Persons Aged over 15 (Resident Population) Mildura LGA
Males Females Persons Males Females Persons Males Females Persons
Managers 2,823 1,162 3,985 2,624 1,124 3,748 -199 -38 -237
Professionals 986 1,291 2,277 1,223 1,851 3,074 237 560 797
Technicians and trades workers (b) 1,952 335 2,287 2,458 503 2,961 506 168 674
Community and personal service workers 349 893 1,242 445 1,367 1,812 96 474 570
Clerical and administrative workers 439 1,567 2,006 461 1,995 2,456 22 428 450
Sales workers 722 1,076 1,798 832 1,531 2,363 110 455 565
Machinery operators and drivers 1,072 110 1,182 1,325 87 1,412 253 -23 230
Labourers 1,804 1,189 2,993 2,141 1,331 3,472 337 142 479
Inadequately described/Not stated 330 231 561 238 151 389 -92 -80 -172
Total 10,477 7,854 18,331 11,747 9,940 21,687 1,270 2,086 3,356
Source: ABS Census, Resident Population Data.
3.3 Key Industry Sectors
Key sectors in the regional economy include agriculture, food processing, manufacturing, construction and tourism. With its regional role and population size, Mildura is a major centre for health services, retail and business services.
Mildura has a trade exposed sector, with the higher exchange rate impacting on export sales in the fruit sector and for processed products. The agriculture sector is recovering from drought, and full recovery will take several years to come through. The area also faces future policy decisions on the water allocations in the Murray Darling Basin. With a combination of these factors and the impacts of the current recession, recent trends have seen a softening in the jobs market. There have also been employment reductions in the food processing sector and subdued conditions in the support industries, including engineering. A slowdown in construction activity has also impacted on employment in construction and in supplying industries. The retail sector has seen the opening of several larger operations (supermarkets and discount department stores), however smaller specialist retailers have been impacted by a slowdown in consumer spending.
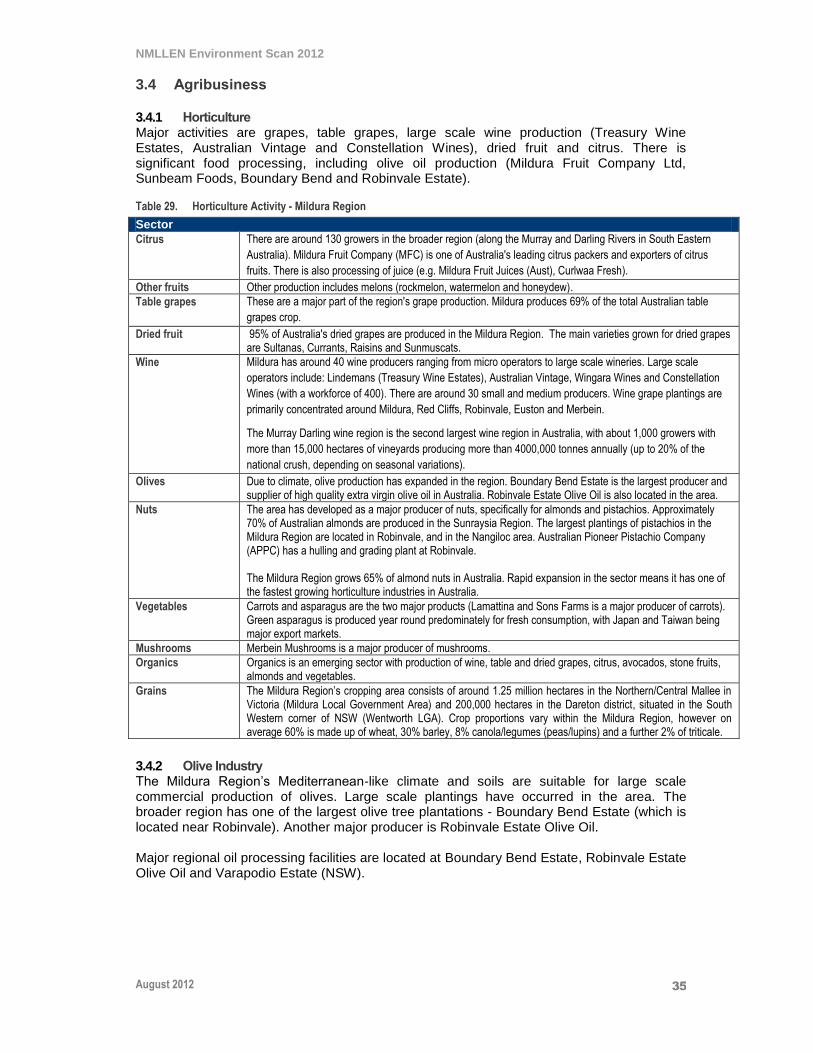
NMLLEN Environment Scan 2012
August 2012
35
3.4 Agribusiness
3.4.1 Horticulture Major activities are grapes, table grapes, large scale wine production (Treasury Wine Estates, Australian Vintage and Constellation Wines), dried fruit and citrus. There is significant food processing, including olive oil production (Mildura Fruit Company Ltd, Sunbeam Foods, Boundary Bend and Robinvale Estate).
Table 29. Horticulture Activity - Mildura Region
Sector
Citrus There are around 130 growers in the broader region (along the Murray and Darling Rivers in South Eastern
Australia). Mildura Fruit Company (MFC) is one of Australia's leading citrus packers and exporters of citrus
fruits. There is also processing of juice (e.g. Mildura Fruit Juices (Aust), Curlwaa Fresh).
Other fruits Other production includes melons (rockmelon, watermelon and honeydew).
Table grapes These are a major part of the region's grape production. Mildura produces 69% of the total Australian table
grapes crop.
Dried fruit 95% of Australia's dried grapes are produced in the Mildura Region. The main varieties grown for dried grapes are Sultanas, Currants, Raisins and Sunmuscats.
Wine Mildura has around 40 wine producers ranging from micro operators to large scale wineries. Large scale
operators include: Lindemans (Treasury Wine Estates), Australian Vintage, Wingara Wines and Constellation
Wines (with a workforce of 400). There are around 30 small and medium producers. Wine grape plantings are
primarily concentrated around Mildura, Red Cliffs, Robinvale, Euston and Merbein.
The Murray Darling wine region is the second largest wine region in Australia, with about 1,000 growers with
more than 15,000 hectares of vineyards producing more than 4000,000 tonnes annually (up to 20% of the
national crush, depending on seasonal variations).
Olives Due to climate, olive production has expanded in the region. Boundary Bend Estate is the largest producer and supplier of high quality extra virgin olive oil in Australia. Robinvale Estate Olive Oil is also located in the area.
Nuts The area has developed as a major producer of nuts, specifically for almonds and pistachios. Approximately 70% of Australian almonds are produced in the Sunraysia Region. The largest plantings of pistachios in the Mildura Region are located in Robinvale, and in the Nangiloc area. Australian Pioneer Pistachio Company (APPC) has a hulling and grading plant at Robinvale. The Mildura Region grows 65% of almond nuts in Australia. Rapid expansion in the sector means it has one of the fastest growing horticulture industries in Australia.
Vegetables Carrots and asparagus are the two major products (Lamattina and Sons Farms is a major producer of carrots). Green asparagus is produced year round predominately for fresh consumption, with Japan and Taiwan being major export markets.
Mushrooms Merbein Mushrooms is a major producer of mushrooms.
Organics Organics is an emerging sector with production of wine, table and dried grapes, citrus, avocados, stone fruits, almonds and vegetables.
Grains The Mildura Region’s cropping area consists of around 1.25 million hectares in the Northern/Central Mallee in Victoria (Mildura Local Government Area) and 200,000 hectares in the Dareton district, situated in the South Western corner of NSW (Wentworth LGA). Crop proportions vary within the Mildura Region, however on average 60% is made up of wheat, 30% barley, 8% canola/legumes (peas/lupins) and a further 2% of triticale.
3.4.2 Olive Industry The Mildura Region’s Mediterranean-like climate and soils are suitable for large scale commercial production of olives. Large scale plantings have occurred in the area. The broader region has one of the largest olive tree plantations - Boundary Bend Estate (which is located near Robinvale). Another major producer is Robinvale Estate Olive Oil. Major regional oil processing facilities are located at Boundary Bend Estate, Robinvale Estate Olive Oil and Varapodio Estate (NSW).

NMLLEN Environment Scan 2012
August 2012
36
3.4.3 Wine Industry The broader Murray Darling Region is a major wine region, with plantings mainly concentrated around Mildura, Red Cliffs, Robinvale, Euston and Merbein. There are an estimated 1,000 growers with more than 20,000 hectares of vineyards (and producing more than 400,000 tonnes annually or around 20% of the national crush). The value of wine-grape production from this broader region is estimated at $200 million a year. Figure 1 - Murray Darling Wine Region
Source: A Workforce Development Strategy for the Mildura Wine, Olive and Beverage Industries, Mildura Development Corporation December 2009 P18
The Mildura Region has over 34 wineries ranging from micro to large scale facilities. Many of the large scale wineries in the area are producing in excess of 10,000 tonnes annually. Over 50% of the Mildura Region wineries are exporting. The Mildura Region has a history of large wine producers such as Beringer Blass (Mildara), McGuigan Simeon Wines (Buronga Hill Winery), Hardy Wine Company (Stanley Wines) and Southcorp (Lindemans).
The region has also become the central focus point for servicing clients from the extended wine regions of the Barossa, Clare and Griffith areas (e.g. vine nurseries, wine tank manufacture, irrigation expertise, tartaric suppliers, transport infrastructure etc.).
Table 30. Wine Producers - Mildura and Swan Hill Areas
Wine Producers with employees Other Wineries
Andrew Peace Australian Vintage Constellation Wines Australia Chateau Mildura Lindemans Wines Neqtar Wines Nursery Ridge Robinvale Wines Trentham Estate Wingara Wine Group Wooden Eye Estate Zilzie Wines
Blue Yabby Estate Callipari Wine and Food Capogreco Winery Estate Chalmers Wines Currans Family Wines Farrell Estate Horse Paddock Wines Jasmine Wines Longshores Wine Company Mulcra Estate Wines Oak Valley Estate Pasut Family Wines Rising Dust Wines Sunview Wines Tall Poppy Wines Venue Wines Williamson Wines Yelta Ridge
Source: A Workforce Development Strategy for the Mildura Wine, Olive and Beverage Industries, Mildura Development Corporation December 2009
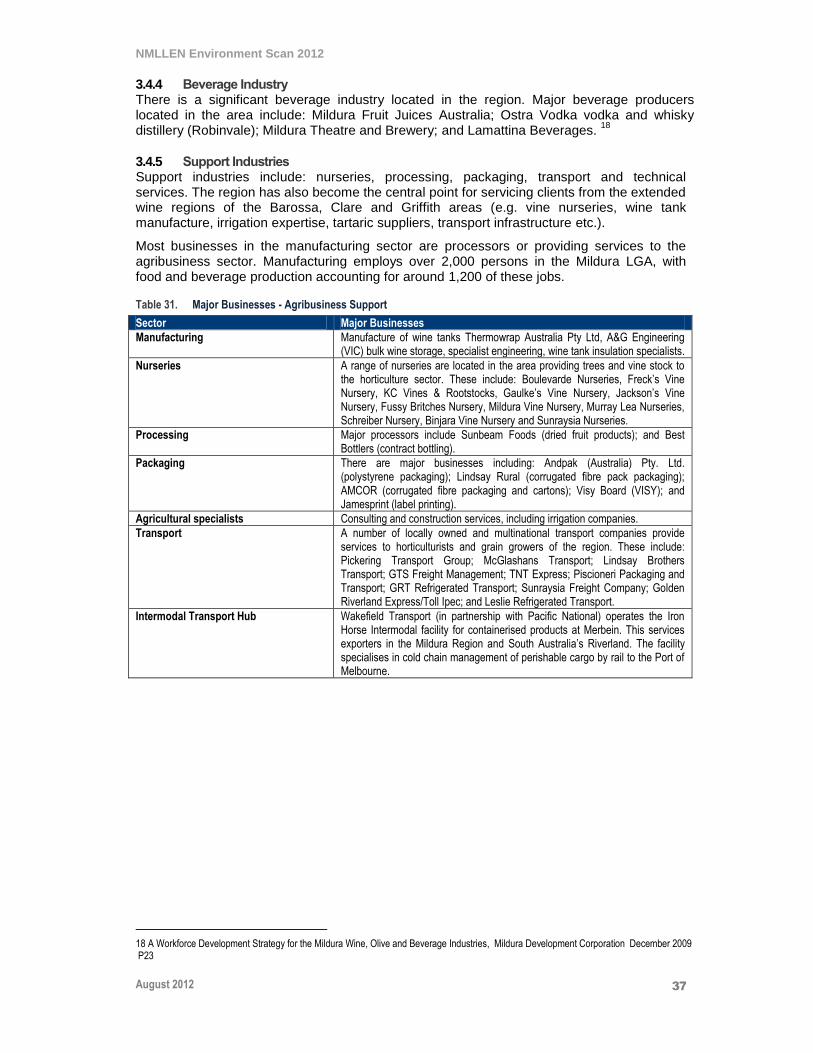
NMLLEN Environment Scan 2012
August 2012
37
3.4.4 Beverage Industry There is a significant beverage industry located in the region. Major beverage producers located in the area include: Mildura Fruit Juices Australia; Ostra Vodka vodka and whisky distillery (Robinvale); Mildura Theatre and Brewery; and Lamattina Beverages.
18
3.4.5 Support Industries Support industries include: nurseries, processing, packaging, transport and technical services. The region has also become the central point for servicing clients from the extended wine regions of the Barossa, Clare and Griffith areas (e.g. vine nurseries, wine tank manufacture, irrigation expertise, tartaric suppliers, transport infrastructure etc.).
Most businesses in the manufacturing sector are processors or providing services to the agribusiness sector. Manufacturing employs over 2,000 persons in the Mildura LGA, with food and beverage production accounting for around 1,200 of these jobs.
Table 31. Major Businesses - Agribusiness Support
Sector Major Businesses
Manufacturing Manufacture of wine tanks Thermowrap Australia Pty Ltd, A&G Engineering (VIC) bulk wine storage, specialist engineering, wine tank insulation specialists.
Nurseries A range of nurseries are located in the area providing trees and vine stock to the horticulture sector. These include: Boulevarde Nurseries, Freck’s Vine Nursery, KC Vines & Rootstocks, Gaulke’s Vine Nursery, Jackson’s Vine Nursery, Fussy Britches Nursery, Mildura Vine Nursery, Murray Lea Nurseries, Schreiber Nursery, Binjara Vine Nursery and Sunraysia Nurseries.
Processing Major processors include Sunbeam Foods (dried fruit products); and Best Bottlers (contract bottling).
Packaging There are major businesses including: Andpak (Australia) Pty. Ltd. (polystyrene packaging); Lindsay Rural (corrugated fibre pack packaging); AMCOR (corrugated fibre packaging and cartons); Visy Board (VISY); and Jamesprint (label printing).
Agricultural specialists Consulting and construction services, including irrigation companies.
Transport A number of locally owned and multinational transport companies provide services to horticulturists and grain growers of the region. These include: Pickering Transport Group; McGlashans Transport; Lindsay Brothers Transport; GTS Freight Management; TNT Express; Piscioneri Packaging and Transport; GRT Refrigerated Transport; Sunraysia Freight Company; Golden Riverland Express/Toll Ipec; and Leslie Refrigerated Transport.
Intermodal Transport Hub Wakefield Transport (in partnership with Pacific National) operates the Iron Horse Intermodal facility for containerised products at Merbein. This services exporters in the Mildura Region and South Australia’s Riverland. The facility specialises in cold chain management of perishable cargo by rail to the Port of Melbourne.
18 A Workforce Development Strategy for the Mildura Wine, Olive and Beverage Industries, Mildura Development Corporation December 2009 P23
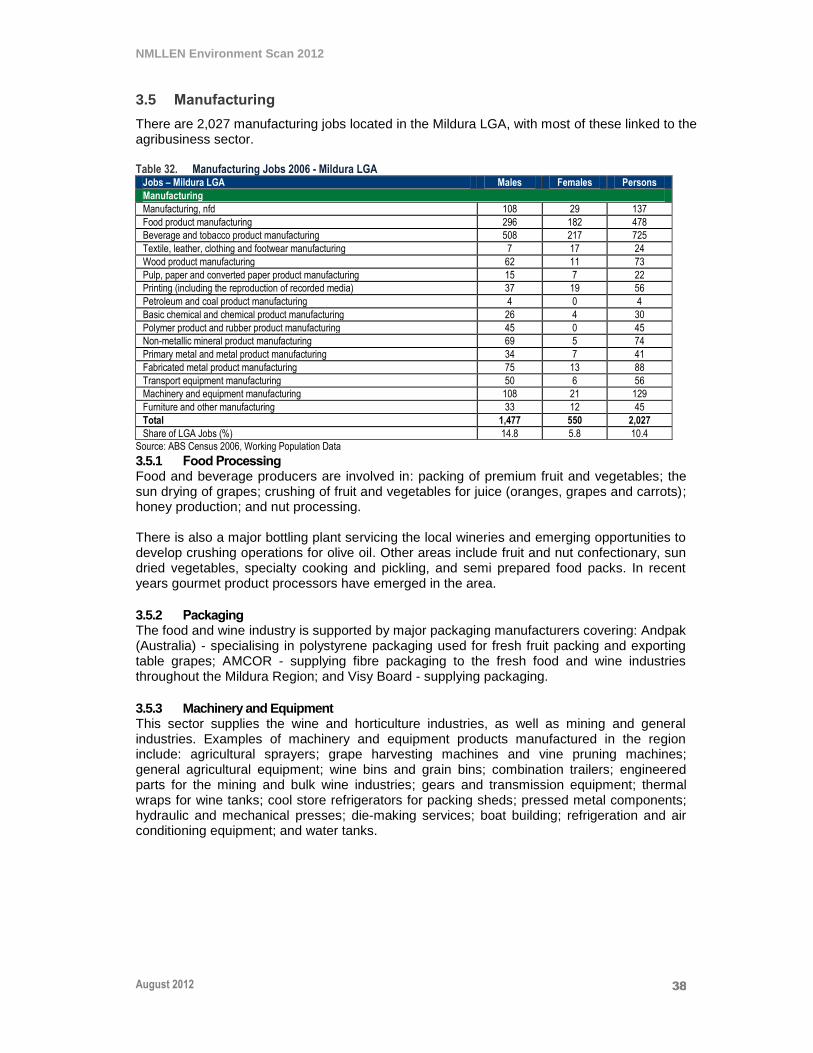
NMLLEN Environment Scan 2012
August 2012
38
3.5 Manufacturing
There are 2,027 manufacturing jobs located in the Mildura LGA, with most of these linked to the agribusiness sector. Table 32. Manufacturing Jobs 2006 - Mildura LGA
Jobs – Mildura LGA Males Females Persons
Manufacturing
Manufacturing, nfd 108 29 137
Food product manufacturing 296 182 478
Beverage and tobacco product manufacturing 508 217 725
Textile, leather, clothing and footwear manufacturing 7 17 24
Wood product manufacturing 62 11 73
Pulp, paper and converted paper product manufacturing 15 7 22
Printing (including the reproduction of recorded media) 37 19 56
Petroleum and coal product manufacturing 4 0 4
Basic chemical and chemical product manufacturing 26 4 30
Polymer product and rubber product manufacturing 45 0 45
Non-metallic mineral product manufacturing 69 5 74
Primary metal and metal product manufacturing 34 7 41
Fabricated metal product manufacturing 75 13 88
Transport equipment manufacturing 50 6 56
Machinery and equipment manufacturing 108 21 129
Furniture and other manufacturing 33 12 45
Total 1,477 550 2,027
Share of LGA Jobs (%) 14.8 5.8 10.4
Source: ABS Census 2006, Working Population Data
3.5.1 Food Processing Food and beverage producers are involved in: packing of premium fruit and vegetables; the sun drying of grapes; crushing of fruit and vegetables for juice (oranges, grapes and carrots); honey production; and nut processing. There is also a major bottling plant servicing the local wineries and emerging opportunities to develop crushing operations for olive oil. Other areas include fruit and nut confectionary, sun dried vegetables, specialty cooking and pickling, and semi prepared food packs. In recent years gourmet product processors have emerged in the area.
3.5.2 Packaging The food and wine industry is supported by major packaging manufacturers covering: Andpak (Australia) - specialising in polystyrene packaging used for fresh fruit packing and exporting table grapes; AMCOR - supplying fibre packaging to the fresh food and wine industries throughout the Mildura Region; and Visy Board - supplying packaging.
3.5.3 Machinery and Equipment This sector supplies the wine and horticulture industries, as well as mining and general industries. Examples of machinery and equipment products manufactured in the region include: agricultural sprayers; grape harvesting machines and vine pruning machines; general agricultural equipment; wine bins and grain bins; combination trailers; engineered parts for the mining and bulk wine industries; gears and transmission equipment; thermal wraps for wine tanks; cool store refrigerators for packing sheds; pressed metal components; hydraulic and mechanical presses; die-making services; boat building; refrigeration and air conditioning equipment; and water tanks.
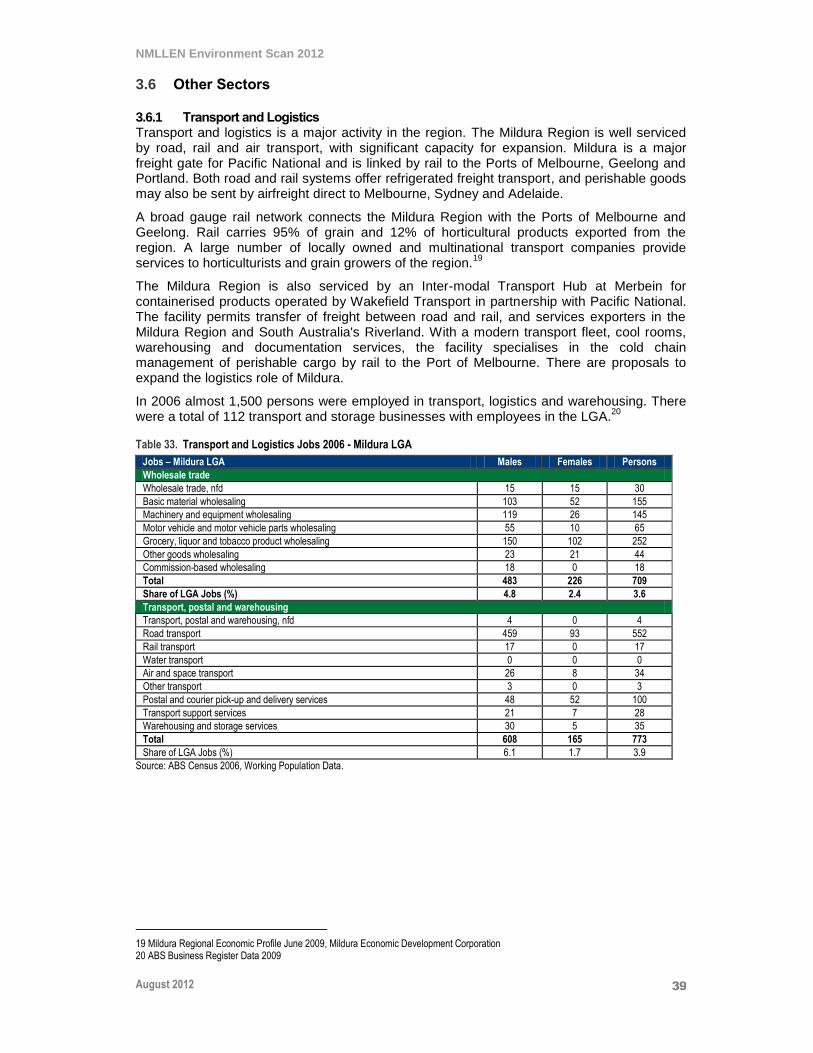
NMLLEN Environment Scan 2012
August 2012
39
3.6 Other Sectors
3.6.1 Transport and Logistics Transport and logistics is a major activity in the region. The Mildura Region is well serviced by road, rail and air transport, with significant capacity for expansion. Mildura is a major freight gate for Pacific National and is linked by rail to the Ports of Melbourne, Geelong and Portland. Both road and rail systems offer refrigerated freight transport, and perishable goods may also be sent by airfreight direct to Melbourne, Sydney and Adelaide.
A broad gauge rail network connects the Mildura Region with the Ports of Melbourne and Geelong. Rail carries 95% of grain and 12% of horticultural products exported from the region. A large number of locally owned and multinational transport companies provide services to horticulturists and grain growers of the region.
19
The Mildura Region is also serviced by an Inter-modal Transport Hub at Merbein for containerised products operated by Wakefield Transport in partnership with Pacific National. The facility permits transfer of freight between road and rail, and services exporters in the Mildura Region and South Australia's Riverland. With a modern transport fleet, cool rooms, warehousing and documentation services, the facility specialises in the cold chain management of perishable cargo by rail to the Port of Melbourne. There are proposals to expand the logistics role of Mildura.
In 2006 almost 1,500 persons were employed in transport, logistics and warehousing. There were a total of 112 transport and storage businesses with employees in the LGA.
20
Table 33. Transport and Logistics Jobs 2006 - Mildura LGA
Jobs – Mildura LGA Males Females Persons
Wholesale trade
Wholesale trade, nfd 15 15 30
Basic material wholesaling 103 52 155
Machinery and equipment wholesaling 119 26 145
Motor vehicle and motor vehicle parts wholesaling 55 10 65
Grocery, liquor and tobacco product wholesaling 150 102 252
Other goods wholesaling 23 21 44
Commission-based wholesaling 18 0 18
Total 483 226 709
Share of LGA Jobs (%) 4.8 2.4 3.6
Transport, postal and warehousing
Transport, postal and warehousing, nfd 4 0 4
Road transport 459 93 552
Rail transport 17 0 17
Water transport 0 0 0
Air and space transport 26 8 34
Other transport 3 0 3
Postal and courier pick-up and delivery services 48 52 100
Transport support services 21 7 28
Warehousing and storage services 30 5 35
Total 608 165 773
Share of LGA Jobs (%) 6.1 1.7 3.9
Source: ABS Census 2006, Working Population Data.
19 Mildura Regional Economic Profile June 2009, Mildura Economic Development Corporation 20 ABS Business Register Data 2009

NMLLEN Environment Scan 2012
August 2012
40
3.6.2 Tourism Tourism is a major sector in the Mildura Region. The natural resources of the region, including national parks and the Murray and Darling Rivers, complement: a strong food and wine presence; cultural and sporting events and festivals; and many other attractions. Over 300 events are held annually, including conferences. There are air connections with Melbourne, Sydney and Adelaide, through Mildura Airport.
The region provides access to four national parks and two river systems. It has Indigenous cultural heritage of regional, national and international significance, including the World Heritage listed Mungo National Park.
These natural features combine with identified tourist attractions such as: food and wine (wineries and restaurants); events and festivals (e.g. music, arts, community and culture); sports (e.g. water sports, golf, motor racing, cycling and tennis); history and heritage including sites, routes and walks; Indigenous culture and tours; rivers, waterways and natural bush land (e.g. houseboat holidays, paddleboat cruises, fishing, and environment); arts and culture; the Barkindji Biosphere and the Australian Inland Botanic Gardens. The accommodation sector comprises: four-star hotel/motel and resort style accommodation (53); caravan parks (28); backpackers (10) and B&Bs (13). In 2006 the accommodation and food services sector employed 1,280 persons, accounting for almost 7% of jobs in the region.
Table 34. Accommodation and Food Service Jobs 2006 - Mildura LGA
Jobs – Mildura LGA Males Females Persons Accommodation and food services
Accommodation 120 254 374
Food and beverage services 350 556 906
Total 470 810 1,280
Share of LGA Jobs (%) 4.7 8.6 6.6
Source: ABS Census 2006, Working Population Data
3.6.3 Construction Building and construction is a major activity in the region and has been driven by a combination of population growth and housing demand and industrial demand. The sector employs over 1,000 persons or 5% of the regional workforce.
Table 35. Building and Construction Jobs 2006 - Mildura LGA
Jobs – Mildura LGA Males Females Persons Construction
Construction, nfd 18 3 21
Building construction 228 63 291
Heavy and civil engineering construction 58 11 69
Construction services 538 91 629
Total 842 168 1,010
Share of LGA Jobs (%) 8.4 1.8 5.2
Source: ABS Census 2006, Working Population Data
3.6.4 Retail As a major regional centre, Mildura has a significant retail sector, which employs almost 2,900 persons or 15% of the workforce. Table 36. Retail Jobs 2006 - Mildura LGA
Jobs – Mildura LGA Males Females Persons Retail trade
Retail trade, nfd 57 64 121
Motor vehicle and motor vehicle parts retailing 194 53 247
Fuel retailing 53 42 95
Food retailing 350 546 896
Other store-based retailing 512 1,020 1,532
Total 1,166 1,725 2,891
Share of LGA Jobs (%) 11.7 18.3 14.9
Source: ABS Census 2006, Working Population Data

NMLLEN Environment Scan 2012
August 2012
41
3.6.5 Health and Community Services Mildura is well serviced by a broad range of established professional and health services, which includes: Mildura Base Hospital (a major regional health care services hub); Mildura Private Hospital; seventeen medical clinics; and seven residential aged care facilities. The sector accounted for 11% of jobs in the region and almost 18% of the jobs held by females.
Table 37. Health and Community Services Jobs 2006 - Mildura LGA
Jobs – Mildura LGA Males Females Persons Health care and social assistance
Health care and social assistance, nfd 8 40 48
Hospitals 107 500 607
Medical and other health care services 162 495 657
Residential care services 38 280 318
Social assistance services 70 406 476
Total 385 1,721 2,106
Share of LGA Jobs (%) 3.9 18.2 10.8
Source: ABS Census 2006, Working Population Data
3.6.6 Education Mildura LGA has a range of education and training facilities from early learning to higher education and vocational education and training (VET). Specialty training courses exist in horticulture, food processing, transportation and logistics, healthcare, education, and business. Education and training accounted for over 1,600 jobs in the region.
La Trobe University, Mildura Campus offers undergraduate and postgraduate courses in Accounting, Arts, Business, Community Development, Education, Graphic Design, Nursing, Health Science, Social Work and Visual Arts.
Monash University School of Rural Health in Mildura is equipped to train in medical professions, including nursing.
The Sunraysia Institute of TAFE’s campuses in Mildura, Ouyen, Robinvale and Swan Hill provide courses in Automotive and Transport; Energy; Engineering; Business; Education; Industry; Land and Environmental studies; Community Health and Welfare; Retail; Hair and Beauty; and Hospitality Services. Sunraysia Institute of TAFE, also known as SuniTAFE has articulation pathways to La Trobe University and to other institutions and is expanding partnerships with other universities (e.g. University of Ballarat). SuniTAFE is one of five partner Institutes in the National Centre for Sustainability, which began as a Victorian Government initiative to promote sustainability in key areas of education-technology, building, renewable energy and conservation and land management.
MADEC is a major provider of vocational education, and adult and community education.
Other Training Providers include: Australian National Institute; Aust-Link Pty Ltd and Top End Training.
Table 38. Education and Training Jobs 2006 - Mildura LGA
Jobs – Mildura LGA Males Females Persons Education and training
Education and training, nfd 3 6 9
Preschool and school education 332 968 1,300
Tertiary education 84 130 214
Adult, community and other education 40 66 106
Total 459 1,170 1,629
Share of LGA Jobs (%) 4.6 12.4 8.4
Source: ABS Census 2006, Working Population Data
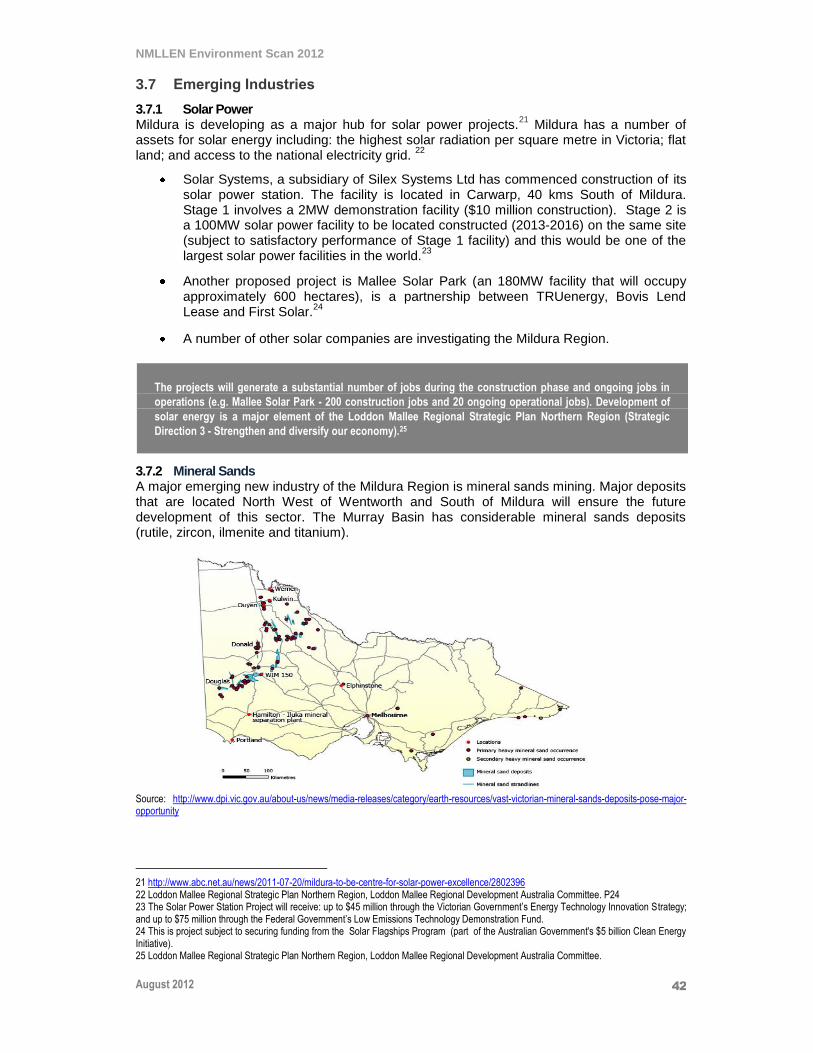
NMLLEN Environment Scan 2012
August 2012
42
3.7 Emerging Industries
3.7.1 Solar Power Mildura is developing as a major hub for solar power projects.
21 Mildura has a number of
assets for solar energy including: the highest solar radiation per square metre in Victoria; flat land; and access to the national electricity grid.
22
Solar Systems, a subsidiary of Silex Systems Ltd has commenced construction of its solar power station. The facility is located in Carwarp, 40 kms South of Mildura. Stage 1 involves a 2MW demonstration facility ($10 million construction). Stage 2 is a 100MW solar power facility to be located constructed (2013-2016) on the same site (subject to satisfactory performance of Stage 1 facility) and this would be one of the largest solar power facilities in the world.
23
Another proposed project is Mallee Solar Park (an 180MW facility that will occupy approximately 600 hectares), is a partnership between TRUenergy, Bovis Lend Lease and First Solar.
24
A number of other solar companies are investigating the Mildura Region.
The projects will generate a substantial number of jobs during the construction phase and ongoing jobs in
operations (e.g. Mallee Solar Park - 200 construction jobs and 20 ongoing operational jobs). Development of
solar energy is a major element of the Loddon Mallee Regional Strategic Plan Northern Region (Strategic
Direction 3 - Strengthen and diversify our economy).25
3.7.2 Mineral Sands A major emerging new industry of the Mildura Region is mineral sands mining. Major deposits that are located North West of Wentworth and South of Mildura will ensure the future development of this sector. The Murray Basin has considerable mineral sands deposits (rutile, zircon, ilmenite and titanium).
Source: http://www.dpi.vic.gov.au/about-us/news/media-releases/category/earth-resources/vast-victorian-mineral-sands-deposits-pose-major-opportunity
21 http://www.abc.net.au/news/2011-07-20/mildura-to-be-centre-for-solar-power-excellence/2802396 22 Loddon Mallee Regional Strategic Plan Northern Region, Loddon Mallee Regional Development Australia Committee. P24 23 The Solar Power Station Project will receive: up to $45 million through the Victorian Government’s Energy Technology Innovation Strategy; and up to $75 million through the Federal Government’s Low Emissions Technology Demonstration Fund. 24 This is project subject to securing funding from the Solar Flagships Program (part of the Australian Government's $5 billion Clean Energy Initiative). 25 Loddon Mallee Regional Strategic Plan Northern Region, Loddon Mallee Regional Development Australia Committee.

NMLLEN Environment Scan 2012
August 2012
43
There are two large mineral sands companies (Iluka Resources and Bemax Resources NL) operating mines.
26 Bemax Resources and Iluka Resources are developing mineral sand
mines to the North and South of Mildura. This includes Iluka’s mining operations at Ouyen and Kulwin, with processing at their Hamilton plant. Iluka draws the majority of its workforce from the local region, which has created mining jobs for Mildura residents. With the potential to invest up to $400 million in the Mildura Region, mineral sands mining is becoming a significant industry. Currently 200 people are employed in mineral sands mining, with projections for additional employment growth. The industry employs plant operators, transport and earthmoving contractors, administration staff, maintenance crews, laboratory workers and caterers.
27
3.8 Occupations and Skills
3.8.1 Occupation Mix
Key Occupations
The occupation mix (see table 25) reflects the industry structure of the Mildura Region with a large number of persons in farm occupations, food processing, service occupations (e.g. retail, health and education) and in skilled trades (e.g. construction trades, engineering trades, automotive trades). The major groups are farm managers (1,727); education professionals (1,024); and health professionals (775). Tradespersons were mainly in automotive and engineering trades (655); and in construction trades (408). Community and personal service workers were carers (758) and health support workers (258). Labourers were mainly factory process workers (775) and farm workers (725).
Demand Levels and Recruitment
Over the last three years employment demand levels have been relatively stable due to the impacts of drought and of the exchange rate on the agribusiness sector. Population growth has encouraged some increase in retail activity and in associated employment.
There is a continued demand for skilled professionals and some organisations experience difficulties in attracting experienced professionals because the region is considered remote and far from Melbourne and Adelaide. Skilled tradespersons have also been attracted out of the region, with the continued growth in the mining and resources sector.
The immediate outlook is for stable employment levels, with several years of growth needed in the
horticulture sector. Growth in construction trades is dependent on future levels of building, including
infrastructure projects.
3.8.2 Skill Issues in the Region Recent studies have identified skill gaps and skill shortages in the region.
28 A 2006 study,
identified recruitment difficulties in a number of categories.29
These included: tradespersons; intermediate production and transport workers; and professionals. The major issues related to: a lack of persons with the right qualifications; lack of experience; inadequate qualifications; lack of relevant technical skills; and poor attitudes.
26 Iluka Resources is a large global mining and processing group with mineral production and processing operations in Australia and the United States. Iluka's primary business activity is mining and processing titanium minerals, zircon, operating a coal-mining joint venture and extensive mineral exploration in Australia and the United States. The titanium minerals are used in paint pigments and other protective coatings whilst the zircon is used in ceramics and refractories. 27 http://www.iluka.com/ The expected mine life is from 2009 to 2014, with the overall Murray Basin operations expected to have a mine life to at least 2023 28 Sunraysia Study Area Report June 2007, Department of Innovation, Industry and Regional Development-Victoria 29 Regional Skills Shortage Survey Summary Mildura and Region, Department for Victorian Communities, April 2006 P6

NMLLEN Environment Scan 2012
August 2012
44
There were identified shortages in a number of areas, including: metal fitters and machinists; cabinet makers; structural steel workers and welders; truck and automobile drivers; freight handlers; motor mechanics; and construction trades.
30 Other areas included: farm labourers;
and mobile construction plant operators. Shortages for professionals included: teachers; nurses; general practitioners; and miscellaneous health professionals (e.g. occupational therapists, podiatrists and physiotherapists). Many of these regional shortages are also state and national skill shortages. The current research for Victoria shows shortages in engineering (professional and trades); construction professional and trades; health professionals, including nurses and allied health professionals.
31
The agribusiness sector (wine, olive and beverage industries) developed a strategy in 2009 that focuses on developing the workforce and on attracting young persons to the range of jobs in the three industry sectors.
32
Dealing with key skills shortages has involved recruitment from outside the region and the attraction of skilled migrants to the area. There are several issues affecting future skills in the Mildura Region:
Skills shortages of experienced professionals, with some turnover of employees and difficulties in attracting persons to the area.
Young people leaving the region for higher education or to take up entry level jobs in professional areas of employment.
A decline in the number of apprentice positions as a result of subdued economic conditions.
A narrow range of entry level positions being available in industries in the region.
With an ageing workforce, there is a need for improved workforce planning to meet current skills shortages to
ensure a sustainable future workforce. This process has commenced in the wine, olive and beverage
industries with the implementation of the Workforce Development Strategy.
The 2007 Report for Sunraysia identified a number of factors impacting on the area. These factors included an increase in property investment, housing and project construction which is generating growth in demand for building and construction; some growth in manufacturing; some reductions in horticulture; and emerging industries including mineral sands, salt, and solar power. There was an increase in demand for engineering skills, and electro technologies. Population growth and ageing was driving a demand for health and aged care.
33
While the recession, drought impacts, exchange rate effects on agribusiness have created more subdued
economic conditions, long term skills issues remain.
The Sunraysia Report recommended an increase in the following fields of training. The key fields for increase are those areas included in the Mildura Region Trade Training Centre provision.
30 Skill Shortages Fact Sheet , Sunraysia Regional Economic Development Board April 2008 31 Skill Shortages in Victoria June 2011, Department of Education, Employment and Workplace Relations. Detailed listings of skill shortages for the states and territories are available at www.deewr.gov.au/skillshortages 32 A Workforce Development Strategy for the Mildura Wine, Olive and Beverage Industries, Mildura Development Corporation December 2009 33 Sunraysia Study Area Report, June 2007, Department of Innovation, Industry and Regional Development - Victoria P10
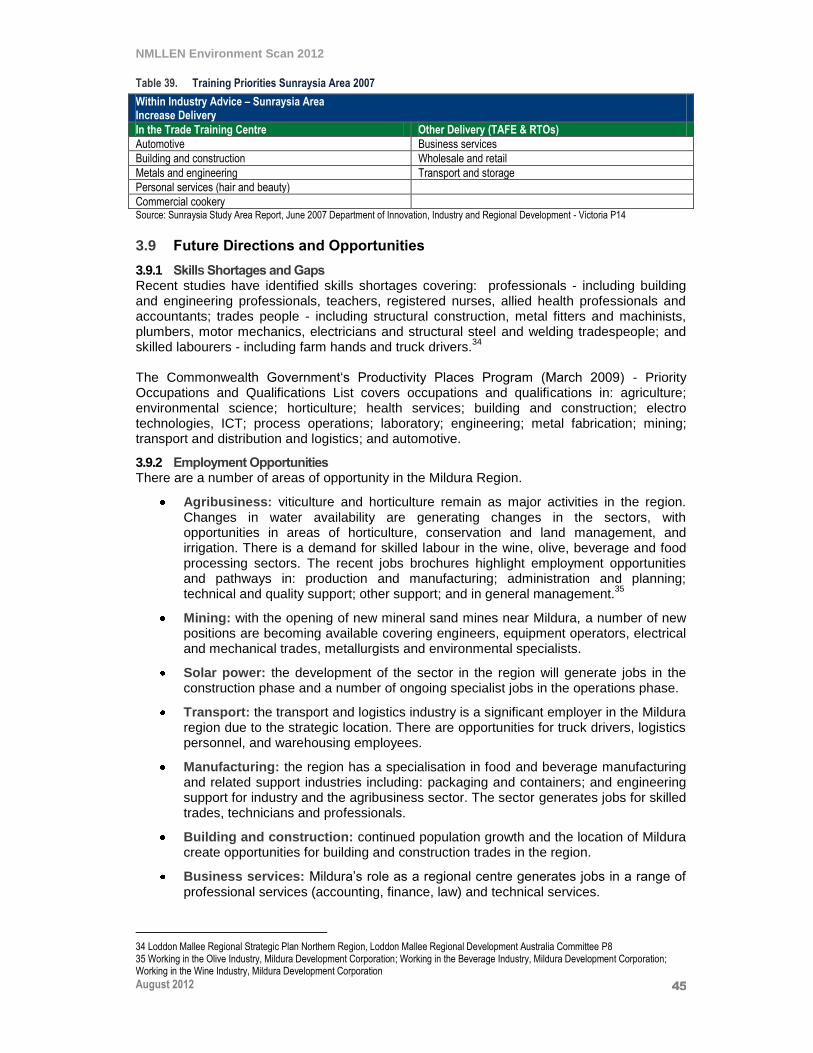
NMLLEN Environment Scan 2012
August 2012
45
Table 39. Training Priorities Sunraysia Area 2007
Within Industry Advice – Sunraysia Area Increase Delivery
In the Trade Training Centre Other Delivery (TAFE & RTOs)
Automotive Business services
Building and construction Wholesale and retail
Metals and engineering Transport and storage
Personal services (hair and beauty)
Commercial cookery Source: Sunraysia Study Area Report, June 2007 Department of Innovation, Industry and Regional Development - Victoria P14
3.9 Future Directions and Opportunities
3.9.1 Skills Shortages and Gaps Recent studies have identified skills shortages covering: professionals - including building and engineering professionals, teachers, registered nurses, allied health professionals and accountants; trades people - including structural construction, metal fitters and machinists, plumbers, motor mechanics, electricians and structural steel and welding tradespeople; and skilled labourers - including farm hands and truck drivers.
34
The Commonwealth Government‘s Productivity Places Program (March 2009) - Priority Occupations and Qualifications List covers occupations and qualifications in: agriculture; environmental science; horticulture; health services; building and construction; electro technologies, ICT; process operations; laboratory; engineering; metal fabrication; mining; transport and distribution and logistics; and automotive.
3.9.2 Employment Opportunities There are a number of areas of opportunity in the Mildura Region.
Agribusiness: viticulture and horticulture remain as major activities in the region. Changes in water availability are generating changes in the sectors, with opportunities in areas of horticulture, conservation and land management, and irrigation. There is a demand for skilled labour in the wine, olive, beverage and food processing sectors. The recent jobs brochures highlight employment opportunities and pathways in: production and manufacturing; administration and planning; technical and quality support; other support; and in general management.
35
Mining: with the opening of new mineral sand mines near Mildura, a number of new positions are becoming available covering engineers, equipment operators, electrical and mechanical trades, metallurgists and environmental specialists.
Solar power: the development of the sector in the region will generate jobs in the construction phase and a number of ongoing specialist jobs in the operations phase.
Transport: the transport and logistics industry is a significant employer in the Mildura region due to the strategic location. There are opportunities for truck drivers, logistics personnel, and warehousing employees.
Manufacturing: the region has a specialisation in food and beverage manufacturing and related support industries including: packaging and containers; and engineering support for industry and the agribusiness sector. The sector generates jobs for skilled trades, technicians and professionals.
Building and construction: continued population growth and the location of Mildura create opportunities for building and construction trades in the region.
Business services: Mildura’s role as a regional centre generates jobs in a range of professional services (accounting, finance, law) and technical services.
34 Loddon Mallee Regional Strategic Plan Northern Region, Loddon Mallee Regional Development Australia Committee P8 35 Working in the Olive Industry, Mildura Development Corporation; Working in the Beverage Industry, Mildura Development Corporation; Working in the Wine Industry, Mildura Development Corporation

NMLLEN Environment Scan 2012
August 2012
46
Health services: as a major regional centre, the Mildura Region has strong demand for health professionals (general practitioners, registered nurses, podiatrists, occupational therapists, physiotherapists) and allied health assistants. There is also a demand for carers in age care.
Tourism is a major industry in the region with a significant accommodation and restaurant sector. This creates major opportunities for full and part time employment in commercial cookery and in front of house.
Several industrial parks are being developed in the Mildura Region to meet increasing industry needs: Airport Business Park Precinct - 250 hectares of land adjacent to the Mildura Airport for freight and storage based businesses to expand. The airport is being redeveloped. Thurla Industrial Park: comprises a 340 hectare industrial park near Red Cliffs, which includes an intermodal freight facility. Some of these industry opportunities have been highlighted in the Loddon Mallee Regional Strategic Plan Northern Region, Report. These include: large-scale solar energy generation facilities; tourism infrastructure; high value agriculture production and added value processing to agriculture and horticulture; and further development of the wine industry.
36
The report also highlights the need to design and implement a regional Workforce Industry Development Strategy with the private sector to address skills shortages.
37
The growth of the Mildura Region will create future opportunities in a number of areas, including traditional
trades, technical occupations and professional occupations. These opportunities will arise because of an
ageing workforce; continued population growth in the region; changes in the industry mix; and changes in
skills requirements.
36 Loddon Mallee Regional Strategic Plan Northern Region, Loddon Mallee Regional Development Australia Committee. These are covered in Strategic Direction 3 - Strengthen and diversify our economy. 37 Loddon Mallee Regional Strategic Plan Northern Region, Loddon Mallee Regional Development Australia Committee P11. This would include Indigenous skills and employment initiatives.
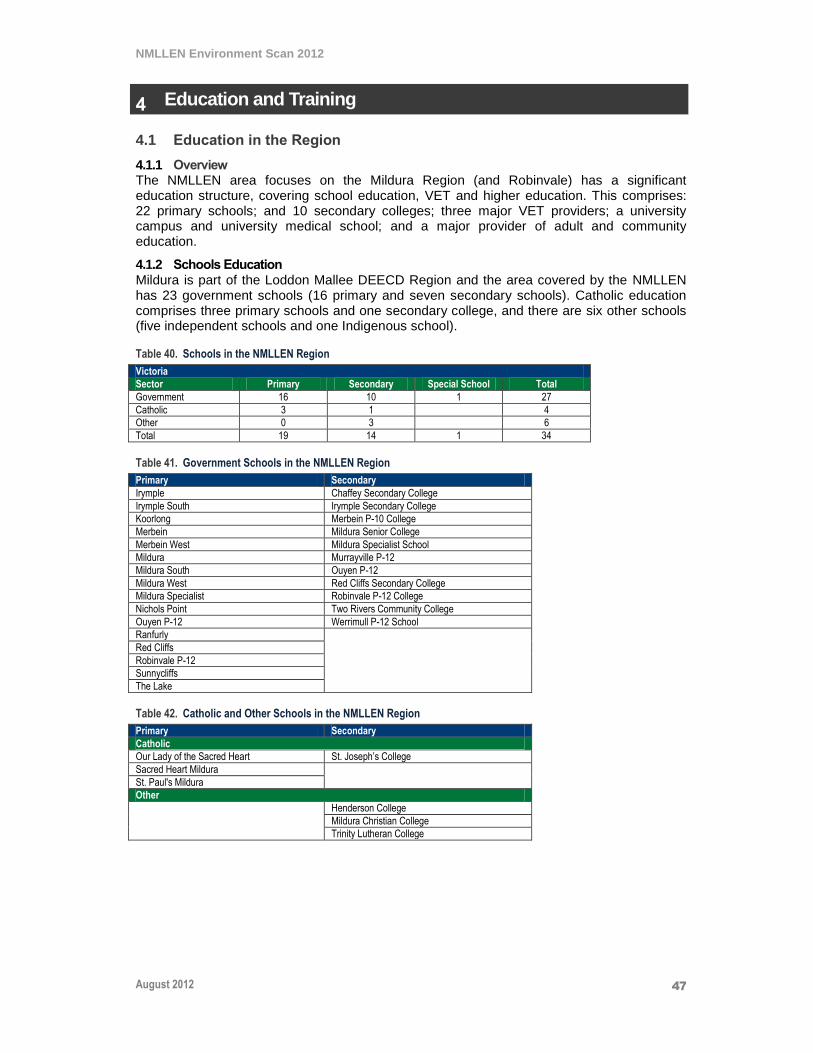
NMLLEN Environment Scan 2012
August 2012
47
4 Education and Training
4.1 Education in the Region
4.1.1 Overview The NMLLEN area focuses on the Mildura Region (and Robinvale) has a significant education structure, covering school education, VET and higher education. This comprises: 22 primary schools; and 10 secondary colleges; three major VET providers; a university campus and university medical school; and a major provider of adult and community education.
4.1.2 Schools Education Mildura is part of the Loddon Mallee DEECD Region and the area covered by the NMLLEN has 23 government schools (16 primary and seven secondary schools). Catholic education comprises three primary schools and one secondary college, and there are six other schools (five independent schools and one Indigenous school).
Table 40. Schools in the NMLLEN Region
Victoria
Sector Primary Secondary Special School Total
Government 16 10 1 27
Catholic 3 1 4
Other 0 3 6
Total 19 14 1 34
Table 41. Government Schools in the NMLLEN Region
Primary Secondary
Irymple Chaffey Secondary College
Irymple South Irymple Secondary College
Koorlong Merbein P-10 College
Merbein Mildura Senior College
Merbein West Mildura Specialist School
Mildura Murrayville P-12
Mildura South Ouyen P-12
Mildura West Red Cliffs Secondary College
Mildura Specialist Robinvale P-12 College
Nichols Point Two Rivers Community College
Ouyen P-12 Werrimull P-12 School
Ranfurly
Red Cliffs
Robinvale P-12
Sunnycliffs
The Lake
Table 42. Catholic and Other Schools in the NMLLEN Region
Primary Secondary
Catholic
Our Lady of the Sacred Heart St. Joseph’s College
Sacred Heart Mildura
St. Paul's Mildura
Other
Henderson College
Mildura Christian College
Trinity Lutheran College

NMLLEN Environment Scan 2012
August 2012
48
4.1.3 Vocational Education and Training Mildura has a range of vocational education and training facilities. Specialist training courses exist in horticulture, food processing, transportation and logistics, health, education and business.
Table 43. VET Providers - Mildura Region
Provider
Sunraysia Institute of TAFE (SuniTAFE) http://www.sunitafe.edu.au/default.aspx
SuniTAFE provides programs in Agriculture, Building, Construction and Trades, Engineering,
Community Health and Welfare, Business, Retail, Events and Commercial Cookery.
SuniTAFE is one of five partner Institutes in the National Centre for Sustainability which began
as a Victorian Government initiative to promote sustainability in key areas of education -
Technology, Building, Renewable Energy and Conservation and Land Management.
SuniTAFE has articulation pathways to La Trobe University and other institutions and is
expanding partnerships with universities (e.g. Ballarat).
SuniTAFE provides programs from Cert II to Advanced Diploma level. Major fields include:
Automotive, Building, Engineering, Furniture, Electro Technologies, Events, Commercial
Cookery, Transport and Logistics, Hair & Beauty, ICT, Horticulture, Business, Graphic Design,
Aged Care, Community Services, Laboratory, Children’s Services, Food Processing and
Energy. It auspices training for cluster schools. SuniTAFE has campuses in Mildura,
Robinvale, Ouyen and Swan Hill.
MADEC http://www.madec.edu.au/
MADEC is a community based provider of employment, education, training and community programs. It provides certificate programs in Aged Care, Business, Children’s Services, and IT. MADEC delivers employment, education and training throughout regional Victoria, New South Wales and South Australia. MADEC employs over 200 staff at 15 sites. It is involved in working with local industry, community, schools and government.
Sunraysia Murray Group Training (SMGT) www.smgt.com.au www.ani.edu.au
Sunraysia Murray Group Training employs 400 apprentices and trainees in a wide variety of trades and sectors. It has trainees in: Hospitality, Automotive, Electrical, Engineering, Construction, Retail, Business and Community Services. SMGT recently incorporated Australian National Institute (ANI).
Aust-Link www.aust-link.com.au
Aust-Link provides education and training for the transport and logistics sector in the Northwest and Central regions of Victoria and in areas of South Australia and New South Wales. Programs include heavy vehicle training, forklift training, heavy machinery training, dangerous goods and fatigue management. It also offers training for motorcycles and 4 wheel drive vehicles.
Table 44. Sunraysia Institute of TAFE Delivery
SuniTAFE Delivery
Automotive Career Connect Health and Wellbeing Industry and Energy Land and Environment
Automotive Motorsport Transport Paint and Panel
Short Courses OHS Commercial Cookery Accounting and Financial Services Business Management Events Tourism
Health and Leisure Hair and Beauty Community Services Children's Services First Aid Aged Care Disability and Education Support
Traditional Trades
Sustainability Conservation Land Management Animal Services Laboratory Operations Irrigation Horticulture Agriculture
Creative Industries Rural Trades SuniTAFE Central Rural Education
Arts Media IT Sound Theatre Design
Traditional trades Agriculture Horticulture
SuniTEC Indigenous programs Youth programs Foundation skills CGEA, CWE, VCAL
Health Children’s Services Aged Care Accounting Deakin @ Your Doorstep pathways
Source: http://www.sunitafe.edu.au/default.aspx

NMLLEN Environment Scan 2012
August 2012
49
Table 45. MADEC Operations MADEC – Operations
Employment Services Education and Training Labour Hire
MADEC provides a diverse range of employment solutions as a large provider for Job Services Australia.
This covers general employment, Indigenous employment services and disability services.
MADEC Community College offers a wide range of training options across Victoria, New South Wales and South Australia, with twelve permanent campuses and a network of outreach sites.
MADEC offers around forty nationally accredited qualifications and courses, plus a wide variety of short courses, both class room based and online, for employment or leisure purposes.
Courses are in the following areas: Aged Care, Business, Children’s Services, First Aid, Horticulture, Hospitality, Information Technology, Literacy and Numeracy, OH&S White Card, and Retail.
MADEC provides year round Harvest Labour services to meet seasonal labour market needs. MADEC has six Harvest Labour Offices across three states: Mildura, Renmark, Wentworth, Robinvale, Swan Hill and McLaren Vale.
MADEC also provides general labour hire services.
Source: http://www.madec.edu.au/
Table 46. Sunraysia Murray Group Training (SMGT) Operations
SMGT Operations
Group Training Employment Services Labour Hire Apprenticeships Australian National
Institute
SMGT directly employs around 400 apprentices and trainees in a wide variety of trades and business sectors.
SMGT provides Job Placement Services throughout the Sunraysia Region.
Sunraysia Labour Hire was established as a result of the high demand for labour hire services.
As a group training company SMGT employs apprentices. It also offers School Based Apprenticeships.
ANI was acquired by SMGT. It is a RTO, and provides training in a number of areas including Agriculture, Engineering, Construction and Hospitality. Training is provided for local students and for international students www.ani.edu.au
Source: www.smgt.com.au
Table 47. Aust-Link Training Delivery
Aust-Link Operations
Heavy Vehicle Training Forklift Training Heavy Machinery
Training
Regulatory Training Other Training
Aust-Link provides vehicle training covering: Light Rigid (LR); Medium Rigid (MR); Heavy Rigid (HR); and Heavy Combination (HC) Vehicles. It also provides a program in fatigue management.
Full training is offered for forklifts covering operations, cargo loading training, with licences and certification.
Provision of training for Heavy Machinery Operators covering: Front End Loader, Front End Loader /Backhoe Excavator, Grader, Dozer and Skidsteer Loader.
Training programs covering: Construction Induction Card, Dangerous Goods Licence and Traffic Control.
Other training covers: motorcycles (pre-learner and licence courses); and 4 wheel drive training.
Source: www.aust-link.com.au

NMLLEN Environment Scan 2012
August 2012
50
4.1.4 Higher Education La Trobe University offers undergraduate and postgraduate courses at its Mildura Campus. The faculties based at Mildura are: Education; Health Science; Law and Management; and Humanities and Social Sciences. Courses are offered in Accounting, Arts, Business, Health (nursing, allied health), Community Development, Education and Social Work. The campus has over 500 students.
Monash University operates the School of Rural Health in Mildura, which provides education and training in medical professions, including nursing.
SuniTAFE has articulation pathways with La Trobe University and with other institutions and is expanding partnerships with universities (e.g. with University of Ballarat and Deakin University) for articulation and program delivery.
Table 48. La Trobe University Courses
La Trobe University – Mildura Campus:
Courses
Bachelor of Business (Accounting) Bachelor of Arts Bachelor of Business Bachelor of Education Bachelor of Graphic Design Bachelor of Health Sciences and Master of Occupational Therapy Practice Bachelor of Health Sciences and Master of Paramedic Practice Bachelor of Health Sciences and Master of Physiotherapy Practice Bachelor of Health Sciences and Master of Podiatric Practice Bachelor of Health Sciences and Master of Speech Pathology Bachelor of Human Services and Master of Social Work Bachelor of Nursing (Division 2 Conversion) Bachelor of Nursing (Pre-registration) Bachelor of Visual Arts Diploma of Arts
Postgraduate Coursework Courses
Graduate Diploma in Accounting Source http://www.latrobe.edu.au/mildura?gclid=CJanwJfl4q0CFYolpAodBgqeNQ

NMLLEN Environment Scan 2012
August 2012
51
4.2 Secondary Education in the Region
4.2.1 School Enrolments
The following tables show total secondary school enrolments for all secondary schools in the NMLLEN Region (covering Mildura LGA and Robinvale-in Swan Hill LGA). In 2010 there were a total of 4,475 enrolments in Years 7-12, with 528 Year 12 enrolments. There were a total of 926 VCE enrolments and 246 VCAL enrolments in 2010. Table 49. Secondary School Enrolments (FTE) - NMLLEN Region 2006-2010 (All Schools)
Northern Mallee LLEN Year 7 Year 8 Year 9 Year 10 Year 11 Year 12 Total
2010 Mildura (RC) 866.7 838 815.1 763.5 664.4 527.7 4,475.4
Swan Hill (RC) 36 42 63 42 32.7 30.7 246.4
Total 902.7 880 878.1 805.5 697.1 558.4 4,721.8
2009 Mildura (RC) 837 824.1 805.6 755.6 644.8 551 4,418.1
Swan Hill (RC) 42 62 45 50 34.7 27.8 261.5
Total 879 886.1 850.6 805.6 679.5 578.8 4,679.6
2008 Mildura (RC) 826 816.7 802.5 725.7 731.5 560.7 4,463.1
Swan Hill (RC) 64 44 61 60 37.5 21.7 288.2
Total 890 860.7 863.5 785.7 769 582.4 4,751.3
2007 Mildura (RC) 826 816.7 802.5 725.7 731.5 560.7 4,463.1
Swan Hill (RC) 64 44 61 60 37.5 21.7 288.2
Total 890 860.7 863.5 785.7 769 582.4 4,751.3
2006 Mildura (RC) 818 817.2 826.1 763 705.9 542.6 4,472.8
Swan Hill (RC) 44 51 52 53.2 43.8 35.4 279.4
Total 862 868.2 878.1 816.2 749.7 578 4,752.2
Source: DEECD Data (LLEN Data Disc 2011) August School Census Data
Table 50. VCE Enrolments (Mildura and Robinvale) - NMLLEN 2005-2010
Northern Mallee LLEN VCE Males Females Persons
2010 Mildura (RC)+ Swan Hill (RC) Robinvale 401 525 926
2009 Mildura (RC) + Swan Hill (RC) Robinvale 422 517 939
2008 Mildura (RC)+ Swan Hill (RC) Robinvale 424 506 930
2007 Mildura (RC)+ Swan Hill (RC) Robinvale 394 515 909
2006 Mildura (RC)+ Swan Hill (RC) Robinvale 394 520 914
2005 Mildura (RC)+ Swan Hill (RC) Robinvale 398 512 910
Source: Victorian Curriculum and Assessment Authority Data 2011
The following table shows VCAL enrolments for the period 2005-2010 for the NMLLEN Region. VCAL enrolments have fluctuated over time and totalled 246 in 2010.
Table 51. VCAL Enrolments (Mildura LGA) - NMLLEN 2005-2010
VCAL VCAL_LEVEL
Northern Mallee LLEN LGA Foundation Intermediate Senior Total
2010 Mildura (RC) 57 146 43 246
2009 Mildura (RC)) 38 129 44 211
2008 Mildura (RC)) 34 115 29 178
2007 Mildura (RC) 85 135 30 250
2006 Mildura (RC) 54 88 29 171
2005 Mildura (RC) 55 156 61 272
Source: Victorian Curriculum and Assessment Authority Data 2011

NMLLEN Environment Scan 2012
August 2012
52
4.2.2 Year 12 Completion Rates The following table shows Year 12 (or equivalent) completions for persons aged 20-24 years, from ABS Census data for 2006. Mildura is at the lower end of Year 12 completion rates compared with the average for regional Victoria (and for most metropolitan LGAs in Victoria). The Year 12 or equivalent completion rate was 66% for Mildura LGA, compared with 72% for regional Victoria and 80% for metropolitan Melbourne. Comparisons are made with other LGAs in the Murray/Goulbourn area (e.g. Greater Shepparton, Campaspe and Swan Hill).
Overall in terms of Year 12 completions of persons aged 20-24 years, Mildura LGA sits in the lowest ten LGAs
in Victoria. The three LGAs with the lowest Year 12 completions were: Mount Alexander (60.4%), Loddon
(62.0%) and Central Goldfields (62.2%).
Table 52. Persons Aged 20-24 Years Schooling Completion Rates (ABS Census 2006) by LGA and Region
LGA
Year 12 or equivalent / Certificate II
or above
Other Year 11
or equivalent
Other Year 10 or
equivalent or below
Other Did not
go to school Not Stated
Total Persons
aged 20-24
% Year 12 or equivalent / Certificate II or above in
total
NMLLEN Region
Mildura (RC) 1,750 237 472 6 195 2,660 65.8
Other Regions
Greater Shepparton (C) 2,238 270 545 21 188 3,262 68.6
Campaspe (S) 1,110 152 301 6 89 1,658 66.9
Swan Hill (RC) 715 86 190 15 113 1,119 63.9
Metro and Regional Victoria
Victoria Average 267,054 17,317 28,148 889 25,312 338,720 78.8
Regional Victoria Average 46,459 5,056 9,010 150 3,761 64,436 72.1
Metropolitan Melbourne Average 214,402 11,781 18,298 736 21,025 266,242 80.5
Source: ABS Census 2006 AGEP Age by Local Government Areas (UR) by Highest Schooling/Qualification for Person Records
4.2.3 Destinations of School Students - Year 12 Completions The following table shows the destinations of Year 12 completers for the period 2003-2010. The long term trend shows that the share going to university has increased (to 37% in 2010).
Table 53. On Track Year 12 Completer Destinations - Northern Mallee LLEN 2003-2010
Northern Mallee LLEN
Un
iver
sity
VE
T C
ert
IV+
En
try
Lev
el V
ET
Ap
pre
nti
cesh
ip
Tra
inee
ship
Em
plo
yed
Fu
ll T
ime
Em
plo
yed
P
art
Tim
e
Lo
oki
ng
for
Wo
rk
Def
erre
d
Total
2010 No 151 40 20 23 26 29 46 20 52 407
% 37.1 9.8 4.9 5.7 6.4 7.1 11.3 4.9 12.8 100.0
2009 No 113 26 15 19 24 19 41 21 89 369
% 30.6 7.0 4.1 5.1 6.5 5.1 11.1 5.7 24.1 100.0
2008 No 116 35 20 22 30 42 30 11 68 374
% 31.0 9.4 5.3 5.9 8.0 11.2 8.0 2.9 18.2 100.0
2007 No 89 17 5 19 13 17 16 10 42 228
% 39.0 7.5 2.2 8.3 5.7 7.5 7.0 4.4 18.4 100.0
2006 No 94 31 8 19 13 20 21 6 33 245
% 38.4 12.7 3.3 7.8 5.3 8.2 8.6 2.4 13.5 100.0
2005 No 90 43 22 31 22 37 53 21 17 336
% 26.8 12.8 6.5 9.2 6.5 11.0 15.8 6.3 5.1 100.0
2004 No 99 25 20 20 11 29 45 13 20 282
% 35.1 8.9 7.1 7.1 3.9 10.3 16.0 4.6 7.1 100.0
2003 No 118 53 38 17 16 45 70 23
380
% 31.1 13.9 10.0 4.5 4.2 11.8 18.4 6.1
100.0
Source: DEECD Data (LLEN Data Disc 2011)
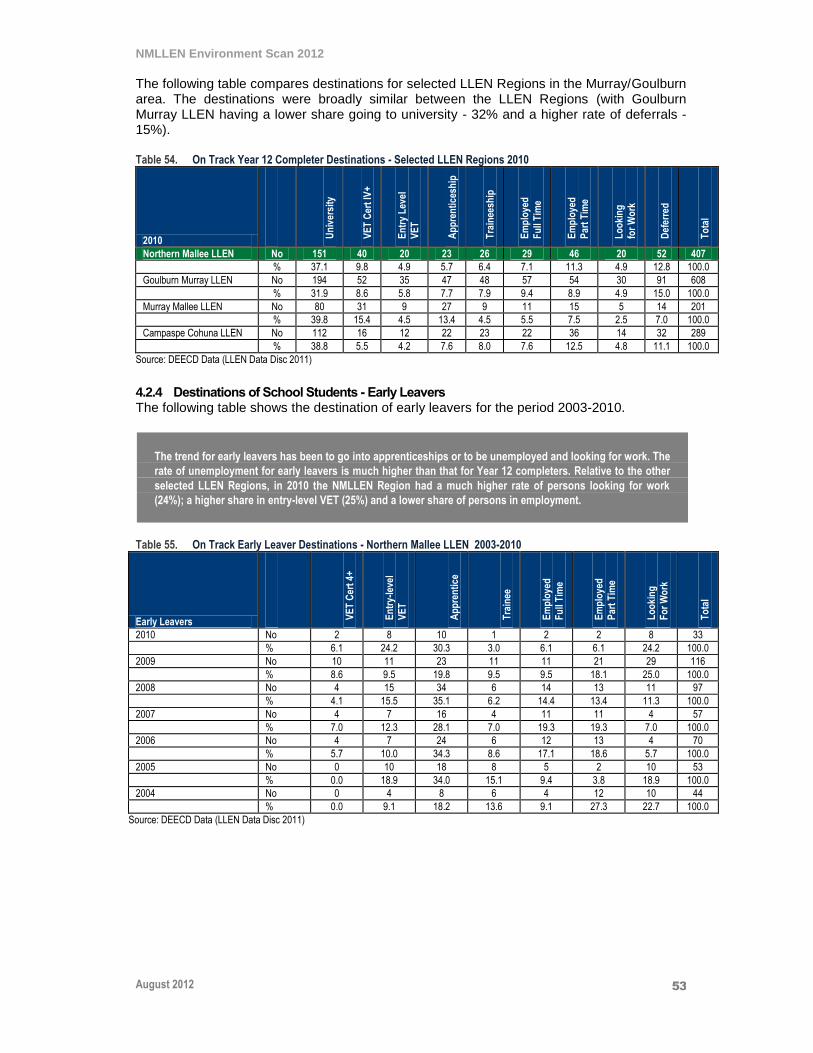
NMLLEN Environment Scan 2012
August 2012
53
The following table compares destinations for selected LLEN Regions in the Murray/Goulburn area. The destinations were broadly similar between the LLEN Regions (with Goulburn Murray LLEN having a lower share going to university - 32% and a higher rate of deferrals -15%). Table 54. On Track Year 12 Completer Destinations - Selected LLEN Regions 2010
2010
Un
iver
sity
VE
T C
ert
IV+
En
try
Lev
el
VE
T
Ap
pre
nti
cesh
ip
Tra
inee
ship
Em
plo
yed
Fu
ll T
ime
Em
plo
yed
Par
t T
ime
Lo
oki
ng
fo
r W
ork
Def
erre
d
To
tal
Northern Mallee LLEN No 151 40 20 23 26 29 46 20 52 407
% 37.1 9.8 4.9 5.7 6.4 7.1 11.3 4.9 12.8 100.0
Goulburn Murray LLEN No 194 52 35 47 48 57 54 30 91 608
% 31.9 8.6 5.8 7.7 7.9 9.4 8.9 4.9 15.0 100.0
Murray Mallee LLEN No 80 31 9 27 9 11 15 5 14 201
% 39.8 15.4 4.5 13.4 4.5 5.5 7.5 2.5 7.0 100.0
Campaspe Cohuna LLEN No 112 16 12 22 23 22 36 14 32 289
% 38.8 5.5 4.2 7.6 8.0 7.6 12.5 4.8 11.1 100.0
Source: DEECD Data (LLEN Data Disc 2011)
4.2.4 Destinations of School Students - Early Leavers The following table shows the destination of early leavers for the period 2003-2010.
The trend for early leavers has been to go into apprenticeships or to be unemployed and looking for work. The
rate of unemployment for early leavers is much higher than that for Year 12 completers. Relative to the other
selected LLEN Regions, in 2010 the NMLLEN Region had a much higher rate of persons looking for work
(24%); a higher share in entry-level VET (25%) and a lower share of persons in employment.
Table 55. On Track Early Leaver Destinations - Northern Mallee LLEN 2003-2010
Early Leavers
VE
T C
ert
4+
En
try-
leve
l
VE
T
Ap
pre
nti
ce
Tra
inee
Em
plo
yed
F
ull
Tim
e
Em
plo
yed
Par
t T
ime
Lo
oki
ng
F
or
Wo
rk
To
tal
2010 No 2 8 10 1 2 2 8 33
% 6.1 24.2 30.3 3.0 6.1 6.1 24.2 100.0
2009 No 10 11 23 11 11 21 29 116
% 8.6 9.5 19.8 9.5 9.5 18.1 25.0 100.0
2008 No 4 15 34 6 14 13 11 97
% 4.1 15.5 35.1 6.2 14.4 13.4 11.3 100.0
2007 No 4 7 16 4 11 11 4 57
% 7.0 12.3 28.1 7.0 19.3 19.3 7.0 100.0
2006 No 4 7 24 6 12 13 4 70
% 5.7 10.0 34.3 8.6 17.1 18.6 5.7 100.0
2005 No 0 10 18 8 5 2 10 53
% 0.0 18.9 34.0 15.1 9.4 3.8 18.9 100.0
2004 No 0 4 8 6 4 12 10 44
% 0.0 9.1 18.2 13.6 9.1 27.3 22.7 100.0
Source: DEECD Data (LLEN Data Disc 2011)

NMLLEN Environment Scan 2012
August 2012
54
Table 56. On Track Early Leaver Destinations by LLEN - Selected LLEN Regions 2010
2010
VE
T C
ert
4+
En
try-
leve
l VE
T
Ap
pre
nti
ce
Tra
inee
Em
plo
yed
Fu
ll T
ime
Em
plo
yed
Par
t T
ime
Lo
oki
ng
F
or
Wo
rk
To
tal
Northern Mallee LLEN No 2 8 10 1 2 2 8 33
% 6.1 24.2 30.3 3.0 6.1 6.1 24.2 100.0
Goulburn Murray LLEN No 6 9 21 8 11 5 9 69
% 8.7 13.0 30.4 11.6 15.9 7.2 13.0 100.0
Murray Mallee LLEN No 8 13 24 8 7 5 3 68
% 11.8 19.1 35.3 11.8 10.3 7.4 4.4 100.0
Campaspe Cohuna LLEN No 1 2 15 5 8 3 7 41
% 2.4 4.9 36.6 12.2 19.5 7.3 17.1 100.0
Source: DEECD Data (LLEN Data Disc 2011)
4.2.5 Student Family Data The following tables show family occupation data for the NMLLEN Region for Year 10-12 enrolments for the period 2006-2010. The data shows that in 2010, 45% of students’ families were in the lower occupation group (D) or not employed (N) and 35% were in senior management or professional jobs.
Relative to the other LLEN Regions, Northern Mallee had a higher percentage of parents in senior
management or professional jobs.
Table 57. Student Family Occupation Data, Year 10-12 Government Schools - NMLLEN Region 2006-2010
Northern Mallee LLEN <Mildura LGA>
A=
Sen
ior
Man
ager
B=
Pro
fess
ion
al
C=
Tra
des
/ Off
ice
D=
Mac
hin
e O
p/L
abo
ure
rs
N=
No
t em
plo
yed
D +
N
U=
un
kno
wn
To
tal
2010 FTE Enrolments 186 403 325 441 307 748 4 1,666
Allocation (%) 11.2 24.2 19.5 26.5 18.4 44.9 0.2 100.0
2009 FTE Enrolments 193.6 420.9 294.8 418.5 285.4 703.9 1.0 1,614.2
Allocation (%) 12.0 26.1 18.3 25.9 17.7 43.6 0.1 100
2008 FTE Enrolments 205.3 458 317.2 295.9 175.9 471.8 42.4 1,494.7
Allocation (%) 13.7 30.6 21.2 19.8 11.8 31.6 2.8 100
2007 FTE Enrolments 181.6 470.3 322.5 312.3 163.8 476.1 63.4 1,513.9
Allocation (%) 12.0 31.1 21.3 20.6 10.8 31.4 4.2 100
2006 FTE Enrolments 162.7 502 264 304.8 173 477.8 70 1,476.5
Allocation (%) 11.0 34.0 17.9 20.6 11.7 32.4 4.7 100
Source: DEECD Data (Government Schools only)

NMLLEN Environment Scan 2012
August 2012
55
Table 58. Student Family Occupation Data, Year 10-12 Government Schools - Selected LLEN Regions 2010
Local Learning and Employment Network
Lo
cal
Go
vern
men
t
Are
a
A=
Sen
ior
Man
ager
B=
Pro
fess
ion
al
C=
Tra
des
/O
ffic
e
D=
Mac
hin
e
Op
/Lab
ou
rers
N=
No
t
emp
loye
d
D +
N
U=
un
kno
wn
To
tal
Northern Mallee Mildura (RC)
FTE Enrolments 186 403 325 441 307 748 4 1666
(%) 11.2 24.2 19.5 26.5 18.4 44.9 0.2 100.0
Goulburn Murray Greater Shepparton (C)
FTE Enrolments
86 315 374 455 355 810 22 1607
(%) 5.4 19.6 23.3 28.3 22.1 50.4 1.4 100.0
Campaspe Cohuna Campaspe (S)
FTE Enrolments 80 300 245 336 109 445 20 1090
(%) 7.3 27.5 22.5 30.8 10.0 40.8 1.8 100.0
Murray Mallee & Northern Mallee (Robinvale)
Swan Hill (RC)
FTE Enrolments
34 165 97 166 120 286 1 583
(%) 5.8 28.3 16.6 28.5 20.6 49.1 0.2 100.0
Source: DEECD Data (Government Schools only)
4.3 VET in Schools Delivery
4.3.1 Overview All schools in the region are active in delivering VET to their students. Current delivery is across a wide range of areas covering traditional trades, skills in demand and emerging industries. The following table from the MRTTC submission provides data on total delivery in 2009. It shows that 667 students were undertaking VET programs, with 405 in programs to be covered by the MRTTC. A total of 127 students were in taster programs.
38
Table 59. Current Delivery of VET Programs - Mildura Cluster Schools 2009
VETIS Enrolments in Mildura Cluster Schools
2009 Total
Enrolments MRTTC Fields
Taster Programs
Chaffey Secondary College 71 58 66
Coomealla High School 70 45 0
Henderson College 19 19 0
Irymple Secondary College 18 10 61
Merbein Secondary College 0 0 0
Mildura Senior College 342 189 0
Mildura Specialist School 0 0 0
Red Cliffs Secondary College 48 25 0
St. Joseph's College 65 32 0
Trinity Lutheran College 31 27 0
Two Rivers College 0 0 0
Werrimull P-12 School 3 0 0
Total 667 405 127
Source: VET Training Provision Audit 2009
38 Trade Training Centres in School Program: Round Two Application, Mildura Region Trade Training Centre, Background Report - June 2009 P33
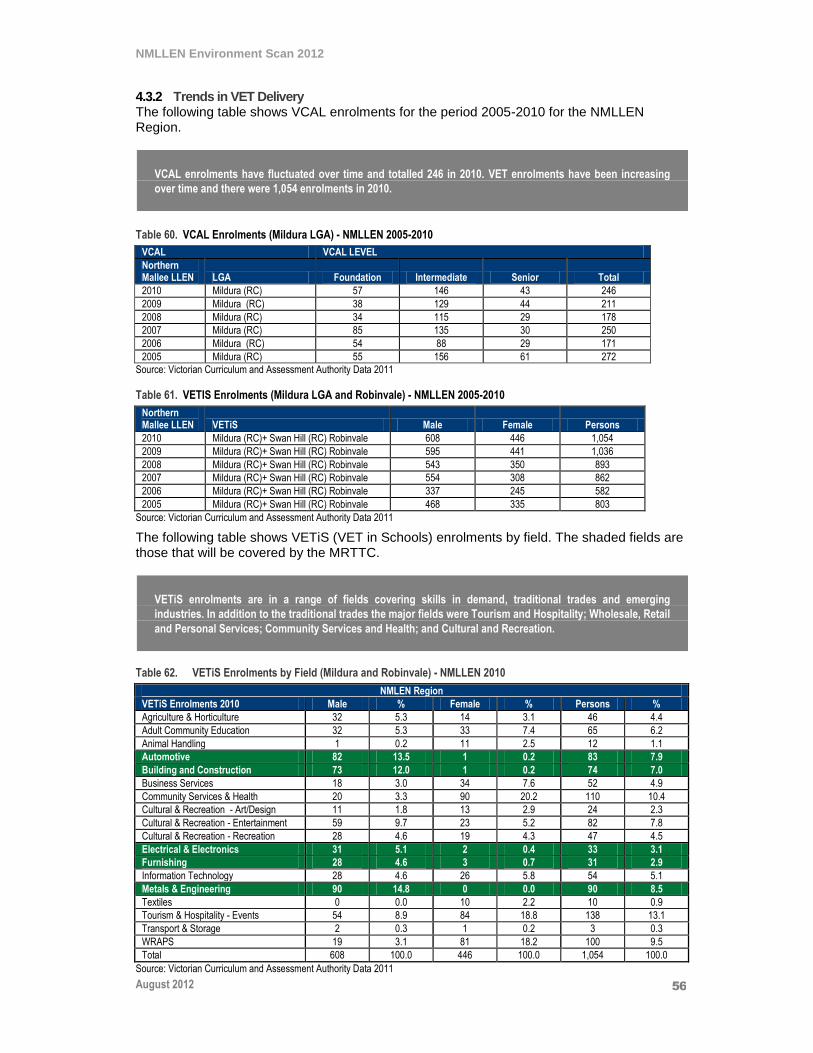
NMLLEN Environment Scan 2012
August 2012
56
4.3.2 Trends in VET Delivery The following table shows VCAL enrolments for the period 2005-2010 for the NMLLEN Region.
VCAL enrolments have fluctuated over time and totalled 246 in 2010. VET enrolments have been increasing
over time and there were 1,054 enrolments in 2010.
Table 60. VCAL Enrolments (Mildura LGA) - NMLLEN 2005-2010
VCAL VCAL LEVEL
Northern Mallee LLEN LGA Foundation Intermediate Senior Total
2010 Mildura (RC) 57 146 43 246
2009 Mildura (RC) 38 129 44 211
2008 Mildura (RC) 34 115 29 178
2007 Mildura (RC) 85 135 30 250
2006 Mildura (RC) 54 88 29 171
2005 Mildura (RC) 55 156 61 272
Source: Victorian Curriculum and Assessment Authority Data 2011
Table 61. VETIS Enrolments (Mildura LGA and Robinvale) - NMLLEN 2005-2010
Northern Mallee LLEN VETiS Male Female Persons
2010 Mildura (RC)+ Swan Hill (RC) Robinvale 608 446 1,054
2009 Mildura (RC)+ Swan Hill (RC) Robinvale 595 441 1,036
2008 Mildura (RC)+ Swan Hill (RC) Robinvale 543 350 893
2007 Mildura (RC)+ Swan Hill (RC) Robinvale 554 308 862
2006 Mildura (RC)+ Swan Hill (RC) Robinvale 337 245 582
2005 Mildura (RC)+ Swan Hill (RC) Robinvale 468 335 803
Source: Victorian Curriculum and Assessment Authority Data 2011
The following table shows VETiS (VET in Schools) enrolments by field. The shaded fields are those that will be covered by the MRTTC.
VETiS enrolments are in a range of fields covering skills in demand, traditional trades and emerging
industries. In addition to the traditional trades the major fields were Tourism and Hospitality; Wholesale, Retail
and Personal Services; Community Services and Health; and Cultural and Recreation.
Table 62. VETiS Enrolments by Field (Mildura and Robinvale) - NMLLEN 2010
NMLEN Region
VETiS Enrolments 2010 Male % Female % Persons %
Agriculture & Horticulture 32 5.3 14 3.1 46 4.4
Adult Community Education 32 5.3 33 7.4 65 6.2
Animal Handling 1 0.2 11 2.5 12 1.1
Automotive 82 13.5 1 0.2 83 7.9
Building and Construction 73 12.0 1 0.2 74 7.0
Business Services 18 3.0 34 7.6 52 4.9
Community Services & Health 20 3.3 90 20.2 110 10.4
Cultural & Recreation - Art/Design 11 1.8 13 2.9 24 2.3
Cultural & Recreation - Entertainment 59 9.7 23 5.2 82 7.8
Cultural & Recreation - Recreation 28 4.6 19 4.3 47 4.5
Electrical & Electronics 31 5.1 2 0.4 33 3.1
Furnishing 28 4.6 3 0.7 31 2.9
Information Technology 28 4.6 26 5.8 54 5.1
Metals & Engineering 90 14.8 0 0.0 90 8.5
Textiles 0 0.0 10 2.2 10 0.9
Tourism & Hospitality - Events 54 8.9 84 18.8 138 13.1
Transport & Storage 2 0.3 1 0.2 3 0.3
WRAPS 19 3.1 81 18.2 100 9.5
Total 608 100.0 446 100.0 1,054 100.0
Source: Victorian Curriculum and Assessment Authority Data 2011

NMLLEN Environment Scan 2012
August 2012
57
4.3.3 VET Clusters There are active VET clusters in the region. The Sunraysia Careers Association (SCA) is a local network of school careers advisors, RTO pathway advisors, Job Services Australia personnel, University student advisors and the NMLLEN. The SCA provides a forum for sharing of information; coordinates work experience programs; and conducts career related events across the year.
NMLLEN has an active VET Consortium, which was formed to secure funding for the Mildura Region Trade Training Centre. The consortium comprises 12 schools in the region. The members include Government, Catholic and Independent Schools, with Mildura Senior College as the lead school.
Table 63. VET Consortium Schools – MRTTC
Schools - Mildura Region TTC
Chaffey Secondary College Mildura Specialist School
Coomealla High School (NSW) Red Cliffs Secondary College
Henderson College St. Joseph’s College
Irymple Secondary College Trinity Lutheran College
Merbein Secondary College Two Rivers College
Mildura Senior College Werrimull P-12 School
4.4 Indigenous Programs
The participation of Indigenous young persons in education and training is much lower than that for the
general population. They also make up a high proportion of disengaged youth in the region.
There are a range of programs to provide support for young people: to remain in school; to transition to further education and training; and to secure employment. Data on education participation shows a low rate of retention into senior years and a very low rate of Year 12 completion for local Indigenous students.
NMLLEN along with schools and other organisations in the region have identified Indigenous education,
training and employment transitions as a major priority. Use is made of a number of Australian Government
and Victoria Government programs including: Dare to Lead (Transition for Koories from Year 10 to Year 11);
Wannik Strategy (Indigenous students in DEECD Schools); the Indigenous Employment Program (DEEWR)
and the Clontarf Academy.

NMLLEN Environment Scan 2012
August 2012
58
Indigenous Programs
Dare to Lead (Transition for Koories from Year 10 to Year 11) http://www.daretolead.edu.au/
Dare to Lead is a Commonwealth funded national project with a focus on improving educational outcomes for Aboriginal and Torres Strait Islander students. A Mildura based pilot program has focused on supporting the transition of all Koorie students from Year 10 to Year 11; engaging parents; and assisting students to identify their preferred Year 11 destination. All Koorie students have Individual Learning Plans/Managed Individual Pathways. A project team involves representatives of Dare to Lead, DEEWR, the Victorian Wannik Unit, LAECG, Mildura Senior College (Year 11-12), Chaffey Secondary College (Year 7-10) and key community members.
Wannik Strategy (Indigenous students in DEECD Schools) http://www.education.vic.gov.au/about/directions/wannik/aboutwannik.htm
The Wannik Strategy commenced in 2008 and has a focus on: assisting student engagement; providing more literacy and numeracy support; and involving parents. All government schools develop an Individual Education Plan (IEP) for each Koorie student in a partnership between teacher, student, parent/caregiver and Koorie support worker. The plan covers key transition points from pre-school to school, primary to secondary and compulsory to post-compulsory education. This program includes: extending Managed Individual Pathways (MIPS) initiative into Years 8 and 9 for Koorie students at risk of disengaging from school; developing special Youth Transition Support Initiatives in locations where there is a high concentration of disengaged Koorie young people; providing accelerated literacy and numeracy support; scholarships for high-performing Koorie students; and School Community Partnership agreements in schools that have Koorie students enrolled.
Indigenous Employment Program (DEEWR)
The Indigenous Employment Program (IEP) aims to increase Indigenous Australians employment outcomes and participation in economic activities, as part of the commitment to halving the gap between Indigenous and non-Indigenous employment outcomes within a decade. The program provides support for employment; encouragement and support for training and employment opportunities; assistance for the development of Indigenous workforce and economic development strategies; and support for the development of sustainable Indigenous businesses.
Clontarf Academy http://www.clontarffootball.com/
The Clontarf Foundation operates a number of Academies in regions for Aboriginal boys. The academies in partnership with local schools are focused on behavioral change and assisting students to complete school and secure employment. The Mildura Academy involves: Mildura Senior College and Chaffey Secondary College. The Robinvale Academy involves Robinvale P-12 College.
4.5 Parents and Families
4.5.1 Issues There are several indicators that highlight family issues:
The Mildura Region has a higher proportion of one parent families (18.1%) than for regional Victoria (15.5%).
39 The Northern Mallee LLEN area also has a significantly
higher rate of teenage mothers (one of the highest in Victoria), who are in many cases disengaged from education.
40
Child maltreatment is influenced by socio-economic conditions such as employment and income levels. Department of Human Services data indicates that the Mildura Region has a high reported rate (at 17.2 substantiated cases of child maltreatment per 1000 children), which is three times that of the Melbourne metropolitan area (5.7 cases per 1000 children).
41
In terms of family income, the region has a higher proportion of families on a low family income (28.0%) than the proportions for regional Victoria (26.8%) and for Melbourne (20.1%).
42
39 Mildura Social Indicators Report 2008, Mildura Rural City Council 40 Mildura Social Indicators Report 2008, Mildura Rural City Council 41 Mildura Social Indicators Report 2008, Mildura Rural City Council 42 Mildura Social Indicators Report 2008, Mildura Rural City Council
NMLLEN Environment Scan 2012
August 2012
59
A broader issue in increasing the education participation, retention and completions of young people is
having parents become more engaged with schools and with education decisions for their children.
4.5.2 Programs There are a number of programs in the region.
Discussions with the Local Community Partnership (LCP) in 2009 indicated the ongoing need for the Parents as Career Transition Support (PACTS) program throughout the region. The Brotherhood of St Laurence’s PACTS program equips parents to help their children make informed decisions.
Within the Indigenous community, the key organisations recognise that partnerships with parents and families of Koorie youth would be a major factor in improving engagement with schools and education. This view is shared by the Local Aboriginal Education Consultative Group (LAECG), school based Koorie educators, Murray Valley Wurreker Broker and other Indigenous community representatives.
43 The
Parental and Community Engagement Program (PaCE) has been identified as a successful tool for engaging Koorie parents and families.
44
Many Koorie children start school without having access to kindergarten or attending play school. Mallee Family Care has recently established a Children and Families Education Partner Program in Robinvale, which aims to work intensively with vulnerable families to address barriers that are preventing them from accessing educational services.
Mallee Family Care and Mildura Primary School (which has a high Indigenous student population) have implemented the ‘Total Learning Centre’, which provides a place for young families to access a range of services and spend time playing, reading, telling stories and learning in a supportive environment.
43 Forum hosted by NMLLEN for the ACER State-wide Indigenous Youth Transitions Project in July 2009. 44 The PaCE Program is a community driven program which focuses on the development and implementation of creative and innovative approaches to improve the educational outcomes of Indigenous school students through enhancing Indigenous parental engagement with schools and education providers. The PaCE Program supports Indigenous families and communities to ‘reach-in’ to schools and education providers and to develop partnerships with them with the aim of enhancing their children’s educational outcomes. http://www.deewr.gov.au/Indigenous/Schooling/Programs/Pages/ParentalandCommunityEngagementProgram.aspx

NMLLEN Environment Scan 2012
August 2012
60
5 Existing Programs
5.1 NMLLEN Programs
5.1.1 Overview
NMLLEN is active in delivering several major programs and in facilitating the take up of other programs in the
region. The major programs being delivered by the NMLLEN are the Workplace Learning Coordinator program;
the Mildura Region Trade Training Centre; and School Business Community Partnership Brokers. NMLLEN is
involved with schools, business and the community in facilitating the delivery of Youth Career and Transition
Programs-Youth Connections; and Youth Partnerships.
5.1.2 Existing Programs The major programs being delivered by NMLLEN are: Mildura Region Trade Training Centre; Workplace Learning Coordinator Program; and the School Business Community Partnership Brokers Program (SBCPB).
Program
Delivered by NMLLEN
Mildura Region Trade Training Centre
NMLLEN established a consortium of 12 schools including Government, Catholic, Independent and a NSW High School which was successful in securing $12.8 million for the development of a Trade Training Centre (TTC). The focus of the centre is on increasing participation in VET programs and providing transitions for students into training and employment. Two major Trade Training Sites, Deakin TTC (Mildura Senior College) and Riverside TTC (St. Joseph's College) as well as facility and equipment upgrades at the other participating schools. These new facilities and the model of delivery will see a doubling of the number of young people accessing VET at Certificate II level in schools over the next 4-5 years. The program will also have a specific focus on Indigenous students, Culturally and Linguistically Diverse students and students with disabilities. NMLLEN is project managing the design and construction of the TTC and working on the development of operational policies and systems for the TTC, which will commence operations in 2013.
Workplace Learning Coordinator Program
NMLLEN is delivering this program to coordinate work placements for School-Based Apprenticeships and Traineeships, Structured Workplace Learning and Work Experience programs. The Workplace Learning Coordinator is working with secondary schools, SuniTAFE, ACE providers and local employers to secure placements. The objectives are: to increase the number of young people undertaking workplace learning placements in those industries that provide employment prospects for young people; to increase the alignment between VCAL and VET provision and local industry needs; and to increase the number of Koorie young people undertaking workplace learning placements. NMLLEN aims to increase the number of workplace learning opportunities available to young people in the Mildura region by 50% in the next three years. The Workplace Learning Coordinator is involved in securing an increased number of workplace learning placement opportunities and to develop opportunities for School Based Apprenticeships in areas including local government, business services and retail. Other activities include promoting job pathways in the food and beverage sector; and opportunities in early childhood development. The focus of the program is to inform students about industry in the region and the diverse range of career pathways that are available. The long term objective is to also increase workplace learning and apprenticeship opportunities. Initiatives have included: 50 in Five and the Teacher Industry Education Day in May 2011 at Boundary Bend Estate with Mildura Development Corporation; and Food Processing Workplace Scholarships.
School Business Community Partnership Brokers Program (SBCPB)
Local delivery of the School Business Community Partnership Brokers program is by the NMLLEN (for service area VIC24). The program is involved in developing local sustainable partnerships that can improve education participation and successful transitions to further education, training or employment for young people. A focus is on lifting the current Year 12 (or equivalent) attainment rate by 2015. NMLLEN is working with education and training providers, businesses, community groups and families in the NMLLEN region. The focus is on facilitating partnerships to address identified local issues in the Mildura and Robinvale areas. Priority areas are: education participation, transitions to further education and training and disengaged youth and Koorie education.

NMLLEN Environment Scan 2012
August 2012
61
5.1.3 Facilitation
The major programs being facilitated by the NMLLEN are: Unlocking Sunraysia’s Potential (USP); Youth
Connections; Youth Partnerships; and the Workforce Development Strategy for the Mildura Wine, Olive and
Beverage Industries. The NMLLEN has been active in the community in bringing key organisations together to
identify key education, training and employment opportunities; to develop solutions; and to access
government programs (Australian Government and Victorian Government).
Program
Facilitation and Partnerships
Unlocking Sunraysia’s Potential (USP) The Key for Better Education Outcomes in the Mallee
NMLLEN has been an active participant in the development of the USP Blueprint which sets goals, strategies and key performance indicators for improved educational and employment outcomes for young people in the region. The partnership with USP links directly with the NMLLEN’s Regional Youth Commitment Project to develop a whole of community approach to work collaboratively to achieve successful outcomes for every young person, particularly vulnerable young people. USP focuses on three life stages:
Early Year’s Goal (birth to school) Goal 1: Every child will enjoy the best start in life.
School Year’s Goal (start of school to 18) Goal 2: School age youth will acquire skills to prepare them for further education, training and employment, and participation in community.
Young Adult Year’s Goal (post school to 24) Goal 3: All young adults access ongoing learning to prepare them for further education, training and employment, and participation in community.
Source: USP P2 The NMLLEN is partnering with the key stakeholders of the Unlocking Sunraysia's Potential including Mildura Rural City Council; Department of Justice, Victoria; DEECD; Mallee Family Care; and La Trobe University.

NMLLEN Environment Scan 2012
August 2012
62
Program
Facilitation and Partnerships
Youth Connections
Youth Connections is a safety net program for young people aged 13-19 years, who are at risk of not making a successful transition through and from school to further education, training or employment. It provides support through the tailored case management, mentoring, and alternative education. The aim is assist young persons to continue with their education and ultimately gain a Year 12 (or equivalent) level. It is a DEEWR program.
The Youth Connections service commenced on 1 January 2010. The service in Victoria focuses on reconnecting the most disengaged young people, but also supports schools in their efforts to assist transitions of their students. Mildura Rural City Council and Sunraysia Murray Group Training are the Youth Connections providers in the NMLLEN Area (VIC Service Area 26).
NMLLEN in partnership with Youth Connections and the DEECD, developed a 'Schools/Youth connections Interface Model' that provided a framework for the referral of young people at risk of leaving school to the Youth Connections program. It also identified pathways for disengaged young people back into the schooling system.
Youth Partnerships This is a Victorian Government initiative to develop new approaches for collaboration to support individual young people experiencing problems. This collaboration engages agencies involved with education, youth and family support, justice, homelessness and mental health. The key goals of Youth Partnerships are to improve engagement in education and training, and to reduce the escalation of social, individual and behavioral problems for vulnerable young people by developing tailored linked- up solutions.
Workforce Development Strategy ( Wine, Olive and Beverage Industries)
NMLLEN has worked with the Mildura Development Corporation and the industry on the implementation of the Workforce Development Strategy, including promotion of opportunities and pathways to teachers and to students.
Mental Health NMLLEN partnered with the National Disability Coordination Officer Program, Northern Mallee Primary Care Partnership and Beyond Blue to conduct two mental health workshops in April 2011: “Mental Health at Work-General” and “Mental Health at Work-Managers”. NMLLEN continued this partnership in 2012 with a focus on mental health and young people in schools. In May, NMLLEN co-hosted a youth mental health forum aimed at the education community.
Young Parents In partnership with Anne Webster (La Trobe University Social Work Honours student), NMLLEN facilitated a forum, Great Expectations for Teenage Mums to Complete Secondary Education (June 2011).45 The forum indicated the need for schools, agencies and community organisations to work collaboratively to provide support to enable teenage mothers to complete education and training.
45 Great Expectations: Reclaiming Education for Teenage Mothers – A Needs Assessment for Teenage Mothers to Complete Secondary Education in Mildura, Anne Webster (Thesis) La Trobe University School of Social Work and Social Policy, February 2011 reports on possible ways to support education and training such as: establishing an onsite child care and parenting centre; providing a flexible timetable and curriculum; providing supported housing and affordable transport for mothers attending school; and providing financial and parenting training. P48
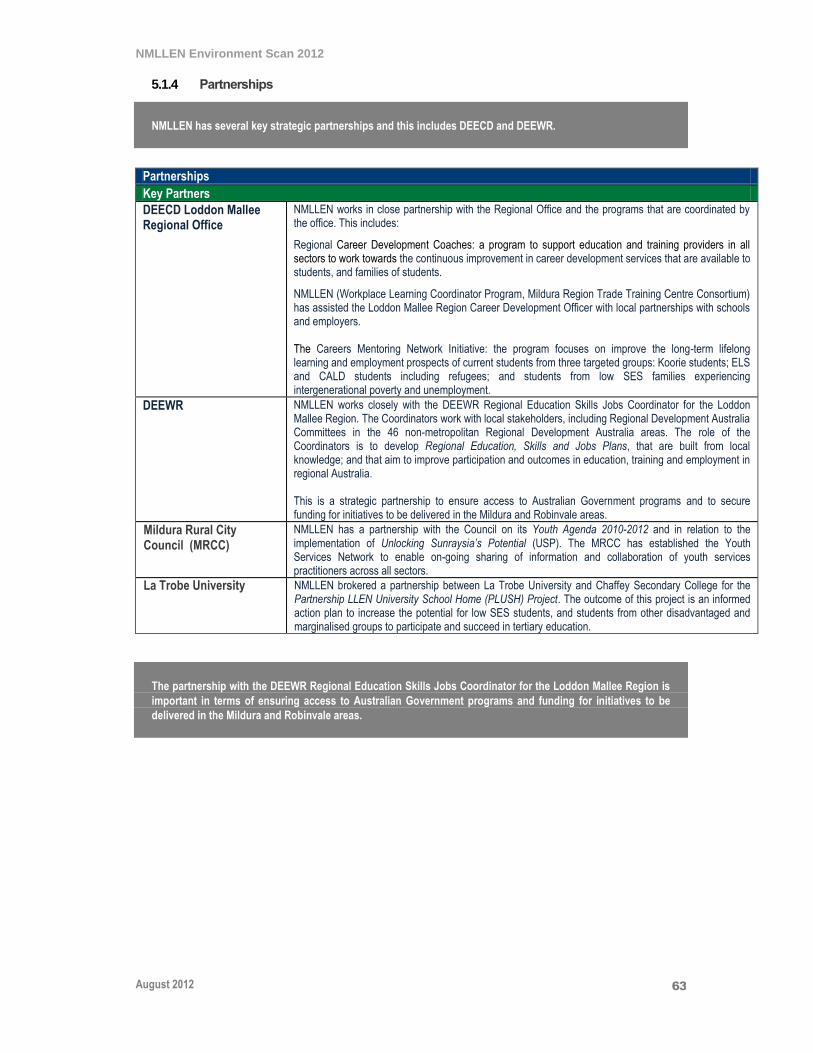
NMLLEN Environment Scan 2012
August 2012
63
5.1.4 Partnerships
NMLLEN has several key strategic partnerships and this includes DEECD and DEEWR.
Partnerships
Key Partners
DEECD Loddon Mallee Regional Office
NMLLEN works in close partnership with the Regional Office and the programs that are coordinated by the office. This includes:
Regional Career Development Coaches: a program to support education and training providers in all sectors to work towards the continuous improvement in career development services that are available to students, and families of students.
NMLLEN (Workplace Learning Coordinator Program, Mildura Region Trade Training Centre Consortium) has assisted the Loddon Mallee Region Career Development Officer with local partnerships with schools and employers. The Careers Mentoring Network Initiative: the program focuses on improve the long-term lifelong learning and employment prospects of current students from three targeted groups: Koorie students; ELS and CALD students including refugees; and students from low SES families experiencing intergenerational poverty and unemployment.
DEEWR
NMLLEN works closely with the DEEWR Regional Education Skills Jobs Coordinator for the Loddon Mallee Region. The Coordinators work with local stakeholders, including Regional Development Australia Committees in the 46 non-metropolitan Regional Development Australia areas. The role of the Coordinators is to develop Regional Education, Skills and Jobs Plans, that are built from local knowledge; and that aim to improve participation and outcomes in education, training and employment in regional Australia. This is a strategic partnership to ensure access to Australian Government programs and to secure funding for initiatives to be delivered in the Mildura and Robinvale areas.
Mildura Rural City Council (MRCC)
NMLLEN has a partnership with the Council on its Youth Agenda 2010-2012 and in relation to the implementation of Unlocking Sunraysia’s Potential (USP). The MRCC has established the Youth Services Network to enable on-going sharing of information and collaboration of youth services practitioners across all sectors.
La Trobe University NMLLEN brokered a partnership between La Trobe University and Chaffey Secondary College for the Partnership LLEN University School Home (PLUSH) Project. The outcome of this project is an informed action plan to increase the potential for low SES students, and students from other disadvantaged and marginalised groups to participate and succeed in tertiary education.
The partnership with the DEEWR Regional Education Skills Jobs Coordinator for the Loddon Mallee Region is
important in terms of ensuring access to Australian Government programs and funding for initiatives to be
delivered in the Mildura and Robinvale areas.
NMLLEN Environment Scan 2012
August 2012
64
6 Challenges and Opportunities
6.1 Major Challenges
6.1.1 Economic Context As an agribusiness based region, the Mildura Region faces a number of challenges and some of these were identified in the Loddon Mallee (Northern Region) Report. These factors include: the impact of climatic conditions; global commodity price cycles; and future decisions on the Murray-Darling Basin Plan (a shift in water allocation from irrigation to environmental flows).
Other challenges include securing local employment opportunities; meeting skills shortages; providing access to services (particularly for smaller towns); and dealing with disadvantage in the region.
46
The Loddon Mallee Regional Strategic Plan Northern Region sets a strategic context for the broader region of which Mildura is a major centre. It recognises the ongoing importance of sustainable agriculture to the region and its communities. The areas that are covered by the NMLLEN are dependent on agribusiness activity (horticulture, agriculture, processing industries and support industries). As the major centre in the region, Mildura is experiencing population growth due to retirement living and some growth in tourism. It is also a major service centre for a cross-border population. Priority actions for economic diversification include: facilitating the development of large-scale solar energy generation facilities; investment in tourism infrastructure; and attraction of investment in high value agriculture production and added value processing. The focus of Strategic Direction 5 - Improve education and training outcomes is consistent with government objectives (State and Commonwealth) and the directions that have been taken by the NMLLEN and its partners. This includes: increasing Year 12 completion rates and improving participation in tertiary education and training courses, particularly for disadvantaged groups (Priority Action 5.1); and action on Indigenous education, training and employment participation (and on other issues including health issues and teen pregnancies).
47
There is also a recognised need to act on workforce skills gaps in key economic growth areas including: construction; education; transport and logistics; and health. A priority is on creating better linkages between education and training (schools, VET providers and universities) and identified industry skills requirements.
48
A Mildura Region strategy has been prepared for the wine, olive and beverage industries and NMLLEN is
active with industry in its implementation. 49 However there is a need for a broader workforce strategy to be
prepared for the region, which examines skill issues in key industry sectors.
46 Loddon Mallee Regional Strategic Plan Northern Region, Loddon Mallee Regional Development Australia Committee P9 47 The Aboriginal and Torres Strait Islander unemployment rate was three times the non-Indigenous unemployment rate at 15.8% compared with 5.3%. Loddon Mallee Regional Strategic Plan Northern Region, Loddon Mallee Regional Development Australia Committee P19 48 Loddon Mallee Regional Strategic Plan Northern Region, Loddon Mallee Regional Development Australia Committee P30 49 A Workforce Development Strategy for the Mildura Region Wine, Olive and Beverage Industries, Mildura Development Corporation December 2009

NMLLEN Environment Scan 2012
August 2012
65
6.1.2 Policy Context
The national/state policy context for activities has been set by The Council of Australian Governments
agreements and this includes: the National Partnership on Youth Attainment and Transitions; and the
Compact with Young Australians.
Policy Context
National Partnership on Youth Attainment and Transitions (NPYAT)
The Council of Australian Governments (COAG) meeting in July 2009 agreed to the National Partnership on Youth Attainment and Transitions (NPYAT).
The Partnership between the Australian Government, and the State and Territory Governments is focused on participation of young people in education and training, increased attainment levels and improved transitions from school. The target is for 90% of young people to attain a Year 12 or equivalent qualification by 2015. The second target is to increase the number of Indigenous students completing Year 12 or an equivalent by 2020.
A number of programs are linked to this partnership including: Workplace Learning Coordinators; Youth Connections; School Business Community Partnership Brokers; Koorie Transitions Coordinators; and Improved Career Development Services.
http://www.education.vic.gov.au/about/directions/nationalpartnerships/programs.htm
Compact with Young Australians
This is part of the National Partnership on Youth Attainment and Transitions (NPYAT) and the core elements of the Compact are:
A national requirement that young people remain in school until Year 10 (or an approved equivalent) and then in full-time education, training or employment (or a combination of these) until 17 years old.
An entitlement, for 15 to 24 year-olds, to an education or training place that focuses on completing Year 12 or an equivalent or a higher qualification.
Participation requirements that must be met for a young person to qualify for Youth Allowance (Other) and/or Family Tax Benefit Part A.
This policy context highlights that the NMLLEN can play a key practical role in: the identification of local
issues; the formulation and brokering of solutions; the development of local partnerships; and the delivery of
programs on the ground (directly or in partnership with other organisations).
This is particularly the case with DEEWR and its education and employment programs, and its coordination
through its regional office.
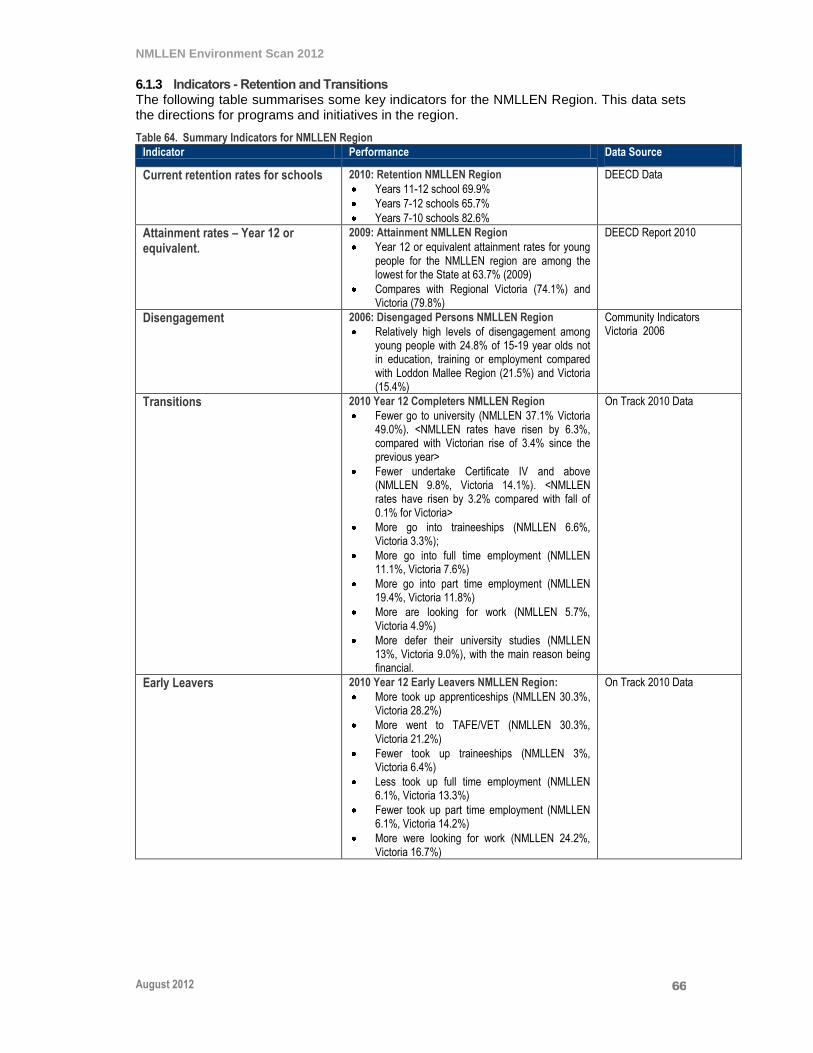
NMLLEN Environment Scan 2012
August 2012
66
6.1.3 Indicators - Retention and Transitions The following table summarises some key indicators for the NMLLEN Region. This data sets the directions for programs and initiatives in the region.
Table 64. Summary Indicators for NMLLEN Region Indicator Performance Data Source
Current retention rates for schools 2010: Retention NMLLEN Region
Years 11-12 school 69.9%
Years 7-12 schools 65.7%
Years 7-10 schools 82.6%
DEECD Data
Attainment rates – Year 12 or equivalent.
2009: Attainment NMLLEN Region
Year 12 or equivalent attainment rates for young people for the NMLLEN region are among the lowest for the State at 63.7% (2009)
Compares with Regional Victoria (74.1%) and Victoria (79.8%)
DEECD Report 2010
Disengagement 2006: Disengaged Persons NMLLEN Region
Relatively high levels of disengagement among young people with 24.8% of 15-19 year olds not in education, training or employment compared with Loddon Mallee Region (21.5%) and Victoria (15.4%)
Community Indicators Victoria 2006
Transitions 2010 Year 12 Completers NMLLEN Region
Fewer go to university (NMLLEN 37.1% Victoria 49.0%). <NMLLEN rates have risen by 6.3%, compared with Victorian rise of 3.4% since the previous year>
Fewer undertake Certificate IV and above (NMLLEN 9.8%, Victoria 14.1%). <NMLLEN rates have risen by 3.2% compared with fall of 0.1% for Victoria>
More go into traineeships (NMLLEN 6.6%, Victoria 3.3%);
More go into full time employment (NMLLEN 11.1%, Victoria 7.6%)
More go into part time employment (NMLLEN 19.4%, Victoria 11.8%)
More are looking for work (NMLLEN 5.7%, Victoria 4.9%)
More defer their university studies (NMLLEN 13%, Victoria 9.0%), with the main reason being financial.
On Track 2010 Data
Early Leavers 2010 Year 12 Early Leavers NMLLEN Region:
More took up apprenticeships (NMLLEN 30.3%, Victoria 28.2%)
More went to TAFE/VET (NMLLEN 30.3%, Victoria 21.2%)
Fewer took up traineeships (NMLLEN 3%, Victoria 6.4%)
Less took up full time employment (NMLLEN 6.1%, Victoria 13.3%)
Fewer took up part time employment (NMLLEN 6.1%, Victoria 14.2%)
More were looking for work (NMLLEN 24.2%, Victoria 16.7%)
On Track 2010 Data

NMLLEN Environment Scan 2012
August 2012
67
Indicator Performance Data Source
Koorie Enrolments 2006-2010 Koorie Enrolments NMLLEN Region
DEECD data on government school enrolments for the
Mildura LGA shows an increase in enrolments in Years
10-12.
2006 (Y10-12) 77
2010 (Y10-12) 101
DEECD Data - Enrolments in Government Schools in Mildura LGA <LLENs Data Disk 2011>
Student Family Occupation 2009 Student Family Occupation Data NMLLEN Region The share of students from families whose SFO category is D (Unskilled/Semi Skilled occupations) and N (Unemployed) has risen from 32.4% in 2006 to 43.6% in 2009.
DEECD Data <LLENs Data Disk 2010>
VET Enrolments at Schools 2010 VET Enrolments NMLLEN Region VET enrolments at schools currently represent approximately 9% of the student cohort.
DEECD Data <LLENs Data Disk 2010>
Teenage Parents Birth Rates for Young Women
The birth rate (per 1000 teenage women – aged 15-19
years) in Mildura LGA is over 2.5 times the average
for Victoria.
Rate Mildura Victoria
2004 20.7 10.6
2005 27.0 10.3
2006 31.9 11.2
2007 25.2 10.4
2008 27.0 10.6
Adolescent Community Profiles, DEECD 2010
Mental Health Mental Health
The Loddon Mallee Region had a higher rate of
adolescents reporting psychological distress
compared with Rural Victoria and Victoria overall
Adolescents Reporting Psychological Distress
2009
Loddon Mallee Region 16.1%
Rural Victoria 12.3%
Victoria 13.0%
Adolescent Community Profiles, DEECD 2010
The indicators highlight that more needs to be done to:
Increase completion rates of Year 12 or its equivalent, and this involves increasing retention rates at schools.
Improve the transitions to post compulsory education and training.
Improve education and training experiences and outcomes for Indigenous young people.
Re-engage young people who are disengaged from education, training and employment in the NMLLEN Region.
Increase the involvement of businesses with schools, including the development of more quality work placements and school based apprenticeships.
Enable teenage mothers to return to education and training.
Provide support to schools on mental health issues of young people.
NMLLEN Environment Scan 2012
August 2012
68
6.2 Future Directions
6.2.1 Strategy Goals In 2010 the Local Learning and Employment Networks expanded their role as a result of the Commonwealth Government's School Business Community Partnership Brokers (SBCPB) program. In Victoria's case, the SBCPB Program is being delivered through the existing LLEN network (enhanced LLENs). The expanded role incorporated a focus on 10-19 year olds and included brokering partnerships with primary schools, families and parents.
The strategic goals identified in the NMLLEN 2010-2013 Strategic Plan are:
Increase the retention of young people in education and training, particularly from low SES and CALD.
Increase the number of young people making transition to positive post-school destinations.
Increase the retention of Koorie young people in school settings.
Increase the number of young people re-engaged into positive destinations, including schooling.

NMLLEN Environment Scan 2012
August 2012
69
6.2.2 Major Initiatives 2012
NMLLEN has an active program for 2012. The major initiatives for 2012 continue on the work commenced over
the last two years and include: managing the design, construction and systems development for the Mildura
Region Trade Training Centre; shaping integrated programs to implement the Unlocking Sunraysia’s Potential
Strategy; assisting the development of a Flexible Learning Options (FLO) model; developing work placements
with the Workplace Learning Program; working on Indigenous programs; developing programs for young
parents; and focusing on mental health issues for young people in education.
Future Initiatives
Priorities and Directions Key Roles
Program Delivery Models Shaping innovative approaches Programs
Taking a lead
NMLLEN provides a vehicle for the development of local strategies, action plans and programs. A key role is identifying gaps in programs and brokering/developing solutions. A key role that the NMLLEN can play is in developing models for improved integration of programs to achieve a linked-up approach.
- Currently programs for early years and those for young people disengaged from education or at risk are fragmented.
- There is a need to define problems and issues and be responsive to local industry needs rather than being reactive to government funded programs.
Key Priorities
Mildura Region Trade Training Centre Supporting the establishment of the centre
NMLLEN continues to manage the project and this includes:
- Project management of design and construction phase.
- Facilitating the development of operational guidelines and systems for the centre.
- Development of industry linkages for the centre.
- Securing work placements for the MRTTC. - Providing guidance on management models for the facility.
Workplace Learning Program Securing more quality work placements
Continuation of an active program:
- Developing work placements across a range of industry sectors.
- Securing of work placements for the MRTTC.
- Developing a streamlined coordinated workplace model for schools and for businesses.
- Developing participation of larger regional employers in programs (e.g. national retailers, banks). Targeting of key sectors, including agribusiness, retail, services, and mining.
Unlocking Sunraysia's Potential Blueprint Implementation Implementing an action plan
NMLLEN is participating with MRCC, DEECD, Mallee Family Care and other stakeholders on the implementation of the USP Strategy, particularly as it relates to vulnerable young persons. This includes: the development of transitions programs, the development of a Flexible Learning Options (FLO) model and developing new training and support programs for vulnerable young persons (to develop skills for employment and life).
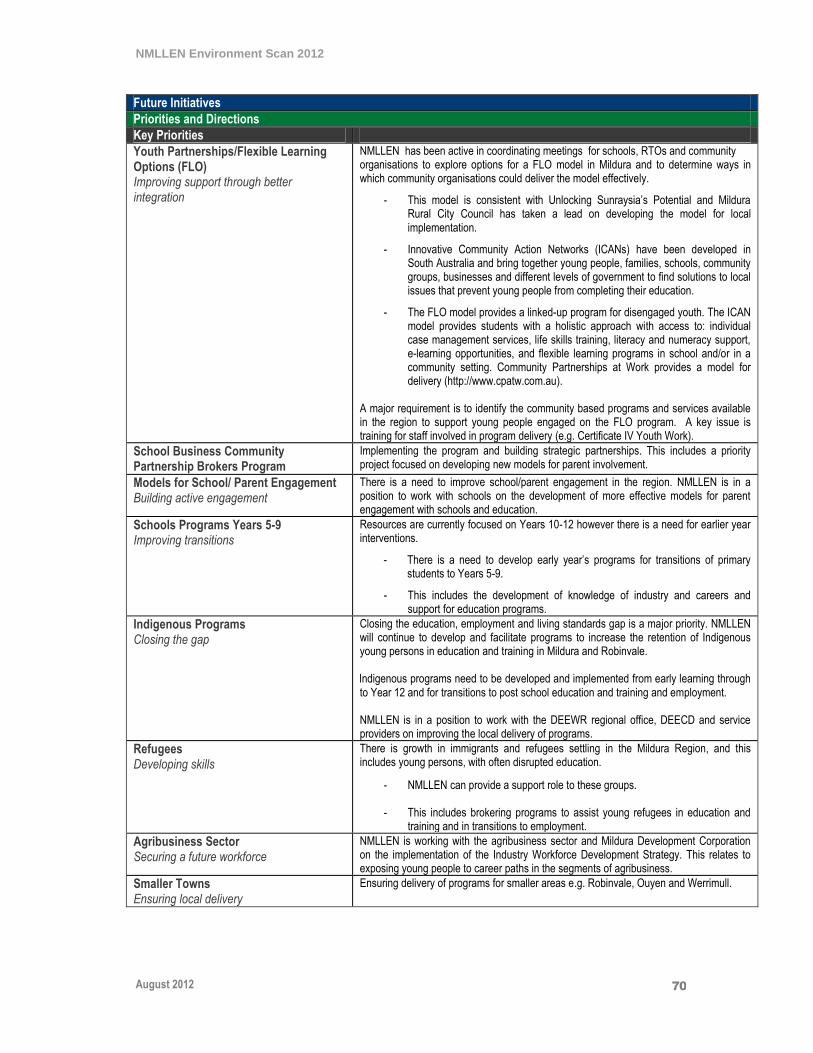
NMLLEN Environment Scan 2012
August 2012
70
Future Initiatives
Priorities and Directions
Key Priorities
Youth Partnerships/Flexible Learning Options (FLO) Improving support through better integration
NMLLEN has been active in coordinating meetings for schools, RTOs and community organisations to explore options for a FLO model in Mildura and to determine ways in which community organisations could deliver the model effectively.
- This model is consistent with Unlocking Sunraysia’s Potential and Mildura Rural City Council has taken a lead on developing the model for local implementation.
- Innovative Community Action Networks (ICANs) have been developed in South Australia and bring together young people, families, schools, community groups, businesses and different levels of government to find solutions to local issues that prevent young people from completing their education.
- The FLO model provides a linked-up program for disengaged youth. The ICAN model provides students with a holistic approach with access to: individual case management services, life skills training, literacy and numeracy support, e-learning opportunities, and flexible learning programs in school and/or in a community setting. Community Partnerships at Work provides a model for delivery (http://www.cpatw.com.au).
A major requirement is to identify the community based programs and services available in the region to support young people engaged on the FLO program. A key issue is training for staff involved in program delivery (e.g. Certificate IV Youth Work).
School Business Community Partnership Brokers Program
Implementing the program and building strategic partnerships. This includes a priority project focused on developing new models for parent involvement.
Models for School/ Parent Engagement Building active engagement
There is a need to improve school/parent engagement in the region. NMLLEN is in a position to work with schools on the development of more effective models for parent engagement with schools and education.
Schools Programs Years 5-9 Improving transitions
Resources are currently focused on Years 10-12 however there is a need for earlier year interventions.
- There is a need to develop early year’s programs for transitions of primary students to Years 5-9.
- This includes the development of knowledge of industry and careers and support for education programs.
Indigenous Programs Closing the gap
Closing the education, employment and living standards gap is a major priority. NMLLEN will continue to develop and facilitate programs to increase the retention of Indigenous young persons in education and training in Mildura and Robinvale.
Indigenous programs need to be developed and implemented from early learning through to Year 12 and for transitions to post school education and training and employment.
NMLLEN is in a position to work with the DEEWR regional office, DEECD and service providers on improving the local delivery of programs.
Refugees Developing skills
There is growth in immigrants and refugees settling in the Mildura Region, and this includes young persons, with often disrupted education.
- NMLLEN can provide a support role to these groups. - This includes brokering programs to assist young refugees in education and
training and in transitions to employment.
Agribusiness Sector Securing a future workforce
NMLLEN is working with the agribusiness sector and Mildura Development Corporation on the implementation of the Industry Workforce Development Strategy. This relates to exposing young people to career paths in the segments of agribusiness.
Smaller Towns Ensuring local delivery
Ensuring delivery of programs for smaller areas e.g. Robinvale, Ouyen and Werrimull.

NMLLEN Environment Scan 2012
August 2012
71
Future Initiatives
Priorities and Directions
Key Priorities
Young Parents Facilitating access to education and training
The Northern Mallee LLEN area has one of the highest teenage pregnancy rates in Victoria. Young mothers have special needs if they are to engage in education and training.
- Research: NMLLEN was active in 2011 in: supporting research (thesis by Anne Webster La Trobe University Social Work Honours student); and a forum on the issue.
- Support: following on the research, a 2012 priority is to develop partnerships and support arrangements to enable young parents to return to education and training (e.g. support - childcare, counselling, flexible learning options, transport, and housing).
Mental Health Supporting young people in schools
Mental health is a major issue in all communities. NMLLEN has a focus on mental health issues of young people in schools.
- Workshops - in 2011 NMLLEN partnered with other organisations for two workshops on mental health at work.
- Youth mental health is a priority for 2012, with key priorities being: mental health of young people in schools; development of programs with partner organisations; and the provision of information and support for teachers (information and training programs).
- A youth mental health forum (with a focus on the education community) was held in May 2012 and brought together a number of education, health and community organisations.
NMLLEN Environment Scan 2012
August 2012
72
References
ABS Business Register Data 2009
ABS Census 2006, Resident Population Data
ABS Census 2006, Working Population Data
ABS Census 2006 and 2011, Aboriginal and Torres Strait Islander Peoples (Indigenous) Profile
ABS Census 2011, Resident Population Data, Basic Community Profile
ABS Regional Population Australia (3218.0) - Population Estimates by Local Government Area, March 2012
Adolescent Community Profiles, DEECD 2010
Annual Report 2011, Northern Mallee Local Learning and Employment Network
DEEWR Small Area Statistics, March 2012 http://www.deewr.gov.au/employment/lmi/pages/salm.aspx
Great Expectations: Reclaiming Education for Teenage Mothers – A Needs Assessment for Teenage Mothers to Complete Secondary Education in Mildura, Anne Webster (Thesis) La Trobe University School of Social Work and Social Policy, February 2011
Loddon Mallee Regional Strategic Plan - Northern Region, Loddon Mallee Regional Development Australia Committee.
Mildura Regional Economic Profile June 2009, Mildura Economic Development Board
Mildura Social Indicators Report 2008, Mildura Rural City Council
Projected Population NSW 2010, Planning NSW.
Regional Skills Shortage Survey Summary Mildura and Region, Department for Victorian Communities April 2006
Skill Shortages Fact Sheet Sunraysia, Regional Economic Development Board April 2008
Sunraysia ACC Workplan, August 2008
Skill Shortages in Victoria June 2011, Department of Education, Employment and Workplace Relations
Sunraysia Study Area Report, June 2007, Department of Innovation, Industry and Regional Development - Victoria
Trade Training Centres in School Program: Round Two Application, Mildura Region Trade Training Centre, Background Report, June 2009
Unlocking Sunraysia’s Potential (USP) - The Key for Better Education Outcomes in the Mallee 2009
Victorian Curriculum and Assessment Authority Data 2011
Victoria in Future 2012, Department of Planning and Community Development, April 2012
Workforce Development Strategy for the Mildura - Wine, Olive and Beverage Industries, Mildura Development Corporation, December 2009
www.growmilduraregion.com.au/index.php

NMLLEN Environment Scan 2012
August 2012
73
Appendix A: Robinvale Economy
This appendix provides information on employment in the Robinvale area (Statistical Local Area-SLA)
A.1 Jobs in Robinvale Area
There were 1,562 jobs located in Robinvale in 2006 and almost 40% of these jobs were in agriculture. The other major concentrations were in retail (10%); health and social assistance (9%); education and training (7%); and construction 6%.
Table A.1 Jobs and Occupations in Robinvale Statistical Local Area 2006
Man
ager
s
Pro
fess
ion
als
Tec
hn
icia
ns
& t
rad
es
wo
rker
s
Co
mm
un
ity
& p
erso
nal
se
rvic
e
wo
rker
s
Cle
rica
l &
adm
inis
trat
ive
wo
rker
s
Sal
es
wo
rker
s
Mac
hin
ery
op
erat
ors
& d
rive
rs
Lab
ou
rers
Inad
equ
atel
y
des
crib
ed/
No
t st
ated
To
tal
Sh
are
%
Agriculture, forestry & fishing 298 11 23 0 23 0 43 207 3 608 38.9
Mining 0 0 0 0 0 0 4 0 0 4 0.3
Manufacturing 27 3 16 0 4 5 14 33 3 105 6.7
Electricity, gas, water & waste services
0 0 3 0 3 0 3 3 0 12 0.8
Construction 5 3 31 0 5 0 17 27 3 91 5.8
Wholesale trade 10 7 0 0 6 5 4 7 0 39 2.5
Retail trade 36 3 15 0 9 75 5 15 0 158 10.1
Accommodation & food services 13 0 6 5 0 5 0 11 3 43 2.8
Transport, postal & warehousing 3 0 0 0 8 0 19 6 3 39 2.5
Information media & telecommunications
0 3 3 0 0 0 0 0 0 6 0.4
Financial & insurance services 3 3 0 0 14 0 0 0 0 20 1.3
Rental, hiring & real estate services
0 0 0 0 3 4 0 0 0 7 0.4
Professional, scientific & technical services
0 7 0 0 17 0 0 0 0 24 1.5
Administrative & support services 3 5 0 4 7 0 0 38 0 57 3.6
Public administration & safety 3 6 0 15 3 0 0 6 3 36 2.3
Education & training 9 65 7 18 7 0 0 3 0 109 7.0
Health care & social assistance 11 40 6 40 12 5 0 18 3 135 8.6
Arts & recreation services 3 0 0 3 0 0 0 0 0 6 0.4
Other services 4 13 19 3 4 0 0 3 0 46 2.9
Inadequately described/Not stated 3 0 3 0 3 0 4 4 0 17 1.1
Total 431 169 132 88 128 99 113 381 21 1,562 100.0
Share % 27.6 10.8 8.5 5.6 8.2 6.3 7.2 24.4 1.3 100.0
Source: ABS Census 2006, Working Population Data.

NMLLEN Environment Scan 2012
August 2012
74
Table A.2 Jobs by Industry - Robinvale SLA 2006 Males Females Persons Males Females Persons
Agriculture, forestry and fishing Electricity, gas, water and waste services
Agriculture, forestry and fishing, nfd 3 0 3 Electricity, gas, water and waste services, nfd 0 0 0
Agriculture 415 160 575 Electricity supply 3 0 3
Aquaculture 0 0 0 Gas supply 0 0 0
Forestry and logging 0 0 0 Water supply, sewerage and drainage services 3 3 6
Fishing, hunting and trapping 0 0 0 Waste collection, treatment and disposal services
0 3 3
Agriculture, forestry and fishing support services 18 12 30 Total 6 6 12
Total 436 172 608 Construction
Mining Construction, nfd 3 0 3
Mining, nfd 3 0 3 Building construction 11 0 11
Coal mining 0 0 0 Heavy and civil engineering construction 27 3 30
Oil and gas extraction 0 0 0 Construction services 42 4 46
Metal ore mining 3 0 3 Total 83 7 90
Non-metallic mineral mining and quarrying 0 0 0 Wholesale trade
Exploration and other mining support services 0 0 0 Wholesale trade, nfd 4 0 4
Total 6 0 6 Basic material wholesaling 5 0 5
Manufacturing Machinery and equipment wholesaling 5 0 5
Manufacturing, nfd 3 3 6 Motor vehicle and motor vehicle parts wholesaling
0 0 0
Food product manufacturing 47 22 69 Grocery, liquor and tobacco product wholesaling
12 3 15
Beverage and tobacco product manufacturing 14 4 18 Other goods wholesaling 0 3 3
Textile, leather, clothing and footwear manufacturing
0 0 0 Commission-based wholesaling
4 0 4
Wood product manufacturing 0 0 0 Total 30 6 36
Pulp, paper and converted paper product manufacturing
0 0 0 Retail trade
Printing (including the reproduction of recorded media)
0 3 3 Retail trade, nfd
0 3 3
Petroleum and coal product manufacturing 0 0 0 Motor vehicle and motor vehicle parts retailing 18 9 27
Basic chemical and chemical product manufacturing
3 0 3 Fuel retailing
3 0 3
Polymer product and rubber product manufacturing
3 0 3 Food retailing
26 40 66
Non-metallic mineral product manufacturing 0 0 0 Other store-based retailing 17 40 57
Primary metal and metal product manufacturing 0 0 0
Fabricated metal product manufacturing 0 0 0 Non-store retailing and retail commission-based buying and/or selling
0 3 3
Transport equipment manufacturing 3 0 3 Total 64 95 159
Machinery and equipment manufacturing 0 0 0
Furniture and other manufacturing 0 0 0
Total 73 32 105

NMLLEN Environment Scan 2012
August 2012
75
Source: ABS Census 2006, Working Population Data.
Males Females Persons Males Females Persons
Accommodation and food services Rental, hiring and real estate services
Accommodation and food services, nfd 0 0 0 Rental, hiring and real estate services, nfd 0 0 0
Accommodation 0 7 7 Rental and hiring services (except real estate) 0 3 3
Food and beverage services 13 22 35 Property operators and real estate services 3 3 6
Total 13 29 42 Total 3 6 9
Transport, postal and warehousing Professional, scientific and technical services
Transport, postal and warehousing, nfd 0 4 4 Professional, scientific and technical services, nfd 0 0 0
Road transport 24 3 27 Professional, scientific and technical services (except computer system design and related services)
5 18 23
Rail transport 0 0 0 Computer system design and related services 3 0 3
Water transport 0 0 0 Total 8 18 26
Air and space transport 0 0 0 Administrative and support services
Other transport 0 0 0 Administrative and support services, nfd 0 0 0
Postal and courier pick-up and delivery services
3 0 3 Administrative services 3 11 14
Transport support services 3 3 6
Building cleaning, pest control and other support services
26 16 42
Warehousing and storage services 0 0 0 Total 29 27 56
Total 30 10 40 Public administration and safety
Information media and telecommunications Public administration and safety, nfd 0 0 0
Information media and telecommunications, nfd
0 0 0 Public administration
12 11 23
Publishing (except internet and music publishing)
3 3 6 Defence
0 0 0
Motion picture and sound recording activities 0 0 0 Public order, safety and regulatory services 5 6 11
Broadcasting (except internet) 0 0 0 Total 17 17 34
Internet publishing and broadcasting 0 0 0 Education and training
Telecommunications services 0 0 0 Education and training, nfd 0 3 3
Internet service providers, web search portals and data processing services
0 0 0 Preschool and school education
22 77 99
Library and other information services 0 0 0 Tertiary education 3 3 6
Total 3 3 6 Adult, community and other education 3 0 3
Financial and insurance services Total 28 83 111
Financial and insurance services, nfd 0 0 0 Health care and social assistance
Finance 0 17 17 Health care and social assistance, nfd 0 0 0
Insurance and superannuation funds 0 0 0 Hospitals 10 86 96
Auxiliary finance and insurance services 0 0 0 Medical and other health care services 6 16 22
Total 0 17 17 Residential care services 3 0 3
Arts and recreation services Social assistance services 0 11 11
Arts and recreation services, nfd 0 0 0 Total 19 113 132
Heritage activities 0 0 0 Other services
Creative and performing arts activities 0 0 0 Other services, nfd 0 0 0
Sports and recreation activities 3 3 6 Repair and maintenance 16 7 23
Gambling activities 0 0 0 Personal and other services 9 16 25
Total 3 3 6 Private households employing staff and undifferentiated goods and service-producing activities of households for own use
0 0 0
Total 25 23 48
Total All Jobs 886 676 1,562
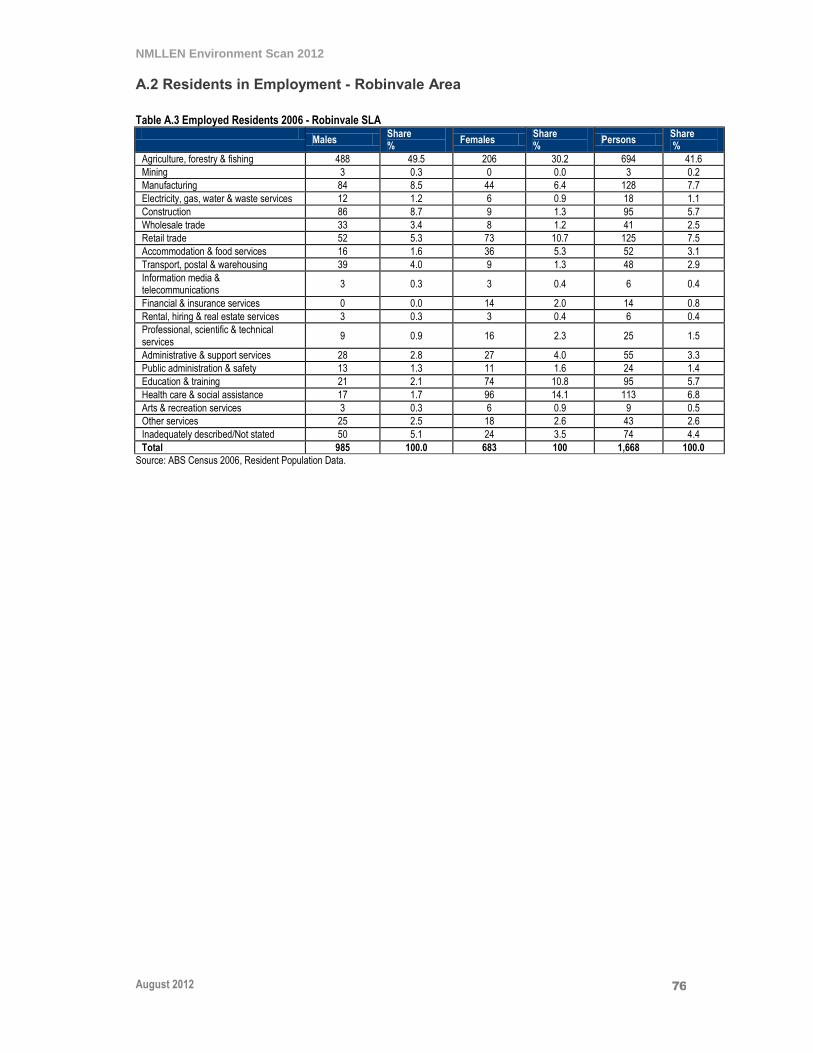
NMLLEN Environment Scan 2012
August 2012
76
A.2 Residents in Employment - Robinvale Area
Table A.3 Employed Residents 2006 - Robinvale SLA
Males Share %
Females Share %
Persons Share %
Agriculture, forestry & fishing 488 49.5 206 30.2 694 41.6
Mining 3 0.3 0 0.0 3 0.2
Manufacturing 84 8.5 44 6.4 128 7.7
Electricity, gas, water & waste services 12 1.2 6 0.9 18 1.1
Construction 86 8.7 9 1.3 95 5.7
Wholesale trade 33 3.4 8 1.2 41 2.5
Retail trade 52 5.3 73 10.7 125 7.5
Accommodation & food services 16 1.6 36 5.3 52 3.1
Transport, postal & warehousing 39 4.0 9 1.3 48 2.9
Information media & telecommunications
3 0.3 3 0.4 6 0.4
Financial & insurance services 0 0.0 14 2.0 14 0.8
Rental, hiring & real estate services 3 0.3 3 0.4 6 0.4
Professional, scientific & technical services
9 0.9 16 2.3 25 1.5
Administrative & support services 28 2.8 27 4.0 55 3.3
Public administration & safety 13 1.3 11 1.6 24 1.4
Education & training 21 2.1 74 10.8 95 5.7
Health care & social assistance 17 1.7 96 14.1 113 6.8
Arts & recreation services 3 0.3 6 0.9 9 0.5
Other services 25 2.5 18 2.6 43 2.6
Inadequately described/Not stated 50 5.1 24 3.5 74 4.4
Total 985 100.0 683 100 1,668 100.0
Source: ABS Census 2006, Resident Population Data.

NMLLEN Environment Scan 2012
August 2012
77
Appendix B Indigenous Population - Mildura Region
This appendix provides information on the Indigenous population in the Mildura LGA.
B.1 Indigenous Population
Table B.1 Population - Mildura LGA 2011
Males Females Persons
Indigenous:
Aboriginal 791 947 1,738
Torres Strait Islander 27 22 49
Both Aboriginal and Torres Strait Islander(a) 26 24 50
Total 844 993 1,837
Non-Indigenous 22,822 23,773 46,595
Indigenous status not stated 1,310 1,237 2,547
Total 24,976 26,003 50,979
Source: ABS Census 2011, Resident Population Data, Aboriginal and Torres Strait Islander Peoples (Indigenous) Profile
Table B.2 Selected Medians and Averages Mildura LGA 2011
Indigenous persons/ households with
Indigenous persons
Non-Indigenous persons /
other households Total
Median age of persons 18 40 39
Median individual income ($/weekly) 332 468 463
Median household income ($/weekly) 710 887 878
Median housing loan repayment ($/monthly) 1,218 1,268 1,268
Median rent ($/weekly) 160 175 170
Average number of persons per bedroom 1.2 1.1 1.1
Average household size 3.1 2.4 2.5
Source: ABS Census 2011 Resident Population, Aboriginal and Torres Strait Islander Peoples (Indigenous) Profile
Table B.3 Indigenous Population by Age - Mildura LGA 2001-2011
2001 2006
2011
Age Males Females Persons Males Females Persons Males Females Persons
0-4 years 80 80 160 107 106 213 156 130 286
5-9 years 83 86 169 102 82 184 152 125 277
10-14 years 74 78 152 95 103 198 110 116 226
15-19 years 68 65 133 72 87 159 80 105 185
20-24 years 46 36 82 55 76 131 64 106 170
25-29 years 31 48 79 42 51 93 42 75 117
30-34 years 28 52 80 48 50 98 48 50 98
35-39 years 30 39 69 29 59 88 43 49 92
40-44 years 28 33 61 22 42 64 40 72 112
45-49 years 17 18 35 26 47 73 29 52 81
50-54 years 14 17 31 20 18 38 31 38 69
55-59 years 9 10 19 17 24 41 25 17 42
60-64 years 4 10 14 4 14 18 17 25 42
65 years and over 7 16 23 11 21 32 6 34 40
Total 519 588 1,107 650 780 1,430 843 994 1,837
Source: ABS Census 2001-2011 Resident Population, Aboriginal and Torres Strait Islander Peoples (Indigenous) Profile

NMLLEN Environment Scan 2012
August 2012
78
B.2 Indigenous Education Participation
Table B.4 Persons Attending an Educational Institution by Age Group - Mildura LGA 2006
Indigenous Non-Indigenous Total
Age Males Females Persons
Total Persons
Share in Educ. %
Males Females Persons
Share in Educ. %
Total Persons
Males Females Persons
0-4 years 24 14 38 218 17.4 295 296 591 20.8 2,846 328 313 641
5-14 years 152 160 312 377 82.8 3,274 3,217 6,491 90.7 7,157 3,497 3,428 6,925
15-19 years 33 45 78 163 47.9 1,123 1,115 2,238 67.6 3,309 1,176 1,172 2,348
20-24 years 8 4 12 128 9.4 160 213 373 15.5 2,401 168 217 385
25 years and over 7 16 23 547 4.2 321 623 944 3.1 30,387 328 649 977
Source: ABS Census 2006, Resident Population Data
Table B.5 Attendance at Education Institutions - Mildura LGA 2006
Source: ABS Census 2006, Resident Population Data
Indigenous Non-Indigenous Not stated Total
Males Females Persons Males Females Persons Males Females Persons Males Females Persons
Pre-school 31 27 58 423 379 802 11 5 16 465 411 876
Infants/Primary
Government 95 100 195 1,736 1,645 3,381 43 31 74 1,874 1,776 3,650
Catholic 5 6 11 377 395 772 8 6 14 390 407 797
Other Non-Government 7 6 13 220 240 460 3 3 6 230 249 479
Total 107 112 219 2,333 2,280 4,613 54 40 94 2,494 2,432 4,926
Secondary
Government 52 66 118 1,320 1,281 2,601 18 15 33 1,390 1,362 2,752
Catholic 4 6 10 325 371 696 6 4 10 335 381 716
Other Non-Government 4 0 4 96 129 225 0 5 5 100 134 234
Total 60 72 132 1,741 1,781 3,522 24 24 48 1,825 1,877 3,702
Technical or Further Educational
Full-time student
Aged 15-24 years 3 9 12 73 104 177 5 0 5 81 113 194
Aged 25 years and over 3 3 6 18 60 78 0 0 0 21 63 84
Part-time student
Aged 15-24 years 6 3 9 175 64 239 0 3 3 181 70 251
Aged 25 years and over 0 0 0 135 202 337 0 3 3 135 205 340
FT/PT student status not stated 3 0 3 7 0 7 0 0 0 10 0 10
Total 15 15 30 408 430 838 5 6 11 428 451 879
University or other Tertiary Institution
Full-time student
Aged 15-24 years 0 0 0 63 147 210 0 0 0 63 147 210
Aged 25 years and over 3 0 3 21 73 94 0 0 0 24 73 97
Part-time student
Aged 15-24 years 0 0 0 13 39 52 0 0 0 13 39 52
Aged 25 years and over 0 6 6 84 176 260 0 0 0 84 182 266
FT/PT student status not stated 0 0 0 5 0 5 0 0 0 5 0 5
Total 3 6 9 186 435 621 0 0 0 189 441 630
Other type of educational institution 7 6 13 86 160 246 5 0 5 98 166 264
Type of educational institution not stated
81 90 171 1,064 1,176 2,240 793 784 1,577 1,938 2,050 3,988
Total 304 328 632 6,241 6,641 12,882 892 859 1,751 7,437 7,828 15,265

NMLLEN Environment Scan 2012
August 2012
79
Table B.6 Highest Year of School Completed (persons aged 15 years and over) - Mildura LGA 2006
Indigenous Share %
Non-Indigenous Share %
Indigenous status not stated
Total
Males
Year 12 or equivalent 33 9.5 4,599 26.2 36 4,668
Year 11 or equivalent 38 10.9 3,017 17.2 21 3,076
Year 10 or equivalent 94 27.0 4,258 24.3 54 4,406
Year 9 or equivalent 63 18.1 2,081 11.9 37 2,181
Year 8 or below 54 15.5 2,292 13.1 40 2,386
Did not go to school 11 3.2 144 0.8 4 159
Highest year of school not stated 55 15.8 1,140 6.5 681 1,876
Total 348 100.0 17,531 100.0 873 18,752
Females
Year 12 or equivalent 61 12.5 5,790 31.2 43 5,894
Year 11 or equivalent 63 12.9 3,106 16.7 35 3,204
Year 10 or equivalent 139 28.5 3,881 20.9 43 4,063
Year 9 or equivalent 93 19.1 1,960 10.6 26 2,079
Year 8 or below 63 12.9 2,375 12.8 76 2,514
Did not go to school 8 1.6 168 0.9 3 179
Highest year of school not stated 60 12.3 1,287 6.9 641 1,988
Total 487 100.0 18,567 100.0 867 19,921
Persons
Year 12 or equivalent 94 11.3 10,389 28.8 79 10,562
Year 11 or equivalent 101 12.1 6,123 17.0 56 6,280
Year 10 or equivalent 233 27.9 8,139 22.5 97 8,469
Year 9 or equivalent 156 18.7 4,041 11.2 63 4,260
Year 8 or below 117 14.0 4,667 12.9 116 4,900
Did not go to school 19 2.3 312 0.9 7 338
Highest year of school not stated 115 13.8 2,427 6.7 1,322 3,864
Total 835 100.0 36,098 100.0 1,740 38,673
Source: ABS Census 2006, Resident Population Data

NMLLEN Environment Scan 2012
August 2012
80
B.3 Indigenous Employment
Table B.7 Labour Force Status of Indigenous Persons - Mildura LGA 2006
Employed (a)
Unemployed Total labour force
Not in the labour force
Labour force status not stated
Total
Males
15-24 years 28 13 41 69 21 131
25-34 years 42 12 54 29 5 88
35-44 years 24 0 24 28 3 55
45-54 years 17 0 17 18 6 41
55-64 years 6 6 12 12 0 24
65 years and over 0 0 0 6 3 9
Total 117 31 148 162 38 348
Females 15-24 years 38 17 55 95 13 163
25-34 years 29 10 39 59 0 98
35-44 years 32 8 40 47 11 98
45-54 years 24 6 30 28 7 65
55-64 years 9 0 9 27 3 39
65 years and over 0 0 0 15 9 24
Total 132 41 173 271 43 487
Persons 15-24 years 66 30 96 164 34 294
25-34 years 71 22 93 88 5 186
35-44 years 56 8 64 75 14 153
45-54 years 41 6 47 46 13 106
55-64 years 15 6 21 39 3 63
65 years and over 0 0 0 21 12 33
Total 249 72 321 433 81 835
Source: ABS Census 2006, Resident Population Data
Table B.8 Industry of Employment of Indigenous Persons (Residents) - Mildura LGA 2006
Source: ABS Census 2006, Resident Population Data
Indigenous
Non-Indigenous
Males Females Persons Share
% Males Females Persons
Share %
Agriculture, forestry & fishing 7 10 17 6.8 2,005 791 2,796 13.2
Mining 0 0 0 0.0 66 15 81 0.4
Manufacturing 14 4 18 7.2 1,644 584 2,228 10.6
Electricity, gas, water & waste services 3 0 3 1.2 225 45 270 1.3
Construction 18 0 18 7.2 1,242 167 1,409 6.7
Wholesale trade 3 3 6 2.4 496 246 742 3.5
Retail trade 8 12 20 8.0 1,153 1,688 2,841 13.5
Accommodation & food services 3 12 15 6.0 486 852 1,338 6.3
Transport, postal & warehousing 4 0 4 1.6 801 179 980 4.6
Information media & telecommunications 0 0 0 0.0 127 82 209 1.0
Financial & insurance services 0 4 4 1.6 144 258 402 1.9
Rental, hiring & real estate services 0 0 0 0.0 114 111 225 1.1
Professional, scientific & technical services 3 3 6 2.4 329 357 686 3.2
Administrative & support services 7 12 19 7.6 397 406 803 3.8
Public administration & safety 11 9 20 8.0 532 517 1,049 5.0
Education & training 5 16 21 8.4 462 1,160 1,622 7.7
Health care & social assistance 12 40 52 20.9 367 1,683 2,050 9.7
Arts & recreation services 3 4 7 2.8 101 74 175 0.8
Other services 7 0 7 2.8 364 255 619 2.9
Inadequately described/Not stated 8 4 12 4.8 339 246 585 2.8
Total 116 133 249 100.0 11,394 9,716 21,110 100.0

NMLLEN Environment Scan 2012
August 2012
81
Table B.9 Occupation of Employed Indigenous Persons (Residents) - Mildura LGA 2006
Indigenous
Share %
Non-Indigenous Share
%
Males Females Persons
Males Females Persons
Managers 8 4 12 4.8 2,568 1,111 3,679 17.4
Professionals 8 25 33 13.3 1,174 1,804 2,978 14.1
Technicians & trades workers 16 6 22 8.9 2,425 485 2,910 13.8
Community & personal service workers 13 36 49 19.8 432 1,338 1,770 8.4
Clerical & administrative workers 3 22 25 10.1 451 1,975 2,426 11.5
Sales workers 5 16 21 8.5 783 1,505 2,288 10.8
Machinery operators & drivers 23 0 23 9.3 1,298 88 1,386 6.6
Labourers 34 23 57 23.0 2,037 1,271 3,308 15.7
Inadequately described/Not stated 6 0 6 2.4 226 140 366 1.7
Total 116 132 248 100.0 11,394 9,717 21,111 100.0
Source: ABS Census 2006, Resident Population Data

NMLLEN Environment Scan 2012
August 2012
82
Appendix C Indigenous Population - Robinvale Region
This appendix provides information on the Indigenous population in the Robinvale area.
C.1 Indigenous Population
Table C.1 Population by Sex - Robinvale (SLA) 2011
Males Females Persons
Indigenous:
Aboriginal 110 154 264
Torres Strait Islander 7 8 15
Both Aboriginal and Torres Strait Islander(a) 6 11 17
Total 123 173 296
Non-Indigenous 1,652 1,468 3,120
Indigenous status not stated 163 168 331
Total Population 1,938 1,809 3,747
Source: ABS Census 2011, Resident Population Data, Aboriginal and Torres Strait Islander Peoples (Indigenous) Profile
Table C.2 Selected Medians and Averages - Robinvale (SLA) 2011
Indigenous persons /
households with Indigenous persons(a)
Non-Indigenous persons (b) /
other households Total
Median age of persons 21 37 36
Median individual income ($/weekly) 344 466 452
Median household income ($/weekly) 574 927 904
Median housing loan repayment ($/monthly) 1,279 1,048 1,048
Median rent ($/weekly) 150 150 150
Average number of persons per bedroom 1.2 1.2 1.2
Average household size 2.9 2.7 2.7
Source: ABS Census 2011, Resident Population Data, Aboriginal and Torres Strait Islander Peoples (Indigenous) Profile
Table C.3 Indigenous Population by Age - Robinvale (SLA) 2011
Indigenous Non-Indigenous
Males Females Persons Males Females Persons
Total persons 124 173 297 1,652 1,468 3,120
Age groups
0-4 years 22 19 41 121 122 243
5-14 years 28 40 68 212 183 395
15-24 years 20 32 52 195 162 357
25-44 years 24 48 72 461 397 858
45-64 years 25 28 53 471 396 867
65 years and over 5 6 11 193 207 400
Source: ABS Census 2011, Resident Population Data, Aboriginal and Torres Strait Islander Peoples (Indigenous) Profile

NMLLEN Environment Scan 2012
August 2012
83
C.2 Indigenous Education Participation
Table C.4 Persons Attending an Educational Institution by Age Group - Robinvale (SLA) 2006
Indigenous Non-Indigenous
Males Females Persons Total Persons
Share in Education %
Males Females Persons Total Persons
Share in Education %
0-4 years 6 0 6 46 13.0 22 30 52 245 21.2
5-14 years 29 36 65 84 77.4 233 180 413 463 89.2
15-19 years 0 15 15 45 33.3 52 55 107 230 46.5
20-24 years 0 0 0 24 0.0 11 11 22 236 9.3
25 years and over 0 7 7 140 5.0 19 32 51 2,208 2.3
Source: ABS Census 2006, Resident Population Data
C.3 Indigenous Employment
Table C.5 Labour Force Status Indigenous Persons - Robinvale (SLA) 2006
Employed(a) Unemployed Total labour force
Not in the labour force
Labour force status not stated
Total
Males
15-24 years 6 7 13 13 0 26
25-34 years 7 0 7 12 0 19
35-44 years 11 0 11 7 0 18
45-54 years 6 0 6 0 0 6
55-64 years 4 0 4 3 0 7
65 years and over 0 0 0 8 0 8
Total 34 7 41 43 0 84
Females
15-24 years 7 5 12 34 0 46
25-34 years 15 0 15 11 0 26
35-44 years 6 0 6 12 0 18
45-54 years 6 0 6 12 5 23
55-64 years 0 0 0 4 0 4
65 years and over 0 0 0 5 4 9
Total 34 5 39 78 9 126
Persons
15-24 years 13 12 25 47 0 72
25-34 years 22 0 22 23 0 45
35-44 years 17 0 17 19 0 36
45-54 years 12 0 12 12 5 29
55-64 years 4 0 4 7 0 11
65 years and over 0 0 0 13 4 17
Total 68 12 80 121 9 210
Source: ABS Census 2006, Resident Population Data
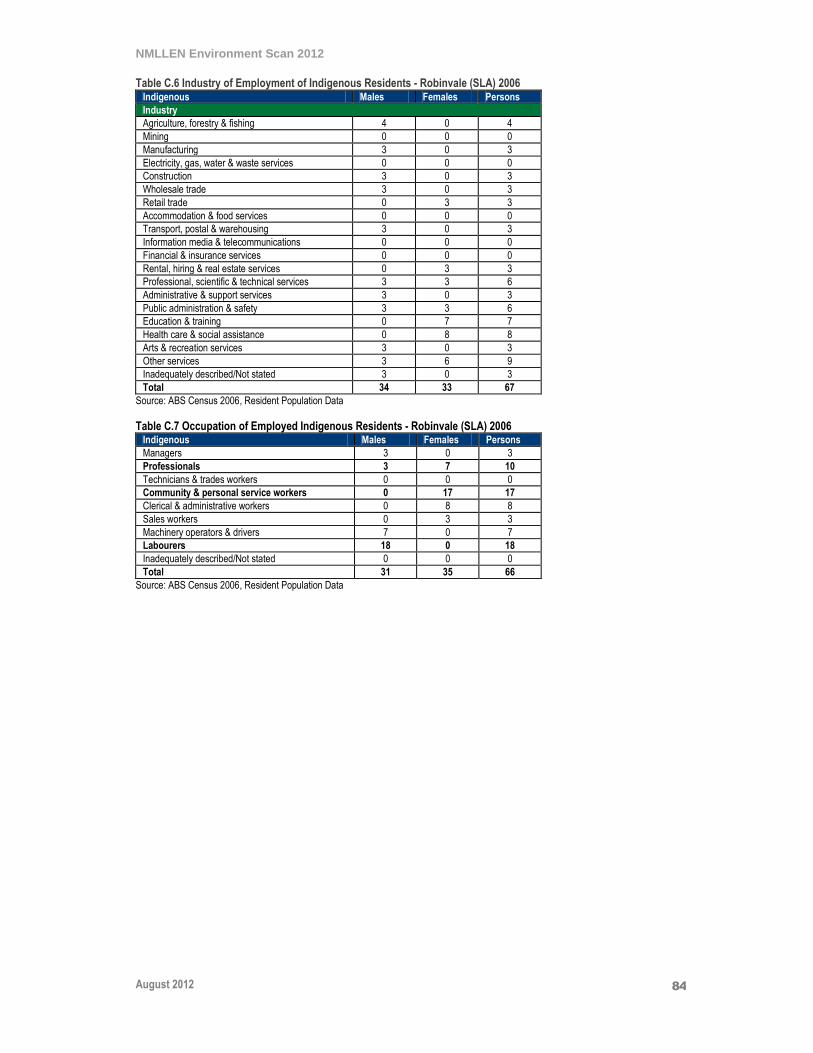
NMLLEN Environment Scan 2012
August 2012
84
Table C.6 Industry of Employment of Indigenous Residents - Robinvale (SLA) 2006 Indigenous Males Females Persons
Industry
Agriculture, forestry & fishing 4 0 4
Mining 0 0 0
Manufacturing 3 0 3
Electricity, gas, water & waste services 0 0 0
Construction 3 0 3
Wholesale trade 3 0 3
Retail trade 0 3 3
Accommodation & food services 0 0 0
Transport, postal & warehousing 3 0 3
Information media & telecommunications 0 0 0
Financial & insurance services 0 0 0
Rental, hiring & real estate services 0 3 3
Professional, scientific & technical services 3 3 6
Administrative & support services 3 0 3
Public administration & safety 3 3 6
Education & training 0 7 7
Health care & social assistance 0 8 8
Arts & recreation services 3 0 3
Other services 3 6 9
Inadequately described/Not stated 3 0 3
Total 34 33 67
Source: ABS Census 2006, Resident Population Data
Table C.7 Occupation of Employed Indigenous Residents - Robinvale (SLA) 2006
Indigenous Males Females Persons
Managers 3 0 3
Professionals 3 7 10
Technicians & trades workers 0 0 0
Community & personal service workers 0 17 17
Clerical & administrative workers 0 8 8
Sales workers 0 3 3
Machinery operators & drivers 7 0 7
Labourers 18 0 18
Inadequately described/Not stated 0 0 0
Total 31 35 66
Source: ABS Census 2006, Resident Population Data
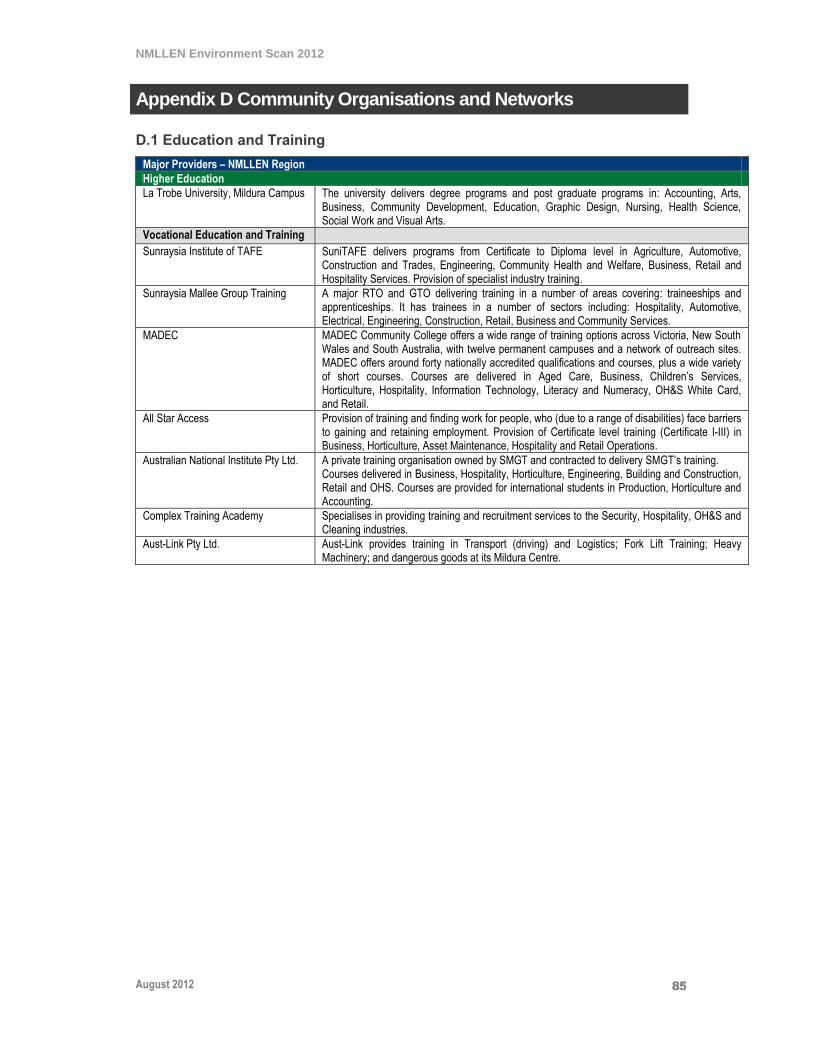
NMLLEN Environment Scan 2012
August 2012
85
Appendix D Community Organisations and Networks
D.1 Education and Training
Major Providers – NMLLEN Region
Higher Education
La Trobe University, Mildura Campus
The university delivers degree programs and post graduate programs in: Accounting, Arts, Business, Community Development, Education, Graphic Design, Nursing, Health Science, Social Work and Visual Arts.
Vocational Education and Training
Sunraysia Institute of TAFE SuniTAFE delivers programs from Certificate to Diploma level in Agriculture, Automotive, Construction and Trades, Engineering, Community Health and Welfare, Business, Retail and Hospitality Services. Provision of specialist industry training.
Sunraysia Mallee Group Training A major RTO and GTO delivering training in a number of areas covering: traineeships and apprenticeships. It has trainees in a number of sectors including: Hospitality, Automotive, Electrical, Engineering, Construction, Retail, Business and Community Services.
MADEC MADEC Community College offers a wide range of training options across Victoria, New South Wales and South Australia, with twelve permanent campuses and a network of outreach sites. MADEC offers around forty nationally accredited qualifications and courses, plus a wide variety of short courses. Courses are delivered in Aged Care, Business, Children’s Services, Horticulture, Hospitality, Information Technology, Literacy and Numeracy, OH&S White Card, and Retail.
All Star Access Provision of training and finding work for people, who (due to a range of disabilities) face barriers to gaining and retaining employment. Provision of Certificate level training (Certificate I-III) in Business, Horticulture, Asset Maintenance, Hospitality and Retail Operations.
Australian National Institute Pty Ltd. A private training organisation owned by SMGT and contracted to delivery SMGT’s training. Courses delivered in Business, Hospitality, Horticulture, Engineering, Building and Construction, Retail and OHS. Courses are provided for international students in Production, Horticulture and Accounting.
Complex Training Academy Specialises in providing training and recruitment services to the Security, Hospitality, OH&S and Cleaning industries.
Aust-Link Pty Ltd. Aust-Link provides training in Transport (driving) and Logistics; Fork Lift Training; Heavy Machinery; and dangerous goods at its Mildura Centre.

NMLLEN Environment Scan 2012
August 2012
86
D.2 Employment Services
Providers – NMLLEN Region
Job Services Providers
MADEC SMGT Centacare Employment Max Employment
Australian Apprenticeship Centres
MEGT VECCI Apprenticeships Services AusNAC
Disability Services
All Star Access CRS Australia
D.3 Youth Services
Providers – NMLLEN Region
Youth Services
Mildura Rural City Council - Youth Services & Mildura Youth Centre Mallee Family Care - Chances for Children assists children and young people from the Mallee Family Care catchment area of North West Victoria and South West NSW. Regional Youth Affairs Network (RYAN), Mallee Sunraysia Community Health Services Centacare Employment Services

NMLLEN Environment Scan 2012
August 2012
87
D.4 NMLLEN Partners
D.4.1 Existing Partners
NMLLEN Partners - Existing
Mildura Trade Training Centre Consortium - Schools Other TTC Supporters
Chaffey Secondary College Coomealla High School (NSW) Henderson College Irymple Secondary College Merbein P-12 College Mildura Senior College Mildura Specialist School Red Cliffs Secondary College St Joseph's College Trinity Lutheran College Two Rivers College Werrimull P-12 College
Loddon Mallee Region, Department of Education and Early Childhood Brent Wlliams & Associates MADEC Mildura Rural City Council Mildura Development Corporation Mildura Chamber of Commerce Mildura Local Aboriginal Education Advisory Group Sunraysia Institute of TAFE Sunraysia Mallee Ethnic Communities Council Sunraysia Mallee Group Training /Australian National Institute Wentworth Shire Council
Youth Robinvale
Loddon Mallee Regional Youth Commitment Sunraysia Mallee Youth Re-Engagement Project Unlocking Sunraysia’s Potential Mildura Rural City Council Community Engagement Framework Governance Group Mildura Youth Services/SMGT Youth Connections Schools Focused Youth Service
Robinvale P-12 College Robinvale District Health Service – Advancing Country Towns So Great (Sustainability of Government and Rural Enterprises Advancing Together) Employers
Government Schools
Department of Education & Early Childhood Development (Loddon Mallee) Mildura Rural City Council Department of Education, Employment and Workplace Relations (Mildura District Office) Mildura Rural City Council Victorian Department of Justice Victorian Department of Human Services Victoria Police Skills Victoria Regional Development Victoria
Chaffey Secondary College Coomealla High School (NSW) Henderson College Irymple Secondary College Merbein P-10 College Mildura Senior College Mildura Specialist School Murrayville Community College Ouyen P-12 College Robinvale P-12 College St. Joesph’s College Trinity Lutheran College Two Rivers College
Industry Education and Training
AUSNAC Local employers Mildura Base Hospital Mildura Development Corporation Mildura Chamber of Commerce Sunraysia Transport and Logistics Cluster VECCI
Australian National Institute Aust-Link La Trobe University, Mildura Campus Sunraysia Institute of TAFE SMGT
Community Organisations Indigenous Community
All Star Access District Rotary Clubs Lower Murray Medicare Local Mallee Family Care / Chances for Children Mildura Accommodation and Support Program Sunraysia Mallee Ethnic Communities Council Sunraysia Residential Services Mallee Division of General Practice Mallee Sexual Assault Unit/Mallee Domestic Violence National Disability Coordination Officer Program Northern Mallee Primary Care Partnership Sunraysia Community Health Services Zoe Foundation
Dulka Yuppata Koorie Cultural Centre/SuniTAFE Koorie Unit Local Aboriginal Education Consultative Group Mildura Aboriginal Corporation Murray Valley Aboriginal Corporation Sunraysia Regional Consulting – Indigenous Employment Program

NMLLEN Environment Scan 2012
August 2012
88
D.4.2 New Partners
NMLLEN has identified the following new partners to undertake its enhanced role.
NMLLEN Partners – New
Victoria New South Wales/South Australia
School Business Community Partnership Brokers and Youth Connections providers for adjoining LLENs regions: -Murray Mallee LLEN -North Central LLEN -Wimmera Southern Mallee LLEN
School Business Community Partnership Brokers and Youth Connections providers for neighbouring regions: -Far West NSW (Region NSW22) -Murray Mallee SA (Region SA11)