nks-336, application of rapid and automated techniques in ... · application of rapid and automated...
TRANSCRIPT

NKS-336 ISBN 978-87-7893-418-5
Application of Rapid and Automated Techniques in Radiochemical Analysis
Jixin Qiao 1
Iisa Outola 2
Petra Lagerkvist 3
Rajdeep Singh Sidhu 4
Kai Xu 1
Sofia Josson 3
Pia Vesterbacka 2
Stina Holmgren 3
Kaisa Vaaramaa 2
1DTU NUTECH, Technical University of Denmark
2STUK, Radiation and Nuclear Safety Authority, Finland
3FOI, CBRN Defence and Security, Sweden
4IFE, Institute for Energy Technology, Norway
April 2015
Abstract NKS Rapid-Tech project 2014 aims to explore the application of different rapid tech-niques in determination of radionuclides, thus to improve the analytical efficiency and capacity of present radioanalytical methodologies used for different purposes in the areas of E, W and R. Specific tasks are described as follows:
• Identification of current needs and problems in methodology development for rapid determination of radionuclides (e.g., 90Sr, actinides).
• Identification of individual processes/operations wherein rapid techniques can be potentially applied to improve the analytical efficiency.
• Establishment of practical solutions/suggestions in the application of rapid techniques in radiochemical procedures.
• Development and optimization of rapid methods for determination of radionuclides (e.g., 90Sr, actinides) in environmental samples using automation and effective sam-ple treatment techniques.
• Assessment of analytical performance and summarization of successes/failures, challenges and future attempts.
In 2014, Rapid-Tech project gathered scientists working in radiochemistry among Nordic countries and oversaw the problems and needs in developing effective radiochemical methods. Based on screening the current analytical methods for common radionuclides (e.g., Sr, actinides) assays in individual institute, challenges and future development needs were identified by each institute and presented in this report.
Experiments in applying distinct novel techniques in each institute were also performed: 1) DTU Nutech (Denmark) improved method applicability for different matrix content in Pu determination by exploring oxalate co-precipitation, and improved Sr seawater procedure; 2) STUK (Finland) improved Pu/Am source preparation technique and Pu procedure in air filter analysis for emergency preparedness; 3) IFE (Norway) improved 90Sr seawater method in terms of reducing the use of fuming nitric acid and testing the application of Sr resin to 210Pb analysis in water samples; 4) FOI (Sweden) tested new redox reagents for improving the stability of Pu analytical method and investigated the matrix effect on TEVA resin to improve the chemical yield of Pu. The preliminary results obtained in each insti-tute are assessed and summarized in this report.
Key words Rapid determination, Pu, Sr, Tc, environment analysis, emergency preparedness NKS-336 ISBN 978-87-7893-418-5 Electronic report, April 2015 NKS Secretariat P.O. Box 49 DK - 4000 Roskilde, Denmark Phone +45 4677 4041 www.nks.org e-mail [email protected]

Application of Rapid and Automated Techniques in Radiochemical
Analysis
Final report from the NKS-B Rapid-Tech activity
(Contract: AFT/B(14)7)
Jixin Qiao 1, Iisa Outola
2, Petra Lagerkvist
3, Rajdeep Singh Sidhu
4, Kai Xu
1, Sofia Josson
3, Pia
Vesterbacka 2, Stina Holmgren
3, Kaisa Vaaramaa
2
1 DTU Nutech, Technical University of Denmark, Denmark
2 STUK, Radiation and Nuclear Safety Authority, Finland
3 FOI, CBRN Defence and Security, Sweden
4 IFE, Institute for Energy Technology, Norway
March 2015

Abstract
NKS-B Rapid-Tech project aims to explore the application of different rapid techniques in
determination of radionuclides, thus to improve the analytical efficiency and capacity of present
radioanalytical methodologies used for different purposes in the areas of E, W and R. Specific tasks
are as follows:
Identification of current needs and problems in methodology development for rapid
determination of radionuclides (e.g., 90
Sr, actinides).
Identification of individual processes/operations wherein rapid techniques can be potentially
applied to improve the analytical efficiency.
Establishment of practical solutions/suggestions in the application of rapid techniques in
radiochemical procedures.
Development and optimization of rapid methods for determination of radionuclides (e.g., 90
Sr,
actinides) in environmental samples using automation and effective sample treatment techniques.
Assessment of analytical performance and summarization of successes/failures, challenges and
future attempts.
In this report, the state-of-art on analytical methods for common radionuclides (e.g., Sr, actinides)
in environmental assays and emergency preparedness among Nordic countries are screened and
summarized. Practical problems, challenges and future needs in developing effective radiochemical
methods are identified.
Within Rapid-Tech 2014 project, experiments in applying rapid techniques and improving
analytical efficiency were performed in each participating institute: 1) DTU Nutech (Denmark)
improved method applicability for different matrix content in Pu determination by exploring oxalate
co-precipitation, and improved Sr seawater procedure by investigating different affecting
parameters; 2) STUK (Finland) improved Pu/Am source preparation technique and Pu procedure in
air filter analysis for emergency preparedness; 3) IFE (Norway) improved 90
Sr seawater method in
terms of reducing the use of fuming nitric acid and tested the application of Sr resin to 210
Pb
analysis in water samples; 4) FOI (Sweden) studied new redox reagents for improving the stability
of Pu analytical method and investigated the matrix effect on TEVA resin to improve the chemical
yield of Pu. The preliminary results obtained within the project are assessed and summarized in this
report.
Key words
Rapid determination, Pu, Sr, Tc, environment analysis, emergency preparedness

Table of Contents 1. Introduction ................................................................................................................................................... 1
2. Overview of Current Status on Radiochemical Analysis in Nordic Countries .............................................. 2
2.1 Environmental Analysis for 90
Sr, 239, 240
Pu, 237
Np and 99
Tc in DTU Nutech ............................................ 2
2.1.1 Procedures for Sr determination ....................................................................................................... 2
2.1.2 Procedures for 99
Tc, 237
Np and 239, 240
Pu determination ..................................................................... 5
2.1.3 Performance evaluation for current analytical methods ................................................................... 9
2.1.4 Potential solutions and perspectives ............................................................................................... 11
2.2 Nuclear emergency preparedness methods for 89, 90
Sr and 239, 240
Pu at FOI Umeå ................................ 13
2.2.1 Procedure for Sr .............................................................................................................................. 13
2.2.2 Procedure for
239, 240Pu ..................................................................................................................... 13
2.2.3 Performance evaluation for current analytical methods ................................................................. 14
2.2.4. Potential improvements and perspectives ...................................................................................... 14
2.3 Environmental analysis and emergency preparedness methods for 89, 90
Sr, 238,
239, 240, 241
Pu and 241
Am in
STUK ........................................................................................................................................................... 15
2.3.1 Routine analytical procedures for 89, 90
Sr, 238,239, 240, 241
Pu and 241
Am in STUK .............................. 15
2.3.2 Performance evaluation of the analytical methods ......................................................................... 21
2.3.3. Emergency preparedness methods ................................................................................................. 21
2.3.4 Potential improvements .................................................................................................................. 22
2.4 Analysis of Sr, Th, U, Pu and Am at IFE .............................................................................................. 24
2.4.1 Treatment of various samples ......................................................................................................... 24
2.4.2 Separation of Sr, Th, U, Pu and Am ............................................................................................... 25
2.4.3 Discussion and perceptiveness ....................................................................................................... 25
3. Method improvement by applying rapid analytical techniques ................................................................... 27
3.1 Methodology improvement in Sr and Pu environmental analysis in DTU Nutech ............................... 27
3.2.1 Improvement for the determination of 90
Sr in Seawater and lake water ................................................. 27
3.2.2 Improvement in method applicability for Pu soil/sediment analysis ...................................................... 31
3.2 Measurement of Pu and major elements in soil and sediment using ICP-OES and ICP-SFMS in FOI 38
3.2.1 Materials and methods ................................................................................ Error! Bookmark not defined.
3.2.2 Instrumentation ................................................................................... Error! Bookmark not defined.
3.2.2 Results and discussion ................................................................................ Error! Bookmark not defined.
3.2.3 Conclusions ................................................................................................ Error! Bookmark not defined.
3.3 Improvement in source preparation and Pu air filter analysis in STUK ................................................ 44

3.3.1. Comparing co-precipitation vs electrodeposition as a source preparing technique for Pu and Am
................................................................................................................................................................. 44
3.3.2 Analysis of Pu from air filters in emergency conditions ................................................................ 48
4. Conclusions ................................................................................................................................................. 54
5. Reference ..................................................................................................................................................... 54

Page 1 of 57
1. Introduction
Rapid sample processing techniques are desirable in radionuclide determination for
emergency preparedness, environmental monitoring, nuclear decommissioning and waste
management to achieve fast analysis, and high sample throughput with low labor intensity and
cost. Within the Nordic countries, a few laboratories working with radiochemistry have
initiated R&D in developing rapid radiochemical methods using different rapid and effective
sample treatment techniques. However, the exploration of rapid techniques is still a fresh area,
and very little has been done to share experiences and knowledge on this topic among the
Nordic countries.
In 2014, within NKS-B Rapid-Tech project [AFT/B(14)7], Nordic scientists gathered together
and screened the current analytical methods for common radionuclides (e.g., Sr, actinides).
Problems and needs in developing rapid radiochemical methods were identified and
applications of distinct rapid sample processing techniques to improve the simplicity and
analytical efficiency in radioassays for determination of the most common radioisotopes were
assessed. Based on the screening, several consensuses through the screening have been
reached: 1) Current application of novel automated techniques in Nordic countries is very
limited, many of them have only been exploited for research purpose while most routine
analysis are still operated in batch-wised manual fashion. 2) Analytical techniques used for Sr
determination vary significantly from lab to lab. Especially for low-level environmental
samples, several Nordic labs are still using very traditional methods developed in 1960-70s.
These methods are not only problematically slow and labor intensive but also based on the
use of harmful chemicals (e.g., fuming nitric acid) wherein laboratory safety issues are worth
of concern. 3) There is a need for end users to become more aware of the advantages of
improved techniques for radiochemical assays, so that they can become more active in driving
the long-term development. Identification of concrete analytical benefits and experience
sharing are necessary for selecting purpose-fit novel techniques.

Page 2 of 57
2. Overview of Current Status on Radiochemical Analysis in Nordic Countries
A kick-off meeting for NKS-B Rapid-Tech project was held on 9th
April 2014. During the
meeting, project participants shared experiences in analytical methods for important
radionuclides (mainly Sr and Pu). A concrete work program was made wherein detailed
experimental plan were structured in each institute to improve the efficiency of specific
analytical protocols used for different sample matrix and radioactivity levels.
To better understand the state-of-art radiochemical analysis for Sr, actinides and other
radionuclides among Nordic countries, an overview of current radiochemical procedures used
in each institute for different situation and samples are given in the following context.
Advantages, problems and challenges demonstrated in current analytical methods are
pinpointed and future optimization and development are identified.
2.1 Environmental Analysis for 90
Sr, 239, 240
Pu, 237
Np and 99
Tc in DTU Nutech
Strontium-90 and technium-99 as important beta-emitting fission products, along with
plutonium-239, 240 and neptunium-237 as important alpha emitters need to be determined for
environmental risk assessment and monitoring, remediation, nuclear security and
radioecology studies. In DTU Nutech, low level 90
Sr, 99
Tc, 239, 240
Pu and 237
Np are routinely
analyzed for large volume aqueous and solid environmental samples in many types. Thorough
chemical purification is required for all these radionuclides to eliminate the interferences
including any other beta or alpha emitters and natural matrix elements. This section
summarizes the current radiochemcial methods used in DTU Nutech for 90
Sr, 99
Tc, 239, 240
Pu
and 237
Np determination in different environmental samples, critically evaluates the
advantages and disadvantages of these methods, and points out possible
solutions/perspectives to overcome the potential problems existed in the analytical procedures.
2.1.1 Procedures for Sr determination
The current method for Sr determination in DTU Nutech is designed for measuring 90
Sr
through its daughter 90
Y in-growth by low background gas flow Geiger Müller beta counter.
Samples analyzed for 90
Sr include seawater, freshwater, air filter, soil, sediment and food
(milk, vegetable, fruit, etc.). 85
Sr is spiked as chemical yield monitor for Sr, and stable yttrium
(89
Y) is used to monitor the chemical yield of 90
Y in the Sr-Y separation step and quantified
by inductively coupled plasma optical emission spectrometry (ICP-OES). The limits of
detection are 0.1 Bq/m3 for seawater, 0.1 Bq/kg for air filter ash and 0.5 Bq/kg for soil,
sediment or food ash, based on the sample size of 45 L seawater, 50 g filter ash and 10 g soil,
sediment or food ash, respectively. Typical chemical yields for Sr are in the range of 60-85%
and the analytical turnover time for one sample is about 5 days excluding the 3-week waiting
for the in-growth of 90
Y and the beta counting (ca. 1-2 weeks).
(1) Sr in seawater
For 90
Sr seawater analysis, normally 45 L sample is processed through three stages: sample
pre-concentration, chemical purification and 90
Y source preparation (Figure. 1). For pre-
concentration, calcium carbonate is used to scavenge most Sr into the residue. A hydroxide
precipitation is then performed in 0.2 M NaOH to remove large amount of Ca as well as other
interfering radionuclide (actinides, Po and rare elements), whilst Sr remains in the supernatant.
Afterwards, another carbonate precipitation is performed to concentrate Sr. The chemical

Page 3 of 57
purification is then carried out to further remove Ca and other impurities. For this purpose,
strontium nitrate precipitation is repeatedly performed with the use of fuming nitric acid,
wherein only Sr forms precipitate and most of impurities will be dissolved in the supernatant.
After an iron hydroxide co-precipitation, the supernatant containing 90
Sr will be kept for 3
week3 for the in-growth of its daughter 90
Y. For the 90
Y source preparation and detection, 90
Sr
and other interfering elements such as Ba and Ra should be separated. Yttrium hydroxide
precipitation is repeatedly performed to remove 90
Sr, in combination with barium sulphate
precipitation to remove Ba and Ra as BaSO4 and RaSO4, respectively. The 90
Y source is
finally precipitated as yttrium oxalate which is embedded on a paper filter for the beta
counting.
Figure. 1 The analytical procedure for 90
Sr determination in 45 L seawater
45 L seawater
Add 85Sr tracer and 1g SrCl2·H2OAdjust pH to 8-10 with 25% NH3·H2O.Heat to boiling. Add 40 mL 25% HN3·H2O and 1-1.5 L 2 M (NH4)2CO3.
Stir with stick and stand overnight
SrCO3 Precipitate
Dissolve with 1 L of 4 M HNO3. Wash the container with 0.5 L of H2O twice.
Add 10 mg of Fe3+. Heat to boiling. Add 250-300 mL 6 M NaOH to pH=10, then add 350
mL 6 M NaOH to 0.2 M NaOH and centrifuge.
Supernatant
Heat to boiling. Add Na2CO3 to 50g/L.Stir and heat under 250°C for 1h.
Stay overnight and centrifuge
SrCO3 precipitate SrCO3 precipitate
Add 4 mL 8 M HNO3 to dissolve the sample. Add 150 mL 65% HNO3 and 30 mL of
fuming HNO3 and centrifuge.
Sr(NO3)2 precipitate
Add 4 mL water, 60 mL 65% HNO3 and 15 mL of fuming HNO3 and centrifuge. Repeat two times.
Sr(NO3)2 precipitate
Dissolve the precipitate in 50 mL water, add 5 mg Fe3+ and NaOH to pH=10, centrifuge.
Supernatant
Add Y3+ carrier and 1 mg Ba carrier, take a part of the solution to measure by NaI detector for Sr chemical
yield. Stand over 3 weeks for the in-growth of Y.
Sr-Y sample solution Sr-Y sample solution
Add 25% NH3·H2O to pH>10, heat for a while and centrifuge.
Supernatant Precipitate
Dissolve with 20 mL 0.7 M HNO3,Add 5 mg Sr carrier and 25%
NH3·H2O to pH>10, centrifuge.
Supernatant Precipitate
Dissolve with 20 mL 0.3 M HNO3.Add 5 mg Ba2+ and 2 mg Sr2+ carrier,
add 1 mL 2 M H2SO4, centrifuge.
Supernatant
25% NH3·H2O to pH>10, centrifuge.Repeat the BaSO4 and Y(OH)3 precipitation
Y(OH)3 Precipitate
Add 5 drops 6 M HNO3 and 20 mL 8% H2C2O4, stir and heat. Filter the Y2(C2O4)3 and wash
with 2 mL water and alchol for two times.
Y2(C2O4)3
Precipitate
Acidify and evaporate to certain volume for storage
GM beta counting for 90Y

Page 4 of 57
(2) Sr in air filter, soil, sediment and food
For 90
Sr air filter, soil, sediment and food analysis, samples are processed following similar
three analytical stages as for seawater, but different in sample pre-concentration depending on
the sample type (Figure. 2). In the pre-concentration stage, typically 30-50 g filter ash, 10 g
soil/sediment, or 10 g food ash is digested with aqua regia to extract Sr into liquid phase. Iron
hydroxide precipitation is employed to remove metal elements for air filter and soil/sediment
samples, while calcium oxalate precipitation is used for food samples. Finally, a carbonate
precipitate is carried out for all type of solid samples prior to the chemical purification using
fuming nitric acid and 90
Y source preparation as indicated in the Sr seawater analysis.
Figure. 2 Sample pre-concentration procedures in 90
Sr air filter, soil, sediment and food
analysis
30-50 g filter ash(from 400°C ashing)
Burn at 550°C for 3 d. Add 85Sr tracer, 0.5g SrCl2·H2O and 40 mL aqua regia.
Heat at 150 °C for 30 min and 200 °C for 1h. Add 60 mL H2O and heat for 15 min. Centrifuge
Supernatant
Add 10 mL 12 M HCl and 50 mL H2O, stir 20 min. Centrifuge
Repeat until 85Sr activity is <4% in the residue
Supernatant
Add 200 mL 6 M NaOH.Centrifuge
SrCO3 precipitate
Residue
Supernatant
Heat to boil.Add Na2CO3 to 50g/L.
Heat 1 h at 250-300 °C.Stand overnight, centrifuge
10 g soil and sediment
Burn at 550°C over-night. Add 85Sr tracer, 0.5g SrCl2·H2O and 40 mL aqua regia.
Heat at 150 °C for 30 min and 200 °C for 1h. Add 60 mL H2O and heat for 15 min. Filtration.
Filtrate
Supernatant
Add 25% NH3·H2O to pH=10,centrifuge.Repeat the precipitation until 85Sr is < 5%
in the precipitate
SrCO3 precipitate
Heat to boil, add Na2CO3 to 50g/L.Heat 1 h at 250-300 °C.
Stand overnight, centrifuge
10 g food ash(from 400°C ashing)
Burn at 550°C for 3 d. Add 85Sr tracer, 0.5g SrCl2·H2O and 40 mL aqua regia.
Heat at 150 °C for 30 min and 200 °C for 1h. Add 60 mL H2O, heat for 15 min. Centrifuge
Supernatant
Add 10 mL 12 M HCl and 50 mL H2O, stir 20 min. Centrifuge
Repeat until 85Sr activity is <4% in the residue
Supernatant
Evaporate to 50 mL, add 30 mL8% H2C2O4 and 25% NH3·H2O
to pH=7-10. Centrifuge
SrCO3 precipitate
Residue
Supernatant
Heat to boil. Add Na2CO3 to 50g/L.
Heat 1 h at 250-300 °C.Stand overnight, centrifuge
(a)
(b)
(c)

Page 5 of 57
2.1.2 Procedures for 99
Tc, 237
Np and 239, 240
Pu determination
Traditionally, the determination of 99
Tc is performed separately from Pu and Np in DTU
Nutech. Samples routinely analyzed for 99
Tc are mostly seawater, freshwater and seaweed.
For 99
Tc water sample analysis, anion exchange chromatography is used by pumping the large
volume (100-200L) water directly through a big anion exchange column, wherein Tc will be
absorbed and pre-concentrated (Chen et al. 1990, 1994). 99
Tc is further purified with Fe(OH)3
precipitation and TIOA-xylene solvent extraction. For 99
Tc seaweed analysis, a wet ash using
concentrated H2SO4 and HNO3 is employed followed by chemical purification using anion
exchange chromatography and TIOA-xylene solvent extraction. For all samples analysis,
short-lived 99m
Tc is spiked as a chemical yield monitor, which restricts the analytical
processed to be finished within 5 days. 99
Tc after purification is electrodeposited on a
stainless steel disc and then counted using low background gas flow beta counter. Typical
chemical yields for Tc are 60-80% for seawater and 70-90% for seaweed. The analytical
turnover time is about 3-4 days for seawater and 2-3 days for seaweed, except the counting
time.
The routine based determination of 237
Np and Pu isotopes in DTU Nutech is mostly carried
out for seawater, soil and sediment samples. For seawater samples, a series Fe(OH)2-Fe(OH)3
co-precipitation is used to scavenge Np and Pu from the seawater, followed by anion
exchange chromatography using macro-porous resin (AGMP-1M). For soil and sediment
samples, acid digestion using aqua regia is used to leach Np/Pu into the aqueous phase
followed by similar Fe(OH)2-Fe(OH)3 co-precipitation and anion exchange chromatography
as for seawater (Qiao et al. 2009, 2011). 242
Pu is spiked as a chemical yield tracer for both 237
Np and Pu isotopes, which avoids the difficulties in obtaining Np isotopic tracers. The Np
and Pu eluate after final column separation is evaporated to dryness and re-dissolved in 0.5 M
HNO3 and measured by inductively coupled mass spectrometry (ICP-MS). The limits of
detection for 237
Np, 239
Pu and 240Pu are 0.25 μBq/m
3, 20 μBq/m
3, 80 μBq/m
3, respectively, for
200 L seawater and 5 μBq/kg, 0.4 mBq/kg, 1.6 mBq/kg, respectively, for 10 g of
soil/sediment. The analytical turnover times for Np and Pu are about 3-4 days for seawater
and 2-3 days for soil/sediment, respectively.
Recently, a new analytical method is developed, which is targeted for simultaneous
determination of 99
Tc, Np and Pu in 200 L seawater (Qiao et al. 2014). The method is based
on the effective co-precipitation of Tc(IV) along with Pu and Np in alkaline condition via
Ca(OH)2-Mg(OH)2-Fe(OH)2. After the simultaneous pre-concentration, Tc is separated from
Np and Pu fraction by oxidizing Tc(IV) to Tc(VII) prior to the Fe(OH)3 co-precipitation,
whereupon Tc(VII) will remain in the supernatant whilst Np/Pu remain in the precipitate. The
further purification of Tc and Np/Pu is then performed separately using extraction (TEVA)
and anion exchange (AGMP-1M) chromatography, respectively. Similar to the traditional
method, beta counter is used for the quantification of 99
Tc and ICP-MS for 237
Np and Pu
isotopes with comparable limits of detection to the traditional methods for all target
radionuclides.
(1) Tc, Np and Pu in seawater
The traditional analytical method for 99
Tc seawater analysis has been reported in Risø-R-1263
report. Herein the new method for combined 99
Tc, 237
Np and Pu isotopes determination is
detailed following the stages of sample pre-concentration, Tc purification, Np and Pu
purification, source preparation and detection. In the pre-concentration stage, Tc is co-

Page 6 of 57
precipitate along with Np and Pu via Ca(OH)2-Mg(OH)2-Fe(OH)2 (pH=10-11) from 200 L
sample based on the redox control of Tc(IV) (Figure.3 ). Ca and Mg is then removed via
Fe(OH)2 co-precipitation through controlling the pH to 9-10. After that, the separation of Tc
from Np and Pu is performed by oxidizing Tc(IV) to Tc(VII) prior to another Fe(OH)3 co-
precipitation, whereupon Tc(VII) becomes soluble in the supernatant while Np and Pu remain
in the precipitate.
Figure. 3 Analytical procedure for simultaneous determination of 99
Tc, 237
Np and 239, 240
Pu in
200 L seawater
Repeat column separation
Dissolve with aqua regiaDigest for 2 h under 200°C
Add concentrated NH3·H2O
to pH 9, centrifuge
Fe(III) hydroxide co-precipitate
Add 6 mol/L NaOH, centrifuge
Fe(III) hydroxide co-precipitate
Dissolve with 37% HClAdd 1 g K2S2O5, stir for 20 min
Add 10% NH3·H2O to pH 9, centrifuge
Fe(II) hydroxide co-precipitate
Dissolve with 2-5 mL of conc. HClAdd conc. HNO3 to 8 mol/L HNO3
Pu/Np
AGMP-1M
①Load sample②Rinse with 100 mL 8 mol/L HNO3
③Rinse with100 mL 9 mol/L HCl④Elute Pu/Np with 100 mL 0.5 mol/L HCl
ICP-MS
Add 1 g of FeCl3·6H2O Adjust pH to 2 with concentrated HCl
Add 1 g K2S2O5, stir for 20 minAdd 10% NH3·H2O to pH 9, centrifuge
Fe(II) hydroxide co-precipitate
Supernatant
Add 3 mL 30% H2O2
Heat at 100 °C for 30 minAdd 8 mol/L HNO3 to pH 0.5-1
TEV
A
Repeat TEVA column separation
Add 6 mol/L NaOH to pH 7Add 3 mL 30% H2O2
Heat at 100 °C for 30 min Adjust pH 0.5-1
Tc
Dissolve with 8 mol/L HNO3
Add 4 mL 30% H2O2
Add 6 mol/L NaOH to pH 10, centrifuge
①Load sample②Rinse with 40 mL 1 mol/L HNO3
③Elute Tc with 10 mL 8 mol/L HNO3
GM Beta counting
Electro-deposition
Add 37% HCl to pH=2, add tracer 242Pu and 99mTcAdd 4 g FeCl3·6H2O and 150 g K2S2O5, air bubbling for 20 min
Add 10 mol/L NaOH to pH 11;
Stay still overnight, discard supernatant
Ca-Mg-Fe(II) hydroxide co-precipitate
Fe(II) hydroxide co-precipitate
Dissolve with 37% HCl; Add 10% NH3·H2O to pH 9;Add KCl to a concentration of 4g/L;
Stay still for 1-2h, discard supernatant
Dissolve with 37% HCl, add 2 mL of 14% NaClOAdd 10% NH3·H2O to pH 9, centrifuge
Filtrated 200 L seawater
Supernatant Fe(III) hydroxide co-precipitate

Page 7 of 57
For Tc purification, a Fe(OH)2 co-precipitation is performed again to reduce the sample
volume followed by a Fe(OH)3 precipitation to transfer Tc(VII) into aqueous phase
meanwhile remove Fe in the residue. The interfering radionuclide such as Mo, Ru, U, Th, Po
is further removed through 30% H2O2 treatment in combination of extraction chromatography
(TEVA). In the chromatographic separation, the sample is prepared in 0.1 M HNO3 and
loaded onto a 2-mL TEVA column. The column is then rinsed with 1 M HNO3 to remove Ru
and Mo, and Tc is finally eluted with 8 HNO3. The TEVA column separation is repeated two
times to ensure sufficient decontamination of interfering nuclides. The final Tc eluate is
evaporated under lower temperature (100 ºC) to near-dryness for source preparation and
detection.
For Np and Pu purification, acid digestion using auqa regia is carried out to decompose
potential organic matter wrapped in the Fe(OH)3 precipitate, followed by repeated Fe(OH)3
co-precipitation in ammonia and NaOH medium to further remove matrix elements (Ca, Mg)
and amphoteric elements (Al, V, U), respectively. After valence adjustment of Pu(IV) and
Np(IV) using a redox pair K2S2O5-conc. HNO3, automated anion exchange chromatography
(AGMP-1M) assembled in a flow injection (FI) system is employed to further remove matrix
elements (e.g., Fe, Mn) and other interfering radionuclides (e.g., U, Am, Th), see Figure. 4.
Four samples can be processed simultaneously in the FI system. In the anion exchange
chromatographic separation, the sample prepared in 8 M HNO3 is loaded onto a 4-mL
AGMP-1M column, the column is rinsed with 8 M HNO3 followed by 9 M HCl, Np and Pu is
finally eluted with 0.1 NH2OH·HCl-2 M HCl and evaporated to dryness. The column
separation is also repeated two times to ensure sufficient decontamination of interferences,
especially for U. But for the second chromatographic separation, a 2-mL column is used
instead of a 4-mL column to reduce the consumption of the anion exchange resin.
Figure. 4. Schematic illustration of the multi-sample processing FI system for simultaneous
determination of Tc, Np and Pu in large volume seawater (PP: Peristaltic pump, S1-S4: ports
for sample loading, EF1-EF4: ports for eluate collection, WS: waste, AIR: port for air
aspiration/dispense, SV-1-SV-8: selective valves, R1-R8: reagents for column separation)
MSV
R2R1
R3R4
R6
R7
AIR
WS
R5
R8
Columns1 2 3 4
PP
S1
S2
S3
S4
E4
E3
E2
E1
WS
WS
WS
WS
SV-1
SV-2
SV-3
SV-4
SV-5
SV-6
SV-7SV-8

Page 8 of 57
In the source preparation and detection, the evaporated Tc eluate is re-dissolved with 2 M
NaOH and electrodeposited onto a stainless steel disc under a current of 150 mA for at least 5
hours. After dry, the Tc disc is counted for about 3-5 days (10 hours/run, 8-12 runs). For the
detection of Np and Pu, the evaporated eluate is re-dissolved with 0.5 M HNO3 (containing 1
ng/g of In as internal standard), and measured under hot plasmas condition using XII series
quadruple ICP-MS connected to ultrasonic nebuliser.
(2) Pu in environmental solid
Sequential injection (SI) based automated analytical methods have been developed in DTU
Nutech for determination of Pu in different environmental solid samples including soil,
sediment and seaweed. These methods have been successfully used for Pu tracer applications
in radioecology studies in different research projects. The detailed analytical procedure for Pu
environmental solid analysis is demonstrated in Figure. 5. Typical sample size is 5-10g of soil
and sediment, and 10-20 g of seaweed. The sample material, after grinding, sieving, freeze
drying and ashing, is digested with aqua regia to leach Pu into the solution. A series Fe(OH)3
co-precipitation is used to pre-concentrate Pu and remove most of the matrix elements. After
valence adjustment with a redox pair K2S2O5-conc. HNO3, the sample is prepared in 1 M
HNO3 solution and loaded onto a 2-mL TEVA column. The column is rinsed with 1 M HNO3
followed by 6 M HCl. Pu is finally eluted with 0.1 NH2OH·HCl in 2 M HCl solution. It
should be noted that, in case of processing high matrix elements (e.g., Fe, Mn, Ni) or U
content samples (such as soils from areas with heavy industrial pollution), anion exchange
column is normally used before the TEVA column to perform the preliminary purification of
Pu as well as to avoid a breakthrough on TEVA column.
Figure. 5 Analytical procedure for Pu determination in environmental solid samples
Sample solution, with Pu (IV) in 1M HNO3 medium
Sequence 2: Wash with 60mL of 9M HCl
Matrix (Ca, Mg, Fe, Pb…) Am, U
Sequence 3: Elute with 10mL of 0.1M NH2OH∙HCl -2M
HCl
Th
ICP-MS
Sequence 1: Wash with 60mL of 1 M HNO3
2 mL(0.7 5 cm) of TEVA
column
Pu
Sequence 1 Sequence 2 Sequence 3
Flow rate: 0.5-2.5 mL/min
Soil, sediment and vegetation
Ash 550 C over-night
Ash
Add 242Pu trace, leachwith aqua regia
Leachate
Add NH3 to pH 8-9, centrifuge
Precipitate
Add NaOH, centrifuge
PrecipitateSupernatant
Dissolve with HCl, add KHSO3, add NaOH to pH9-10, centrifuge
Precipitate
Dissolve with cocn. HNO3, dilute to 1 M HNO3
Page 9 of 57
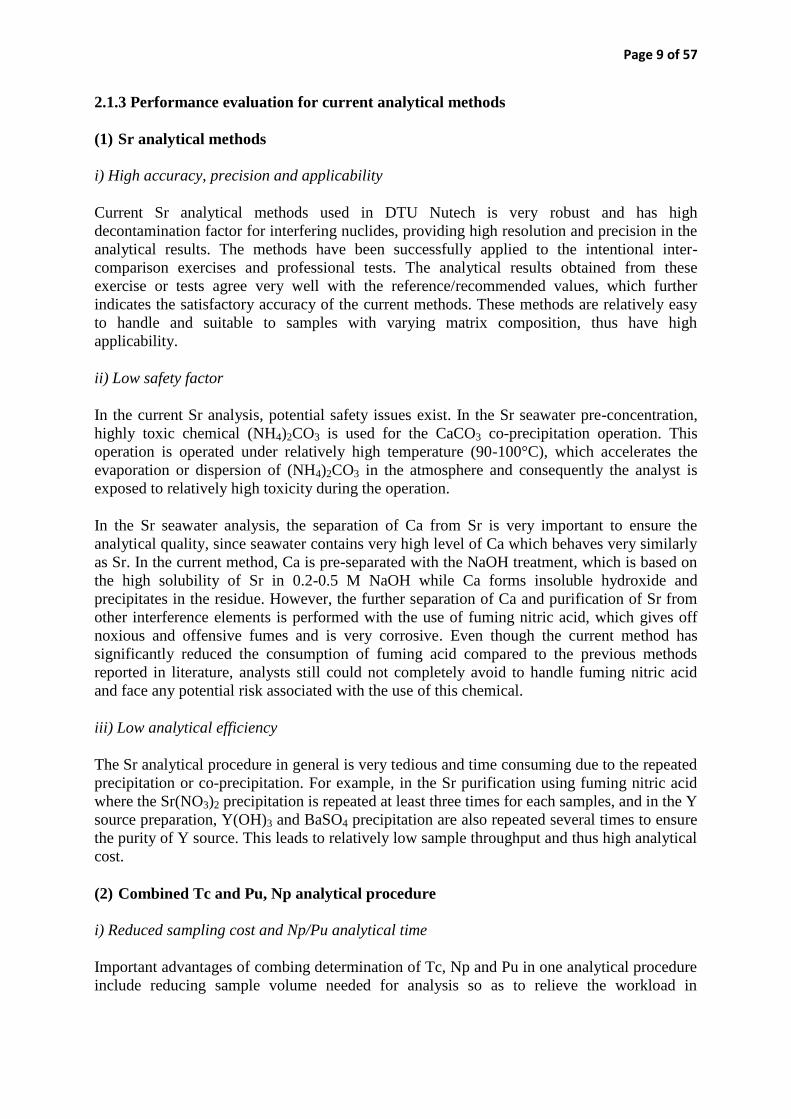
2.1.3 Performance evaluation for current analytical methods
(1) Sr analytical methods
i) High accuracy, precision and applicability
Current Sr analytical methods used in DTU Nutech is very robust and has high
decontamination factor for interfering nuclides, providing high resolution and precision in the
analytical results. The methods have been successfully applied to the intentional inter-
comparison exercises and professional tests. The analytical results obtained from these
exercise or tests agree very well with the reference/recommended values, which further
indicates the satisfactory accuracy of the current methods. These methods are relatively easy
to handle and suitable to samples with varying matrix composition, thus have high
applicability.
ii) Low safety factor
In the current Sr analysis, potential safety issues exist. In the Sr seawater pre-concentration,
highly toxic chemical (NH4)2CO3 is used for the CaCO3 co-precipitation operation. This
operation is operated under relatively high temperature (90-100°C), which accelerates the
evaporation or dispersion of (NH4)2CO3 in the atmosphere and consequently the analyst is
exposed to relatively high toxicity during the operation.
In the Sr seawater analysis, the separation of Ca from Sr is very important to ensure the
analytical quality, since seawater contains very high level of Ca which behaves very similarly
as Sr. In the current method, Ca is pre-separated with the NaOH treatment, which is based on
the high solubility of Sr in 0.2-0.5 M NaOH while Ca forms insoluble hydroxide and
precipitates in the residue. However, the further separation of Ca and purification of Sr from
other interference elements is performed with the use of fuming nitric acid, which gives off
noxious and offensive fumes and is very corrosive. Even though the current method has
significantly reduced the consumption of fuming acid compared to the previous methods
reported in literature, analysts still could not completely avoid to handle fuming nitric acid
and face any potential risk associated with the use of this chemical.
iii) Low analytical efficiency
The Sr analytical procedure in general is very tedious and time consuming due to the repeated
precipitation or co-precipitation. For example, in the Sr purification using fuming nitric acid
where the Sr(NO3)2 precipitation is repeated at least three times for each samples, and in the Y
source preparation, Y(OH)3 and BaSO4 precipitation are also repeated several times to ensure
the purity of Y source. This leads to relatively low sample throughput and thus high analytical
cost.
(2) Combined Tc and Pu, Np analytical procedure
i) Reduced sampling cost and Np/Pu analytical time
Important advantages of combing determination of Tc, Np and Pu in one analytical procedure
include reducing sample volume needed for analysis so as to relieve the workload in

Page 10 of 57
transporting very large volumes of seawater over long distances, as well as shortening
analytical time and thus saving analytical cost and improving sample throughput.
To our experience, the application of automation is important to obtain good analytical
repeatability and constant sample throughput, especially for Np and Pu column separations,
since the density/viscosity of the column loading solutions for Np and Pu are very high
(containing a large amount of matrix elements, such as Fe and Mn), often inducing blockage
of the column or fluctuation of flow rate whenever manual operations are performed.
ii) High complexity
In the combined Tc, Pu and Np procedure, Fe(OH)2 is used for the pre-concentration of target
radionuclide. Even though the co-precipitation efficiency is satisfactory, the selectivity is not
very high since a lot of interfering matrix (Mn, Co, Ni) and radionuclide (U, Th, Mo, Ru) will
be scavenged along with Tc, Pu and Np. This impose relatively high burden in the
chromatographic column separation, which require repeated operation for column separation
to ensure high resolution and decontamination of interferences. Consequently, this renders the
analytical process somehow complicated and time-consuming. Especially in the case for Tc
determination, the analyst is frustrated with time-constrain of the short half-life of 99m
Tc, and
the repeated and complicated operation may cause more human error in the operation.
iii) Low analytical efficiency for 99
Tc
At present, the Tc column separation is performed manually and the flow rate is sometime
very slow due to the high density of the sample loading solution, which possibly decreases the
analytical efficiency. Moreover, in the 99
Tc source preparation, the Tc eluate has to be
evaporated to near dryness in order to be able to reconstitute in 2 M NaOH. However, due to
the readily volatile behaviour of Tc, the evaporation operation cannot be operated under high
temperature which slows down the sample process and also bring more stress to the analysis
with the analytical time. The Tc electro-deposition is also time-consuming which takes at
least 6 hour to get quantitative Tc source, which again prolong the analytical processes.
(3) Pu solid analytical procedure
i) High simplicity and analytical efficiency
The current Pu method developed for environmental solid samples is simple and
straightforward, and the chromatographic separation can be performed in a sequential
injection system for automated operation (Figure. 6). With the application of automated
sequential injection system, sample throughput is improved and labor intensity is reduced.
ii) Low applicability
However, the current method used for Pu solid analysis is not suitable for sample containing
refractory Pu oxides, since acid leaching is not able to extract Pu from refractory oxides. As
mentioned in the method description, in the case of analyzing samples containing high
amount of matrix elements, a guard anion exchange column is needed to avoid the
breakthrough of the TEVA column, since TEVA column is sometimes very sensitive to
matrix content in the sample loading solution. Consequently, the chemical yields of Pu from
TEVA column vary significantly with the matrix composition of the sample. Besides, with the

Page 11 of 57
used of Fe(OH)3 co-precipitation , U will be co-precipitated with Pu, thus one TEVA is
sometime not sufficient to get satisfactory decontamination of U. We recently observed that
NaOH treatment of Fe(OH)3 could improve the decontamination of U since U behave as
amphoteric element and will be dissolved in the relatively high concentration of alkaline
solution (Qiao et al. 2014). But even with the NaOH treatment, the decontamination of U with
the use of only one TEVA column is still not satisfactory, especially for the samples with high
matrix content.
Figure. 6 Sequential injection network for Pu determination in environmental solid samples
(SP: syringe pump, HC: holding coil, S1-S9: ports for sample loading, EF1-EF9: ports for
eluate collection, WS: waste, AIR: port for air aspiration to isolation the carrier from the
solution drawn into the holding coil, SV-1-SV-5: selective valves, R1-R6: reagents for
column separation)
2.1.4 Potential solutions and perspectives
(1) Sr analytical methods
The safety issue involved in Sr analytical procedure might be solved by changing to use
chemicals with similar performance as (NH4)2CO3 but lower hazards, e.g., Na2CO3. Another
alternative solution is to completely change the technique used for co-precipitation., e.g.,
using CaC2O4 co-precipitation under lower pH (5) which could also improve the selectivity
against many metal ions. Bojanowski and Knapinska-skiba (1990) have reported the
application of oxalate co-precipitation for Sr large volume seawater analysis.
In the separation of Ca from Sr, NaOH treatment can be repeatedly used instead of using
fuming nitric acid. The application of NaOH in separating large amount of Ca from Sr for
5 SV-3
4
6 7
3
1 10
9
8
2
5
SV-4
4
6 7
3
1 10
9
8
2
1 2 3 4 5 6 7 8 9
HC
SV-1
SP
Carrier
(H2O)
R2
R1
R3R4
R5
R6
AIR
WS
5 SV-2
4
6 7
3
1 2 10
9
8
S1
S3
S2
S4
S5
S6
S7
S8
S9
5
SV-5
4
6 7
3
1 2 10
9
8
EF1
EF3
EF2
EF4
EF5
EF6
EF7
EF8
EF9
WS
Chromatographic
columns

Page 12 of 57
seawater analysis have been investigated by Popov et al. (2006, 2009) and successfully used
in large volume seawater analysis. This will improve the safety factor of the analytical
procedure as well as reduce the analytical cost since the price of fuming nitric acid is much
higher compared to NaOH.
Besides, many researchers have used Sr resin for determination of Sr in different
environmental and biological samples. The Sr extraction chromatography method is rather
straightforward and simple, which significantly reduce the analytical turnover time. In the
separation of 90
Y from Sr, Ln resin has also been applied to achieve a rapid separation which
can be considered in the future method improvement for DTU Nutech.
(2) Tc analytical methods
In Tc determination, beta counting is used which requires time-consuming source preparation,
since the 99
Tc eluate in 8 M HNO3 medium has to be evaporated slowly and then re-dissolved
in 2 M NaOH and electrodeposited for at least 5 hours. With the development of mass
spectrometry, more and more researcher started to use ICP-MS for 99
Tc determination (Shi et
al. 2012). The measurement normally takes less than 10 minutes and does not require
complicated source preparation. The only challenge is the external (e.g., from lab wares and
atmosphere) contamination of stable Mo and Ru at the mass 99, but this can be controlled via
careful clean-up the lab ware and using inflammation box to avoid contamination from air.
For the column separation, vacuum box is a good choice due to its relative low cost and easy
handle-ability for analyst. But the drawback is that the vacuum box system is not fully
automated and human attention is needed throughout the whole operational process.
Flow/sequential injection techniques have been used in many labs for fully automated column
separation. In DTU Nutech, these techniques have been successfully used for routine Np and
Pu seawater analysis, which improve the analytical efficiency and reduce the labor
insensitivity. However, these techniques require to analyst to have more intensive training and
knowledge for handling and the instrumental cost is relatively high compared to vacuum box.
(3) Pu analytical methods
For Pu environmental solid analysis, method development is needed to explore the analytical
method to be applied for samples with different origins and matrix composition. For example,
alkaline fusion will be developed for the pre-treatment of samples containing refractory Pu
oxides and possibly boric fusion could be a technique of choice according to its successful
application in many Pu studies for geological samples (Croudace et al. 1998). To overcome
the high susceptibility of TEVA to matrix content, development of an alternative co-
precipitation technique using CaC2O4 could be considered to eliminate the scavenge of most
metal elements contained in the samples (Fe, Mn, Ni, Co), since the CaC2O4 co-precipitation
is normally operated in low pH (1-2). As a consequence, one TEVA column separation might
be sufficient to remove the remaining interfering nuclides. Thus the analytical time will be
reduced comparing to the one using an extra anion exchange column before the TEVA
column separation.
Page 13 of 57
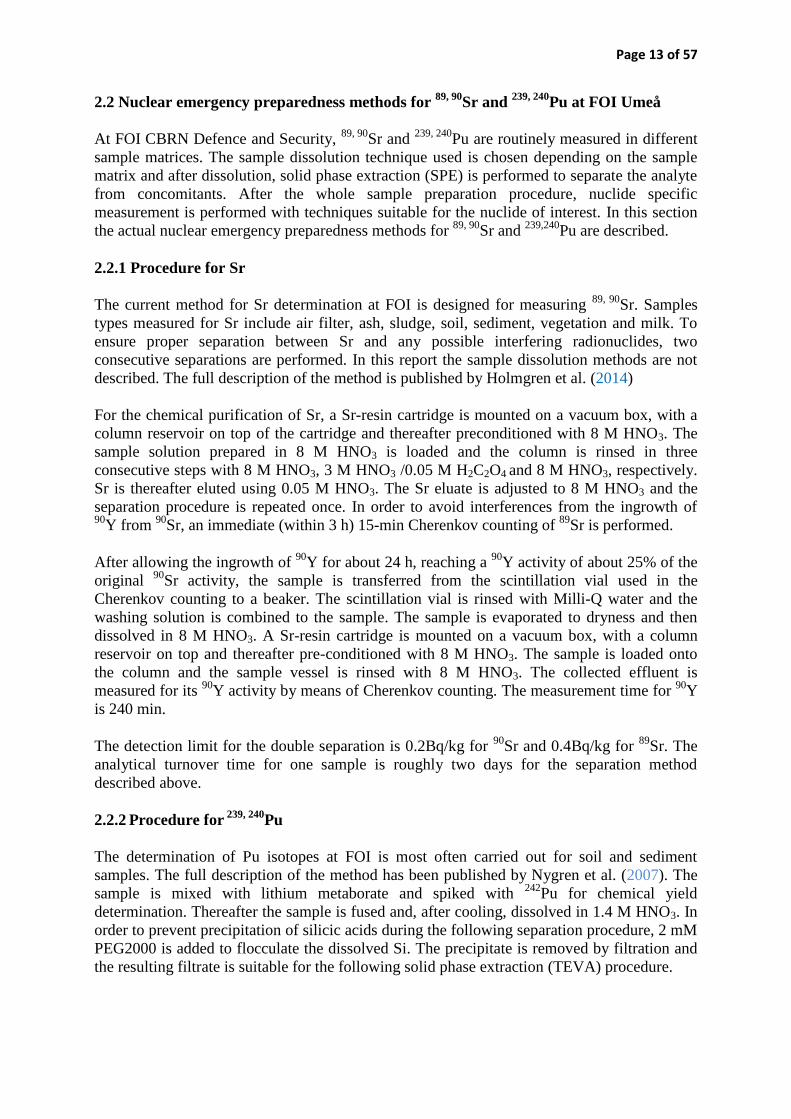
2.2 Nuclear emergency preparedness methods for 89, 90
Sr and 239, 240
Pu at FOI Umeå
At FOI CBRN Defence and Security, 89, 90
Sr and 239, 240
Pu are routinely measured in different
sample matrices. The sample dissolution technique used is chosen depending on the sample
matrix and after dissolution, solid phase extraction (SPE) is performed to separate the analyte
from concomitants. After the whole sample preparation procedure, nuclide specific
measurement is performed with techniques suitable for the nuclide of interest. In this section
the actual nuclear emergency preparedness methods for 89, 90
Sr and 239,240
Pu are described.
2.2.1 Procedure for Sr
The current method for Sr determination at FOI is designed for measuring 89, 90
Sr. Samples
types measured for Sr include air filter, ash, sludge, soil, sediment, vegetation and milk. To
ensure proper separation between Sr and any possible interfering radionuclides, two
consecutive separations are performed. In this report the sample dissolution methods are not
described. The full description of the method is published by Holmgren et al. (2014)
For the chemical purification of Sr, a Sr-resin cartridge is mounted on a vacuum box, with a
column reservoir on top of the cartridge and thereafter preconditioned with 8 M HNO3. The
sample solution prepared in 8 M HNO3 is loaded and the column is rinsed in three
consecutive steps with 8 M HNO3, 3 M HNO3 /0.05 M H2C2O4 and 8 M HNO3, respectively.
Sr is thereafter eluted using 0.05 M HNO3. The Sr eluate is adjusted to 8 M HNO3 and the
separation procedure is repeated once. In order to avoid interferences from the ingrowth of 90
Y from 90
Sr, an immediate (within 3 h) 15-min Cherenkov counting of 89
Sr is performed.
After allowing the ingrowth of 90
Y for about 24 h, reaching a 90
Y activity of about 25% of the
original 90
Sr activity, the sample is transferred from the scintillation vial used in the
Cherenkov counting to a beaker. The scintillation vial is rinsed with Milli-Q water and the
washing solution is combined to the sample. The sample is evaporated to dryness and then
dissolved in 8 M HNO3. A Sr-resin cartridge is mounted on a vacuum box, with a column
reservoir on top and thereafter pre-conditioned with 8 M HNO3. The sample is loaded onto
the column and the sample vessel is rinsed with 8 M HNO3. The collected effluent is
measured for its 90
Y activity by means of Cherenkov counting. The measurement time for 90
Y
is 240 min.
The detection limit for the double separation is 0.2Bq/kg for 90
Sr and 0.4Bq/kg for 89
Sr. The
analytical turnover time for one sample is roughly two days for the separation method
described above.
2.2.2 Procedure for
239, 240Pu
The determination of Pu isotopes at FOI is most often carried out for soil and sediment
samples. The full description of the method has been published by Nygren et al. (2007). The
sample is mixed with lithium metaborate and spiked with 242
Pu for chemical yield
determination. Thereafter the sample is fused and, after cooling, dissolved in 1.4 M HNO3. In
order to prevent precipitation of silicic acids during the following separation procedure, 2 mM
PEG2000 is added to flocculate the dissolved Si. The precipitate is removed by filtration and
the resulting filtrate is suitable for the following solid phase extraction (TEVA) procedure.
Page 14 of 57
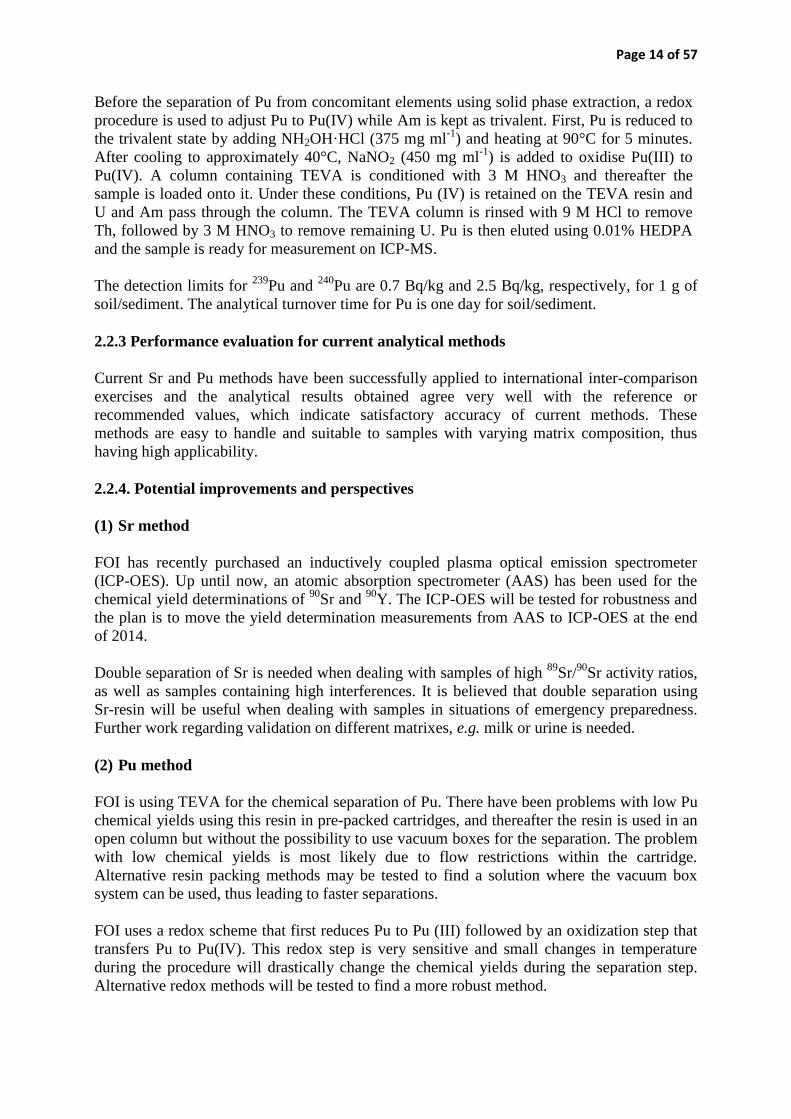
Before the separation of Pu from concomitant elements using solid phase extraction, a redox
procedure is used to adjust Pu to Pu(IV) while Am is kept as trivalent. First, Pu is reduced to
the trivalent state by adding NH2OH·HCl (375 mg ml-1
) and heating at 90°C for 5 minutes.
After cooling to approximately 40°C, NaNO2 (450 mg ml-1
) is added to oxidise Pu(III) to
Pu(IV). A column containing TEVA is conditioned with 3 M HNO3 and thereafter the
sample is loaded onto it. Under these conditions, Pu (IV) is retained on the TEVA resin and
U and Am pass through the column. The TEVA column is rinsed with 9 M HCl to remove
Th, followed by 3 M HNO3 to remove remaining U. Pu is then eluted using 0.01% HEDPA
and the sample is ready for measurement on ICP-MS.
The detection limits for 239
Pu and 240
Pu are 0.7 Bq/kg and 2.5 Bq/kg, respectively, for 1 g of
soil/sediment. The analytical turnover time for Pu is one day for soil/sediment.
2.2.3 Performance evaluation for current analytical methods
Current Sr and Pu methods have been successfully applied to international inter-comparison
exercises and the analytical results obtained agree very well with the reference or
recommended values, which indicate satisfactory accuracy of current methods. These
methods are easy to handle and suitable to samples with varying matrix composition, thus
having high applicability.
2.2.4. Potential improvements and perspectives
(1) Sr method
FOI has recently purchased an inductively coupled plasma optical emission spectrometer
(ICP-OES). Up until now, an atomic absorption spectrometer (AAS) has been used for the
chemical yield determinations of 90
Sr and 90
Y. The ICP-OES will be tested for robustness and
the plan is to move the yield determination measurements from AAS to ICP-OES at the end
of 2014.
Double separation of Sr is needed when dealing with samples of high 89
Sr/90
Sr activity ratios,
as well as samples containing high interferences. It is believed that double separation using
Sr-resin will be useful when dealing with samples in situations of emergency preparedness.
Further work regarding validation on different matrixes, e.g. milk or urine is needed.
(2) Pu method
FOI is using TEVA for the chemical separation of Pu. There have been problems with low Pu
chemical yields using this resin in pre-packed cartridges, and thereafter the resin is used in an
open column but without the possibility to use vacuum boxes for the separation. The problem
with low chemical yields is most likely due to flow restrictions within the cartridge.
Alternative resin packing methods may be tested to find a solution where the vacuum box
system can be used, thus leading to faster separations.
FOI uses a redox scheme that first reduces Pu to Pu (III) followed by an oxidization step that
transfers Pu to Pu(IV). This redox step is very sensitive and small changes in temperature
during the procedure will drastically change the chemical yields during the separation step.
Alternative redox methods will be tested to find a more robust method.

Page 15 of 57
2.3 Environmental analysis and emergency preparedness methods for 89, 90
Sr, 238,
239, 240,
241Pu and
241Am in STUK
At STUK 89, 90
Sr and 239, 240
Pu are routinely measured in various environmental samples.
STUK measures also other radionuclides routinely from environmental samples but this
section concentrates only on Sr and Pu isotopes. The routine analysis of 89, 90
Sr and 239, 240
Pu
carried out in STUK consist of several steps and requires several weeks to be completed.
STUK has also developed emergency preparedness methods for 89, 90
Sr and 239, 240
Pu that can
be used in emergency situations when results are needed within a short time.
2.3.1 Routine analytical procedures for 89, 90
Sr, 238,239, 240, 241
Pu and 241
Am in STUK
(1) Procedures for 90
Sr analysis from environmental samples
90Sr is routinely analyzed from various environmental matrices (e.g. milk, vegetation,
seawater, surface water, fish, soil and sediment, meat, air filter, deposition, urine). The
method used for 90
Sr determination in STUK is based on various precipitations (carbonate,
oxalate, iron, and chromate precipitations) followed by extraction chromatography with Sr-
resin. Purified samples are counted with liquid scintillation counter or with low proportional
counting. For 90
Sr both counters can be used, but if 89
Sr is to be determined proportional
counter should be used preferably. The sample dissolution technique selected depends on the
sample matrix. Typical size of the sample for 90
Sr analysis from milk is 5-10 L and associated
minimum detectable activity (MDA) is about 0.002 Bq/L. 90
Sr analysis is normally carried out
within 1-2 months. Detailed description of 90
Sr analysis from vegetation samples is given as
an example below.
Example I: Analysis of 90
Sr from vegetation sample
Dissolving the sample
1. Ash is used in the analysis as follows:
2. a) Kelp (Fucus vesiculosus) and bear moss (Polytrichum) 5 g.
b) Other type of samples 10 g. Additional ashing is done at 600 ºC (1- 2 h), if sample
contains too much carbon.
3. Two alternative methods can be used to convert the ashed samples into liquid samples:
a. microwave digestion or b. melting with sodium carbonate.
a. Mars5-burn: Choose “sample specific burn” from the “MARS-cookbook”. After
digestion, transfer the liquid to a beaker (liter volume) or to a Teflon covered beaker in
case of using HF. Evaporate the residue to dryness with care. Centrifuge if needed,
and wash the precipitate with HCl in ratio of 1:4. If the sample is rich in silicate,
follow the instructions given in point 4.
b. Melting: Place/put anhydrous Na2CO3 on the bottom of a platinum bowl and on top of
it, put about 90 mg SrCl2*6 H2O, and add ashed sample mixed with Na2CO3; ratio is
1:4 (weight ratio). Add another thin layer of sodium carbonate. Melt the mixture in
muffle furnace at 900 ºC for 30 minutes (Remember fiberglass gloves and calf-length
tongs!)
4. Stir and cool the melt by dipping the bowl bottom into ice-water. Place the cooled
bowl (outer side rinsed with distilled water) in a 600-mL beaker. Add about 200-mL
distilled water. Extract the sample with a heating magnetic stirrer until the precipitate
unstuck the bowl. Centrifuge the sample and discard the liquid.

Page 16 of 57
5. Dissolve the carbonate precipitate with 50 mL 37% HCl and 150 mL H2O (HCl ratio
1:4) and transfer the solution to a beaker (volume of 1 litre) Mix and evaporate the
sample with care to dry in a beaker on a hot plate. Add a further 37% HCI and
evaporate to dryness. Add about 50 mL of 37% HCl and 150 ml H2O. Heat the sample
in water bath, centrifuge and transfer it to a beaker (volume 1 litre). Wash the residual
precipitate two times with 50 mL of 37% HCl and 150 ml H2O (HCl ratio 1:4),
centrifuge and add it to the previous solution.
Oxalate precipitation
1. Add 25 mL of 25% ammonium acetate (CH3COONH4) and 30 g of oxalic acid
(C2H2O4·2H2O) to the solution. Heat the solution on a hot plate and adjust the pH to 5-
6 with aid of 25% of ammonia (checked with pH paper) (Figure. 7). Dilute the
solution to 900 mL, boil it and leave the solution to stand for at least 4 hours in order
to descent the precipitate (Figure. 8).
Figure. 7 Oxalate precipitation for soil sample
Figure. 8 Oxalate precipitation has settled (deposition sample)
2. The liquid is then sucked into drains and the sediment is transferred to a 250-mL
centrifuge tube with water. Centrifuge and suck the solution into the drain. Wash the
precipitate once with water and centrifuge it.
3. Transfer the oxalate precipitation to a quartz beaker with a small amount of water, dry
it with an infrared lamp and ash the oxalates to carbonates in a muffle furnace at 600 -
700 ° C for about a half hour (Figure. 9).

Page 17 of 57
Figure. 9 Ashed oxalate precipitation in crucibles
Iron precipitation and chromate precipitation
1. If the sample does not contain 210
Pb, dissolve the carbonate precipitate in 20 mL of 8
M HNO3 and follow the instructions given in section ‘Extraction chromatography with
Sr resin’.
2. If the sample contains 210
Pb, proceed as follows: add 60 mL of distilled water and
65% HNO3 to the cooled silica crucible until no dissolution of carbonates can be
detected. Boil for at least 10 min. covered with a watch glass.
3. Heat the solution well. Precipitate iron with carbonate free ammonia (pH 8-9), heat the
solution for a few minutes and filter while hot (Whatman 41 filter paper). Wash the
precipitate with hot water containing ammonia. Add 10 mg of lead carrier and a few
drops of methyl red indicator, adjust pH by addition of 6 M HNO3 until the solution
turns red and then add 6 M NH4OH until the solution turns from back to yellow. Add
1mL of 30% acetic acid and 2 mL of 25% ammonium acetate solution.
4. Heat the solution well and precipitate lead by adding 1mL of 30% Na chromate. Heat,
cool and centrifuge the solution. Filter through the Whatman paper (no. 40). Solution
is adjusted to basic with ammonia (lemon yellow color change). Precipitate Sr with
ammonium carbamate (3.5 to 4 g), heat, cool and centrifuge. Dissolve the precipitate
in 20 mL of 8 M HNO3.Cromate filtrate and lead cromate precipitate is treated as
hazardous waste/ toxic waste
Extraction chromatography with Sr resin
1. Prepare a Sr-Spec column (Figure. 10). Add glass wool on the bottom of the column.
Add distilled water to the column (half full). Weigh 3 g of Sr resin (100 - 150 µm) and
mix it with small amount of distilled water. Transfer the resin into the column. Add
glass wool on the top of the resin bed. Condition the column with 30 mL of 3 M
HNO3. (Resin can be used 10 times but it must be reconditioned after each use by
washing it with 30 mL of distilled water followed by 30 mL of 3 M HNO3. If removal
of Pb and its daughters is needed, resin is washed with 30 mL of 8 M HCl, followed by
30 mL of water and then 30 mL of 3 M HNO3)
2. Transfer the sample to the column and allow it to drip freely into a clean beater. Rinse
a quartz beaker or centrifuge tube with 10 mL of 8 M HNO3 and transfer the rinsing
solutions to the column.
3. Wash the column twice with 20 mL of 8 M HNO3 followed by 20 mL of 3 M HNO3.
Record the exact time when washing was completed (yttrium ingrowth starts)
4. Elute Sr from the resin with 70 mL of 0.05 M HNO3 and collect the eluate into a 250-
mL centrifuge tube.

Page 18 of 57
5. Add 25 % NH3·H2O to adjust the pH to 8-9 and add 3.5 - 4 g of solid ammonium
carbamate (NH4CO2NH2) to the solution. Heat in water bath until precipitate settles in
the bottom of the tube. Cool in ice water bath.
Figure. 10 Preconditioned Sr-resin columns ready to be used
Measurement of 90
Sr with liquid scintillation counter
1. Filter the sample solution on pre-weighed Whatman 42 filter paper (diameter 3 cm)
that has been dried at 105 ºC for 30 min. Wash the precipitate 5 mL of distilled water
for 3 times and then with 5 mL of technical alcohol for three times. Dry the sample at
105 ºC for 30 min. and weigh the precipitate.
2. Transfer the precipitate into a pre-weighed 20-mL liquid scintillation (LS) bottle and
dissolve it with 1.7 mL of 1M HCl. Shake well.
3. Weigh the scintillation bottle. To determine the Sr yield with AAS, take an aliquot of
0.15 ml with pipette and transfer it into a pre-weighed 50-mL measuring bottle and
weigh. Add 1 mL of 6 M HCl and fill the measuring bottle with distilled water. Weigh
the LS bottle and determine the weight of the final solution.
4. Add 6 mL of Ultima Gold uLLT scintillation cocktail into the scintillation bottle
containing the sample and shake well. Prepare background sample by pipetting 1.5 mL
of 1M HCl and 6 mL of Ultima Gold uLLT into a LS bottle. Shake well.
5. Wait 18 days until 90
Sr and 90
Y are in equilibrium. Store samples in dark and cool
place. Check and ensure that phases have not been separated in LS bottle before
counting the samples.
6. Before placing the scintillation bottles LS counter (Quantuluks) wash the closed LS
bottles in ultrasound washing system for 3 min. in distilled water and then 3 min. in
alcohol.
7. Start measurement next day after samples has been placed in Quantulus (constant
temperature achieved).
(2) Procedures for 238, 239, 240, 241
Pu and 241
Am analysis from environmental samples
Pu is routinely analyzed in STUK from seawater, surface water, soil, sediment, vegetation and
urine. Samples are first digested using microwave digestion (MARS5, CEM) or wet ashing.

Page 19 of 57
Pu is separated from the digested sample with anion exchange (Dowex 1x4 resin). Pu sources
are prepared through electrodeposition or co-precipitation. 238
Pu and 239+240
Pu are determined
with Alpha Analyst alpha spectrometer (Canberra) and analyzed with Canberra Genie2000
based software. Chemical yield of Pu is determined by 242
Pu tracer. 241
Pu (if wanted) is
determined by liquid scintillation counting with beta and alpha/beta -separation procedures.
Typical sample size for Pu analysis from soil is 15 g and the associated minimum detectable
activity (MDA) is 0.01 - 0.02 Bq/kg. Pu analysis is typically carried out in 2-3 weeks.
Detailed description of 239, 240
Pu analysis from soil, vegetation and sediment is given below.
Example II: 238,
239, 240
Pu and 241
Amanalysis from soil, vegetation and sediment
Samples are first digested using microwave digestion or wet ashing. Pu is separated with
anion exchange. Am is separated with oxalate precipitation, iron hydroxide precipitation,
extraction, cation exchange and anion exchange. Pu and Am sources are prepared through
electro-deposition or co-precipitation.
Digestion of the samples
1. Sample size 10 - 60 g
2. Weigh dried and homogenized sample into a digestion flask
3. Add 242
Pu and 243
Am tracers into the digestion flask
4. Samples are digested using microwave digestion (MARS5) or wet ashing with 65%
HNO3, 37% HCl and 30% H2O2 (Tecator)
5. If using wet ashing (Tecator), filter the digested sample through a GF-filter using
Bühner-funnel with suction. Rinse the flask and the precipitate with 8 M HNO3 few
times. Transfer the solutions into a 400-mL beaker and evaporate until salts appear.
6. If using microwave digestion (MARS5), transfer the digested sample from the
digestion flask into a Teflon beaker and evaporate to dryness (Teflon beaker can be
used max. 200-250°C).
Pu separation by anion exchange
1. Dissolve the residual into 100 mL of 8 M HNO3. Heat and add 1 mL of 30% H2O2.
Cover the beaker with a watch glass and heat at 90 ºC for 1 hour. Add approx. 2 g (1
teaspoon) NaNO2 to the hot solution. Let cool for 1 h. (Pu3+
is oxidized to Pu4+
.
Reaction is vigorous so add NaNO2 in bit by bit)
2. Prepare an anion exchange column (Figure. 11): place approx. 12.5 g anion exchange
resin Dowex 1 x 4 (50 - 100 mesh) in nitrate form into an anion exchange column (ø 1
cm) using 8 M HNO3. (Resin is brought in nitrate form by treating it with 50 mL of
conc. HNO3 and 2 x 50 mL of 8 M HNO3)
3. Place glass wool on bottom of the column. Load the sample solution into the anion
exchange column (15 cm resin in the column). Wash the resin with 150 mL of 8 M
HNO3. Collect the load and wash solutions for Am analysis. (8 M HNO3 solution
contains: Am3+
, Cm3+
, lanthanides, Sr2+
, Pb2+
, Ra2+
, Fe3+
, U6+
, Po)
4. Wash the resin with 150 - 200 mL 37% HCl. Discard the wash solution. (Wash
solution contains Th4+
)
5. Elute Pu with freshly made 60 mL of 37% HCl + 5 mL of 1 M NH4I solution. (Pu4+
is
reduced to Pu3+
. 1 M NH4I can be preserved for one month when covered from light)

Page 20 of 57
6. Evaporate Pu eluate to dryness. Add few milliliters of 65% HNO3 and 37% HCl and
evaporate. Repeat this 2 - 3 times. Evaporate and add small amounts of 65% HNO3 (<
1 ml) until no residual remains in the beaker.
Figure. 11. Anion exchange columns
Source preparation
Pu sources are prepared by either electro-deposition or co-precipitation
Electro-deposition
1. Add 25 drops of 2 M HNO3 into the beaker by washing the walls of the beaker at the
same time. Heat and let cool. Pour the solution into an electrolysis vessel. Wash the
beaker with small amount of distilled water and add wash solution into the electrolysis
vessel, repeat. Volume of the solution should not exceed 4 - 5 ml.
2. Add 3 – 4 drops of methylred. Add 25% NH3·H2O dropwise until colour changes from
red to yellow. Add 2 M HNO3 dropwise until the solution turns red (solution now
acid). Add 4 drops more 2 M HNO3.
3. Carry out the electrolysis for 45 - 90 min using 1.7 – 1.9 A (currency) and 6 - 9 V
(voltage) in ice water bath with Pt-spiral as an anode and steel plate as cathode. (45
min is enough for Pu but Am requires 1.5 h.) Stop the electrolysis by adding 2 mL of
25% NH3·H2O into the vessel, wait 1 min before taking the vessel out.
4. Wash the steel plate with distilled H2O and ethanol. Anneal with Bunsen burner, upper
part of the flame, until tinged with red. Let cool.
5. Measure Pu with α-spectrometry
Co-precipitation
Dissolve the residual into 2-5 mL of 1 M HNO3. Transfer into plastic test tube and wash the
beaker twice with few milliliters of 1M HNO3. Add wash solutions into the test tube. Add 0.5

Page 21 of 57
mL of Ce-carrier (Ce 100 µg/mL) into the test tube and mix with Vortex mixer. Co-precipitate
Pu with CeF by adding 1.5 mL of 40 % HF acid. Mix the sample with Vortex and place the
test tube in ice bath for 45 min. Filter the precipitate. Measure 238
Pu and 239+240
Pu with α-
spectrometry
2.3.2 Performance evaluation of the analytical methods
Current Sr and Pu methods used in STUK are very robust and have been successfully used in
several international inter-comparisons exercises. Within last three years, STUK has
participated in 8 inter-comparison related 89, 90
Sr analysis and 6 related to 239, 240
Pu.
Environmental Radiation Surveillace (VALO) at STUK is a testing laboratory accredited by
FINAS Finnish Accreditation Service under the registration number T167. The laboratory
meets the requirements laid down in standard EN ISO/IEC 17025:2005.
2.3.3. Emergency preparedness methods
Even though the regular analytical methods used for 90
Sr and Pu isotopes are very robust, they
are time consuming. Therefore the methods have been modified for emergency purpose so
that results will be obtained faster.
(1) Emergency preparedness methods for 89, 90
Sr
Emergency preparedness method for 89,
90
Sr in water and air filter has been tested and can be
carried out within a day.
Analysis of Sr from water/deposition
1. Add Sr carrier (30 mg) and Cs carrier (30 mg) into a 500 mL water sample. Acidify
with HNO3 and stir for 10 min.
2. Add NaOH until pH 8-9 and heat the sample. Precipitate Sr by adding 10 g of
Na2CO3·10 H2O (20 g/L) and stir for 15 min.
3. Centrifuge, discard solution and dissolve precipitate into 8 M HNO3 (20 mL).
4. Carry out Sr extraction chromatography : load sample to Sr columns, wash twice with
20 mL of 8 M HNO3 and once with 3 M HNO3 (20 mL), note time of last wash, elute
Sr with 60 mL of 0.05 M HNO3.
5. Precipitate Sr from alkaline solution (pH 8-9) by adding 3 - 4 g of NH4CO2NH2 and
heat. Filter the Sr precipitate onto pre-weighed filter paper and determine the Sr yield
by weighing.
6. Activity measurements: sample is divided into two parts: Cerenkov counting with
liquid scintillation (89
Sr) and measurement with proportional counter (89+90
Sr). If there
is more time, then only liquid scintillation is used by first measuring the sample by
Cerenkov and then after adding cocktail measuring it again with liquid scintillation
counting (89
Sr, 90
Sr, 90
Y). If only 90
Sr is present in the sample, liquid scintillation
counting is used.
Analysis of Sr from glass fiber filter
1. Weigh and transfer the sample into a Ni-crucible, add about 100 g SrCl2*6H2O (note
exact mass) and mix.
Page 22 of 57
2. Add NaOH granules (6 x sample mass) and 2 tsp Na2CO3 (anhydrous) and heat with
Bunsen burner.
3. Add ~3 tsp of NaNO3 until all carbon is burned and the sample turns greenish.
4. Dissolve the fused sample with 100 mL of distilled water while heating. Centrifuge
the sample solution while hot and discard the solution. Wash the residual with 30 mL
of boiling water. Dissolve the precipitate with small amount of 8 M HNO3 and dilute
with water to 30 mL.
5. Carry out carbonate precipitation by adding 25% NH3·H2O until pH 8 - 9. Add 2 g of
NH4CO2NH2, heat, cool and centrifuge. Discard the solution. Dissolve the residual
into 30 mL of 8 HNO3
6. Carry out extraction chromatography with Sr resin as mentioned before, followed by
carbonate precipitation and 89, 90
Sr measurement.
(2) Emergency preparedness methods for Pu isotopes
1. Liquid sample is acidified, tracers are added and Pu precipitated as Fe(OH)3 by adding
Fe-carrier (50 mg) and NH3·H2O until pH is 9. Precipitation is separated through
centrifugation.
2. Solid sample is combusted with microwave using HNO3+HCl+H2O2
3. Pu is separated with anion exchange: Dowex 1x4, 50-100 mesh. Anion exchange is
carried out with faster speed (25 drops/min) than in regular Pu analysis
a. Load sample solution (40 mL of 8 M HNO3 + 2 gNaNO2)
b. Wash with 50 mL of 8 M HNO3 and with 50 mL of 37% HCl
c. Elute Pu with 30 mL of 37% HCl+3 mL of 1M NH4I
d. Evaporate and treat with acids
e. Pu is co-precipitated by dissolving the sample with few milliliters of 1 M HNO3,
adding Ce carrier (50µg), 1.5 mL of HF and letting to precipitate for 45 minutes.
The sample is filtered with 0.1 µm membrane.
4. The precipitate is counted with alpha detector (238
Pu and 239+240
Pu)
5. If 241
Pu is needed the sample is divided before co-precipitation and liquid scintillation
is used to measure 241
Pu.
2.3.4 Potential improvements
(1) Co-precipitation vs. electrodeposition in Pu method
Radiochemical separation method used traditionally in STUK for Pu and Am has included a
step where Pu/Am is deposited on a steel plate using electrodeposition prior to alpha
counting. Electrodeposition that has been traditionally used is a suitable method for source
preparation but it is sensitive to impurities that might exist in the sample and it is also more
sensitive to malfunction in equipment as well as dependent on the operator. Co-precipitation
of Pu/Am as cerium fluoride into a membrane is an alternative technique for
electrodeposition. Co-precipitation technique is known to be less sensitive for impurities and
it also works as an additional source purification step, since only trivalent and tetravalent
elements can be precipitated. Co-precipitation is also simpler to carry out and requires less
time.
To validate co-precipitation technique, samples have been analyzed in STUK using both
electrodeposition and co-precipitation. Both chemical recovery and the Full width at half

Page 23 of 57
maximum (FWHM) has been recorded. The results will be reported in the final report of this
project.
(2) Analysis of Pu from air filters in emergency conditions
The emergency preparedness method for Pu has not been tested recently for air filters in
STUK. However, the air filters are one of the most important matrices needed to be analyzed
in emergency conditions and there is need to test and improve the method for different type of
filters. Glass fiber filters are commonly used in STUK and especially the sample dissolution
technique for glass fiber filter has to be tested and improved: fusion vs. acid leach. It is also
important to determine how long time it takes to carry out the appropriate method.

Page 24 of 57
2.4 Analysis of Sr, Th, U, Pu and Am at IFE
The methods used for the analysis of Sr, Th, U, Pu and Am at IFE are developed to fit our
main purpose, which is the analysis of internal samples and of samples collected in
connection with the environmental surveillance programme. The procedures are of sequential
manner, in that the same sample can be used to analyze several radionuclides. All the
procedures are described in our quality assurance book and are tested in relevant inter-
comparison exercises. The procedures are also adapted to analyze other kind of samples.
2.4.1 Treatment of various samples
(1) Discharge water from IFE
A representative sample is acidified, tracers added and the solution is dried and ashed at 450 oC. The salts are then treated with 65% HNO3 before they are dissolved with 20-30 mL of 3
M HNO3 - 0.1 M sulphamic acid - 0.1 M ascorbic acid - 0.3 M Al(NO3)3. The solution is then
filtered through membrane filter.
(2) Water from Nitelva river
Pre-concentrated sample (by evaporation) is added 65% HNO3 and tracers and evaporated to
dryness. The salts are then treated with 65% HNO3 before they are dissolved with 20-30 mL 3
M HNO3 - 0.1 M sulphamic acid - 0.1 M ascorbic acid - 0.3 M Al(NO3)3. The solution is then
filtered through membrane filter.
(3) Water from manholes in connection with the discharge pipeline
The water sample is added 65% HNO3 and tracers and evaporated to dryness. The salts are
then treated with 65% HNO3 before they are dissolved with 20-30 mL of 3 M HNO3 - 0.1 M
sulphamic acid - 0.1 M ascorbic acid - 0.3 M Al(NO3)3. The solution is then filtered through
membrane filter.
(4) Precipitation
Pre-concentrated sample (by evaporation) is added 65% HNO3 and tracers and evaporated to
dryness. The salts are then treated with 65% HNO3 before they are dissolved with 20-30 mL
of 3 M HNO3 - 0.1 M sulphamic acid - 0.1 M ascorbic acid - 0.3 M Al(NO3)3. The solution is
then filtered through membrane filter.
(5) Urine
The sample is added 50 mL of 65% HNO3 pr. liter sample, appropriate tracers, 2 mg Sr- and
100 mg Ca-carrier. The sample is then heated at approx. 90 oC for 2 hours after the addition of
a few drops of octanol. The heat is turned off and 1-2 mL conc. phosphoric acid is added and
pH raised to 8-9 with NH3·H2O. The precipitate is allowed to settle and collected by
centrifugation. The precipitate is then ashed at 450 oC, treated with 65% HNO3 and dissolved
with 20-30 mL of 3 M HNO3 - 0.1 M sulphamic acid - 0.1 M ascorbic acid - 0.3 M Al(NO3)3.
The solution is then filtered through membrane filter.
(6) Sediment and soil samples
Page 25 of 57
An ashed sample is treated with aqua regia for several hours and then filtered through glass
fiber filter. The solution is evaporated to dryness and treated with 65% HNO3 and the salts
dissolved with 200 mL of 1 M HNO3. 20 mL solution is added U-tracer and 3 mL 65% HNO3
and used for U-analysis with UTEVA. The rest of the solution is added Pu- and Sr-tracers and
1.0 g of NH2OH·HCl and 100 mg of Ca-carrier. The solution is heated and added oxalic acid
and the pH adjusted to 5-6 by carefully adding NH3·H2O. After cooling, the solution is
filtered through paper filter and the precipitate is ashed at 600 oC. The salts are then treated
with 65% HNO3 and dissolved with 20-30 mL of 3 M HNO3 - 0.1 M sulphamic acid - 0.1 M
ascorbic acid - 0.3 M Al(NO3)3. The solution is then filtered through membrane filter.
(7) Biota
Ashed sample is added tracers and treated with aqua regia for several hours. After cooling the
solution is filtered through glass fiber filter and evaporated to dryness. The salts are then
treated with 65% HNO3 and dissolved with 20-30 mL of 3 M HNO3 - 0.1 M sulphamic acid -
0.1 M ascorbic acid - 0.3 M Al(NO3)3. The solution is then filtered through membrane filter.
2.4.2 Separation of Sr, Th, U, Pu and Am
UTEVA-TRU-Sr columns are connected together (UTEVA on top) and conditioned with 5-10
mL of 3 M HNO3. The solution from the different treatment steps of the various matrixes is
then loaded. The columns are then rinsed with 10 mL of 3 M HNO3 and disconnected.
(1) Sr-Resin
The column is rinsed with 10 mL of 8 M HNO3 followed by 5 mL of 3 M HNO3 - 0.05 oxalic
acid and 5 mL of 3 M HNO3 and Sr is eluted with 0.05 M HNO3. The solution is then set
aside for the ingrowth of 90
Y. Y is separated from Sr using oxalate and hydroxide
precipitation and finally counted using beta counter (Risø).
(2) UTEVA-Resin
The column is rinsed with 10 mL of 3 M HNO3 followed by 5 mL of 9 M HCl. Th is then
eluted with 15 mL of 4 M HCl. For samples containing high levels of Po (soil samples etc)
the column is rinsed with 50 mL of 4 M HCl - 0.05 M oxalic acid and U eluted with 15 mL of
0.01 M HCl.
(3) TRU-Resin
The column is rinsed with10 mL of 3 M HNO3 - 0.1 M NaNO2 followed by 2 mL of 9 M HCl.
Am and Cm are eluted with 10 mL of 4 M HCl and the column rinsed with 10 mL of 4 M HCl
before Pu is eluted with 10 mL of 4 M HCl added 200 µL of 15% TiCl3.
Source preparation of the actinides is done by micro co-precipitation of fluorides and
collection on membrane filters. Activity determination is done by alpha spectrometry.
2.4.3 Discussion and perceptiveness
IFE is mostly very satisfied with the current procedures, and inter-comparison exercises show
that the methods give correct answers. Since IFE does not use HF for the digestion of

Page 26 of 57
sediment samples in the surveillance work, inter-comparison exercises have shown that the
results for U are lower than the true value when HF is not used. The procedures are modified
when analyzing other matrixes, but in overall the pattern remains the same. When analyzing
samples that may contain high levels of Ca, larger Sr-columns are used. If needed, HF
digestion of samples is also used. In samples that contain large amounts of lanthanides, Am is
normally purified by using TEVA column.

Page 27 of 57
3. Method improvement by applying rapid analytical techniques
Experiments were performed in each institute to improve analytical efficiency during 2014: 1)
DTU Nutech (Denmark) has improved the current Pu-Np seawater analytical procedure by
using NaOH treatment to enhance the decontamination factor of U. A vacuum box system has
been built up and will be used for the inter-comparison exercises in 2015. Analytical
procedure for Sr in seawater has been updated based on an internal evaluation and amendment,
further experimental tests to replace the use of (NH4)2CO3 and fuming nitric acid are on-going.
A CaC2O4 co-precipitation method has been developed to improve method applicability for
different matrix content in Pu determination and experiments for processing real-samples is in
progress.
2) STUK (Finland) has tested the performance of co-precipitation v.s. electro-deposition for
Pu/Am source preparation. It was found that both electro-deposition and co-precipitation are
well suited for Pu and Am as source preparing. Comparatively, co-precipitation is simple,
rapid and less sensitive to operator. STUK (Finland) has also developed a rapid method for Pu
air filters analysis in emergency conditions. Two different dissolution techniques (fusion with
NaOH/Na2CO3 and acid leach with HF, HNO3, HCl) have been tested followed by anion
exchange and co-precipitation for source preparation. Acid leach with HF was found to be
more suitable than fusion because multiple samples could be analyzed at the same time
3) FOI (Sweden) has improved the stability and chemical yields of Pu in their current Pu
analytical method for soil and sediment. In their previous experiments, Pu was identified in
the U- and Am-fractions and a low recovery of Pu was noticed. After series improvement in
the valence adjustment step for Pu, it was observed that with careful control of the
temperature, the valence of Pu(IV) can be well stabilized and no loss of Pu was found in the
other fractions (U and Am). To further improve the chemical yield of Pu, column separation
was optimized and it was found that, with increase the volume of elution solution from 5 mL
to 10 mL, Pu chemical yield can be improved from 40-50% to 90-100%.
4) IFE (Norway) has partly tested the application of Sr resin in 210
Pb analysis for water
samples. MnO2 co-precipitation has been investigated for Ac, Th and Ra determination in
Urine, the results were not satisfactory and further improvement is on-going. IFE also is
improving 90
Sr seawater method to reduce the amount of fuming nitric acid by applying the
current analytical method used in DTU Nutech.
3.1 Methodology improvement in Sr and Pu environmental analysis in DTU Nutech
3.2.1 Improvement for the determination of 90
Sr in Seawater and lake water
On the currently used procedures, methodology improvement was carried out in DTU Nutech
during 2014 to enhance the chemical yield for determination of 90
Sr in seawater and lake
water samples based. Results presented here cover the selection of optimal pH value in the
steps of carbonate precipitation by theoretical calculation and the experimental investigation
of the effect of elevated temperature on the Ca decontamination.
Materials and methods
A 85
Sr standard solution purchased from Isotope Products Laboratories (3017 N San Fernando
Blvd, Burbank, CA 91504) and diluted to 2100 Bq/mL in 1 M HCl were used as a chemical

Page 28 of 57
yield for Sr. All reagents used in the experiment were of analytical reagent grade and prepared
using ultra-pure water (18 MΩ·cm). Seawater samples were collected around Danish and
Greenland coast during 2011-2014 and lake water samples were collected at different location
in Denmark
The analytical processes applied in this work for 90
Sr seawater or lake water analysis basically
follow the steps described in Figure. 2. The effect of different experimental operation and
conditions on the chemical yield of Sr and the efficiency of Ca decontamination were
investigated herein and the details are summarized below.
Results and Discussion
(1) Theoretical calculation during carbonate precipitation for Sr pre-concentration
For pre-concentration, carbonate is used to scavenge most Sr into the residue as strontium
carbonate. The chemical reaction between Sr and carbonate during the pre-concentration
process is:
SrCO3 ↔ Sr2+
+ CO32-
(a)
For which the solubility product, Ksp is:
Ksp = [ Sr2+
] [CO32-
] [1]
Assuming the solubility of strontium carbonate is S, its unit is M. All weak acids, denoted
H2CO3, react with water by donating a proton to H2O. Dissociation of weak acid:
H2CO3 + H2O↔ HCO3– + H3O
+ (b)
Wherein, the acid dissociation constant is Ka1.
HCO3– + H2O↔ CO3
2-+ H3O
+ (c)
Wherein, the acid dissociation constant is Ka2.
When the (a), (b), (c) reactions are in equilibrium,
[Sr2+
]= S [2]
[CO32-
]=C·δ [3]
In which, C is concentration of added CO32-
, usually add 1L of 1M (NH4)2CO3 into 45L
seawater, so C=0.044 M; δ is the distribution coefficient of CO32-
.
δ= Ka1Ka2/([H+]+Ka1[H
+]+ Ka1Ka2) [4]
Put [2], [3], [4] into [1], thus
S·C·Ka1Ka2/([H+]+Ka1[H
+]+ Ka1Ka2)=Ksp [5]
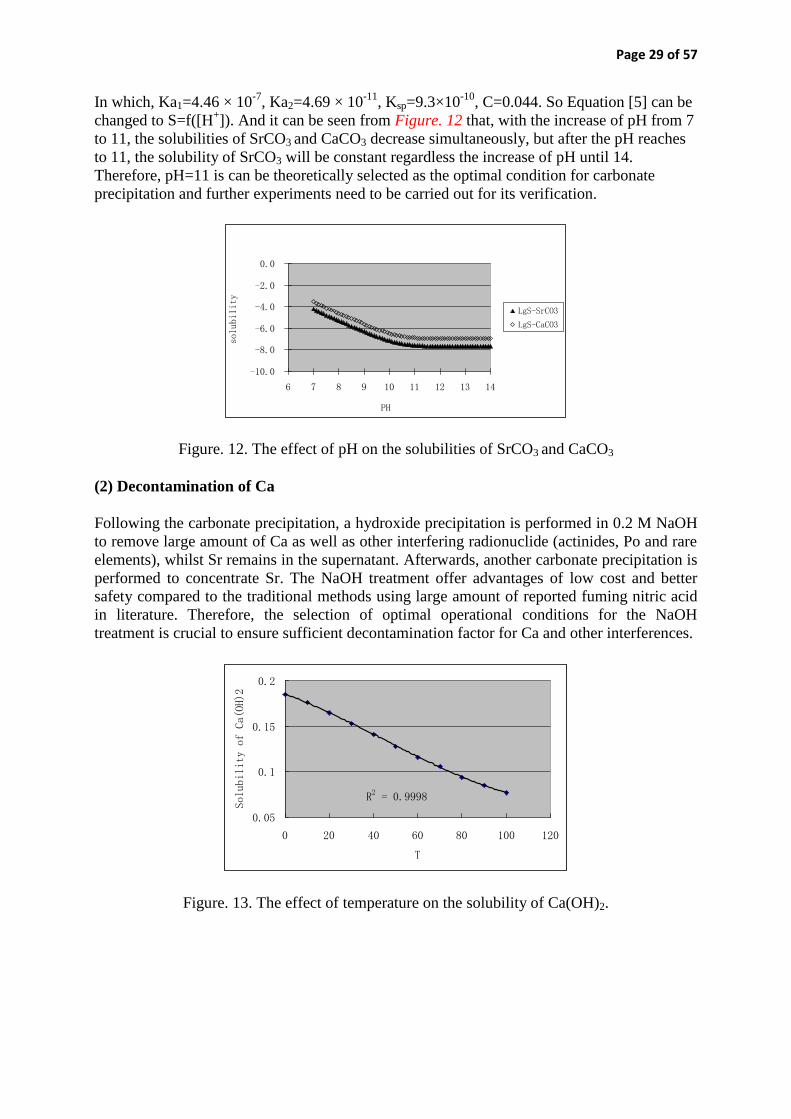
Page 29 of 57
In which, Ka1=4.46 × 10⁻⁷
, Ka2=4.69 × 10⁻¹¹
, Ksp=9.3×10⁻¹⁰
, C=0.044. So Equation [5] can be
changed to S=f([H+]). And it can be seen from Figure. 12 that, with the increase of pH from 7
to 11, the solubilities of SrCO3 and CaCO3 decrease simultaneously, but after the pH reaches
to 11, the solubility of SrCO3 will be constant regardless the increase of pH until 14.
Therefore, pH=11 is can be theoretically selected as the optimal condition for carbonate
precipitation and further experiments need to be carried out for its verification.
Figure. 12. The effect of pH on the solubilities of SrCO3 and CaCO3
(2) Decontamination of Ca
Following the carbonate precipitation, a hydroxide precipitation is performed in 0.2 M NaOH
to remove large amount of Ca as well as other interfering radionuclide (actinides, Po and rare
elements), whilst Sr remains in the supernatant. Afterwards, another carbonate precipitation is
performed to concentrate Sr. The NaOH treatment offer advantages of low cost and better
safety compared to the traditional methods using large amount of reported fuming nitric acid
in literature. Therefore, the selection of optimal operational conditions for the NaOH
treatment is crucial to ensure sufficient decontamination factor for Ca and other interferences.
Figure. 13. The effect of temperature on the solubility of Ca(OH)2.
-10.0
-8.0
-6.0
-4.0
-2.0
0.0
6 7 8 9 10 11 12 13 14
PH
solubility
LgS-SrCO3
LgS-CaCO3
R2 = 0.9998
0.05
0.1
0.15
0.2
0 20 40 60 80 100 120
T
Solubility of Ca(OH)2

Page 30 of 57
Figure. 14. The effect of [OH-] on the equilibrium concentration of Ca
2+ ([Ca
2+]) in an
aqueous solution saturated with solid Ca(OH)2, at 25.00 ± 0.02℃
Theoretically, the solubility of Ca(OH)2 smoothly decreases with the increase of the
temperature (Figure. 13). While under a constant temperature, the equilibrium concentration
of Ca2+
([Ca2+
]) decreases dramatically with the increase of [OH-] wit in 0 - 2.5 M in an
aqueous solution saturated with solid Ca(OH)2 (see Figure. 14). In series experiment, it was
observed that relatively higher temperature and higher concentration of [OH-] are favor for the
decontamination of Ca. When the NaOH treatment was performed up 50℃, the Ca is better
removed compared to the ones operated under room temperature. This is confirmed by the
significant less amount of carbonate co-precipitate formed in the following step after the
NaOH treatment as a consequence of less concomitant formation of CaCO3 (see Figure. 15).
Figure. 15. Effect of temperature on the removal of Ca (Ca(OH)2 treatment process in 50℃
water bath (left 1) and following SrCO3 precipitation (left 2) vs. Ca(OH)2 treatment process
under room temperature (left 3) and the flowing SrCO3 precipitation (left 4)).
In the experiment, it was also observed that a floating layer was formed if the sample solution
was exposed in air for a relatively longer time (e.g., overnight) in the step of NaOH treatment
(see Figure. 16). After separating the layer from solution and checking the activity with
gamma counter, it was found that 10-20% of Sr was lost in this portion. But by covering the
sample with a Parafilm®, no white floating lay was observed. This phenomenon could
possibly be a consequence of the reaction of Sr2+
with CO2 in the air which forming saturated
SrCO3 as a floating layer.
0
0.5
1
1.5
2
0 2.5 5 7.5 10 12.5 15
[OH-] M
[Ca2+] mM

Page 31 of 57
Figure. 16. Effect of air exposure (left: exposed in the air overnight, and right: without air
exposure)
With the use of improved NaOH treatment process (namely, relatively high temperature
(50 °C) and avoid air exposure), the overall Sr chemical yields increased from ~ 70% to ~ 90
(see Table. 1), indicating temperature and air exposure are important parameters affecting the
analytical performance for Sr determination.
Table. 1. The chemical yield of Sr for the entire analytical procedure
Before method improvement After method improvement
Sample ID
Chemical yield
(%)
Sample ID
Chemical yield
(%)
2011-0486
2012-2052
2012-2053
2012-2055
2013-0463
2013-0537
2013-0538
2013-2052
2013-2053
2013-2054
2014-0484
Average
67.30
74.93
74.29
82.53
36.90
52.65
60.87
81.40
87.39
76.26
54.32
68.08
2014-2051
2014-2052
2014-2053
Average
91.91
89.58
88.24
89.91
Conclusions
Based on the theoretical calculation, pH=11 is can be regarded as a starting point for the
further experimental test to select the optimal carbonate precipitation condition for the pre-
concentration of Sr. Applying relatively high temperature (50 °C) and avoid the exposure of
air during the NaOH treatment, the chemical yields of Sr were improved from ~ 70% to ~90%.
3.2.2 Improvement in method applicability for Pu soil/sediment analysis
In DTU Nutech, rapid Pu analytical methods based on sequential injection extraction
chromatography (TEVA) and ICP-MS detection has been developed and applied in different
radioecology studies. Even though the previous method is simple and rapid due to the
automated chromatographic operation, we experiences difficulties and challenges in
application of these methods to certain type of environmental samples containing high
Page 32 of 57
proportion of transit metal elements such as Fe, Mn, Ni. For these samples, whenever
Fe(OH)3 co-precipitation is employed for the pre-concentration, a large amount of transit
metal (Fe, Mn, Ni) is always present in the Pu fraction and make the sample volume before
chromatographic separation very large (e.g., typically 50-100 mL for 10 g soil or sediment)
and complicated (see Figure. 17 (left)). As a consequence, the performance of column
separation is normally deteriorated resulting in low and variable chemical yields for Pu, since
TEVA is sensitive to matrix content in the sample solution. In the worst case, a column
breakthrough is encountered when a relatively small column (e.g., 2-mL TEVA) is used,
therefore Pu is totally lost during the column separation. We have improved the method by
using a large anion exchange column (10-20 mL) as a guard to avoid the breakthrough of the
TEVA column. But in this case, the two times column separation is needed, which make the
analytical procedure tedious and lab intensive.
To overcome the high susceptibility of TEVA to matrix content, development of an
alternative co-precipitation technique using CaC2O4 could be possible to eliminate the
scavenge of most metal elements contained in the samples (Fe, Mn, Ni, Co), since the co-
precipitation is normally operated in low pH (1-2). As a consequence, one TEVA column
separation might be sufficient for the further purification of Pu. Thus the analytical time will
be reduced comparing to the one using an extra anion exchange column.
Besides, our previous method used for Pu solid analysis is not suitable for sample containing
refractory Pu oxides, since acid leaching is not able to extract Pu from refractory oxides. In
this case, alkaline fusion is needed for the pre-treatment of samples and boric fusion have
been tested in DTU Nutech in 2014. In this report, preliminary results on the method
improvement for Pu soil/sediment analysis are presented.
Materials and methods
(1) Standards, reagents and samples
A 242
Pu standard solution (0.1037 Bq/g in 2 mol/L HNO3) diluted from NBL-CRM 130 (New
Brunswick Laboratory, Argonne, IL) was used as a chemical yield tracer for both plutonium
and neptunium. Standard solutions of uranium (1.000 g/L in 2 mol/L HNO3) were purchased
from NIST (Gaithersburg, MD). All reagents used in the experiment were of analytical
reagent grade and prepared using ultra-pure water (18 MΩ·cm). 2-mL Econo-Columns (0.5
cm i. d. × 10 cm length, BioRad Laboriatories Inc., Hercules, CA) was utilized for
chromatographic separation. TEVA (100-150 µm particle size) extraction chromatographic
resin was purchased from TRISKEM International (Bruz, France).
For the method development, two soil samples collected at Poyang Lake (S4 (102.92 ºE,
25.03 ºN) and L9 (102.92 ºE, 25.02 ºN)) in China during 2013 were used throughout the
work.
(2) Alkaline fusion vs. acid dissolution
An alkaline fusion procedure was investigated in order to extend the Pu method applicability
to soil or sediment which contains refractory Pu oxides. Lithium metaborate was used as a
fusion flux and mixed with the soil sample in a ratio of 5: 2 (weight) in a graphite crucible.
The graphite crucible was placed in an oven for about two hours at 650°C for pre-oxidization
and thereafter the sample was heated for 20 minutes at 1200°C.

Page 33 of 57
The crucible was allowed to cool to room temperature and thereafter the melt was transferred
to a beaker and dissolved with 1.4 M HNO3. In order to prevent precipitation of silicic acids
during the following separation procedure, 2 mM PEG2000 was added to flocculate the
dissolved Si. The precipitate was removed by filtering.
To compare the efficiency of alkaline fusion pre-treatment, a total dissolution of the sample
soil sample was also performed with consecutive attack with 65% HNO3 + 40% HF + 60%
HClO4 on a hotplate (200-250 °C). Sample solutions obtained from both pre-treatment were
diluted to suitable times by 0.5 M HNO3 and delivered for ICP-OES measurement for the
matrix elements.
(3) CaC2O-4 co-precipitation
To develop the CaC2O4 co-precipitation, 10 g of dried soil sample was used and after ashing
the sample at 450 ºC overnight, 5-10 mBq 242
Pu was spiked as a chemical yield tracer. The
sample was then digested with Aqua regia on a hotplate at 150°C for 30 min and then 200 °C
for 2 h. The beaker was covered with a glass-watch to prevent significant evaporation of the
acid solution. After cooling, water was added and the sample was filtered through a GF/A
filter (glass microfiber filters, 125 mm ø, Whatman International Ltd, Maidstone, England)
and the filtrate was directly collected into a centrifuge tube. The beaker and the filter were
gently washed with 30 mL of 0.2 mol/L HCl.
To select the optimal condition of CaC2O4 co-precipitation, the effect of pH, amount of Ca
and oxalate added were investigated. Therefore, 1-3 g of CaCl2·2H2O (see details Table 1)
was added to the filtrate and the sample pH was adjusted to 1- 4 (see details in Table 2) with
conc. NH3·H2O. Weigh 3-66 g H2C2O4·2H2O to a beaker and dissolve with HCl solution with
corresponding pH (1-4) which is the same as the sample solution. Add the dissolved oxalate
acid solution to the sample, and then decant the supernatant after centrifugation (3000 rpm for
10 minutes). For the decomposition of CaC2O4, the precipitate was ashed in a muffle oven at
450 ºC overnight after dried at 100ºC. The residue was dissolved with 5-10 mL of conc. HCl
and then diluted to ca. 40 mL with water. 10 mg of Fe3+
was added to the solution and
NH3·H2O was slowly added to concentrate Pu in Fe(OH)3 precipitate. After centrifugation,
the precipitate was dissolved with 1 mL of conc. HNO3 and then a 100-µL aliquot was taken
and diluted for 10-100 times with 0.5 M HNO3 for Pu quantification with ICP-MS.
(4) Automated FI chromatographic separation scheme
A multi-sample processing flow injection (FI) system was used for the chromatographic
purification of Pu, wherein for four samples can be handled simultaneously. As indicated in
Figure. 4, the FI system consists of a four-channel peristaltic pump (Watson-Marlow Inc.
Wilmington, MA), a 10-port multi-position selection valve (MSV, Valco Instruments,
Houston, TX) and 8 solenoid valves (SV1-8). All outlets of MSV were connected through
PEEK ferrules and fittings with rigid PTFE tubing of 2.4 mm i.d./3.2 mm o.d., while all
outlets SV1-8 were connected with PTFE tubing of smaller diameter (0.8 mm i.d./1.6 mm
o.d). Four Econo-Columns (Bio-Rad Laboratories Inc., Hercules, CA) packed with TEVA,
UTEVA or AGMP-1M resin were integrated in the flow system through PEEK ferrules and
fittings, whereupon the chemical purification of analytes were controlled automatically via the
aid of the user-friendly FIAlab software (FIAlab Instruments, Bellevue, WA).

Page 34 of 57
The extraction chromatographic procedure was performed according to the following five
steps: I. precondition the TEVA with 20 mL 3 mol/L HNO3 at a flow rate of 2.0 mL/min; II.
Load sample solution (ca. 15-25 mL) onto the TEVA column at 1.0 mL/min; III. Rinse the
TEVA column with 60 mL of 1 mol/L HNO3 to remove most matrix elements and U at 1.0
mL/min IV. Rinse the TEVA column with 40 mL of 6 mol/L HCl to remove thorium at 2.0
mL/min; V. Elute Pu 20 mL of 0.5 mol/L HCl at 1.0 mL/min.
Each eluate was evaporated to dryness on a hot-plate to eliminate hydrochloric acid. The
residue was reconstituted in 5 mL of 0.5 mol/L HNO3 for ICP-MS measurement.
(5) Detection with ICP-MS and ICP-OES
ICP-MS measurement
The detection of 238
U, 239
Pu, 240
Pu and 242
Pu was performed with ICP-MS instrument (X
SeriesII, Thermo Fisher Scientific, Waltham, MA) equipped with an Xt-skimmer cone and an
ultrasonic nebulizer (U5000AT+, CETAC, USA ) under hot plasma conditions.
238U
concentrations in different fractions were determined after appropriate dilution with 0.5 mol/L
HNO3. 115
In (as InCl3) was exploited as an internal standard and prepared to a concentration
of 1 µg/L in each sample. A 0.5 mol/L HNO3 solution was used as washing solution among
consecutive assays. Prior to each measurement, the ICP-MS instrument was tuned to
maximum transmission of target analytes. Typical sensitivities of U and Pu ranged from
1×10⁶ to 5 ×10
6 cps per µg/L.
ICP-OES measurement
ICP-OES measurement performed on a Varian VISA AX CCD simultaneous spectrometer
(Palo Alto, CA) was used for the determination of concentrations of the matrix elements in
the samples after total dissolution or alkaline fusion. An aliquot of 0.5 mL was taken from
each sample solution and diluted to certain times (depending on the detection limit of ICP-
OES for certain elements) with 0.5 mol/L HNO3. The samples were measured using axial
mode to assure that the instrument would be able to measure to the highest sensitivity for the
elements of interest. All samples were blank-corrected.
Results and Discussion
Alkaline fusion vs. acid dissolution
Table. 2. Results of matrix elements concentration in soil S4 by ICP-OES measurement
Experimental
condition
Sample
size, g Operational
time, h
Concentration of element, mg/g
Al Ba Ca Cu Fe Mg Mn Ni
Acid
dissolution 2 48 67.559 0.262 5.062 0.192 99.426 7.077 1.048 0.053
Alkaline
fusion 2 3 84.102 0.273 5.572 0.154 103.337 9.414 1.067 0.000
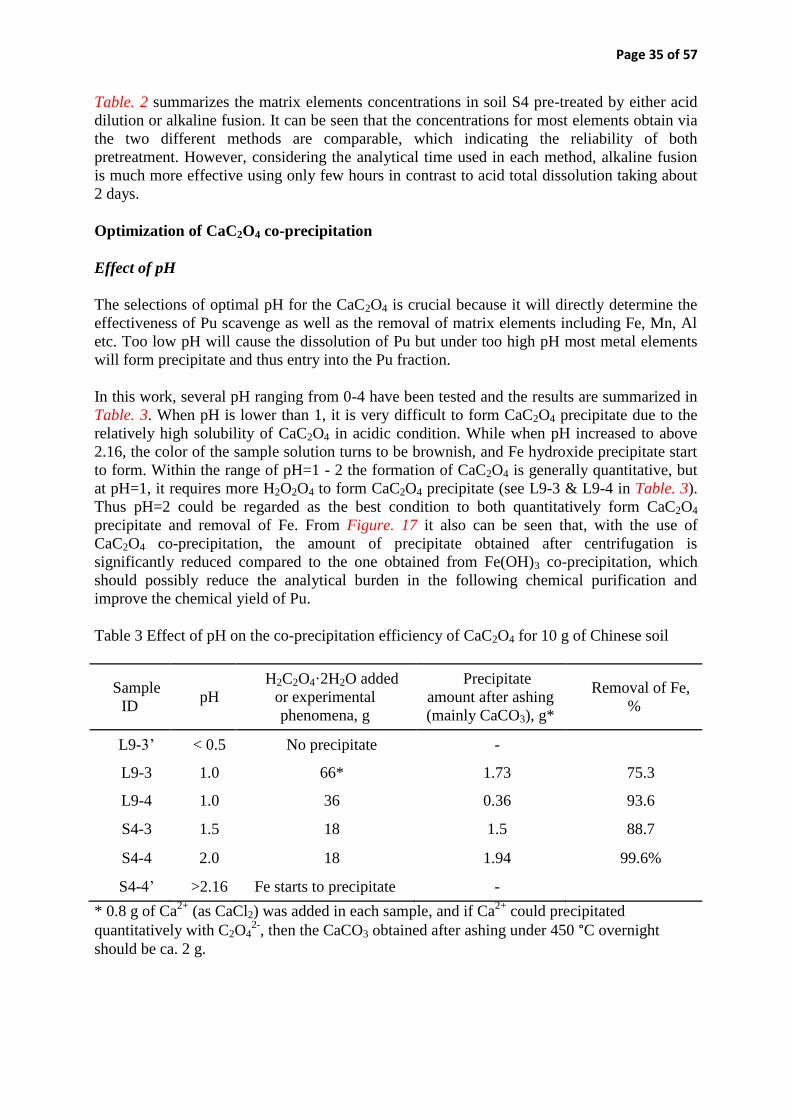
Page 35 of 57
Table. 2 summarizes the matrix elements concentrations in soil S4 pre-treated by either acid
dilution or alkaline fusion. It can be seen that the concentrations for most elements obtain via
the two different methods are comparable, which indicating the reliability of both
pretreatment. However, considering the analytical time used in each method, alkaline fusion
is much more effective using only few hours in contrast to acid total dissolution taking about
2 days.
Optimization of CaC2O4 co-precipitation
Effect of pH
The selections of optimal pH for the CaC2O4 is crucial because it will directly determine the
effectiveness of Pu scavenge as well as the removal of matrix elements including Fe, Mn, Al
etc. Too low pH will cause the dissolution of Pu but under too high pH most metal elements
will form precipitate and thus entry into the Pu fraction.
In this work, several pH ranging from 0-4 have been tested and the results are summarized in
Table. 3. When pH is lower than 1, it is very difficult to form CaC2O4 precipitate due to the
relatively high solubility of CaC2O4 in acidic condition. While when pH increased to above
2.16, the color of the sample solution turns to be brownish, and Fe hydroxide precipitate start
to form. Within the range of pH=1 - 2 the formation of CaC2O4 is generally quantitative, but
at pH=1, it requires more H2O2O4 to form CaC2O4 precipitate (see L9-3 & L9-4 in Table. 3).
Thus pH=2 could be regarded as the best condition to both quantitatively form CaC2O4
precipitate and removal of Fe. From Figure. 17 it also can be seen that, with the use of
CaC2O4 co-precipitation, the amount of precipitate obtained after centrifugation is
significantly reduced compared to the one obtained from Fe(OH)3 co-precipitation, which
should possibly reduce the analytical burden in the following chemical purification and
improve the chemical yield of Pu.
Table 3 Effect of pH on the co-precipitation efficiency of CaC2O4 for 10 g of Chinese soil
Sample
ID pH
H2C2O4·2H2O added
or experimental
phenomena, g
Precipitate
amount after ashing
(mainly CaCO3), g*
Removal of Fe,
%
L9-3’ < 0.5 No precipitate -
L9-3 1.0 66* 1.73 75.3
L9-4 1.0 36 0.36 93.6
S4-3 1.5 18 1.5 88.7
S4-4 2.0 18 1.94 99.6%
S4-4’ >2.16 Fe starts to precipitate -
* 0.8 g of Ca2+
(as CaCl2) was added in each sample, and if Ca2+
could precipitated
quantitatively with C2O42-
, then the CaCO3 obtained after ashing under 450 °C overnight
should be ca. 2 g.

Page 36 of 57
Figure. 17. Fe(OH)3 precipitate (left) vs. CaC2O4 precipitate (right) obtained after pre-
concentration of 10 g Chinese soil
Effect of calcium and oxalic acid amount
In general, soil samples contain certain level of Ca. but due to the different type of samples,
the content of Ca may vary from sample to samples. Extra addition of Ca maybe necessary to
ensure the quantities absorption of Pu, the formation of CaC2O4 should be sufficient. On the
hand, excessive amount of Ca may cause problems for the further chemical purification and
deteriorate the column separation performance. Except to form CaC2O4 precipitation with
Ca2+
, the oxalic acid added into the sample could complex with Al, Fe, Mn, Ni and other
metal elements under relatively lower pH, as a consequence of the readily complexion
properties of C2O42-
with metal cations. Thus, the addition of oxalic acid should consider both
the content of Ca2+
and the existence of other comlexing metal elements. Moreover, too much
sulphurs addition of oxalic acid could possibly also form complexes with Pu ions, thus the
chemical yields of Pu will be deteriorated. Therefore, selection of appropriate addition of
oxalic acid is also very crucial to ensure the quantities scavenge of Pu.
It can be seen from Table. 4 that, the precipitate obtained after ashing the CaC2O4 increases
with the addition of Ca2+
, when the CaCl2·2H2O addition is less than 1 g, the dissolution of
CaC2O4 is relatively significant (> 30%) due to the low [Ca2+
] and [C2O42-
], e.g., for OX-10 in
Table 4, dissolution of CaC2O4 = (0.68-0.47)/0.68*100% = 30.9%. Therefore, the preliminary
results could possibly suggest that minimum existence of 2 g of Ca should be needed in the
sample solution. In the case for samples contain low level of Ca, external Ca addition is
necessary to form quantitative precipitation of CaC2O4.
Table 4. Effect of Ca amount on the co-precipitation efficiency of CaC2O4
Sample
ID
CaCl2·2H2O
added, g
H2C2O4·2H2O added, g Amount of precipitate after
ashing (mainly CaCO3), g*
OX-9 0.5 0.5 0.15 (0.34)
OX-10 1 1 0.47 (0.68)
OX-11 2 2 1.22 (1.35)
OX-12 5 5 3.33 (3.38)
*The values in the brackets are the expected CaCO3 amount after quantitative co-precipitation
with C2O42-
and ashing under 450 °C.

Page 37 of 57
The results in Table. 5 confirm the complexation of with Fe3+
and when extra addition of
C2O42-
is three times of Fe3+
, CaC2O4 precipitation could be formed relatively quantitatively.
Therefore, it was presumably regarded that the complex ratio is around Fe3+
: C2O42-
(mole
ratio) = 1: 3. Therefore, the optimal addition of oxalic acid should be related to the content of
complexion elements, mainly Al, Fe, Mn, Ni, Mg, in which case a matrix screening by ICP-
OES for each soil/sediment sample may be favourable before the chemical analysis of Pu.
Table 5. Effect of Fe on the CaC2O4 co-precipitation efficiency
Sample ID Fe
3+,
g
CaCl2·2H2O
added, g H2C2O4·2H2O
added, g
Amount of precipitate after ashing
(mainly CaCO3), g*
OX-5 0.2 3.0 3.0 0.61
OX-6 1 3.0 9.8 1.48
0X-7 5 3.0 42.4 1.66
OX-8 10 3.0 70.5 0.95
* 0.8 g of Ca2+
(as CaCl2) was added and the CaC2O4 co-precipitation was carried at pH=1.5
in each sample
Conclusions
An alkaline fusion method was developed for sample pre-treatment in DTU Nutech, which
showed high effectiveness (taking few hours) compared to the ones using acid total
dissolution taking about 2 days. This method can be used for future matrix elements
determination by ICP-OES as well as the determination of Pu and other actinides in samples
containing refractory oxides, thus exploring the applicability of our current analytical method
for Pu and other actinides.
A CaC2O4 co-precipitation was tested preliminarily for the pre-concentration of Pu in
soil/sediment samples. The results indicate the selection of optimal of pH, addition of Ca and
oxalic acid during the co-precipitation process are important parameters affecting the
analytical performance. Experiment will be done in the near future for further optimization
the performance in combining the chemical yields of Pu and decontamination of U.
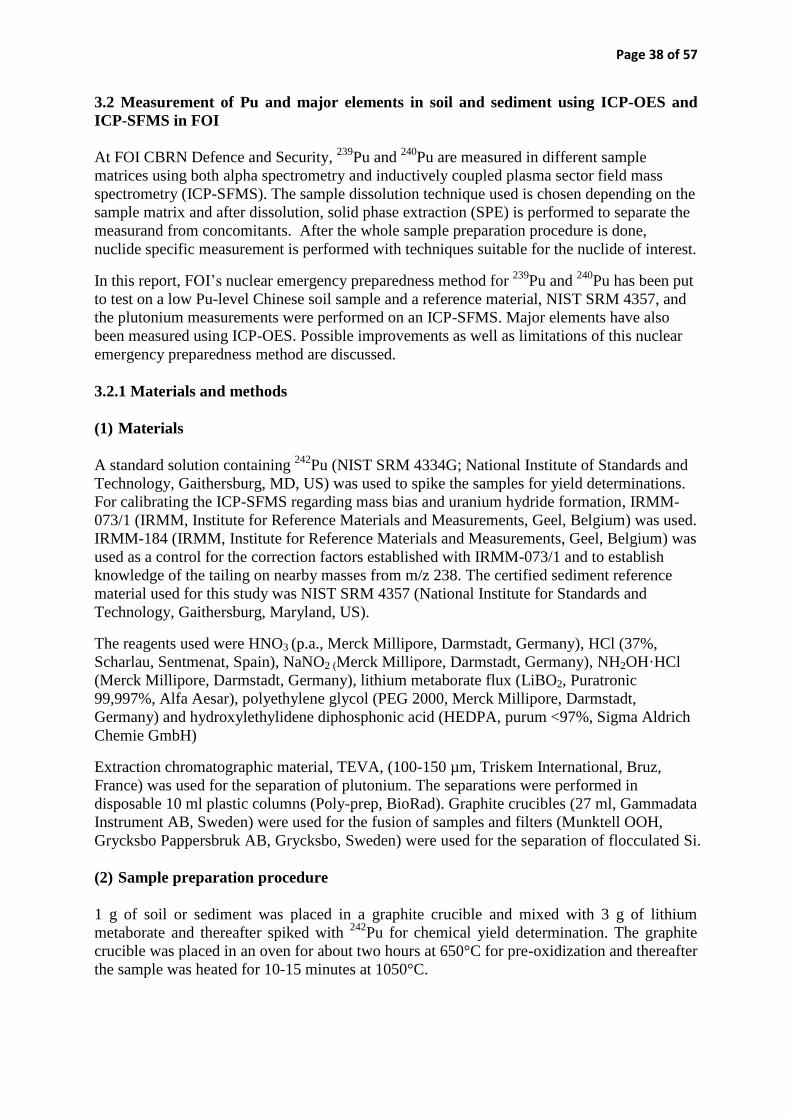
Page 38 of 57
3.2 Measurement of Pu and major elements in soil and sediment using ICP-OES and
ICP-SFMS in FOI
At FOI CBRN Defence and Security, 239
Pu and 240
Pu are measured in different sample
matrices using both alpha spectrometry and inductively coupled plasma sector field mass
spectrometry (ICP-SFMS). The sample dissolution technique used is chosen depending on the
sample matrix and after dissolution, solid phase extraction (SPE) is performed to separate the
measurand from concomitants. After the whole sample preparation procedure is done,
nuclide specific measurement is performed with techniques suitable for the nuclide of interest.
In this report, FOI’s nuclear emergency preparedness method for 239
Pu and 240
Pu has been put
to test on a low Pu-level Chinese soil sample and a reference material, NIST SRM 4357, and
the plutonium measurements were performed on an ICP-SFMS. Major elements have also
been measured using ICP-OES. Possible improvements as well as limitations of this nuclear
emergency preparedness method are discussed.
3.2.1 Materials and methods
(1) Materials
A standard solution containing 242
Pu (NIST SRM 4334G; National Institute of Standards and
Technology, Gaithersburg, MD, US) was used to spike the samples for yield determinations.
For calibrating the ICP-SFMS regarding mass bias and uranium hydride formation, IRMM-
073/1 (IRMM, Institute for Reference Materials and Measurements, Geel, Belgium) was used.
IRMM-184 (IRMM, Institute for Reference Materials and Measurements, Geel, Belgium) was
used as a control for the correction factors established with IRMM-073/1 and to establish
knowledge of the tailing on nearby masses from m/z 238. The certified sediment reference
material used for this study was NIST SRM 4357 (National Institute for Standards and
Technology, Gaithersburg, Maryland, US).
The reagents used were HNO3 (p.a., Merck Millipore, Darmstadt, Germany), HCl (37%,
Scharlau, Sentmenat, Spain), NaNO2 (Merck Millipore, Darmstadt, Germany), NH2OH·HCl
(Merck Millipore, Darmstadt, Germany), lithium metaborate flux (LiBO2, Puratronic
99,997%, Alfa Aesar), polyethylene glycol (PEG 2000, Merck Millipore, Darmstadt,
Germany) and hydroxylethylidene diphosphonic acid (HEDPA, purum <97%, Sigma Aldrich
Chemie GmbH)
Extraction chromatographic material, TEVA, (100-150 µm, Triskem International, Bruz,
France) was used for the separation of plutonium. The separations were performed in
disposable 10 ml plastic columns (Poly-prep, BioRad). Graphite crucibles (27 ml, Gammadata
Instrument AB, Sweden) were used for the fusion of samples and filters (Munktell OOH,
Grycksbo Pappersbruk AB, Grycksbo, Sweden) were used for the separation of flocculated Si.
(2) Sample preparation procedure
1 g of soil or sediment was placed in a graphite crucible and mixed with 3 g of lithium
metaborate and thereafter spiked with 242
Pu for chemical yield determination. The graphite
crucible was placed in an oven for about two hours at 650°C for pre-oxidization and thereafter
the sample was heated for 10-15 minutes at 1050°C.

Page 39 of 57
The crucible was allowed to cool to room temperature and the melt (which formed a glass
bead which was easily picked up with tweezers from the crucible) was thereafter transferred
to a beaker and dissolved with 1.4 M HNO3. In order to prevent precipitation of silicic acids
during the following separation procedure, 2 mM PEG2000 was added to flocculate the
dissolved Si. The precipitate was removed by filtering and the resulting filtrate, after
evaporation to half the volume, was suitable for the following solid phase extraction
procedure, see Figure. 18.
1. Sample: 3 M HNO3, NH2OH·HCl: 15 mg/ml, NaNO2: 18 mg/ml
TEVA
2
ml
2. Wash: 10 ml 9 M HCl, 20 ml 3 M HNO3
3. Pu-elution: 5 ml 0.01% HEDPA
Discard
Pu
Figure. 18. Schematic outline of the SPE procedure
Before the separation using solid-phase extraction of plutonium from concomitant elements,
a redox procedure was used to adjust Pu to Pu(IV) while keeping Am as trivalent. First, Pu is
reduced to the trivalent state by adding NH2OH·HCl (375 mg ml-1
) and heating at 90°C for 5
minutes. After cooling to approximately 40°C, NaNO2 (450 mg ml-1
) is added to oxidise
Pu(III) to Pu(IV). The TEVA-containing column was conditioned with 3 M HNO3 and
thereafter the sample was loaded. Under these conditions, Pu(IV) is retained on the TEVA
resin and U and Am will pass through the column. The TEVA column was thereafter rinsed
with 9 M HCl to remove thorium, followed by 3 M HNO3 to remove uranium. Plutonium
was then eluted using 0.01% HEDPA and the sample was ready for measurement on ICP-MS.
3.2.2 Instrumentation
(1) ICP-OES
An iCap7400 ICP-OES Duo (Thermo Scientific, Bremen, Germany) was used for the
determination of concentrations of the major elements in the samples before TEVA separation
described above. In order to measure the elemental concentration 0.5 mL of each sample was
taken out for analysis using ICP-OES. The samples were then spiked with 0.2 mL of indium
(9925 µg/mL) as internal standard, 0.2 mL concentrated HNO3 and MQ was added so that the
samples were diluted to a volume of 10 mL 2% HNO3. The samples were measured using
axial mode to assure that the instrument would be able to measure to the highest sensitivity
for the elements of interest. All samples were blank-corrected.

Page 40 of 57
Table. 6 Operating parameters and data acquisition parameters for the Element XR
Isotope Sample time Samples/peak Mass window Detection mode
232Th 0.003 100 5 both
233U 0.010 100 5 both
234U 0.010 100 5 both
235U 0.010 100 5 both
236U 0.010 100 5 both
237Np 0.010 100 5 both
238U 0.003 100 5 both
239Pu 0.010 100 5 both
240Pu 0.010 100 5 both
241Pu 0.010 100 5 both
242Pu 0.010 100 5 both
243Am 0.010 100 5 both
244Pu 0.010 100 5 both
Total time
Resolution, m/Δm
Runs/passes
Scan type
Magnet mass
Dead time correction
00:04:57
300
20·25
E-scan
232.038 u
Active, τ = 33 ns
(2) ICP-SFMS
An Element XR double focusing sector field ICP-MS (Thermo Scientific, Bremen, Germany)
equipped with a Jet interface was used for the determination of plutonium in soil and
sediment. The instrument was equipped with a Micromist nebuliser (GE) and a Cyclonic
spray chamber (GE, dead volume 20 mL). The measurements were performed in self-
aspiration mode, resulting in a sample flow rate of approximately 0.1 mL/ min. Operating
parameters and measurement acquisition parameters can be seen in Table. 6.
The concentrations of the measurands are evaluated relative to the signal of the spike nuclide,
i.e. 242
Pu. The intensities are corrected for blank levels and the ratio of analyte to spike is
corrected for mass bias, using the exponential relationship, and also hydride formation where
necessary.
3.2.2 Results and discussion
(1) ICP-OES
The results from the ICP-OES measurement show that the predominant elements in the soil
sample are aluminium (Al), iron (Fe), magnesium (Mg), nickel (Ni) and uranium (U). One
replicate each for the sample and the reference material is presented in Table. 7 but during this
work three replicates for the Chinese soil sample and two for the reference material were
measured and all showed agreeable results for each major element.

Page 41 of 57
Table. 7 Measured concentrations of major elements (µg/mL) in the Chinese soil-191 sample
and in the sediment reference material NIST SRM 4357.
Al Ba Ca Cr Cu Fe La Mg Mn Ni Pb Sr U V Y Zn Zr
Soil-191 85000 60 2900 130 18 57000 31 2800 360 8600 <9 24 10000 350 26 <19 190
4357 13000 110 5800 26 <0.5 6400 3 1700 85 1600 <9 52 720 14 7 <19 70
4357a 24700 143 6267 27 82 10700 25 3930 - 97 12 64 - 21 12 45 540
a Informational values for the reference material NIST SRM 4357
b Element concentrations reported as less-than values are below detection limit for the instrument. Measurement
uncertainties are 10% of the concentrations.
According to Table 7, the information values and the measured values are generally not in
agreement with each other, the ones that are in agreement have been marked in bold. The
control sample used during the measurement contained 1 µg/mL of the elements reported in
Table. 7. The results for the quality control sample were accurate for all elements but zinc (Zn)
and nickel (Ni). The reason for these deviations may be that the spectral lines used had
interference from another elements spectral line. There were no other suitable spectral lines
available for either Zn or Ni, and to overcome the problem with spectral interferences there is
a need for mathematical corrections to be added in the software. Seeing as this measurement
method still needs to be validated with reference materials the results should be viewed as
guidelines rather than perfect concentrations.
(2) ICP-SFMS
The correction factors needed for isotope dilution mass spectrometry of Pu (mass bias and
hydride formation correction factors) were determined using the reference material IRMM-
073/1. As a control sample, the reference material IRMM-184 was used and the resulting
ratios for n(234
U)/n(238
U) and n(235
U)/n(238
U) can be seen in Figure. 19. The results are in
agreement with the certified values for the mentioned isotope amount ratios.
Figure. 19. Isotope amount ratios for a) 235
U/238
U and b) 234
U/238
U. The blue bars represent the results
from this study and the green bars show the certified values for the reference material IRMM-184. The
error bars correspond to the expanded measurement uncertainty (k=2).

Page 42 of 57
The abundance sensitivity, that is the tailing on nearby masses have also been controlled,
using IRMM-184. The results for the reference material NIST SRM 4357 and the Chinese soil
191 samples are presented in Table 8, both as corrected and uncorrected for abundance
sensitivity.
The reason for presenting two sets of results was to show the importance of establishing
correction factors for certain spectral interferences such as mass bias, hydride formation and
abundance sensitivity. For the results corrected for mass bias and hydride formation, it can be
seen that the expanded measurement uncertainties for both the n(240
Pu)/n(239
Pu) ratio and the
specific activity for 239
Pu are relatively high and the n(240
Pu)/n(239
Pu) ratio is only reported as
an information value. The expanded measurement uncertainties are large, the measurement
uncertainty (k=1) is up to 40%, indicating that the results are close to or at the detection limit
for these type of measurements.
Studying the results where all three correction factors have been applied, it can be seen that 239
Pu and 240
Pu as well as the n(240
Pu)/n(239
Pu) ratio fall below the detection limit.
The largest sources of uncertainty for the determination of 239
Pu and 240
Pu were the
determination of the hydride formation correction factor to correct the m/z 239 signal for
contribution from 238
UH and the measurement uncertainty of the signal on m/z 239. The
relatively small signal on m/z 239 (about 10 cps) and the large measurement uncertainty on
the hydride formation correction factor cause the detection limit for 239
Pu to be high. Another
important uncertainty contribution is the correction for abundance sensitivity on nearby
masses.
The low level soil sample (approximately 0.2 Bq/kg 239+240
Pu) contained high iron
concentration (see Table 2) and this may have caused a vast amount of the redox chemicals to
be used up by the redox reaction for iron instead of for plutonium. If the redox reaction for
plutonium was incomplete this in turn would have caused the recovery, during the separation
on TEVA, to be considerably reduced compared to a sample with lower iron concentration.
The low recovery for plutonium during the separation meant that a smaller amount of
plutonium was available for the ICP-SFMS measurement. This led to a low signal for both 239
Pu and 240
Pu. As the contribution from the corrections for mass bias, hydride formation and
abundance sensitivity domineered the total signal measured, for both the plutonium isotopes,
this led to non-detectable amounts of plutonium.
The results for the reference material NIST SRM 4357 are within the range of results that are
normally achieved in this laboratory for this reference material. The reference material had
lower concentrations of iron and uranium in the sample and the specific activities of
plutonium are higher than that of the Chinese sample, thereby the two sets of results are
similar as the spectral interference corrections are not the major contributor to the measured
signal at m/z 239 and 240.
For this work, the detection limits for 239
Pu and 240
Pu are 0.7Bq/kg and 2.5 Bq/kg,
respectively, for 1 g of soil/sediment. The analytical turnover time for plutonium is one day
for soil/sediment, including the time that the samples are left for flocculation of silicon (12
hours).

Page 43 of 57
Table. 8 Specific activity (Bq/kg) and n(240
Pu)/n(239
Pu) in soil and sediment samples.
n(240
Pu)/n(239
Pu) S 239
Pu (Bq/kg) S 239
Pu (Bq/kg)
Soil 0.19(15)* 2.4(1.6)* 1.66(30)
NIST SRM 4357 0.153(10) 14.25(39) 8.05(50)
a The measurement uncertainties given in bracket are expanded with a coverage factor, k, 2. Results marked with
* are only reported as informational values as the expanded measurement uncertainties are large, the
measurement uncertainty (k=1) is up to 40%, indicating that the results are close to or at the detection limit for
these type of measurements.
3.2.3 Conclusions
The results in this work show that the nuclear emergency preparedness method including
lithium metaborate fusion and separation procedure using TEVA is robust for specific activity
levels of plutonium above 0.7 and 2.5 Bq/kg for 239
Pu and 240
Pu, respectively, but for low
activity samples and for samples containing high concentrations of uranium and iron the
method needs to be altered.
The correction of spectral interferences on m/z 239 and m/z 240 caused a major contribution
to, and increase of, the combined measurement uncertainty. Therefore we see isotope amount
ratios and specific activities close to the detection limit for this work. A continuation of this
work may consist of increasing the sample amount in order to achieve higher signal intensities
on m/z 239 and m/z 240, as well as improving the determination of the spectral interference
correction factors. This would lead to decreased expanded measurement uncertainties and
hence a lower detection limit may be achieved. By increasing the sample amount three times
the sample volume that need to be processed would be increased and therefore the time for the
separation procedure would get longer. However, a three times as large sample volume would
not make a drastic change the total turnover time for the method - it would still be one day.
This is because the major part of the turnover time is due to the time that the samples are
allowed to stand to flocculate silicates prior to separation.
Determination of major constituents in samples, in which certain radionuclides need to be
determined, can give good information on the sample preparation procedures suitability. For
the determination of plutonium it can be a major concern to know the concentrations of iron
and uranium due to the large influence that both these elements have on the sample
preparation and the ICP-SFMS measurement. By having knowledge of major constituents in a
sample, the sample preparation procedure can be altered. For example, by increasing the
amount of redox chemicals would ensure that that the redox process for plutonium is
complete before the plutonium separation despite the high concentration of iron in the sample.
By separating uranium from the sample before the plutonium separation, the concentration of
uranium in the sample to be measured would be reduced and therefore the tailing from 238
U
on both 239
Pu and 240
Pu will have less importance.
In this work the determinations of major elements in soil and sediment have been included
even though these kinds of measurements are still in its early stages at FOI. To improve the
measurements of the major elemental concentrations, in soil and sediment using ICP-OES,
potential spectral interferences need to be mathematically corrected for. There is also a need
to validate the method using a certified reference material.

Page 44 of 57
3.3 Improvement in source preparation and Pu air filter analysis in STUK
Pu and Am analysis from environmental samples are very time consuming. The aim of this
work was to a) test if co-precipitation could be used instead electrodeposition methods as
source preparing step in the Pu/Am methods to decrease time spent in analysis and b) test and
develop Pu method for air filters in emergency situations that is faster than the normal method
used in STUK.
3.3.1. Comparing co-precipitation vs electrodeposition as a source preparing technique
for Pu and Am
Radiochemical separation method used traditionally in STUK for Pu and Am analysis has
included a step where Pu/Am are deposited on a steel plate using electrodeposition prior to
alpha counting.
Co-precipitation of Pu/Am as cerium fluoride into a membrane is an alternative technique for
electrodeposition. The aim of this work was to test if the co-precipitation would be suitable
alternative for electrodeposition in STUK. Electrodeposition that has been traditionally used
is also a well suitable method for source preparation but it is sensitive to impurities that might
exist in the sample and it is also more sensitive to malfunction in equipment. Additionally the
technique is dependent on the operator. Co-precipitation technique is known to be less
sensitive for impurities than electrodeposition. It also works as an additional purification step
as only elements with valence states 3 and 4 will precipitate. Co-precipitation is also simpler
to carry out and requires less time than electrodeposition.
To validate cop-recipitation technique replicate samples were analyzed both using
electrodeposition and co-precipitation. Both chemical recovery and the full width at half
maximum (FWHM) were recorded.
Materials and Methods
Samples were prepared by adding a known value of tracers (242
Pu or 243
Am) into 1 M HNO3
solution.
(1) Electro-deposition
Platinum spiral is placed into the sample vessel and electricity is turned on. Pt spiral works as
an anode and stainless steel as and cathode. As a result metal present in the solution is
reduced and is precipitated on stainless steel (Letho and Hou, 2011).
Preparation of samples and pretreatment of steel plates
Stainless steel plates (ø 17.5 mm) were cleaned with water, ethanol and heated with Bunsen
burner. 30 mL Nalgene® bottles were used as electrodeposition vessels. The stainless steel
plate was placed into the Nalgene bottle and the bottle was attached into the apparatus
(Figure. 20).
3 ml of tracer solution (0.1 Bq/sample) and 400 μl MilliQ-water was added to the sample
bottle. 3 – 4 drops of methyl indicator solution was added and the sample was stirred. Conc.
NH3 was added dropwise until color was changed from red into yellow. The sample was

Page 45 of 57
acidified by adding 2 M HNO3 dropwise until the colour turned red and four additional drops
of 2 M HNO3 was then added.
Electrolysis
Current used was 1.7 - 1.9 A. Pu samples were electrodeposited for 1 hour and americium
samples for 1.5 hours. Electrolysis was finished by adding 2 ml concentrated NH3 into the
sample solution. The steel plates were rinsed with water, ethanol and heated with Bunsen
burner for 15 seconds. Heating was used to ensure that Pu is properly attached on the plate.
The diameter of the average precipitation area was 15.5 mm.
Figure. 20. Electrodeposition apparatus.
(2) Co-precipitation
Small amount of Ce (or Nd) is added into the sample solution and precipitated as CeF3 by
adding HF into the sample solution. Actinides co-precipitate in oxidation states +III/+IV. The
precipitation is filtered on a membrane filter and the membrane filter is attached on a suitable
base.
Precipitation procedure
3 ml of 242
Pu/243
Am –tracer solution (0.1 Bq/sample) was added into plastic centrifuge tubes.
0.5 ml cerium –carrier (Ce 100 μg/mL) and 1.5 ml of 40 % hydrofluoric acid (HF) were added
to the sample solution. Solution was mixed thoroughly with Vortex® and placed into an ice
bath for 45 minutes while shaking now and then.
Sample filtering
The sample solution was filtered on Metricell® polypropylene membrane (0.1 µm, ø 25 mm).
Filtering apparatus is shown in Figure. 21. After placing the filter membrane on the filtering
apparatus, 5 mL ethanol was filtered followed by the sample solution. Sample container was
rinsed twice with 5 mL of HF -solution (50 drops of 40 % HF/250 mL water) that was also
filtered. Finally 5 mL ethanol was filtered through and the membrane was removed and air
dried. The dried membrane was glued on a stainless steel plate. The diameter of the average
area with precipitation on it was about 23.5 mm.

Page 46 of 57
Figure. 21. Filtering apparatus for co-precipitated samples.
(3) Measurement of alpha sources
Electro-precipitated and co-precipitated sources were measured by alpha spectrometry
(Canberra, Alpha Analyst) with PIPS-detector. Detectors with surface area of 300 mm2 were
used for electrodeposited sources and those of 450 mm2 for co-precipitated samples. Samples
were counted for 22-31 hours.
Results and Discussion
Table. 9. Full with half maximum (FWHM) and chemical yields for Pu samples.
Electro-deposition Co-precipitation
Sample FWHM
(keV)
Yields, %
Sample FWHM
(keV)
Yield, %
1 60.1 79.6 1 46.8 87.1
2 61.3 85.2 2 64.5 89.4
3 48.8 86.1 3 42.5 89.1
4 62.2 87.8 4 61.2 85.4
5 57,5 92.6 5 31.2 106.0
6 77.6 93.2 6 34.3 110.4
7 58.7 82.4 7 36.7 104.4
8 24.3 73.9 8 34.0 92.5
9 63.1 93.1 9 36.3 104.9
10 61.6 84.8 10 37.7 95.4
11 68.0 89.9 11 33.0 91.9
12 58.6 90.4 12 30.3 97.6
13 49.8 92.2 13 36.8 93.5
14 66.0 89.4 Average 40 96
15 63.3 91.3 Standard
deviation
11 8.1
16 54.7 89.3 Std dev (%) 27 8.4
Average 59 88
Standard
deviation
11 5.4
Std dev (%) 20 6.1

Page 47 of 57
Average chemical yield for Pu in co-precipitated samples was 96 % and that from
electrodeposited samples was 88 % (Table. 9). Full with half maximum (FWHM) that
describes energy resolution was 40 keV for co-precipitated samples and 59 keV for
electrodeposited samples. Average chemical yields and FWHM-values were similar when
taking consideration standard deviation of results.
Average chemical yield for Am from co-precipitated samples was 96 % and that from
electrodeposited samples was 92 % (Table. 10). Full with half maximum (FWHM) that
describes energy resolution was 32 keV for co-precipitated samples and 52 keV for
electrodeposited samples (table 2). Average chemical yields were similar when taking
consideration standard deviation of results. However, average FWHM-values and associated
standard deviation were somewhat larger for electrodeposited samples than for co-precipitated
samples.
Table. 10. Full with half maximum (FWHM) and chemical yields for Am samples.
Electro-deposition Co-precipitation
FWHM
(keV)
Yields, %
FWHM
(keV)
Yields, %
FWHM
(keV)
Yields, %
1 45.6 90.2 1 32.3 93.9
2 42.3 98.4 2 30.1 95.4
3 33.6 84.3 3 27.7 96.4
4 41.4 92.5 4 31.0 95.2
5 62.1 86.4 5 29.9 95.9
6 54.7 97.1 6 33.8 96.9
7 47.9 103.5 7 34.2 96.6
8 63.6 94.0 8 31.2 96.1
9 64.6 83.1 9 32.4 96.4
10 39.2 96.1 10 33.1 95.7
11 74.4 91.4 11 31.0 94.0
Average 52 92 12 31.0 99.2
Standard
deviation
13 6.3 13 34.4 94.4
Std dev (%) 25 6.8 14 32.7 93.2
15 32.7 98.4
Average 32 96
Standard
deviation
1.8 1.6
Std dev (%) 5.7 1.7
Electro-deposition is more time consuming than co-precipitation. Electro-deposition is also
more sensitive to impurities. The advantage of the electrodeposition is that the radionuclide
can be deposited into a very thin layer that is needed for good resolution in alpha spectrum.
Electro-deposited samples need to be heated with Bunsen burner to assure that Pu and Am are
well attached on plate. Estimating how long the plate need to be heated is challenging and
requires experience. If the sample is heated too long part of Pu may evaporate. On the other
hand if the sample is heated too short, impurities may be left on the sample plate.
Pretreatment of the sample and preparing the equipment takes more time in electro-deposition
than in co-precipitation. The equipment needs oversights when running as the voltage may

Page 48 of 57
change during the electro-deposition. Current may have to be adjusted during the
electrodeposition due to changes in voltage. Sample container is hold in ice bath to avoid
sample evaporation and additional ice has to be added several times during the
electrodeposition.
Co-precipitation was simpler technique than the electrodeposition previously used in STUK.
Co-precipitation was not so sensitive to the operator than electrodeposition. Co-precipitation
was also not so sensitive to impurities of the sample. Disadvantage in co-precipitation is that
other elements in valence states 3 and 4 may also precipitate.
Conclusions
Based on the results it was found that both electrodeposition and co-precipitation are well
suited for Pu and Am source preparing. The advantage of co-precipitation is simplicity and
rapidity of the method that together decreases the time needed to prepare Pu/Am source.
Additionally it was found that co-precipitation technique is less sensitive to operator.
3.3.2 Analysis of Pu from air filters in emergency conditions
The Pu method that is used in STUK for regular samples takes several days to carry out. In
emergency situation results are needed faster, preferably within a day. Air filters are one of
the most important matrices needed to be analyzed in emergency conditions, especially in the
early phase of the emergency. The aim of this work was to test and improve the method for
determination of Pu from glass fiber air filters in emergency conditions. The goal was that the
Pu analysis could be carried within one working day. To dissolve the glass fiber filters two
different techniques, NaOH-Na2CO3 fusion and HF acid leach, were tested.
Materials and Methods
Samples used in the experiments were air samples collected on glass-fiber filters 12.8.2014.
The size of one individual glass fiber filter is about 8.7 cm x 8.2 cm and the diameter of the
area where the air sample is collected is about 7.8 cm. Samples were dissolved either with a)
NaOH-Na2CO3 fusion or b) with HF acid leach (mixture of HF, HNO3, HCl). Four samples
were analyzed: 2 samples with fusion and 2 with acid leach. Dissolved samples were then
purified by anion exchange followed by co-precipitation and alpha counting. NaOH-Na2CO3
fusion was chosen to be tested as one dissolution technique because it is regularly used in
STUK in Sr determination. When developing the methods for emergency situation the aim
was that the methods would be rather similar to the regular methods used in STUK so that the
laboratory personnel is familiar with them. However for the emergency purpose the methods
need to be modified in a manner that they can be carried out faster than during normal
operation.
(1) Dissolution of glass fiber filter with fusion
The glass fiber air filter (8.7 cm x 8.2 cm, ~ 0.57 g) was weighed and cut into small pieces
with scissors into a Ni crucible. 1 mL of 242
Pu tracer (A=0.0289 Bq/ml, ref date 7.6.1994) was
added to the sample. About 100 g SrCl2·6H2O was added to the sample. NaOH granules (6 x
sample mass) and 2 tea spoon of Na2CO3 (anhydrous) were added to the sample and it was
heated with a Bunsen burner. About three teaspoons of NaNO3 were added until all carbon
was burned. The fused sample was dissolved with 100 mL of distilled water while heating.
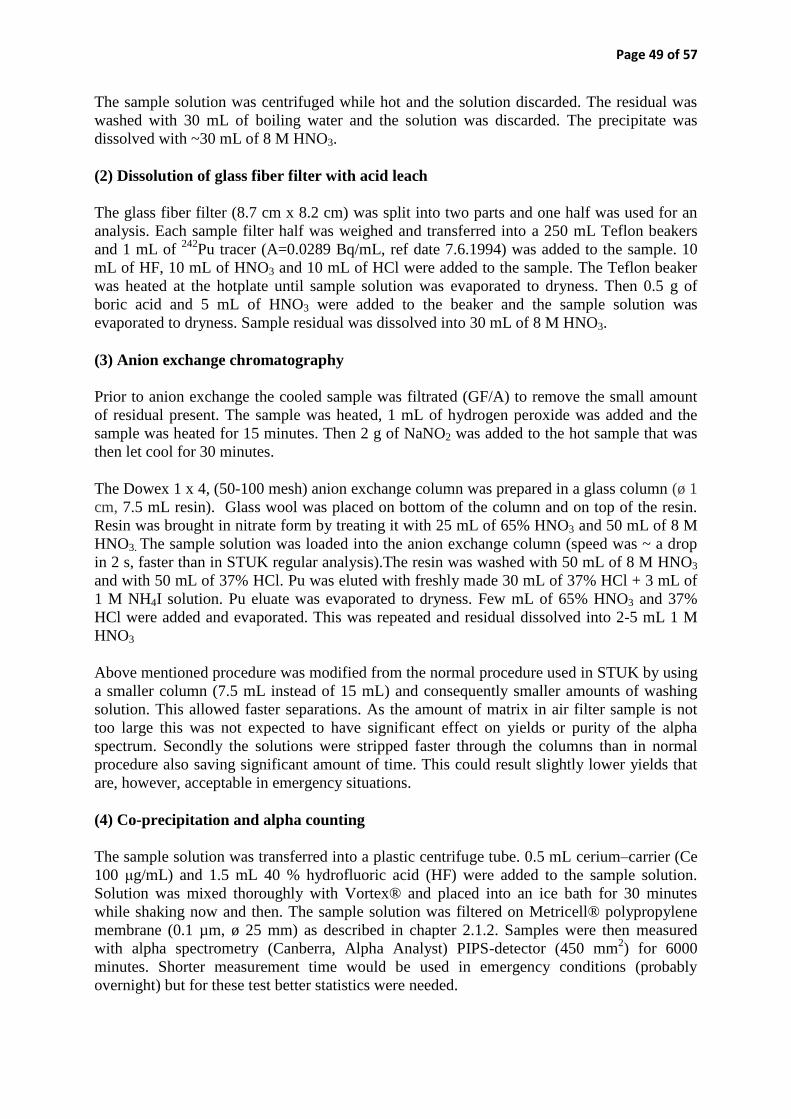
Page 49 of 57
The sample solution was centrifuged while hot and the solution discarded. The residual was
washed with 30 mL of boiling water and the solution was discarded. The precipitate was
dissolved with ~30 mL of 8 M HNO3.
(2) Dissolution of glass fiber filter with acid leach
The glass fiber filter (8.7 cm x 8.2 cm) was split into two parts and one half was used for an
analysis. Each sample filter half was weighed and transferred into a 250 mL Teflon beakers
and 1 mL of 242
Pu tracer (A=0.0289 Bq/mL, ref date 7.6.1994) was added to the sample. 10
mL of HF, 10 mL of HNO3 and 10 mL of HCl were added to the sample. The Teflon beaker
was heated at the hotplate until sample solution was evaporated to dryness. Then 0.5 g of
boric acid and 5 mL of HNO3 were added to the beaker and the sample solution was
evaporated to dryness. Sample residual was dissolved into 30 mL of 8 M HNO3.
(3) Anion exchange chromatography
Prior to anion exchange the cooled sample was filtrated (GF/A) to remove the small amount
of residual present. The sample was heated, 1 mL of hydrogen peroxide was added and the
sample was heated for 15 minutes. Then 2 g of NaNO2 was added to the hot sample that was
then let cool for 30 minutes.
The Dowex 1 x 4, (50-100 mesh) anion exchange column was prepared in a glass column (ø 1
cm, 7.5 mL resin). Glass wool was placed on bottom of the column and on top of the resin.
Resin was brought in nitrate form by treating it with 25 mL of 65% HNO3 and 50 mL of 8 M
HNO3. The sample solution was loaded into the anion exchange column (speed was ~ a drop
in 2 s, faster than in STUK regular analysis).The resin was washed with 50 mL of 8 M HNO3
and with 50 mL of 37% HCl. Pu was eluted with freshly made 30 mL of 37% HCl + 3 mL of
1 M NH4I solution. Pu eluate was evaporated to dryness. Few mL of 65% HNO3 and 37%
HCl were added and evaporated. This was repeated and residual dissolved into 2-5 mL 1 M
HNO3
Above mentioned procedure was modified from the normal procedure used in STUK by using
a smaller column (7.5 mL instead of 15 mL) and consequently smaller amounts of washing
solution. This allowed faster separations. As the amount of matrix in air filter sample is not
too large this was not expected to have significant effect on yields or purity of the alpha
spectrum. Secondly the solutions were stripped faster through the columns than in normal
procedure also saving significant amount of time. This could result slightly lower yields that
are, however, acceptable in emergency situations.
(4) Co-precipitation and alpha counting
The sample solution was transferred into a plastic centrifuge tube. 0.5 mL cerium–carrier (Ce
100 μg/mL) and 1.5 mL 40 % hydrofluoric acid (HF) were added to the sample solution.
Solution was mixed thoroughly with Vortex® and placed into an ice bath for 30 minutes
while shaking now and then. The sample solution was filtered on Metricell® polypropylene
membrane (0.1 µm, ø 25 mm) as described in chapter 2.1.2. Samples were then measured
with alpha spectrometry (Canberra, Alpha Analyst) PIPS-detector (450 mm2) for 6000
minutes. Shorter measurement time would be used in emergency conditions (probably
overnight) but for these test better statistics were needed.

Page 50 of 57
Results and discussion
(1) Chemical yields and FWHM
Chemical yields were relatively low (28-40%) for the samples that were digested with NaOH-
Na2CO3 fusion as shown in Table 3. This is because prior to anion exchange when H2O2 were
added to sample solution, silicates precipitated in the sample. Sample was filtrated and the
residual containing silicates were discarded. Obviously some Pu was also carried away with
silicates. If fusion is to be used silicates should be removed prior to anion exchange and an
additional step would be required. Silicates could be removed by using HF acid and
evaporating the sample or by carrying out an additional precipitation step. Additional
precipitation step with iron could be used to precipitate Pu and further remove impurities from
the sample solution prior to anion exchange. This would however require more time. Full
width half maximum (FWHM) that describe energy resolution was also larger in samples
where fusion was used (38-90) suggesting that purification was not satisfactory.
Samples that were digested with HF had no problems with silica interfering as the silicates
were removed while heated with HF. Chemical yield and FWHM-values were good for
samples leached with HF (Table. 11). Chemical yields varied from 78 to 96 %. As one of the
membrane filters (sample 1) was glued to the steel plate prior to counting, it became a little
wrinkled (due to the lack of practice of the operator) causing the yield to be somewhat lower
(78%) than in the other sample that was properly prepared (yield was 96%). FWHM-values
for samples leached with HF varied from 30 to 32 KeV suggesting good purification from
impurities.
Table. 11. Full with half maximum (FWHM), chemical yields and 239, 240
Pu activity in air
filter samples using the procedure for emergency conditions.
Dissolution technique Sample
number
Chemical
yield (%)
FWHM (Pu-
242 peak)
239,240Pu,
Bq/sample
Unc.
(2 sigma)
NaOH-Na2CO3 Fusion 1 28 38 <3 x10⁻⁴
NaOH-Na2CO3 Fusion 2 40 90 2.3 x10⁻³
30 %
HF acid leach 3 78 30 3.3 x10⁻⁴
50 %
HF acid leach 4 96 32 <2 x10⁻⁴
(2) Time required for the analysis
Time scheme for the analysis is shown in Figure. 22. Two samples were prepared
simultaneously. It took 6 hours and 30 min. to carry out NaOH-Na2CO3 fusion and
radiochemical purification of Pu and 5 hours and 40 min. to conduct HF digestion followed
by anion exchange and co-precipitation. Alpha counting was not included in the time scheme.
It should be noted that if a batch of four samples were to be analyzed it would take an
additional 30 min. if fusion was to be used to digest samples. However if a batch of four
samples were to be analyzed using HF acid digestion the analysis time would not increase
from 5 h 40 min. Therefore HF acid leach is faster to carry out than NaOH-Na2CO3 fusion for
glass fiber filters especially if multiple samples are to be analyzed simultaneously.
Additionally, if NaOH-Na2CO3 fusion would be used, an additional step to remove the
silicates that interfere the analysis should be added that would increase the time.

Page 51 of 57
Conclusions
It was found feasible to digest and radiochemically separate Pu from glass fiber filters within
one working day using either NaOH-Na2CO3 fusion or HF acid leach to dissolve the glass
fiber filter material. However, if fusion were to be used that would require an additional step
to remove silicates that otherwise will decrease chemical yields and interfere in the alpha
spectrum.
Leaching with HF acid resulted satisfactory yields and was faster to carry out than fusion
especially if multiple samples are to be analyzed together. Therefore leaching with HF acid is
suggested to be used for glass fiber filters in emergency (see Table. 12) However if there are
refractory particles present in air that do not dissolve easily into HF acid, fusion might be
required to dissolve the particles.

Page 52 of 57
Table. 12. Suggested Pu analysis from glass fiber filter in emergency conditions
Digestion (1 h 20 min)
Weigh the filter into a 250 mL Teflon beaker
Add 242
Pu tracer into the Teflon beaker
Add 10 mL HF, 10 mL HNO3 and 10 mL HCl to Teflon beaker and evaporate to dryness at a hot plate
(these amounts are used for an glass fiber filter with an area of 36 cm2 and weigh 0.29 g, adjust
accordingly)
Add 0.5 g boric acid and 5 mL HNO3 and evaporate to dryness
Dissolve the residual into 30 mL 8 MNO3
Filter cooled sample if needed (GF/A)
Anion exchange (3 h 20 min)
Heat and add 1 mL H2O2. Cover the beaker with a watch glass and heat at 90oC for 15 minutes. Add
approx. 2 g (1 teaspoon) NaNO2 to the hot solution. Let cool for 1 h.
Prepare an anion exchange column: place glass wool on bottom of the column and approx. 7.5 mL
anion exchange resin Dowex 1 x 4 (50 – 100 mesh) in nitrate form into an anion exchange column (ø 1
cm) using 8 M HNO3. (Resins is brought to nitrate form by treating it with 25 ml conc. HNO3 and 50
mL 8 M HNO3) Place glass wool on top of the column
Load the sample solution into the anion exchange column and wash the resin with 50 mL 8 M HNO3
(speed ~ drop in 2-3 s). Discard the load and wash solutions unless Am is to be determined
Wash the resin with 50 mL 37% HCl. Discard the wash solution.
Elute Pu with freshly made 30 mL 37% HCl + 3 mL 1 M NH4I solution.
Co-precipitation (2 hours)
Evaporate Pu eluate to dryness. Add few ml conc. HNO3 and HCl and evaporate. Repeat this 2 times.
Dissolve the residual into few mL 1 M HNO3. Transfer into plastic test tube where 0.5 mL Ce-carrier
(Ce 100 µg/mL) has been added. Wash the beaker twice with few mL 1M HNO3. Add wash solutions
into the test tube.
Co-Precipitate Pu with CeF by adding 1.5 mL 40 % HF acid. Mix the sample with Vortex and place the
test tube in ice bath for 30 min.
Filter the precipitate on Metricell® polypropylene membrane (0.1 µm, ø 25 mm)
Measure Pu with α-spectrometry

Page 53 of 57
Figure. 22. Time scheme for analysis of Pu from glass fiber filters in emergency conditions
NaOH-Na2CO3Fusion
Cut and weigh the filter into a Ni Crucible
Add tracer and reagents
Fusion
dissolve to water, centrifuge, dissolve to 8 M HNO, filter if needed
HF digestion
weigh and transfer the filter into a teflon beaker
Add tracer and acids
Acid digestion, evaporation
Add boric acid and HNO3, evaporate, dissolve to 8 M HNO3, filter if needed
Anion exchange
heat the sample solution, add H2O2 and NaNO2, let cool, prepare the columns
Anion exchange
Evaporation
Coprecipitation
Dissolve into 1 M HNO3, add Ce carrier and HF,
wait 30 min
Filtrate precipitate on a membrane
2 h
5 h 30 min
6 h 30 min
1 h 20 min
4 h 40 min
5 h 40 min
start start
Fusion and HF acid leach were carried out as a batch of 2 samples. If four samples would be analyzed simultaneously that would require additional 30
minutes for fusion but no more additional time in HF acid leach. Anion exchange and co-precipitation were carried out as a batch of four samples. If fusion
were to be used, an additional step would be required to remove silicates.
Cumulative time Cumulative time
Page 54 of 57
4. Conclusions
In 2014, Rapid-Tech project gathered scientists working in radiochemistry among Nordic
countries and oversaw the problems and needs in developing effective radiochemical methods.
Based on screening the current analytical methods for common radionuclides (e.g., Sr,
actinides) assays in individual institute, challenges and future development needs were
identified by each institute and presented in this report. Experiments in applying distinct novel
techniques in each institute were also performed and the preliminary results obtained in each
institute are assessed and summarized in this report.
In the planned continuing phase of the activity, NKS-B Rapid-Tech project aims to explore
practical evaluation and experience exchange for the application of effective and automated
sample processing techniques. Analytical benefits can be gained by using these novel
techniques, leading to easier method optimization for distinct purposes and improvement of
current radio-analytical methods.
To fulfil these objectives, an inter-comparison exercise (e.g., for determination of 90
Sr,
actinides) will be run within the collaborative institutes to compare the analytical performance
of different novel techniques (e.g., vacuum box, flow injection (FI) /sequential injection (SI),
HPLC-ICP-MS). An inter-exchange program can also be planned with authorized permission
for project participants, regarding specific novel techniques of interest that are applied in
other partner institutes.
5. Reference
Bojanowski R.13 and Kanpinska-Skiba D. 1990. Determinaiton of low-level 90Sr in
environmental materials: a novel approach to the classic method. J. Radioanal. Nucl. Chem.
138: 207-218.
Chen Q., Dahlgaard H., Hansen H., Aarkrog A. 1990. Determination of 99
Tc in envrionmental
sample by anion exchange and liquid-liquid extraction at controlled valency. Anal. Chim.
Acta 228: 163-167.
Chen Q., Dahlgaard H., Nielsen S. P. 1994. Determination of 99
Tc in seawater at ultra low
levels. Anal. Chim. Acta 285: 177-180.
Croudace I., Warwick P., Taylor R., Dee S. 1998. Rapid procedure for plutonium and
uranium determination in soils using a borate fusion followed by ion-exchange and extraction
chromatography. Anal. Chim. Acta. 371: 217-225.
Holmgren S., Tovedal A., Jonsson S., Nygren U., H. Ramebäck H. 2014. Handling
interferences in 89
Sr and 90
Sr measurements of reactor coolant water: A method based on
strontium separation chemistry. Appl. Rad. Isot., 90: 94-101.
Lehto J. and Hou X. 2011. Chemistry and Analysis of Radionuclides: Laboratory Techniques
and Methodology, WILEY-VCH.
Nygren U., Ramebäck H. Nilsson C. 2007. Age determination of plutonium using inductively
coupled plasma mass spectrometry. J. Radioanal. Nucl. Chem. 272: 45-51.
Page 55 of 57
Popov L., Hou X., Nielsen S. P., Yu Y., Djingova R., Kuleff I. 2006. Determination of radio
strontium in environmental sample using hydroxide for separation of strontium from calcium.
J. Radioanal. Nucl. Chem. 269: 161-173.
Popov L., Mihailova G., Hristova I., Tzibranski R., Avramov V., Naidenov I., Stoenelova B.
2009. Separation of strontium from calcium by the use of sodium hydroxide and its
application for the determination of long-term background activity concentraitons of 90
Sr in
100 km area around Kozloduy Nuclear Power Plant (Bulgaria). J. Radioanal. Nucl. Chem.
279: 49-64.
Qiao J., Hou X., Roos P., Miró, M. 2009. Rapid determination of plutonium isotopes in
environmental samples using sequential injection extraction chromatography and detection by
inductively coupled plasma mass spectrometry. Anal. Chem. 81: 8185-8192.
Qiao J., Hou X., Roos P., Miró M. 2011. High-throughput sequential injection method for
simultaneous determination of plutonium and neptunium in environmental solids using
macro-porous anion exchange chromatography followed by inductively coupled plasma mass
spectrometric detection. Anal. Chem. 83: 374-381.
Qiao J., Shi K., Hou X., Nielsen S. P., Roos P. 2014. Rapid multisample analysis for
simultaneous determination of anthropogenic radionuclides in marine environment. Envrion.
Sci. Technol. 48: 3935-3942.
Shi K., Qiao J., Wu W., Roos P., Hou X. 2012. Rapid Determination of 99
Tc in large volume
seawater samples using sequential injection extraction chromatographic separation and ICP-
MS measurement. Anal. Chem. 84: 6783-6789.
Page 56 of 57
Bibliographic Data Sheet NKS-336
Title Application of Rapid and Automated Techniques in Radiochemical
Analysis
Author(s) Jixin Qiao 1, Iisa Outola
2, Petra Lagerkvist
3, Rajdeep Singh Sidhu
4,
Kai Xu 1, Sofia Josson
3, Pia Vesterbacka
2, Stina Holmgren
3, Kaisa
Vaaramaa 2
Affiliation(s) 1 DTU-Nutech, Technical University of Denmark, Denmark
2 STUK, Radiation and Nuclear Safety Authority, Finland
3 FOI, CBRN Defence and Security, Sweden
4 IFE, Institute for Energy Technology, Norway
ISBN 978-87-7893-418-5
Date April 2015
Project NKS-B / Rapid-Tech
No. of pages 61
No. of tables 12
No. of illustrations 22
No. of references 13
Abstract
max. 2000 characters
NKS Rapid-Tech project 2014 aims to explore the application of
different rapid techniques in determination of radionuclides, thus to
improve the analytical efficiency and capacity of present
radioanalytical methodologies used for different purposes in the
areas of E, W and R. Specific tasks are described as follows:
Identification of current needs and problems in methodology
development for rapid determination of radionuclides (e.g., 90
Sr,
actinides).
Identification of individual processes/operations wherein rapid
techniques can be potentially applied to improve the analytical
efficiency.
Establishment of practical solutions/suggestions in the
application of rapid techniques in radiochemical procedures.
Development and optimization of rapid methods for
determination of radionuclides (e.g., 90
Sr, actinides) in
environmental samples using automation and effective sample
treatment techniques.
Assessment of analytical performance and summarization of
successes/failures, challenges and future attempts.
In 2014, Rapid-Tech project gathered scientists working in

Page 57 of 57
radiochemistry among Nordic countries and oversaw the problems
and needs in developing effective radiochemical methods. Based on
screening the current analytical methods for common radionuclides
(e.g., Sr, actinides) assays in individual institute, challenges and
future development needs were identified by each institute and
presented in this report.
Experiments in applying distinct novel techniques in each institute
were also performed: 1) DTU Nutech (Denmark) improved method
applicability for different matrix content in Pu determination by
exploring oxalate co-precipitation, and improved Sr seawater
procedure; 2) STUK (Finland) improved Pu/Am source preparation
technique and Pu procedure in air filter analysis for emergency
preparedness; 3) IFE (Norway) improved 90
Sr seawater method in
terms of reducing the use of fuming nitric acid and testing the
application of Sr resin to 210
Pb analysis in water samples; 4) FOI
(Sweden) tested new redox reagents for improving the stability of Pu
analytical method and investigated the matrix effect on TEVA resin
to improve the chemical yield of Pu. The preliminary results
obtained in each institute are assessed and summarized in this report.
Key words
Rapid determination, Pu, Sr, Tc, environment analysis, emergency
preparedness