nitrogen dynamics on grazing dairy farms in georgia
TRANSCRIPT

NITROGEN DYNAMICS ON PASTURE-BASED DAIRY FARMS IN GEORGIA
by
NATHANIEL P. EASON
(Under the Direction of Miguel Cabrera)
ABSTRACT
Information on nitrogen inputs and outputs for southeastern US pasture-based dairies is
very limited. The first objective of this research was to estimate N losses via ammonia
volatilization, nitrous oxide emissions, and nitrate leaching on two pasture-based dairies located
in the Coastal Plain of Georgia (U.S.). The second objective was to create a one-year N balance
for the two dairies. Nitrogen inputs were obtained from farm records. Nitrogen outputs included
milk export, ammonia volatilization, nitrous oxide emission, and nitrate leaching. A
micrometeorological passive flux method measured ammonia. Nitrous oxide emissions were
measured using closed chambers in the field. Cup lysimeters were installed at 1-m depth to
measure NO3 leaching. Total N inputs were similar for both farms and so was N exported in milk
when expressed as percentage of N inputs. However, ammonia and nitrate losses were very
different between farms because of differences in N management practices.
INDEX WORDS: Grass-based dairies, N balance, Environmental impact, Dairy, Nitrate, Ammonia

NITROGEN DYNAMICS ON PASTURE-BASED DAIRY FARMS IN GEORGIA
by
NATHANIEL P. EASON
B.S.F.R., University of Georgia, 2007
A Thesis Submitted to the Graduate Faculty of The University of Georgia in Partial Fulfillment
of the Requirements for the Degree
MASTER OF SCIENCE
ATHENS, GEORGIA
2010

© 2010
Nathaniel P. Eason
All Rights Reserved

NITROGEN DYNAMICS ON PASTURE-BASED DAIRY FARMS IN GEORGIA
by
NATHANIEL P. EASON
Major Professor: Miguel Cabrera
Committee: Nick Hill Dennis Hancock
Electronic Version Approved: Maureen Grasso Dean of the Graduate School The University of Georgia May 2010

iv
ACKNOWLEDGEMENTS
I would like to thank my major professor and committee members for guiding me along
this journey. My research would not have been possible without the help of lab technicians, John
Rema, Cheryl Mackowiak, and Kevin Roach. A special thanks to my parents and brother who
continually supported my efforts throughout my work. Finally, I would like to thank God for
allowing me to lean upon Him during all the stressful times.

v
TABLE OF CONTENTS
Page
ACKNOWLEDGEMENTS ........................................................................................................... iv
LIST OF TABLES ........................................................................................................................ vii
LIST OF FIGURES ...................................................................................................................... viii
CHAPTER
1 INTRODUCTION ................................................................................................... 1
References ................................................................................................... 3
2 LITERATURE REVIEW ........................................................................................ 4
References ................................................................................................. 12
3 NITROGEN LOSSES IN TWO PASTURE-BASED DAIRIES ON GEORGIA’S
COASTAL PLAIN (USA) .................................................................................... 15
Introduction ............................................................................................... 17
Materials and Methods .............................................................................. 18
Results/Discussion ................................................................................... 25
Conclusions ............................................................................................... 30
References ................................................................................................. 31
4 FARM-GATE N BALANCES FOR TWO PASTURE-BASED DAIRIES IN
GEORGIA, USA ................................................................................................... 42
Introduction ............................................................................................... 44
Materials and Methods .............................................................................. 45
Results/Discussion .................................................................................... 51

vi
Conclusions................................................................................................58
References..................................................................................................60
5 SUMMARY AND CONCLUSION ......................................................................73

vii
LIST OF TABLES
Page
Table 3.1: Soil chemical and physical properties for the two pasture-based dairy farms monitored in this study. .................................................................................................................................. 35 Table 3.2: Summary of total fertilizer N applied and losses associated with the sampling period at Wrens (1 Jun 2008-31 Aug 2009) and Quitman (1 Aug 2008-31 Aug 2009) Farms................ 36 Table 4.1: Farm-gate N balances for Wrens and Quitman farms.................................................. 63
Table 4.2: Ranges in average yearly temperature and relative humidity for Georgia (USA) and other locations with studies on pasture-based dairies. .................................................................. 64 Table 4.3: Mean N2O emissions from manure, urine and, control treatments from a 14-day study at the Wrens farm in 2009 ............................................................................................................. 65 Table 4.4: Inorganic N to a depth of 75 cm at the initial and final samplings on the Wrens and Quitman farms. .............................................................................................................................. 66

viii
LIST OF FIGURES
Page
Figure 3.1: Ammonia volatilization (a), nitrate leaching (b), fertilizer-N applied (c), and air temperature and precipitation (d) at each farm during sampling periods in 2008 and 2009 ......... 37 Figure 3.2: Nitrate concentrations in 1-m cup lysimeters (a), water flux at 1-m depth (b), and volumetric water content at 0-25, 25-50, and 50-75 cm in the Orangeburg soil on the Wrens farm. .............................................................................................................................................. 38 Figure 3.3: Nitrate concentrations in 1-m cup lysimeters (a), water flux at 1-m depth (b), and volumetric water content at 0-25, 25-50, and 50-75 cm in the Tifton soil on the Quitman farm ....................................................................................................................................................... 39 Figure 3.4: Nitrate concentrations in 1-m cup lysimeters (a), water flux at 1-m depth (b), and volumetric water content at 0-25, 25-50, and 50-75 cm in the Stilson soil on the Quitman farm ....................................................................................................................................................... 40 Figure 3.5: Nitrate concentrations in 1-m cup lysimeters (a), water flux at 1-m depth (b), and volumetric water content at 0-25, 25-50, and 50-75 cm in the Fuquay soil on the Quitman farm ....................................................................................................................................................... 41 Figure 4.1: Farm-gate balance: nitrogen inputs and outputs used................................................. 67 Figure 4.2: Nitrous oxide and CO2 emissions, soil temperature, and water-filled pore space of the upper 10 cm during the first N2O study on the Wrens farm.................................................... 68 Figure 4.3: Nitrous oxide and CO2 emissions, soil temperature, and water-filled pore space of the upper 10 cm during the second N2O study on the Wrens farm ..................................................... 69 Figure 4.4: Monthly amounts of N fertilizer applied on the Quitman and Wrens farms ............. 70 Figure 4.5: Monthly amounts of NH3 volatilized on the Quitman and Wrens farms ................... 71 Figure 4.6: Monthly amounts of NO3 leached on the Quitman and Wrens farms ........................ 72

1
CHAPTER 1
INTRODUCTION
Purpose of the Study
Animal confinement systems are the primary type of dairy farm in Southeastern USA.
Because of increasing grain and energy costs, these farms are becoming costly to operate. Dairies
that use management-intensive grazing provide an alternative to confinement systems in Georgia
and the Southeast. Pasture-based dairies generally have lower operating costs, better animal
health, less environmental impact, and better energy efficiency than animal confinement dairies
(Soder and Rotz, 2001). Nitrogen fertilization is one of the most important management practices
in pasture-based dairies. Thus, efficient use of nitrogen is crucial for the sustainability of these
dairies. Nitrogen cycles between the soil, water, and atmosphere components of the grassland
system at rates which are poorly defined (Rotz et al., 2005). To understand the importance of N
application on pasture-based dairies, it is necessary to look into the dynamics and processes
associated with N fertilizer. Once N fertilizer is applied to a pasture, it may be leached below the
rooting zone in the form of nitrate, or it may be lost as ammonia gas and/or nitrous oxide. Vaio et
al. (2008) showed that up to 50% of the urea-N applied to a tall fescue pasture could potentially
be lost as ammonia. Korevaar (1992) found the same percentage could be lost via nitrate
leaching. Ledgard et al. (1999) discussed the potential for 16 to 30% of the added N to be
immobilized in the soil as organic N one year after application.

2
Stricter legislative, economic, and public pressures demand that N use is optimized and
that losses do not exceed thresholds, allowing both environmental and economic goals to be
attained (Jarvis, 1993). By monitoring the N inputs and outputs on current operational pasture-
based dairies in the Coastal Plain of Georgia, a better understanding of the N use efficiency. As a
result, improved management practices can be developed/recommended that will make these
operations more environmentally and economically sustainable.
Objectives
The first objective of this research was to estimate N losses via ammonia volatilization,
nitrous oxide emissions, and nitrate leaching on two pasture-based dairies located in the Coastal
Plain of Georgia. The second objective was to create one-year N balances for both farms based
upon measured N losses and N inputs from farm records.

3
REFERENCES
Jarvis, S.C. 1993. Nitrogen cycling and losses from dairy farms. Soil Use Manage. 9:99-105. Korevaar, H. 1992. The nitrogen balance on intensive dutch diary farms: a review. Livestock
Production Science 31:17-27. Ledgard, S.F., J.W. Penno, and M.S. Sprosen. 1999. Nitrogen inputs and losses from clover/grass
pastures grazed by dairy cows, as affected by nitrogen fertilizer application. J. Agric. Sci. (Cambridge). 132:215-225.
Rotz, C.A., F. Taube, M.P. Russelle, J. Oenema, M. A. Sanderson, and M. Wachendorf. 2005.
Whole-farm perspectives of nutrient flows in grassland agriculture. Crop Sci. 45:2139-2159.
Soder, K.J., and C.A. Rotz. 2001. Economic and environmental impact of four levels of
concentrate supplementation in grazing dairy heards. American Dairy Science Association. 84:2560-2572.
Vaio, V., and M.L. Cabrera. 2008. Ammonia volatilization from urea-based fertilizers applied to
tall tall fescue pastures in Georgia, USA. Soil Sci. Soc. Am. J. 72:1665-1671.
4
CHAPTER 2
LITERATURE REVIEW
Confinement vs. Pasture-based Dairies
NRCS (2007) defines grazing-based dairy production systems as land use and feed
management systems that optimize the intake of forages directly by grazing cows. It also defines
confinement-based dairy production systems as land use and feed management systems that
optimize milk production with confined cows consuming harvested forages. Gaining knowledge
of energy, labor, and cost efficiencies within these farms will help provide current or future dairy
farmers with valuable information to increase their profitability and optimize production on their
farms. In addition, stricter environmental regulations regarding nutrient losses, waste handling,
and water management are forcing dairies managers to implement environmental practices on the
farm.
Confinement systems are capital-intensive, labor-intensive, and resource-intensive. These
high costs, along with unstable or low milk prices, drastically increase risk and reduce long-term
profitability for the farm operation (Soder and Rotz, 2001). Hoof and leg problems, acidosis,
udder sores, mastitis, and general animal stress are also commonplace for the cows in
confinement systems (NRCS, 2007). Grazing systems generally have reduced facility and labor
costs, healthier cows with longer productive lives, and potentially a better quality of life for the
dairy farmer (NRCS, 2007; Soder and Rotz, 2001; Weil and Gilker, NA).

5
Why Georgia?
Pasture-based dairy farms have been the primary form of dairy farming in many Western
European countries as well as in New Zealand and Australia for decades. Now, more attention
has been directed toward introducing these grazing systems into the southeastern United States,
mainly the Coastal Plain of Georgia. So why choose Georgia? To begin with, the southeast is a
milk-deficient region. In fact, the southeastern United States produces less than 8% of the
national milk supply (Anon., 2004). The population in the Southeast continues to grow, with
Georgia having the 4th highest growth rate in the U.S. (Newberry, 2008). Therefore, an increase
in the population demands for more milk producers. Ironically, of the milk produced in Georgia,
51% is exported, and of that, 48% is exported to Florida (Newberry, 2008); therefore, most of
Georgia is dependent upon other states for its milk.
Additional attractions for implementing pasture-based dairies in Georgia are its climate
and forage species that allow for a year-round grazing season (Ball et al., 2002). The sub-tropical
climate allows optimum growth rates for forages such as bermudagrass and winter annual
grasses. The Coastal Plain region of Georgia has an adequate supply of water which aids in the
irrigation needed for the success of these farms. Topsoils within this region are generally
described as highly weathered sandy loams (with varying depths) with low water-holding
capacity, underlined by kaolinitic clay subsoils that are acidic, limit root growth, and have low
cation exchange capacity. The low clay content of the upper 12 to 24 cm of soil profile tolerates
traffic from cows and is well drained. As a result, cows graze on drained soils (as opposed to
muddy pastures), which leads to increased herd health.

6
Nitrogen Balance
Little is known about the transport and losses of N on pasture-based dairies in Georgia’s
Coastal Plain. This lack of information is problematic given the rate at which the pasture-based
dairy industry is being introduced in the Southeast. Little research has been done to determine
the extent rotationally-grazed, irrigated pastureland on Coastal Plain soils effects the N cycle in
these soils. Much research has been done in Northwestern Europe, Netherlands, New Zealand,
and Australia on N balances and N losses on pastureland, however, extrapolation of this research
is inappropriate to the Southeast because of differences in management practices, soil types, and
climate. Transformations of N into different components as it cycles through the farm may cause
large losses to the atmosphere, ground-, and surface-water (Rotz et al., 2005). Because N
fertilizer is one of the largest costs for these farms, and little is known about the N dynamics in
this region under such conditions, the purpose of this study is to obtain information on how N
cycles under these conditions. For this reason, a whole farm N balance is a necessary first step
because it is the scale at which nutrient management decisions are made. A whole farm approach
also provides insight into how the N dynamics may affect other components within the system.
For the N balance used in this study, our N inputs are N fertilizer and supplemental feed. The
outputs are nitrous oxide (N2O) emissions, ammonia (NH3) volatilization, nitrate (NO3) leaching,
and milk N export. The following section provides a closer examination of these outputs.

7
Nitrous Oxide Loss
Nitrous oxide (N2O) emission is thought to be a major contributor to global climate
change. It is estimated that N2O molecule has an impact equivalent to that of 300 CO2 molecules
(Turner et al., 2008). Nitrous oxide is produced by microbial processes that reduce NO3 to N2
(denitrification) and by the oxidation of NH4 to NO3 (nitrification) (Eckard et al., 2003). These
processes are affected by moisture conditions, water-filled pore space (WFPS), oxygen status,
soil temperature, N availability, organic matter, topography, and pH (Katayanagi et al., 2008;
Turner et al., 2008). The complexities and interactions between biological, chemical, and
physical properties of the soil lead to highly variable N2O emissions both spatially and
seasonally (Liebig et al., 2008; Parkin 1993; Senbayram et al., 2009; Carter 2007; Turner et al.,
2008). Turner et al. (2008) performed a correlation matrix on the interactions between various
physical and chemical soil properties, and found that the amount of NO3 present in the soil was
the most significant predictor of N2O emissions. Liebig et al. (2008) also found a strong
correlation between N2O and WFPS in a study with cattle urine. Optimal N2O fluxes seem to
occur when the soil is between 60 and 80% WFPS, but emissions can still occur up to field
capacity (Velthof and Oenema, 1995). Both, animal excreta deposited on a pasture and irrigation
is expected to add to the variability (Turner et al., 2008). Results by Luo et al. (2008) showed
that most N2O fluxes reached a maximum at 1 to 14 days after grazing. In that study, N2O
emissions exhibited high seasonal variation, with rates decreasing in the following order:
spring/early summer > late autumn/winter> summer/early autumn.
In grazed grassland systems, urea found in urine patches contributes to N2O fluxes due to
its N and C contents (Liebig et al., 2007). Oenema (1997) reported up to 3.8% on the N in urine
is released as N2O. Studies aimed at reducing GHGs from dairies have focused on modifying the

8
animal’s diet with a lower protein feed (Liebig et al., 2008; Luo et al., 2008). Urea in N
fertilizers also causes large amounts of N2O emissions. Ledgard et al. (1999) reported that
gaseous losses by denitrification and volatilization increased 5-fold with the application of Urea
fertilizer. In that study, N2O loss was 5 kg N ha-1yr-1 for control, and 10 kg N ha-1yr-1 for
ammonium nitrate and urea treatments. Extrapolation of data from other research to any location
is not recommended because of the complexity of interactions of various biological, chemical,
and physical properties that affect N2O fluxes.
Ammonia Loss
A major concern on these pasture-based dairies is the loss of N via ammonia
volatilization to the atmosphere. Bussink (1992) states there are limited data on the losses of NH3
on grazed swards. The primary source of NH3 losses on grazed pastures is thought to be urine
deposited by cattle. Urine contains urea, which is hydrolyzed by the enzyme urease to produce
ammoniacal N. The extent to which NH3 volatilization occurs is dependent upon environmental
factors and possibly grassland management. Ammonia losses to the atmosphere are important to
manage because they may affect aerosol chemistry and acid deposition (Bussink, 1992).
Deposition of NH3 from the atmosphere could potentially lead to N loading to lakes, acidify soils
of low buffering capacity, and damage sensitive crops (Gay and Knowlton, 2005; Pearson and
Stewart, 1993; ApSimon et al., 1987; Van Breemen and Van Dijk, 1988). Recent studies in
Europe show that up to 90% of the total NH3 burden in the atmosphere originated from
agriculture, with livestock wastes as its major source (Bussink and Oenema, 1998). While much
is known about the effects NH3 has on the atmosphere (Bussink, 1992), little is known about
losses at the farm level. Gaining quantitative insight of the various sources of NH3 volatilization

9
and the factors that govern these losses is necessary to introduce cost-effective management
practices. A whole-farm approach can consider the various components of NH3 loss so that
practices can be put into effect that minimizes this source of N loss.
Nitrate Leaching Losses
Loss of N in leaching of NO3 through the soil profile raises many environmental
concerns. Nitrate becomes a concern in groundwater when concentrations exceed USEPA’s
drinking water standard of 10 mg N L-1. The probability of NO3 leaching depends on climate,
soil, and plant characteristics, with the highest losses in humid climates or irrigated systems, on
coarse-textured soils or soils with artificial drainage, and under plants with short root systems,
such as perennial ryegrass and white clover (Rotz et al., 2005). Various studies have shown that
NO3 leaching under grazed grasslands has been significantly higher than under cut grasslands
(Hack-ten Broeke et al., 1996). This increase is because of the cattle excreta patches deposited on
the field while animals graze. Roughly 80% of N consumed by grazing dairy cattle in feed and
forages is deposited back into the pasture in the form of urine and feces (Whitehead, 1995).
Dung patches have little impact on NO3 leaching because 65 to 80% of the N excreted is
contained in urine. It is estimated that one urine patch can represent a localized application
ranging from 400 to 1200 kg N ha-1 (Hack-ten Broeke et al., 1996). However, a study done by
White et al. (2001) showed that excreta from cattle under grazing conditions were relatively
evenly distributed about the field after several grazing rotations. There have also been leaching
studies considering dairy effluent application rates to various forages. Woodard et al. (2002)
found that a Bermudagrass-annual ryegrass system compared to a corn-forage sorghum-rye
system (where all three crops were annuals) was 20% more effective in N uptake and greatly

10
reduced NO3 leaching below the primary rooting zone. Despite the effective use of N by
perennial grasses and annuals, NO3 leaching can still pose environmental hazards and steps
should be taken to minimize this source of N loss.
Another variable affecting NO3 leaching on the farm is the use of supplemental irrigation.
Irrigation is necessary on intensively managed pasture-based dairies to ensure an adequate forage
supply for the animals. Little is known about how irrigated pastureland affects N leaching in
Coastal Plain soils in temperate climates of the southeast region of the U.S. A study conducted in
Denmark determined that a change from 25 to 15 mm per irrigation on sandy drier soils resulted
in higher irrigation efficiencies and lowered annual water use from supplemental irrigation
(Hack-ten Broeke, 2001). This study revealed that various irrigation strategies had no significant
effect on NO3 concentrations in the leachate for drier soils. Further research in site-specific
locations would be necessary to understand the relationship between irrigation management and
nitrate losses.
Milk Export
Nitrogen ouput in milk export is an important component of a farm-gate balance. .
Ledgard et al. (1999) constructed a farm-gate N balance on clover/grass pastures grazed by dairy
cows and assessed the influence of N fertilizer applications. They showed that fertilizer N inputs
resulted in a minor increase in the N removed in milk relative to the amounts of N applied. Many
other studies conducting N balances grouped the milk exported with the meat that was removed ,
labeling it as “milk and meat products” (e.g., Ledgard, 2001; Kristensen, 2004). As a result, it is
difficult to determine what percentage of N was actually removed in milk (ADD figures on %
removed in milk).

11
Modeling N flows
Some studies have used models models to predict N losses in intensive grazing systems.
These models usually overestimate or underestimate N losses because of the pure complexity of
how N cycles within these systems (e.g., McGechan and Topp, 2004; Watson and Atkinson,
1999). Since models are only as accurate as the calibration data they are based from, there is a
need to study the N cycle in situations on pasture-based dairies in the Coastal Plain of Georgia.
Gaining understanding of the N dynamics on these farms could potentially help improve the
economic and environmental sustainability of this system.
Conclusions
There has been considerable research directed to the estimation of the N losses associated
with dairy-slurry applications, leaching, volatilization, and N movement in dry-land grazing
pastures, but these conditions are highly variable and site-specific. Monitoring the N dynamics
on a grazing dairy in the Georgia Coastal Plain is needed. Research in other countries on pasture-
based dairy farms indicates high losses of N to the environment are possible and suggests that
monitoring of N flows on these farms is vital for their sustainability. Because of the possibility
that pasture-based dairies will be an alternative practice to dairy farming systems in the
Southeast USA, it is important to determine their environmental effects. For these reasons, this
research is important to understand the environmental implications of pasture-based dairies
within Georgia.

12
REFERENCES Anonymous. 2004. Milk cows and production: Final estimates 1998-2002. USDA National ` Agricultural Statistics Service. Statistical Bulletin No. 988. ApSimon, H.M., M. Kruse, and J.N.B. Bell.1987. Ammonia emissions and their role in acid
deposition. Atmos. Environ. 21:1939-1946. Ball, D.M., C.S. Hoveland, and G.D. Lacefield. 2002. Southern forages. 3rd ed. p. 232-241. PPI
and FAR. Printed by Graphic Comm. Corp., Lawrenceville, Ga. Bussink, D.W. 1992. Ammonia volatilization from grassland receiving nitrogen fertilizer and
rotationally grazed by dairy cattle. Fert. Res. 33:257-265. Bussink, D.W., and O. Oenema. 1998. Ammonia volatilization from dairy farming systems in
temperate areas: A review. Nutrient Cycling in Agroecosytems 51:19-33. Carter, M.S. 2007. Contribution of nitrification and denitrification to N2O emissions from urine
patches. Soil Biol. Biochem. 39:2091-2102. Eckard, R.J., D.Chen, R.E.White, and D.F.Chapman. 2003. Gaseous nitrogen loss from
temperate perennial grass and clover dairy pastures in south-eastern Australia. Aust. J. of Agric. Res. 54:561-570.
Gay, S.W. and K.F. Knowlton. 2005. Ammonia emissions and animal agriculture. Virginia
Cooperative Extension Biological Systems Engineering Publication 442-110. www.ext.vt.edu
Hack-ten Broeke, M.J.D. 2001. Irrigation management for optimizing crop production and
nitrate leaching on grassland. Agriculture Water Management 49:97-114. Hack-ten Broeke, M.J.D., W.J.M. De Groot, and J.P. Dijkstra. 1996. Impact of excreted nitrogen
by grazing cattle on nitrate leaching. Soil Use Manage. 12:190-198. Katayanagi, N., T. Sawamoto, A. Hayakawa, and R. Hatano. 2008. Nitrous oxide and nitrice
oxide fluxes from cornfield, grassland, pasture and forest in a watershed in southern Hokkaido, japan. Soil Sci. Plant Nutr. (Tokyo) 54:662-680.
Kristensen, I.S. 2004. Nitrogen balance from dairy farms. Danish Institute of Agricultural
Science. http://www.lcafood.dk/processes/agriculture/dairyfarms.html Version No.1. (verified 20 Nov. 2008).
Ledgard, S.F. 2001. Nitrogen cycling in low input legume-based agriculture, with emphasis on
legume/grass pastures. Plant Soil 228:43-59.

13
Ledgard, S.F., J.W. Penno, and M.S. Sprosen. 1999. Nitrogen inputs and losses from clover/grass pastures grazed by dairy cows, as affected by nitrogen fertilizers application. J. of Agric. Sci. 132:215-225.
Liebig, M.A., S.L. Kronberg, and J.R. Gross. 2008. Effects of normal and altered cattle urine on
short-term greenhouse gas flux from mixed-grass prairie in the northern great plains. Agric. Ecosyst. Environ. 125:57-64.
Luo, J., S.F. Ledgard, C.A.M. de Klein, S.B. Lindsey, and M. Kear. 2008. Effects of dairy
farming intensification on nitrous oxide emissions. Plant Soil. 309:227-237. McGechan, M.B., andC.F.E. Topp. 2004. Modeling environmental impacts of deposition of
excreted nitrogen by grazing dairy cows. Agric. Ecosyst. Environ. 103:149-164. Newberry, F. 2008. Georgia’s dairy industry. Georgia Milk Producer Inc.
http://www.gamilk.org/images/E0075201/GA_Dairy_Industry.pdf (verified 20 Nov. 2008).
NRCS. 2007. Profitable grazing-based dairy systems. Range and Pasture Technical Note No.1. ftp://ftp-fc.sc.egov.usda.gov/GLTI/technical/publications/tn_rp_1_a.pdf (verified 5 Apr.
2010). Oenema, O., G.L. Velthof, S. Yamulki, and S.C. Jarvis. 1997. Nitrous oxide emissions from
grazed grassland. Soil Use Manage. 13:288-295. Parkin, T.B. 1993. Spatial variability of microbial processes in soil: a review. J. Environ. Qual.
22:409-417. Pearson,J., and G.R. Sewart. 1993. Transley review no. 56: The deposition of atmospheric
ammonia and its effects on plants. New Phytol.125:283-305. Rotz, C.A., F. Taube, M.P. Russelle, J. Oenema, M. A. Sanderson, and M. Wachendorf. 2005.
Whole-farm perspectives of nutrient flows in grassland agriculture. Crop Sci. 45:2139-2159.
Senbayram, M., R. Chen, K.K. Muhling and K. Dittert. 2009. Contribution of nitrification and
denitrification to nitrous oxide emissions from soils after application of biogas waste and other fertilzers. Rapid Commun. Mass Spectrom. 23:2489-2498.
Soder, K.J., and C.A. Rotz. 2001. Economic and environmental impact of four levels of
concentrate supplementation in grazing dairy heards. American Dairy Science Association. 84:2560-2572.
Turner, D.A., D. Chen, I.E. Galbally, R. Leuning, R.B. Edis, Y. Li, K. Kelly, and F. Phillips.
2008. Spatial variability of nitrous oxide emissions from an Australian irrigated pasture. Plant Soil 309:77-88.

14
Van Breemen, N., and H.F.G. Van Dijk. 1988. Ecosystem effects of atmospheric deposition of nitrogen in the Netherlands. Environ. Pollut. 54:249-274.
Velthof, G.L., O. Oenema. 1995. Nitrous oxide fluxes from grassland in the Netherlands: II.
Effects of soil type, nitrogen fertilizer application and grazing. Eur. J. Soil Sci. 46:541-549.
Watson, C.A., and D. Atkinson. 1999. Using nitrogen budgets to indicate nitrogen use efficiency
and losses from whole farm systems: A comparison of three methodological approaches. Nutrient Cycling in Agroecosystems 53:259-267.
Weil, R.R., and R.E. Gilker. No Date. Management intensive grazing: environmental impacts
and economic benefits. http://www.enst.umd.edu/files/weilfactsheetdairygrazing.pdf (verified 20 Nov. 2008).
White, S.L., R.E. Sheffield, S.P. Washburn, L.D. King, and J.T. Green, Jr. 2001. Spatial and time
distribution of diary cattle excreta in an intensive pasture system. J. Environ. Qual. 30:2180-2187.
Whitehead, D.C. 1995. Grassland nitrogen. CAB International, Wallingford, United Kingdom. Woodard, K.R., E.C. French, L.A. Sweat, D.A. Graetz, L.E. Sollenberger, B. Macoon, K.M.
Portier, B.L. Wade, S. J. Rymph, G.M. Prine, and H.H. Van Horn. 2002. Nitrogen removal and nitrate leaching for forage systems receiving dairy effluent. J. Environ. Qual. 31:1980-1992.

__________________________ Eason, N., M.L. Cabrera, N. Hill, C. Mackowiak, and K. Roach. To be submitted to Nutrient Cycling in Agroecosystems
15
CHAPTER 3
NITROGEN LOSSES IN TWO PASTURE-BASED DAIRIES ON GEORGIA’S
COASTAL PLAIN (USA)

16
ABSTRACT
Management intensive pasture-based dairies are an alternative to traditional confinement
dairy systems. Pasture-based dairies have lower operating costs, better animal health, and
potentially less environmental impact. The objectives of this project were to estimate seasonal N
losses through (NH3) ammonia volatilization and nitrate (NO3) leaching at two irrigated pasture-
based dairies (Quitman and Wrens farms) located in the Coastal Plain of Georgia. Cup lysimeters
were installed on each soil type to a depth of 1 m to monitor nitrate concentrations, which were
used with water fluxes to estimate amounts of leached nitrate. Ammonia volatilization losses
were measured with a micrometeorological technique that used passive ammonia samplers
replaced every 30 to 60 days. Nitrate leached, expressed as % of applied N, amounted to 12.5 %
at the Quitman farm and 0.3% at the Wrens farm. Larger losses at the Quitman farm were due to
larger water fluxes coupled to larger nitrate concentrations at 1 m. Ammonia volatilization
losses, expressed as % of applied N, amounted to 2% at the Quitman farm and 32% at the Wrens
farm. The larger ammonia losses at the Wrens farm were attributed to surface applied urea
compared to UAN applied through center pivot irrigation at the Quitman farm. Our results
indicate that various N practices can affect the magnitude of NH3 and NO3 leaching losses, but
overall indicate that these pasture-based dairies have losses similar to other grassland systems.

17
INTRODUCTION
Traditional, large-scale dairy farming in the USA has relied on confinement systems to
rear and feed cows during lactation (NRCS, 2007). Most farms import feed from off-site
locations, therefore importing nutrients in the grain onto the farm. Confinement farms may have
limited land contiguous to the area where animal waste is collected, making it difficult to
properly manage nutrients and often leading to on-site nutrient accumulation. Accumulation of
nutrients such as nitrogen (N) and phosphorus in soil poses potential environmental problems
because of the likelihood of contamination of surface runoff and ground waters (Osei et al.,
2000). There is a trend towards increasing pasture use in USA dairies to accommodate the
waste/nutrient distribution as well as providing economical benefits (Johnson, 2002). In a study
with pasture grazing systems, White et al. (2001) found that manure was evenly distributed by
the cows, which reduced manure handling and storage costs. Incorporating grazing into
traditional dairies located in the southeastern USA is a logical management option because the
region’s subtropical climate allows longer growing seasons for forages and nearly 12 months of
grazing (Ball et al., 2002).
Nitrogen cycles between the soil, water, and atmospheric components of the grassland
system at rates which are poorly defined (Rotz et al., 2005). These transformations are
influenced by interactions among biological, chemical, and physical properties of the soil,
climatic conditions, and grazing animals (Jarvis, 1993). Transformations of N in pasture
ecosystems can cause large losses to the atmosphere as ammonia (NH3) gas and to the
groundwater as nitrate (NO3) (Rotz et al., 2005).
Gaseous and leaching losses of N from pastures are not only economically important, but
can pose a threat to the environment. Ammonia losses to the atmosphere may affect aerosol

18
chemistry and acid deposition (Bussink, 1992). Recent studies in Europe show that up to 90% of
the total NH3 burden in the atmosphere originated from agriculture, with livestock wastes as its
major source (Bussink and Oenema, 1998). Nitrate becomes an environmental concern in
groundwater when concentrations exceed USEPA’s drinking water standard of 10 mg N L-1.
Most studies examining N losses in dairies examine systems in which dairy effluent is
surface applied to pastures (e.g. Di et al., 1999; Williamson et al., 1998; Stevens and Logan,
1987; Misselbrook et al., 1996; Woodward et al., 2002). Hence most research on dairy N losses
is not representative of a pasture-based system. Conversely, most research examining N
dynamics in grassland systems have been conducted on dryland systems (e.g. Ball and Ryden,
1984; Jarvis and Ledgard, 2001; Di and Cameron, 2002; Ledgard et al., 1999; Bussink, 1992;
Rotz et al., 2005) and therefore may not be applicable to irrigated pasture systems common to
pasture-based dairies in the southeastern USA. Therefore, the objectives of this study were to: 1)
estimate seasonal N losses via ammonia volatilization, and 2) estimate monthly leached NO3
below a 1-m depth on two pasture-based dairies located in the Coastal Plain of Georgia.
MATERIALS AND METHODS
Farm Characteristics
Two commercial pasture-based dairy farms were chosen as experimental sites for this
study. One farm (hereafter referred to as the Wrens farm) was located in east-central Georgia
near the city of Wrens (Jefferson County). The second farm (hereafter referred to as the
Quitman farm) was located in South Georgia, near the city of Quitman (Brooks County). The
Wrens farm consisted of 124 ha and 500 cross-bred Jersey-Holstein milk cows, whereas the

19
Quitman farm had 114 ha and 450 Jersey-Holstein milk cows. Both farms grew forages under
center pivot irrigation systems that had been divided into paddocks approximately 2.5 ha in size.
The dominant soil at the Wrens farm is an Orangeburg soil series (fine-loamy, Kaolinitic,
thermic Typic Kandiudults) with class 0-3 and 3-7% slope classifications. The dominant soils at
the Quitman farm included Tifton (fine-loam, siliceous, thermic plinthic, argillic Paleudults),
Fuquay (loamy kaolinitic, thermic arenic plinthic Kandiudults), Stilson (loamy sand, Siliceous,
subactive, thermic arenic plinthic Paleudults), and Alapaha series (loamy, siliceous, subactive,
thermic arenic plinthic Paleaquults). The soils at both farms have loamy sand Ap horizons
(approximately 25 cm deep) that transition to sandy clay loam Bt horizons.
Perennial pastures at the Wrens farm were planted to ‘Tifton 85’ bermudagrass (Cynodon
dactylon (L.) Pers. – 16 ha) or ‘Jesup Max Q’ tall fescue (Lolium arundinacea Schreb – 23 ha).
In addition, approximately 59 ha of prepared ground was planted to ‘Tifleaf 3’ pearl millet
(Pennisetum glaucum (L.) R. Br.) in the spring and was later over-seeded with a mixture of
‘Wrens Abruzzi’ cereal rye (Secale cereal (L.) Salisb.) and ‘Feast 2’ annual ryegrass (Lolium
multiflorum Lamarck) in September. Bermudagrass pastures were also over-seeded with cereal
rye. Tall fescue pastures were over-seeded with annual ryegrass in the fall of the year. The forage
system at the Quitman dairy was ‘Tifton 85’ bermudagrass which was over-seeded with ‘Florida
401’ cereal rye and ‘Big Boss’ annual ryegrass in November.
Nitrogen Applications
Nitrogen applications in both farms were made throughout the study period as determined
by the farm manager. Farm records were used to determine times and rates of these applications.
At the Wrens farm, 78% of the N fertilizer was applied in the form of urea with about 22% of the

20
N supplied as poultry litter (134 kg N ha-1). At the Quitman farm, N fertilizer was applied as urea
ammonium nitrate (UAN) solution through the center pivot irrigation system.
Soil Analysis
Soils were sampled with a hydraulic probe in 25-cm increments to a depth of 100 cm in
June 2008 at both farms. Six paddocks at the Wrens farm were sampled at eight randomly
selected locations within each paddock. These paddocks represented the main soil type or pasture
species present on the farm. Four paddocks were sampled in a similar manner at the Quitman
farm, using one paddock for each soil type. Samples from the respective depths within a paddock
were combined, air dried, and ground to pass a 2-mm screen. Soils were analyzed for cation
exchange capacity (CEC) using an unbuffered salt extraction method (Sumner and Miller, 1996).
Total carbon was determined in the top 25 cm of soil by dry combustion (Nelson and Sommers,
1996). A 1:1 ratio of soil and deionized water was used to measure pH with a Cornell pH meter
(model 125, Corning Science Products, Medfield, MA). The pH buffering capacity was
measured using a lime buffer capacity method (Kissel et al., 2007), and particle size analysis was
determined with the pipette method (Gee and Or, 1996).
A second set of undisturbed soil core samples were collected from the different soil
types on each farm to be analyzed for bulk density, hydraulic conductivity (Ks), gravimetric
water content at field capacity ( −0.03 MPa), and wilting point (−1.5 MPa). A soil water
retention curve was also developed using Tempe pressure cells (Soil Moisture Equipment Corp.,
Santa Barbara, California). Saturated hydraulic conductivity was determined with a lab method
in which a Mariotte bottle maintained a constant head of water ponded on the core, while flow
rate measurements were recorded (Booltink and Bouma, 1996). Field capacity and wilting points

21
were determined with a 1.5- MPa ceramic plate extractor (Soil Moisture Equipment Co., Santa
Barbra, Ca) (Dane and Hopmans, 1996). To develop a soil water retention curve, soil cores were
saturated in 0.01M CaCl2, placed into a Tempe pressure cell, and exposed to 1.5, 2.9, 9, 18, 33,
and 75 kPa of pressure (Flint and Flint, 1996). Retained water within the soil core was
determined by weighing each apparatus daily until an equilibrium was reached at a particular
pressure.
Environmental Monitoring
Environmental stations were placed in each soil type (Quitman farm) or forage type (‘Tift
85’ bermudagrass, ‘Jesup Max Q’ tall fescue, and ‘Feast 2’ annual ryegrass (Wrens farm) on the
farms. Three environmental monitoring stations were installed on the Wrens farm and four on
the Quitman farm. Because the soil at the Wrens farm (Orangeburg) was similar across the center
pivot, the stations were placed in the different forage types. Each environmental station included
a data-logger (Model CR206x, Campbell Scientific, Logan, UT), solar panel, rain gauge
(TE525WS-L, Campbell Scientific, Logan, UT), temperature probe (Model 109, Campbell
Scientific, Logan, UT), and three time domain reflectometry (TDR) probes (Model CS 625,
Campbell Scientific, Logan, UT). The three TDR probes were placed 3 m into the paddock from
an electric cross-fence line to measure water content at 0-25, 25-50, and 50-75 cm depths. The
temperature probe was installed at a depth of 10 cm. The data-logger recorded temperature,
rainfall/irrigation, and soil water content data every 15 min.
The TDR soil moisture probes were calibrated by collecting soil from the different depths
at each station location. The soil was ground to pass through a 2-mm screen using a Wiley Mill,
and packed in acrylic boxes (14.6 x 13.97 x 39.37 cm) to the bulk density measured in the field.
22
The TDR probes were inserted horizontally through holes on the side of the box so that they had
5 cm of soil above and below the probes. The soils were saturated with water and the boxes were
placed in a greenhouse, where they were weighed twice daily for several days until a volumetric
water content corresponding to -1.5 MPa (wilting point) was reached. Probe readings were
recorded every hour to establish a mathematical relationship between mV reading and volumetric
water content.
Ammonia Volatilization
Ammonia volatilization was monitored during 15 months at the Wrens Farm and during
13 months at the Quitman farm. Ammonia loss was determined using a passive flux method
(Sommer et al., 1994). Passive flux samplers were installed on masts located on the periphery of
the irrigation pivots (beyond the range of the irrigation water). The masts were installed at
approximately 90° angles from each other, as close to the four cardinal directions as possible.
Passive flux samplers were set at five heights (0.45, 0.75, 1.50, 2.25, and 3.00 m) on the masts
(Leuning et al., 1985). Each passive flux sampler consisted of two glass tubes (each tube 0.7 i.d.
by 10 cm long) connected by a piece of silicone tubing, with a nozzle connected to one of the
tubes via another piece of silicone tubing. The nozzle consisted of a 2.3-cm-long (0.7-cm i.d.)
glass tube with a stainless steel disk glued to it. The steel disk had a 1-mm-diameter hole at the
center of the disk (Schjoerring et al., 1992). The inner surface of the tubes was coated with a 3%
oxalic acid solution in acetone to trap ammonia. Two samplers were placed at each height. One
open-ended tube in one sampler and one nozzle-ended tube in the other sampler faced toward the
field to measure NH3 volatilized from the land area under the center pivot. Similarly, one open-
ended tube and one nozzle-ended tube faced away from the field to measure background NH3.

23
Tubes were changed every 30 to 60 days and brought to the laboratory where they were extracted
with 3 mL of deionized water to dissolve the ammonium oxalate formed as ammonia reacted
with the oxalic acid. The extract was analyzed colorimetrically for NH4 (Mulvaney, 1996) on an
Alpkem auto-analyzer (RFA-300; Alpkem Corp., Clackamas, OR).
At each mast height, the horizontal flux of NH3 from the center pivot through a plane
perpendicular to the longitudinal axis of the sampler was calculated using Equation [1].
Fhz, p = [ (C1 + C2 )V] / (π r2 K∆ t) [1]
where C1 and C2 are the concentrations of NH4–N (µg N mL−1) in the deionized water used to
extract sorbed NH4–N from the two tubes facing toward the field, V is the volume of deionized
water use for extraction (3 mL), r is the radius of the hole in the stainless steel disk (0.5 mm), K
is a correction factor (0.77), and ∆t is the time during which the tubes were exposed (s). Similar
calculations were performed with the NH4 concentration in the two tubes facing away from the
field to estimate the horizontal, background flux of NH3 coming into the pivots (Fhz,b, µg N m−2
s−1) through a plane perpendicular to the longitudinal axis of the sampler. The net horizontal flux
of NH3 derived from the field at each mast height was calculated by subtracting background
fluxes from the fluxes coming from the center pivot.

24
The net vertical flux of NH3 derived from the field (Fv, µg N m−2 s−1) was estimated by
integrating each net horizontal flux, taking into account the vertical distance corresponding to
each mast height using Equation [2].
h=5
Fv = 1/R ∑ ( Fhz,p - Fhz,b ) ∆ h [2]
h=1
where h represents each of the mast heights at which samplers were positioned, R is the radius
from the center pivot, and ∆h (m) is the vertical distance corresponding to each passive sampler
(for any sampler, the distance between the point halfway to the sampler below and the sampler
above it) (Schjoerring et al., 1992). Ammonia losses were expressed in kg N ha-1 per sampling
period.
NO3 Leaching
Five cup lysimeters were installed within 5 m of each of the environmental monitoring
stations. A hydraulic probe was used to remove a soil core slightly longer than 1 m so that a
lysimeter can be placed in the hole. Before placing the lysimeter in the hole, a clay/water slurry
was poured in the bottom of the hole, to ensure contact between the soil and the ceramic cup.
The lysimeter was inserted into the hole so that the cup was at a 1-m depth, and a 3:2
sand:kaolinite mixture was packed around the lysimeter tube to prevent vertical movement of
water along the tube walls. Lysimeters were installed 3 m from one another along an electric
fence-line, and were protected from animal trampling using an electric exclusionary fence. The
lysimeters were placed under a -52 kPa vacuum to collect water samples bi-weekly. The water
samples were analyzed colorimetrically for NO3 on an Alpkem auto-analyzer (Mulvaney, 1996).

25
The results were averaged at each station on a monthly basis for a total period of 15 months at
the Wrens farm and 13 months at the Quitman farm.
Soil water flow model (Hydrus 2-D)
A soil water flow model, Hydrus 2-D (Šimůnek et al., 2006), was used to determine the
flux of water at a 1-m depth, which was the depth at which the lysimeters were collecting
percolating water. Evapotranspiration, rainfall + irrigation, Ks, depth of horizons, texture
analysis, bulk density, and the soil release curve parameters obtained with the Tempe cells were
used in the Hydrus 2-D model to estimate the vertical water flux. The water flux leaving the
bottom of the 1-m profile after each month was used to calculate the potential amount of nitrate
leached by combining it with the nitrate concentration measured in the lysimeters.
RESULTS AND DISCUSSION
Soil Analysis
Analysis of soils on both farms showed characteristics typical of the Coastal Plain region
(Perkins et al., 1986; NRCS, 2009) (Table 3.1). Soils in this region are acidic, with pH typically
ranging from 4.6 to 6.0, becoming more acidic with depth. In all cases, except for the Stilson
soil, the Ks decreased at the 25-50 cm depth. This is likely due to an increase of clay content
beginning at this depth. The Fuquay soil had comparatively higher Ks values, which reflect the
arenic nature of the epipedon. The 0-25 cm horizon of all soils was low in organic matter (<10 g
C kg-1) and low in CEC. Bulk densities also fell in range of well-drained soils found in Coastal
Plain soils.

26
Fertilizer Application
Rates and total amounts of N fertilizer varied among farms. At the Wrens Farm,
application rates ranged from 16 to 55 kg urea-N ha -1 mo -1 (Fig. 3.1), for a total application rate
of 605 kg urea-N ha -1 (Table 3.2). At the Quitman Farm, applications ranged from 14 to 43 kg
UAN-N ha -1 mo-1 (Fig. 3.1), with a total application rate of 320 kg UAN-N ha -1 (Table 3.2).
Ammonia Volatilization
In general, the amount of N lost through ammonia volatilization in each sampling period
was greater at the Wrens farm than at the Quitman farm (Fig. 3.1). The Wrens farm lost as much
as 60 kg N ha-1 in a given period, whereas the Quitman farm did not lose more than 2.7 kg N ha-1
in a sampling period. Overall ammonia losses during the study amounted to 32% of the applied
N at the Wrens farm and 2% of the applied N at the Quitman farm. The higher ammonia loss
from broadcast, granular urea at the Wrens farm is similar to losses found in other studies. In a
two-year study with tall fescue pastures in north Georgia, Vaio et al. (2008) reported average
losses of 25% of the applied N with broadcast, granular urea. Similarly, Sommer and Jensen
(1993) in a study measuring NH3 volatilization from urea and ammoniacal fertilizers applied to
winter wheat and grassland reported NH3 losses of up to 25% of applied N. The smaller NH3 loss
at the Quitman farm than at the Wrens farm may be attributed to the form of N applied (UAN vs.
urea) and the application method used. The Quitman farm applied UAN through the irrigation
system, whereas the Wrens farm broadcast granular urea. By applying the N through the
irrigation system, it is likely that the UAN solution infiltrated deep enough below the soil surface
to prevent significant ammonia losses. In contrast, when granular urea is broadcast, urea
hydrolysis occurs at or near the soil surface, which enhances the potential for NH3 loss.

27
Furthermore, conditions favorable to ammonia loss from urea, such as relative humidity greater
than the critical relative humidity (CRH) for urea (Vaio et al., 2008), and low soil pH buffering
capacities (Table 3.1), were present at the Wrens farm. The low pH buffering capacity of the
soils, which is mainly due to the low organic C content (Weaver et al., 2004), makes the soils
more susceptible to increases in pH caused by urea hydrolysis. As a result, the soil pH in the
vicinity of urea granules can rise well above pH 7, which leads to the formation and subsequent
gaseous loss of ammonia (Mundy, 1995).
Supplemental irrigation can play an important role in the rates of ammonia volatilization
from N fertilizers (Denmead et al., 2004). Mundy (1995) found that adding water to the soil
increased urea-N recovery in a pasture from 79 to 91% with 10 mm, and from 79 to 94% with 50
mm. This effect was probably due to leaching of urea into the soil, thereby reducing NH3 losses.
In a study with NH3 volatilization from nitrogen fertilizers surface-applied to grass pasture,
Oberle and Bundy (1987) indicated that a rainfall/irrigation event must occur within 24 h after
applying urea to prevent significant loss. Thus, applying irrigation immediately after urea
application to a pasture would be expected to incorporate urea into the soil, thereby reducing
ammonia loss. The amount of rain or irrigation required to move urea into the soil in pastures is
not well established (Denmead et al., 2004). Soil water content at the Wrens farm was
maintained between 40 and 80% plant available water in the top 60 cm of soil by irrigation, but it
is unknown how much time elapsed between fertilizer and irrigation applications. From the
large losses of ammonia measured at the Wrens farm, it is likely that irrigation was not applied
soon after urea applications.
Not all ammonia volatilization from pasture ecosystems is derived from the applied N
fertilizers. Ammonia is also lost from N in manure and urine deposited on the surface of the

28
pasture (Eckard et al., 2003), with urine being the larger of these two sources. Bussink (1992)
found ammonia losses equivalent to approximately 8% of the total amount of excreted N.
Furthermore, he found that the larger the amount of N fertilizer applied, the larger the N content
found in cow excreta and the larger the loss of NH3. Given the amount of N applied to the
pastures at the Wrens farm, a significant fraction of the NH3 loss may have been derived from
cow excreta. Additionally, the application of poultry litter at the Wrens farm may have
contributed to the measured ammonia losses (Marshall et al., 2001).
Nitrate Leaching
The maximum nitrate concentration in the cup lysimeters observed at the Wrens farm
was 4.8 mg N L-1 (Fig. 3.2). This occurred in January, when water flux through a 1-m depth was
small (3.14 cm). Large water fluxes were estimated in October/November and March/April, but
nitrate concentrations in those months were low resulting in low amounts of leached NO3 (0 to
0.5 16 kg N ha-1 mo-1; Fig. 3.1). Total nitrate losses for the monitored period (June 2008 to
August 2009) were 1.7 kg N ha-1 (Table 3.2), which correspond to 0.3% of the applied N. Total
water flux at 1-m depth in the monitored period was 55.22 cm, which corresponds to 33% of the
total amount of water (precipitation + irrigation) received.
Nitrate concentrations and water fluxes at a 1-m depth from the soil types at the Quitman
farm (Tifton, Stilson, and Fuquay soils) are presented in Figures 3.3, 3.4, and 3.5. In general,
nitrate concentrations and water fluxes were greater than those for the Wrens farm. Maximum
concentrations ranged from 12 to 27 mg N L-1 with maximum water fluxes as high as 30 cm
month-1. As a result, leached NO3 ranged from 1 to 16 kg N ha-1 mo-1 at the Quitman farm. Total
nitrate leaching losses for the monitored period (August 2008 to August 2009) amounted to 40

29
kg N ha-1, which corresponds to 12.5% of the applied N (Table 3.2). Total water flux at 1-m
depth in the monitored period ranged from 88 to 95 cm in the different soils (Fig. 3.3, 3.4, and
3.5), which represented 44 to 49 % of the total amount of water (precipitation + irrigation)
received. Nitrate concentrations measured at the Quitman farm were similar to those determined
by Pakrou and Dillon (2004) in a study with grazed, unfertilized, irrigated, and non-irrigated
paddocks on sandy loam soils. Mean concentrations in that study ranged from 13 to 17 mg N L-1
for irrigated paddocks, and from 9 to 11 mg N L-1 for non-irrigated paddocks. Their study
suggests that soil moisture and the amount of water that passes through the soil profile are
important factors in NO3 losses.
In a study with grazed pastures on sandy soils, Di and Cameron (2002) estimated that 33
kg N ha-1 yr-1 were expected to be lost through leaching considering urine patches alone. When
up to 400 kg N ha-1 y-1 (split into four applications) were applied on top of paddocks already
affected by urine, a total of 30 to 60 kg N ha-1 yr-1 was leached. These losses (7.5 to 15% of
applied N) are similar to losses observed on the Quitman farm and suggest that multiple
fertilizations may reduce nitrate losses.
Nitrate losses measured at both farms are smaller than those found in other grassland
systems. Jarvis (1993) measured NO3 losses of 200 kg N ha -1 yr -1 from a grassland on well-
drained soils, where 420 kg fertilizer N ha -1 was applied. Ledgard et al. (1999), working on N
inputs and losses for a clover/grass pasture grazed by dairy cows, found NO3 losses of 137 to 204
kg N ha -1 yr -1 with fertilizer inputs of 400 kg N ha -1 yr -1. These results suggest losses of about
50% of the N applied as fertilizer. Korevaar (1992) also found similar results.

30
CONCLUSIONS
The largest loss of N at the Wrens Farm occurred through ammonia volatilization,
whereas the largest loss of N at the Quitman Farm occurred through nitrate leaching. Large
ammonia losses at the Wrens Farm were attributed to the use of granular urea applied on the soil
surface without sufficient immediate irrigation to incorporate the fertilizer. Ammonia losses at
the Quitman farm were relatively small because of the use of UAN through the irrigation system,
which presumably allowed a deeper movement of the fertilizer into the soil. Thus, better
management of the N fertilization at the Wrens farm, either by incorporating urea with irrigation
or using UAN through the irrigation system, may reduce ammonia volatilization losses. With
regard to nitrate leaching, the larger losses at the Quitman farm than at the Wrens Farm were
attributed to larger water fluxes at the 1-m depth coupled with larger nitrate concentrations in the
leachate. Thus, better management of irrigation at the Quitman farm may reduce nitrate leaching
losses. Additional research should be conducted on pasture-based dairies to better understand
their nitrogen cycling and if possible improve their efficiency.

31
REFERENCES
Ball, D.M., C.S. Hoveland, and G.D. Lacefield. 2002. Southern forages; modern concepts for forage crop management. 3rd ed. PPI and FAR., Norcross, Ga.
Ball, P.R., and J.C. Ryden.1984. Nitrogen relationships in intensively managed temperate
grasslands. Plant and Soil 76: 23-33. Booltink, H.W.G., and J. Bouma. 1996. Water retention and storage. p.797-816. In J.H. Dane
and G.C. Topp (ed.) Methods of soil analysis. Part 4. SSSA Book Ser. 5. SSSA, Madison, WI.
Bussink, D.W. 1992. Ammonia volatilization from grassland receiving nitrogen fertilizer and
rotationally grazed by dairy cattle. Fert. Res. 33:257-265. Bussink, D.W., and O. Oenema. 1998. Ammonia volatilization from dairy farming systems in
temperate areas: A review. Nutr. Cycl. Agroecos. 51:19-33. Dane, J.H., and J.W. Hopmans. 1996. Water retention and storage. p. 671–720. In J.H. Dane and
G.C. Topp (ed.) Methods of soil analysis. Part 4. SSSA Book Ser. 5. SSSA, Madison, WI.
Denmead, T., D. Chen, D. Turner, Y. Li, and R.B. Edis. 2004. Micrometerological
measurements of ammonia emissions during phases of the grazing rotation of irrigated pastures. Super Soil 3rd Australian New Zealand Soils Conference. www.regional.org.au/au/asssi/ (verified 10 Dec. 2009).
Di, H.J., and K.C. Cameron. 2002. Nitrate leaching in temperate agroecosystems: sources,
factors and mitigating strategies. Nutr. Cycl. Agroecos. 46: 237-256. Di, H.J., and K.C. Cameron, S. Moore, and N.P. Smith. 1999. Contributions to nitrogen leaching
and pasture uptake by autumn-applied dairy effluent and ammonium fertilizer labeled with 15N isotope. Plant and Soil 210:189-198.
Eckard, R.J., D.Chen, R.E.White, and D.F.Chapman. 2003. Gaseous nitrogen loss from
temperate perennial grass and clover dairy pastures in south-eastern Australia. Aust. J. of Agric. Res. 54:561-570.
Flint, L.E., and A.L. Flint. 1996. Water retention and storage. p. 241-249. In J.H. Dane and G.C.
Topp (ed.) Methods of soil analysis. Part 4. SSSA Book Ser. 5. SSSA, Madison, WI. Gee, G.W., and D. Or. 1996. Particle-size analysis. p. 255–293. In J.H. Dane and G.C. Topp
(ed.) Methods of soil analysis. Part 4. SSSA Book Ser. 5. SSSA, Madison, WI. Jarvis, S.C. 1993. Nitrogen cycling and losses from dairy farms. Soil Use Manage. 9:99-105.

32
Jarvis, S.C., and Ledgard, S. 2002 Ammonia emissions from intensive dairying: a comparison of contrasting systems in the united kingdom and new Zealand. Agric. Ecosyst. Environ. 92:83-92.
Johnson, T. 2002. The economics of grass-based dairying. Livestock Buisness Guide. ATTRA
Publication #IP210. http://attra.ncat.org/attra-pub/PDF/ecodairy.pdf (verified 10 Dec. 2009).
Kissel, D.E., R.A. Isaac, R. Hitchcock, L.S. Sonon, and P.F. Vendrell. 2007. Implementation of
soil lime requirements by a single-addition titration method. Comm. Soil Sci. Plant Anal. 38:1341-1352.
Korevaar, H., 1992. The nitrogen balance on intensive dutch diary farms: a review. Livestock
Production Science 31:17-27. Ledgard, S.F., J.W. Penno, and M.S. Sprosen. 1999. Nitrogen inputs and losses from clover/grass
pastures grazed by dairy cows, as affected by nitrogen fertilizer application. J. Agric. Sci. (Cambridge). 132:215-225.
Leuning, R., J.R. Freney, O.T. Denmead, and J.R. Simpson. 1985. A sampler for
measuring atmospheric ammonia flux. Atmos. Environ. 19:1117–1124.
Marshall, S.B., M.D. Mullen, M.L. Cabrera, C.W. Wood, L.C. Braun, and E.A. Guertal. 2001. Nitrogen budget for fescue pastures fertilized with broiler litter in major land resource areas of the southeastern u.s. Nutr. Cycl. Agroecos. 59:75-83.
Misselbrook, T.H., J.A. Laws, and B.F. Pain. 1996. Surface application and shallow injection of cattle slurry on grassland: nitrogen losses, herbage yields and nitrogen recoveries. Grass Forage Sci. 51: 270-277.
Mulvaney, R.L. 1996. Nitrogen – Inorganic form. pp. 1123-1184. In D.L. Sparks et al. (Ed.).
Methods of soil analysis. Part 3. Chemical Methods. SSSA, ASA, Madison, WI. Mundy, G.N. 1995. Effect of soil initial water content and application of water on urea applied to
pasture. Aust. J. Agric. Res. 46:821-830. Nelson, E.W., and L.E. Sommers. 1996. Total carbon, organic carbon, and organic matter. p.
961–1010. In D.L. Sparks (ed.) Methods of soil analysis. Part 3. SSSA Book Ser. 5. SSSA, Madison, WI.
NRCS. 2007. Profitable grazing-based dairy systems. Range and Pasture Technical Note No.1. ftp://ftp-fc.sc.egov.usda.gov/GLTI/technical/publications/tn_rp_1_a.pdf (verified 5 Apr.
2010). NRCS. 2009. Soil web survey. http://websoilsurvey.nrcs.usda.gov/app/WebSoilSurvey.aspx
(verified 10 Dec. 2009).

33
Oberle, S.L, and L.G. Bundy. 1987. Ammonia volatilization from nitrogen fertilizers surface-applied to corn (Zea mays) and grass pasture (Dactylis glomerata). Biol. Fertil. Soils 4:185-192.
Osei E., P.W. Gassman, R.D. Jones, S.J. Pratt, L.M. Hauck, L.J. Beran, W.D. Rosenthal, and J.R.
Williams. 2000. Economic and environmental impacts of alternative practices on dairy farms in an agricultural watershed. J. Soil Water Conserv. 55 (4):466-472.
Pakrou, N., and P.J. Dillon. 2004. Leaching losses of N under grazed irrigated and non-irrigated
pastures. J. Agric. Sci. (Cambridge). 142:503-516 Perkins, H.F., J.E. Hook, and N.W. Barbour. 1986. Soil characteristics of selected areas of the
coastal plain experiment station and ABAC research farms. Research Bulletin 346. Rotz, C.A., F. Taube, M.P. Russelle, J. Oenema, M.A. Sanderson, and M. Wachendorf. 2005.
Whole-farm perspectives of nutrient flows in grassland agriculture. Crop Sci. 45:2139-2159.
Schjoerring, J.K., S.G. Sommer, and M. Ferm. 1992. A simple passive sampler for measuring
ammonia emission in the field. Water, Air, and Soil Pollution. 62:13-24. Šimůnek, J., M.Th. Van Genuchten, and M. Šejna. 2006. The HYDRUS software package for
simulating two- and three-dimensional movement of water, heat, and multiple solutes in variably-saturated media. Version 1.0, Technical manual. PC Progress, Prague, Czech Republic.
Sommer, S.G., and C. Jensen. 1994. Ammonia volatilization from urea and ammoniacal
fertilizers surface applied to winter wheat and grassland. Fert. Res. 37: 85-92. Stevens, R.J., and H.J. Logan. 1987. Determination of the volatilization of ammonia from
surface-applied cattle slurry by the micrometeorological mass balance method. J. Agric. Sci. (Cambridge) 109:205-207.
Sumner, M.E., and W.P. Miller. 1996. Cation exchange capacity and exchange
coefficients. p. 1201–1229. In D.L. Sparks (ed.) Methods of soil analysis. Part 3. SSSA Book Ser. 5. SSSA, Madison, WI.
Vaio, V., and M.L. Cabrera. 2008. Ammonia volatilization from urea-based fertilizers applied to
tall tall fescue pastures in Georgia, USA. Soil Sci. Soc. Am. J. 72:1665-1671. Weaver, A.R., D.E. Kissel, F. Chen, L.T. West, W. Adkins, D. Rickman, and J.C. Luvall. 2004.
Mapping soil pH buffering capacity of selected fields in the coastal plain. Soil Sci. Soc. Am. J. 68:662-668.

34
White, S.L., R.E. Sheffield, S.P. Washburn, L.D. King, and J.T. Green, Jr. 2001. Spatial and time distribution of diary cattle excreta in an intensive pasture system. J. Environ. Qual. 30:2180-2187.
Williamson, J.C., M.D. Taylor, R.S. Torrens, and M. Vojvodic-Vukovic. 1997. Reducing
nitrogen leaching from dairy farm effluent-irrigated pasture using dicyandiamide: a lysimeter study. Agric. Ecosyst. Environ. 69: 81-88
Woodard, K.R., E.C. French, L.A. Sweat, D.A. Graetz, L.E. Sollenberger, B. Macoon, K.M.
Portier, B.L. Wade, S.J. Rymph, G.M. Prine, and H.H. Van Horn. 2002. Plant and environmental interactions; nitrogen removal and nitrate leaching for forage systems receiving dairy effluent. J.Environ.Qual. 31:1980-1992.

35
Table 3.1. Soil chemical and physical properties for the two pasture-based dairy farms monitored
in this study.
Wrens Farm Quitman Farm Depth (cm) Soil Characteristic
Orangeburg
Tifton
Fuquay
Stilson 0-25 mmol H+kg-1 (pH unit)-1 2.9 3.3 2.6 3.3
pH 6.2 5.9 6.3 5.7 Ks (cm/hr) 0.25 0.74 2.20 0.39 Total C (g/kg) 6.8 - 8.9 6.7 6.1 7.6 CEC (cmolc/kg) 1.3 2.0 2.1 1.8 Bulk Density (g/cm3) 1.6 1.7 1.5 1.5 Wilting Point (cm3/cm3) 0.027 0.014 0.017 0.021 Field Capacity (cm3/cm3) 0.187 0.192 0.123 0.133 Sand (%) 79.5-88.6 79.5 90.9 92.5
Silt (%) 9.1-14.5 13.8 6.1 4.8 Clay (%) 2.3-6.8 6.8 3.0 2.7
25-50 mmol H+ kg-1 (pH unit)-1 3.8 4.9 3.4 2.4 pH 5.7 5.7 6.1 5.4 Ks (cm/hr) 0.22 0.17 1.03 0.51 CEC (cmolc/kg) 0.9 1.6 1.8 0.9 Bulk Density (g/cm3) 1.7 1.7 1.5 1.5 Wilting Point (cm3/cm3) 0.049 0.034 0.034 0.049 Field Capacity (cm3/cm3) 0.303 0.226 0.208 0.241 Sand (%) 70.6-83.4 70.9 84.0 84.1 Silt (%) 10.6-15.4 15.4 5.1 10.1 Clay (%) 9.2-16.7 13.7 10.9 5.9
50-75 mmol H+ kg-1 (pH unit)-1 3.9 4.6 4.3 3.8 pH 5.5 5.0 4.9 4.6 CEC (cmolc/kg) 1.2 2.2 2.7 1.7 Bulk Density (g/cm3) 1.7 1.6 1.5 1.5 Wilting Point (cm3/cm3) 0.050 0.064 0.070 0.073 Field Capacity (cm3/cm3) 0.330 0.280 0.278 0.276 Sand (%) 64.0-76.7 64.2 66.6 80.6 Silt (%) 9.0-12.4 10.4 8.3 5.4 Clay (%) 14.3-26.1 25.4 25.0 13.9
75 + mmol H+ kg-1 (pH unit)-1 4.1 4.9 4.0 4.4 pH 5.6 5.2 5.1 4.8 CEC (cmolc/kg) 1.3 2.1 2.4 2.1 Sand (%) 43.4-67.3 50.0 67.3 74.4 Silt (%) 6.7-10.3 10.1 4.5 5.8 Clay (%) 27.2-39.8 39.9 28.1 19.8

36
Table 3.2. Summary of total fertilizer N applied and losses associated with the sampling period
at Wrens (1 Jun 2008-31 Aug 2009) and Quitman (1 Aug 2008-31 Aug 2009) Farms
† Fertilizer N = Urea ‡ Fertilizer N = UAN
N Fertilizer Applied
Poultry Litter N
Ammonia Volatilized
Nitrate Leached
---------- kg N ha-1 (% of Total N applied) -----------
Wrens Farm †
605 134 196 (32) 1.7 (0.3)
Quitman Farm ‡
320 0 7 (2) 40.4 (12.5)

37
Volatilized NH3 in each
time period (kg N ha-1 )
0
20
40
60
80
NO3 leached
per month (kg N ha-1 )
0
5
10
15
N applied in
each month (kg N ha-1 )
0
20
40
60
80
Jun Oct Feb Jun
Air temperature (o C)
-10
0
10
20
30
2008 2009
Wrens Farm
Precipitation +
Irrigation (cm)
0
50
100
150
Quitman Farm
2008 2009
a)
b)
c)
d)
Aug Dec Apr Aug
Fig. 3.1. Ammonia volatilization (a), nitrate leaching (b), fertilizer-N applied (c), and air
temperature and precipitation (d) at each farm during sampling periods in 2008 and 2009.

38
c)
NO3 Concentration (mg N L-1)
Jul Nov Mar Jul
0
2
4
6
8
10
12
14
Monthly Rainfall +
Irrigation (cm)
0
5
10
15
20
25
FluxMonthly Rainfall
Monthly H2O flux
from soil 1 m profile (-cm)
VWC (cm
3 /cm
3 )
0.0
0.1
0.2
0.3
0.4
0.5
0-25 cm 25-50 cm 50-75 cm
0
1
2
3
4
5a)
b)
Orangeburg Soil
2008 2009
Fig. 3.2. Nitrate concentrations in 1-m cup lysimeters (a), water flux at 1-m depth (b), and
volumetric water content at 0-25, 25-50, and 50-75 cm in the Orangeburg soil on the Wrens
farm.

39
0
5
10
15
20
Monthly Rainfall +
Irrigation (cm)
0
5
10
15
20
25
30
35
Fluxmonthly rainfall
0
5
10
15
Tifton SoilNO3 Concentration (mg L-1 )
Monthly H2O flux
from soil 1 m profile (-cm)
Jul Nov Mar Jul
VWC (cm
3 /cm
3 )
0.0
0.1
0.2
0.3
0.40-25 cm25-50 cm50-75 cm
a)
b)
c)
2008 2009
Fig. 3.3. Nitrate concentrations in 1-m cup lysimeters (a), water flux at 1-m depth (b), and
volumetric water content at 0-25, 25-50, and 50-75 cm in the Tifton soil on the Quitman farm.

40
a)
b)
c)0
5
10
15
20
25
Monthly Rainfall +
Irrigation (cm)
0
5
10
15
20
25
30
35
FluxMonthly Rainfall
0
2
4
6
8
10
12
Stilson SoilNO3 Concentration (mg L-1 )
Monthly H2O flux
from soil 1 m profile (-cm)
Jul Nov Mar Jul
VWC (cm
3 /cm
3 )
0.0
0.1
0.2
0.3
0.4
0.50-25 cm25-50 cm50-75 cm
a)
b)
c)
2008 2009
Fig. 3.4. Nitrate concentrations in 1-m cup lysimeters (a), water flux at 1 m (b), and volumetric
water content at0-25, 25-50, and 50-75 cm in the Stilson soil on the Quitman farm.

41
a)
b)
c)0
10
20
30
Monthly Rainfall +
Irrigation (cm)
0
5
10
15
20
25
30
35
FluxMonthly Rainfall
0
5
10
15
20
25
Fuquay SoilNO3 Concentration (mg L-1 )
MonthlyH2O flux
from soil 1 m profile (-cm)
Jul Nov Mar Jul
VWC (cm
3 /cm
3 )
0.0
0.1
0.2
0.3
0.4
0-25 cm25-50 cm50-75 cm
2008 2009
Fig. 3.5. Nitrate concentrations in 1-m cup lysimeters (a), water flux at 1 m (b), and volumetric
water content at 0-25, 25-50, and 50-75 cm in the Fuquay soil on the Quitman farm.

___________________________ Eason, N., M.L. Cabrera, N. Hill, C. Mackowiak, and K. Roach. To be submitted to Nutrient Cycling in Agroecosystems
42
CHAPTER 4
FARM-GATE N BALANCES FOR TWO PASTURE-BASED
DAIRIES IN GEORGIA, USA

43
ABSTRACT
Management intensive pasture-based dairies are an alternative to traditional confinement
dairy systems in the southeastern USA. The objective of this study was to develop a one-year,
farm-gate N balance for two pasture-based dairies (Wrens and Quitman farms) located in the
Coastal Plain of Georgia, USA. Nitrogen inputs were obtained from farm records and included
fertilizer N applied, N in feed, hay, and silage imported to the farm. Nitrogen outputs included
export of N in milk, nitrate leaching (NO3), ammonia volatilization NH3), and nitrous oxide
(N2O) emission. Cup lysimeters placed at 1-m depth were used to monitor NO3 concentrations,
and NO3 leaching was calculated from modeled water fluxes. Ammonia volatilization losses
were measured with a micrometeorological technique using passive ammonia samplers. Nitrous
oxide emissions were measured using closed chambers in the field. Nitrate leached, expressed as
% of total N inputs, amounted to 5.3 % at the Quitman farm and 0.3% at the Wrens farm. In
contrast, NH3 volatilization losses amounted to 0.9% at the Quitman farm and 30.2% at the
Wrens farm. The larger NH3 losses at the Wrens farm were attributed to surface applied urea
compared to UAN applied through center pivot irrigation at the Quitman farm. Both farms had
large surpluses of N, which was probably immobilized N. Total N inputs did not differ much
between farms, but the form and management of N inputs affected losses and surpluses in each
farm. Overall our results indicate that these pasture-based dairies have losses similar to other
grassland systems.

44
INTRODUCTION
The number of pasture-based dairies is increasing in the Coastal Plain region of Georgia
(USA) as an alternative to traditional confinement dairy systems. Pasture-based dairies rely on an
intensive system of pasture management and utilization (Ledgard et al., 1999). Consequently,
proper utilization of nutrients on these farms is vital to operational efficiency, profitability, and
environmental impacts (Jarvis, 1993). Nitrogen fertilizer is the largest costs for these pasture-
based dairies. Therefore, losses of N from these systems may have severe economic as well as
environmental consequences. Jarvis (1993) stated that N in grasslands can be lost through NH3
volatilization, NO3 leaching, and N2O emitted from different biophysical components of the
system. A perspective of the relative importance of the forms of N losses in a pasture-based dairy
can be gained using a farm-gate balance approach because it takes into account inputs and
outputs from the farm. According to Nevans et al. (2006), farm-gate balances tend to be much
simpler and have less uncertainties and unknowns in comparison to a particular soil-based
balance. Furthermore, farm-gate balances are indicators of how a particular nutrient is moving
through a system and can serve as a guideline for improving nutrient management.
Most studies on farm-gate balances have been conducted in Australia, New Zealand, and
some European countries (e.g., Watson and Atkinson, 1999; Ball and Ryden, 1984; Ledgard et
al., 1999; Ledgard, 2001; Humphreys et al., 2008; Nevans et al., 2005; Eckard et al., 2007,
Korevaar, 1992). While those studies are useful to structure a farm-gate balance and to obtain
estimates of expected N losses, data from those studies cannot be extrapolated to southeastern
U.S. pasture-based dairies because of differences in soils and climatic conditions. Therefore, the
objective of this study was to develop farm-gate N balances for two pasture-based dairies located
in the Coastal Plain of Georgia, USA.

45
MATERIALS AND METHODS
Farm Characteristics
Two commercial pasture-based dairy farms were chosen as experimental sites for this
study. One farm was located in east-central Georgia approximately 5 km west of the city of
Wrens (Wrens farm); the second farm was located in South Georgia, approximately 25 km south
of the city of Quitman (Quitman farm). The Wrens farm consisted of 124 ha and 500 cross-bred
Jersey-Holstein milk cows, whereas the Quitman farm had 114 ha and 450 Jersey-Holstein milk
cows. Both farms grew forages under center pivot irrigation systems, which were divided into
paddocks approximately 2.5 ha in size. The dominant soil at the Wrens farm is an Orangeburg
soil series (fine-loamy, Kaolinitic, thermic Typic Kandiudults) with class 0-3 and 3-7% slope
classifications. The dominant soils at the Quitman farm include Tifton (fine-loam, siliceous,
thermic Plinthic, Argillic), Fuquay (loamy kaolinitic, thermic arenic plinthic Kandiudults),
Stilson (loamy sand, Siliceous, subactive, thermic arenic plinthic Paleudults), and Alapaha series
(loamy, siliceous, subactive, thermic arenic plinthic Paleaquults). Soils at both farms are loamy
sand in the Ap horizon (25 cm) and change to sandy clay loam in the Bt horizon.
Perennial pastures at the Wrens farm were planted to ‘Tifton 85’ bermudagrass (16 ha)
(Cynodon dactylon (L.) Pers.) or ‘Jesup Max Q’ tall fescue (Lolium arundinacea Schreb), (23
ha). Approximately 59 ha of prepared ground was planted to ‘Tifleaf 3’ pearl millet (Pennisetum
glaucum (L.) R. Br.) in the spring and over seeded with a mixture of ‘Wrens Abruzzi’ cereal rye
(Secale cereal (L.) Salisb.) and ‘Feast 2’ annual ryegrass (Lolium multiflorum Lamarck) in
September. Bermudagrass pastures were also over-seeded with cereal ryegrass. Tall fescue
pastures were over-seeded with annual ryegrass in the fall of the year. The forage system at the

46
Quitman dairy was ‘Tifton 85’ bermudagrass which was over seeded with ‘Florida 401’ cereal
rye and ‘Big Boss’ annual ryegrass in November. At the Wrens farm, N fertilizer was broadcast
in the form of granular urea with a minor amount supplied as chicken litter (134 kg ha-1). At the
Quitman farm, N was applied as urea ammonium nitrate (UAN) through the center pivot
irrigation system.
Nitrogen Balance
The farm-gate N balance considered three main N sources as inputs on the farm: a)
nitrogen fertilizer, b) N imported forages (corn silage and hay), and c) imported grain feed.
Outputs of N from the farms included: a) NH3 volatilization, b) N2O emissions, c) NO3 leaching,
and d) milk N export. Inputs that were not considered in the balance were atmospheric N
deposition and N fixation by legumes. Atmospheric deposition was not considered because it
usually contributes very little to overall inputs (Ball and Ryden, 1984). Nitrogen fixation by
legumes was not taken into account because legumes were not a significant component of the
forage species on either farm. Output of N in the meat of culled animals was not taken into
account because very few cows were culled during the study. The farm-gate N balance (surplus)
was calculated as inputs minus outputs (Fig. 4.1).
Soil Sampling
Soils were sampled with a hydraulic probe in 25-cm increments to a depth of 100 cm in
June 2008 and August 2009 at both farms. Six paddocks at the Wrens farm were sampled at eight
randomly selected locations within each paddock. These paddocks represented the main soil type
or pasture species present on the farm. Four paddocks were sampled in a similar manner at the

47
Quitman farm, one paddock for each soil type. Samples from the respective depths in each
paddock were combined, air dried, and ground to pass a 2-mm screen using a Wiley mill. Soils
were extracted for NO3 and NH4 and analyzed colorimetrically on an Alpkem auto-analyzer
(Mulvaney, 1996).
Managed Inputs and Outputs
Farm Records
Farm records were used to determine N inputs and outputs that were a direct result of
farm management. Records from the Wrens farm provided the following information: a) number
of milk cows grazing in a given week and weekly grazing rotational period, b) weekly estimates
of forage dry matter (DM) in each paddock, c) average amount of feed (hay or grain) given to
milk cows in the milking parlor on a weekly basis, d) amount of fertilizer N applied on the farm,
and e) daily export of milk. Records from the Quitman provided monthly estimates of a) grain
and hay feed, b) milk export, and c) amounts of UAN fertilizer applied. To estimate N contents
(kg N) of feed, forage, and milk, crude protein values were divided by constants (6.25 for
forage, 6.25 for hay, 5.7 for grain, 6.38 for milk) to obtain percent N, which was then multiplied
by quantities of each source. Crude protein was obtained from farm records for milk, from
laboratory analysis for forages, and from book values for hay and corn silage.

48
Outputs in Environmental Losses
NH3 Volatilization
Ammonia volatilization was measured using a micrometeorological passive flux sampler
method (Sommer et al., 1994). Samples were collected every 30 to 60 days as described in
Chapter 3. Ammonia volatilization was measured from the areas under two center pivot
irrigation systems on the Wrens farm and from under one center pivot on the Quitman farm.
Ammonia losses were expressed as a monthly loss (kg N ha-1) by proportionally allocating the
amount of ammonia volatilized in a given sampling period to the days corresponding to each
month included in that particular period. At the Wrens farm, the rate of loss (kg N ha-1 mo-1) for
each pivot was then multiplied by the area under each pivot and the results added to obtain total
monthly losses from the pivots. At this farm, 21 ha were not a part of the two pivots which were
monitored for NH3 losses, but because that land was treated similarly to the pivots, an average
volatilization rate was calculated between the two pivots and was multiplied by 21 ha to obtain
additional losses from that area. At the Quitman farm, volatilization was measured from only one
pivot, so the rate of loss from that pivot was multiplied by the total area of the farm to obtain
total losses. Grazed areas that were not under the monitored pivot were treated similarly as the
grassland under the pivot.

49
Nitrous Oxide Emissions
Nitrous oxide is emitted from cattle urine and manure by microbial metabolism of the N
sources found in each (Luo et al., 2008). Depending upon the N source, the rate and extent of
N2O emissions vary. To account for the differences based upon the N source (urine vs. manure),
a field study was carried out on the Wrens farm. Before conducting the field study, a preliminary
laboratory experiment was carried out to determine an approximate sampling regime to be used
in the field. Air dried soil was packed to field bulk density into 18 closed-ended PVC chambers
(16-cm I.D. x 15.5 cm height). Two replicates of each treatment (manure, urine, and control)
were placed in incubators at 15, 25, or 35oC for two weeks. Manure and urine treatments
received surface applications of 159 g of fresh bovine manure and 88 mL of bovine urine,
respectively. Every day for 1 h, the chambers were capped with PVC caps equipped with septa
for gas sampling. A 3-mL sample was withdrawn with a hypodermic needle and syringe at time
zero and after 1 h. The cap was removed and the same procedure was repeated daily for two
weeks. From that study, it was determined that a suitable sampling regime for the field study
was to take gas samples on the 0, 2, 4, 7, 10, and 14 days after manure or urine application. Two
14-d sampling periods during the summer of 2009 (starting on 15th, June 2009 and on 13th, July
2009) were used for the field study. Chambers were installed (in a paddock that had been grazed
the previous day) in a grid pattern with six rows (blocks) spaced approximately 6 m from each
other, and three chambers spaced approximately 6 m within each row. The chambers were
inserted 7.75 cm into the ground while leaving 7.5 cm for headspace (in addition, 3 cm from the
cap). Three treatments: urine, manure, and a control were randomly assigned in each of six
blocks. Manure treatments received 400 g fresh manure (870 g H2O kg-1, 53.76 g N m2) and
urine treatments received 88 mL of urine (9.4 g N m2). The same sampling method used in the

50
lab was used in the field, but with the new sampling regime. Samples were analyzed with a
Varian gas chromatograph (STAR 3600 CX, Palo Alto, CA) for N2O and CO2 concentrations.
Nitrous oxide and CO2 concentrations at each sampling were integrated with time using the
trapezoidal rule to estimate total emissions in 14 days (Table 4.3). The first study was carried at a
relatively low WFPS (18 to 20%), whereas the second study was conducted at a relatively high
water-filled pore space (WFPS) (30 to 60%). Therefore, the total N2O emission in 14 d from
each study was used to develop a moisture correction factor (MF) based on WFPS:
MF (0-1) = 1-0.0183*(Average WFPS during 14-day) [1]
A correction factor (TF) based on average temperature during 14 d (oC) was calculated as
follows (Li et al., 1992):
TF (0-1) = 2((Avg. 14 day soil temp-28.7)/10) [2]
Dataloggers (Model CR206X, Campbell Scientific, Inc., Logan, UT) connected to time domain
reflectometry sensors (CS625) and temperature probes (Model 109) were used to record soil
water content and temperature every 15 min in the upper 25 cm of soil at three locations in the
Wrens farm and at four locations at the Quitman farm. Fourteen-day (estimated rotational time)
averages of soil water content and temperature were combined with the total emission measured
(kg N ha-1 in 14 d) from each of the treatments (manure, urine, control) in the first study, to
calculate a corrected emission every 14 d throughout the year for each of the treatments:
Corrected N2O emission in 14-d (kg N ha-1) = Measured kg N ha-114 d x TF x MF [3]
To scale the N2O emissions to a whole-farm scale, we calculated the percent area of each
hectare that was affected by urine and manure by taking into account that 250 cows grazed a
paddock in half a day, and by assuming an average manure patch affects 0.12 m2 and an average
urine patch affects 0.36 m2 (White et al., 2001). The total emission of N2O from a given hectare

51
was estimated by using the corrected emission rates during 14 d for areas affected by manure and
urine, as well as for areas not affected by the cattle excretions, and multiplying them by the
corresponding percentages of a hectare affected by the different treatments. Assuming an
average rotation period of 14 d, each hectare on the farm was grazed by cattle every 14 d.. These
calculations were carried out for the Wrens farm, which was where the field study on N2O
emission was carried out. Nitrous oxide emissions for the Quitman farm were not calculated.
Nitrate Leaching
Nitrate leaching was measured using five cup lysimeters (representing one station) placed
on each soil type on each farm. Each cup lysimeter was 1 m in length and was installed 3 m from
one another along an electric fence-line to protect them from the cows. The lysimeters were
placed under a -52 kPa of vacuum with water samples collected bi-weekly and analyzed
colorimetrically for NO3 on an Alpkem auto-analyzer (Mulvaney, 1996). The results were
expressed in kg N ha-1mo-1. Because the Wrens farm had only the Orangeburg soil type, NO3
losses were estimated by calculating the average loss from three lysimeter stations and
multiplying it by the total number of hectares on the farm. Because the Quitman farm had
multiple soil types, losses calculated with each soil type were multiplied by the estimated area
occupied by that soil on the farm (NRCS, 2009). The NO3 losses were then added together for a
total loss from the farm.

52
RESULTS AND DISCUSSION
Managed Inputs and Outputs
Managed inputs included fertilizer, grain, corn silage, and hay used. Rates and total
amounts of N fertilizer varied between farms. At the Wrens Farm, monthly N application rates
ranged from 16 to 55 kg N ha -1 (Fig. 4.4) for a total yearly rate of 491 kg N ha -1 (Table 4.1). At
the Quitman Farm, monthly N applications ranged from 14 to 43 kg N ha -1 (Fig. 4.4), for a
comparatively smaller yearly rate of 297 kg N ha -1 (Table 4.1). Consequently, fertilizer N as %
of total N inputs represented 79% at the Wrens farm and 41% at the Quitman farm. The smaller
rate of N fertilizer applied at the Quitman farm was in part counterbalanced by a larger rate of N
input in the form of grain feed (383 kg N ha-1 versus 97 kg N ha-1 at the Wrens farm). Grain feed
as % of total N inputs represented 16% at the Wrens farm and 53% at the Quitman farm. Thus,
grain feed and fertilizer N accounted for most of the N input on both farms (95% at the Wrens
farm and 94% at the Quitman farm). Hay and silage made up the rest of the N inputs (Table 4.1).
Monthly N exported in milk ranged from 574 to1,526 kg N ha -1 for the Wrens farm, and
from 405 to 956 kg N ha -1 for the Quitman farm (data not shown). Total exported N in milk as a
percentage of total N inputs was 15.8% for the Wrens farm and 17.1% for the Quitman farm
(Table 4.1). Thus, both farms used similar proportions of the input N to produce milk. Ledgard et
al. (1999) found that milk export averaged 20% of the total N inputs. Eckard et al. (2007) along
with studies reported by Rotz et al. (2005) found higher milk exports ranging from 27 to 30% of
the N inputs. Different concentrates, supplements, forage type and quality, and dietary
management are likely key contributors to these differences.

53
Outputs in Environmental Losses
N2O Emissions
In the field study carried out at the Wrens farm, N2O emissions followed distinct patterns
for each of the treatments. Emissions were greater from chambers containing urine and manure
than from control chambers (Fig. 4.2 and 4.3), with the larger rates of emissions occurring within
the first 2 days after application. Although urine and manure emission rates peaked between 4
and 5 mg N2O m2 hr -1, overall emission rates remained at a lower rate for the majority of the
study period. Luo et al. (2008) also saw emissions reach a maximum 1 to 14 days after grazing,
thereafter returning to pre-grazing emission rates. Carbon dioxide emissions were greater for the
manure treatment than from the urine or control treatments for two days following application,
but were not different from the control treatments thereafter. Between days 7 and 10, CO2
emission was smaller from the urine treatment than from the manure or control treatment.
Estimating the total loss of N2O-N over two weeks for a grazed paddock resulted in 1.78 and
0.78 kg N ha-1 for Studies 1 and 2, respectively. In both studies, total N2O emission was greater
from urine and manure treatments than from control treatments (Table 4.2). Furthermore, in the
second study, emission from urine was greater than emission from manure. This may have been
due to more anaerobic conditions created by the manure application, as indicated by a greater
emission of CO2. Carter (2007) suggests that nitrification and denitrification seem to contribute
equally to the N2O production in urine-affected soil. This could relate to the intermediate soil
water content of about 45% WFPS, which would allow both processes to occur simultaneously.
Many studies have found good correlation between N2O emission rates and water WFPS
(e.g. Carter, 2007; Luo et al., 2008; Koops et al., 1997; Vinther, 2005). The second study in this

54
experiment had lower overall emissions, but a higher WFPS, which may have been due to the
fact that under wetter conditions a larger proportion of the emitted N is converted to N2 gas
rather than to N2O (Vinther, 2005; Carter, 2007). In addition, an increase in WFPS would
decrease nitrification, decreasing N2O emissions. Because the studies were located in different
paddocks, it is possible that different soil characteristics, such as pH, bulk density, etc. could
have played a role in the different results of both studies. Turner et al. (2008) studied the
variability of N2O emissions on an irrigated dairy pasture, and concluded that, in addition to
WFPS, topography, and NO3 concentrations seemed to be the most influential factors.
Topography indirectly affects N2O emissions because the soil physical properties, structure, and
water status effect the soil environment for denitrifying microorganisms.
Of the total inputs of N on the Wrens farm, N2O represented a 2.65% loss from the
system (3.36% of the total applied fertilizer), with estimated monthly losses ranging from 0.52 to
3.13 kg N ha -1 (Table 4.1). This represented a loss of 16.5 kg N ha -1 for the year. Ledgard et al.
(1999) found annual losses of 15 to 30 kg N ha -1 on a farm receiving 400 kg N ha -1 with a
stocking density of 4.4 cows ha-1. Eckard et al. (2003) found N2O losses ranging between 13 and
15 kg N ha -1 yr-1on a temperate perennial grass and clover dairy pasture receiving 200 kg N ha -1
yr-1. Thus, our results seem to parallel other N2O studies with similar conditions. Compared to
other outputs in the N balance, N2O was second to least of the outputs from the system. Eckard et
al. (2003) suggest better use of N management practices could significantly reduce N2O
emissions; however, from the point of view of N use efficiency it seems that one would focus on
management practices relevant to outputs with the highest losses of N.

55
NH3 Volatilization
Monthly ammonia losses ranged from 0.5 to 41.6 kg N ha -1 at the Wrens farm, and from
0.1 to 1.5 kg N ha -1 at the Quitman farm (Fig. 4.5). When expressed as percentage of the total N
inputs, total ammonia loss was 30.2% at the Wrens farm and 0.9% at the Quitman farm (Table
4.1). Greater losses at the Wrens farm were likely due to the use of surface applied granular urea,
in contrast to the Quitman farm, which used UAN solution through the irrigation system. The
poultry litter that was applied to the Wrens farm may have also been a cause of the higher losses
of NH3 (Marshall et al., 2001). In research with surface-applied urea to fescue pastures in
Georgia, Vaio et al. (2008) found losses of ammonia as high as 46% of applied N. In a summary
of NH3 volatilization results from many grazing dairy studies located in the UK, Europe, New
Zealand, Netherlands, and Australia, Denmead et al. (2004) found a range of 25 to 60 kg NH3-N
ha -1. Eckard et al. (2007) reported NH3 emissions ranging from 45 to 74 kg N ha -1 yr-1 on
pasture-based dairies receiving 200 kg N ha -1 yr-1. Similar losses were also found in other studies
(Eckard et al., 2003; Ledgard, 2001). Average temperature and relative humidity for the state of
Georgia (USA) and for countries with comparable ammonia studies can be found in Table 4.2. In
general, Georgia’s higher temperatures and relative humidity would be expected to results in
larger NH3 volatilization fluxes under intensive grazing conditions.
NO3 Leaching Losses
Monthly nitrate losses ranged from 0 to 0.5 kg N ha -1 for the Wrens farm and from 0 to
15.5 kg N ha -1 for the Quitman farm (Fig. 4.6). Annual losses were estimated at 1.6 kg N ha -1 for
the Wrens farm and at 38.3 kg N ha -1 for the Quitman farm (Table 4.1), which correspond to
0.3% and 5.3% of total N inputs, respectively. Larger water fluxes from the soil profiles, paired

56
with significant NO3 concentrations were the driving factors for NO3 losses on both farms
(Chapter 3). Nitrate concentrations were highest on both farms between December and April.
Although water fluxes during those months were not consistently high, losses from these months
were still the main contributors to NO3 loss, with March and April being the highest. These
elevated concentrations of NO3 during the winter were expected and is explained by slower plant
growth during the winter, and lower relative efficiency of N uptake by plants. Typically cool-
season forages have shallower root depths compared to warm season forages (Ball et al., 2002).
This coupled with higher rainfall during these months may leach NO3 past the rooting zone. The
Quitman farm also received 40 cm (irrigation and precipitation) more than the Wrens Farm
during the year. It is interesting to note that although N fertilization at the Wrens farm was not
reduced during winter, NO3 leaching losses were low during winter. Studies on pasture-based
dairies with similar fertilizer applications and stocking rates as the ones on this study found
nitrate leaching losses ranging from 3 to 50% of the total N applied (e.g. Eckard et al., 2004;
Eckard et al., 2007; Jarvis, 1993; Ledgard et al., 1999). Variability among studies can be
attributed to differences in the soil type, climate, and timing of N application. Yearly and
seasonal variations in weather patterns make management decisions for N applications difficult
for farmers. Eckard et al. (2004) suggest that during low drainage years, NO3-N may accumulate
in the soil profile, contributing to higher losses in subsequent higher drainage years. To account
for build-up of N in the soil, Ball et al. (2002) suggest frequent soil testing to optimize forage
growth and N efficiency.

57
Nitrogen Surplus
The N balances from both farms resulted in a surplus of unaccounted for N. Surplus N
found on the Wrens farm was 318 kg N ha -1yr-1 or 52% of the total input N. On the Quitman
farm, surplus N was 559 kg N ha -1 or 77% of total N inputs (Table 4.1). Similar results were
found by Nevans et al. (2006) in a compilation of data from intensively managed dairy farms
across Europe. Their results showed N balance surpluses (input N – output N) of 378 and 238 kg
N ha -1 in two separate studies.
Nitrogen surplus may include N in animals exported from the farm (culled cows and bull
calves), increases in soil inorganic N, N losses in surface runoff, and N immobilized in organic
fractions. Nitrogen amounts in animals exported from the farm and N losses in runoff were not
estimated, but were probably small. Increases in inorganic N could not account for N surpluses
because in both farms the amount of inorganic N in the soil decreased during the study. At the
Wrens farm, the area-weighted inorganic N changed from 98 kg N ha-1 in the initial sampling to
55 kg N ha-1 in the final sampling, for an average loss of 43 kg N ha-1. Similarly, at the Quitman
farm, the area-weighted inorganic N changed from 65 kg N ha-1 in the initial sampling to 56 kg
N ha-1 in the final sampling, for an average loss of 9 kg N ha-1 (Table 4.4). Therefore,
immobilized N was the main suspected source of unaccounted N.
Studies in Denmark, discussed in Korevaar (1992), found that 85% of the N that entered
the farm was lost to the system or accumulated in the soil. Ledgard et al. (1999) suggested that
16 to 30% of the added N could be immobilized into the soil as organic N after one year of N
applications. Furthermore, the authors suggested that eventually much of the N immobilized
would be mineralized in later years and be available to plants until these processes in the N cycle
reached some type of equilibrium. Nevans et al. (2006) omitted net mineralization from their N

58
balance because they assumed that mineralized soil N is replaced by immobilized N from newly
added organic material (mainly through the input of manure). While most research agrees that
this soil N steady-state assumption exists, Ball and Ryden (1984) describe it as being asymptotic;
the time it takes the system to reach this equilibrium is unknown (Ball and Ryden, 1984; Jarvis,
1993; Ledgard et al., 1999; Watson and Atkinson, 1999). Thus, it would be likely to see higher
rates of immobilization in the first few years of a pasture-based dairy than in later years. The two
farms in the current study were less than two years old; therefore a relatively high percentage of
N inputs being immobilized is possible. Because of the complexity of nitrogen cycling,
understanding key controlling processes of mineralization/immobilization in grassland systems
continues to be a difficult challenge (Ledgard, 2001; and Rotz et al., 2005). Further research into
N cycling on these farms is warranted in order to understand the role of developing/developed
pools of immobilized N on mineralized N over time.
CONCLUSIONS
Although both farms were operated as management intensive pasture-based dairies, there
were differences in farm management. Total N inputs into each farm were similar, but the
sources were different. Nitrogen fertilizer represented 79% of total N inputs at the Wrens farm,
but only 41% of N inputs at the Quitman farm. In contrast, grain feed N as percentage of total N
inputs was 16% for the Wrens farm and 53% for the Quitman farm. Nitrogen in milk exports was
similar in both farms (16 to 17% of N inputs), but NH3 loss was much larger at the Wrens farm
(30% of N inputs) than at the Quitman farm (<1%). These differences in volatilized NH3 were
due to the type and method of fertilizer N used. Whereas the Wrens farm used surface-applied,
granular urea, the Quitman farm used UAN solution applied through the irrigation system. As a

59
result of the large differences in NH3 losses, surplus N was greater at the Quitman (77% of N
inputs) than at the Wrens farm (52% of N inputs). Most of the surplus N was probably
immobilized in the soil, or present in the form of undecomposed fecal matter. Our results show
that environmental and soil conditions as well as management practices play important roles in
the transfer of N on these intensively grazed systems. Additional research should be carried out
on the individual processes of N transfer in these systems to better identify the forms in which
surplus N is present.

60
REFERENCES
Ball, D.M., C.S. Hoveland, and G.D. Lacefield. 2002. Southern forages; modern concepts for
forage crop management. 3rd ed. PPI and FAR., Norcross, Ga. Ball, P.R., and J.C. Ryden.1984. Nitrogen relationships in intensively managed temperate
grasslands. Plant Soil. 76: 23-33. Carter, M.S. 2007. Contribution of nitrification and denitrification to N2O emissions from urine
patches. Soil Biol. Biochem. 39:2091-2102. Denmead, T., D. Chen, D. Turner, Y. Li, R.B. Edis. 2004. Micrometerological measurements of
ammonia emissions during phases of the grazing rotation of irrigated pastures. Super Soil 3rd Australian New Zealand Soils Conference. www.regional.org.au/au/asssi/ (verified 10 Dec. 2009).
Eckard, R.J., D.Chen, R.E.White, and D.F.Chapman. 2003. Gaseous nitrogen loss from
temperate perennial grass and clover dairy pastures in south-eastern Australia. Aust. J. of Agric. Res. 54:561-570.
Eckard, R.J., D.F. Chapman, and R.E. White. 2007. Nitrogen balances in temperate perennial
grass and clover dairy pastures in south-eastern Australia. Aust. J. of Agric. Res. 58:1167-1173.
Eckard, R.J., R.E. White, R. Edis, A. Smith, and D.F. Chapman. 2004. Nitrate leaching from
temperate perennial pastures grazed by dairy cows in south-eastern Australia. Aust. J. of Agric. Res. 55:911-920.
Humphreys, J., K. O’Connell and I.A. Casey. 2008. Nitrogen flows and balances in four
grassland-based systems of dairy production on a clay-loam soil in a moist temperate climate. Grass and Forage Sci. 63:467-480.
Jarvis, S.C. 1993. Nitrogen cycling and losses from dairy farms. Soil Use Manage. 9:99-105. Koops, J.G., M.L. van Beusichem, and O. Oenema. 1997. Nitrous oxide production, its source
and distribution in urine patches on grassland on peat soil. Plant Soil. 191:57-65. Korevaar, H. 1992. The nitrogen balance on intensive dutch diary farms: a review. Livestock
Production Science 31:17-27. Ledgard, S.F. 2001 Nitrogen cycling in low input legume-based agriculture, with emphasis on
legume/grass pastures. Plant Soil. 228:43-59.

61
Ledgard, S.F., J.W. Penno, and M.S. Sprosen. 1999. Nitrogen inputs and losses from clover/grass pastures grazed by dairy cows, as affected by nitrogen fertilizer application. J. Agric. Sci. (Cambridge). 132:215-225.
Li, C., S. Frolking, and T. A. Frolking. 1992. A model of nitrous oxide evolution from soil
driven by rainfall events: 1. model structure and sensitivity, J. Geophys. Res. 97(D9): 9759–9776.
Luo, J., S.F. Ledgard, C.A.M. de Klein, S.B. Lindsey, and M. Kear. 2008. Effects of dairy
farming intensification on nitrous oxide emissions. Plant Soil. 309:227-237. Marshall, S. B., M.D. Mullen, M.L. Cabrera, C.W.Wood, L.C. Braun, and E.A. Guertal. 2001
Nitrogen budget for fescue pastures fertilized with broiler litter in major land resource areas of the southeastern us. Nutr. Cycl. Agroecos. 59:75-83.
Mulvaney, R.L. 1996. Nitrogen – Inorganic form. pp. 1123-1184. In D.L. Sparks et al. (Ed.).
Methods of soil analysis. Part 3. Chemical Methods. SSSA, ASA, Madison, WI. Nevans, F., I. Verbruggen, D. Reheul, and G. Hofman. 2006. Farm gate nitrogen surpluses and
nitrogen use efficiency of specialized dairy farms in flanders: evolution and future goals. Agric. Syst. 88:142-155.
NRCS. 2009. Soil web survey. http://websoilsurvey.nrcs.usda.gov/app/WebSoilSurvey.aspx
(verified 10 Dec. 2009). Rotz, C.A., F. Taube, M.P. Russelle, J. Oenema, M.A. Sanderson, and M. Wachendorf. 2005.
Whole-farm perspectives of nutrient flows in grassland agriculture. Crop Sci. 45:2139-2159.
Sommer, S.G., and C. Jensen. 1994. Ammonia volatilization from urea and ammoniacal
fertilizers surface applied to winter wheat and grassland. Fert. Res. 37: 85-92. Turner, D.A., D. Chen, I.E. Galbally, R. Leuning, R.B. Edis, Y. Li, K. Kelly, and F. Phillips.
2008 Spatial variability of nitrous oxide emissions from an Australian irrigated pasture. Plant Soil 309:77-88.
Vaio, V., and M.L. Cabrera. 2008. Ammonia volatilization from urea-based fertilizers applied to
tall tall fescue pastures in Georgia, USA. Soil Sci. Soc. Am. J. 72:1665-1671. Vinther, F.P. 2005. A simple empirical model for quantification of N2O emission and
denitrification. http://orgprints.org/5759/ (verified 10 Dec. 2009). Watson, C.A., and D. Atkinson. 1999. Using nitrogen budgest to indicate nitrogen uses
efficiency and losses from whole farm systems: a comparison of three methodological approaches. Nutr. Cycl. Agroecos. 53:259-267.

62
White, S.L., R.E. Sheffield, S.P. Washburn, L.D. King, and J.T. Green, Jr. 2001. Spatial and time distribution of diary cattle excreta in an intensive pasture system. J. Environ. Qual. 30:2180-2187.

63
Table 4.1. Farm-gate N balances for Wrens and Quitman farms.
Wrens Farm Quitman Farm Wrens farm Quitman Farm
------------kg N yr-1 ----------- % of Total N input
N input
Mineral Fertilizer 60,395 33,807 78.9 40.7
Grain Feed 11,959 43,680 15.6 52.6
Maize Silage 1,224 0 1.6 0
Hay 3,011 5,587 3.9 6.7
Total Inputs 76,589 83,074 100 100
N output
Milk 12,066 14,218 15.8 17.1
N2O emission 2,032 N/A 2.7 N/A
NH3 volatilization 23,104 746 30.2 0.9
NO3 Leached 205 4,364 0.3 5.3
Total Outputs 37,407 19,328 48 23
N surplus 39,185 63,746 52 77

64
Table 4.2. Ranges in average yearly temperature and relative humidity for Georgia (USA) and
other locations with studies on pasture-based dairies.
Location Temperature (oC) Relative Humidity (%)
UK 2-13 70-85
Netherlands (-1)-22 67-88
New Zealand 5-20 67-78
Australia 0-28 35-64
Denmark (-3)-22 68-88
USA, Georgia 7.2-32 48-93
http://www.watkinshire.co.uk/assets/File/uk-weather-average-data.pdf (UK weather cite)
http://www.climatetemp.info/new-zealand/ NZ

65
Table 4.3. Mean N2O emissions from manure, urine and, control treatments from a 14-day study
at the Wrens farm in 2009.
N2O-N CO2-C
Treatment kg N ha-1 (14 d)-1 kg C ha-1 (14 d)-1
----------------Study 1-----------------
Manure 4.4 a 1231 a
Urine 4.3 a 913 b
Control 1.7 b 1372 a
----------------Study 2------------------
Manure 3.7 b 1991 a
Urine 5.7 a 1250 b
Control 0.7 c 1465 b
* Within a column, means followed by the same letter are not significantly different according to Fisher’s protected LSD at a 0.05 probability level.
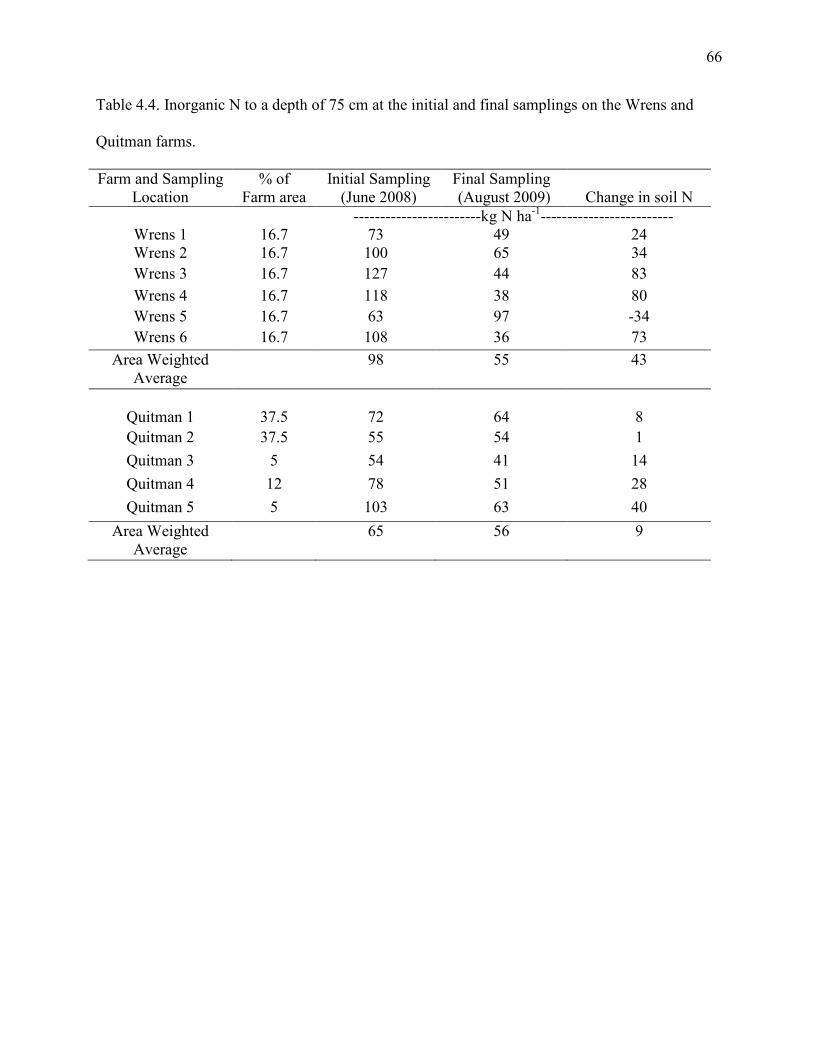
66
Table 4.4. Inorganic N to a depth of 75 cm at the initial and final samplings on the Wrens and
Quitman farms.
Farm and Sampling Location
% of Farm area
Initial Sampling (June 2008)
Final Sampling (August 2009)
Change in soil N
------------------------kg N ha-1------------------------- Wrens 1 16.7 73 49 24 Wrens 2 16.7 100 65 34 Wrens 3 16.7 127 44 83 Wrens 4 16.7 118 38 80 Wrens 5 16.7 63 97 -34 Wrens 6 16.7 108 36 73
Area Weighted Average
98 55 43
Quitman 1 37.5 72 64 8 Quitman 2 37.5 55 54 1 Quitman 3 5 54 41 14 Quitman 4 12 78 51 28 Quitman 5 5 103 63 40
Area Weighted Average
65 56 9

67
Fig. 4.1. Farm-gate balance: nitrogen inputs and outputs used.

68
CO2-C (mg m2 hr-1)
0
500
1000
1500Control Manure Urine a
b
c
ab
b b
c
aa
a
a
N2O-N (mg m2 hr-1)
0
1
2
3
4
5
6
Control Manure Urine
b
b
b
c
a
a
a
ab
ab
Days after application
0 2 4 6 8 10 12 14
Soil Temperature (o C)
26
28
30
32
WFPS (%)
15
16
17
18
19
20Soil TemperatureWFPS
Fig. 4.2. Nitrous oxide and CO2 emissions, soil temperature, and water-filled pore space of the
upper 10 cm during the first N2O study on the Wrens farm.

69
N2O-N (mg m2 h-1 )
0
1
2
3
4
5
6
ControlManureUrine
Days after application
0 2 4 6 8 10 12 14
Soil Temperature (o C)
26
27
28
29
30
31
WFPS (%)
30
40
50
60
Soil TemperatureWFPS
CO2-C (mg m2 h-1 )
0
500
1000
1500 Control Manure Urine
a
aa
a
a
abb
b
b
b
c
a
aa
a
bbb
a
b
Fig. 4.3. Nitrous oxide and CO2 emissions, soil temperature, and water-filled pore space of the
upper 10 cm during the second N2O study on the Wrens farm.

70
Aug Dec Apr Aug
kg of Urea-N ha-1
0
20
40
60
kg of UAN-N ha-1
0
20
40
60
Quitman Farm
Wrens Farm
2008 2009
Fig. 4.4. Monthly amounts of N fertilizer applied on the Quitman and Wrens farms.

71
0
10
20
30
40
NH3 Volatilized per month (kg N ha-1 )
Quitman Farm
Aug Dec Apr Aug 0
10
20
30
40Wrens Farm
2008 2009
Fig. 4.5. Monthly amounts of NH3 volatilized on the Quitman and Wrens farms.

72
0
2
4
6
8
10
12
14
16
Aug Dec Apr Aug 0
2
4
6
8
10
12
14
16
NO3 Leached per month (kg N ha-1 )
Quitman Farm
Wrens Farm
2008 2009
Fig. 4.6. Monthly amounts of NO3 leached on the Quitman and Wrens farms.

73
CHAPTER 5
SUMMARY AND CONCLUSIONS
Management intensive pasture-based dairies are now being viewed as an alternative to
traditional confinement systems. Grass-based dairies have lower operating costs, better animal
health, and potentially less environmental impact. The objectives of this research were to 1)
estimate seasonal N losses through ammonia volatilization and nitrate leaching for two irrigated
pasture-based dairies (Quitman and Wrens farms) located in the Coastal Plains of Georgia, and
2) develop a farm-gate, N balance for each farm. Overall ammonia losses amounted to 32% of
the applied N at the Wrens farm and 2% of the applied N at the Quitman farm. Large ammonia
losses at the Wrens Farm were attributed to the use of granular urea applied on the soil surface
without sufficient immediate irrigation to incorporate the fertilizer. Ammonia losses at the
Quitman farm were relatively small because of the use of UAN through the irrigation system,
which presumably allowed a deeper movement of the fertilizer into the soil. Nitrate losses
corresponded to 0.3% of applied N at the Wrens farm and 12.5% of applied N at the Quitman
farm. The larger losses at the Quitman farm were due to larger water fluxes at the 1-m depth
coupled with larger nitrate concentrations in the leachate. The N balance developed for each
farm showed that although total N inputs into each farm were similar, the sources were different.
Nitrogen fertilizer represented 79% of total N inputs at the Wrens farm, but only 41% of N
inputs at the Quitman farm. In contrast, grain feed N as percentage of total N inputs was 16% for
the Wrens farm and 53% for the Quitman farm. Nitrogen in milk exports was similar in both

74
farms (16 to 17% of N inputs). As a result of the large differences in NH3 losses between farms,
surplus N (Inputs-Outputs) was greater at the Quitman (77% of N inputs) than at the Wrens farm
(52% of N inputs). Most of the surplus N was probably immobilized in the soil, or present in the
form of undecomposed fecal matter. These results show that environmental and soil conditions
as well as management practices play important roles in the transfer of N on these intensively
grazed systems. Additional research should be carried out on the individual processes of N
transfer in these systems to better identify the forms in which surplus N is present.