development of a high-output grazing system for dairy farms
TRANSCRIPT

Development of a High-Output Grazing System for Dairy Farms
Animal Feed Manufactures Association Conference
Sun City
South Africa
March 2020
Associate Professor Finbar Mulligan
School of Veterinary Medicine
University College Dublin
Ireland
Development of a High-Output Grazing System for Dairy Farms
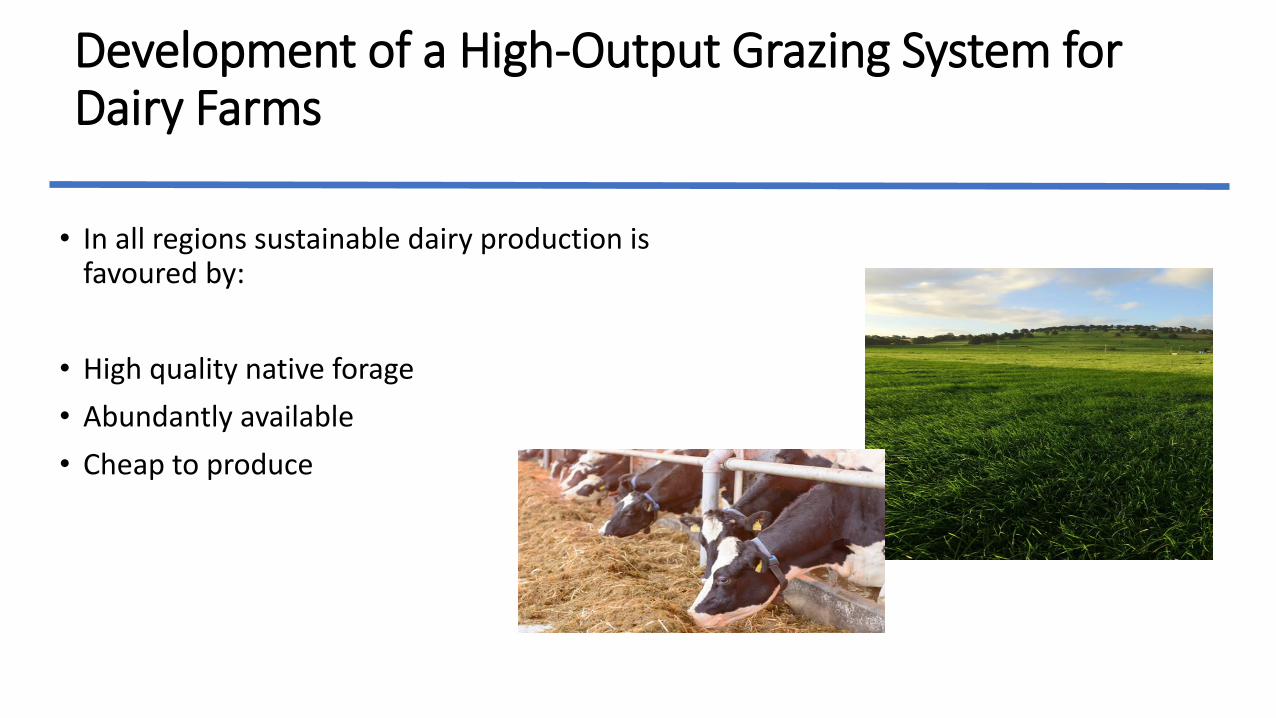
• In all regions sustainable dairy production is favoured by:
• High quality native forage
• Abundantly available
• Cheap to produce

Development of a High-Output Grazing System for Dairy Farms
• In grazing regions
• Ability to grow abundant high quality fresh herbage
• Feed budget for the year based on primarily on grazed and conserved grass
• Grazing means a lower requirement for housing for most of the year
• Grazing means a lower labour requirement for feed preparation

Development of a High-Output Grazing System for Dairy Farms
• Irish Dairy Production
• The predominant system is grass-based
• Grazing for 280 days +
• 80% + of the diet is from grazed or conserved grass
• Compact seasonal calving at the start of the grazing season
• Low concentrate input
• Milk solids production (fat and protein) on average 380 kg per cow
• Milk production approx 5,500kg of milk on average

Development of a High-Output Grazing System for Dairy Farms
• Grazing systems that have developed
• Based on low output per cow
• Avid cost control
• Relatively high stocking rates
• High profitability is possible

Development of a High-Output Grazing System for Dairy Farms
• Farmer Profitability is One Consideration
• Environmental sustainability
• Animal welfare
• Food quality and safety
• Farm family life style

• Milk quota removed 2015
• Food Harvest 2020: Grow food exports to €12 billion by 2020
• Increase in milk output by 50% (7-8% in the EU)
• Food Wise 2025: Increase the value of agri food exports by 85% to €19bn
• Increase the value of primary production by 65% to €10bn
• Extra 23,000 jobs in the agri food sector by 2025
Finbar Mulligan
Development of a High-Output Grazing System for Dairy Farms
Development of a High-Output Grazing System for Dairy Farms
• Reasons to consider a grazing system based on high output per cow
• Since Dec 2010: Dairy cow numbers in Ireland have increased by approx. 40%
• Environmental concerns:
• Increasing animal numbers and methane emissions
• Increasing animals numbers and ammonia emissions
• Increasing animals numbers an N load to inland waters
• Continuance of derogation from Nitrates directive

Development of a High-Output Grazing System for Dairy Farms
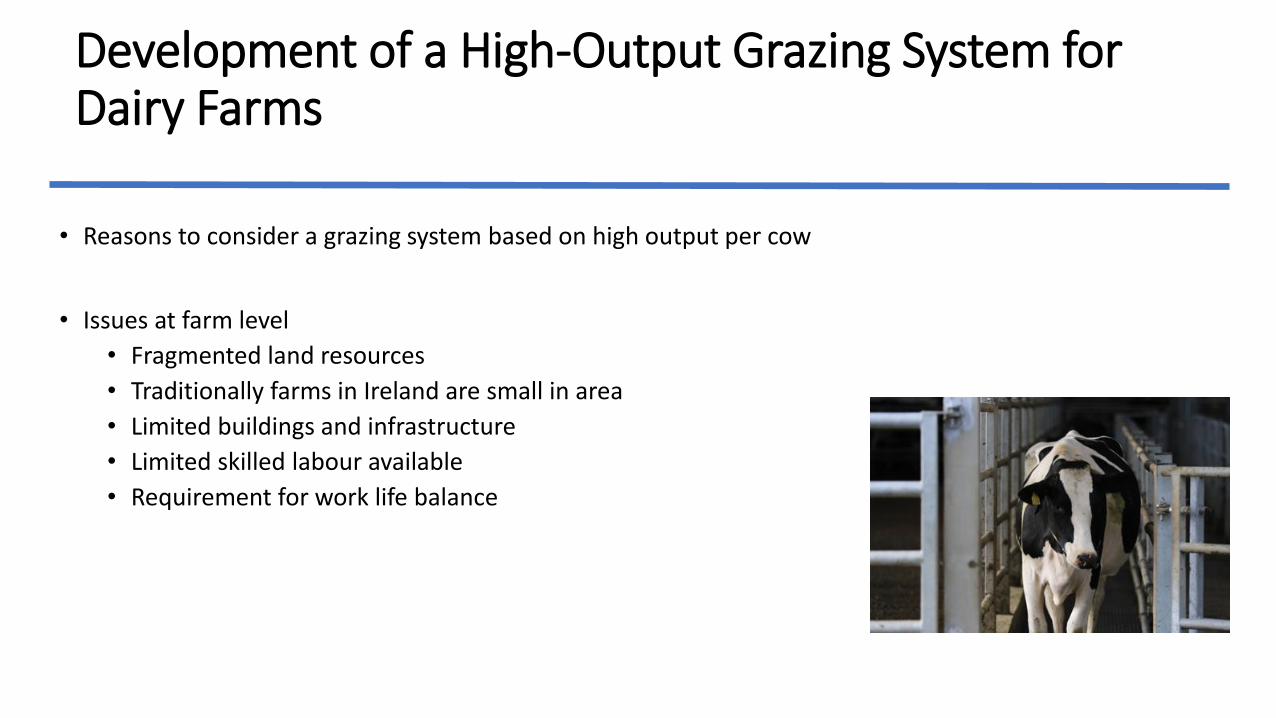
• Reasons to consider a grazing system based on high output per cow
• Issues at farm level
• Fragmented land resources
• Traditionally farms in Ireland are small in area
• Limited buildings and infrastructure
• Limited skilled labour available
• Requirement for work life balance

Aims
• To incorporate the most recent advances in grassland management for dairy farms into a high-output system
• Use a type of dairy cow that has good genetic indices for both milk production and fertility
• Employ the best practices from nutrition research and dairy cow husbandry

A high-output grass-based spring milk production system can be profitable when built on a foundation of good grassland management and meeting performance targets and has a
place in a sustainable Irish dairy industry
Grassland Management Genetics
Nutrition & Husbandry
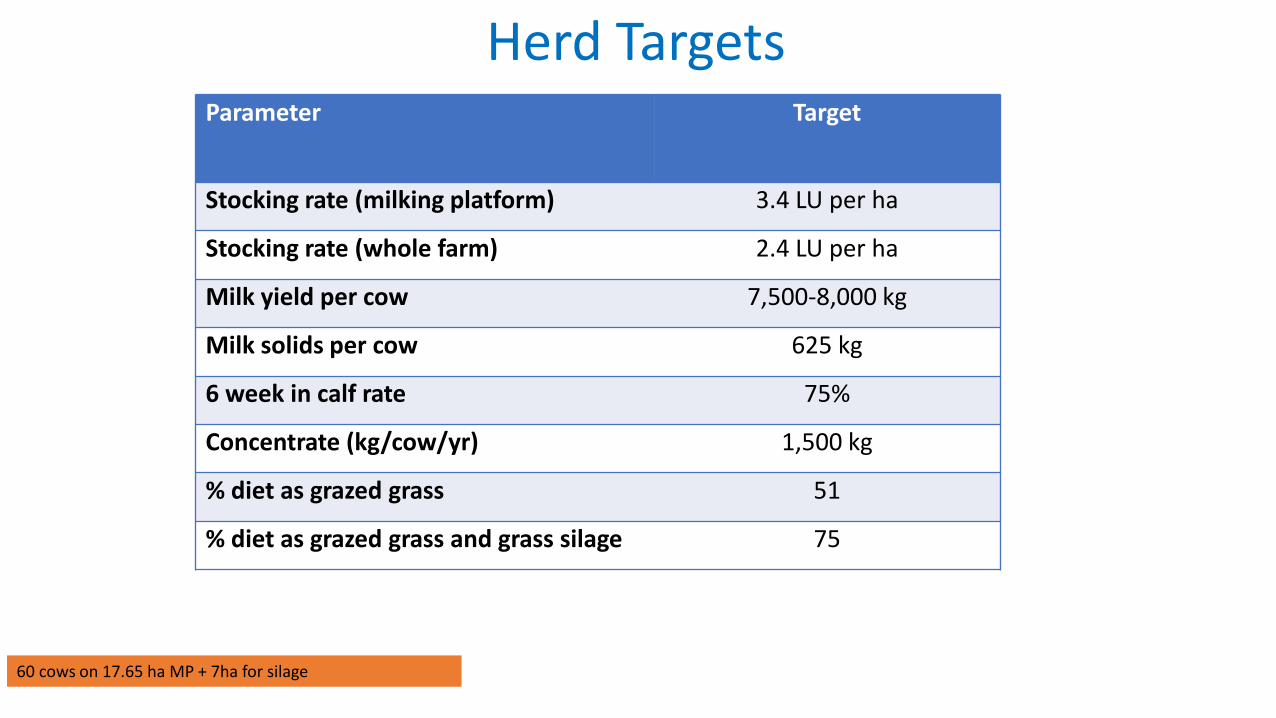
Herd TargetsParameter Target
Stocking rate (milking platform) 3.4 LU per ha
Stocking rate (whole farm) 2.4 LU per ha
Milk yield per cow 7,500-8,000 kg
Milk solids per cow 625 kg
6 week in calf rate 75%
Concentrate (kg/cow/yr) 1,500 kg
% diet as grazed grass 51
% diet as grazed grass and grass silage 75
60 cows on 17.65 ha MP + 7ha for silage

Economic Breeding Index (ICBF: Ireland)

Average genetic merit of the herd*
EBI Milk Fert Calv Milk kg Fat kg Prot kg Fat% Prot%
2016 208 72 101 35.2 195 14.2 11.3 0.1 0.1
Rank 1% 1% 10% 1% 20% 1% 5% 10% 10%
2017 154 58 58 37.5 150 12.5 8.8 0.1 0.1
Rank 1% 1% 10% 1% 10% 1% 1% 10% 10%
2018 161 56 61 42.1 78 10.5 6.9 0.1 0.1
Rank 1% 5% 10% 1% 40% 5% 10% 10% 5%
*Based on the January evaluations each year

Herd Profile - 2019• 58 dairy cows
✓ High EBI (Economic Breeding Index)
✓ Balanced ratio of Production Sub-Index and Fertility Sub-Index
✓ Positive for Milk kg (PTA)
✓ Genomically tested
EBI (€) Milk (€) Fert (€) Calv (€) Beef (€) Maint (€) Health (€) Mgt (€)
177 66 63 42 -9 6 5 4
Milk (kg) Fat (kg) Prot. (kg) Fat (%) Prot. (%) Calv int. (days) Surv (%)
131 12 8.9 0.11 0.07 -2.88 1.99
Top 1% Top 1% Top 10%
Top 10%

Grassland management
• Grass is measured in every paddock on a Monday morning with a plate meter
• Three conventional grassland management tools are used throughout the grazing season (1st February – 21st November) to manage grass demand and supply:
• 60:40 Autumn planner;
• Spring rotation planner;
• Grass wedge
• Baled silage used to manage surplus/quality
• Topping where necessary
Grass is the corner stone of the system!
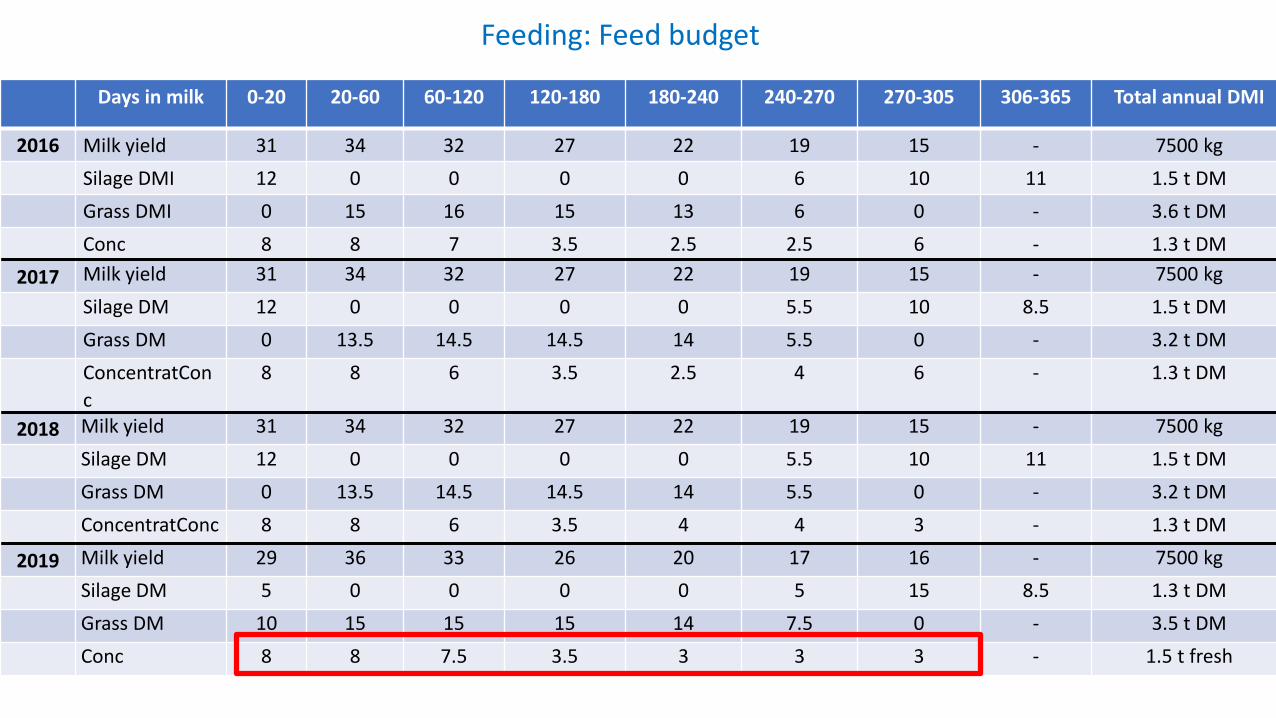
Feeding: Feed budget
Days in milk 0-20 20-60 60-120 120-180 180-240 240-270 270-305 306-365 Total annual DMI
2016 Milk yield 31 34 32 27 22 19 15 - 7500 kg
Silage DMI 12 0 0 0 0 6 10 11 1.5 t DM
Grass DMI 0 15 16 15 13 6 0 - 3.6 t DM
Conc 8 8 7 3.5 2.5 2.5 6 - 1.3 t DM
2017 Milk yield 31 34 32 27 22 19 15 - 7500 kg
Silage DM 12 0 0 0 0 5.5 10 8.5 1.5 t DM
Grass DM 0 13.5 14.5 14.5 14 5.5 0 - 3.2 t DM
ConcentratCon
c
8 8 6 3.5 2.5 4 6 - 1.3 t DM
2018 Milk yield 31 34 32 27 22 19 15 - 7500 kg
Silage DM 12 0 0 0 0 5.5 10 11 1.5 t DM
Grass DM 0 13.5 14.5 14.5 14 5.5 0 - 3.2 t DM
ConcentratConc 8 8 6 3.5 4 4 3 - 1.3 t DM
2019 Milk yield 29 36 33 26 20 17 16 - 7500 kg
Silage DM 5 0 0 0 0 5 15 8.5 1.3 t DM
Grass DM 10 15 15 15 14 7.5 0 - 3.5 t DM
Conc 8 8 7.5 3.5 3 3 3 - 1.5 t fresh

Lyons farm compound 2017 (15% Protein)
• 22.5% Maize grain (ground)• 22.5% Barley (rolled)• 15% Maize distillers grains• 10% Unmolassed beet pulp• 10% Soya hulls• 10% Soyabean meal• 1.5% Fat• 4.5% Molasses
• From September • Soyabean meal increased to lift protein to 18%
Results: UCD Lyons Herd Performance 2016-2019

Parameter Target 2016 2017 2018
Average lactation days 305 301 305 305
Yield/cow (305d) 7,750 7,441 7,548 6,680
Milk solids/cow (305d) 625 592 602 558
Yield/cow (actual) 7,750 7,407 7,466 6,790
Milk solids/cow (actual) 625 588 595 544
Milk solids/ha MP (actual) 2,125 1,940 2,023 1,850
Milk solids/ha Whole Farm
(actual)
1,500 1,294 1,428 1,306
Herd Performance

Results: Milk production (kg/cow/day)
10
15
20
25
30
35
28-Jan 28-Feb 31-Mar 30-Apr 31-May 30-Jun 31-Jul 31-Aug 30-Sep 31-Oct 30-Nov 31-Dec
kg/c
ow
/day
2016 2017 2018

1
1,5
2
2,5
3
28-Jan 28-Feb 31-Mar 30-Apr 31-May 30-Jun 31-Jul 31-Aug 30-Sep 31-Oct 30-Nov 31-Dec
kg/c
ow
/day
2016 2017 2018
Results: Milk solids (kg/cow/day)
Drought Snow
2018: The worst snow event in 40yrs and the worst drought in 40yrs, in the same year

Parameter Target 2016 2017 2018 2019
Average lactation days 305 301 305 305 305
Yield/cow (305d) 7,750 7,441 7,548 6,680 7521
Milk solids/cow (305d) 625 592 602 558 600
Yield/cow (actual) 7,750 7,407 7,466 6,790 7,378
Milk solids/cow (actual) 625 588 595 544 586
Milk solids/ha MP (actual) 2,125 1,940 2,023 1,850 1,939
Milk solids/ha Whole Farm
(actual)
1,500 1,294 1,428 1,306 1,377
Herd Performance

Development of a High-Output Grazing System for Dairy Farms
• Breeding• All cows pre-breeding exam
• All breeding AI (approx 12 weeks)
• Once daily AI (2016 and 2017), 2 x Daily 2018 on
• Heat detection automated and scratch cards

Reproductive Performance
2016 2017 2018 2019
Number of Cows 58 59 60 (55
submitted)
58 (56
submitted)Submission Rate % 91 90 96 95
First Service Conception Rate % 43 50 69 64
6-week Pregnancy Rate % 59 54 83 79
Resultant 6 week calving down rate the
following year
83%
(23% 1st
lactation)
85%
(28% 1st
lactation)
90%
(23% 1st
lactation)
-
Empty Rate % (all cows) 9 (12 wks) 15 (13 wks) 13 (12 wks) 12% (11 wks)

2016-2019 Grassland performance
Parameter 2016 2017 2018
Grass grown kg/ha 13,060 14,000 11,700
Silage on MP (kg/ha) 1,710 2,000 1,410
Herbage utilized kg/ha 11,417 12,200 10,030
Grazed Grass utilized/ha 9,707 10,200 8,620
Grazed Grass utilized/cow 2,942 3,000 2,535
Milk from forage (kgs) 4,400 4,400 3,548
Silage ground required 9.02 7 7
Nitrogen MP kg/ha 235 260 265
P MP kg/ha 9.3 8.6 8.9
K MP kg/ha 31.7 44 112

Parameter 2019
Grass grown tonnes DM/ha 14.53
Grass utilisation tonnes DM/ha 13.37
Silage on MP tonnes DM/ha 1.98
Grazed grass utilised tonnes DM/ha 11.39
Silage ground required 7
Nitrogen MP kg/ha 250
P MP kg/ha 10.15
K MP kg/ha 72.96
2019 Grassland Performance

Grass growth 6 yr average v 2018 & 2019
0
20
40
60
80
100
120
140
07-Feb 28-Feb 21-Mar 11-Apr 02-May 23-May 13-Jun 04-Jul 25-Jul 15-Aug 05-Sep 26-Sep 17-Oct 07-Nov
kg D
M/h
a/d
ay
6 yr average 2018 2019

Life Cycle Analysis• Collaborating with Prof. Nick Holden and Dr Pooja Sherman in UCD
• Data required:
Dairy Ration
ProductionFeeding
No. of cows & replacement rate
Fertiliser
N, P & K usageMP/silage area Housing Time
kg C02/kg MS

LCA Results
Teagasc Sectoral Roadmap Systems Herd
1,1
0,97
0,83
0
0,2
0,4
0,6
0,8
1
1,2
Current 2025 target Research target
kg C
02
/kg
MS
0,870,94
0,88
0,00
0,20
0,40
0,60
0,80
1,00
1,20
Target 2016 2017

UCD Dairy Systems Model

Very efficient low concentrate system
UCD Lyons high-output grazing system
Stocking rate (LU/ha) 2.75 2.4
Milk yield (kg/cow) 5,550 7,450
Milk solids (kg/cow) 450 590
Concentrate (kgDM/cow/yr) 350 1,300
% diet grazed grass 74 53
% diet grazed grass and silage 90 78
System Comparison
Lyons “MCGS”Benchmark “LCGS”

Very efficient low concentrate system
UCD Lyons (@ Achieved perf)
Milk output (€/cow) 1,904 (32,581) 2,487 (42,215)Milk output (€/ha) 5,235 (89,581) 6,052 (103,561)
Gross Margin (€/cow) 1,263 (21,612) 1,416 (24,230)Gross Margin (€/ha) 3,472 (59,413) 3,445 (58,951)
Farm Profit ex. lab, rent, int (€/cow) 782 (13,382) 907 (15,520)Farm Profit ex. lab, rent, int (€/ha) 2,151 (36,808) 2,208 (37,783)
Imputed labour (€/cow) 315 (5,390) 371 (6,349)Imputed rent and interest (€/cow) 283 (4,843) 304 (5,202)
Economic Prof after lab, rent & int €/cow 184 (3,149) 232 (3,969)Economic Prof after lab, rent & int €/ha 507 (8,676) 566 (9,685)
• Milk base price @ 5.13 ZAR/l; concentrate price @ 5,818 ZAR/t DM; • Imputed full labour @ 257 ZAR/hr; imputed rent (all land) @ 7187 ZAR/ha; imputed interest on capital @ 5%
Financial Simulation (ZAR)“LCGS” “MCGS”
+57 (975)
+56+21
+125 (2,139)
+48 (821)+59 (1010)
Diff (€)
@ Target
Performance
+3,576+7,717

Financial Simulation (Fixed Area: 41ha) – whole farm (ZAR)
LCGS Lyons-MCGS Difference Dairy Cows (no.) 113 100 -13
Milk solids (kg) 50,840 59,000
Milk output (€) 215,058 (3,680,057) 248,665 (4,255,138)
Total Variable Cost (€) 64,623 (1,105,824) 96,800 (1,656,434)
of which: Purchased Feed (€) 13,444 (230,053) 44,200 (756,347)
Gross Margin (€) 142,640 (2,440,845) 141,565 (2,424,007) -1,074 (18,378)
Fixed Costs (€) - excl. Labour, Rent, Interest 54,272 (928,699) 50,861 (870,330) -3,411 (58,369)
Farm Profit (€) - excl. Labour, Rent, Interest 88,368 (1,512,147) 90,705 (1,552,138) +2,337 (39,991)
Imputed labour (€) 35,588 (608,979) 37,100 (634,853) +1,512 (25,873)Imputed rent and interest (€) 31,973 (547,120) 30,400 (520,203) -1,573 (26,917)
Economic Profit (€) – after Labour, Rent, Interest 20,808 (356,065) 23,205 (397,082) +2,397 (41,017)
@ Target: 39,306 (672,602) + 18,498 (316,536)

0
50
100
150
200
250
300
350E
con
om
ic P
rofi
t p
er
cow
(€
)
MCGS Replacement Rate
Impact of Replacement Rate on Lyons Net Margin vs Low Concentrate Grazing System (LCGS) system benchmark
LCGS (Benchmark) MCGS (Lyons)
Milk base price: 30 cpl
Impact of Variation in Replacement Rate for Lyons-MCGS vs LCGS-benchmark
LCGS @ 20% repl rate
5989
5134
4278
3422
2567
1711
856
ZAR

Economic Profit per Hectare by Milk Price
-2,000
-1,500
-1,000
-500
0
500
1,000
1,500
2,000
2,500
2.75 3 3.25 3.5 3.75 4 4.25 4.5 4.75 5 5.25
Eco
no
mic
Pro
fit
pe
r H
ect
are
(€)
Milk Price (€/kg MS)
Sensitivity Analysis: Milk Price vs Net Margin/ha
MCGS (Lyons) LCGS (Benchmark)
(43,169)
(34,536)
(25,902)
(17,268)
(8,634)
(-17,268)
(-34,536)
(51.8) (56.1) (60.4) (64.8)(69.1)
(75.1) (77.7) (82.0) (86.3) (90.7)
ZAR
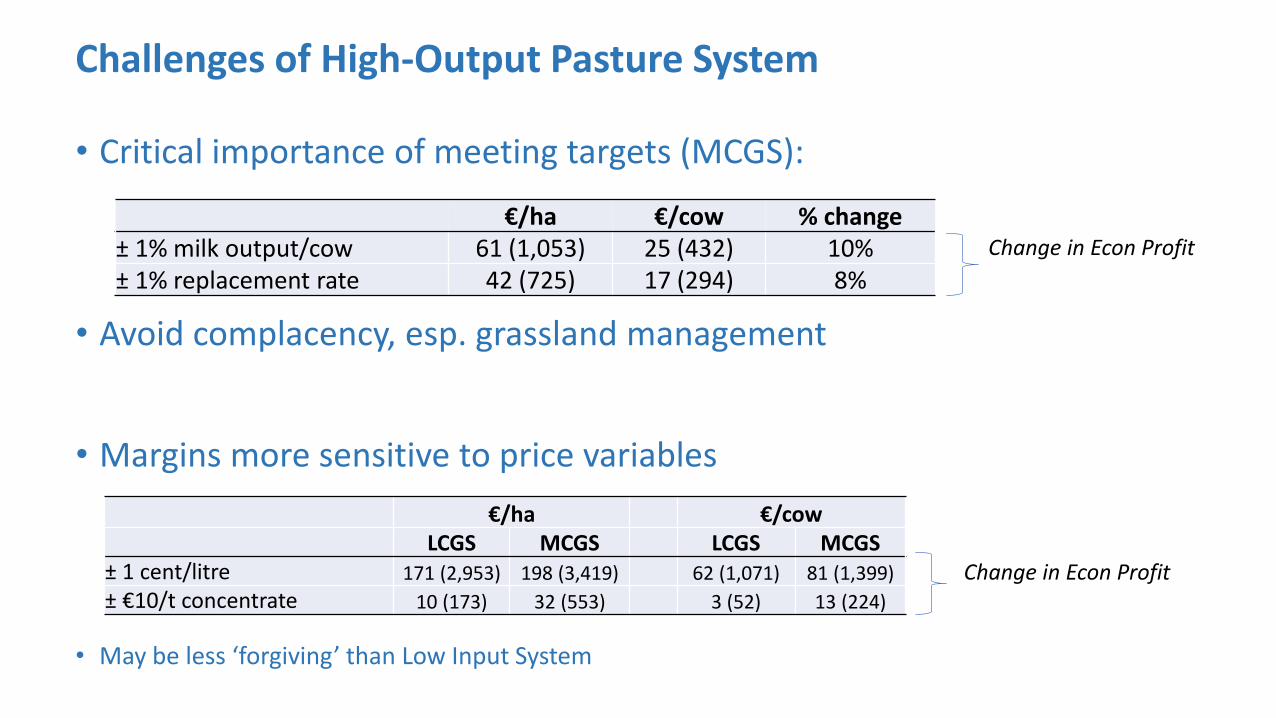
Challenges of High-Output Pasture System
• Critical importance of meeting targets (MCGS):
• Avoid complacency, esp. grassland management
• Margins more sensitive to price variables
• May be less ‘forgiving’ than Low Input System
€/ha €/cow % change± 1% milk output/cow 61 (1,053) 25 (432) 10%± 1% replacement rate 42 (725) 17 (294) 8%
€/ha €/cowLCGS MCGS LCGS MCGS
± 1 cent/litre 171 (2,953) 198 (3,419) 62 (1,071) 81 (1,399)
± €10/t concentrate 10 (173) 32 (553) 3 (52) 13 (224)
Change in Econ Profit
Change in Econ Profit

Findings
• High level of milk output possible in cows selected on multi-trait index in grazing systems
• Fertility targets are achievable in high output grazing cows
• High input grazing systems can be profitable
• LCA Analysis: Environmental emissions are diluted by the high output

Future Work
• 2020
• Compare 12% CP supplement with 14% CP supplement
• Evaluate Compound based 95% on Native Ingredients

Dissemination
• To date:• Farmer discussion groups• Stakeholder meetings• International delegates• Social Media• UCD website – weekly notes and 3 Year Report• Scientific conferences

Acknowledgements:
Dairy Research Ireland
Department of Agriculture Food and the Marine

•Acknowledgements:

UCD Team
• Prof Finbar Mulligan• Prof Karina Pierce• Dr Bridget Lynch• Luke O’Grady BVMS• Prof Alan Fahey• Joris Somers BVMS• Prof Michael Wallace• Dr Connie Grace• Dr Simone McCabe• Ciaran McDonnell• Dr. Nicholas Ryan• Dr Faisal Zahoor• Farm staff and grad students at Lyons


Thank You