nile perch fishery management plan for lake victoria … · 4 nile perch fishery management plan...
TRANSCRIPT

Nile Perch Fishery Management Plan for Lake Victoria
2015 - 2019
APRIL 2015
THE EAST AFRICAN COMMUNITY
JUMUIYA YA AFRIKA MASHARIKI
Funded by the European Union
With the support of:Co-implemented by
SF/ 2015/ 49

The designations employed and the presentation of material in this information product do not imply the expression of any opinion whatsoever on the part of Indian Ocean Commission concerning the legal or development status of any country, territory, city or area or of its authorities, or concerning the delimitation of its frontiers or boundaries. The mention of specific companies or products of manufacturers, whether or not these have been patented, does not imply that these have been endorsed or recommended by Indian Ocean Commission in preference to others of a similar nature that are not mentioned.
The views expressed in this information product are those of the author(s) and do not necessarily reflect the views or policies of Indian Ocean Commission.
© 2015 Indian Ocean Commission
Indian Ocean Commission Blue Tower5th floor, rue de l'InstitutEbene, MauritiusTel : +230 402 6100Fax: +230 466 [email protected] www.smartfish-coi.org
“ This publication has been produced with the assistance of the European Union. The contents of this publication are the sole responsibility of the author and can no way be taken to the reflect the views of the European Union.”
Photo credit for cover: © Mike Markovina/ SmartFish
CONTENTS
ABBREVIATIONS AND ACRONYMS......................................................................................................4
EXECUTIVE SUMMARY ............................................................................................................................5
1 INTRODUCTION ............................................................................................................................9
2 RATIONALE FOR PROMOTING A SPECIFIC FISHERY MANAGEMENT PLAN FOR THE LAKE VICTORIA NILE PERCH FISHERY ................................................................12
2.1 BRIEF INTRODUCTION TO FISHERIES MANAGEMENT ................................................................12
2.2 RATIONALE FOR PROMOTING A SPECIFIC NILE PERCH FISHERY MANAGEMENT PLAN
(NPFMP) FOR LAKE VICTORIA .......................................................................................................14
3 MAJOR ISSUES RELATING TO THE MANAGEMENT OF THE LAKE VICTORIA NILE PERCH FISHERY ...................................................................15
3.1 MANAGEMENT FRAMEWORK FOR THE NILE PERCH FISHERY ...................................................15
3.2 MAJOR CHARACTERISTICS OF THE NILE PERCH FISHERY ..........................................................16
3.3 FISHERY STATUS AND TRENDS .....................................................................................................19
3.4 CURRENT CONTRIBUTION OF THE NILE PERCH FISHERY (INCLUDING VALUE CHAIN) TO THE
ECONOMIES OF THE THREE PARTNER STATES ...........................................................................21
3.5 SWOT ANALYSIS OF THE NILE PERCH FISHERY ...........................................................................24
4 NILE PERCH FISHERY MANAGEMENT PLAN FOR LAKE VICTORIA, 2015-2019 (NPFMP2) ......................................................................................................................................26
4.1 TOWARDS A NEW PARADIGM FOR ADEQUATE AND RESPONSIBLE MANAGEMENT
OF THE NILE PERCH FISHERY ........................................................................................................26
4.2 GOAL AND SPECIFIC OBJECTIVES OF NPFMP2 ..........................................................................27
4.3 STRATEGY FOR NPFMP2 ................................................................................................................29
4.3.1 Control Access to Resource (immediate) ..............................................................................32
4.3.2 Regulate All Post-Harvest Activities (immediate) .................................................................32
4.3.3 Enforce Existing Priority NP Fishery Regulations (immediate) .............................................33
4.3.4 Restrict Fishing Capacity to the 2015 Level (Short-to-Medium Term) .................................34
4.3.5 Strengthen the NP Fishery Regulatory Framework (Short-to-Medium Term). .....................34
4.3.6 Evaluate the Feasibility of Introducing Secure Fishing Rights (Short-to-Medium Term) ......36
4.3.7 Strengthen Post-Harvest Sector (Short-to-Medium Term) ...................................................37
4.4 NPFMP2 ACTION PLAN .................................................................................................................37
4.4.1Deliveryofkeyfisheriesmanagementservices ....................................................................37
4.4.2ImprovementofthegovernanceframeworkinNPfishery ..................................................39

4.4.3 Complementary actions to ensure the success of NPFMP2, including through
promotionofspecificactionstoincreasewealthgeneratedbytheNPfishery ..................40
4.4.4 Monitoring and evaluation (M&E) ........................................................................................40
4.5 COSTING OF THE NPFMP2 ACTION PLAN...................................................................................41
4.6 EXPECTED ECOLOGICAL, SOCIAL AND ECONOMIC BENEFITS .................................................44
4.7 PROPOSED FINANCING MECHANISMS ........................................................................................45
5 ANNEXES......................................................................................................................................47
5.1 REGULAR M&E OF INDICATORS OF SPECIFIC BIO-ECOLOGICAL, SOCIAL AND ECONOMIC
OBJECTIVES ...................................................................................................................................47
5.2 DETAILED COSTING OF THE NPFMP2 5 YEARS ACTION PLAN (2015-2019) ...............................48
TABLE OF FIGURES
Figure 1 Lake Victoria Basin showing the drainage and international boundaries (source: draft Fisheries Management Plan for Lake Victoria, 2015-2020) .....................................9Figure 2 Annual catch of Nile perch on Lake Victoria in tonnes (1990-2011) source: LVFO..............................................................................................................................16Figure 3 Supply chain of Lake Victoria Nile perch (source: MRAG, 2008) ................................................18
LIST OF TABLES
Table1 NumberoffishingunitstargetingNileperchbymaincategory(LVFOFS,2012)......................17Table2 Numbersoffishers,boatsandcertainfishinggearonLakeVictoria,2000,2006 and 2012 (LVFO frame surveys) ..................................................................................................19Table3 GeneralcompositionandnumberoffishingunitstargetingNileperch on Lake Victoria (LVFO Frame Survey 2012) ...............................................................................20Table4 IndicativecatchrateforfishingunitstargetingNilePerchin2000, 2006 and 2011-2012 (LVFO Frame Survey 2012 and CAS 2011) .................................................20Table5 Value(turnover)andvalueaddedgeneratedbytheLakeVictoriaNPfishery (LVFO/SmartFish, 2015) ..............................................................................................................22Table6 OfficialcontributionofLakeVictoriaNPfisherytotradebalancesinPartnerStates (LVFO/SmartFish, 2014) ...............................................................................................................23Table7 ContributionofLakeVictoriaNPfisherytoemploymentinPartnerStates (LVFO/SmartFish, 2014) ...............................................................................................................23Table8 ContributionoftheNPfisherytofishconsumptioninPartnerStates (LVFO/SmartFish, 2014) ...............................................................................................................24Table 9 Summarized costing of proposed NPFMP2 action plan 2015-2019 by main category of actions (in USD) – LFVO/SmartFish 2015 ...................................................43
Blim Biomass limit – minimum safe stock size
B0 Unexploited (maximum) biomass
BMSY Biomass that gives rise to MSY
BMU Beach Management Unit
BS Beach seine
CAS Catch Assessment Survey
CPUE Catch per unit of effort
EAC East African Community
EAF Ecosystemapproachtofisheries
EAIFFPA East African Industrial Fishing and Fish Processing Association
EU European Union
FAO Food and Agriculture Organization of the United Nations
FAO CCRF FAO Code of Conduct for Responsible Fisheries
FMO/P Fish movement orders/permits
FMP Fisheries Management Plan
FS Frame survey
GDP Gross Domestic Product
GN Gillnet
HAS Hydro-acoustic survey
HL Hook and line
IEC Information-Education-Communication
IFMP Implementation of a Fisheries Management Plan
IUU Illegal,unreportedandunregulatedfishing
LVEMP Lake Victoria Environmental Management Programme
LVFO Lake Victoria Fisheries Organisation
LVFO-CoM Lake Victoria Fisheries Organisation Council of Ministers
MCS Monitoring, control and surveillance
MSY Maximum sustainable yield
MEY Maximum economic yield
M&E Monitoring and evaluation
NP Nile perch
NPFMP Nile perch Fishery Management Plan
NPFMP2 Nile perch Fishery Management Plan, 2015-2019 (this document)
OECD Organization for Economic Cooperation and Development
OSNP Operation Save Nile perch
RWG Regional Working Group (LVFO)
SWOT Strengths, weaknesses, opportunities and threats
ABBREVIATIONS AND ACRONYMS

6 LVFO NILE PERCH FISHERIES MANAGEMENT PLAN, 2015-2019 (NPFMP2, APRIL 2015) 7
EXECUTIVE SUMMARYThe Lake Victoria Nile perch (NP) fishery (fishing and post-harvest activities) is a significant contributor to the social and economic development of the Lake Victoria Fisheries Organization (LVFO) Partner States (Kenya, Tan-zania and Uganda). The catch of NP has averaged 250 000 tonnes per annum for the last two decades. During the last decade, the fishery has faced serious problems of overcapitalisation and overfishing and high levels of non-compliance to regulations in the fishing and post-harvest sub-sectors. This has led to decreasing stock health resulting in an increased vulnerability of the resource base and suboptimal contribution of the fishery to the lake-side economies.
A first specific Fishery Management Plan for the Nile perch Fishery (NPFMP1) covering the period 2009-2014 was developed in 2008 by LVFO. Other initiatives, both national and regional, aimed at reversing the Nile perch stock decline have also been promoted since 2008. The implementation of NPFMP1 and related initiatives has led to some progress in the management of the NP fishery; however gaps and weaknesses are still affecting the sustainability of the fishery and the full expression of social and economic benefits that could be derived from proper management of the fishery.
The LVFO has engaged since the end of 2013 in the revision of NPFMP1 and has requested the assistance of the EU-funded SmartFish Programme to prepare a final draft NPFMP2 covering the period 2015-2019. The pro-cess of preparing the NPFMP2 is expected to make use of lessons learnt from NPFMP1 and to place particular attention on governance and economic considerations. The NPFMP2 is also to be reorganized into a policy and planning document to present the most important aspects for various parties concerned, especially deci-sion-makers.
A Final Draft NPFMP2 was presented at a regional LVFO stakeholder’s workshop (Entebbe, 09th and 11th March 2015). On the third day of the meeting, Permanent/Principal Secretaries of the three Partner States joined the validation process of NPFMP2.
The present document (called NPFMP2, 2015-2019, April 2015) incorporates the comments, suggestions and recommendations made during the stakeholders’ meeting. This document has been approved in principle by the Permanent/Principal Secretaries of the three Partner States who expressed their intention to support its adoption at the next LVFO-Council of Ministers (LVFO-CoM) meeting. They also expressed their wish that each country can, at a later stage, develop specific action plans and costings at national level in order to facilitate the overall implementation of the NPFMP2 when it is formally adopted.
An in-depth analysis of the current situation and trends in the NP fishery and of its governance system calls for a change in the management approach promoted so far and the adoption of a new paradigm that can be summarised as follows:
Promote a different and more appropriate approach for a social management of the NP fishery. This should not only consist in promoting mechanisms for further participation of fishers in the provision of management services but rather in establishing enabling conditions to increase the creation of wealth and its sharing at local level to the benefit of sedentary fishers and related economic actors in a context where the NP fishery is now-adays a pure business-orientated fishery.
The need for the management to be policy-driven at both central and local levels in relation to wealth gen-eration. Current economic benefits that are derived from the NP fishery are sub-optimal and they are not sustainable. Economic benefits could be at least sustained and possibly significantly increased provided that the necessary institutional and infrastructural investments and fiscal arrangements are set-up to support the implementation of the management plan.
The promotion of a specific and operational NP fishery management plan is of utmost importance. Major les-sons learned from NPFMP1 have shown that NPFMP2 should better address regulation of access to resources, compliance with existing fishing regulations and formalisation/regulation of all post-harvest activities. More-over, NPFMP2 should be more action-driven and implementation orientated.
Management arrangements should further involve actual (commercial) actors including fishers, boat-owners, processors and traders.
Responsibility of all public institutions concerned with fishery management (including local government and the judiciary system) to fulfil their mission/mandate should be seen as a key condition of success of NPFMP2. There will therefore be a need to mobilise adequate human, financial, and logistical means and to ensure that institutions are accountable of their actions.
Promote a sustainable approach for the financing of NPFMP2. This signifies that financing of implementation of fisheries management by Governments should be in relation to bio-ecological, economic and social stakes and to requirements. Reliance on external funding should be reduced. Particular attention should also be placed on establishing mechanisms for co-financing by all commercial operators involved in fishing and value chain.
Research should focus on providing technical and scientific advice to support decision-making in relation to the implementation and the monitoring and evaluation of NPFMP2. This should include improving knowledge on stock dynamics and status and developing capacities in each country and at the LVFO Secretariat level in economic analysis.
The Goal of NPFMP2 is to enable the Lake Victoria NP fishery to increase its contribution to the economic and social development of the LVFO Partner States in a sustainable and responsible manner.
The Specific Objectives of NPFMP2 are:
To rebuild the biomass of the NP stock to the level that will sustain catches above 300 000 tonnes per annum;
To increase wealth generated by NP fishing and related activities by at least 10% through improved regulation of fishing activities and enhanced value addition in the artisanal and industrial post-harvest sector;
To improve wealth sharing to the benefit of local communities.
In order to reach these management objectives, the NPFMP2 provides a strategy that includes ending open access to the fishery, ensuring compliance of all actors involved in fishing and post-harvest activities with ex-isting regulations, promotion of actions aimed at continuing rebuilding the NP stock, and promotion of value addition. The outlines of the NPFMP2 strategy are as follows:
Immediate
Control access to the fishery resource through minimal conditions of access and formalisation of all fishers and boat-owners in the NP fishery.
Regulate all post-harvest activities with a focus on regional trade and fish maw trade.
Enforce existing priority fishing regulations through effective MCS, with priority given to those designed to prevent the most harmful fishing practices.
Short-to-medium term
Restrict fishing capacity to the 2015 level.
Strengthen the NP fishery regulatory framework with the objective of further reducing fishing effort (notably through introduction of a closed season for two months a year) and protecting the NP resource (notably to protect the largest spawners targeted by fish maw traders).
Evaluate the feasibility of introducing secure fishing rights.
Strengthen post-harvest sector in respect to fish quality and wealth generation in both artisanal and industrial value chain (processing and trade).
A NPFMP2 action plan for the period 2015-2019 is structured around four main types of actions:
Deliver key fisheries management services - General fishery administration, research and MCS.
Improve the governance framework - Policy and planning and legal issues, co-management and Public-Private

8 LVFO NILE PERCH FISHERIES MANAGEMENT PLAN, 2015-2019 (NPFMP2, APRIL 2015) 9
Partnership (PPP) and collaborative and funding mechanisms.
Implement complementary actions - Communication of NPFMP2 to decision-makers, fishers and stakeholders, improved access of fishing communities to education and health, accompanying actions for fishing closure and livelihood diversification, value addition in post-harvest sector and increased ex-vessel price of NP.
Monitor and evaluate - Regular M&E of indicators and reviews.
In total the estimated cost of the action plan is approximately USD 57.3 million over a period of 5 years, i.e. about USD 11.5 million per year. The share of the cost between the three Partner States and the LVFO Secretar-iat is 90.4% and 9.6% respectively. This amount of USD 11.5 million represents about 1.0% of current turnover of the NP fishery, or 1.4% of the wealth (value added) that is currently generated by the NP fishery. Moreover, this amount should be compared with total revenues from the NP fishery that benefit the Partner States and that are currently around USD 10 million per annum.
The expected benefits from the NPFMP2 are, above all, that the sustainability of the NP resource is ensured and that the current and already significant contribution of the fishery to the national and local economies is maintained. Note that in a ‘no-change’ scenario, catch of NP is expected to decrease from 250 000 to 200 000 tonnes per year, resulting in an annual loss of about USD 222 million in terms of turnover and USD 158 million in terms of wealth (value added) generated by the NP fishery. Moreover, full implementation of the NPFMP2 would result in an increased contribution of the NP fishery to the economies, particularly in the lake-basin area. The budget revenue to the Partner States would increase by about 50% to USD 15 million per year (to be com-pared to the cost of the NPFMP2 which has been estimated as USD 11.5 million per year).
The expected annual maximum benefits from year 5 onwards if combined potential loss and potential gain, from avoiding loss and increasing net benefits, would result in an annual gain of USD 451 million in terms of wealth created.
Furthermore, the Partner States and LVFO will be at the forefront of sustainable management of a shared inland water body through the implementation of NPFMP2. It can also be argued that PFMP2 will provide a successful example of the Pan-African Policy Framework and Reform Strategy for Fisheries and Aquaculture in respect to wealth creation in fisheries. Not to mention that a success of NPFMP2 will create further interest from donors and investors in the EAC area.
Finally, MCS efforts on the NP fishery (which represent about 31.7% of the estimated total cost of the action plan) will also benefit other Lake Victoria fisheries since it will result in a considerable reduction of the most harmful fishing gear and practices on the lake.
With regards to the financing mechanism for NPFMP2, a policy shift towards making direct resource users (boat-owners, fishers, processors and traders) contribute more towards the management costs will be imple-mented. This could be facilitated through an agreed tripartite financing plan. Funding could be derived from a range of different but complementary sources: Government budget and Fish Levy Trust Fund at national levels (to be financed partly by fishing rights and taxation of the fishery); LVFO Fish Fund for Lake Victoria Nile perch; ‘Operation Save the Nile Perch’ (OSNP); co-financing of monitoring and control of fish in processing factories; and development partners.
For the short term, until the financing plan is in place, it is proposed that EAC partnership funding be sought to which the three national governments will contribute and to which donors could be sought as additional fund-ing sources. In addition to this, the process of establishing the Fish Levy Trust Fund for NP initiated at national levels and the LVFO Fish Fund for NP should be finalized as a matter of urgency so that they can take over as the major contributing funding source.
1 INTRODUCTION Lake Victoria covers an area of 68 000 km2 with a catchment area of 193 000 km2. It is the site of Africa’s largest freshwater fishery. The lake is sharedbetween Uganda (43%), Kenya (6%) and Tanzania (51%). It is relatively shallow with a mean depth of 40 m, a maximum depth of 84 m, and it has a shoreline of 3 450 km. The lake is also the source of the River Nile. It is estimated that Lake Victoria’s resources contribute directly to supporting the livelihoods of over two million people through income, food and employment generation (LVFO Fisheries Management Plan for Lake Victoria, 2009-2014).
Lake Victoria fisheries are currently dominated bythree species: Nile perch (NP) Lates niloticus, Nile tilapia Oreochromis niloticus and dagaa Rastrineobola argentea. These three species are also the most commercially important ones, contributing up to 90% of the catch biomass.
Figure 1: Lake Victoria Basin showing the drainage and international boundaries (source: draft Fisheries Management Plan for Lake Victoria, 2015-2020)

10 LVFO NILE PERCH FISHERIES MANAGEMENT PLAN, 2015-2019 (NPFMP2, APRIL 2015) 11
plan in relation to reference points such as MSY. The draft NPFMP2 emphasised the need to reduce the overall fishingeffortthroughclosedseasonsandstrongerenforcementofexistingregulationstocombatIUUfishing.
The LVFO-CoM meeting held in November 2013 “noted with concern the continued decline of the NP stocks and urged the Partner States to intensify curbing of illegal fishing activities including catching and trading in undersize/immature fish and use of prohibited fishing gears; and implement species specific licencing in order to control fishing effort”. The LVFO-CoM also “noted the status of the Partner States remittance towards the OSNP and requested Partner States to fulfil obligation towards operationalization of the plan by June 2014”.
Based on the above, the LVFO Secretariat organized two meetings in January 2014 and May 2014 involving inter alia the Regional Working Group on MCS (RWG-MCS). The purpose of both meetings was principally to “re-plan the strategy for the OSNP”. Meanwhile, the meetings considered the draft NPFMP2 and expressed their concernthatthedraft,althoughbeingagoodscientificdocument,maybedifficulttounderstand,especiallybythemainpartiesandpolicymakers,andwasinsufficientlydevelopedintermsoftheprovisionofaconcreteaction plan.
ItisinthiscontextthattheLVFOSecretariatrequestedtheassistanceoftheEU-financedSmartFishProgrammetoreorganizethedraftNPFMP2intoapolicydocument,withstrongereconomicjustificationsforthestepstobetakenandtheuseofscientificevidencethatcanbeeasilyunderstoodbythevariouspartiesconcerned,including provision of a more detailed action plan for the three countries concerned and the LVFO Secretariat.
A second draft NPFMP2 (called the Reorganized NPFMP2 – 2015-2019, Nov 2014) was prepared in the period September-October 2014 with the assistance of an international consultant recruited under SmartFish who workedincloseconsultationwiththeLVFOSecretariatandtheLVFODeskOfficersfromeachPartnerState3. The document was reviewed and edited in early 2015 by SmartFish.
A Final Draft NPFMP2 was presented at a regional LVFO stakeholder’s workshop that was held on 09th and 11th March2015inEntebbewiththetechnicalandfinancialsupportofSmartFish.Onthethirddayofthemeeting,Permanent/Principal Secretaries of the three Partner States joined the validation process of NPFMP2.
The present document (called NPFMP2, 2015-2019, April 2015) incorporates comments, suggestions and recommendations made during the stakeholders’ meeting. This document has been approved in principle by the Permanent/Principal Secretaries of the three Partner States who expressed their intention to support its adoption at the next LVFO-CoM. They also expressed their wish that each country can, at a later stage, develop specificactionplansandcostingsatnationallevelinordertofacilitatetheoverallimplementationoftheNPFMP2when it is formally adopted.
2 RATIONAlE fOR pROMOTINg A SpECIfIC fIShERY MANAgEMENT plAN fOR ThE lAkE VICTORIA NIlE pERCh fIShERY
2.1 Brief Introduction to fisheries ManagementAfisherymeansaneconomicactivitybasedontheexploitationandvalorisationofagivenfisheryresource,likethe Lake Victoria Nile perch resource. Fishery resources have four main characteristics:
• They are natural renewable resources, produced by the ecosystem, which means that the economic cost of fish harvesting is relatively low since it is limited to the costs of catching the resource.
• The fishery production depends on environmental parameters and is limited by the carrying capacity of the ecosystem, which means that social and economic returns derived from fishing can only be achieved within the biological limits imposed by the productivity of the target fish stocks and their environment.
• Most fishery resources are publicly-owned resources which means that in practice access to the fishery is essentially open.
3 The mission team included: Breuil Christophe (SmartFish Consultant), B.A. Abura Samson (LFVO ICT expert), C. Mkumbo Oliva (LVFO Deputy Executive Secretary), Ikwaput Nyeko Joyce (Uganda LVFO Desk Officer), Meela Braison (Tanzania Principal Fisheries Officer), Nyandat Beatrice (Kenya LFVO Desk Officer), Rhoda Tumwebaze (LFVO management specialist).
The Lake Victoria Nile perch (NP - Lates niloticus)fisheryisthemostvaluablefreshwaterfisheryinAfricaandsince the 1990s has supported an extremely valuable export-orientated fishery that generates a significantsource of revenue for the population of the three riparian countries. The fishery has attractedmigrants tothefisheryandcatcheshavedeclinedsincetheirpeakin1990inresponsetoincreasingfishingpressureandchangesinfishingpractice.AspecificFisheryManagementPlanforNileperch(NPFMP1)coveringtheperiod2009-2014wasdevelopedin2008aspartoftherevisionofthefirstRegionalFisheriesManagementPlanforLake Victoria conducted under the aegis of the Lake Victoria Fisheries Organization (LVFO).
TheNPFMP1wasdevelopedasameansofmanagingtheNPfisheryspecifically,andwasadoptedbytheLVFOCouncilofMinisters(LVFO-CoM)inJune2009.ThepriorityobjectivesforthemanagementoftheNPfisherywere to:
• Optimizesustainablefishproduction.
• Maximise contribution to macro-economic growth through foreign exchange generated by exports of fishproducts.
• Maximisenetincomeofparticipatingartisanalfishers.
TheNPFMP1stressedtheurgentneedtoreversethestateofoverfishingoftheresourceandrecommendedafurtherreductionoffishingeffort,using inparticular regulationsforclosedseasonsandclosedareas.TheNPFMP1alsoemphasisedtheneedtoeradicatetheillegaltradeinundersized,immaturefish,andthemostharmfulillegalfishingpractices,includingbeachseiningandtheuseofundersizedgillnets.
Other recent initiatives to reverse the NP stock decline have included:
• The“self-monitoringandcontrol”initiativeledbythefishprocessingindustryassociations.Thisstartedin Uganda in September 2007 and was later applied in Kenya and Tanzania.
• The “zero-tolerance” compliance policy of the harvested NP slot size of not less than 50 cm total length by the industry in February 2009.
• The launching by the LVFO-CoM of the “Operation Save Nile Perch” (OSNP) in November 2009 which givesemphasistofightingIllegal,UnreportedandUnregulatedfishing(IUUfishing)throughimprovedmonitoring, control and surveillance (MCS) operations. This operation had an operational objective of initiallyreducingIUUfishingby50%and100%bytheendof20101.
Despite implementation of a range of management measures, the NPFMP1 has not achieved its aim of managing thefisheryinaccordancewiththestatedreferencepoints,includingthatofMaximumSustainableYield(MSY).The fishery is currently overfished at a level approaching its biologically safe limit. This situation results inthe stock being highly vulnerable which, unless reversed, may lead to stock collapse, as well as suboptimal contributionof thefisherytotheeconomiesof thePartnerStates (lossofeconomicandsocialbenefitsthatcould potentially be derived from an adequate level of exploitation and improved post-harvest practices).
Themain reasons for thisundesirablesituationare thatfishingefforthassteadily increasedand inadequateenforcementoffisheryregulations.Theunderlyingreasons(coredrivers)haveincludedinter alia an increase in the population of the lake-side communities and the lack of alternative livelihoods, a growing regional market forsmallimmaturefish(illegaltrade),theopenaccessregimeofthefishery,andtheweakdeliveryoffisheriesmanagement services, including MCS, which is closely linked to governance issues.
The lack of funding since the end of the EU-funded IFMP project in 2010 is also believed to have exacerbated governanceproblemsinrelationtothemanagementofthesharedNPfishery.Thelackoffinancialcommitmentof LVFO member States to support the implementation of the OSNP can also be highlighted to explain the lack ofeffectivenessofMCSinsupportofthemanagementprocessoftheNPfishery.
TheEU-financedACPFishIIprojectassistedtheLVFOSecretariattorevisetheNPFMP1duringthesecondhalfof 20132. The process involved a prior evaluation of the NPFMP1, the holding of a stakeholders workshop in Jinja (August2013)whereafirstdraftNPFMP2wasprepared,andtheholdingoftwotechnicalworkshopsinOctober2013toconsolidatethisfirstdraft.ThedraftNPFMP2wasthenpresentedandrevisedduringasecondregionalstakeholder’s validation workshop that was held on 22nd and 23rd October 2013 in Jinja.
ThestructureofthefirstdraftNPFMP2wassimilartothestructureofNPFMP1,withemphasisgiventotheanalysisofthebio-ecologicaldynamicsofthefisheryandtoidentifyingobjectivesthatshouldbepursuedthroughthe
1 Since its adoption in 2009, only Kenya has contributed to OSNP; hence the plan could never be operational. The OSNP process has however been recently reactivated (LVFO-CoM November 2013).
2 The ACP Fish II project was started in July 2013 through SOFRECO, the selected consulting company, which provided for inter alia two key experts: S.P. Marriott and Dr A.S. Halls.

12 LVFO NILE PERCH FISHERIES MANAGEMENT PLAN, 2015-2019 (NPFMP2, APRIL 2015) 13
It should be stressed that these two sets of measures and regulations are complementary and should not be promoted separately.
In order to set up and effectively implement these two sets of measures and regulations, several management functions and services have to be developed, including general administration of the sector (e.g. registration, licensing), regular data collection on catch and effort, stock assessment, MCS and prosecution in cases of infringement,andfisheriescooperation (ofutmost importance in thecaseofasharedwaterbody likeLakeVictoria). These functions and services will only be effective if the legislative and institutional framework is adequateandifthedifferentstakeholders,includingtheGovernments,providesufficientresources.
Fisheries management should also include policies and actions aimed at improving the economic dynamics of fishingandrelatedactivities,includingfishprocessingandmarketingactivities,tomakesurethatthefisherywillbetter contribute to the social and economic development of the countries.
Fisheriesmanagement should also consider the direct and indirect effects of fishing and related activitiesconcerningaspecificfishresourceontheotherfishresourcesandtheenvironmentingeneral.OnLakeVictoria,the monitoring of the predator/prey relationships between NP, Nile tilapia, dagaa, haplochromine cichlids and the crustacean Caridina nilotica is of particular importance.
2.2 Rationale for Promoting a Specific Nile Perch Fishery Management Plan (NpfMp) for lake Victoria
Forseveraldecades,mostofcountrieshaveconsideredfisheriesmanagement throughasectoralapproachembracingallthecomponentsofthefisherysector.Suchanapproachhasprovedtobeinsufficientbasedonthespecificsofeachofthefisheriesandtopaylowattentiontotheaccessregimetoresources.Undersuchanapproach,publicactionshavealsoprovedtobeinsufficientlycoordinatedandmostlyfocusedontheprovisionofonly someof the requiredmanagement services,globalmonitoringof the sector (insufficient to supportsoundanalysis), conductingof researchprojects thatare tooacademicand insufficiently linked todecision-making, enforcement of technical management measures in priority (to the detriment of access control), and preventionofsanitaryrisks(particularlyforexportorientedfisheries).
Thissectoralapproach–whichhasprovedtobe inadequate,weaklyefficientandminimalistduetobudgetrestrictions-canexplaintheunsatisfactorycurrentsituationinmostoffisheries.Fisheryresourceshavebecomemoreandmorevulnerable,excessivefishingcapacityhasbeenaccumulated (e.g.numberofboats,numberof fishers, and number of gears) and social and economic performances of fisheries have remained underexpectations.
Thishasledmanycountriesandregionalfisheriesorganization,suchastheLVFO,topromotespecificfisheriesmanagementplans(FMP).ThemainrationaleinpromotingaspecificFMP,whencomparedtoasectoralapproachforfisheriesmanagement,referstoitscapacityofstructuringthepublicactionforbetterefficiencyinageneralcontext of budget limitations. Another reason for developing an FMP is because it is thought to better address the key issue in fisheriesmanagementwhich is the regulationof theaccess to resources including throughpromotingprocessestoclarifyandsecurefishingrights.Moreover,anFMPisanappropriatepolicyinstrumentto support regional cooperation, public-private partnership (PPP) and co-management.
There is no universally accepted model for the format of an FMP. Based on relevant technical guidelines of the FAO Code of Conduct for Responsible Fisheries, it is however widely accepted that an FMP, in addition to referring toanadequatemanagementunit,shouldindicateinteralia:objectivesassignedtothefishery,managementoptions and strategies to achieve these objectives, measures and actions to support the implementation of the strategy(actionplan),andinstitutionalandfinancialarrangementsfortheimplementationoftheFMP.
An FMP must also give particular attention to communication so as to ensure adequate ownership by the major fisherystakeholders,aswellastomonitoringandevaluation(M&E),consideringthatanFMP,asforanypublicproject, must be regularly adjusted and periodically revised.
Thesellingpriceofthefishoftensteadily increasesasaresultofthescarcityoftheresourceandincreaseddemand of domestic, regional and international markets.
Thesefourmaincharacteristicscanexplainthe‘usual’ trendofmanyfisheriesthat isacontinuous increasednumberoffishersandboats,combinedwithimprovedefficiencyoffishingintermsofthenumberandsizeofgears by boat, motorization of boats, etc.
Inanyfishery,theapplicationofasteadyincreaseoffishingeffortwillresultatthebeginningofthefisheryinincreasingfishproductionuntilamaximumisreached(MSYlevel).Iffishingeffortthencontinuestoincrease,thetotalfishproductionwillmoreorlessstagnatearoundtheMSYlevelforacertaintimebeforestartingtodecline. However, during that period, the abundance (biomass) of the resource will continue to decrease to the detriment of the sustainability of the resource, particularly if the stock biomass is close to its safe biological limit4. The catch rate expressed in terms of catch per unit of effort (CPUE)5 will also continue to decrease. This meansthatfisherswillhavetospendmoreandmoretimeand/ormoneytocatchthesamequantityoffish.Thiswillresultinneteconomiclossesforthefishersintermsofprofitability.ThismayalsoleadanincreasingnumberoffisherstolowcompliancewithregulationssoastocompensatethedecreasedprofitabilityoffishingactivityandhencehighoccurrenceofIUUfishing.
Thiswillalsoresultinadecreaseoftheintrinsicvalueofthefisheryresourcewithreferencetothenotionofresourcerentwhichcorrespondstotheeconomicsurplusthatcanbeextractedwhennormalfishingcostshavebeen covered6. This means that people in general (represented by the State which is the owner of the resource) cannotbenefitfromthewealththatcouldbepotentiallyandsustainablygeneratedbythefishery.
Finally, if nothing is done to prevent such a situation continuing, the fishery may collapse, resulting in anecological, social, economic and political crisis.
In order to prevent such an undesirable scenario, there is a crucial need for public and private stakeholders to adequately manage the fishery. This should consist of developing conditions, incentives and rules that would firstly ensure the sustainability of the resource (through aligning fishing effort with the natural productive capacity of the resource) and secondly optimise the social and economic returns that can be derived from fishing and related activities in line with governmental objectives.
It should be stressed however thatwhen the level of fishing effort is above the levelwhereMSY (and thecorresponding biomass level - BMSY)canbereached,itdoesnotmeanthatthefisherycannotbesustainable.Itmeans that the fishery is overfished to the detriment of certain objectives like themaximisation of bothproduction (MSY) and wealth generation (Maximum Economic Yield – MEY), but this may be to the advantage ofotherobjectives,includingmaximisingemployment(whichisgenerallythecaseinanopenaccessfishery).However,iffishinglevelsaresteadilyincreasingthestocksize(abundance)willgraduallydeclineandresourcewill become more and more vulnerable until it may collapse.
Inapoorlyregulatedfishery,thekeychallengeformanagersisthustoensurefirstthatthestockbiomassremainsabove the safe biological limit such that the long-term productivity of the resource is not endangered. To this extent,thenotionof‘acceptablelevelofoverfishing’canbereferredto.Betweenthesetwokeyreferencepointsthatarethe‘acceptablelevelofoverfishing’andtheMSY,themanagersshouldhavethepossibilitytodeterminetheleveloffishingeffortwherethefisheryshouldgoorremainsoastosatisfytheobjectivesassignedtothefishery.
Fisheriesmanagementthereforeconsistsofidentifyingtheleveloffishingeffortbetweenthesetworeferencepoints (to satisfy given objectives) and then deciding how to reach this required level through the implementation ofasetofmeasuresandregulationsaimedatregulatingthefishingpressureandconservingtheresource.Inthecontext of the LVFO, two sets of measures and regulations have been envisaged so far:
• Regulation of access to resources (effort control) through regulating the number of fishing units (e.g. limited number of fishing permits) and/or limiting the number of fishing days (e.g. temporal closure).
• Conservation of the fish resource through imposing a certain number of technical regulations such as minimum mesh size, minimum fish size, closed area (sensitive areas), banning of harmful or destructive fishing gear or practices (e.g. beach seines).
4 The safe biological limit of the stock corresponds to the biomass (maximum carrying capacity of the stock) below which the stock is in serious risk of collapsing.
5 The catch rate which is usually expressed in terms of catch per unit of effort (CPUE) measures the fish production by unit of effort and is often expressed in terms of fish caught per fishing trip.
6 The CAADP (Comprehensive Africa Agriculture Development Programme) paper on “The Wealth Generation Opportunities of African Fish Resources” (African Union, 2010) states that resource rent is a key concept in fisheries exploitation and management since it is the driving force behind the widespread overexploitation of fisheries, and, it determines the potential economic and social benefits that may be derived from well-managed fisheries.

14 LVFO NILE PERCH FISHERIES MANAGEMENT PLAN, 2015-2019 (NPFMP2, APRIL 2015) 15
The NP fishery is predominantly a small-scale commercial fishery. Two fishing gears, i.e. gillnets (GN) andlonglines(LL),aformofhook-and-line,arethemostimportantgearsinthefishery.Thesearepredominantlycarried by two main boat categories, i.e. sesse boats8 using paddles, which operate in waters close to the home landingsites,andsesseboatsoperatedwithenginesorsailsthatareabletocoverlongerdistancestofishinggroundsfurtherawayfromthehomelandingsites.TheNPfisheryalsoinvolvestheuseofasignificantnumberofbeachseines(BS)andmonofilamentnets(forgillnetting),bothofwhichareillegal.
Afishingunitconsistsofasinglecraft (motorized,sailornon-motorized)regardlessofsizecombinedwithatypeofgearusedfortargetingNP(gillnet,longline,beachseine).In2012therewereabout37600fishingunitstargeting NP on Lake Victoria (LVFO Frame Survey - FS, 2012). These units can be grouped into seven main categoriesasshowninTable1.Thetotalnumberoffishingunitstargetingallspecieswascloseto70000in2012;theNPfisheryrepresentedabout53%ofthese.
Table 1: Number of fishing units targeting Nile perch by main category (LVFO FS, 2012)
Kenya Tanzania Uganda Total
Motorized craft – Gillnets 1 246 7 195 6 841 15 281
Sail craft – Gillnets 1 529 296 192 2 017
Un-motorized craft – Gillnets 657 1 714 1 581 3 952
Motorized craft- Longlines 169 892 1 810 2 871
Sail craft- Longlines 1 424 1 450 821 3 695
Un-motorized craft – Longlines 246 3 712 2 892 6 850
Un-motorized craft – Beach seine 405 1 379 1 135 2 919
Total 5 676 16 638 15 270 37 585Therehasbeenasubstantialmigration into thefishery,especially inKenya,ofunskilledworkers,witha lowincomeandwithlittleincentiveormeanstoinvestinanylong-termapproachestotheirfishingorthefutureofthefishery.Therearenowabout200000fishersoperatingonthelake(LVFOFS,2012)ofwhichabout106000(assumingaratioof53%ofthetotal)arebelievedtobeinvolvedintheNPfishery.
ThesupplychainofLakeVictoriaNPisbrieflydescribedinFigure3.
Figure 3: Supply chain of Lake Victoria Nile perch (source: MRAG, 20089)
8 A sesse boat is a boat constructed from planks or timber and it has a V-shaped bottom with a keel. Its common size ranges from 6 to 12 m.9 Pollard, Iain (2008) Value Chain Analysis of the Lake Victoria Nile perch Fishery May-July 2008. MRAG. IFMP (ACP ROR/029)
3 MAjOR ISSUES RElATINg TO ThE MANAgEMENT Of ThE lAkE VICTORIA NIlE pERCh fIShERY
3.1 Management Framework for the Nile Perch FisheryIn 1994 Kenya, Tanzania and Uganda formed the Lake Victoria Fisheries Organisation (LVFO) which was established through the LVFO Convention. The objective of the LVFO is to foster cooperation among the three East African Community (EAC) Partner States by harmonizing national measures and developing and adopting conservation and management measures for the sustainable utilization of the living resources of Lake Victoria formaximumsocio-economicbenefits7.
The highest statutory body of the LVFO is the LVFO-CoM. The three Partner States have operational Fisheries Actsforthemanagementanddevelopmentoffisheriesresourcesandlowerlevellegislationgoverningfisherieswithin national territories. Decisions made by the LVFO-CoM are taken up at national level and legislation developed where needed.
The LVFO Secretariat is the executive body of the LVFO. Its functions are to coordinate the activities and functionsoftheOrganization,providetechnicalfisheriesresourcemonitoringandeconomicguidancetotheOrganizationandcoordinateandmaintainregionaldatastorageandmanagementsystemsforthebenefitanduse of the Organization.
3.2 Major Characteristics of the Nile Perch FisheryNP is a native to the Nile system but was introduced together with Nile tilapia into lakes Kyoga and Victoria in the 1950s and 1960s. Following their introduction, the NP population expanded rapidly and is now distributed throughoutLakeVictoriawithjuvenilefishtendingtoinhabitshallowinshorewaterswhilstlargerfisharemorewidely distributed. Following the introduction of NP and Nile tilapia, the increased NP population coupled with overfishingledtodramaticchangesintheecologyandareductioninthebiodiversityofthelake.
The catches of NP reached a maximum of about 340 000 tonnes in 1990. The catches have subsequently varied between 200 000 tonnes and 300 000 tonnes per year since 1993. In 2014, landings were estimated at 251 060 tonnes (draft LV-FMP3, 2015-2020).
Figure 2: Annual catch of Nile perch on Lake Victoria in tonnes (1990-2011) - source: LVFO
7 The functions of the LVFO are to: a) Promote the proper management and optimum utilization of fisheries and other resources of the lake; b) Enhance the capacity of existing fisheries institutions; c) Provide a forum for discussion of the impacts of initiatives on the lake; d) Provide for the conduct of research on the living resources of the lake and its environment; e) Coordinate and undertake training and extension in all aspects of fisheries; f) Consider and advise on the impact of introductions on non-indigenous organisms into the lake; g) Serve as a clearing-house and a data bank for information on the fisheries of the lake; h) Promote the dissemination of information.
100 000
150 000
200 000
250 000
300 000
350 000
400 000
1990
1992
1994
1996
1998
2000
2002
2004
2006
2008
2010
2012
2014
16 LVFO NILE PERCH FISHERIES MANAGEMENT PLAN, 2015-2019 (NPFMP2, APRIL 2015) 17
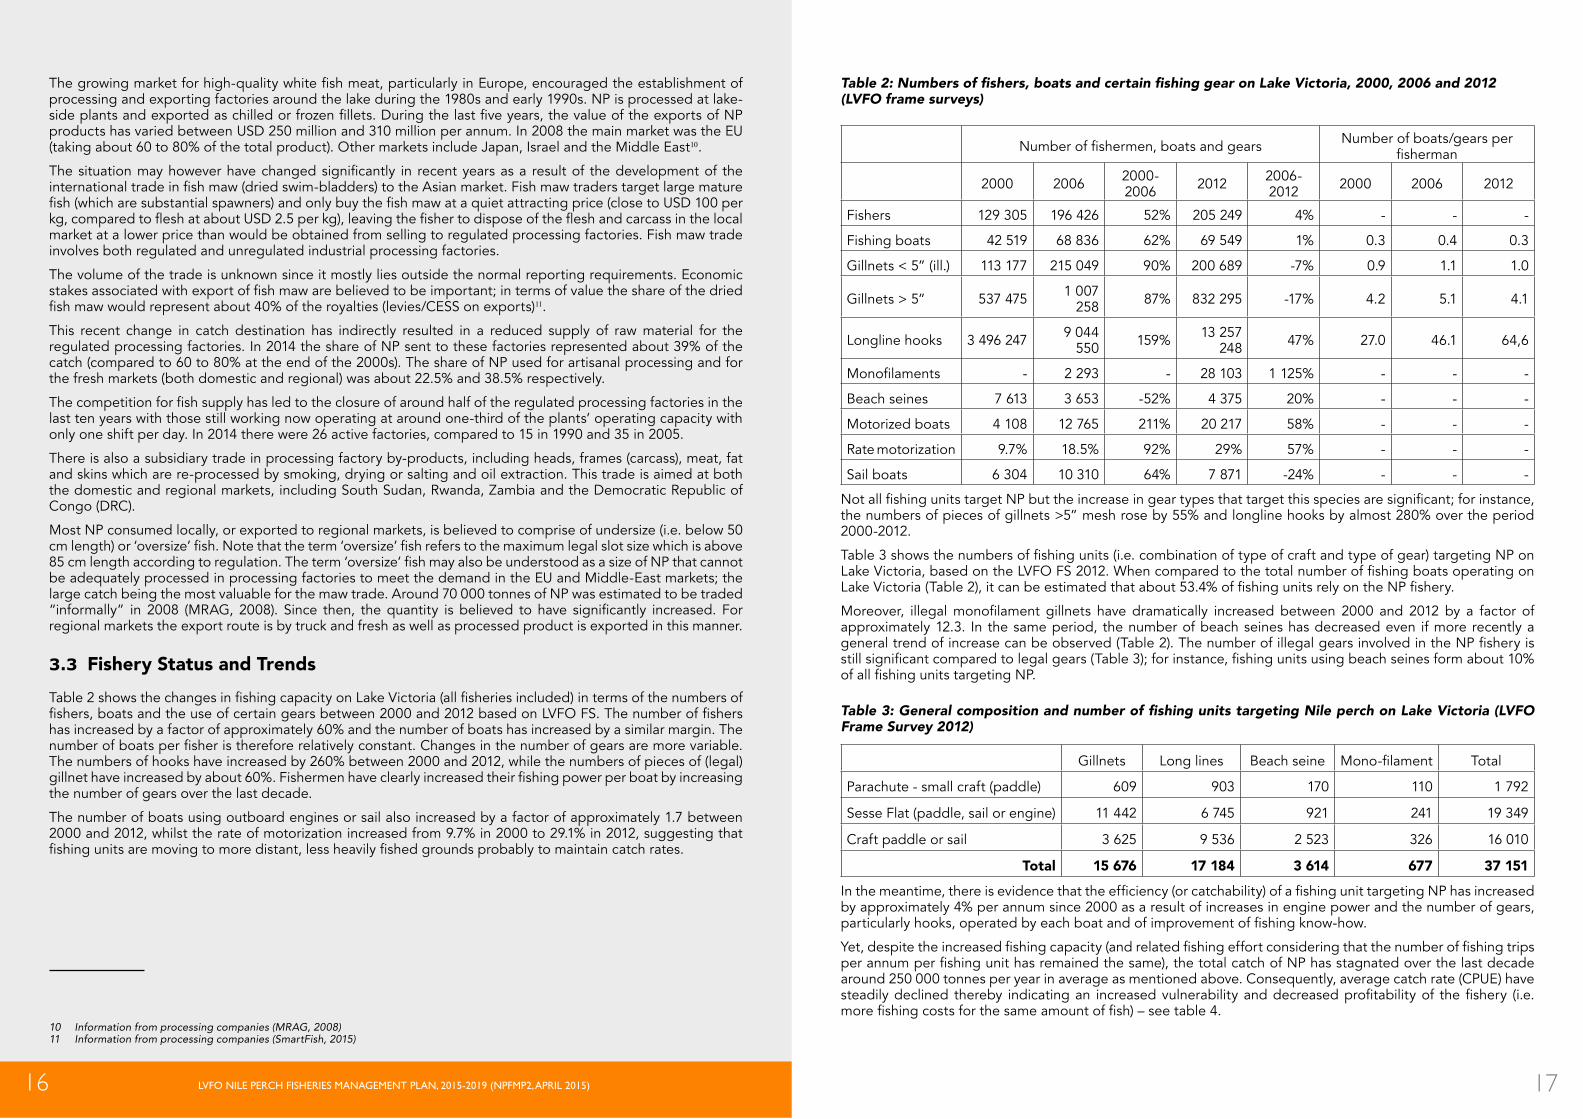
Table 2: Numbers of fishers, boats and certain fishing gear on Lake Victoria, 2000, 2006 and 2012 (LVFO frame surveys)
Numberoffishermen,boatsandgears Number of boats/gears per fisherman
2000 2006 2000-2006 2012 2006-
2012 2000 2006 2012
Fishers 129 305 196 426 52% 205 249 4% - - -
Fishing boats 42 519 68 836 62% 69 549 1% 0.3 0.4 0.3
Gillnets < 5” (ill.) 113 177 215 049 90% 200 689 -7% 0.9 1.1 1.0
Gillnets > 5” 537 475 1 007 258 87% 832 295 -17% 4.2 5.1 4.1
Longline hooks 3 496 247 9 044 550 159% 13 257
248 47% 27.0 46.1 64,6
Monofilaments - 2 293 - 28 103 1 125% - - -
Beach seines 7 613 3 653 -52% 4 375 20% - - -
Motorized boats 4 108 12 765 211% 20 217 58% - - -
Rate motorization 9.7% 18.5% 92% 29% 57% - - -
Sail boats 6 304 10 310 64% 7 871 -24% - - -
NotallfishingunitstargetNPbuttheincreaseingeartypesthattargetthisspeciesaresignificant;forinstance,the numbers of pieces of gillnets >5” mesh rose by 55% and longline hooks by almost 280% over the period 2000-2012.
Table3showsthenumbersoffishingunits(i.e.combinationoftypeofcraftandtypeofgear)targetingNPonLakeVictoria,basedontheLVFOFS2012.WhencomparedtothetotalnumberoffishingboatsoperatingonLakeVictoria(Table2),itcanbeestimatedthatabout53.4%offishingunitsrelyontheNPfishery.
Moreover, illegalmonofilament gillnets have dramatically increasedbetween 2000 and 2012by a factor ofapproximately 12.3. In the same period, the number of beach seines has decreased even if more recently a generaltrendofincreasecanbeobserved(Table2).ThenumberofillegalgearsinvolvedintheNPfisheryisstillsignificantcomparedtolegalgears(Table3);forinstance,fishingunitsusingbeachseinesformabout10%ofallfishingunitstargetingNP.
Table 3: General composition and number of fishing units targeting Nile perch on Lake Victoria (LVFO Frame Survey 2012)
Gillnets Long lines Beach seine Mono-filament Total
Parachute - small craft (paddle) 609 903 170 110 1 792
Sesse Flat (paddle, sail or engine) 11 442 6 745 921 241 19 349
Craft paddle or sail 3 625 9 536 2 523 326 16 010
Total 15 676 17 184 3 614 677 37 151
Inthemeantime,thereisevidencethattheefficiency(orcatchability)ofafishingunittargetingNPhasincreasedby approximately 4% per annum since 2000 as a result of increases in engine power and the number of gears, particularlyhooks,operatedbyeachboatandofimprovementoffishingknow-how.
Yet,despitetheincreasedfishingcapacity(andrelatedfishingeffortconsideringthatthenumberoffishingtripsperannumperfishingunithasremainedthesame),thetotalcatchofNPhasstagnatedoverthelastdecadearound 250 000 tonnes per year in average as mentioned above. Consequently, average catch rate (CPUE) have steadilydeclined thereby indicatingan increasedvulnerabilityanddecreasedprofitabilityof thefishery (i.e.morefishingcostsforthesameamountoffish)–seetable4.
Thegrowingmarketforhigh-qualitywhitefishmeat,particularlyinEurope,encouragedtheestablishmentofprocessing and exporting factories around the lake during the 1980s and early 1990s. NP is processed at lake-sideplantsandexportedaschilledorfrozenfillets.Duringthelastfiveyears,thevalueoftheexportsofNPproducts has varied between USD 250 million and 310 million per annum. In 2008 the main market was the EU (taking about 60 to 80% of the total product). Other markets include Japan, Israel and the Middle East10.
Thesituationmayhoweverhavechangedsignificantly in recentyearsasa resultof thedevelopmentof theinternationaltradeinfishmaw(driedswim-bladders)totheAsianmarket.Fishmawtraderstargetlargematurefish(whicharesubstantialspawners)andonlybuythefishmawataquietattractingprice(closetoUSD100perkg,comparedtofleshataboutUSD2.5perkg),leavingthefishertodisposeofthefleshandcarcassinthelocalmarket at a lower price than would be obtained from selling to regulated processing factories. Fish maw trade involves both regulated and unregulated industrial processing factories.
The volume of the trade is unknown since it mostly lies outside the normal reporting requirements. Economic stakesassociatedwithexportoffishmawarebelievedtobeimportant;intermsofvaluetheshareofthedriedfishmawwouldrepresentabout40%oftheroyalties(levies/CESSonexports)11.
This recent change in catch destination has indirectly resulted in a reduced supply of raw material for the regulated processing factories. In 2014 the share of NP sent to these factories represented about 39% of the catch (compared to 60 to 80% at the end of the 2000s). The share of NP used for artisanal processing and for the fresh markets (both domestic and regional) was about 22.5% and 38.5% respectively.
Thecompetitionforfishsupplyhasledtotheclosureofaroundhalfoftheregulatedprocessingfactoriesinthelast ten years with those still working now operating at around one-third of the plants’ operating capacity with only one shift per day. In 2014 there were 26 active factories, compared to 15 in 1990 and 35 in 2005.
There is also a subsidiary trade in processing factory by-products, including heads, frames (carcass), meat, fat and skins which are re-processed by smoking, drying or salting and oil extraction. This trade is aimed at both the domestic and regional markets, including South Sudan, Rwanda, Zambia and the Democratic Republic of Congo (DRC).
Most NP consumed locally, or exported to regional markets, is believed to comprise of undersize (i.e. below 50 cmlength)or‘oversize’fish.Notethattheterm‘oversize’fishreferstothemaximumlegalslotsizewhichisabove85cmlengthaccordingtoregulation.Theterm‘oversize’fishmayalsobeunderstoodasasizeofNPthatcannotbe adequately processed in processing factories to meet the demand in the EU and Middle-East markets; the large catch being the most valuable for the maw trade. Around 70 000 tonnes of NP was estimated to be traded “informally” in 2008 (MRAG,2008). Since then, thequantity isbelieved tohave significantly increased. Forregional markets the export route is by truck and fresh as well as processed product is exported in this manner.
3.3 Fishery Status and Trends Table2showsthechangesinfishingcapacityonLakeVictoria(allfisheriesincluded)intermsofthenumbersoffishers,boatsandtheuseofcertaingearsbetween2000and2012basedonLVFOFS.Thenumberoffishershas increased by a factor of approximately 60% and the number of boats has increased by a similar margin. The numberofboatsperfisheristhereforerelativelyconstant.Changesinthenumberofgearsaremorevariable.The numbers of hooks have increased by 260% between 2000 and 2012, while the numbers of pieces of (legal) gillnethaveincreasedbyabout60%.Fishermenhaveclearlyincreasedtheirfishingpowerperboatbyincreasingthe number of gears over the last decade.
The number of boats using outboard engines or sail also increased by a factor of approximately 1.7 between 2000 and 2012, whilst the rate of motorization increased from 9.7% in 2000 to 29.1% in 2012, suggesting that fishingunitsaremovingtomoredistant,lessheavilyfishedgroundsprobablytomaintaincatchrates.
10 Information from processing companies (MRAG, 2008)11 Information from processing companies (SmartFish, 2015)
18 LVFO NILE PERCH FISHERIES MANAGEMENT PLAN, 2015-2019 (NPFMP2, APRIL 2015) 19
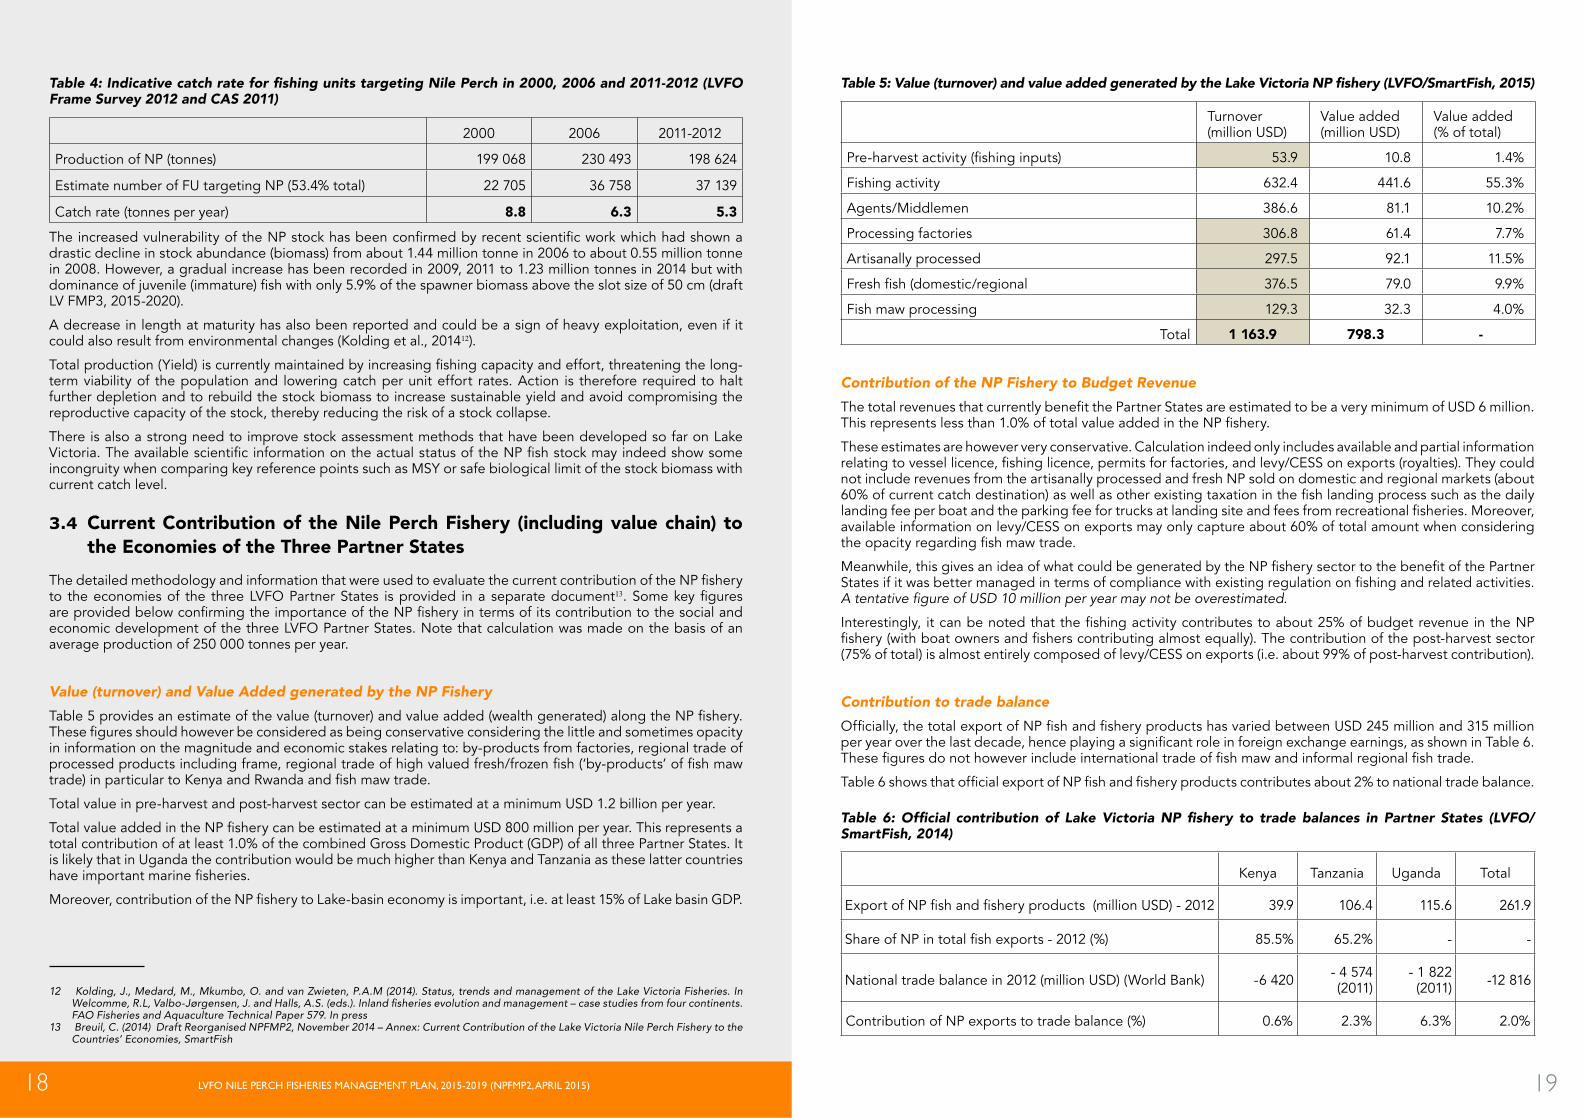
Table 5: Value (turnover) and value added generated by the Lake Victoria NP fishery (LVFO/SmartFish, 2015)
Turnover (million USD)
Value added (million USD)
Value added (% of total)
Pre-harvestactivity(fishinginputs) 53.9 10.8 1.4%
Fishing activity 632.4 441.6 55.3%
Agents/Middlemen 386.6 81.1 10.2%
Processing factories 306.8 61.4 7.7%
Artisanally processed 297.5 92.1 11.5%
Freshfish(domestic/regional 376.5 79.0 9.9%
Fish maw processing 129.3 32.3 4.0%
Total 1 163.9 798.3 -
Contribution of the NP Fishery to Budget RevenueThetotalrevenuesthatcurrentlybenefitthePartnerStatesareestimatedtobeaveryminimumofUSD6million.Thisrepresentslessthan1.0%oftotalvalueaddedintheNPfishery.
These estimates are however very conservative. Calculation indeed only includes available and partial information relatingtovessellicence,fishinglicence,permitsforfactories,andlevy/CESSonexports(royalties).Theycouldnot include revenues from the artisanally processed and fresh NP sold on domestic and regional markets (about 60%ofcurrentcatchdestination)aswellasotherexistingtaxationinthefishlandingprocesssuchasthedailylandingfeeperboatandtheparkingfeefortrucksatlandingsiteandfeesfromrecreationalfisheries.Moreover,available information on levy/CESS on exports may only capture about 60% of total amount when considering theopacityregardingfishmawtrade.
Meanwhile,thisgivesanideaofwhatcouldbegeneratedbytheNPfisherysectortothebenefitofthePartnerStatesifitwasbettermanagedintermsofcompliancewithexistingregulationonfishingandrelatedactivities.A tentative figure of USD 10 million per year may not be overestimated.
Interestingly, itcanbenotedthatthefishingactivitycontributestoabout25%ofbudgetrevenueintheNPfishery(withboatownersandfisherscontributingalmostequally).Thecontributionofthepost-harvestsector(75% of total) is almost entirely composed of levy/CESS on exports (i.e. about 99% of post-harvest contribution).
Contribution to trade balanceOfficially,thetotalexportofNPfishandfisheryproductshasvariedbetweenUSD245millionand315millionperyearoverthelastdecade,henceplayingasignificantroleinforeignexchangeearnings,asshowninTable6.Thesefiguresdonothoweverincludeinternationaltradeoffishmawandinformalregionalfishtrade.
Table6showsthatofficialexportofNPfishandfisheryproductscontributesabout2%tonationaltradebalance.
Table 6: Official contribution of Lake Victoria NP fishery to trade balances in Partner States (LVFO/SmartFish, 2014)
Kenya Tanzania Uganda Total
ExportofNPfishandfisheryproducts(millionUSD)-2012 39.9 106.4 115.6 261.9
ShareofNPintotalfishexports-2012(%) 85.5% 65.2% - -
National trade balance in 2012 (million USD) (World Bank) -6 420 - 4 574 (2011)
- 1 822 (2011) -12 816
Contribution of NP exports to trade balance (%) 0.6% 2.3% 6.3% 2.0%
Table 4: Indicative catch rate for fishing units targeting Nile Perch in 2000, 2006 and 2011-2012 (LVFO Frame Survey 2012 and CAS 2011)
2000 2006 2011-2012
Production of NP (tonnes) 199 068 230 493 198 624
Estimate number of FU targeting NP (53.4% total) 22 705 36 758 37 139
Catch rate (tonnes per year) 8.8 6.3 5.3
TheincreasedvulnerabilityoftheNPstockhasbeenconfirmedbyrecentscientificworkwhichhadshownadrastic decline in stock abundance (biomass) from about 1.44 million tonne in 2006 to about 0.55 million tonne in 2008. However, a gradual increase has been recorded in 2009, 2011 to 1.23 million tonnes in 2014 but with dominanceofjuvenile(immature)fishwithonly5.9%ofthespawnerbiomassabovetheslotsizeof50cm(draftLV FMP3, 2015-2020).
A decrease in length at maturity has also been reported and could be a sign of heavy exploitation, even if it could also result from environmental changes (Kolding et al., 201412).
Totalproduction(Yield)iscurrentlymaintainedbyincreasingfishingcapacityandeffort,threateningthelong-term viability of the population and lowering catch per unit effort rates. Action is therefore required to halt further depletion and to rebuild the stock biomass to increase sustainable yield and avoid compromising the reproductive capacity of the stock, thereby reducing the risk of a stock collapse.
There is also a strong need to improve stock assessment methods that have been developed so far on Lake Victoria.TheavailablescientificinformationontheactualstatusoftheNPfishstockmayindeedshowsomeincongruity when comparing key reference points such as MSY or safe biological limit of the stock biomass with current catch level.
3.4 Current Contribution of the Nile Perch Fishery (including value chain) to the Economies of the Three partner States
ThedetailedmethodologyandinformationthatwereusedtoevaluatethecurrentcontributionoftheNPfisheryto the economies of the three LVFO Partner States is provided in a separate document13.SomekeyfiguresareprovidedbelowconfirmingtheimportanceoftheNPfisheryintermsofitscontributiontothesocialandeconomic development of the three LVFO Partner States. Note that calculation was made on the basis of an average production of 250 000 tonnes per year.
Value (turnover) and Value Added generated by the NP FisheryTable5providesanestimateofthevalue(turnover)andvalueadded(wealthgenerated)alongtheNPfishery.Thesefiguresshouldhoweverbeconsideredasbeingconservativeconsideringthelittleandsometimesopacityin information on the magnitude and economic stakes relating to: by-products from factories, regional trade of processedproductsincludingframe,regionaltradeofhighvaluedfresh/frozenfish(‘by-products’offishmawtrade)inparticulartoKenyaandRwandaandfishmawtrade.
Total value in pre-harvest and post-harvest sector can be estimated at a minimum USD 1.2 billion per year.
TotalvalueaddedintheNPfisherycanbeestimatedataminimumUSD800millionperyear.Thisrepresentsatotal contribution of at least 1.0% of the combined Gross Domestic Product (GDP) of all three Partner States. It is likely that in Uganda the contribution would be much higher than Kenya and Tanzania as these latter countries haveimportantmarinefisheries.
Moreover,contributionoftheNPfisherytoLake-basineconomyisimportant,i.e.atleast15%ofLakebasinGDP.
12 Kolding, J., Medard, M., Mkumbo, O. and van Zwieten, P.A.M (2014). Status, trends and management of the Lake Victoria Fisheries. In Welcomme, R.L, Valbo-Jørgensen, J. and Halls, A.S. (eds.). Inland fisheries evolution and management – case studies from four continents. FAO Fisheries and Aquaculture Technical Paper 579. In press
13 Breuil, C. (2014) Draft Reorganised NPFMP2, November 2014 – Annex: Current Contribution of the Lake Victoria Nile Perch Fishery to the Countries’ Economies, SmartFish

20 LVFO NILE PERCH FISHERIES MANAGEMENT PLAN, 2015-2019 (NPFMP2, APRIL 2015) 21
• Established harvesting rules.
• Industry self-monitoring with established penalty rules.
• Importance of NP fishing and related activities for wealth creation, foreign exchange earnings,employment creation, and food security to wider community.
• Establishedtradingandmarketingchainswithqualitycontrolsandstandardsforcertaintypesoffishproducts and markets.
• Available resources, infrastructure and technical capacity.
Major WeaknessesintheNPfisheryincludethefollowing:• Inadequate follow-up of agreed issues among Partner States (measures, recommendations, etc.)
• Poor funding levels for the LVFO and its Secretariat by Partner States with delayed payment of operational funds impacting on regional activities. This makes reference inter alia to the funding of Secretariat by Partner States through line ministries instead of directly through the EAC
• Reliance on donor projects and funding for research and MCS activities.
• InadequacyofinstitutionalstructuresandstaffingarrangementsinLVFOSecretariat.
• PoorfundingofBMUsoperatesagainstco-managementrole.Weaklegitimacywithinfishingcommunitiesand poor leadership of some BMUs is also a problem.
• Inadequate understanding of precautionary principle at high level impedes prompt management action.
• Thefisheryisover-fishedandtherehasbeenincreasingencroachmentonthespawningbiomass.Thisisdangerousforthelong-termsurvivalofthefishery.
• Severalgapsinavailabilityofhigh-qualityfisheriesdata.
• Insufficientlevelofknowledgeaboutfisheryandbiology.
• Importance and increased demand of the unregulated regional markets.
• DeficienciesinfishqualityforcertainNPvaluechain
• PovertyandHIVAidshaveanegativeimpactonconservingfishstocks(short-termoutlookoffishers).
Major OpportunitiesintheNPfisheryincludethefollowing:• Acceptance of stock decline situation and acceptance of the need for action by all stakeholders at all
levels.
• Recognition of LVFO and its functions in the EAC Treaty.
• RecognitionoftheneedtoestablishspecificfishinglicencesforLakeVictoria,includingaspecificNPfishinglicence(LVFO-CoM,November2013).
• In one Partner State (Uganda), recent initiative of permanent markings for fishing vessels/vesselidentificationplateson-going.
• Several recent initiatives/funding for improved MCS, including procurement of new and rehabilitation of patrol vessels.
• The BMUs operate at primary level and are well-established with opportunity to be effective co-management bodies.
• Therecognitionofeco-labellingasatoolforsustainablefisheriesmanagementbycross-sectionofkeyplayers provides opportunity for lake-wide application.
• Donor and development partner interest in selected research and MCS projects in Lake Victoria area.
• Possibilitytoincreasevalueadditioninthe‘traditional’fishprocessingindustrytargetinginternationalandregionalmarketsandinthefishmawtrade.
• Established markets in developed countries.
Major Threats intheNPfisheryincludethefollowing:• Openaccessfishingregime,poorregulationoffishingeffortandunsustainablefishingcapacity.
• Lowcostofentryhasexacerbatedtheexpansioninnumbersoffishingunitstoalevelwherewithdrawal
Contribution to employmentBasedonthegenerallyacceptedratioof2.5workersinthepre-andpost-harvestsectorstoeachfisher,thetotalnumberemployedintheNPfisherycanbeestimatedat442000persons(Table7).Theseestimatescouldhowever be largely underestimated as stressed by countries. Unfortunately, no information is available to adjust them.
TheonlydataavailableongenderissuesintheNPfisherycomefromUganda;theseindicatethatwomenplayasignificantroleinthepost-harvestsectormakingup80%oftheartisanalprocessinglabourforce,39%offreshmarketretailers;36%intheprocessingfactoriesand40%infishmawprocessing.
Table 7: Contribution of Lake Victoria NP fishery to employment in Partner States (LVFO/SmartFish, 2014)
Kenya Tanzania Uganda Total
NumberoffishersinvolvedinNPfishing 20 675 58 197 47 562 126 435
Estimated number of workers in NP pre- and post-harvest sectors 51 689 145 494 118 904 316 087
- of which in processing factories (2 190) (3 285) (5 500) (10 975)
Total 72 364 203 691 166 466 442 521
Contribution to food securityNPfishandfisheryproductsareprincipallysoldontheregionalandinternationalmarkets.Itisestimatedthatonly30%ofthetotalNPcatchissoldwithinthePartnerStates’markets;thecontributionoftheNPfisherytofishconsumptioninthethreePartnerStatesisestimatedtobe6.5%(Table8).
At lake-level, such ratio is however believed to be much higher and steadily increasing as a result of recent changeincatchdestinationwithlessfishenteringintoregulatedprocessingfactories.
Table 8: Contribution of the NP fishery to fish consumption in Partner States (LVFO/SmartFish, 2014)
Kenya Tanzania Uganda Total
Population (‘000) – 2012 43 180 47 780 36 350 127 310
Fish consumption in 2009 (kg/person/year) – FAO 3.4 5.7 13.5 -
Totalfishavailability(tonnes/year) 146 812 272 346 490 725 909 883
Total NP availability 2011 (30% total catch) (tonnes/year) - - - 59 587
ContributionofNPtofishconsumption(%) - - - 6.5%
3.5 SWOT Analysis of the Nile Perch FisheryMajor strengthsintheNPfisheryincludethefollowing:
• Existenceofadequatefisheriesmanagementframework(throughLVFO)
• ExistenceofnationalinstitutionalarrangementsforLakeVictoriafisheriesmanagementcapableofbeingrestructured.
• Established Beach Management Units (BMUs) and BMU networks.
• Established processing associations.
22 LVFO NILE PERCH FISHERIES MANAGEMENT PLAN, 2015-2019 (NPFMP2, APRIL 2015) 23
4 NIlE pERCh fIShERY MANAgEMENT plAN fOR LAke ViCTORiA, 2015-2019 (NPFMP2)
4.1 Towards a New paradigm for Adequate and Responsible Management of the Nile Perch Fishery
ThecurrentsituationandmajortrendsintheNPfisherycanbesummarisedasfollows:
• ThehealthoftheNPstockisofanincreasingconcernduetoexcessivefishingpressureandanextremelyhighnumberofsmallandimmaturefishinthecatchesandadeteriorationofthereproductivecapacityofthestockastherearefewerfemalesandfemalesaresmallerinsizeatfirstmaturity.Thishasresultedfroma steady increaseof fishing capacity andeffort anda tremendous increaseof illegalgear andpractices,makingtheNPfisherymoreandmorevulnerable.
• Thereislowcompliancewithfishinglicencingsystemwhichmeansthataccesstothefisheryispoorlyregulatedandalmostfreeforresourceusers.Atthesametimetheincreaseinregionalfishtradeandfishmawtrade,which is generally informal, is resulting in less control of post-harvest sub-sector. Generally speaking, the NP fisheryinvolvesanincreasednumberofactors(bothinfishingandvaluechain)operatinginanunregulatedandinformal environment. This has led to increased complexity of the management system and negative impacts on both the local economies and the budget revenue. In other words, there is increased unfair distribution ofthewealthgeneratedbythefisheryresourcetothedetrimentofpeoplelivinginthethreePartnerStates.
of units is likely to have a possibly unacceptable political cost.
• Substantialquantitiesof“IUU”fishtradedinlocalandregionalmarkets.
• Weak and under-funded enforcement (MCS) systems.
• Political interferences take precedence over management decisions and implementation of management measures.
• Constrained governance standards affect management, notably that key players at local Government, arenotdirectlyanswerabletotheministryinchargeoffisheries.
• Increasedpovertyamongstthefishingcommunity,whichisbelievedtobeanaggravatingfactorforthedevelopment of illegal activities.
• Gapsinscientificinformationduetostalledresearchandsurveyactivities.
• Localisedpollutionandclimatechangeeffectsonthefishingenvironmentandfishstocks.
24 LVFO NILE PERCH FISHERIES MANAGEMENT PLAN, 2015-2019 (NPFMP2, APRIL 2015) 25
4.2 Goal and Specific Objectives of NPFMP2ThegoalandspecificobjectivesofNPFMP2shouldbeinlinewithobjectivesstatedinoverarchingLVFOpolicydocuments and recent LVFO-CoM recommendations. Policy documents include the Strategic Vision for Lake Victoria (1999-2015), Regional Plans of Actions and the draft Fisheries Management Plan for Lake Victoria, 2015-2020 (FMP3) under preparation.
The Strategic Vision for Lake Victoria (1999-2015) underlines the need of a healthy ecosystem and to assure a sustainable development of resources14.
TheRegionalPlanofActiontoprevent,deterandeliminateillegal,unreportedandunregulatedfishing(RPOA-IUU)onLakeVictoriaadoptedin2004bytheLVFO-CoMcontainsagreedmeasurestocombatIUUfishingonLakeVictoria.Theseincludeactionstolicenceandregisterfishingvessels,strengthenlawenforcementonthelake,promotecommunityparticipationinfisheriesthroughBeachManagementUnits(BMUs)andimplementaseriesoftechnicalmeasuresdesignedtoensuresustainablefisheries,includingaminimummeshsizeforgillnetsand slot size for NP. Implementation of RPOA-IUU is underway through legislation and plans of the Partner States.
The Regional Plan of Action for Management of Fishing Capacity on Lake Victoria (RPOA-Capacity) adopted in 2004bytheLVFO-CoMrecognizedeffortsbeingmadeinfisheriesmanagementandcommittedPartnerStatestomanagefishingcapacitytoprevent,deterandeliminateoverfishingonLakeVictoria.ImplementationoftheRPOA-Capacity is underway, but requires further support and agreement on measures to ensure achievement of key objectives.
The issue relating to access controls is a crucial issue in both RPOAs. The last LVFO-CoM meeting held in November 2013 recommended that the Partner States establish specificfishinglicences,includingaspecificNPfishinglicence.
The Vision of the draft FMP3 under preparation is “to contribute to the sustainable economic growth and reduction of poverty in the East Africa Community”. The focus of the Vision statement of the draft FMP3 is very clearly on impacts on the lives of people in fisheries15. The Goal of FMP3 is “sustainable utilization of fisheries resources of Lake Victoria basin to contribute to wealth creation and provide equitable opportunities and benefits in the EAC”.
Furthermore,foreachfishery-specificmanagementplantobedeveloped(suchasNPFMP2),thedraftFMP3indicates technical management measures (gear size restrictions, restricted areas, gear/fishing restrictions)aimedatachievingmanagementobjectives.TheobjectiveassignedtotheNPfisheryis“to rebuild NP biomass of Lake Victoria from current levels of 1.2 million tonnes to the historical highest standing biomass of 1.4 million tonnes”.
BasedonthecurrentsituationandtrendsoftheNPfishery,consideringtheneedforachangeintheparadigmforadequateandresponsiblemanagementoftheNPfishery,andwithreferencetotheabovepolicyguidance,theGoal and SpecificObjectives of theNile perch FisheryManagement Plan, 2015-2019 (NPFMP2) are asfollows:
GOAL
(long term):ToenabletheLakeVictoriaNileperchfisherytoincreaseitscontributiontotheeconomicand social development of the LVFO Partner States in a sustainable and responsible manner.
SPECIFIC OBJECTIVES (5 years):
To rebuild the biomass of the Nile perch stock to the level that will sustain catches above 300 000 tonnes per annum;
ToincreasewealthgeneratedbyNileperchfishingandrelatedactivitiesbyatleast10%throughimprovedregulationoffishingactivitiesandenhancedvalueadditionintheartisanal and industrial post-harvest sector;
Toimprovewealthsharingtothebenefitoflocalcommunities.
14 The LVFO developed its own Strategic Vision for Lake Victoria (1999-2015) which aimed to “foster a common systems/resource management approach amongst the Partner States in matters regarding Lake Victoria, with the goal of restoring and maintaining the health of its ecosystem, and assuring sustainable development to the benefit of the present and future generations”.
15 The 2015-2020 draft FMP Vision statement recognizes that “Lake Victoria and its basin will continue to be an engine for economic growth and poverty reduction in the region, acting as a central hub, welding the Partner States firmly together in a sphere of cultural, political, social and economic integration and harmony”.
• ThecontributionoftheNPfisherytothelocalandnationaleconomiesisstillimportant.Thismeansthatin addition to leading to an ecological crisis on Lake Victoria, a likely collapse of the NP stock would result in a significant social and economic crisis and related conflicts at local, national andpossiblyregional levels. This may have serious impact on the stability of the lake-basin area.
• ThemanagementsystemfortheNPfisheryis inadequate. Inparticularthereisexcessiverelianceondevolved management structures including BMUs which has proved to be inappropriate in the context oftheNPfisherywhichismainlyabusiness-orientedfisheryinvolvingcommercialactors(fishers,boat-owners, processors and traders). Note that the meaning of the word ‘commercial’ does not refer to the size of the economic units that are involved but rather to the logics of almost all the actors whose priority isclearlytoseekingprofits.Inotherwords,thevisionofafisherycapableofsupportingthelivelihoodsofthousandsoffishingcommunitiesandwhichcouldbemanagedthoughcommunity-basedarrangementsisnolongervalid.Thereisalsoapoorlevelofenforcementofexistingregulationsingeneralandfisheriesmanagement services are weak as a result of the lack of political will at decentralized and central levels toeffectivelymanagethefishery.Finally,managementinitiativesthathavebeensupportedbydonorsinthelasttwodecadeshavefocusedonscientificprojectsratherthanimplementationofmanagementmeasures.
Based on the above, there is now a crucial need for change in the management approach. The new paradigm can be resumed as follows:
• PromoteadifferentandmoreappropriateapproachforasocialmanagementoftheNPfishery,i.e.anapproachthatwouldbetterbenefitthelocalcommunities.Thisshouldnotonlyconsist inpromotingmechanismsfor furtherparticipationoffishers intheprovisionofmanagementservicessuchasdatacollection and MCS but rather in establishing enabling conditions to increase the creation of wealth anditssharingatlocalleveltothebenefitofsedentaryfishersandrelatedeconomicactors.Thiswouldincludeinparticularformalizationofeconomicactors,regulationoffishingactivities,promotionofsecureaccess to resources, and improvement of value chain.
• Need for a change in policy-driven at both central and local levels in relation to wealth generation. Current economic benefits that are derived from the NP fishery are sub-optimal and they are notsustainable.Economicbenefitscouldbeatleastsustainedandpossiblysignificantlyincreasedprovidedhowever that decision-makers make the necessary institutional and infrastructural investments and set-upadequatefiscalarrangements.Whiledoingso,decision-makersshouldconsiderthatreturnoninvestmentcouldbeconsiderableandbeneficialtoallstakeholdersincludingtheStates(andhenceallpeople from the three Partner States).
• ThepromotionofaspecificandoperationalNPfisherymanagementplanisofutmostimportance.Majorlessons learned from NPFMP1 have shown that NPFMP2 should better address regulation of access toresources,fullcompliancewithexistingfishingregulationsandformalisation/regulationofallpost-harvest activities. Moreover, NPFMP2 should be more action-driven and implementation orientated than NPFMP1.
• Managementarrangements should further involveactual (commercial) actors includingfishers,boat-owners, processors and traders.
• Responsibilityofallpublicinstitutionsconcernedbyfisherymanagement(includinglocalgovernmentandtheJudiciarysystem)infulfillingtheirmission/mandateshouldbeseenasakeyconditionofsuccessofNPFMP2.Therewillthereforebeaneedtomobiliseadequatehuman,financial,andlogisticalmeansand to ensure that institutions are accountable of their actions.
• PromoteaproperapproachforthefinancingofNPFMP2.ThissignifiesthatfinancingofimplementationoffisheriesmanagementbyGovernments (central and local) shouldbe in relation tobio-ecological,economic and social stakes and to requirements. This also means that there should be no longer reliance onexternalfinancingforaction.Particularattentionshouldalsobeplacedonestablishingmechanismsforco-financingbyallcommercialoperatorsinvolvedinfishingandvaluechainandnotonlyregistered/regulated processing factories as it is today.
• Researchshouldfocusonprovidingtechnicalandscientificadvicetosupportdecision-makinginrelationto the implementation and the monitoring and evaluation of NPFMP2. This should include improving knowledge on resource dynamics and status and developing capacities in each country and at the LVFO Secretariat level in economic analysis.

26 LVFO NILE PERCH FISHERIES MANAGEMENT PLAN, 2015-2019 (NPFMP2, APRIL 2015) 27
effort by 15 to 20% by 2019 is considered realistic. Key challenges associated with NPFMP2 are to ensure that the risk zone where the stock may collapse is not reached and to shifting from a poorly managed to an effectively regulatedNPfisheryandvaluechain.
Based on the above, the outlines of the NPFMP2 strategy are as follows:
Immediate• Controlaccesstoresourcethroughminimalconditionsofaccesstoandformalisationofallfishersand
boat-ownersintheNPfishery.
• Regulateallpost-harvestactivitieswithafocusonregionaltradeandfishmawtrade.
• EnforceexistingpriorityfishingregulationsthrougheffectiveMCS,withprioritygiventothosedesignedtopreventthemostharmfulfishingpractices.
Short-to-medium term• Restrictfishingcapacitytothe2015level.
• Strengthen theNPfishery regulatory frameworkwith theobjectiveof further reducingfishingeffort(notably through introduction of a closed season for two months a year) and protecting NP resource (notablytoprotectthelargestspawnerstargetedbyfishmawtraders).
• Evaluatethefeasibilityofintroducingsecurefishingrights.
• Strengthenpost-harvestsector inrespecttofishqualityandwealthgeneration inbothartisanalandindustrial value chain (processing and trade).
These strategic elements are further developed below.
Inparallel,cross-cuttingactionswillneedtobepromoted.Thesewillincludeimproveddeliveryofkeyfisheriesmanagement services including general administration of the sector, MCS and research and improved legal and institutional framework. To this extent, particular emphasis will be placed on developing public-private partnership at both local and national levels and strengthening collaborative arrangements at regional level to adequatelyaddressregulationoffishingactivitiesandfishtrade.
Otherguidingprinciples for improvedgovernanceandmanagementof theNPfishery areprovided inboxbelow.
TheabovespecificmanagementobjectivesfortheNPFMP2,2015-2019,areinlinewiththefollowingnationalpoliciesinthefisherysector:
• Kenya: National Oceans and Fisheries Policy (NOFP) of 2008.
• Tanzania: National Fisheries Sector Policy and Strategy Statement of 1997, draft National Fisheries Policy (NFP) of 2010, and Fisheries Sector Development Program developed in 2011 to support the operationalization of the draft NFP of 2010.
• Uganda: National Fisheries Policy (NFP) of 2004 and Development Strategy and Investment Plan (DSIP) 2010-2015developedbytheMinistryinchargeoffisheries
Moreover, the specific objectives of NPFMP2 and the proposed strategy to achieve these objectives (seebelow) are in good coherence with the African Union’s Policy Framework and Reform Strategy for Fisheries and Aquaculture that focusesontheneedtopromotewealth-basedmanagement infisheries through improvedregulation of access to resources and development of opportunities in the value chain and to ensure equity in wealthdistributionthroughadequatefishingrightsandtaxation16.
4.3 Strategy for NPFMP2Considering thecurrent statusof theNP resourceand thegradualdeclineof theNPfishery in termsof itscontribution to the economies of the three Partner States, the overall strategy of NPFMP2toreachthespecificobjectivesshouldbefirsttofocusonactionsaimedatreducingthefishingpressureandrebuildingtheNPstocktoapointthatitiscompatiblewithitssustainability.ThiswillbeachievedthroughtheregulationofallNPfishingand related activities and compliance with existing regulations.
Whenthisobjectiveofan‘acceptablelevelofoverfishing’andyieldisachieved(i.e.whentheleveloffishingpressure is compatible with the carrying capacity of the stock), managers may then wish to promote actions aimed at continuing rebuilding theNP stock, further regulating fishing effort (e.g. by introducing a closedseason)andstrengtheningpost-harvestsectorinordertosatisfymorespecificfisherymanagementobjectivesof an ecological, social and/or economic nature.
A range of potential management options were explored to reduce the fishing pressure using a biomassdynamicsmodelofthefishery.Theseoptionsfocuseduponintroducingeasilymonitoredandenforcedcontrolsoverfishingeffort(numberoffishingdays,numbersofboats,gearsandboatpropulsion)andenforcementofexisting regulations17.
Inordertoreducefishingpressure,twomainoptionsareavailable.Thefirstoption(input-control)consistsofregulatingthefishingeffortexertedontheresourcewithemphasisoncontrollingfishingactivities(numberoffishingunits,numberoffishingdays,etc.).Thesecondoption(output-control)requiresregulationofthefishingmortalitythroughcontrollingfishharvestingorfishlandingsorpost-harvestactivities.Eachofthetwooptionshasitsownadvantagesanddisadvantagesdependingonthecharacteristicsofthefisherytobemanaged.InthecaseoftheLakeVictoriaNPfishery,thesecondoptionisnotrealisticconsideringthenumberoffishlandingsites (3450kmof shoreline)and theexistenceof significantdomesticand regionalmarkets thatarepoorlyregulated. At the time when NP products were largely sold on the international market through processing factories, this option could have been considered but this is no longer an option.
The preferred option to reduce fishing pressure is therefore to promote an ‘input-control’ managementsystem,withpriorityactionsincludingputtinganendtotheopenaccess,reducingillegalfishingandgraduallyestablishing clearer user rights. Other related key challenges relating to this option include preventing further increasein,andpossiblyreducing,theoverallfishingcapacity(byremovingillegalfishing)before,orinparallelto,promotingmeasuresaimedatreducingfishingeffortsuchasclosedseasons.Additionalmeasuresaimedatcontributing to the conservation of the resource, such as closed/protected areas, may also need to be introduced in a longer term.
ThetotaltargetintermsofreducedfishingeffortattheendofNPFMP2couldbecloseto15-20%. This target may be below recommendations of scientists, aiming to reach the theoretical MSY level, however, considering current weaknesses in the governance system and due to the balancing of social challenges and the possible destabilizing effect that massive management actions may have at the lake-basin level area, a target to reduce
16 See Policy Framework & Reform Strategy for Fisheries and Aquaculture in Africa (2014) NEPAD Planning and Coordinating Agency.17 Size/age-related harvest controls (landing size restrictions, gear size restrictions, slot size etc.) and controls over the spatial
distribution of effort (closed areas) could not be examined due to lack of suitable data. However, the effects of such controls could be examined in the future with the application of an age-structured model (see proposed action for research in NPFMP2 action plan).
28 LVFO NILE PERCH FISHERIES MANAGEMENT PLAN, 2015-2019 (NPFMP2, APRIL 2015) 29
It will be essential to ensure harmonization of procedures and conditions attached to licencing among the three Partner States.
4.3.2 Regulate All Post-Harvest Activities (immediate)
Ensuring proper regulation of post-harvest activities will involve putting emphasis on the effective issuance of permits/authorisations to all economic entities involved in value addition in accordance to existing regulations in each of the three Partner States. The existing regulations distinguish the following categories:
• Annual permit/authorization for 1 agent/middleman
• Annual permit/authorization for 1 fish retailer
• Annual permit/authorization for 1 artisanal fish processor
• Annual permit/authorization for 1 processing factory
• Annual permit/authorization for 1 fish maw processor
There will be also a need to extend the issuance of Fish Movement Orders/Permits from Lake Victoria (FMO/P issuedbyCompetentAuthoritiesinthecontextoftraceabilityofproducts)toallNPfishandfisheryproductswhatevertheirfinaldestination.Notethattheissuanceofsuchadministrativeactiscurrentlypoorlyeffectiveinthe cases of domestic and regional trades.
MeasurestocontrolentryofIUUfishintothedomesticandregionalmarketchannelswillalsoincludestrengtheningof border controls, inter-agency collaboration and inter-country collaboration.
4.3.3 Enforce Existing Priority NP Fishery Regulations (immediate)
Enforcementof existing regulationswith respect to IUUfishingwould result inmajorprogress towards improvedconservationof resourcesbyeliminatingharmfulfishingpracticesandmakeasignificantcontribution towards theobjectiveofreducingfishingcapacityandeffort.CombattingIUUfishinghoweverpresentssomechallengesasfollows:
• MCS requires considerable funding if satisfactory intelligence and operational activities are to be achieved at lake level.
• To ensure successful MCS certain governance elements require improvements, including the adoption of increased penalties in case of infringements to provide a deterrent effect and the setting-up of an enabling environment for proper prosecution.
• Harmonization of regulations and a concerted effort is required by all three countries to ensure that illegal fishers would not simply move in response to enforcement operations from one Partner State to another Partner State.
• If fishers change behaviour from illegal to legal fishing because of enforcement, i.e. if the numbers of legal fishers increase in response to intervention, then the overall fishing capacity (in respect to numbers of fishers) would remain the same, however the overall effort may be reduced.
CombattingIUUfishingshouldbegivenhighpriorityduetothepotentialtoimplementitrelativelyimmediatelyand the strong political will in favour of such an option with reference to the communiqué of the last LVFO-CoM held in November 2013 recommending the reactivation of the OSNP as a matter of urgency.
Although the NPFMP2 requires that the current regulations are retained in their entirety as they are at present. However, inacontextoffinancial, logisticalandhuman resourcesconstraints, therewillbeaneed to focusMCS and enforcement efforts on a limited number of regulations considered as priority, based on ecological, social, economic and institutional considerations with an objective of 100% compliance. The priority regulations include the following:
• NP fishing vessel registration.
• Specific NP fishing licence.
• Slot size for NP of 50 cm minimum.
• Use of gillnet mesh size above 6”.
• Prohibition of the use of beach seines.
• Prohibition of the use of monofilament gillnets.
• Registration of processing units, both artisanal and industrial.
4.3.1 Control Access to Resource (immediate)
Theestablishmentofminimalconditionsofaccesstoandformalisationofallfishersandboat-ownersintheNPfisheryshouldincludepromotionoftheapplicationofbasicadministrativetoolssuchasboatregistrationandthe issuingofspecificNPfishing licencesandthedevelopmentofbasicmonitoring tools tomonitorfishingcapacity. In particular this should consist of the following:
• Registration and marking of all vessels targeting NP (indicating inter alia nationality, name of owner, length, mode of propulsion, type of gear used, number of gear by craft, basic safety devices, etc.)
• Establishment of a specific annual NP fishing licence for Lake Victoria with agreed and consistent conditions among the three Partner States (e.g., a link between fishing licence and vessel registration, provisions for the licence to be suspended or revoked in case of serious infringement, requirements for declaring catch, etc.).
• Development of harmonized and computerized national and LVFO vessel registers and fishing licence registers for the NP fishery.
Theprocedureforregistrationandlicencingoffishingunitsshouldprovidetheopportunitytostoptheexistingopen(andquasi-free)accesstothefisheryandtocreateenablingconditionsthatwillallowinalaterstagetofurtherclarifyinguserrightsaswellastorestrictthefishingcapacitytoitscurrentlevel.Notethatinadditiontocreatingthepossibilitiesforeffectivelycontrollingfishingeffortatalaterstage,thismeasureisalsoofparticularrelevance for the success of certain technical measures including closed seasons, for instance, to prevent boat ownersfromfurtherinvestinginnewfishingunitsandincreasingtheiroveralleffortinthemonthsfollowingthereopeningofthefishery.
Other guiding principles for improved governance and management of the NP fisheryEcosystem Approach to Fisheries (EAF) and the Precautionary Approach The purpose of implementing an Ecosystem Approach to Fisheries (EAF) is to plan, develop and manage fisheriesinamannerthataddressesthemultipleneedsanddesiresofsocieties,withoutjeopardizingtheoptionsforfuturegenerationstobenefitfromthefullrangeofgoodsandservicesprovidedbyecosystems.An EAF strives to balance diverse societal objectives, by taking account of the knowledge and uncertainties of biotic, abiotic and human components of ecosystems and their interactions and applying an integrated approachtofisherieswithinecologicallymeaningfulboundaries.ApplyinganEAFwhendevelopingafisherymanagementplanshouldconsistofaddressingcomponentsof ecosystems within a geographic area, in this case, Lake Victoria, in a more holistic manner than is used in the current single-species approach and it would also consider the ecological, social and economic aspects ofthefishery.WhenapplyingEAFtothemanagementoftheNPfishery,sustainabilityofhaplochrominesspecies as an important prey base for NP and for its ecological role in the lake ecosystem should be given particular attention.The FAO Code of Conduct for Responsible Fisheries (FAO CCRF), 1995, and the EAF approach adopted to implement the CCRF encourages the authorities to develop fisheriesmanagement plans (FMP), withappropriate emphasis on the precautionary approach and rights-based allocation. Theprecautionaryapproachstatesthat“theabsenceofadequatescientificinformationshouldnotbeusedas a reason for postponing or failing to take measures to conserve target species, associated or dependent species and non-target species and their environment” (FAO CCRF, 1995. Art. 6.5)Gender equityThe active participation and respective role of men, women and youth in the fishery sector should berecognized and accounted for during the implementation of the NPFMP2, particularly as regards to post-harvest activities. Other social issuesOthersocial (humandimension)aspectsarehighontheagendaofanyartisanalfisherysuchastheLakeVictoriafisheries.ThesereferforinstancetowhethertheyoungareenteringthefisheryorwhetherAIDS/HIVorotherhealthissuesareofimportancesinceitmayleadtoshort-termismwithinthefishery.Alsopoverty,inequityinwealthdistribution,etc.shouldbegivenparticularattentioninthemanagementofanyfisheryinvolvingsmall-scalefishers.
30 LVFO NILE PERCH FISHERIES MANAGEMENT PLAN, 2015-2019 (NPFMP2, APRIL 2015) 31
aquaculture while making use of strategies provided by the FMP3 to increase availability of quality seed and feed and capacity building of technical staff and farmers.
Consolidation of conservation measures, notably to protect the largest spawners targeted by fish maw tradersThedramaticdevelopmentof thevery lucrativefishmawtrade in recentyearshas resulted inan increaseddemand for large NP (which form an important component of the spawning stock) that are also caught in shallow watersinbreedingareas.ThereisaregulationinallthreecountrieswhichdefinesthemaximumslotsizeofNPat85cmbutthisregulationisdifficulttoenforce,tothedetrimentoftheobservedrecruitmentover-fishing.Itisinthiscontextthatnewmeasuresshouldbepromotedinordertodiscouragethecatchoflargematurefish.This could be done through:
• Theformalizationoffishmawprocessors/exporters(registration/approvaltomeettherequirestandards,obligationoffishmovementpermits,etc.)–seeabove.
• Theintroductionofaregulationaimedatbanningthetradeoffishmawsheavierthanacertainweight(tobeidentifiedviaresearchwork)consideringthatMCSeffortstoenforcesuchmeasurescouldrelyoncollaborativemechanismswithCustoms(alldriedfishmawisexportedtoAsianmarkets).
Other conservation measures to protect the NP resource should also include the following:
• Protection of sensitive areas notably in the main breeding and nursery areas which are targeted by fishers.Someareashavealreadybeenpre-identifiedbyresearchbuttheyneedtobefurtherspecifiedbased on additional research programmes. When they are demarcated, priority sensitive areas (no fishingzone)shouldbegazetted.
• Promotionofmeasuresaimedatconservingthehaplochrominefisheryinrelationtospecificmanagementmeasures recommended in the draft FMP3.
4.3.6 Evaluate the Feasibility of Introducing Secure Fishing Rights (Short-to-Medium Term)
Thekeyissueinfisheriesmanagementrelatestotheregulationoftheaccesstoresources.Towardsthisend,theformalizationofactorsinvolvedinfishingactivities(boat-ownersandfishers)andtheendofopenaccessintheNPfisherywillconstituteessentialfirststeps.Inordertoensureincreasedwealthcreationinfishingactivity,anothermajorstepwillbetopromoteprocessestoclarifyandsecurefishingrights. It is inthiscontextthatNPFMP2willevaluatethefeasibilityofintroducingasystemoffishingright.
Akeyquestionthatwillhavetobeadequatelyevaluatedconcernsthenatureanddurationoffishingrights.Itisrecommendedthatthefishingrightbegiventoboat-ownerswhoinmostcasesownseveralfishingunits,foraduration of 5 years. Note that 5 years is the average lifespan of a craft (lifespan of gear averages 1.5 years) and 5 years should be the maximum duration of any NPFMP before its revision.
Thenatureofthefishingrightcouldtaketheformofaprivateaccessagreement(e.g.aconcessionforadurationof 5 years) between a given Partner State and a boat-owner. The concession should clearly indicate the number ofauthorizedfishingunitsperboat-owner(eachfishingunitbecomingeligibletospecificannualfishinglicence)andgiveprecisetechnicalspecificationstodefinethetotalfishingcapacityallowedperboat-owner.Itshouldclearly state that the concession can be suspended or cancelled in case of non-compliance with the terms of the agreementorfishingregulations.Aclearlinkshouldthenbeestablishedbetweenvesselregistration,privateaccessagreementand(annual)specificfishinglicencing.
AharmonizedandcomputerizednationalandLVFOfishingrightregisterfortheNPfisherycouldbeestablishedbefore the end of NPFMP2
At the end of NPFMP2, the administration and boat-owners could enter into a dialogue to revise the level and thedistributionamongboat-ownersofthetotalauthorizedfishingcapacityforthenext5years.Thesedecisionswould then support the revision of private access agreements for another 5 years.
4.3.7 Strengthen Post-Harvest Sector (Short-to-Medium Term)
Thepost-harvestfisherysectorisfacedwithproblemsrelatingtoinadequatefishquality,theexistenceofsomephysicalandeconomicpost-harvestlossesandinequityinthesharingofvalueadditionamongfishersandotherstakeholders. The causes of these problems are to be found in the lack of infrastructure and equipment, the useofunsuitablepracticesinfishhandling,processingandmarketing,poorfishqualitycontrolandinadequatemarket information systems.
Aprerequisitetothestrengtheningofpost-harvestsectorwillbetoformalize/regulatealltypesoffishprocessing
Whenlegalprovisionsaredraftedtosupporttheenvisagedestablishmentofafishingrightsystem(seeafter)MCS should aim towards 100% compliance of relevant regulations.
4.3.4 Restrict Fishing Capacity to the 2015 Level (Short-to-Medium Term)
Attheendofyear2ofNPFMP2atthelatest,itcanbeassumedthattheNPfisherywillbesatisfactorilyregulatedintermsofcompliancebyboat-owners,fishers,processorsandtraderswithexistingregulations. Inordertopreventanyincreaseinfishingcapacityandtocreateenablingconditionsforthepossibleintroductionofmoresophisticatedmeasuresaimedatreducingfishingeffortsuchasclosedseason,therewillbeaneedtorestricttheoverallNPfishingcapacitytothe2015level.Concretely,thismeansthatonlytherenewalofbothvesselandspecificfishinglicencingwillbeauthorizedusinginformationavailableonrelevantregisters.
ThisactionwilldefinitelyendthecurrentopenaccessregimeoftheNPfishery.
4.3.5 Strengthen the NP Fishery Regulatory Framework (Short-to-Medium Term).
Introduction of a closed season for two months a yearThepurposeofaclosedseasonistocontributetothereductionoftotalfishingeffortandtostrengthenthesetof technical management measures aimed at conserving the resource (e.g. reduce the risk of catching spawners or pre-spawners by introducing a closed season before and during the main breeding period). As indicated above,aconditionforsuccessofsuchameasureisthatthefishingcapacityiscapped.
For the introduction of a two months closed season, two approaches were considered: either a 1-day closure eachweek throughout theyear (52/365days=14% in termsof reducedfishingeffort)oracontinuous twomonthsclosureduringawell-definedandconsistentperiod(2/12months=16.6%intermsofreducedfishingeffort).Althoughacontinuousclosuremaybemoredisruptiveforprocessingfactoriesandpossiblyforfishers,itisthepreferredoptionforcost-efficiencyreasonsinrelationtoMCSandenforcement.
Other elements that should be taken into consideration for the introduction of a closed season are as follows:
• TheclosureshouldapplytoallfishingunitstargetingNPandshouldbecoveredbythesameregulationsfor all three countries.
• Harmonised national regulations should also allow for additional closures by Legal Notice in response to possible changed or exceptional circumstances.
• No Fish Movement Orders/Permits (FMO/P) from Lake Victoria should be issued for NP during closure period and it should be illegal to transport NP without an FMO/P or with an FMO/P issued during a closure period.
• NoNPshouldbereceivedbyanyfishprocessingentityduringaclosedperiod(withsomeexceptionsunder certain conditions to be further determined, for example, in the case of Uganda where there are other sources of NP supply from Lake Albert18 and Lake Kyoga19).
• No NP should be sold at a market for unless an FMO/P has been issued during a closure period.
• Accompanyingmeasuresshouldbepromotedspecificallyregardingtheexportofhighvaluechilled/frozen products on the international market so as to prevent any risk of a commercial nature20.
• Accompanyingmeasuresshouldalsobepromotedwithinfishingcommunitiessoastofacilitatetheiraccess to alternative livelihoods, in particular for sedentary communities. This will include promoting
18 Lake Albert is the natural home of the NP which was introduced to Lakes Victoria and Kyoga. In Lake Albert, there are two species of Nile perch (Lates niloticus and Lates macrophthalmus). A recent catch assessment survey was undertaken in in 2014. Results indicate an annual landing of 151 600 tonnes of fish from Lake Albert. Amongst the large commercial species, NP was the most dominant species caught on the lake and third overall with an estimated annual catch of 5 200 tonnes (2013) and 3 800 tonnes (2014) of the total production. Most of the NP caught is exported to the neighboring countries of Democratic Republic of Congo and Rwanda while their fish maws are brought to Kampala where it is processed for export to Hong Kong.
19 In Lake Kyoga, the introduced NP became a successful fishery just like in Lake Victoria resulting in Lake Kyoga having the highest catches in the 1970s with a catch of 167 000 tonnes in 1978. However, due to high fishing pressure, the fish catches in Lake Kyoga have declined to less than 50 000 tons. The most dominant species in the commercial catches include Tilapia, Rastrineobola, Nile perch, Protopterus, Clarias, Bagrus, Mormyrus and Synodontis in that order. The NP remains very important in terms of beach value. Some NP is taken to factories for processing while a majority is processed by artisanal processors for the regional market.
20 “From the market side, one of the key selling points of LVNP is its all-year-round availability. In changing this there would be impacts in demand and possibly long-term consequences. These would be minimised through explanation to the market of why it is necessary for sustainability reasons. Proper planning on shutting down the fishery, when it would be restarted and how it would be restarted are critical. The market must know when supplies will recommence and be prepared to market it with promotions so that it re-starts properly. In fact full stakeholder consultation is prudent to avoid a disaster in the fishery not re-starting exports
after a closure.” (MRAG, 2008)

32 LVFO NILE PERCH FISHERIES MANAGEMENT PLAN, 2015-2019 (NPFMP2, APRIL 2015) 33
differentfishinggeartypesonthefisheryandthegeneralecosystem.
• SpecificprojectstoregularlyevaluatethesocialandeconomicperformanceoftheNPfishery,betterunderstandingthemagnitudeandcoredriversofregionaltradeforillegalfishandfishinggears,betterunderstandingthefishmawtrade,valueadditionoffisheryproducts,improvementofwealthsharingtothebenefitoffishingcommunities,etc.
• Contribution to M&E of NPFMP2.
Monitoring, Control and Surveillance (MCS) to ensure compliance with fishery regulations• Strengthening of MCS capacities including the establishment of enforcement units.
• Coordination of MCS planning including through operationalizing National and Local/Decentralized Task Forces and strengthening regional coordination.
• Development of intelligence networks and systems.
• Conducting joint patrols.
• Inspectionandcontrolatfishlandingsites(50%total)andartisanalprocessors.
• Inspection and control within processing units (export).
• Awareness-raising, training and collaborative mechanisms with other administration (incl. Customs, Police,andRevenueAuthorities)tocontroltradeofillegalfishandfishinggearsinmarkets,manufacturingand strategic border posts.
• Strengthening and supporting BMUs and working with other community and education activities to promote voluntary compliance.
• Contribution to M&E of NPFMP2.
4.4.2 Improvement of the governance framework in NP fishery
Policy and planning issues• Integration of NPFMP2 into the Revised Lake Victoria FMP 2015-2020.
• IntegrationofNPFMP2intothefisheriesstrategiesandplansofthethreePartnerStates.
• Integration of NPFMP2 action plan into the Decentralized/Devolved Government action plans and any other sector plans as required.
Legal issues• Ensure adequate legal support for NPFMP2 in each of the three Partner States.
• Revision of penalties for increased deterrence of existing regulations whilst ensuring harmonization between the three Partner States.
• Development of new provisions where necessary (regulations and by-laws) relating to boat registration, privateaccessrights,specificNPfishinglicencing,fishingclosure,controlofthefishmawtrade(includingformalizationof fishmawprocessing), andfishquality standards fordomestic and regionalmarkets,whilst ensuring harmonization between the three Partner States.
• Amendment of East Africa Customs Management Act Schedule 2 (with the aim of empowering Revenue Authoritiestoprohibitallimportofmonofilamentnets,tradeinillegalNPandrequiretheCompetentAuthoritytoissueclearancetotradersingillnets,fishhooksandfisheryproducts).
• Ensureadequatelegalsupport(formation,operation,financing,etc.)forco-managementstructuresatvariouslevels(industry,BMUnetworks,fisherfolkassociations).
Co-management and Public-Private Partnership (PPP)• Revisit co-management guidelines for Lake Victoria, capacity building of BMUs, and promotion of
motivating mechanisms (e.g. rewards to BMUs for voluntary compliance and contribution to NPFMP2).
• Promotion of NP boat-owners associations, in consultation with BMUs, to support the process of establishing private access agreements.
• Promotionoffisherfolkassociations tostrengthenco-management includingthroughcontributiontothe delivery of management services.
and tradewhatever the final destinationof theNPfish andfisheryproducts. Thiswill be addressed in theimmediate term as stated above.
Inacontextofpoorlyregulatedfisheries(whichisthecasetodayformostLakeVictoriafisheries),careshouldbetaken when promoting value addition activities as these must be balanced with the status of the NP stock and developed to not exacerbate current over-capacity. In other words, a condition for the full success of actions in favourofvalueadditionandenhancedpro-poorgrowthshouldbethatNPfisheryisadequatelyregulated.Thatis the reason why most actions in relation to strengthening of post-harvest activities are planned in the short-to medium term.
DuringNPFMP2,emphasiswillbeplacedoncompliancetofoodsafetyinallfishprocessingfactoriesandonactions aimed at reducing physical and economic post-harvest losses.
4.4 NpfMp2 Action plan The NPFMP2 action plan for the period 2015-2019 is structured around four main types of actions as follows:
1. Deliverkeyfisheriesmanagementservices-Generalfisheryadministration,researchandMCS.
2. Improve the governance framework - Policy and planning and legal issues, co-management and Public-Private Partnership (PPP), collaborative and funding mechanisms.
3. Implement complementary actions - Communication of NPFMP2 to decision-makers, fishers andstakeholders,improvedaccessoffishingcommunitiestoeducationandhealth,accompanyingactionsfor fishing closure and livelihooddiversification, value addition in post-harvest sector, increased ex-vessel price of NP.
4. Monitor and evaluate - Regular M&E of indicators and reviews.
Detailed outline of the action plan is provided below.
4.4.1 Delivery of key fisheries management services
General fishery administration • Vessel registration, including vessel marking and management of a computerized register.
• SpecificNPfishinglicensing,includingmanagementofacomputerizedregister.
• Qualityandsafetycontrol forNPfishandfisheryproductsbyCompetentAuthority (e.g. inspection,healthcertificates,fishmovementpermits,andexportsanitarycertificates).
• NPfisherydatacollection,processingandmanagement.
• Framesurvey(every2years)forthepurposeofmonitoringtheNPfishingcapacity
• Private access agreement (concession for 5 years between a given Partner State and boat-owner).
• Contribution to M&E of NPFMP2.
Research• Annual hydro-acoustic survey (HAS) to monitor the status of NP stock.
• CatchAssessmentSurvey(CAS)twiceayeartoestimateNPfishproductionandcatchrate.
• Standardizationoffishingeffort(betweendifferentboattypesandgeartypes)toobtainastandardizedunitofeffortperfishingunitinnumberoffishingdaysortrips.
• Stock assessment based on a dynamic model to evaluate the status of the NP stock and make recommendationstoenablethealignmentoffishingcapacity/effortwiththeresourcebase.
• Development of an age-structured model to verify the effort control-response of the stock predicted by the biomass dynamics model and make recommendations on measures to improve yield-per-recruit fromthefisheryandtoprioritiseresourcestocontrolillegalgearsunderMCS.
• Developmentofaneconomicmodelaimedatmakingrecommendationsfortheregulationoffishingcapacity/effort.
• Specificscientificprojectsto investigatethebiological,socialandeconomicconsequencesofclosedseasons, where closed areas should be developed to protect ecologically sensitive areas, the impact of

34 LVFO NILE PERCH FISHERIES MANAGEMENT PLAN, 2015-2019 (NPFMP2, APRIL 2015) 35
4.4.4 Monitoring and evaluation (M&E)
Regular M&E of indicators of activities, actions/expected results and expected outcomes envisioned in the NPFMP2
IdentificationofactivitiestobeundertakenwhenNPFMP2isapproved.
Identificationofindicators,time-frames,responsibilities,etc.
Implementation of the M&E system, incl. development of database.
Regular M&E of indicators of NPFMP2 specific objectives of bio-ecological, social and economic nature
Implementation of the M&E system incl. development of data base (see proposed matrix in Annex 5.1).
Annual review of NPFMP2 • National multi-stakeholders meetings.
• Regional multi-stakeholders meeting.
• Production of annual progress reports
Mid-term review of NPFMP2 (after end of year 3)• Preparation of a draft report.
• National multi-stakeholders meetings.
• Regional multi-stakeholders meeting.
• Production and dissemination of mid-term review report.
Revision of NPFMP2 (at the end of year 5)• Final evaluation of the NPFMP2.
• National multi-stakeholders meetings.
• Regional multi-stakeholders meeting.
• Preparation of a draft NPFMP3.
4.5 Costing of the NpfMp2 Action plan Table 9 gives a summarized costing of the action plan by main category of actions in USD; detailed costing of the action plan is provided in Annex 5.2. In total the estimated cost of the action plan is approximately USD 57.3 million over a period of 5 years, i.e. about USD 11.5 million per year.
The share of the cost between the three Partner States and the LVFO Secretariat would be 90.4% and 9.6% respectively.
ThisamountofUSD11.5millionrepresentsabout1.0%ofcurrentturnoveroftheNPfishery,or1.4%ofthewealth(valueadded)thatiscurrentlygeneratedbytheNPfishery.Moreover,thisamountshouldbecomparedwithtotalrevenuesfromtheNPfisherythatbenefitthePartnerStatesandthatarecurrentlyaroundUSD10million per annum.
In order to give an indication of the total cost of the proposed action plan, we can also use an OECD model21 whichsuggests theannualmanagementcostofafisheryshouldbearound10%of the totalcatchvalue (indeveloped countries). Using such a model, and based on catch value of NP (at landing site) currently estimated at USD 632.4 million, the action plan could cost close to USD 63.2 million per year. The cost of the NPFMP2 action plan is much lower than the OECD estimate by a factor of 5.5.
TheOECDmodelalsosuggeststhatMCS,whichisthemostexpensivecomponentofthefisherymanagementservices, would be expected to represent about 40% of total costs. In the NPFMP2 action plan, MCS represents about 31.7% of the total costs.
21 OECD, 2003. The cost of managing fisheries.
• Support to industry self-monitoring and control system (including through developing MoU between industries and administration).
• SupportotherinitiativesaimedatdevelopingPPPwiththeindustryandfishersassociations(e.g.TaskForce for improved MCS)
Collaborative mechanisms with other institutions• Awareness-raising and training of Local/Devolved Government and Judiciary system to ensure proper
prosecution and the imposition of appropriate sanctions to create effective deterrence.
• Contribution to the implementation of local environmental plans (promoted by other institutions like MinistryofWaterandEnvironment)intheprotectionofwetlandsandfishbreedingareas.
Sustainable funding mechanisms• IdentificationandadoptionofafinancingplanforNPFMP2.
• Establishment of an NP Fish Levy Trust Fund at national levels.
4.4.3 Complementary actions to ensure the success of NPFMP2, including through promotion of specific actions to increase wealth generated by the NP fishery
Communication of NPFMP2 with appropriate tools to decision-makers• Production of policy briefs.
• Production of short progress reports.
Communication of NPFMP2 with appropriate tools to fishers and related stakeholders involved in the Nile perch fishery
• ProductionofIECmaterial(leaflets,posters,fact-sheets,etc.)intoEnglishandatleast2locallanguages(Kiswahili, Luganda).
• Information via mass-media (radio, TV, newspaper).
Improved access to education and health within fishing communities• Liaise with ministries responsible for education, health, water, environment, roads, social affairs, etc. for
delivery of relevant services.
• Support small projects.
Accompanying actions to facilitate fishing closure and support livelihood diversification• Development of communication material for main stakeholders (Cabinet, devolved/decentralized
Government,Parliament,fisherfolks,industry,developmentpartners,NGOs).
• Promotionofalternativelivelihoodsforfishers,includingaquaculture,incollaborationwithotherrelevantinstitutions.
• Promotionofsavingschemesandfinancialmanagement.
• Strategyforinternationalmarkets(atthereopeningofthefishery)includingpromotioncampaign.
Value addition in post-harvest sector (traditional, industrial processing)• Improved quality of products, including reduction of post-harvest losses (through improved handling,
processing, packaging and transportation).
• Productsdiversificationandpromotion.
• Certificationandpromotionof(eco-)labellingforLakeVictoriaNPfishery.
Increased ex-vessel price of NP• DevelopmentofaLakeinformationsystemonex-vesselfishprice.
• PromotionofgazettedspecificfishlandingsitesforNP.

36 LVFO NILE PERCH FISHERIES MANAGEMENT PLAN, 2015-2019 (NPFMP2, APRIL 2015) 37
4.6 expected ecological, Social and economic Benefits TheexpectedbenefitsfromtheNPFMP2are,aboveall,thatthesustainabilityoftheNPresourceisensuredandthatthecurrentandalreadysignificantcontributionoftheNPfisherytotheeconomiesofthethreePartnerStates is maintained. In a ‘no-change’ scenario, catch of NP would decrease from 250 000 to 200 000 tonnes per year, resulting in an annual loss of about USD 222 million in terms of turnover and USD 158 million in terms ofwealth(valueadded)generatedbytheLakeVictoriaNPfishery.
Moreover, it can be argued that full implementation of the NPFMP2 would result in an increased contribution of theNPfisherytotheeconomiesofthethreePartnerStates,particularlyinthelake-basinarea.
It was not possible to develop a bio-economic model to measure the impact of the management measures and actionsontheNPfisheryyearafteryearoverafiveyearsperiodandtoevaluatethecumulatedannualeffects.Itshouldindeedberemindedthatduringthefirstyearsofimplementationcatchrateswouldbeexpectedtocontinue to stagnate or decrease, taking into consideration the time necessary for the rebuilding of the NP stock biomass. Intheshort-term,sincetheoverall leveloffishingeffort isexpectedtodecrease,thiswouldresultin a decline of total catch (and turnover). In contrast, during the later years of implementation, catch rates are predictedtoincreaseandthiswouldresultinanincreasedcatchleveldespitethereducedleveloffishingeffort.
Economically speaking, it can be argued that during the later years of implementation catches will be higher and lessmoneywillbespenttocatchthefishsincefishingeffortwillbereduced.Thiswouldresultinincreasedvalueaddedinthefishingactivity.Moreover,ifillegalgearssuchasbeachseinehavebeeneradicated,anincreasedaverageex-vesselsellingpricecanbeexpected,tothebenefitofwealthgenerationinboththefishingandposts-harvest sectors. Other actions contained in the NPFMP2 will also contribute to increased value added inthepost-harvestsectorthroughimprovedfishqualityandvalueaddition.Finally,asatisfactoryregulationoffishingandrelatedactivities(processingandtrade)willresultinasignificantincreaseofthebudgetrevenuetothebenefitofeachPartnerState.
In order to provide some basis in support of decision-making, a basic simulation has been conducted to show whatthecontributionoftheNPfisherytotheeconomiesofthethreePartnerStatescouldbeiftheNPFMP2isimplemented. Calculation hypotheses used were as follows, based on best case scenarios:
• Restrictionoflegalfishingcapacity(i.e.excludingbeachseinesandmonofilaments)atthe2015level
• Fishingeffortreducedby15%(removalofIUUfishinggearand2monthsclosedseason)
• Catch level increased by 10% as a result of the gradual rebuilding of the NP stock
• Ex-vesselpriceandfishandfisheryproductspricesincreasedby10%asaresultofimprovedqualityandvalue addition and increased average size of NP
• Conversionratevalueadded/turnoverinthefishingactivityandpost-harvestsectorincreasedby5%
• 100%compliancewithexistingandforeseenfishingandrelatedregulation(includingregionaltrade)
Table10presentsthemainresultsfromthesimulation.Asexpectedalltheeconomicindicatorsshowasignificantincrease, including the budget revenue to the Partner States which would increase by about 50% to USD 15 million per year. This can be compared to the cost of the NPFMP2 which has been estimated as USD 11.5 million per year.
Theexpectedannualmaximumbenefitsfromyear5onwardsifcombinedpotentiallossandpotentialgain,fromavoidinglossandincreasingnetbenefits,wouldresultinan annual gain of USD 451 million in terms of wealth created.
The only indicator which not surprisingly would decrease relates to employment. This can be explained by the reductioninthenumberoffishersasaresultofreducedillegalfishing.
Table 9: Summarized costing of proposed NPFMP2 action plan 2015-2019 by main category of actions (in USD) – LFVO/SmartFish 2015
Tota
l pa
rtne
r st
ates
% g
rand
To
tal
Tota
l lVf
O
Secr
et.
% g
rand
To
tal
TOTA
l%
gra
nd
Tota
l
1. D
eLiV
eRY
OF
keY
FiS
HeR
ieS
MA
NA
GeM
eNT
SeRV
iCeS
1.1.Generalfisheryadministration
9 51
0 00
016
.6%
210
000
0.4%
9 72
0 00
017
.0%
1.2.Research(forNPfishery)
3 99
0 00
07.
0%1
405
000
2.5%
5 39
5 00
09.
4%
1.3.MCS(compliancewithfisheryregulations)
17 4
00 0
0030
.4%
790
000
1.4%
18 1
90 0
0031
.7%
Sub-
Tota
l 130
900
000
53.9
%2
405
000
4.2%
33 3
05 0
0058
.1%
2. G
OVe
RNA
NCe
2.1.
Pol
icy
and
pla
nnin
g is
sues
1 05
0 00
01.
8%50
000
0.1%
1 10
0 00
01.
9%
2.2.
Leg
al is
sues
1 65
0 00
02.
9%23
5 00
00.
4%1
885
000
3.3%
2.3.
Co
-man
agem
ent a
nd P
ublic
Priv
ate
Part
enrs
hip
(PPP
)3
150
000
5.5%
75 0
000.
1%3
225
000
5.6%
2.4.
Col
lab
orat
ive
mec
hani
sms
with
oth
er in
stitu
tions
1 20
0 00
02.
1%50
000
0.1%
1 25
0 00
02.
2%
2.5.
Sus
tain
able
fund
ing
mec
hani
sms
1 56
0 00
02.
7%75
000
0.1%
1 63
5 00
02.
9%
Sub-
Tota
l 28
610
000
15.0
%48
5 00
00.
8%9
095
000
15.9
%
3. C
OM
PLeM
eNTA
RY A
CTiO
NS
3.1.
Com
mun
icat
ion
of N
PFM
P2 to
dec
isio
n-m
aker
s0
0.0%
350
000
0.6%
350
000
0.6%
3.2.CommunicationofNPFMP2wtofishersandrelatedactors
1 80
0 00
03.
1%40
0 00
00.
7%2
200
000
3.8%
3.3.Improvedaccesstoeducationandhealth/fishingcommunities
1 42
5 00
02.
5%0
0.0%
1 42
5 00
02.
5%
3.4.Accompanyingactionsforfishingclosureandlivelihood
diversification
2 91
0 00
05.
1%28
0 00
00.
5%3
190
000
5.6%
3.5.
Val
ue a
dd
ition
in p
ost-
harv
est s
ecto
r 5
040
000
8.8%
400
000
0.7%
5 44
0 00
09.
5%
3.6
Incr
ease
d ex
-ves
sel p
rice
of N
P60
0 00
01.
0%10
000
0.0%
610
000
1.1%
Sub-
Tota
l 311
775
000
20.5
%1
440
000
2.5%
13 2
15 0
0023
.1%
4. M
ON
iTO
RiN
G &
eVA
LUAT
iON
4.1.
Reg
ular
M&
E of
act
ions
00.
0%22
5 00
00.
4%22
5 00
00.
4%
4.2.RegularM&Eofspecificobjectives
00.
0%17
5 00
00.
3%17
5 00
00.
3%
4.3.
Ann
ual r
evie
w o
f the
NPF
MP2
37
5 00
00.
7%25
0 00
00.
4%62
5 00
01.
1%
4.4.
Mid
-ter
m r
evie
w o
f the
NPF
MP2
75 0
000.
1%16
0 00
00.
3%23
5 00
00.
4%
4.5.
Rev
isio
n of
NPF
MP2
75
000
0.1%
350
000
0.6%
425
000
0.7%
Sub-
Tota
l 452
5 00
00.
9%1
160
000
2.0%
1 68
5 00
02.
9%
gRA
ND
TO
TAl
51 8
10 0
0090
.4%
5 49
0 00
09.
6%57
300
000
-

38 LVFO NILE PERCH FISHERIES MANAGEMENT PLAN, 2015-2019 (NPFMP2, APRIL 2015) 39
Therefore,sourcesoffundingthatshouldbeclearlyindicatedinthefinancingplanofNPFMP2shouldinclude:
• Government recurrent budget.
• FishLevyTrustFundforNP(tobefinancedpartlybyfishingrightsandtaxationintheNPfishery).
• LVFO Fish Fund for Lake Victoria NP.
• OSNP (USD 680,000 per country, i.e. USD 2 million for the total duration of NPFMP2).
• Co-financingofmonitoringandcontroloffishinallprocessingfactories(including‘traditional’factoriesandthosedealingspecificallywiththeprocessedfishmawtrade).
• Development partners.
Fortheshortterm,untilthefinancingplanisinplace,itisproposedthatEACpartnershipfundingbesoughttowhich the three national governments will contribute and to which donors could be sought as additional funding sources. In addition to this, the process of establishing the Fish Levy Trust Fund for NP initiated at national levels andtheLVFOFishFundforNPshouldbefinalizedasamatterofurgencysothattheycantakeoverasthemajorcontributing funding source.
Table 10: Simulation of the likely economic and social effects of NPFMP2 in Partner States (LVFO/SmartFish, 2015)
Current situation (2014)
Potential situation( 2019)
Variation 2014-2019
Quantity Percentage
Catch (tonnes) 250 000 300 000 + 50 000 + 20.0%
Turnover (USD million) 1 164 1 465 + 301 + 25.9%
Value added (USD million) 798 1 091 + 293 + 36.7%
Contribution to national GDP 1.0% 1.4% - -
Total budget revenue (USD million) 10 15 + 5.0 + 50%
TotalemploymentinNPfishery 442 500 400 000 - 42 500 - 10%
Total NP availability in 3 States (tonnes) 75 000 90 000 + 15 000 + 20%
ContributionofNPtofishconsumption 6.6% 7.2% - -
Total NP export in value (USD million) 250 325 + 75 + 30%
Moreover, the Partner States and LVFO will be at the forefront of sustainable management of a shared inland water body through the implementation of NPFMP2. It can also be argued that NPFMP2 will provide a successful exampleofthePan-AfricanReformStrategyinrespecttowealthcreationinfisheries.Nottomentionthatasuccess of NPFMP2 will create further interest from donors and investors in the EAC area.
Finally,itshouldbestressedthatMCSeffortsonNPfishery-whichrepresentabout31.7%oftheestimatedcostoftheactionplan-willalsobenefitotherLakeVictoriafisheriessinceitwillresultinaconsiderablereductionofthemostharmfulfishinggearandpracticesonthelake.
4.7 proposed financing Mechanisms The major constraint of the NPFMP1 was the lack of reliable and consistent funding for implementation and essential monitoring activities. The result is that many of the activities for essential monitoring, for management and effective enforcement have either not taken place or have only been carried out sporadically with a consequent lack of proper implementation. It is evident that donor funding is no longer an option to cover all management activities.Consequently,thefundingsolutionlieswithinEastAfricaandwiththedirectbeneficiariesoftheNPfishery:thethreenationalgovernments,thefishingactors(boat-ownersandfishers)andtheactorsinvolvedinpost-harvest sector (processors and traders).
Thepointneedstobemadeclearthatthedirectresourceusers(boat-owners,fishers,processorsandtraders)haveenjoyedaccessandadvantagesfromthefishery,virtuallyfreeofanycharge,apartfromminimallicencefeesandalowlevycharge.Whatchargesthathavebeenmadeareinnowayreflectiveoftherealcostofthemanagementofthefishery.It isproposedthatthereshouldbeapolicyshifttowardsmakingresourceusersbettercontributetothemeetingofmanagementcoststhroughaconcertedfinancingplan,agreedbyallthreePartner States (this action is proposed in the action plan).
Tomeet these costs, user fees from licences/permits (vessel, fishing, processing) and the levy charged onprocessors should be utilised as appropriate funding sources. User fees from private access agreements (concessions) should also contribute when the system has been established. For instance, the introduction of a nominal private access agreement fee of USD 500 for 5 years per boat-owner (10-15,000 in total), a nominal annualboatlicencefeeofUSD30,anindividualannualfisherlicensefeeofUSD20combinedwitha2.5%levyof exports valued at about USD 300 million, would generate about USD 12.6 million per year, i.e. more than the funds required to implement the NPFMP2 (annual cost estimated at USD 11.5 million per year). To this, it should be added other sources of revenues such as user fees from licences/permits for processing and trade units.

40 LVFO NILE PERCH FISHERIES MANAGEMENT PLAN, 2015-2019 (NPFMP2, APRIL 2015) 41
5.2 Detailed costing of the NPFMP2 5 years action plan (2015-2019)5 ANNEXES
5.1 Regular M&e of indicators of specific bio-ecological, social and economic objectives
A monitoring protocol is proposed below.
Survey Information generated
Parameters and Indicators for management
Frequency/sample size Coverage
Frame Survey (FS)
Totalfishingeffort(legal and illegal) Changes in total effort Distributionoffishingeffort
# Fishers# Boats# Outboards# Hooks# Gillnets# Illegal gears by type
Once every 2 years
National and regional synthesis (all States undertake survey at the same time)
Catch Assessment Survey (CAS)
Catch by species and vessel-gear. Effort by vessel-gear.Length and weight distribution of catch by species. Additional biological sampling of catch as required.
Total catch (and by vessel-gear).CPUE (and by vessel-gear).Catch by gearCatch at length/ageUnit value ($/kg).Gear selectivity (Lc50). Z (from length-converted catch curve). VBGF parameters from LFD.Length-fecundity relationship parameters.Length-weight relationship parameters.Condition factor.Length at maturity (LM50).
Two times a year
National and regional synthesis (all States undertake survey at the same time)
Fish factory processing & export
Total weight of whole freshfishreceivedinto factories Total exports - weight & value Total number & weightoffishrejected at factories with reject code.
Total catch weight and proportion processed by factories.Value of exports.
Continuous sampling, report monthly
National and regional synthesis
Fish factory sampling
Biological sampling offishinfactoriesincluding length frequency/ L/Wt, aging & diet, maturity.
Z for cohorts corresponding to slot size.Length at maturity (LM50).Meanfishsizeabove50cm.Condition factorReproductive state, age and diet
Daily random sample of 500 fishReport every six months:.
National and regional synthesis
Hydro-Acoustic Survey (HAS)
Biomass. Distribution (horizontal & vertical bylengthoffish).Biological samplingEnvironmental parameters.
Biomass (B).Spawning Stock Biomass (SSB).Biomass of prey species.Environmental parameters.
Once per annum in February corresponding tothestratifiedlake period.
Regional (lake-wide)
Uni
t Cos
t pe
r co
untr
yN
b of
uni
ts
per
coun
try
Uni
t Cos
t fo
r L
VFO
Nb
of u
nits
fo
r L
VFO
Tot
al P
artn
er
stat
es (5
yea
rs)
Tot
al L
VFO
S
ecre
t. (5
yea
rs)
1. D
eliv
ery
of k
ey fi
sher
ies
man
agem
ent s
ervi
ces
Ves
sel r
egis
trat
ion,
incl
udin
g m
arki
ng a
nd m
anag
emen
t of a
com
pute
rized
re
gist
er10
0 00
05
15 0
002
1 50
0 00
030
000
Spec
ific
NP
fishi
ng li
cens
ing,
incl
udin
g m
anag
emen
t of a
com
pute
rized
re
gist
er12
0 00
05
15 0
002
1 80
0 00
030
000
Qua
lity
and
safe
ty c
ontr
ol o
f NP
fish
and
fishe
ry p
rodu
cts
by C
ompe
tent
A
utho
rity
- CA
(e.g
. ins
pect
ion,
hea
lth c
ertif
icat
es, f
ish
mov
emen
t per
mits
, 80
000
50
01
200
000
0
Dat
a co
llect
ion
and
proc
essi
ng o
n N
P fis
hery
130
000
510
000
51
950
000
50 0
00
Fram
e su
rvey
(eve
ry 2
yea
rs) t
o ce
nsus
of f
ishi
ng c
apac
ity (b
oats
, gea
r, en
gine
s, fi
sher
s, e
tc.)
135
000
225
000
281
0 00
050
000
Fish
ing
acce
ss a
gree
men
t (co
nces
sion
for 5
yea
rs b
etw
een
a gi
ven
Part
ner
Stat
e an
d bo
at-o
wne
r)15
0 00
04
25 0
002
1 80
0 00
050
000
Con
trib
utio
n to
M&
E of
NPF
MP2
30 0
005
00
450
000
0
Sub
-tot
al -
- -
-9
510
000
210
000
1.1.
Gen
eral
fish
ery
adm
inis
trat
ion

42 LVFO NILE PERCH FISHERIES MANAGEMENT PLAN, 2015-2019 (NPFMP2, APRIL 2015) 43
Uni
t Cos
t pe
r co
untr
yN
b of
uni
ts
per
coun
try
Uni
t Cos
t fo
r L
VFO
Nb
of u
nits
fo
r L
VFO
Tot
al P
artn
er
stat
es (5
yea
rs)
Tot
al L
VFO
S
ecre
t. (5
yea
rs)
1.3.
MC
S (c
ompl
ianc
e w
ith
fish
ery
regu
lati
ons)
Stre
ngth
enin
g of
MC
S ca
paci
ties
incl
udin
g es
tabl
ishm
ent o
f enf
orce
men
t un
it50
0 00
05
00
7 50
0 00
00
Coo
rdin
atio
n of
MC
S pl
anni
ng (i
ncl.
Nat
iona
l and
Loc
al/D
ecen
tral
ized
Tas
k Fo
rces
and
regi
onal
coo
rdin
atio
n)10
0 00
05
50 0
005
1 50
0 00
025
0 00
0
Dev
elop
men
t of i
ntel
ligen
ce s
yste
ms
50 0
005
00
750
000
0
Con
duct
of j
oint
pat
rols
150
000
770
000
73
150
000
490
000
Insp
ectio
n an
d co
ntro
l at f
ish
land
ing
site
s (5
0% to
tal)
and
artis
anal
pr
oces
sors
120
000
50
01
800
000
0
Insp
ectio
n an
d co
ntro
l in
proc
essi
ng u
nits
(exp
ort)
50 0
005
00
750
000
0
Aw
aren
ess-
rais
ing,
trai
ning
, col
labo
rativ
e m
echa
nism
s w
ith o
ther
(in
cl.
Cus
tom
s, P
olic
e, a
nd R
even
ue A
utho
ritie
s) il
lega
l fis
h an
d fis
hing
gea
rs
100
000
525
000
21
500
000
50 0
00
Con
trib
utio
n to
M&
E of
NPF
MP2
30 0
005
00
450
000
0
Sub
-tot
al -
- -
-17
400
000
790
000
Uni
t Cos
t pe
r co
untr
yN
b of
uni
ts
per
coun
try
Uni
t Cos
t fo
r L
VFO
Nb
of u
nits
fo
r L
VFO
Tot
al P
artn
er
stat
es (5
yea
rs)
Tot
al L
VFO
S
ecre
t. (5
yea
rs)
2. G
over
nanc
e
2.1.
Pol
icy
and
plan
ning
issu
es
Inte
grat
ion
of N
PFM
P2 in
the
Rev
ised
Lak
e V
icto
ria F
MP
2015
-202
00
025
000
20
50 0
00
Inte
grat
ion
of N
PFM
P2 in
the
fishe
ries
polic
ies
of th
e th
ree
Part
ner S
tare
s30
000
50
045
0 00
00
Inte
grat
ion
of N
PFM
P2 a
ctio
n pl
an in
the
Dec
entr
aliz
ed/D
evol
ved
Gov
ernm
ent a
ctio
n pl
ans
40 0
005
600
000
0
Sub
-tot
al -
- -
-1
050
000
50 0
00
2.2.
Leg
al is
sues
Ensu
re le
gal b
acki
ng o
f NPF
MP2
in e
ach
of th
e th
ree
Part
ner S
tare
s20
000
50
030
0 00
00
Rev
isio
n of
pen
altie
s fo
r inc
reas
ed d
eter
renc
e fo
r exi
stin
g re
gula
tions
whi
lst
ensu
ring
harm
oniz
atio
n20
000
530
000
230
0 00
060
000
Dev
elop
men
t of n
ew le
gal p
rovi
sion
s: b
oat r
egis
trat
ion,
priv
ate
acce
ss
right
s, s
peci
fic N
P fis
hing
lice
ncin
g, fi
shin
g cl
osur
e, c
ontr
ol o
f fis
h m
aw
40 0
005
25 0
003
600
000
75 0
00
Am
endm
ent o
f EA
Cus
tom
s M
anag
emen
t Act
Sch
edul
e 2
(em
pow
erin
g R
even
ue A
utho
ritie
s an
d C
A to
con
trol
ille
gal t
rade
in fi
sh a
nd fi
shin
g ge
ar0
050
000
20
100
000
Ensu
re le
gal b
acki
ng (f
orm
atio
n, o
pera
tion,
fina
ncin
g, e
tc.)
for c
o-m
anag
emen
t str
uctu
res
at v
ario
us le
vels
(ind
ustr
y, B
MU
net
wor
ks,
30 0
005
00
450
000
0
Sub
-tot
al -
- -
-1
650
000
235
000

44 LVFO NILE PERCH FISHERIES MANAGEMENT PLAN, 2015-2019 (NPFMP2, APRIL 2015) 45
Unit
Cos
t pe
r co
untr
yN
b of
uni
ts
per
coun
try
Unit
Cos
t fo
r LV
FON
b of
uni
ts
for
LVFO
Tota
l Par
tner
st
ates
(5 y
ears
)To
tal L
VFO
Se
cret
. (5
year
s)
2.3.
Co-
man
agem
ent a
nd P
ublic
Pri
vate
Par
tenr
ship
(PPP
)
Revi
sitin
g co
-man
agem
ent g
uide
lines
for L
ake
Vict
oria
, cap
acity
bui
ldin
g of
BM
Us,
and
pro
mot
ion
of m
otiv
atin
g m
echa
nism
s 80
000
525
000
21
200
000
50 0
00
Prom
otio
n of
NP
boat
-ow
ners
ass
ocia
tions
to s
uppo
rt th
e es
tabl
ishm
ent o
f pr
ivat
e ac
cess
agg
reem
ents
25 0
005
25 0
001
375
000
25 0
00
Prom
otio
n of
fish
erflo
ks a
ssoc
iatio
ns to
stre
ngth
en c
o-m
anag
emen
t in
clud
ing
thro
ugh
cont
ribut
ing
to d
eliv
ery
of m
anag
emen
t ser
vice
s50
000
50
075
0 00
00
Supp
ort t
o in
dust
ry s
elf-m
onito
ring
and
cont
rol s
yste
m (i
nclu
ding
thro
ugh
deve
lopi
ng M
oU b
etw
een
indu
strie
s an
d ad
min
istra
tion)
30 0
005
00
450
000
0
Supp
ort o
ther
initi
ativ
es a
imed
at d
evel
opin
g PP
P w
ith th
e in
dust
ry a
nd
fishe
rs a
ssoc
iatio
ns25
000
50
037
5 00
00
Sub-
tota
l -
- -
-3
150
000
75 0
00
2.4.
Col
labo
rativ
e m
echa
nism
s wi
th o
ther
inst
itutio
ns
Aw
aren
ess-
rais
ing
and
train
ing
of L
ocal
/Dev
olve
d Go
vern
men
t and
Ju
dici
ary
syst
em
50 0
005
25 0
002
750
000
50 0
00
Cont
ribut
ion
to th
e im
plem
enta
tion
of e
nviro
nmen
tal p
lans
30 0
005
00
450
000
0
Sub-
tota
l -
- -
-1
200
000
50 0
00
2.5.
Sus
tain
able
fund
ing
mec
hani
sms
Iden
tific
atio
n an
d ad
optio
n of
a fi
nanc
ing
plan
for N
PFM
P220
000
125
000
160
000
25 0
00
Esta
blis
hmen
t of N
P fis
h le
vy tr
ust f
und
100
000
525
000
21
500
000
50 0
00
Sub-
tota
l -
- -
-1
560
000
75 0
00
Uni
t Cos
t pe
r co
untr
yN
b of
uni
ts
per
coun
try
Uni
t Cos
t fo
r L
VFO
Nb
of u
nits
fo
r L
VFO
Tot
al P
artn
er
stat
es (5
yea
rs)
Tot
al L
VFO
S
ecre
t. (5
yea
rs)
3. C
ompl
emen
tary
act
ions
to e
nsur
e th
e su
cces
s of
NPF
MP2
3.1.
Com
mun
icat
ion
of N
PFM
P2
wit
h ap
prop
riat
e to
ols
to d
ecis
ion-
mak
ers
Prod
uctio
n of
pol
icy
brie
fs0
050
000
50
250
000
Prod
uctio
n of
sho
rt p
rogr
ess
repo
rts
00
20 0
005
010
0 00
0
Sub
-tot
al -
- -
-0
350
000
3.2.
Com
mun
icat
ion
of N
PFM
P2
wit
h ap
prop
riat
e to
ols
to fi
sher
s an
d re
late
d ac
tors
invo
lved
in th
e N
ile
Per
ch fi
sher
y
Prod
uctio
n of
IEC
mat
eria
l (le
afle
ts, p
oste
rs, f
act-
shee
ts, e
tc.)
into
Eng
lish
and
at le
ast 2
loca
l lan
guag
es (K
isw
ahili
, Lug
anda
) 20
000
580
000
530
0 00
040
0 00
0
Mas
s-m
edia
(rad
io, T
V, n
ewsp
aper
)10
0 00
05
00
1 50
0 00
00
Sub
-tot
al -
- -
-1
800
000
400
000
3.3.
Impr
oved
acc
ess
to e
duca
tion
and
hea
lth
wit
hin
fish
ing
com
mun
itie
s
Liai
se w
ith m
inis
trie
s re
spon
sibl
e fo
r edu
catio
n, h
ealth
, wat
er, e
nviro
nmen
t, ro
ads,
soc
ial a
ffai
rs, e
tc. f
or d
eliv
ery
of re
leva
nt s
ervi
ces
15 0
005
00
225
000
0
Supp
ort s
mal
l pro
ject
s80
000
50
01
200
000
0
Sub
-tot
al -
- -
-1
425
000
0

46 LVFO NILE PERCH FISHERIES MANAGEMENT PLAN, 2015-2019 (NPFMP2, APRIL 2015) 47
Uni
t Cos
t pe
r co
untr
yN
b of
uni
ts
per
coun
try
Uni
t Cos
t fo
r L
VFO
Nb
of u
nits
fo
r L
VFO
Tot
al P
artn
er
stat
es (5
yea
rs)
Tot
al L
VFO
S
ecre
t. (5
yea
rs)
3.4.
Acc
ompa
nyin
g ac
tion
s to
faci
lita
te fi
shin
g cl
osur
e an
d su
ppor
t liv
elih
ood
dive
rsif
icat
ion
Dev
elop
men
t of c
omm
unic
atio
n m
ater
ial f
or m
ain
stak
ehol
ders
(Cab
inet
, de
volv
ed/d
ecen
t Gvt
, Par
liam
ent,
fishe
rfol
ks, i
ndus
try,
dvt
par
tner
s, N
GO
s)40
000
525
000
260
0 00
050
000
Prom
otio
n of
alte
rnat
ive
livel
ihoo
ds fo
r fis
hers
, in
colla
bora
tion
with
oth
er
rele
vant
inst
itutio
ns12
0 00
05
25 0
002
1 80
0 00
050
000
Prom
otio
n of
sav
ing
sche
mes
and
fina
ncia
l man
agem
ent
30 0
005
20 0
001
450
000
20 0
00
Stra
tegy
for i
nter
natio
nal m
arke
ts (a
t the
reop
enin
g of
the
fishe
ry) i
nclu
ding
pr
omot
ion
cam
paig
n10
000
280
000
260
000
160
000
Sub
-tot
al -
- -
-2
910
000
280
000
3.5.
Val
ue a
ddit
ion
in p
ost-
harv
est s
ecto
r (t
radi
tion
al, i
ndus
tria
l pro
cess
ing)
Impr
oved
qua
lity
of p
rodu
cts,
incl
udin
g re
duct
ion
of p
ost-
harv
est l
osse
s (t
hrou
gh im
prov
ed h
andl
ing,
pro
cess
ing,
pac
kagi
ng a
nd tr
ansp
orta
tion)
300
000
525
000
24
500
000
50 0
00
Prod
ucts
div
ersi
ficat
ion
and
prom
otio
n30
000
525
000
245
0 00
050
000
(Eco
)Lab
ellin
g10
000
310
0 00
03
90 0
0030
0 00
0
Sub
-tot
al -
- -
-5
040
000
400
000
3.6
Incr
ease
d ex
-ves
sel p
rice
of N
P
Dev
elop
men
t of a
Lak
e in
form
atio
n sy
stem
on
ex-v
esse
l fis
h pr
ice
15 0
005
5 00
02
150
000
10 0
00
Prom
otio
n of
gaz
ette
d fis
h la
ndin
g si
tes
spec
ific
for N
P30
000
50
045
0 00
00
Sub
-tot
al -
- -
-60
0 00
010
000
Uni
t Cos
t pe
r co
untr
yN
b of
uni
ts
per
coun
try
Uni
t Cos
t fo
r L
VFO
Nb
of u
nits
fo
r L
VFO
Tot
al P
artn
er
stat
es (5
yea
rs)
Tot
al L
VFO
S
ecre
t. (5
yea
rs)
4. M
onito
ring
and
Eva
luat
ion
(M&
E)
4.1.
Reg
ular
M&
E of
indi
cato
rs o
f act
ivit
ies,
act
ions
/exp
ecte
d re
sult
s an
d ex
pect
ed o
utco
mes
env
isio
ned
in th
e N
PFM
P2
Iden
tific
atio
n of
indi
cato
rs to
be
done
whe
n N
PFM
P2 a
ppro
ved
00
50 0
001
050
000
Impl
emen
tatio
n of
the
M&
E sy
stem
incl
. dat
a ba
se35
000
50
175
000
Sub
-tot
al -
- -
-0
225
000
4.2.
Reg
ular
M&
E of
indi
cato
rs o
f NP
FMP
2 sp
ecif
ic o
bjec
tive
s of
bio
-eco
logi
cal,
soci
al a
nd e
cono
mic
nat
ure
Impl
emen
tatio
n of
the
M&
E sy
stem
incl
. dat
a ba
se0
035
000
50
175
000
Sub
-tot
al -
- -
-0
175
000
4.3.
Ann
ual r
evie
w o
f the
NP
FMP
2
Nat
iona
l mul
ti-st
akeh
olde
rs m
eetin
gs25
000
50
037
5 00
00
Reg
iona
l mul
ti-st
akeh
olde
rs m
eetin
g0
040
000
50
200
000
Prod
uctio
n of
an
annu
al p
rogr
ess
repo
rt0
010
000
50
50 0
00
Sub
-tot
al -
- -
-37
5 00
025
0 00
0

48 LVFO NILE PERCH FISHERIES MANAGEMENT PLAN, 2015-2019 (NPFMP2, APRIL 2015)
Uni
t Cos
t pe
r co
untr
yN
b of
uni
ts
per
coun
try
Uni
t Cos
t fo
r L
VFO
Nb
of u
nits
fo
r L
VFO
Tot
al P
artn
er
stat
es (5
yea
rs)
Tot
al L
VFO
S
ecre
t. (5
yea
rs)
4.4.
Mid
-ter
m r
evie
w o
f the
NP
FMP
2 (a
fter
end
of y
ear
3)
Prep
arat
ion
of a
dra
ft re
port
00
100
000
10
100
000
Nat
iona
l mul
ti-st
akeh
olde
rs m
eetin
gs25
000
10
075
000
0
Reg
iona
l mul
ti-st
akeh
olde
rs m
eetin
g0
050
000
10
50 0
00
Prod
uctio
n an
d di
ssem
inat
ion
of m
id-t
erm
revi
ew re
port
00
10 0
001
010
000
Sub
-tot
al -
- -
-75
000
160
000
4.5.
Rev
isio
n of
NP
FMP
2 (a
t the
end
of y
ear
5)
Fina
l eva
luat
ion
of th
e N
PFM
P20
010
0 00
01
010
0 00
0
Nat
iona
l mul
ti-st
akeh
olde
rs m
eetin
gs25
000
10
075
000
0
Reg
iona
l mul
ti-st
akeh
olde
rs m
eetin
gs0
050
000
10
50 0
00
Prep
arat
ion
of a
dra
ft N
PFM
P30
020
0 00
01
020
0 00
0
Sub
-tot
al -
- -
-75
000
350
000
