social and economic implications of the...
TRANSCRIPT

SOCIO-ECONOMIC RESEARCH REPORT 3
LAKE VICTORIA ENVIRONMENTAL MANAGEMENT PROJECT
SOCIAL AND ECONOMIC IMPLICATIONS OF THE FISHERY DISTRIBUTION PATTERNS ON
LAKE VICTORIA, UGANDA
Paul NamisiFISHERIES RESOURCES RESEARCH INSTITUTE
NATIONAL AGRICULTURAL RESEARCH ORGANISATION
JINJA, UGANDA. November, 2005
Republic of Uganda

Copyright: Ministry of Agriculture, Animal Industry and Fisheries (MAAIF), National Agricultural Research Organization (NARO) and Lake Victoria Environmental Management Project (LVEMP).This publication may be reproduced in whole or part and in any form for education or non-profit uses, without special permission from the copyright holders, provided acknowledgement of the source is made. MAAIF, NARO and LVEMP would appreciate receiving a copy of any publication which uses this publication as a source.No use of this publication may be made for resale or other commercial purpose without the prior written permission of MAAIF, NARO and LVEMP
Citation:Namisi, P. 2005: Social and economic implications of fishery distribution patterns on Lake Victoria, Uganda. LVEMP Socio-economic Research Report 3. NARO-FIRRI, Jinja
Disclaimer:The opinions expressed in this publication are those of the author and do not necessarily represent the views of MAAIF, NARO or LVEMP.
i

EXECUTIVE SUMMARY
The fisheries of Lake Victoria have undergone a dramatic transformation during the last
two decades. From being a locally based fishery with little intervention and capital
investment from outside, the present fishery is dominated by national and international
capital penetrating the industry. It is the explosion in the growth of Nile perch and the
strong demand developed for this fish in the global markets, which have transformed
the fisheries of Lake Victoria.
This report presents the results of a survey carried out between October 2001 and
February 2002 about the fishery distribution patterns and their impacts on fisher
communities of Lake Victoria. The fisheries distribution pattern of the lake is described
as well as the flows and benefits from the fisheries resource and the resource
constraints and sustainability options. A major part of the paper discusses some of the
socio-economic impacts of the rapid changes that are responsible for the present
fisheries. It particularly focuses on the effect of the Nile perch boom, its globalization
and the development of the fish industry in Uganda, on food security and employment
for the local population.
ii

TABLE OF CONTENTS
Page
EXECUTIVE SUMMARY ii
1 INTRODUCTION 1
1.1 An overview of the Lake Victoria fisheries 2
2 OBJECTIVES 3
3 METHODOLOGY 4
3.1 Description of Study Area and Sample Selection 4
4 RESULTS AND DISCUSSIONS 7
4.1 The Lake Victoria Fisherfolk Communities 13
4.2 Fish Handling and Social Factors 14
4.3 Fishery Resource Distribution 16
4.4 Fish Stocks and Fisheries of Lake Victoria 19
4.5 Fish Flows and Market Mechanisms 20
4.6 Market Structure for Nile perch, Nile Tilapia and Mukene 22
4.7 Benefits from the Fisheries 24
4.8 Uganda's Fish Factories and Fish Exports 26
4.9 Management Issues and Possible Interventions 29
4.10 Organisation of Fishing Communities 33
5 CONCLUSIONS 35
6 RECOMMENDATIONS 36
7 REFERENCES 37
Appendix: DATA INSTRUMENT USED 39
iii
List of Tables
Page
Table 1. Data Collection Sites 4
Table 2. Statistics 12
Table 3. Landing site characteristics 20
List of Figures
Page
Figure 1.0: Map of Lake Victoria 1
Figure 2: Social and economic characteristics of fishers 7
Figure 3a. Marketing structure for Nile Perch 22
Figure 3b. Marketing structure for Mukene 23
Figure 3c. Marketing structure for Nile Tilapia 23
iv

1. INTRODUCTION
Lake Victoria is located in East Africa (Figure 1) and is bordered by three countries:
Uganda to the northwest, Kenya to the northeast, and Tanzania to the south. It is the
second largest lake in the world by surface area and the largest fresh water body in
Africa covering about 69,000 sq km (Hecky and Guildford, 2001). Twenty million people
live in the Lake Victoria watershed (Hecky and Guildford, 2001). The low relief of the
land along the shores of Lake Victoria makes much of the area suitable for human
habitation (Bootsma and Hecky, 1993). As a result, population densities along the
lakeshore are very high (Bootsma and Hecky, 1993).
Lake Victoria accounts for more than 60 per cent of all the fish produced in Uganda
every year and almost all of the country's fish exports, which earns the government US
$ 60-80 million annually and, contribute to income, nutrition and employment for about
one million people.
Figure 1.0: Map of Lake Victoria
Source: LVFRP
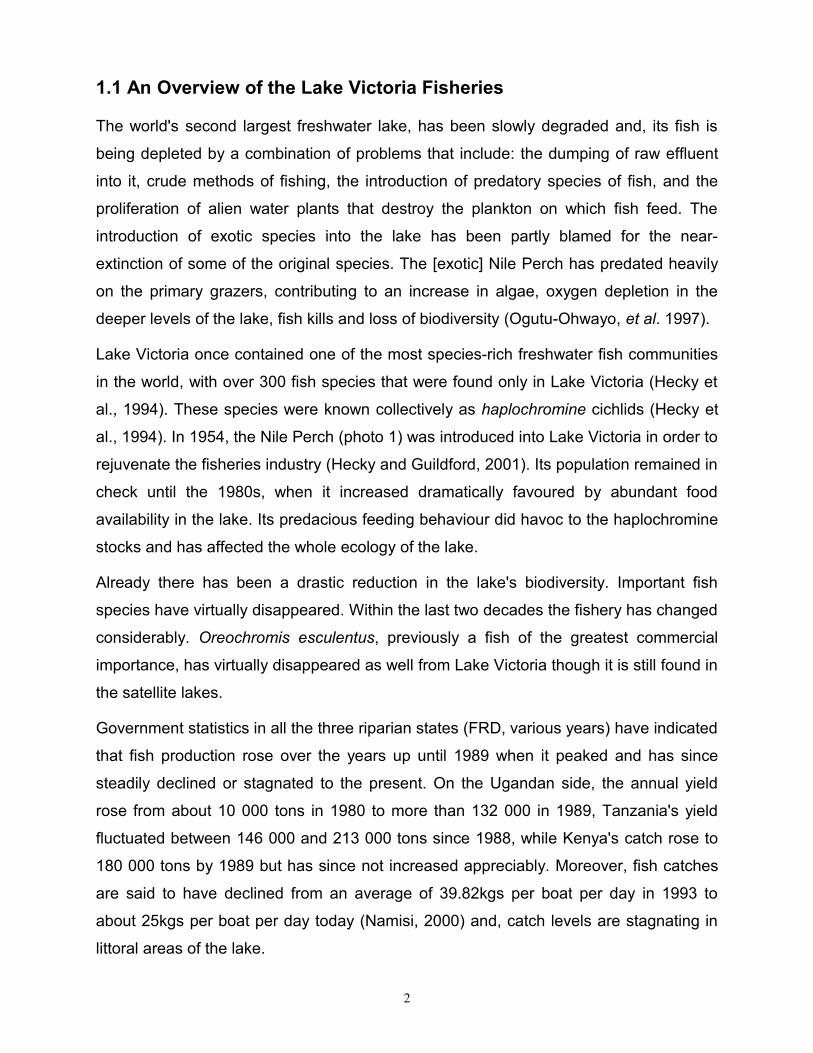
1.1 An Overview of the Lake Victoria Fisheries
The world's second largest freshwater lake, has been slowly degraded and, its fish is
being depleted by a combination of problems that include: the dumping of raw effluent
into it, crude methods of fishing, the introduction of predatory species of fish, and the
proliferation of alien water plants that destroy the plankton on which fish feed. The
introduction of exotic species into the lake has been partly blamed for the near-
extinction of some of the original species. The [exotic] Nile Perch has predated heavily
on the primary grazers, contributing to an increase in algae, oxygen depletion in the
deeper levels of the lake, fish kills and loss of biodiversity (Ogutu-Ohwayo, et al. 1997).
Lake Victoria once contained one of the most species-rich freshwater fish communities
in the world, with over 300 fish species that were found only in Lake Victoria (Hecky et
al., 1994). These species were known collectively as haplochromine cichlids (Hecky et
al., 1994). In 1954, the Nile Perch (photo 1) was introduced into Lake Victoria in order to
rejuvenate the fisheries industry (Hecky and Guildford, 2001). Its population remained in
check until the 1980s, when it increased dramatically favoured by abundant food
availability in the lake. Its predacious feeding behaviour did havoc to the haplochromine
stocks and has affected the whole ecology of the lake.
Already there has been a drastic reduction in the lake's biodiversity. Important fish
species have virtually disappeared. Within the last two decades the fishery has changed
considerably. Oreochromis esculentus, previously a fish of the greatest commercial
importance, has virtually disappeared as well from Lake Victoria though it is still found in
the satellite lakes.
Government statistics in all the three riparian states (FRD, various years) have indicated
that fish production rose over the years up until 1989 when it peaked and has since
steadily declined or stagnated to the present. On the Ugandan side, the annual yield
rose from about 10 000 tons in 1980 to more than 132 000 in 1989, Tanzania's yield
fluctuated between 146 000 and 213 000 tons since 1988, while Kenya's catch rose to
180 000 tons by 1989 but has since not increased appreciably. Moreover, fish catches
are said to have declined from an average of 39.82kgs per boat per day in 1993 to
about 25kgs per boat per day today (Namisi, 2000) and, catch levels are stagnating in
littoral areas of the lake.
2

The increased local and export demands for fish have most likely exceeded the
sustainable yield of the lake's fish. In addition, the rapid build-up of fish-processing
capacity along the lakeshores has given rise to the indiscriminate use of small fishing
nets that continues to threaten the survival of both small and large fish species.
Moreover, information from fisheries department, research workers and even fishers
themselves indicate that undersize fish are being caught, threatening breeding patterns.
The lack of a comprehensive law on fishing is also making it possible for illegal nets and
poison to be used. The displacement of fishers and fish traders by large commercial
traders and fish-processing plants, along with over-fishing in near-shore waters and
under-fishing in offshore waters is probably the worst implications resulting from the
changes in the fishery patterns of Lake Victoria. This study sought out to describe the
fisheries distribution pattern of the lake, fish flow channels and benefits and; identify the
resource constraints and possible sustainability options. A major part of the paper
discusses some of the socio-economic impacts of the rapid changes that are
responsible for the present fisheries.
2. OBJECTIVESThe overall objective was to assess the social and economic implications of current
fishery distribution patterns in view of the pertaining fisheries management issues on
Lake Victoria, Uganda.
Specifically, the overall objective would be achieved by:
1. Establishing the current fisheries resources distribution patterns
2. Determining impacts on the communities: socially (domestic consumption of fish,
fishing activity, social structure, culture and resource conservation) and
economically (incomes, investments, trade and markets) by changes in fisheries
distribution patterns.
3. Identifying major management constraints and soliciting sustainable
management options.
3

3. METHODOLOGY
Description of Study Area and Sample Selection
In total 400 people including key informants were interviewed during two months of
fieldwork in October 2001 and January 2002. The questionnaire is presented in
Appendix 1. The Survey took place in all the regions of the Uganda sector of Lake
Victoria. Involved in the study were over thirty landing sites from nine districts out of the
eleven districts surrounding the lake including Islands (Table 2).
Table 1. Data Collection Sites
DISTRICT SITE NAME LOCATION/SIZE Busia Nalyoba
MaduwaMainland/small
Bugiri Bumeru ABumeru BBusiiroNamatuSidome
Mainland/big,
Small small
Mayuge NtokoloBulubaMasolya
AverageSmallIsland/big
Mukono KamwanyiKibangaNamusenyiBulebiNangomaLubyaNamitiMakalagaKilewe
Mainland
Island/big
Kalangala KibangaKakyangaTubiMalabana/Kyagalanyi
Island/big
Rakai Kyabasimba Mainland/smallWakiso Kasenyi/Bugiri
DeweLwena
Mainland/BigMainland/BigMainland/Big
Mpigi BuvumboNabugaboSanya
Mainland/big
Masaka KamuwungaLambu
Mainland/smallMainland/Big
4
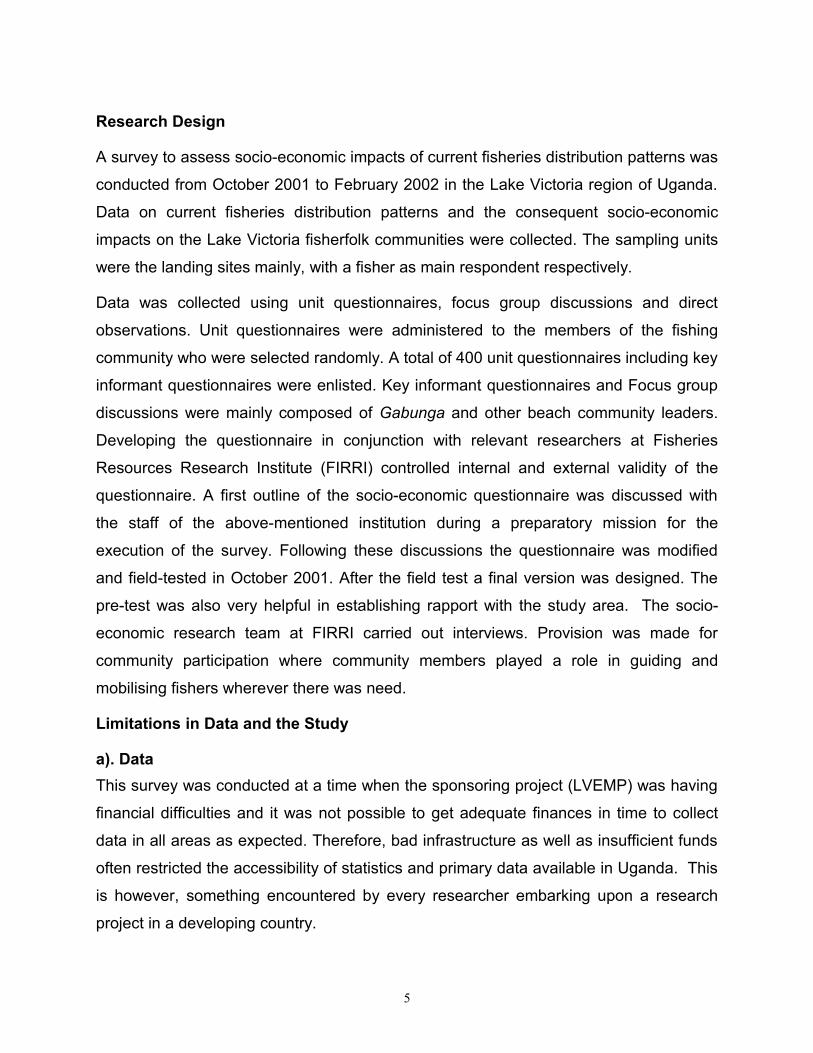
Research Design
A survey to assess socio-economic impacts of current fisheries distribution patterns was
conducted from October 2001 to February 2002 in the Lake Victoria region of Uganda.
Data on current fisheries distribution patterns and the consequent socio-economic
impacts on the Lake Victoria fisherfolk communities were collected. The sampling units
were the landing sites mainly, with a fisher as main respondent respectively.
Data was collected using unit questionnaires, focus group discussions and direct
observations. Unit questionnaires were administered to the members of the fishing
community who were selected randomly. A total of 400 unit questionnaires including key
informant questionnaires were enlisted. Key informant questionnaires and Focus group
discussions were mainly composed of Gabunga and other beach community leaders.
Developing the questionnaire in conjunction with relevant researchers at Fisheries
Resources Research Institute (FIRRI) controlled internal and external validity of the
questionnaire. A first outline of the socio-economic questionnaire was discussed with
the staff of the above-mentioned institution during a preparatory mission for the
execution of the survey. Following these discussions the questionnaire was modified
and field-tested in October 2001. After the field test a final version was designed. The
pre-test was also very helpful in establishing rapport with the study area. The socio-
economic research team at FIRRI carried out interviews. Provision was made for
community participation where community members played a role in guiding and
mobilising fishers wherever there was need.
Limitations in Data and the Study
a). DataThis survey was conducted at a time when the sponsoring project (LVEMP) was having
financial difficulties and it was not possible to get adequate finances in time to collect
data in all areas as expected. Therefore, bad infrastructure as well as insufficient funds
often restricted the accessibility of statistics and primary data available in Uganda. This
is however, something encountered by every researcher embarking upon a research
project in a developing country.
5

b). The StudyThe study focusing on distribution patterns of fisheries and impacts on communities is a
broad study touching almost all aspects of fisheries and it required enough time to
exhaust all these aspects but time and resources available could not allow.
Processing and Data AnalysisThe data collected was both quantitative and qualitative, coming from a mixture of
primary and secondary sources, which therefore demanded different analyses and
presentations.
The information obtained was coded and entered in a database utilising the software
package Dbase III plus files. The data were then converted into SPSS/PC+TM V.8.0
system files for processing and preliminary analysis. SPSS/PC+TM V.8.0 was used for
this purpose. Graphs presented in this report were created with Harvard Graphics.
6

4. RESULTS AND DISCUSSIONS
This section constitutes findings on changes in the Lake Victoria fisheries with respect
to it’s sustainability, fisheries resource distribution patterns, benefits from the fisheries,
fish flows, markets and management issues. The chapter discusses the drastic changes
and the pertinent problems experienced in fisheries and communities, which are
identified as having been both internal and external to the lake. It finally highlights the
need for interventions for sustainable management of the lake resources.
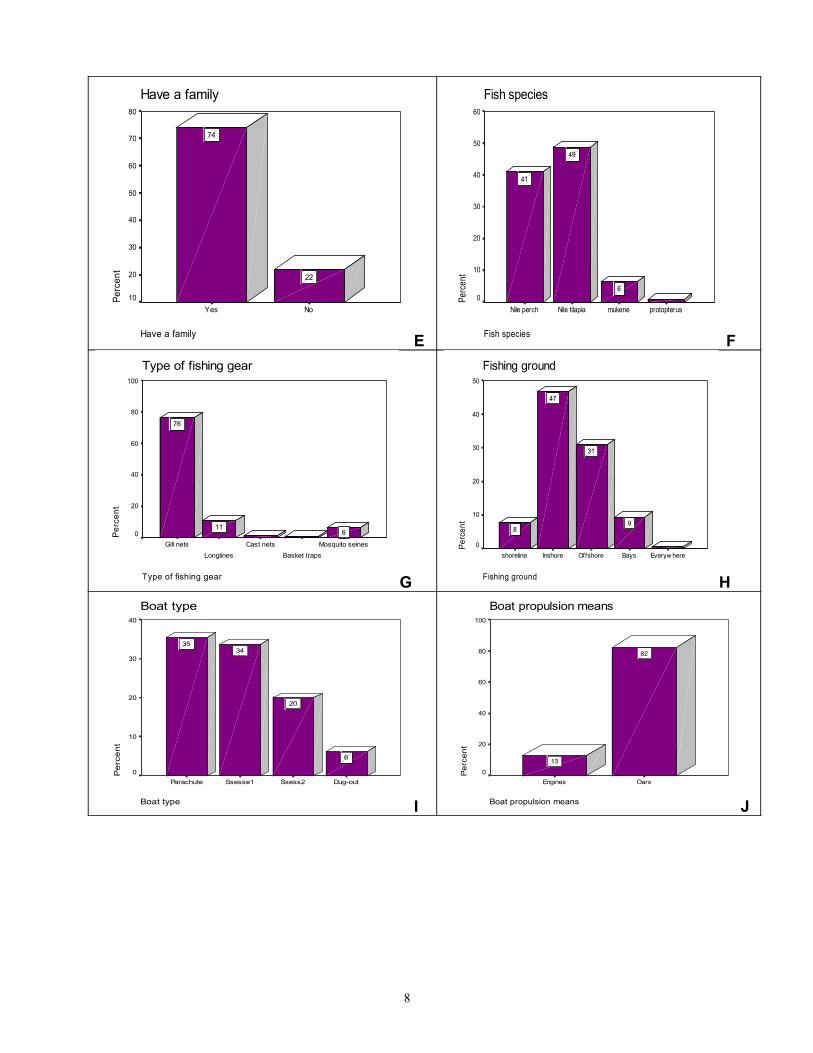
Figure 2: Social and economic characteristics of fishers
Sex of respondent
Sex of respondent
FemaleMale
Perc
ent
120
100
80
60
40
20
0
98
A
Tribe of respondent
Tribe of respondent
Others- JaluoAdhola
AlurMugw ere
MukenyeMusamia
MusogaMuganda
Iteso
Perc
ent
50
40
30
20
10
0
20
4
14
9
47
3
B
Marital status
Marital status
w idow eddivorcedsinglemarried
Perc
ent
80
60
40
20
0
29
70
C
Education of respondent
Education of respondent
TertiarySecondaryPrimaryNo education
Perc
ent
70
60
50
40
30
20
10
0
19
63
17
D
7
Have a family
Have a family
NoYes
Perc
ent
80
70
60
50
40
30
20
10
22
74
E
Fish species
Fish species
protopterusmukeneNile tilapiaNile perch
Perc
ent
60
50
40
30
20
10
06
49
41
FType of fishing gear
Type of fishing gear
Mosquito seinesBasket traps
Cast netsLonglines
Gill nets
Perc
ent
100
80
60
40
20
0 611
76
G
Fishing ground
Fishing ground
Everyw hereBaysOffshoreInshoreshoreline
Perc
ent
50
40
30
20
10
0
9
31
47
8
HBoat type
Boat type
Dug-outSsess2Ssesse1Parachute
Pe
rce
nt
40
30
20
10
0
6
20
3435
I
Boat propulsion means
Boat propulsion means
OarsEngines
Per
cent
100
80
60
40
20
0
82
13
J
8

Fish price per kilogram for Nile perch
Fish price per kilogram
1700.001650.00
1600.001500.00
1400.001350.00
1300.001200.00
Per
cent
14
12
10
8
6
4
2
0
3
1
13
9
1
5
7
K L
Fish price per kilogram of Tilapia
Fish price per kilogram
1000.00900.00
800.00750.00
700.00650.00
600.00500.00
400.00330.00
300.00
Perc
ent
20
10
0
19
1
8
1
7
910
2
Type of fish buyers
Type of fish buyers
Local processorsFactory agentLocal trader
Per
cent
70
60
50
40
30
20
10
0
32
66
M
Fish consumed by
Fish consumed by
OthersRegional markets
Fish factoryUrban communities
Rural communities
Perc
ent
40
30
20
10
0 2
323233
N
Fish transported by
Fish transported by
OthersBoats
Truckspublic transport
bicycleFoot
Perc
ent
60
50
40
30
20
10
0
16
22
4
53
3
O
Traditional fish processing-Main species
Traditional fish processing-Main species
Mukene Nile perch Tilapia Not for processing
Percent
100
80
60
40
20
0 8 6
82
P
9

Other income source
Other income source
NoYes
Perc
ent
50
40
30
20
48
32
Q
Type of other income
Type of other income
BusinessFarming
Perc
ent
30
20
10
0
9
23
R
Type of investment
Type of investment
mosqiuto gear
Others (hooks, traps Gillnet
Boat
Percent
60
50
40
30
20
10
0 9
51
S
Initial source of capital
Initial source of capital
Others- labourer, etLoan
Family sourcesRetirement benefits
Small-scale businessFarming
Fishing activities
Perc
ent
50
40
30
20
10
0 47
3
24
38
TCurrent main employment
Current main employment
sundryinsmoking
others- businessShop
FarmingBoat building
Fishing
Perc
ent
100
80
60
40
20
0
90
U
Fishing employment
Fishing employment
Local f ish tradersFactory agents
Local fish processorCrew member
Boat ow ner/renting
Perc
ent
70
60
50
40
30
20
10
0
28
62
V
10

Main eaten fish
Main eaten fish
ProtopterusMukeneNile perchTilapia
Perc
ent
100
80
60
40
20
0
13
85
W
Why type of fish preferred
Why type of fish preferred
othersMost affordableTastyMost available
Perc
ent
70
60
50
40
30
20
10
08
25
66
XWealth location
Wealth location
Outside beach areaWithin beach area
Pe
rce
nt
60
50
40
30
20
10
55
15
Y
11
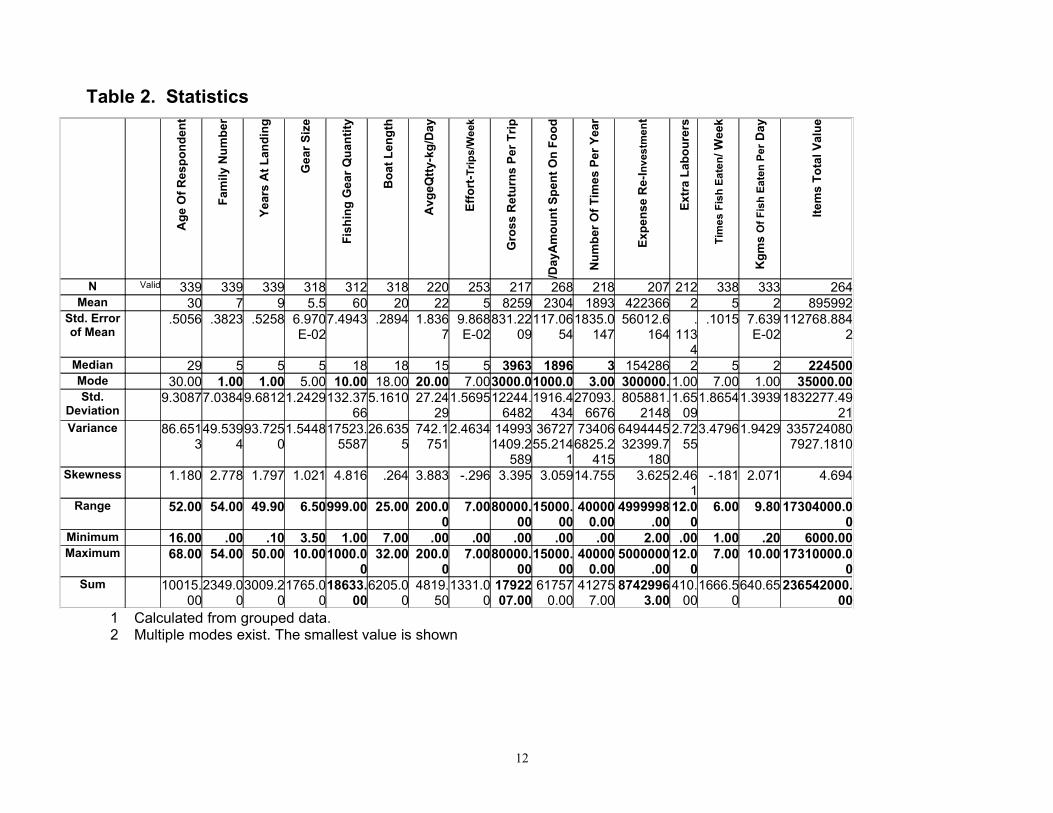
Table 2. Statistics
Age
Of R
espo
nden
t
Fam
ily N
umbe
r
Year
s A
t Lan
ding
Gea
r Siz
e
Fish
ing
Gea
r Qua
ntity
Boa
t Len
gth
Avg
eQtty
-kg/
Day
Effo
rt-T
rips/
Wee
k
Gro
ss R
etur
ns P
er T
rip
Am
ount
Spe
nt O
n Fo
od
/Day Num
ber O
f Tim
es P
er Y
ear
Expe
nse
Re-
Inve
stm
ent
Extr
a La
bour
ers
Tim
es F
ish
Eate
n/ W
eek
Kgm
s O
f Fis
h Ea
ten
Per D
ay
Item
s To
tal V
alue
N Valid 339 339 339 318 312 318 220 253 217 268 218 207 212 338 333 264Mean 30 7 9 5.5 60 20 22 5 8259 2304 1893 422366 2 5 2 895992
Std. Error of Mean
.5056 .3823 .5258 6.970E-02
7.4943 .2894 1.8367
9.868E-02
831.2209
117.0654
1835.0147
56012.6164
.113
4
.1015 7.639E-02
112768.8842
Median 29 5 5 5 18 18 15 5 3963 1896 3 154286 2 5 2 224500Mode 30.00 1.00 1.00 5.00 10.00 18.00 20.00 7.003000.01000.0 3.00 300000. 1.00 7.00 1.00 35000.00Std.
Deviation9.30877.03849.68121.2429132.37
665.1610 27.24
291.569512244.
64821916.4
43427093.
6676805881.
21481.65
091.86541.3939 1832277.49
21Variance 86.651
349.539
493.725
01.544817523.
558726.635
5742.1
7512.4634 14993
1409.2589
3672755.214
1
734066825.2
415
649444532399.7
180
2.7255
3.47961.9429 3357240807927.1810
Skewness 1.180 2.778 1.797 1.021 4.816 .264 3.883 -.296 3.395 3.05914.755 3.625 2.461
-.181 2.071 4.694
Range 52.00 54.00 49.90 6.50999.00 25.00 200.00
7.0080000.00
15000.00
400000.00
4999998.00
12.00
6.00 9.80 17304000.00
Minimum 16.00 .00 .10 3.50 1.00 7.00 .00 .00 .00 .00 .00 2.00 .00 1.00 .20 6000.00Maximum 68.00 54.00 50.00 10.001000.0
032.00 200.0
07.0080000.
0015000.
0040000
0.005000000
.0012.0
07.00 10.00 17310000.0
0Sum 10015.
002349.0
03009.2
01765.0
018633.
006205.0
04819.
501331.0
01792207.00
617570.00
412757.00
87429963.00
410.00
1666.50
640.65 236542000.00
1 Calculated from grouped data.2 Multiple modes exist. The smallest value is shown
12
4.1 The Lake Victoria Fisherfolk Communities
Socio-demographicsMales dominate in the fisheries (98 %). The mean age of fishers is 29 years with 30
years age dominating (Figure 3a). The majority of the fishers are married (70%) and,
have families (74%) consisting of mainly 4 members, although an overall mean of 9
was recorded with the maximum number being 54 (Figure 3c,e & Table 3).
The mean for the period most fishers have stayed at landing sites is 9 years;
although most fishers have been at landing site for only 1 year.
A maximum of 50 years was noted (Table 3).
The fishers on Lake Victoria part of Uganda constitute a wide range of ethnic tribes
with Baganda (47%) dominating followed by Samia (14%), Basoga (9%), Alur, Iteso
Bakenye, Bagwere and Adhola respectively. Among others the Jaluo and Banyala
from Kenya constitute a big portion of the other twenty percent, the rest of the small
groups include Banyankole, Nyarwanda and Bagisu from Uganda (Figure 3b).
According to key informants, youthful men do the fishing while women are involved in
mukene drying, traditional processing of fish and cookery. People who do not go
fishing themselves but hire to catch fish own most fishing units. The involvement of
family is less. The other groups involved in fishing are fish traders, boat owners and
fish smokers. Women are involved in fish smoking and food service business, men
do fishing and trade. In the mukene fishery labour constitutes hired men (crew) as
majority but in some cases the family members are involved in fishing. Boats,
mosquito seine and light (bait) are the main inputs used for fishing.
Several studies have examined Uganda’s fishing communities over the last decade
(Reynolds & Greboval 1988, Kitakule 1991, FCSEP 1997, LVFRP 1999, LVEMP
2000) and noted that one of the main interest groups in the fisheries of Lake Victoria
is constituted by the vast fishing communities that have exploited the resource for
generations. Made up of little scattered settlements at the edge of the villages and
on the islands, the fishing communities consist primarily of large numbers of male
youths who provide labour to a few boat and gear owners for a share of about a third
13

of the catch. In addition, there are also a few fish processors, mostly operating
traditional and improved smoking kilns. Considerable numbers of fish traders,
coming mainly by bicycle and also by truck, get to the beaches early in the morning
and depart for their market destinations on securing their supplies. Many of other
traders, dealing in provisions and supplies are also to be seen at the beaches, their
activities depending equally on the level of catch.
Changes in the fisheries of Lake Victoria over the last two decades have resulted in
development in the fishing communities in response to the situations and
opportunities created by the changes. There has been expansion in size of fishing
communities, resulting from rise in population growth rate, estimated at 2.5% per
annum (MFEP 1999). There has been greater diversity in the ethnic composition,
from the local traditionally fishing ethnic groups of the Baganda, Basoga, Bakenye
and Samia to include other tribes, namely the Banyankole, Bagisu, Japadhola and
Lugbara. The fisheries have seen the entry of new comers, bringing with them not
only improved harvesting skills but also greater capital. These changes have
represented a threat towards excessive effort on the lake.
4.2 Fish Handling and Social Factors
Fish handling is still poor with fish caught just placed in open boats with no box
containers or ice in the boats. The fish are transported to inland beach markets
where they are offloaded and placed on racks for selling as bundles (tilapia) or
weighed (N/perch). Apart from ice containers that transport fish for factory processing
the rest of the transport are in poor hygienic state (see Photo2)
There is only a limited use of ice by fishers. Conditions at beach landing sites are
poor, lacking portable water supply, clean auction areas and toilets. However, there
is now a trend to improved control of the distribution chain with some of the main
buyers operating collection vessels to receive and ice fish directly on the lake. The
fish are landed at numerous small landing sites on the shore or off-lying islands,
where they are bought by traders or directly by processors for onward road transport
to the factory or market. Only the best quality fish are selected for export processing.
The fish are transported to inland beaches where they are offloaded and placed on
14

racks for selling as bundles (tilapia) or weighed (Nile perch). Fish caught is stored in
baskets (Busero) and sold to local traders, who use bicycle, motorcycles and pickups
to transport the fish to local village markets and urban markets. Selling is by auction
and mutual agreement for Tilapia, although in terms of kilograms it ranges from Ushs
500-1,000 per kg and varies from beach to beach and in different regions of the lake.
Nile perch is particularly weighed at racks direct from boats and placed into truck
containers, iced and transported to fish processing factories. Nile perch is sold in
kilograms using weighing scales and a kilogram ranges from Ushs 1,200/- to 1,700/-
and even more on Nkome Islands. The rate of reject due to spoilage, however, has
gone down probably due to good timings and increased demand.
In the traditional Bantu society, the lake: its swamps and islands are associated with
numerous myths and customary activities responding to these beliefs. It is not
surprising therefore, that there have been strong cultural considerations affecting
fishing practices, use of sanitary facilities at the landings and fish consumption.
The traditional practice of prohibiting fishing during periods of crop harvest has been
a positive resource management practice, as it took off fishing effort pressure on the
resource during certain periods. Similarly, non-use of boat-based fishing practices by
women in many societies, although it denied opportunities to the women, helped to
keep the fishing pressure low.
On the negative side, the perception that the use of latrines leads to inability of
women to bear children, or of men to realize good catch, has serious implications for
pollution of the lake, on fish quality and on the health of the lake side communities.
Skills, knowledge and innovationsAt least 83 percent of the fishers are literate, that is, they have at least had primary
(63 %), Secondary (19 %) and tertiary (1 %) education (Figure 3d).
Even if a large number of fishers have attained some formal primary education,
generally the fishing communities operate on the basis of indigenous knowledge (IK).
Some of IK has been handed down from the previous generations but there have
been considerable local innovations in response to the needs of the changing
fisheries. Most fishers have expressed satisfaction with their knowledge and skills
15

based on IK (LVEMP data). Government, through the fisheries management and
research institutions, had previously been unable to provide the lead in sustainable
technology generation and dissemination, due to institutional constraints though
efforts are being made of recent by institutions like FIRRI. In the process, new
designs of gear as well as new fishing methods have appeared on the lake, some of
which are not compatible with sustainable exploitation of the fisheries. The IK, much
of which is on fish production, has proved deficient with respect to fish handling and
processing. In a recent survey, the most common method of fish preservation
practiced by fishers was “covering the fish with leaves and keeping it in the shade”
(LVFRP, 1999). This deficiency represents wastage of the fish resource.
While this technological development based on IK has taken place, however, the
level of entrepreneurship among fishers has remained low. Records on operations
have remained at best sketchy, due to lack of interest as well as inability among
fishers to write books of accounts (LVEMP data). Personal savings continue to be
the main source of capital within the community and very few operators have taken
advantage of formal credit, mainly from the Poverty Alleviation Project, Micro Finance
Schemes, Etandikwa (a political credit fund) and private individuals in that order
(LVEMP data). The main problems resulting in poor repayment of the loans taken
are reported to include high interest rates, short repayment periods, and occurrence
of calamity during the loan period, e.g. theft of gear. Despite all the steps taken to
improve the condition of fishefolk, migration in search for better catch or market has
remained a common practice. This hinders their access to the various credit
schemes.
The effect of all this has been a lack of efficiency in the fisheries, resulting in wasteful
utilization of the resources.
4.3 Fishery Resource Distribution
The fishery of Lake Victoria
The common commercial fish species by exploitation are Nile Tilapia (49 %), Nile
perch (41 %), and Rastrineobola argentea (6 %) and protopterus (Figure 3f).
However, Haplochromines, clarias, Bagrus, Barbus, Mormyrus, Labeo, catches
16

feature commonly in some areas of the lake according to key informants and they
supplement the fishers’ diet mainly.
The most commonly used gear is the gillnet (76 %) of size 5 inches (41 %), 6 inches
(22 %) and 7 inches (12 %) though 3.5, 4, 4.5 are also in use to a large extent. In
addition, long line (11%) of size 7, 8, 9 and 10 hooks, Mosquito net (6 %), cast nets
and basket traps respectively are widely in use as well (Figure 3g & Table 3).
Most fishers have 10 pieces of nets and mainly fish in the inshore (47 %) and
offshore (31 %) areas of the lake while some do fish in the bays and shorelines
(Figure 3h).
The commonly used boat types are parachute (bawotatu, has a flat base) (35 %),
Ssesse1 (keeled boats with pointed ends mainly propelled by oars and a sail) (34 %),
Ssesse2 (keeled and pointed at one end with an outboard engine provision on one
end) (20 %) and Dugout canoes (6 %) respectively. The oars (82 %) and engines
(13%) are the main propulsion means for the boats (Figure 2 i, j).
Key informants revealed that most fishing is done within the grounds less than 3
kilometres from the beaches/shoreline, because the waters there are shallower and
richer in fish-supporting food. Fishing for Tilapia and Mukene is done in the inshore
by fishers who claim that they cannot afford offshore waters, which require strong
boats and engines for propulsion. This was confirmed by findings indicating a great
number of fishers (82%) who use oars/paddles and small boats for fishing (Figure 2i,
j). Fishers desire to fish offshore/open water but are limited by small boats and
expensive gears (engines).
Nile perch and Nile tilapia fisheriesThese fisheries are so important because they support the local and export markets
and their demand is ever increasing. Nile perch fishers mostly catch from the
offshore/deeper waters where there are good catches, unlike tilapia, which is
exploited in shallow inshore waters mainly.
Methods used for catching include; gill nets for tilapia and; gill nets and long line
using hooks for Nile perch. Gillnets of mesh sizes: 3” 4”, 5”, 6”, and 7” are used to
17

catch tilapia as well as Nile perch. Long-line that uses hooks of various sizes from
number 1-12 are used, however, 7-8 and 10-12 are commonly used depending on
bait type and the targeted fish. Long line is known to be most destructive because
they catch indiscriminately all sizes. Gill nets of 3.5 inches and lesser inches are
rampant on most Islands, like Lolwe, Buvuma, etc where the Banyala from Kenya
and Jaluo are well known for these practices.
Mukene fisheryAlongside the Nile perch and Tilapia fisheries, the Mukene fishery has tremendously
developed with an impressive market. Mukene fishery is mainly exploited for fishmeal
industries in Uganda though some locals prefer it for food especially regionally. Easy
of entry due to limited initial investment capital, ready market, readily available fish
and its pelagic nature makes exploitation easier in mid waters. However, it is
relatively more labour intensive requiring at least 4 people per boat. The main inputs
used include mosquito nets and lamps to provide light as an attractant. The Jaluos
from Kenya are very experienced in the exploitation of this fish and are said to
dominate the business as main fishers in Uganda. They also enjoy mukene so much,
on average, most fishers taking home to eat about 1 kg/day.
Handling is simple, involving pouring in boats and use of basins to measure and sell
at 2000 to 6000/- per basin to traditional processors who do the drying. Drying is
done on bear rocky grounds after which they are packed in sacks weighing between
60-70 kgs. Boat traders/ factory agents buy from fishers/driers and then transport fish
to fish meal factories in Jinja where they sell at 2000/- to 3500/- per kg (Fig.2b).
Some fish is transported by boats to land beach markets like Wakawaka and Bugoto
from where it is sold to Busia traders/fishmongers for sale in inland markets. A 6 kg
tin costs Ushs 2,500/-. Losses incurred are with respect to value resulting from
processing—humidity from rain causes deterioration with 40 % of product output lost
usually. By-catch of immature Nile perch is the main problem associated with this
fishery.
18
4.4 Fish Stocks and Fisheries of Lake Victoria
Changes in fish stocks.Key informant findings revealed that changes in fish stocks were greatly influenced
by the boom of the introduced fish species like Nile perch (Lates niloticus) that is
predacious in its feeding ecology. The increase in Nile perch, has been associated
with the simultaneous decline in most of the other stocks especially Haplochromines,
which formed its main diet in its boom times. Currently, with the disappearance of
haplochromines the feeding ecology of Nile perch has even changed constituting
mukene, caridina and juveniles of its own mainly in its diet (Ogutu-Ohwayo et al,
1997).
Intensive traditional fishing methods and increased use of illegal gear may have also
contributed to the decline of certain species especially Tilapiines (Oreochromis
esculentus). Tilapiines (Oreochromis niloticus) are being over-fished due to
increasing use of smaller mesh sizes. In addition illegal fishing gears like beach
seines (non-selective) have also played a role in reducing fish stocks. Besides Nile
perch (Lates) and Rastrineobola argentea, only the tilapiine Oreochromis niloticus is
important to fisheries at present. Other species like Bagrus and Clarias are too low to
support a fishery.
Landing sites on Lake VictoriaObservations from the survey show that landing sites are normally determined by
proximity to fishing grounds and local markets potential. The latter is influenced by
population density and accessibility.
The number of boats landing at a given site is used to categorise landing sites into
three groups (small, medium and large)
19

Table 3. Landing site charateristics
Characteristic Small Landing Medium Landing Large LandingNo. Of boats 5 5-15 >15Propulsion of boats
Paddles. Paddles mostly at times sails.
Paddles or engines.Majority sails.
Target fish species.
No specific species. Nile perch, Tilapia, Protopterus and Mukene.
Catches dominated by Nile perch.
Post harvest activities.
Fish for home consumption.
Local consumers or fishmongers and transport the fish to inland markets by bicycles.-Few young men are found doing the gutting, scaling and chopping of Nile perch.Food service businesses by women.
Same as medium but the activities are more intensive.-fish landing.-fish processing.-fish marketing.Traders transport fish to other far markets by car.-Some secondary businesses at the landing sites like selling cloth or merchandise. Food service businesses done by women.
Distribution. Any where along the shorelines of Lake Victoria.
Located near populated areas.
Near towns or village centres with high population densities or with settlement.
4.5 Fish Flows and Market MechanismsFish trade and its role as a major cash incomeNile perch has the highest price per kilogram compared to other fish species. The
highest beach price or, on-water price for Nile perch is 1700/- and the lowest is
1200/- per kg with 1500/- being the common price for most areas. Nile tilapia, the
second important commercial fish has a maximum beach price of 1000/- per kg and
the lowest of 300/- per kg, even so, the price varies greatly between 500/- to 1000/-
per kg (Fig. 3 k & l).
Information gathered from key informants indicated that prices vary from place to
place at landing sites/on water with distances from landing sites to
consumer/processor influencing the prices significantly.
Local traders (66%) are the main buyers of fish from fishers. These include men and
women who use bicycle and motorbikes (53%), pickup cars and public transport (4%)
20

and foot (3%), to transport fish to consumers in rural (33%) and urban markets (32%)
mainly.
Factory agents/middlemen (32%) are the second largest but most powerful group of
traders who use trucks (22%) and boats (16%) mainly to transport the fish to fish
factories located in urban areas (Kampala, Jinja, Entebbe and Masaka). The last
group constitutes local fish processors (2%) who mainly process mukene (8%) for
fishmeal factories and rural markets consumers. Nile perch (6%) and tilapia, usually
the rejects or the juveniles are processed for urban poor and rural markets.
The level of traditional fish processing is very low with most fishers (82%) indicating
that they are neither involved nor do they sell fish for traditional processing (Fig. 3 m,
n, o & p). Most fishers (48%) do not have any extra source of income but for those
who have another source of income (32%), they either practice farming (23%) or do
business (9%) respectively (Fig. 3 q & r).
Soft ware fishing inputs like gillnets (51%), hooks and mosquito nets are the most
frequently invested in due to the short lifetime of these inputs, loss due to storms and
occasional thefts whereas, boats and engines are rarely invested in (Fig. 3 s).
Fishing is the main employment (90%) for fishers interviewed though others include
farming, small-scale businesses, traditional fish processing, boat building and retail
shop ownership. Most of the initial capital was sourced from fishing (38%), farming
(24%), family sources (7%), labouring (4%), small-scale businesses (3%) and
retirement benefits. Sixty-two percent of respondents were boat owners or hirers,
while 28 % were crew members/labourers and the rest were local fish traders, local
fish processors and factory agents (Fig. 3 t, u & v). Most fishers are reluctant to
declare returns per trip, a mode of 3000/- per day with a mean of 8260/-, a median of
about 4000/- and the maximum of 80,000/- was noted (Table 3).
Market systems and fish distribution.
The importance of the marketing is evident when considering that selling fish to
middlemen and traders is a major source of cash income for many poor fishers,
particularly in remote fishing villages. The trading network allows for a ready market
21

for high value fish, such as Nile perch, which otherwise would have been difficult to
find a buyer for.
4.6 Market Structure for Nile perch, Nile Tilapia and Mukene
Figure 3a. Marketing structure for Nile Perch
Signify the flow of reject fish or Nile perch scrap from factories Signify the flow of mainly immature Nile perch from very poor fishersNB: The thickness of the line denotes the intensity of fish flow.
Regional/Export Markets
Fishers
Middlemen
Whole-sellers/ Fish Factories
Local traders
Consumers/ Mainly Rural and Urban markets
Traditional fish processors
22
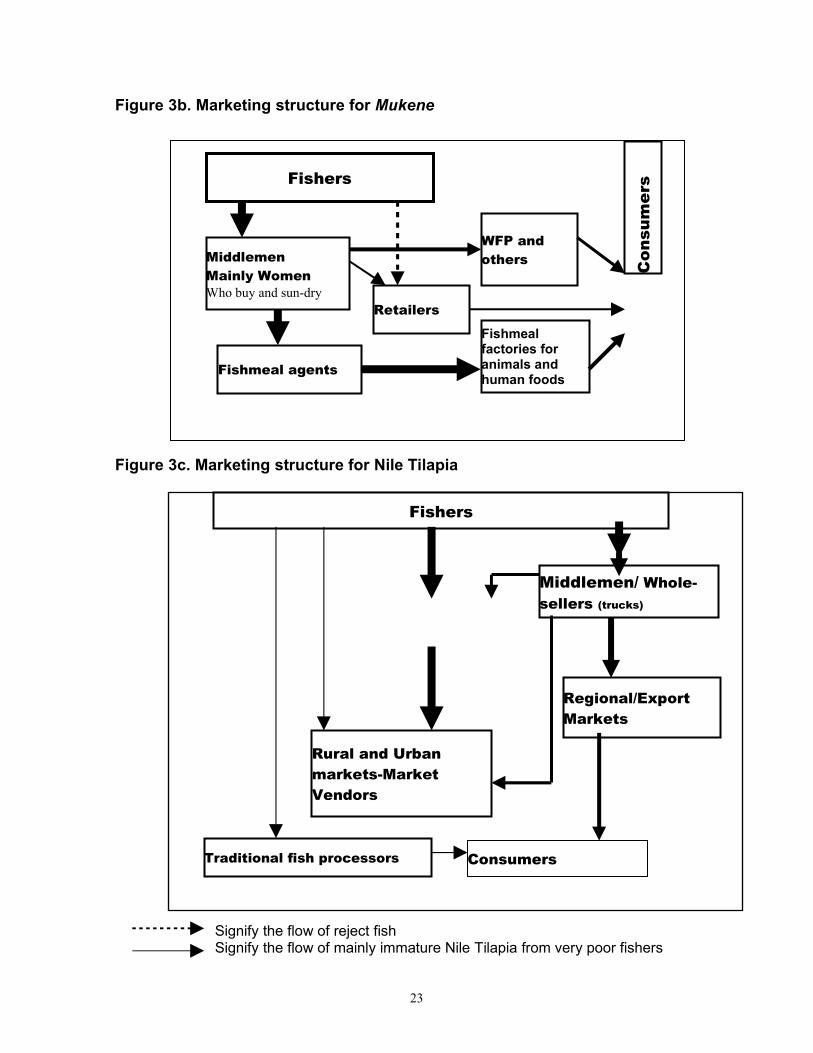
Figure 3b. Marketing structure for Mukene
Figure 3c. Marketing structure for Nile Tilapia
Signify the flow of reject fish Signify the flow of mainly immature Nile Tilapia from very poor fishers
Local tradersMotorbike, bikes or on foot
Fishers
Middlemen/ Whole-sellers (trucks)
Regional/Export Markets
Rural and Urban markets-Market Vendors
Traditional fish processors Consumers
Fishers
Fishmeal agents
Fishmeal factories for animals and human foods
MiddlemenMainly WomenWho buy and sun-dry
WFP and others
Retailers
Con
sum
ers
23

The survey shows that there is a well-developed market for fish products in the
region with the trading network stretching out to the villages. Generally there are
three layers starting with fishers as the producers, selling to a middleman who sells
to whole-sellers/factories and traders. The traders market the fish locally and the
factories process and market the fish at distant markets (exports). Though this is the
overall characteristic of the system it is not always adhered to as some fishers sell
directly as retail, middlemen may sell to traders and traders may buy from fishers,
see Figures 3 a, b, c. The sophistication of the network suggests that substantial
amounts of fish are being marketed. Artisanal fisheries catches are marketed fresh or
processed in line with consumer taste, storage conditions and supply and demand.
The lack of a highly developed cold storage and marketing network makes fresh and
frozen fish distribution to the inland population in Uganda difficult. In Uganda, more
than 80% of the fish is sold fresh, about 10% is salted/dried and 8% smoked. In
general, there is an increasing tendency to sell the fish captured by Artisanal
fisheries in fresh form due to an increased availability of ice, together with better
infrastructures that make an enhanced distribution towards hinterland possible. There
is also a growing trade among neighbouring countries due to the same reasons
together with improved co-operation between countries.
From this survey, it was noted that three main commercial fishery have emerged with
characteristic distribution channels (Figures 3a, b, c). The main outlets being Fish
factories, Urban markets, semi-urban and rural communities, fishmeal factories,
Hotels and restaurants within the country and, regional and international export
markets. Globalisation and increasing international trade in fish commodities and
fishery products lead developments in one market to have rapid repercussions in
other markets. In addition, long-term global trends in supply and demand, including
developments in consumption have broad implications for the domestic industry and
for consumers.
4.7 Benefits from the Fisheries
Findings from this study indicate that the demand for fish is ever increasing with all
fish caught normally sold off according to fishers. The fish distribution has greatly
24

improved with increased channels. These include middle agents/boat traders that
supply to fish factories, fish traders that supply to rural and urban markets, and
factory agents that supply factories. The demand for fish for factory processing for
both Nile perch and mukene is likely to be affecting fish distribution to other up
country rural markets which used to feed local people. Some fish is sold to Kenyan
buyers. Already there is growing exploitation of juveniles by fishers to meet the
demand for local consumers especially the poor who cannot now afford big size fish.
Most fishers note that they would rather sell Nile perch to factory agents at a good
price and then use the money to buy small fish for home use. The quantity supplied
home of course must have gone down with the increasing value of fish for cash.
This study established that Nile tilapia is the most preferred (85%) fish for eating
because it is the most available (66%), tasty (25%) and most affordable (8%)
according to fishers and, Nile perch (13%), mukene and protopterus are some of the
others that are consumed (Figures 3 w & x). Most fishers eat fish daily although on
average it is 5 times per week and they eat 1-2 kg per day and, spend 1000/- on food
daily though the average is about 2000/- with a maximum of 15,000/- (Table 3).
Tilapia, Nile perch and Nkejje are commonly eaten because they are tasty, affordable
and available. Taboos limit consumption of some fish like protopterus among the
Baganda.
Factories mainly exploit Nile perch for export - so great volumes of Nile perch are
feeding the out side market earning government a large foreign exchange. Many
fishers and people involved in the distribution together with factory owners have
greatly benefited from the Nile perch fishery.
The economic benefits occurring from the 3 main fisheries have attracted many
actors into the business. This survey established a very conservative estimate of
some fishers who indicated that they have some assets or wealth based mainly off
the landing site worth at least Ushs 2 003 000/- on average with Ushs 35,000/- being
the common figure and, ranging from Ushs 6000/- worth to Ushs 17million worth
(Table 3) out of the money sourced largely from fishing activities.
25

Recent figures have put the total employment at between 700,000 and one million
(East African Newspaper, 1999). Government assessment, however, puts the figure
at about 440,000 persons comprising: full-time and part-time fishers at 140,000; fish
processors/distributors at 150,000 and fisheries related activities at about 150,000 on
Lake Victoria alone. Fishing effort has increased from about 3200 fishing canoes in
1972 to over 10,000 canoes presently for Lake Victoria. The numbers of nets and
other gears have also equally increased boosting trade and enhancing employment
incomes in these areas as well.
The number of projects and researchers related to the fisheries has greatly increased
since early 90s creating employment and enhancing incomes for Ugandans.
4.8 Uganda's Fish Factories and Fish ExportsThere are 12 Nile perch processing factories operating in the Ugandan part of Lake
Victoria and, Non-indigenous Ugandans own most of them. The industry is well
integrated horizontally and vertically, which extends to other factories in Tanzania
and Kenya. Much of the investments in the industry have been financed by funds
from both international and local financial institutions.
Government statistics sourced from twelve factories licensed to process and export
frozen, chilled fish fillets and fish maws have indicated that in the month of Dec. 2001
alone Uganda, exported 2590.6 metric tons of fish worth $7.8m (UFRD, 2001). The
exports have been consistently rising in the past years only to register a drop in Dec.
compared to the previous month of November when it registered 2832.8 mt fetching
the country $8.5m in foreign currency (New Vision, Monday, Jan 28, 2002, pg50). On
the average, however, fish factories in Uganda export about 2500 metric tons of Nile
perch per month, which is only 50% of the existing capacity. The excess capacity is
mainly due to the difficulty factories face in getting adequate fish supplies, although
some of them also have constraints related to marketing, fish quality and under-
financing. Besides fillet, many of the by-products of processing are also utilised. The
swim-bladders (maws) are sun-dried and find ready export markets in the Far East.
The fillet and maws are marketed for different reasons and the products packaged in
26

different small packages to suit different export markets in several countries
overseas. Belly flaps (with their high oil content) and visceral fat can be rendered to
produce high quality fish oil. In the last five years, a small tanning industry has
developed in Uganda and Kenya, producing high quality leather goods from the
skins. Fillet frames are sold on the local market, where they are fried and sold for
consumption by street traders. There is also some artisanal processing of Nile perch
employing smoke drying over wood fires to confer a degree of preservation for
distribution to interior markets. Most of the fish frames produced by factories are also
now going for fishmeal. Similarly about three quarters of the catch of a small sardine-
like fish, mukene, goes for fishmeal. The demand for both products in the local
market for human consumption is high and unsatisfied. Therefore Nile perch frames
and mukene going for fishmeal is directly in conflict with food security requirements
for local people. Because of the strong demand for fishmeal, the price of fish frames
and mukene has risen beyond what most consumers can afford. The industries also
draw away fish and fish products from the traditional processing sectors, thus
causing unemployment, which outweigh the new employment opportunities created
in the modern sectors. Eventually, industrialization of the Lake Victoria fisheries is
leading to negative impacts on the conservation of fisheries resources.
Fish Processing
Artisanal fisheries catches are marketed fresh or processed in line with consumer
taste, storage conditions and supply and demand. The lack of a highly developed
cold storage and marketing network makes fresh and frozen fish distribution to the
inland population in the country difficult. In Uganda, cold-storage systems are
lacking/inadequate and fish not sold the same day is either dried or smoked. In any
case, more than 80% of the fish is sold fresh, about 10% is salted/dried and 8%
smoked. In general, there is an increasing tendency to sell the fish captured by
Artisanal fisheries in fresh form due to an increased availability of ice, together with
increased demand from fish factories. There is also a growing trade among
neighbouring countries due to the same reasons together with improved co-operation
between countries. The main trade flows are: Kenya, DRC, Rwanda.
27

According to the key informants, the processing methods used are mainly traditional
ones dominated by women, although improved technologies are being introduced
and gradually adopted. Different techniques of smoking fish exist and are based on
tradition, preferred tastes and market preferences. The quality of smoked fish is
different according to the smoking methods, species used to the wood used in the
smoking process, which can give a different taste to the final smoked product. In
general there are two main different smoking techniques: hot-smoked and dried-
smoked. The first is considered of superior quality than the second and has a better
market acceptance but, as it contains some water, it has a reduced conservation time
compared to the dried-smoked fish. The main products processed and traded include
dried mukene, smoked catfish and smoked tilapia and Nile perch. Other traditional
forms of processing are sun-dried, dried-salted and fried. On most Islands like Lolwe,
women normally buy fish especially, that is most likely rejected by buyers/juvenile
and smokes it. The Oil is also extracted from Nile perch, processed and sold to
Kenya. Women also deal in refreshments, bars, crafts like ropes and to some extent
engage in prostitution on some Islands.
Fish trading varies, the sale of a consignment of catch to a commissioned agent, fish
auctioning and purchasing fish in bulk for sale in the fresh state. Elsewhere, direct
bargaining between producer and trader remains the most popular trade process.
Although Namisi (2000) indicated that the size of Nile perch processed by fish
factories, had improved with most factories processing fish of more than 2 kg, this
study established that all factory agents buy Nile perch starting from 1.5 kg and
above. This has come about due to the increasing demand for Nile perch for export
following the lifting of the ban on fish and its products.
The factories have established relationships with fishermen, either directly or via
agents, by supplying gear or credit. This makes fishermen dependent on factories or
their agents, effectively reducing their choices in the market.
Fish agents / Middlemen
Fish agents act on behalf of the fish processing factories by buying the fish from
fishermen and then supplying the same to the factories. Most of these fish agents are
28
influential and powerful. Many own outboard engine boats and vehicles for fish
transportation, while some own canoes and nets and employ fishers. Many times the
fish is bought in the lake and brought directly to the factory. Fish agents from Kenya
and Kampala are known to transact fishing inputs with fishers. Fishers give them fish
in exchange for inputs such as outboard engines, nets, fuel and ice.
Fishers, however, have become disillusioned with the fish agents who act as
middlemen, between the fishers and fish processing factories because of exploiting
them. For example, instead of buying fish at the agreed price (agreed between the
agent and the fish processors), upon reaching the beach, the agent normally sets his
own buying prices, which in most cases are lower than the agreed prices and he
retains the balance. Arrangements are sometimes made between individual
agents/factories and fishers in which the agents either employ the fishers or provide
them with fishing equipment on credit and in return, the fishers supply fish to him
and, in the process pay back his loan. This strong patron-client relationship is geared
towards serving the interests of the factories and middlemen. By establishing tight
control of the fishers who, in many cases are forced to supply them with fish, many
fish agents have undermined the role of the fishers organization. They have become
constraints for community participation in the marketing of the fisheries.
4.9 Management Issues and Possible Interventions
Management issues
Results from key informants indicated that low catches; low fish prices, high taxation,
lack of clean water and poor health and lack of schools are some of the daunting
problems facing the lake’s fisheries.
Fishers used to get more earnings with uncontrolled gear sizes but with serious
restrictions on illegal gears most fishers cannot afford the legal gears and have called
it quits and resorted to farming.
Theft of fishing gear (nets and hooks) is serious and ever increasing for the same
reason discouraging many fishers from the business and disrupting or distorting the
beach management institutions.
29

Landing sites in Mayuge have very poor infrastructure mainly no schools and health
centres, sanitary conditions are very shoddy. Some landing sites like in Busia,
Madwa however, have good infrastructure with a primary school, hospital and toilets
available or accessible. The road network has improved greatly to number of fishers
and fish traders.
Bugiri (Bumeru B) has a good infrastructure with pre- and primary schools but had
poor sanitation (lack latrines and bathrooms), poor medical facility, poor transport
and poor management institutions.
Buluba (Mayuge) has schools and health services nearby but has poor local
management institutions.
Increased fishing effort and illegal gearsThe gears have increased in quality and quantities. Ten percent of the boats are
motorised Ssesse type; owned mainly by the affluent fishers, of which the Baganda
are majority and they mainly target Nile perch. The majority constitute a typical
traditional fishery employing simple boat types commonly known as parachute and
used by the less affluent fishers including the two tribes from Kenya, Jaluo and
Banyala.
Dug out canoes are found in isolated places but they are indeed few. These mainly
target Nile tilapia and they use the traditional method of cast nets. The main method
of propulsion is by Oars.
Competition for money, poverty and increased fishing effort has forced most fishers
to resort to use of illegal/destructive fishing methods such as gill nets with very small
mesh size and fishing in shallow breeding grounds for fish. They reason that big fish
is scarce and they have to adjust size of nets to get some fish. The small size nets
can be locally made and are relatively cheaper.
Illegal fishing methods such as beach seines, monofilament, small mesh gill nets/cast
nets and tycooning, increasing effort, weak enforcement due to corrupt government
officials, high fish demand and feeding behaviours of Nile perch are some of the
reasons why some fish (Cynodontis, Barbus, labeo, momyrus) have disappeared
30

and, why tilapia and Nile perch are declining. Some fishers who resort to bad fishing
methods do it for their survival since they are poor, unemployed and cannot afford
the legal gears, engines and fuel, which are too expensive for them. Fishers feel
they need financial help to enable them acquire proper gears or the prices of the
gears should be lowered. The lake communities have resorted to cheap but
destructive methods because fishing gear is too expensive.
To get good returns, one needs hooks, nets, a boat and an engine, all valued at
around Ush 5,468, 750 ($3,125). Those who do not use motorised boats need close
to Ush 800,000 ($460), far beyond the reach of many in a country whose GDP per
capita is $150.
In contrast, those who poison fish need only Ush 5000 ($3) or less to catch Ush400,
000 ($234) worth of fish per day. Those using legal methods earn an average of
Ush100, 000 ($60) a day. Many fishermen can't afford that kind of money mentioned
above, so they resort to methods which the government does not want."
Pressure from middlemen who control the industry and lack of incentives for
fisherfolk to use appropriate methods was responsible for the rise in fish poisoning.
The practice, which led to ban on fish imports from Lake Victoria by the European
Union and jeopardised the country's Ush 105 billion (US $60 millions) annual trade in
fish. In any case, fishers have already lost control over the destiny of their resource
to the rich and the influx of migrants into the sector has also had a negative impact.
Kenyans coming to fish and for fish in Ugandan waters have increased in recent
years. The recent ban to restrict fish smuggling to Kenya (New Vision, 2001) has not
helped much because during this study we learnt that a lot of fish still goes
unaccounted for to Kenya after the culprits buying their way out from some Uganda
Revenue Authority (URA) personnel manning these areas. The money given in bribe
is Ushs 50,000/- per boat (personnal communication at Kirewe Islands). Moreover,
the illegal immigrants (mainly Banyala and Jaluo from Kenya) are seen as people
importing destructive fishing methods to Uganda since the same methods have
depleted fish in their country. In particular, long line fishery is associated with these
people.
31

The situation is made worse by complete lack of government fisheries officials in
these Islands. For example, Kirewe, Namiti, Lubya, Laboro and Makalaga Islands
have only one provisional fisheries assistant personnel who confessed that he takes
sometimes two months to get to some Islands to see what is happening (personal
communication by Jjugu). While fisheries officials blame fishers for using illegal
methods, fishing communities accuse fisheries officials of corruption.
Fish scouts who are supposed to monitor fishing activities in the lake have become
ineffective because they accept bribes from the offenders. The institution mandated
to manage, regulate and monitor the fishing industry in Uganda is poorly funded,
corrupt and politically marginalized."
Fisheries guards in the field say that much as they may try to enforce regulations,
lack of guarantees for their security limits their capacity.
Some fishers in Bugiri admit that due to declining harvests they sometimes resort to
destructive techniques in order to earn sufficient income.
Fisheries management by Government
The management of Lake Victoria fisheries has been transformed during the last two
decades, from traditional to central management systems. Traditional management
systems, based on the clan institutions, provided a sound management for Lake
Victoria fisheries. The management framework was based on the territorial user
rights, with enforceable clear rules and regulations on who could fish where, when
and how.
The Government has played a role in fisheries development since colonial times.
However, it is mainly since the 1970s Nile perch boom that the government activities
have affected the development of the fisheries and undermined the traditional
management system. The rules and regulations for the fisheries and the
development plans made by the government are well articulated in the Act. However,
the key informants presented a rather negative picture of the way in which the
regulations and the development plans are being implemented at the local level.
Almost all people interviewed emphasised that the behaviour of the Government
32
officials in the field has changed for the worse during the last decades. Instead of
managing the fisheries resources sustainably, they have focussed on exploiting the
fishers for their (officials’) economic advantage. This has thrown Lake Victoria
fisheries into a management crisis hence compromising the resource base and, by
extension, the living standards of the fishing community.
In response to these frustrations, and given the importance of Lake Victoria fisheries
in terms of employment generation, income and food security, the fishers are coming
up with their own institutions, the self help groups, which they would like to operate
without any intervention from the government.
4.10 Organisation of Fishing Communities
The overall authority at fish landings lies with the LCs, the state organ at the grass
root level. It ensures law and order among fishing communities and the
implementation of government programs within the communities. Traditionally,
fishing communities have operated under the leadership of a head fisherman
(Gabunga), with his committee. In other situations, there are elected chairmen, also
with their committees, serving unspecified periods of office. These organs are
essentially to resolve conflicts and maintain harmony at the beaches. They have
power to set up and enforce byelaws, often regarding hours to go fishing in order to
control theft of gear. They have, however, not played significant roles in resource
management due to the legal policy implications involved and lack of incentives.
Recently, following the increased use of fish poisoning, the District authorities
ordered the establishment of Fisheries Task Forces at the Sub-counties, initially to
curb the use of fish poisoning. The Task Force has been responsible for registering
fishermen at the beaches, inspecting and issuing certificates for fish consignments
and setting up bye-laws governing hours to go in and out of the lake. Having largely
achieved its objective, the organ’s mandate has been extended to cover the control
of other types of fishing malpractices. They have, however, had much less success
in this role.
The existence of different organs at the beaches has often created conflict among
the organs themselves, resulting for unclear definition of powers. Conflicts have also
33

been experienced with other local leaders, due to divergence of interests over
resource management. There are no clear mechanisms for resolving these conflicts.
At the higher level, there exist fishers’ NGOs working to co-ordinate and represent
the interests of the communities. Notable are the Uganda Fisheries and Fish
Conservation Association and the Uganda Fisheries Development Union.
Government development projects have been working with these NGOs to involve
fishers in formulation and implementation of management and development
programs on the lake but the success of this is still to be realized.
Fishers’ participation in resource management has been hindered by the open
access regime on the lake. A recent study (Namisi, 2000; LVFRP, 1999) revealed
that there was considerable awareness among fishers on the danger of illegal fishing
methods and practices causing fish decline. Fishers also have the basic knowledge
on fishery regulations in place. However, the open access nature of the fishery
regime is a disincentive to fishers not only to enforce the regulations but also to
comply themselves.
34

CONCLUSIONS
1. The demand for fish is ever increasing. Almost all fish caught (mainly Nile
perch, tilapia and mukene respectively) is utilised in one way or the other
according to fishers. The fish distribution has greatly improved with increased
channels. These include - middle agents/boat traders that supply to fish
factories for regional and export markets, fish traders that supply to rural,
urban and regional markets, factory agents that supply factories and, boat
traders who smuggle fish to Kenya. The demand for fish for factory
processing for both Nile perch and mukene is likely to be affecting fish
distribution to other up country rural markets which used to feed local people.
2. Factories mainly exploit Nile perch for export - so great volumes of Nile perch
are feeding the out side market earning government a large foreign exchange.
Many fishers and people involved in the distribution together with factory
owners have greatly benefited from the Nile perch fishery. Nile tilapia mainly
serves the domestic fish requirements.
3. There have been tremendous structural changes at major landing sites,
increased infrastructure, including businesses indicating improved incomes
and standards of living.
4. Mostly semi permanent ethnic groups have become diverse: —Baganda,
Basoga, Baziba, Jaluo, Bagungu, Adholas, Bagwere, Itesots, Alur, Nyankole,
Nyarwanda, Bagisu, Bakenyi, Banyala, etc., indicating high rates of migration
in recent years.
5. Illegal fishing methods such as beach seines, monofilament, small mesh gill
nets/cast nets and tycooning, increasing effort, weak enforcement due to
corrupt government officials, high fish demand and feeding behaviours of Nile
perch are some of the reasons why some fish have disappeared. Some
fishers who resort to bad fishing methods do it for their survival since they are
poor, unemployed and cannot afford the legal gears, which are too expensive
for them.
35

6. Unemployment, poverty, lack of capital and laxity in enforcing existing
regulations has compounded the use of destructive fishing methods in Lake
Victoria.
RECOMMENDATIONS
1. There is need for a clear fisheries policy regarding food security and fish
exports in view of the available fish stocks and all fisheries stakeholders
should understand this.
2. At the mean time, the government ought to institute measures such as taxing
the fish processing and animal feed firms and using the revenue back to
improve the fisheries sector and the welfare of fisherfolk.
3. A gradual transfer of ownership of the fisheries to the fishing community to
reduce open access to the lake and provide incentives for adoption of
appropriate technology is the best way forward. This can be done through
sensitisation and empowerment of the local community to manage the
resource.
36

REFERENCES
East African Newspaper, 1999FCSEUP (Fish Commodity Systems Economics [Uganda] Project) 1997: Final
Technical Report of the Fish Commodity Systems Economics [Uganda] Project
Hecky, R. E., and S. Guildford. 2001. Sci 454, Biology of Freshwater Pollution -- Supplemental Lecture Notes [online].
Available: http://www.sciborg.uwaterloo.ca/~sguildfo/notes.htm [April 4, 2001]. Hecky, R. E., F. W. B. Bugenyi, P. Ochumba, J. F. Talling, R. Mugidde, M. Gophen,
and L. Kaufman. 1994. Deoxygenation of the Deep Water of Lake Victoria, East Africa. Limnology and Oceanography 39(6): 1476-1481.
Kitakule, J: 1991: findings of the fishing communities of Lakes Victoria and Albert – Uganda, 1991. Socio-economics field Reports: Fisheries Statistics and Information Systems Project.
LVEMP (Lake Victoria Environment Management Project), 1999: Report of the national stakeholders workshop, 26-28 October, 1999.
LVFRP (Lake Victoria fisheries Research Project), 1999; Marketing Study. LVFRP Technical document No. 2.
Namisi W. P, 2000: Socioeconomic implication of the fish export trade on the fishing communities and fisheries of Lake Victoria, Uganda. Thesis: National University of Ireland, Cork.
New Vision, Monday, Jan 28, 2002, pg50Reynolds, J.E. and D.F Greboval, 1988: socio-economics effects of the evolution of
Nile perch fisheries of Lake Victoria: A review. CIFA Technical Paper No. 17, CIFA, FAO, Rome.
UFRD, 2001: Various reports. MAAIF, Fisheries Department, Statistics Section Entebbe
37

ACKNOWLEDGEMENT
This study was carried out with funding under LVEMP, Socio-economics Research
Sub-Component under the Fisheries Research Component at FIRRI. The Socio-
economics research team (J. Wegoye, A. Nassuna, M. Khaidhiwa, V. Kulyanyingi, M.
Lubuulwa and I. Kyangwa) of FIRRI was instrumental in primary data collection. The
assistance rendered by Dr. O.K. Odongkara, Head of Socio-economics Unit and Dr.
R. Ogutu-Ohwayo, Director FIRRI in guiding and facilitating the research cannot go
unmentioned.
38

Appendix: DATA INSTRUMENT USEDSocio-Economic Sub-ComponentLake Victoria Environment Management ProjectFisheries Resources Research Institute
A STUDY TO EXAMINE THE CURRENT FISHERIES DISTRIBUTION PATTERN AND THE SOCIO-ECONOMIC IMPLICATIONS.
Name of Interviewer: _________________________
Date: __________________________
District: __________________________
A. Personal Data:
1. Name of Respondent __________________________
2. Age ___________ years
3. Sex [1] Male[2] Female
4. Tribe [1] Iteso[2] Muganda[3] Musoga[4] Musamia[5] Mukenye[6] Mugwere[7] Alur[8] Adhola[9] Others (Specify) __________________________
5. Marital Status[1] Married[2] Single[3] Divorced[4] Widowed[5] Others (Specify) __________________________
6. What is your level of education? (Tick one)[1] No schooling[2] Primary[3] Secondary[4] Tertiary[5] University[6] Others (Specify) __________________________
7. Do you have a family?[1] Yes [2] No
8. If yes, how many people are in the family?
39

Children________ Dependants_______ Wives_____________
9. How long have you been at this landing? ____________ Years
B. Fisheries Distribution PatternFish Production
10. What fish species do you most commonly catch? (Rank)[1] Nile perch[2] Nile Tilapia[3] Mukene
[4] Others (specify) _______________
11. What type of fishing gear do you use?[1] Gill nets[2] Longlines[3] Cast nets[4] Basket traps[5] Mosquito seines[6] Beach seines[7] Others (Specify) ____________________________
12. What gear size/ number do you use?[1] Size __________[2] Number _______
13. In what fishing ground do you operate?
[1] Shoreline[2] Inshore[3] Offshore[4] Bays[5] Others (Specify) ____________________
14. What boat type/ length/ means of propulsion do you use to fish?
Boat type Means of propulsion Boat length[1] Parachute [1] Engines[2] Ssesse 1 [2] Oars[3] Ssesse 2 [3] Sails[4] Dug-out [4] Others (Specify)[5] Others (Specify)
Fish Marketing10. To what type of traders do you sell your fish?
Type of trader Means of transport Market[1] Local trader [1] By food [1] Rural[2] Bicycle trader [2] Bicycle [2] Urban[3] Factor agent [3] Public transport [3] Fish processing factories[4] Truck trader [4] Truck [4] Regional markets[5] Local processors [5] Boat [5] Others (Specify)[6] Others (Specify) [6] Others (Specify)
Fish Processing
40

10. Is there any traditional fish processing done?[1] Yes [2] No
11. If yes, what fish species is most commonly processed?[1] Tilapia[2] Nile perch[3] Mukene
12. What method of processing do you use?[1] Smoking[2] Salting[3] Sun drying[4] Others. (Specify)_____________
C. Socio-Economic Status
Income
13. Boat owner
Fish Species QuantiesYesterday Today Good day Bad day Price
Nile perchTilapiaMukeneProtopterusClariasOther (Specify)
Fish Labourer
20. How many fishing trips do you make in a week? _____________
21. How much do you make on each fish trip? Shs. _____________
22. Do you have any other sources of income?[1] Yes [2] No
23. If yes, which ones?[1] Farming [2] Business [3] Others (Specify) _________________
24. How much do you spend on food per day? Shs __________
Investment
25. Do you re-invest some of the money you earn in fishing assets?[1] Yes [2] No
26. If you reinvest, what fishing asset do you mainly buy?[1] Boat[2] Gillnets[3] Boat engine
41

[4] Oars.[5] Others (Specify)____________________
27. How often do you re-invest in fishing assets in year?
Asset RateBoatGear ( )Boat engineOarOther (Specify)
28. How much of your income is re-invested on the following assets?
Assets Amount BoatGear ( )Boat engineOarOther (Specify)
29. What was the source of your starting capital?[1] Fishing activities [2] Farming [3] Small-scale business[4] Retirement benefits [5] Family sources [6] Loan[7] Others (Specify) _________________
Employment
30. What is your main occupation?[1] Fishing [2] Boat building [3] Farming [4] Shop [5] Food and refreshment [6] None [7] Others (Specify)
31. If fishing, what is your(a) Type of employment
[1] Boat owner[2] Crew member[3] Local processor[4] Factory agent[5] Middlemen[6] Local fish trader[7] Others (Specify) _________________________
(b) How many people do you employ? __________
Fish Consumption
32. What type of fish do you most commonly eat?[1] Tilapia[2] Nile Perch[3] Mukene[4] Others (Specify) ________________________
33. Why do you mainly eat this type of fish?[1] Available[2] Tasty
42

[3] Affordable[4] Others (Specify) _______________________
34. How often do you eat fish in a week? ___________
35. How much fish (kilogrammes) do you eat per day? __________
Wealth36. What wealth items do you own?
Item No. Unit value Landing/ Off-landing[1] Permanent house[2] Semi-permanent house[3] Vehicle[4] Bicycle[5] Cattle[6] Goats[7] Radio[8] Others (Specify)
Thank you for your time
43