nikolaus franke and eric von hippel and martin schreier finding commercially attractive user
TRANSCRIPT
ePubWU Institutional Repository
Nikolaus Franke and Eric von Hippel and Martin Schreier
Finding commercially attractive user innovations: A test of lead user theory
Article (Accepted for Publication)(Refereed)
Original Citation:
Franke, Nikolaus and von Hippel, Eric and Schreier, Martin
(2006)
Finding commercially attractive user innovations: A test of lead user theory.
Journal of Product Innovation Management, 23 (4).
pp. 301-315. ISSN 1540-5885
This version is available at: https://epub.wu.ac.at/3118/Available in ePubWU: June 2011
ePubWU, the institutional repository of the WU Vienna University of Economics and Business, isprovided by the University Library and the IT-Services. The aim is to enable open access to thescholarly output of the WU.
This document is the version accepted for publication and — in case of peer review — incorporatesreferee comments. There are minor differences between this and the publisher version which couldhowever affect a citation.
http://epub.wu.ac.at/

1
Finding commercially attractive user innovations:
A test of lead user theory
Nikolaus Franke*, Eric von Hippel**, Martin Schreier*
A later version of this paper is published in
Journal of Product Innovation Management, 2006, 23: 301-315.
* Vienna University of Economics and Business Administration (WU)
Augasse 2-6
A-1090 Vienna
Austria
[email protected] / [email protected]
** Massachusetts Institute of Technology/Sloan School of Management
Room E52-556
50 Memorial Drive
Cambridge, MA 02142-1347
[email protected] Suggested running title: Test of lead user theory

2
Abstract
Firms and governments are increasingly interested in learning to exploit the value of lead user innovations for commercial advantage. Improvements to lead user theory are needed to inform and guide these efforts. In this paper we empirically test and confirm the basic tenants of lead user theory. We also discover some new refinements and related practical applications. Using a sample of users and user-innovators drawn from the extreme sport of kite surfing, we analyze the relationship between the commercial attractiveness of innovations developed by users and the intensity of the lead user characteristics those users display. We provide a first empirical analysis of the independent effects of its two key component variables. In our empirical study of user modifications to kite surfing equipment, we find that both components independently contribute to identifying commercially attractive user innovations. Component 1 (the “high expected benefits” dimension) predicts innovation likelihood, and component 2 (the “ahead of the trend” dimension) predicts both the commercial attractiveness of a given set of user-developed innovations and innovation likelihood due to a newly-proposed innovation supply side effect. We conclude that the component variables in the lead user definition are indeed independent dimensions and so neither can be dropped without loss of information - an important matter for lead user theory. We also find that adding measures of users’ local resources can improve the ability of the lead user construct to identify commercially-attractive innovations under some conditions. The findings we report have practical as well as theoretical import. Product modification and development has been found to be a relatively common user behavior in many fields. Thus, from 10% to nearly 40% of users report having modified or developed a product for in-house use (in the case of industrial products) or for personal use (in the case of consumer products) in fields sampled to date. As a practical matter, therefore, it is important to find ways to selectively identify the user innovations that manufacturers will find to be the basis for commercially attractive in the collectivity of user-developed innovations. We discuss the implications of these findings for theory and also for practical applications of the lead user construct, i.e. how variables used in lead user studies can profitably be adapted to fit specific study contexts and purposes.
3
Introduction and overview
There is a growing interest in applying “lead user methods” to the development of new
products and services. This interest has been fueled by practical demonstrations that such
methods can effectively and systematically generate ideas for commercially-attractive new
products (Urban and von Hippel 1988, Herstatt and von Hippel 1992, Olson and Bakke 2001,
Lilien et al. 2002). In tandem and for the same reason, governmental policymakers are
increasingly interested in learning how to support user-centered innovation practices in order to
improve national competitive advantage (National Innovation Initiative Final Report, 2004; Nye
Mal Regerings Grundlag, 2005). Given this growing interest by practitioners and policymakers, it
is important to further develop and test lead user theory. Improvements will provide a deeper
understanding of present practices, and also will provide new insights for further improvements.
In this paper we test some basic tenants of lead user theory. We analyze the relationship
between the commercial attractiveness of innovations developed by users and the intensity of the
lead user characteristics embodied in those users. We test the independent explanatory value of
each of the two components in the lead user construct with respect to innovation likelihood and
innovation attractiveness.
Our article is organized as follows. We next develop our hypotheses via a review of the
literature on lead user theory, research and practice. Then we describe the research setting for our
empirical study and the research methods used. Next, we present our research findings. Finally,
we discuss these findings and related deepened insights regarding the relationship between
innovation and lead user characteristics.
Lead user theory
Lead users are defined as members of a user population having two characteristics. First,
they anticipate obtaining relatively high benefits from obtaining a solution to their needs - and so

4
may innovate. Second, they are at the leading edge of important trends in a marketplace under
study - and so are currently experiencing needs that will later be experienced by many users in
that marketplace (von Hippel 1986). The original theoretical thinking that led to defining “lead
users” in this way was built upon findings from two different literatures (von Hippel 1986, 2005).
The “high expected benefits” component of the lead user definition was derived from
research on the economics of innovation. Studies of industrial product and process innovations
have shown that the greater the benefit an entity expects to obtain from a needed innovation, the
greater will be that entity’s investment in obtaining a solution (e.g., Schmookler 1966, Mansfield
1968). Component 1 of the lead user definition was therefore intended to serve as an indicator of
innovation likelihood.
The “ahead on an important marketplace trend” component of the lead user definition was
included because of its expected impact on the commercial attractiveness of innovations
developed by users residing at that location in a marketplace (von Hippel 1986). Studies of
innovation diffusion regularly show that some adopt innovations before others (Rogers 1994).
Further, classical research on problem solving shows that subjects are strongly constrained by
their real-world experience via an effect called “functional fixedness”: For example, those who
use an object or see it used in a familiar way find it difficult to conceive of novel uses (Adamson
1952, Birch and Rabinowitz 1951, Duncker 1945, Adamson and Taylor 1954, Allen and Marquis
1964). Taken in combination, these findings led to the hypothesis that users “at the leading edge”
would be best positioned to understand what will be needed later by many. After all, their
present-day reality represents aspects of the future from the viewpoint of those with mainstream
market needs.
Note that these two components of the lead user definition are conceptually independent.
They stem from different literatures, and they serve different functions in lead user theory.

5
Although they may be related in some cases and to some degree, this is not necessarily the case.
Consider, for example, that both an animated film studio such as Pixar and a hobbyist maker of
animated films may both be at the leading edge of needs for video editing capabilities. However,
it is likely that Pixar would anticipate far higher benefits from obtaining a solution to those
leading-edge needs.
Review of related literature
Lead user theory was originally proposed as a way to selectively identify commercially
attractive innovations developed by users (von Hippel 1986). Empirical studies to date support
the likelihood that the theory can offer this functionality. Some studies have explored the
effectiveness of the theory with regard to identifying any user innovations. Thus, Franke and
Shah (2003), Lüthje (2004), Lüthje et al. (2002) and Morrison et al. (2000) divided their samples
into innovators and non-innovators (dependent variable) and showed that lead user characteristics
are systematically different in these two groups via t-tests and logit analyses. The effect sizes
found in these studies tend to be very large. For example, Urban and von Hippel (1988) found
that 82% of the lead user cluster in their sample had developed their own version of or had
modified the specific type of industrial product they studied, while only 1% of the non-lead users
had done this.
Empirical studies have also found that many of the innovations developed by users do
have commercial attractiveness. Thus, Urban and von Hippel (1988) found that an industrial
software product concept developed by lead users had greater marketplace appeal than did
concepts developed by conventional marketing research methods. Morrison et al (2000) showed
that manufacturers of IT systems for libraries judged that many of the IT innovations developed
by libraries had potential value as commercial products sold in the marketplace. Lüthje (2003)

6
found that 48% of surgical innovations developed by surgeons in university clinics in Germany
had been or would be produced as commercial products. Evaluators of the commercial potential
of innovations developed by a sample of mountain bikers judged that 31% of the innovations
would be “adopted by many users if produced” (Lüthje et al 2002).
Several published studies have reported successful experiments with a lead user-centered
approach to new product idea generation. Two such studies have quantitatively compared the
outputs of lead user idea generation studies with the outputs of traditional studies, and found that
the ideas generated by a process using inputs from lead users have much higher commercial
attractiveness (Urban and von Hippel 1988, Lilien et al. 2002). (As traditionally applied “voice
of the customer” idea generation methods focus on inputs from target market customers rather
than on inputs from lead users (Griffin 1997).) Lilien et al. (2002) also found lead user studies
capable of systematically generating ideas for “breakthrough” innovations, where breakthroughs
were defined as new product lines providing new sales representing over 20% of total existing
sales of the entity (a corporate division) developing them.
With respect to development of lead user theory, Morrison et al. (2004) showed that the
lead user construct (and a closely-related construct developed by Morrison called Leading Edge
Status) is distributed in a continuous, unimodal manner in a sample of innovating and non-
innovating users. These authors also found that the three component variables in their construct,
being ahead of the trend, having high levels of need, and actual development of innovations, were
significantly correlated throughout their sample. On the basis of this finding, they reasoned that
the lead user components are reflective rather than formative indicators. As will be seen below,
we hypothesize and empirically find that this is not the case: the lead user components are in fact
independent dimensions.

7
This distinction is an important one for lead user theory. Reflective indicators are highly
correlated, interchangeable and do not have an independent meaning. As they all attempt to
measure the same thing, they usually are merged to an index without loss and consequently, their
independent contribution to an explanation is not analyzed. In contrast, dimensions of a construct
usually have a formative nature: they do have an independent meaning, are not interchangeable
and cannot be merged into an index variable without loss of information. As an illustration of the
use of reflective variables within a larger construct, consider the construct “creativity.” This may
be reflected e.g. in the number and quality of ideas in a test, in the preference for particular
careers and hobbies etc. (Spector 1992). Dimensions of a construct and formative indicators, in
contrast, are not interchangeable, and are not necessarily correlated. Diamantopoulos and
Winklhofer (2001) use the construct of “socioeconomic status” (SES) and its components
education, income, occupation, and residence to illustrate. If one of the construct components
increases, SES would also increase c.p. but if SES increases, we would not necessarily expect an
increase in all four components.
Development of hypotheses
As was discussed earlier, the general assertion of the lead user theory is that users who have a
high personal need for innovations (component 1) and are in a position ahead of an important
trend (component 2) are more likely to develop innovations of high value to others. Following
Morrison et al (2004) we assume the lead user construct to be continuous and state as our first
hypothesis:
Hypothesis 1. The higher the intensity of lead user characteristics displayed by a user the
greater the likelihood that the respective user yields commercially attractive innovations.

8
Next, we differentiate the functions of the components. This step is useful and necessary
if the components are (formative) dimensions rather than reflective indicators. If both have
different explanatory functions, this is a clear argument for the components being independent
dimensions: they would not be interchangeable.
Finding attractive innovations can be thought of as consisting of two steps: first
innovations must be found and, second, the most attractive must be identified. As indicated
above, lead user theory argues that the first function is carried out by the “high benefit expected”
component, the second by the “ahead on an important marketplace trend” component. Therefore:
Hypothesis 2. The “expectation of high benefits” component of the lead user construct
has a positive impact on user innovation likelihood.
Hypothesis 3. The “ahead on an important marketplace trend” component of the lead
user construct has a positive impact on innovation attractiveness.
As was discussed earlier, initial lead user theory development focused on two components
only. However, there is a strong case for expecting that innovators’ own resources and also their
links to communities that can provide innovation-related assistance will also affect innovation
likelihood and attractiveness. Why should this be so? Given perfect information and given that
innovations under study were being developed for financial gain, expected benefit would be both
a reasonable and sufficient indicator of the probability that an innovation would be funded. The
presence or absence of internal resources would then be irrelevant because, given perfect
information, external investors will be willing to fund an innovation on nearly the same terms as

9
would the innovator itself. However, ample argumentation and evidence exists that innovation-
related information is far from perfectly distributed (Hayak 1945, von Hippel 1994, 2005, Ogawa
1998, Winter and Szulanski 2001). When potential innovators – and their intimate innovation
communities - have better information regarding an innovation opportunity than can be conveyed
to outside investors, internal resources and help from community members can be obtained on
better terms than can resources from outside investors. Under these conditions, the availability of
local resources will “matter” and will have an effect on innovation likelihood. If the innovation is
being developed for consumption rather than investment, in-house resources will again matter.
An outside investor will require that the innovator have some other source of income or other
assets to assure that its investment will be “paid back.” Morrison et al. (2000) found in-house
resource variables did have a strong impact on the likelihood of innovation. Lüthje and von
Hippel (2002) found that user-innovators tended to rely on in-house resources with respect to
information employed in their innovation-related activities. Franke and Shah (2003) found that
users did get significant help with their innovation development efforts from members of their
user communities for free.
We also expect a user innovator’s internal resources to have an impact on the commercial
attractiveness of the innovation developed. To the extent that an innovator must rely on internal
resources, having better resources - such as higher technical capabilities, more support from the
top management or from a community of peers, lower time constraints in the process, more funds
for testing and refining the innovation - should have a positive impact on the value of the
innovative outcome (see e.g. Hadjimanolis 2000). Therefore:
10
Hypothesis 4. A user’s local, innovation-relevant resources have a positive impact on (a)
the likelihood that the user innovates and (b) the commercial attractiveness of the
innovations that user develops.
Study method
In this section we report on the context of the research field being studied (section 3.1), on
data collection procedures and characteristics of our samples (section 3.2), and operationalization
of dependent and independent variables (section 3.3).
Context for empirical research
In order to test our hypotheses empirically we needed a field research context meeting
three criteria: (1) user innovations are likely to occur, (2) users seek to make advances with
respect to a clearly-definable major trend, and (3) users can objectively be ranked metrically on
this trend. Discussions with innovation researchers familiar with a wide variety of fields led us to
decide that the relatively young field of kite surfing would meet these criteria. Kite surfing is a
water sport in which the user stands on a special board, somewhat like a surfboard, and is pulled
along by holding onto a large, steerable kite. Equipment and technique have evolved to the point
that kites can be guided both with and against the wind by a skilled kite surfer, and can lift rider
and board many meters into the air for tens of seconds at a time. Today there are between
100,000 and 250,000 kite surfers worldwide (Plastic 2004).
Tietz et al. (2004) have studied kite surfing and have found users to be quite active as
innovators. By studying literature on the sport of kite surfing and by interviewing professional
kiters we found that the major trend in the sport is an increase in the “radical” nature of
performances over time. More specifically, the worldwide elite competes primarily in the two

11
categories “Freestyle” and “Hang-Time” (see “PKRA - Professional Kiteboard Riders
Association” - www.pkra.info, organizer of the world tour). “Freestyle” is scored by measures of
the level of challenge of tricks performed in the air, “Hang-Time” is measured by the time a kiter
stays suspended in the air without touching water.
Data collection and sample characteristics
Data was collected in two major waves. First, kite surfers were surveyed to determine
whether they innovated or not. Second, user innovations were then evaluated in terms of
attractiveness by six external experts in the field.
As kite surfing is a very young and trendy sport, essentially all serious participants are
members of some (online) community. We therefore chose to collect data via important
(European) kite surfing communities (multi-sample method). The questionnaire was either
posted directly on the community’s website or, if possible, sent by the web- or community-master
to its members by newsletter via email. Whenever it was possible, at least one reminder was sent
out.
Table 1 reports on population sizes and response rates of our 15 samples. In sum, 456
questionnaires were returned. Response rates for samples surveyed via e-mail (mean: 14.6%) are
based on the actual number of delivered emails. For major reasons, it is likely that this calculated
response rate is a serious underestimate, and that the actual response rate is 30% or greater.1 T-
tests of early and late respondent revealed no systematic differences. Respondents were
predominantly male (91.5%) and are on average 30 years old (SD: 8.8), started kite surfing in
2002 (ranging from 1988 to 2005), and practice the sport 64 days per year (SD: 67.6). This last
figure suggests that our sample is biased towards active kiters.
12
Insert Table 1 about here
Operationalization of independent variables
In general, all items were generated by means of literature review as well as interviews
with experts in the field under study. All independent variables in our hypotheses (“ahead of a
trend”, “high benefit expected”, “resources at hand”) are measured by reflective complex
construct measurement (e.g., Churchill, 1979).
“Ahead of a trend”. As noted above, kite surfing is dominated by the trend to perform
more radical jumps - in terms of height above water achieve, length of time in air, and the degree
of difficulty of tricks performed. We therefore measure “being ahead of a trend” by the user’s
ability to achieve in terms of these measures. Following the PKRA, we operationalize it
according to the two categories of competition used in the sport: Freestyle (difficulty of tricks
i.e., taking into account technical difficulty, height, smoothness, power, and style of jumps) and
Hang-Time (time off the water).
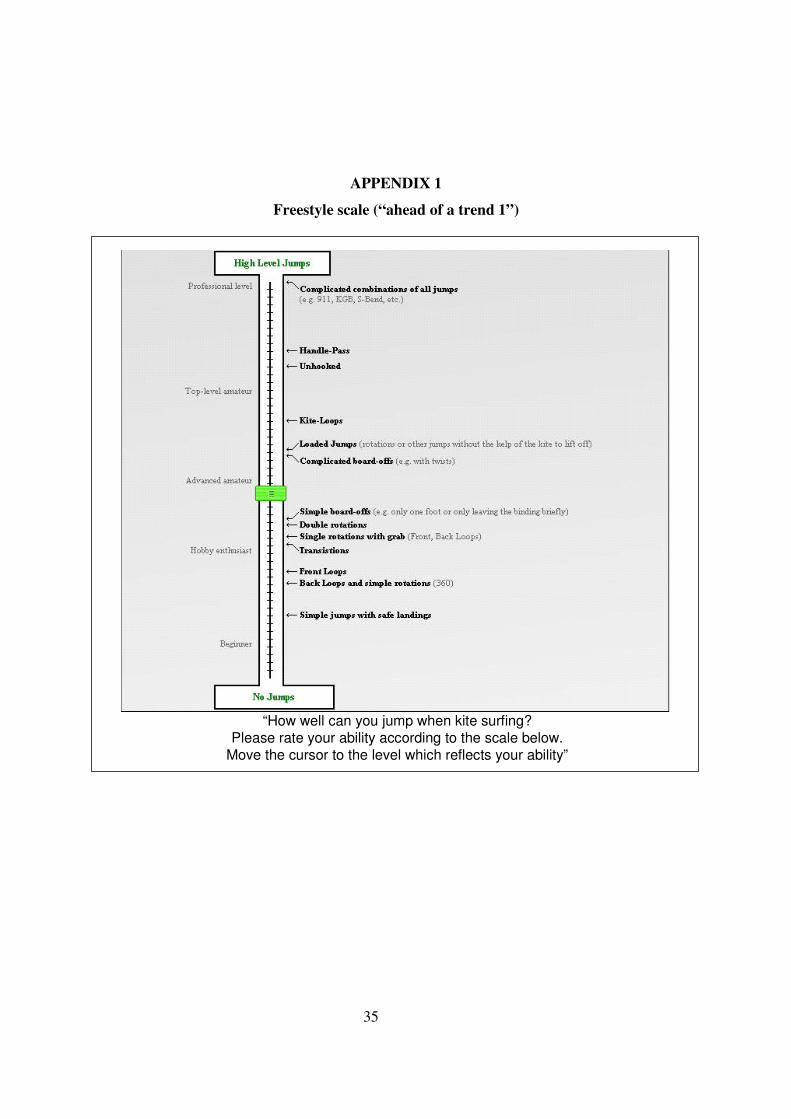
For the freestyle mastery we developed a scale following the idea of Thurstone (Thurstone
and Chave, 1929, see also Likert, Roslow, and Gardner, 1993, Wrenn, 1997). We collected the
most popular tricks that reflect the whole range of freestyle jumps. Then, in course of pilot study
1, twelve experts were asked to rate the selected tricks on a (metric) scale from zero to ten. The
highest and the lowest judgments were eliminated and means were used to denominate the scale
for the questionnaire (see appendix 1). In addition to evaluating the tricks, experts in pilot study
1 were asked to rate the skill level of a kiter who would perform such tricks, ranging from
“beginner” to “professional level” with scores again from zero to ten. These additional anchors

13
facilitated orientation for self-evaluation and thus increased validity of measurement. In course
of our main study, kiters could use a scroll bar to precisely indicate their freestyle mastery.
Hang-Time was measured as the maximum time a kiter managed to be off the water when
jumping (self-assessment). Additionally, we asked for the maximum height they reached when
jumping. For both measures kiters were provided with reference points for orientation purposes
(for reliability and validity concerns see tables 2 and 3).
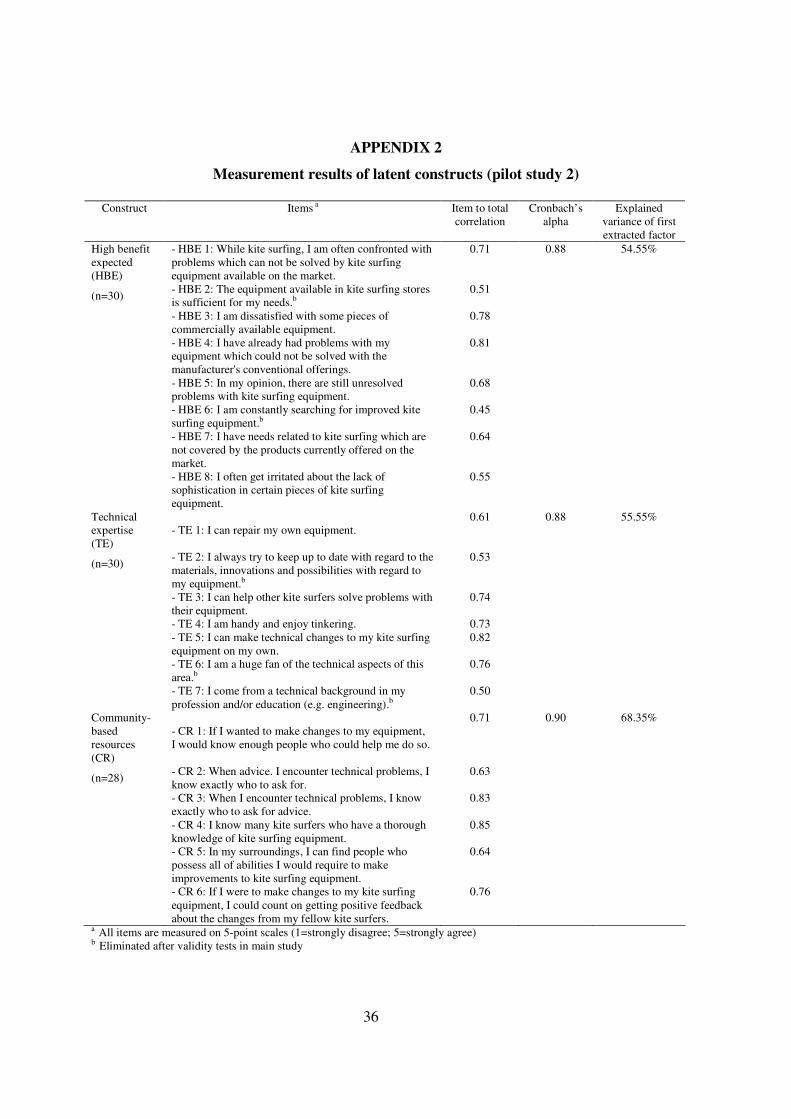
“High benefit expected” and “resources at hand”. In the absence of satisfactory scales in
existing literature, we developed appropriate scales for these two variables. First, items were
generated to reflect all construct properties. After testing content-related validity by expert
discussions (e.g., Bearden and Netemeyer 1989) we tested remaining items in course of pilot
study 2 (n=30; Swiss community “Kitegenossen”; population: 117 users; response rate: 25.6%).
“High benefit expected” was measured by 12 items. “Resources at hand” was divided into two
constructs which seemed to be conceptually independent. “Technical expertise” – the ability of a
user to actually accomplish modifications/changes to existing kite surfing equipment (e.g. Lüthje
et al. 2002), is measured by ten items, “community-based resources” – the potential contacts a
user can draw on at low or no cost when facing a problem with existing kite surfing equipment
(e.g. Franke and Shah 2003), is measured by eight items. Both resource-based constructs might
add independently when explaining innovation likelihood and innovation attractiveness, thus they
were not further aggregated.
Exploratory factor analyses lead to a drop of four, three, and two items, respectively (due
to low factor loadings and low item to total correlations, Churchill, 1979). All item-to-total
correlations of the remaining items, Cronbach’s alphas, and explained variances show satisfactory
results for all three constructs (see appendix 2).
14
In course of our main study both, exploratory and confirmatory factor analyses indicate a
reliable and valid measurement (see table 2). For each latent variable, the first factor extracted
explained close to or more than 50% of the variance (exploratory factor analysis). Furthermore,
Cronbach’s alpha clearly surpassed the 0.7 threshold (one item of “technical expertise” (TE7)
was dropped due to low item-to-total correlation of 0.36). Next, we assessed overall
measurement quality by employing confirmatory factor analysis (e.g., Anderson and Gerbing,
1988/1992) where maximum likelihood estimation was used to fit the model. Initial analysis lead
to a drop of four items (HBE2, HBE6, TE2, and TE6) due to low squared multiple correlations
(<0.4) and low factor loadings (<0.5) (e.g. Babin and Boles, 1998, Bagozzi, 1994).
Table 2 reports the final quality assessment of latent construct measurement (in both
exploratory and confirmatory factor analysis). All factor loading surpass 0.5 (t-values >10;
p<0.001). Global fit measures consistently support our measurement model (e.g. c²/df=2.15;
AGFI=0.90; CFI=0.96; RMSEA=0.05). This indicates a reliable and valid measurement of our
independent variables.
Insert Table 2 about here
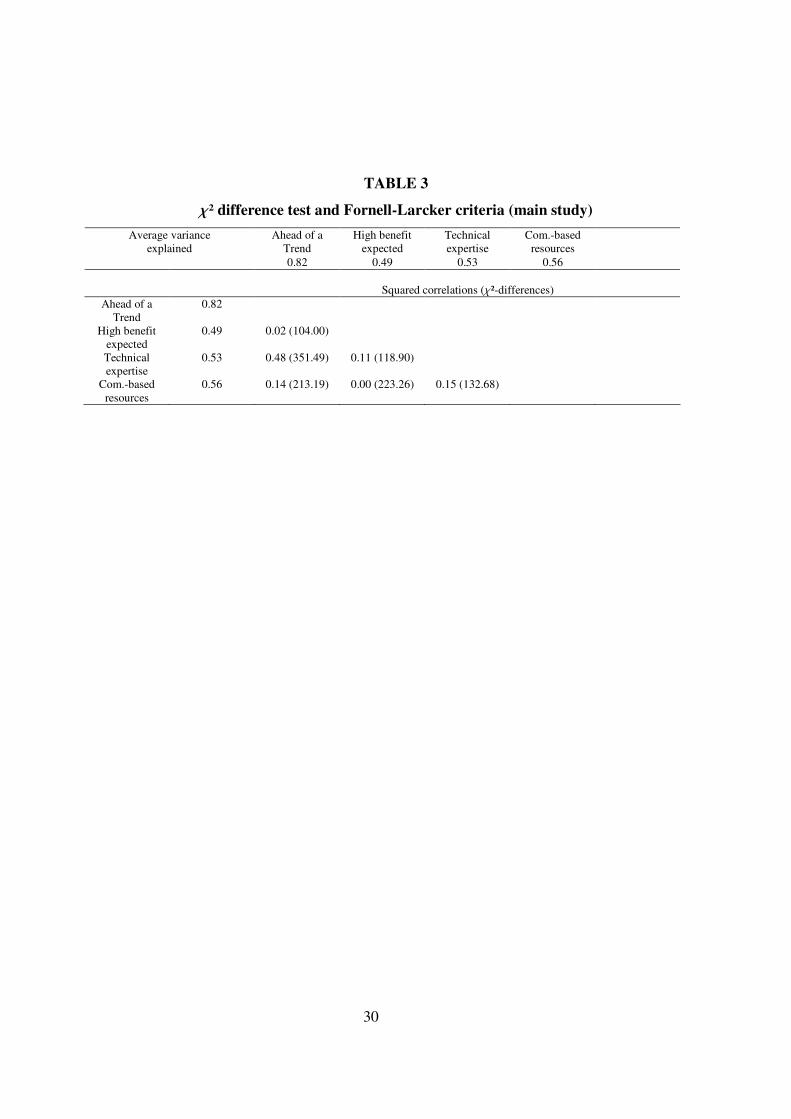
Table 3 reports results of c²-difference test and Fornell-Larcker criterion (Fornell and
Larcker 1981, Jöreskog and Sörbom 1982) to assess discriminant validity. Both tests show a high
measurement validity. This is a first empirical confirmation of the independence of the two lead
user components. The correlation between the two lead user components is only relatively
moderate albeit significant (r=0.14; p<0.05).
15
Insert Table 3 about here
Operationalization of dependent variables
Following previous research (e.g., Franke and Shah 2003, Franke and von Hippel 2003,
Lüthje 2004, Lüthje et al. 2002, Morrison et al. 2000), innovative activities were measured as a
dummy variable asking respondents “have you ever had specific suggestions for improvement for
existing products or had ideas for new pieces of equipment which were not yet available on the
market?” (Yes/No). Those users who had had an idea where then asked to describe the most
innovative one by stating the problem and its solution (“Please describe your most innovative
idea as specifically as possible so that we can understand it fully - what was the problem, what
was the solution?”).
Insert Table 4 about here
Out of 452 respondents who answered this question 140 indicated to have had an idea to
improve kite surfing equipment (30.9%). Table 4 provides some examples. Asking about
innovative activities bears the risk of social desirability. We therefore coded only those
respondents as innovators who provided descriptions of their respective innovation and where
experts agreed that, based on the information provided, they were confident that the users’ ideas
were indeed meaningful innovations. (The expert evaluation was performed by six individuals
who rated all user ideas in course of a one-day workshop held at the author’s university. All six
experts dealt with kite equipment in their jobs (e.g. product developer or salesmen of significant
kite companies). They also had a very good overview of the sport’s history and the technical

16
aspects of equipment, and all of them have been practicing the sport themselves for several
years.) A number of descriptions lacked a fully satisfactory description, thus we ended with 88
innovators (19.5%). Our conservative classification did not affect the pattern of results reported
later, however, i.e. results are robust for different classification schemes.
“Innovation attractiveness”. We used two measures of innovation attractiveness. First,
we constructed a continuous attractiveness index based on the averaged ratings along the
variables originality of problem (a=0.70), newness of idea (a=0.66), short-run (a=0.63) and
long-run benefit (a=0.56), and short-run (a=0.63) and long-run sales potential (a=0.56). Second,
we asked the expert to nominate the most outstanding innovations and constructed a dummy
variable from their judgments (average pairwise intercoder reliability: Cohen-Kappa = 0.12).
This procedure we carried out as it appeared difficult for the experts to differentiate e.g. between
an average idea and a “somewhat-below-average” idea. Given the moderate agreement, an
innovation was treated as highly attractive if at least four of the six experts considered it
outstanding, leading to 26 innovations that fall into this category. Again, variations of this
classification scheme did not affect the patterns of results reported below.
Concluding, reliability of measurement seems to be reasonable for such evaluations (e.g.
similar studies like the one conducted by Kristensson et al. (2004). For further analysis
(validation of overall attractiveness judgement) ratings were averaged (Amabile, 1996, Blackman
and Funder, 1998). All measures are positively and highly inter-correlated and are also correlated
with innovators’ self-assessment of their ideas (see table 5).
Insert Table 5 about here

17
Findings
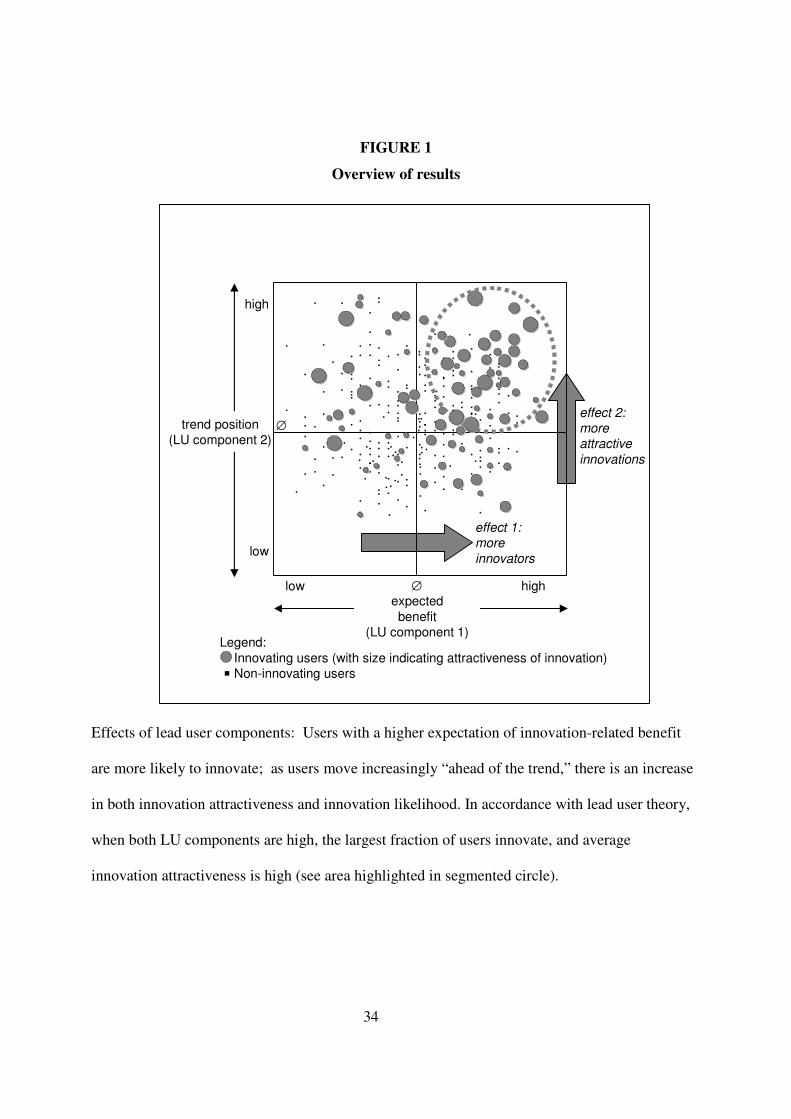
Before turning to statistical analyses, we give a graphical illustration of the findings with regard
to the effects of the lead user components (figure 1). First of all, we see that both components are
indeed relatively independent. Users are broadly distributed and there is a considerable number
of users who are far ahead of the trend but have hardly any benefit from innovating, and also
many users who would reap high benefits from an innovation but are not ahead of the trend at all.
Second, we see that moving from left to right (i.e. from low to high benefit), the proportion of
innovators is rising – just as lead user theory proposes. Third, we see that moving upwards (i.e.
from a position behind the trend to a position ahead of the trend) the attractiveness of innovations
is rising which also is in line with theory. Interestingly, the proportion of innovations is also
increasing in that direction. Hence, in the “lead user region” of figure 1 (top right) both the
proportion of users with innovative ideas and the commercial attractiveness of the innovations
they develop is highest. This pattern is in clear agreement with lead user theory.
Insert Figure 1 about here
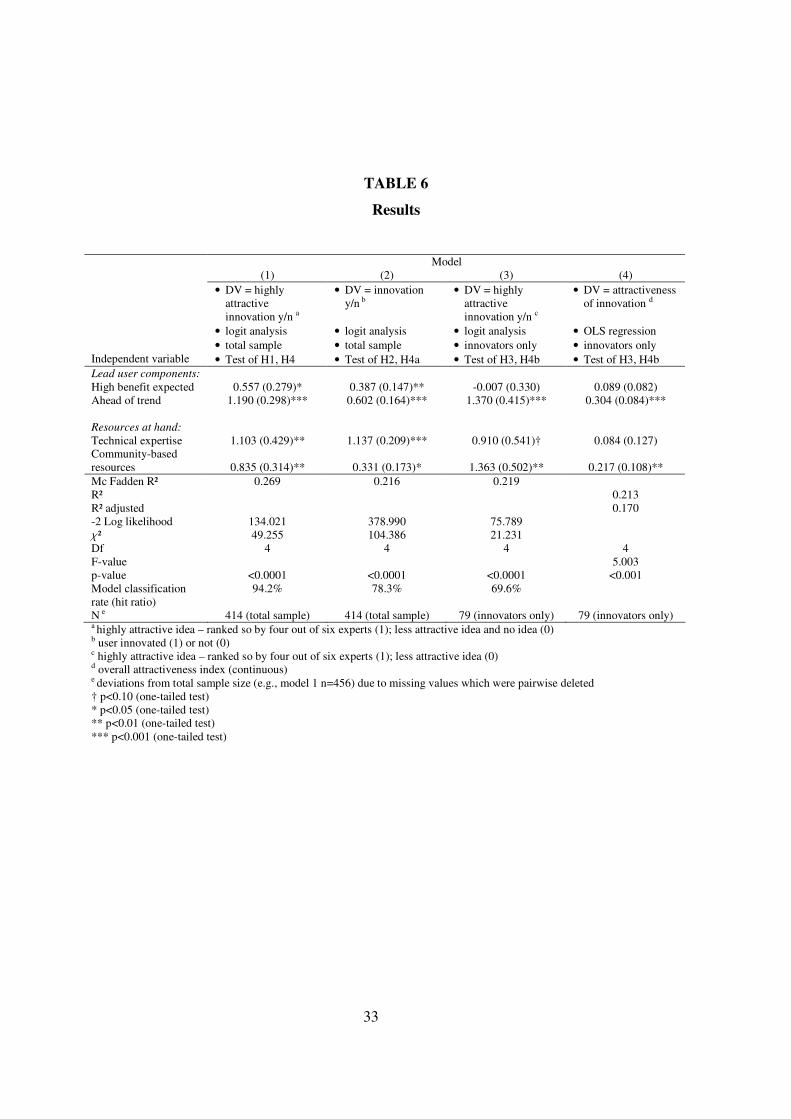
In the following, we analyze these effects statistically. In our analyses, we include our two “local
resource” variables in addition to the two originally-proposed components of lead user theory.
Results of our tests are presented in table 6. Overall, results clearly confirm all our hypotheses
and model performance generally is very good. We describe the findings along the different
models.

18
Insert Table 6 about here
In model 1, we conduct the overall test of the lead user theory that states that the two lead
user components serve to identify commercially attractive innovations (H1). For this, we coded
the 26 subjects who provided highly attractive innovations (ranked as high potential by at least
four out of six experts) as 1 and users with less attractive innovations as well as non-innovators as
0. This setting is a realistic equivalence to a lead user study in which only attractive innovations
are searched for.
As predicted by H1, we find both components to have an independent explanatory
contribution to the likelihood of an attractive innovation, with effect and significance level of
component 2 (being ahead of the trend) being somewhat stronger. We also see that local
resources (technical expertise as well as the availability of community-based resources) have a
clear contribution, thus also H4 is confirmed.
In the following models 2, 3, and 4 we split up the lead user theory in the particular
functions that are associated with the two components. Component 1 (expected benefit) is
hypothesized (H2) to separate innovators from non-innovators (irrespective of the commercial
attractiveness of their innovations) and component 2 (being ahead of the trend) is hypothesized
(H3) to filter out attractive from less attractive innovations.
In model 2 we analyze H2 and H4a. We find a clear association between the independent
variables of “high benefit expected” (H2) and both innovation-related resources “technical
expertise” and “community-based resources” (H4) and the likelihood of an innovation.
Additionally, we found a positive association between component 2 (being ahead of the trend)
19
and the likelihood of innovation. We will provide an interpretation of this finding in the
discussion section.
In model 3 we test H3 and H4b. For this test, we drop non-innovator data and use only
data from the 88 innovations in our sample (that could be seriously evaluated by experts). As
predicted in our hypotheses, we find that component 2 (being ahead of the trend) as well as
resources at hand significantly impact the likelihood of yielding a commercially attractive
innovation. Regarding technical expertise, the effect is only relatively weak. Lead user
component 1 (expected benefit) has no independent impact.
In model 4 we test the robustness of the latter finding (model 3) by treating the
attractiveness of the innovation as a continuous variable. As can be seen from the fourth column,
results of the OLS regressions show very similar significance patterns as in model 3. Again,
hypotheses 3 can be confirmed. Hypothesis 4b gains only partial confirmation as a user’s
technical expertise had no significant impact.
Discussion
In this study we have formulated lead user theory as a set of four interrelated hypotheses
and have tested these hypotheses for the first time. Overall, we confirmed that a high intensity of
lead user characteristics displayed by a user has a positive impact on the likelihood that the
respective user yields a commercially attractive innovation. More specifically, we found that the
two components of the lead user construct – being ahead of the trend and obtaining benefit from
the innovation – work as theoretically postulated: high benefits expected are associated with
innovation likelihood and a position ahead of the trend is associated with innovation
attractiveness. Thus, it appears appropriate to treat the two components as (conceptually)

20
independent dimensions rather than reflective items. This finding suggests that neither of the two
dimensions can be omitted without loss in a lead user search.
Unexpectedly, we also found that a single component of the lead user definition – being at
the leading edge of a marketplace trend – predicts both user innovation likelihood and innovation
attractiveness. Extant lead user theory had proposed that the “ahead of the trend” variable would
predict innovation attractiveness only. We speculate that the “ahead of trend” component of the
lead user construct also predicts the likelihood of user innovation because it addresses the “supply
side” of the innovations desired by lead users. Lead users experience needs for products ahead of
others in the marketplace, and the “leading edge” of markets are by definition small and in
addition may be uncertain. As a consequence, manufacturers are unlikely to have a product on
offer when lead users encounter a need for it – and those that do want the product early are likely
to have to innovate rather than buy. The further ahead of a trend a user is, the lower the
likelihood of an existing solution and so the greater the likelihood this “supply side” motivator
will contribute to inducing innovation.
In addition we found that innovation-related local resources contribute to explaining both,
user innovation likelihood and innovation attractiveness. Due to reasoning discussed earlier
(section 2) we propose that innovators’ resources at hand will be found to be important predictors
of innovation attractiveness when either or both of two conditions hold: (1) information about the
potential returns of an innovation held by a potential user-innovator is “better” than the
information on that opportunity obtained by outside investors and; (2) investment in an
innovation is not expected to create an innovation-related profit stream that could be used to
repay an outside investor. In contrast, local resource measures will not predict innovation
attractiveness under conditions of perfect distribution of information and profit-making
innovations.

21
The relatively large effect sizes we have found bode well for practical applications of lead
user theory. In addition, our findings suggest that the variables that will be most effective for
identification commercially-attractive user innovations will differ depending upon study
conditions and goals. When the goal is to identify as many user-developed innovations as
possible independent of commercial promise, then this can be achieved by adding resource-
related variables with regard to user’s technical expertise and availability of support from a user-
community to the two lead user components. If in contrast, one aims at finding the most
attractive user innovations only from a given field of innovative users (i.e., a certain community),
a good strategy will be to search for users leading an important market trend. Third, if one aims
at efficiently identifying attractive user ideas from an unknown population, he might employ all
four search criteria at once – the two lead user components as well as both resource-related
variables technical expertise and community-based resources.
We conclude with two suggestions for further research. First, the lead user theory so far
contains merely situation-specific variables. It would be interesting to analyze in how far a high
intensity of lead user characteristics correlate with individual factors like personality traits (e.g.
Burroughs and Mick 2004, Higgins 1990). If we find that lead users are distinct from others with
regard to personality, we might gain an alternative way for identification.
Finally, we note that in this study we focused on how one might selectively identify the
most promising innovations among lead users within a target market. However, Lilien et al.
(2002) have found that innovations by users offering “breakthrough” potential for a target market
will often be found among lead users entirely outside of a target market population facing needs
that are more intense than and/or ahead of all members of the target market. Those seeking
“breakthrough” innovations developed by lead users will therefore find it very important to
22
explore how to incorporate promising groups of “outside” lead users into empirical research on
innovations developed by lead users.
Acknowledgements: The authors thank two anonymous reviewers for their important and very
helpful suggestions for improvement. Students of the E&I Research class (fall 2004) are
acknowledged for their assistance in realizing the empirical test. We also thank Martin
Ponweiser, Christoph Hienerth (Vienna University of Economics and BA), Peter Lu and
particularly the many kite surfing experts and community webmasters who gave us their valuable
assistance. The authors gratefully acknowledge research funding from the Wiener Wissenschafts-,
Forschungs- und Technologiefonds (WWTF).
23
References
Adamson, R.E. (1952). Functional Fixedness as Related to Problem Solving: A Repetition of
Three Experiments. Journal of Experimental Psychology 44, 288-291.
Adamson, R.E., and D.W. Taylor (1954). Functional Fixedness As Related to Elapsed Time and
to Set. Journal of Experimental Psychology 47, 122-126.
Adventure Travel Guides (2004). http://countries.reference-guides.com/adventure/kite surfing/,
accessed January 2005.
Allen, T.J., and D.G. Marquis (1964). Positive and Negative Biasing Sets: The Effects of Prior
Experience on Research Performance. IEEE Transactions on Engineering Management EM-11
(4), 158-161.
Amabile, T.M. (1996). Creativity in Context: Update to the Social Psychology of Creativity.
Boulder, CO: Westview Press.
Anderson, J.C. and D.W. Gerbing (1988). Structural equation modeling in practice: a review and
recommended two-step approach. Psychological Bulletin, 103 (May), 411-423.
Anderson, J.C. and D.W. Gerbing (1992), Assumptions of the Two-Step Approach to Latent
Variable Modeling. Sociological Methods and Research, 20 (February), 321-333.
Babin, B.J. and J.S. Boles (1998). Employee Behavior in a Service Environment: A Model and
Test of Potential Differences Between Men and Women. Journal of Marketing, 62 (April), 77-91.
Bagozzi, R.P. (1994). Structural Equation Models in Marketing Research: Basic Principles. In:
Principles of Marketing Research, R.P. Bagozzi (ed.). Oxford: Blackwell, 317-185.
Bearden, W.O. and R.G. Netemeyer (1989). Measurement of Consumer Susceptibility to
Interpersonal Influence. Journal of Consumer Research, 15 (March), 473-481.

24
Birch, H.G., and H.J. Rabinowitz (1951). The Negative Effect of Previous Experience on
Productive Thinking. Journal of Experimental Psychology 41, 121-26.
Blackman, M.C. and Funder, D.C (1998). The Effect of Information on Consensus and Accuracy
in Personality Judgement. Journal of Experimental Social Psychology 34(2), 138-181.
Burroughs, J.E. and Mick, D.G. (2004). Exploring Antecedents and Consequences of Consumer
Creativity in a Problem-Solving Context. Journal of Consumer Research, 31/2, 402-411.
Churchill, G.A. (1979). A Paradigm for Developing Better Measures of Marketing Constructs.
Journal of Marketing Research, 16 (February), 64-73.
Diamantopoulos, A. and H.M. Winklhofer (2001). Index Construction with Formative Indicators:
An Alternative to Scale Development. Journal of Marketing Research 38, 269-277.
Duncker,K. (1945). On Problem Solving. Translated byLynne S. Lees. Psychological
Monographs 58 (5).
Fornell, C. and D.F. Larcker (1981). Evaluating Structural Equation Models with Unobservable
Variables and Measurement Error. Journal of Marketing Research 18 (February), 39-50.
Franke, N. and Shah, S. (2003). How Communities Support Innovative Activities: An
Exploration of Assistance and Sharing Among End-Users. Research Policy 32, 157-178.
Franke, N. and E. von Hippel (2003). Satisfying Heterogeneous User Needs via Innovation
Toolkits: The Case of Apache Security Software. Research Policy 32, 1199-1215.
Griffin, A. (1997). Drivers of NPD Success: The 1997 PDMA Report, Product Development and
Management Association, Chicago, October.
Hadjimanolis, A. (2000). A Resource-Based View of Innovativeness in Small Firms. Technology
Analysis and Strategic Management 12, 263-281.
Hayek, F. A. (1945). The Use of Knowledge in Society. The American Economic Review 35/4
(September), 519-530.

25
Herstatt, C. and E. von Hippel (1992). From experience: Developing new product concepts via
the lead user method: A case study in a "low tech" field. Journal of Product Innovation
Management 9, 213-221.
Higgins, E.T. (1990). Personality, Social Psychology, and Person-Situation Relations: Standards
and Knowledge Activation as a Common Language. In: Handbook of Personality: Theory and
Research, Lawrence A. Pervin (ed.). London: Guilford, 301-338.
Jöreskog, K. and D. Sörbom (1982). Recent Developments in Structural Equation Modeling.
Journal of Marketing 19 (November), 404-416.
Jelling, J. (2004). http://www.eureka-java-gold.com/Ezines/article.cfm?articleid=3032, accessed
January 2005.
Kitehigh (2005). Interview with Bruno Legaignoux at kitehigh.com;
http://www.kitehigh.com/index.cfm?section=talkStory&talkstory=brunomessage, accessed
January 2005.
Kite Surf Origins (2004). http://sportsvl.com/water/kite surfing.htm, accessed January 2005.
Kristensson, P., Gustafsson, A., and T. Archer (2004). Harnessing the Creative Potential among
Users. Journal of Product Innovation Management 21, 4-14.
Likert, R., Roslow, S., and M. Gardner (1993). A simple and reliable method of scoring the
Thurstone Attitude Scales. Personnel Psychology, 46/3, 689-690.
Lilien, G., Morrison, Pamela D., Searls, K., Sonnack, M., and E. von Hippel (2002). Performance
Assessment of the Lead User Generation Process for New Product Development. Management
Science 48 (August), 1042-1059.
Lüthje, C. (2003). Customers as Co-Inventors: An Empirical Analysis of the Antecedents of
Customer-Driven Innovations in the Field of Medical Equipment. Proceedings from the 32th
EMAC Conference 2003 (Glasgow, Scotland).
26
Lüthje, C. (2004). Characteristics of Innovating Users in a Consumer Goods Field. An Empirical
Study of Sport-related Product Consumers. Technovation 24, 683-695.
Lüthje, C., Herstatt, C. and E. von Hippel (2002). The Dominant Role of “Local” Information in
User Innovation: The Case of Mountain Biking. MIT Sloan School of Management Working
Paper (July).
Mansfield, E. (1968). Industrial Research and Technological Innovation: An Econometric
Analysis. New York: W.W. Norton.
Morrison, P.D., Roberts, J.H. and E. von Hippel (2000). Determinants of User Innovation and
Innovation Sharing in a Local Market. Management Science 46, 1513-1527.
Morrison, P.D., Roberts, J.H., and D.F. Midgley (2004). The Nature of Lead Users and
Measurement of Leading Edge Status. Research Policy 33, 351-362.
National Innovation Initiative Final Report (2004). (Ed: rest of citation to come)
Ogawa, S. (1998). Does sticky information affect the locus of innovation? Evidence from
Japanese convenience-store industry. Research Policy 26, 777-790.
Olson, E.L. and G. Bakke (2001). Implementing the Lead User Method in a High Technology
Firm: A Longitudinal Study of Intentions versus Actions. Journal of Product Innovation
Management 18 (November), 388-395.
Plastic (2004). http://www.plastic.com/comments.html;sid=04/04/22/03341574;cid=2, accessed
January 2005.
Nye Mal Regerings Grundlag (2005), VK Regeringen II, (February), Government Printing
Office, Copenhagen, Denmark
Rogers, E. M. (1994). Diffusion of Innovation. Fourth Edition. New York: The Free Press.
27
Schmookler, J. (1966). Invention and Economic Growth. Cambridge, MA: Harvard University
Press.
Shah, S. (2000). Sources and Patterns of Innovation in a Consumer Products Field: Innovations
in Sporting Equipment. MIT Sloan Working Paper #4105.
Spector, P.E. (1992). Summated Ratings Scales Construction. Newbury Park: Sage.
Thurstone, L.L. and E.J. Chave (1929). The Measurement of Attitude. Chicago: University of
Chicago Press.
Tietz, R., Morrison, P.D., Lüthje, C., and C. Herstatt (2004). The process of user-innovation: A
case study on user innovation in a consumer goods setting. Working Paper Nr. 29 Technical
University Hamburg-Harburg.
Urban, G. and von E. Hippel (1988). Lead User Analyses for the Development of New Industrial
Products. Management Science 35, 569-582.
Von Hippel, E. (1986). Lead users: A Source of Novel Product Concepts. Management Science
32, 791-806.
Von Hippel, E. (1994). Sticky information" and the Locus of Problem Solving: Implications for
Innovation. Management Science 40, 429-440.
Von Hippel, E. (2005) Democratizing Innovation, MIT Press, Cambridge MA, (April)
Winter, S. G. and G. Szulanski (2001). Replication as Strategy. Organization Science 12 (6), 730-
743.
Wrenn, B. (1997). The market orientation construct: Measurement and scaling issues. Journal of
Marketing Theory and Practice 5/3, 31-55.

28
TABLE 1
Population and response rates of our main study
#
Sample
Country
Size
Response
Innovations
Sample response from total response (sample innovations
from total innovations)
N n (%) n (%) %
1 PKRAa Professional Kiteboard Riders Ass.
International 128 11 (8.6%) 7 (5.5%) 2.4% (5.0%)
2 DWSVa “Deutscher Windsegelverein”
Germany 519 57 (11.0%) 15 (2.9%) 12.5% (10.7%)
3 Greek Wakeboard Ass.a Greece 96 9 (9.4%) 3 (3.1%) 2.0% (2.1%) 4 Irish Kite Ass.b Ireland 495 13 (2.6%) 1 (0.2%) 2.9% (0.7%) 5 Kiteforum.comd Germany 3000 60 (2.0%) 27 (0.9%) 13.2% (19.3%) 6 Kitegenossena Switzerland 105 5 (4.8%) 2 (1.9%) 1.1% (1.4%) 7 Kitesailinga Switzerland 250 66 (26.4%) 15 (6.0%) 14.5% (10.7%) 8 Kite surfing.grb Greece c 32 2 (6.3%) 0 (0.0%) 0.4% (0.0%) 9 Kitesurfvereinigung.nlc Netherlands 200 27 (13.5%) 12 (6.0%) 5.9% (8.7%)
10 Kitetour.dkc Denmark 240 12 (5.0%) 3 (1.3%) 2.6% (2.1%) 11 Kudernatsch Kite Surfinga Austria 40 16 (40.0%) 7 (17.5%) 3.5% (5.0%) 12 Kite Community “Mondsee”a Austria 214 41 (19.2%) 8 (3.7%) 9.0% (5.7%) 13 Oase.comd Germany 2000 81 (4.1%) 17 (0.9%) 17.8% (12.1%) 14 VDWSa
“Verein Deutscher Wassersportschulen”
Germany 208 23 (11.1%) 11 (5.3%) 5.0% (7.9%)
15 Xtremebigair.comb International 570 e 33 (5.8%) 12 (2.1%) 7.2% (8.6%)
Total
Online
8097
1560
6537
456 (5.6%)
228 (14.6%)
228 (3.5%)
140 (1.7%)
68
72
100% (100%)
50.0% (48.6%) 50.0% (51.4%)
a survey sent via e-mail (sample population based on delivered mails) b survey posted on website (sample population based on views of questionnaire posting – not unique, i.e., including multiple views per person) c survey posted on website (sample population based on unique website views – i.e., total number of distinct visitors) d survey posted on website (sample population based on estimation of webmaster regarding “number of active users”)

29
TABLE 2
Tests of latent construct measurement (main study)
Construct Items Squared multiple
correlation
Factor loading (t-value)
Item to total correlation
Cronbach’s alpha
Explained variance of
first extracted factor
Ahead of a trend (AT)
Hang-Time
0.82 0.90 (-) 0.85 0.91 88.21%
Height 0.81 0.90 (27.44) 0.86 Tricks 0.84 0.92 (27.90) 0.87 High benefit expected (HBE)
HBE 1 0.40 0.63 (-) 0.58 0.84 55.89%
HBE 3 0.45 0.67 (10.75) 0.60
HBE 4 0.41 0.64 (10.60) 0.58
HBE 5 0.53 0.73 (11.57) 0.65
HBE 7 0.58 0.76 (11.86) 0.67
HBE 8 0.56 0.68 (10.93) 0.62
Technical expertise (TE)
TE 1 0.49 0.70 (-) 0.61 0.82 64.73%
TE 3 0.67 0.82 (13.51) 0.54
TE 4 0.36 0.60 (10.64) 0.58
TE 5 0.58 0.76 (13.35) 0.72
Community-based resources (CR)
CR 1 0.43 0.66 (-) 0.60 0.88 62.90%
CR 2 0.69 0.83 (14.06) 0.78
CR 3 0.46 0.68 (11.70) 0.62
CR 4 0.59 0.77 (12.96) 0.72
CR 5 0.58 0.76 (12.77) 0.70
CR 6 0.59 0.77 (12.93) 0.72
Global fit measures of confirmatory factor analysis (n=399; missing values deleted): c²/df=2.15 (c²=314.30; df=146); GFI=0.92; AGFI=0.90; CFI=0.96; IFI=0.95; TLI=0.95; RMSEA=0.05
30
TABLE 3
c² difference test and Fornell-Larcker criteria (main study)
Ahead of a Trend
High benefit expected
Technical expertise
Com.-based resources
Average variance explained
0.82 0.49 0.53 0.56
Squared correlations (c²-differences)
Ahead of a Trend
0.82
High benefit expected
0.49 0.02 (104.00)
Technical expertise
0.53 0.48 (351.49) 0.11 (118.90)
Com.-based resources
0.56 0.14 (213.19) 0.00 (223.26) 0.15 (132.68)

31
TABLE 4
Example of user innovations
Examples of User Innovations
Problem Solution a
Standard release systems offered by certain brands using a loop of rope and pin on the chicken loop are near on impossible to release under loads such as kiteloops from broken lines etc, Needed to do something about it to help my safety on the water after a few close calls ending in being knocked out
An all metal release solution, with steel loop and support and hardened steel pin which eliminated the problems a rope loop causes and makes the release a lot more reliable and as a by product easier to reset on the water, Many galvanisation and coating processes had to be used and the hardened steel had to be used to stop it bending and making release more difficult
Suicide leashes are horrible but they are the only option for advanced riders, any other type of leash other than a 5th line system there is no way to ride again afterthey are deployed, They are so bad some riders try them but dont use leashes at all instead, if you mess up badly the only way to stop getting dragged is to release your kite and watch it fly away, plus spinning leashes are very expensive or very complicated or both(5th line)
I created a tiny cylindrical system that fits on the chicken loop between the bar and the harness loop, it works because on the outside of the system there are two spinning attachments, one atachment is where you would attach a line from your harness, the other attachment goes to the sliding ring on a rear line(the ring is the traditional saftey system supplied with all bars), when the rider spins the bar the attachment that conects to the ring swivels and doesn't tangle, if a rider misses a pass he can get to the bar and continue riding without having to swim in, if the rider misses a pass and gets out of control or starts heading for something hard he pulls the quickrelease on his chicken loop and he is left attached to the kite but on the saftey line so there is no power, at that piont he's gona have to swim in, Also unlike other systems it works for beginers and pros, In addition it is super cheap and simple, i made the proto type out of $5 worth of copper pipes and a hacksaw in 10minutes
Couldn't find a production or custom kite board to meet the perfomance requirements to meet the needs of a 100kg rider in lightwind, gusty and wave surfing conditions of my location
Designed a lightwind kiteboard that compresses air at the concave tip scoop and automatically lifts the nose of the board over chop and wave soup ( foam that is formed after the wave breaks), The combination of bottom contour, rail geometry, and overall dementions allow me to achieve early planing, but still hold more than enough power to control the kites speed and position when conditions increase in strength, The design is efficient enough that I don't need to use fins, Fins can be added to help riders of a lower skill level however.
a 31.7% imagined a possible solution, 14.6% developed a plan with descriptions and/or drawings, 27.6% built a prototype which is so reliable that it can be used, 13.0% of the innovations are already used by others, 13.0% indicated that their idea was already being marketed. Ideas per user ranged from one to 25 (only 15% indicated that they had had “only” one idea so far).
32
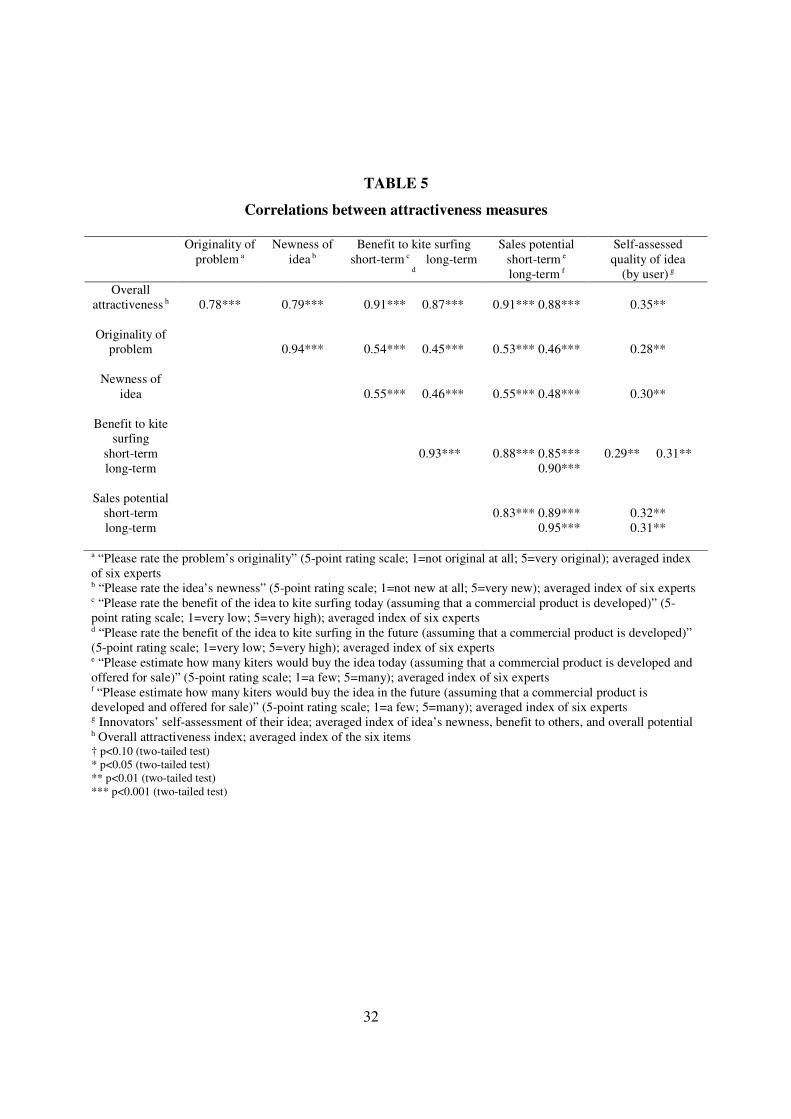
TABLE 5
Correlations between attractiveness measures
Originality of
problem a Newness of
idea b Benefit to kite surfing
short-term c long-term
d
Sales potential short-term e long-term f
Self-assessed quality of idea
(by user) g
Overall attractiveness h
0.78***
0.79***
0.91*** 0.87***
0.91*** 0.88***
0.35**
Originality of problem
0.94***
0.54*** 0.45***
0.53*** 0.46***
0.28**
Newness of idea
0.55*** 0.46***
0.55*** 0.48***
0.30**
Benefit to kite surfing
short-term long-term
0.93***
0.88*** 0.85*** 0.90***
0.29** 0.31**
Sales potential short-term long-term
0.83*** 0.89*** 0.95***
0.32** 0.31**
a “Please rate the problem’s originality” (5-point rating scale; 1=not original at all; 5=very original); averaged index of six experts b “Please rate the idea’s newness” (5-point rating scale; 1=not new at all; 5=very new); averaged index of six experts c “Please rate the benefit of the idea to kite surfing today (assuming that a commercial product is developed)” (5-point rating scale; 1=very low; 5=very high); averaged index of six experts d “Please rate the benefit of the idea to kite surfing in the future (assuming that a commercial product is developed)” (5-point rating scale; 1=very low; 5=very high); averaged index of six experts e “Please estimate how many kiters would buy the idea today (assuming that a commercial product is developed and offered for sale)” (5-point rating scale; 1=a few; 5=many); averaged index of six experts f “Please estimate how many kiters would buy the idea in the future (assuming that a commercial product is developed and offered for sale)” (5-point rating scale; 1=a few; 5=many); averaged index of six experts g Innovators’ self-assessment of their idea; averaged index of idea’s newness, benefit to others, and overall potential
h Overall attractiveness index; averaged index of the six items † p<0.10 (two-tailed test) * p<0.05 (two-tailed test) ** p<0.01 (two-tailed test) *** p<0.001 (two-tailed test)
33
TABLE 6
Results
Model (1) (2) (3) (4)
• DV = highly attractive innovation y/n a
• DV = innovation y/n b
• DV = highly attractive innovation y/n c
• DV = attractiveness of innovation d
• logit analysis • logit analysis • logit analysis • OLS regression • total sample • total sample • innovators only • innovators only
Independent variable • Test of H1, H4 • Test of H2, H4a • Test of H3, H4b • Test of H3, H4b
Lead user components: High benefit expected 0.557 (0.279)* 0.387 (0.147)** -0.007 (0.330) 0.089 (0.082) Ahead of trend 1.190 (0.298)*** 0.602 (0.164)*** 1.370 (0.415)*** 0.304 (0.084)***
Resources at hand:
Technical expertise 1.103 (0.429)** 1.137 (0.209)*** 0.910 (0.541)† 0.084 (0.127) Community-based resources
0.835 (0.314)**
0.331 (0.173)*
1.363 (0.502)**
0.217 (0.108)**
Mc Fadden R² 0.269 0.216 0.219 R² 0.213 R² adjusted 0.170 -2 Log likelihood 134.021 378.990 75.789 c² 49.255 104.386 21.231 Df 4 4 4 4 F-value 5.003 p-value <0.0001 <0.0001 <0.0001 <0.001 Model classification rate (hit ratio)
94.2% 78.3% 69.6%
N e 414 (total sample) 414 (total sample) 79 (innovators only) 79 (innovators only) a highly attractive idea – ranked so by four out of six experts (1); less attractive idea and no idea (0) b user innovated (1) or not (0) c highly attractive idea – ranked so by four out of six experts (1); less attractive idea (0) d overall attractiveness index (continuous) e deviations from total sample size (e.g., model 1 n=456) due to missing values which were pairwise deleted † p<0.10 (one-tailed test) * p<0.05 (one-tailed test) ** p<0.01 (one-tailed test) *** p<0.001 (one-tailed test)
34
FIGURE 1
Overview of results
V VVVVV V
VV VV V VVVVV V VV VV VVV V VVVV VVVV VVV VV VV VV V VVV V VV VVV VV VV VVVV V VVV V
V VV VVVV V VV VVV V VV VV V VV
V
VV V VVVVV VV V V VV VV VV VVVV VV V VV VVV VV VVVVVV V VVV VV VVV VV VV VV VVV VVV VV VVV VVV VVV V VVVV VVV V
VV VVV V VV V VVV VVVV VVV V VV V VVVV VV
VVVV VV VVV V VV V VV VV VV V VVV V VV VVV VV V V
VVV
V
V V VV
WWW
W WW
WWW
WW
W
W W WW
W
W
W
WW
W WW
W W
W
WW
W WW
WW
W
WWWW
W
WW
WW
W
W
W
W
W
W
W
W W WWW WWW
W WW
W WWW
W
WW
WWWW
W W
W
W
expected
benefit
(LU component 1)
highlow
low
trend position
(LU component 2)
high
Legend:
Innovating users (with size indicating attractiveness of innovation)
Non-innovating users
∅
�
effect 1:
more
innovators
∅
effect 2:
more
attractive
innovations
Effects of lead user components: Users with a higher expectation of innovation-related benefit
are more likely to innovate; as users move increasingly “ahead of the trend,” there is an increase
in both innovation attractiveness and innovation likelihood. In accordance with lead user theory,
when both LU components are high, the largest fraction of users innovate, and average
innovation attractiveness is high (see area highlighted in segmented circle).
35
APPENDIX 1
Freestyle scale (“ahead of a trend 1”)
“How well can you jump when kite surfing? Please rate your ability according to the scale below.
Move the cursor to the level which reflects your ability”
36
APPENDIX 2
Measurement results of latent constructs (pilot study 2)
Construct Items a Item to total correlation
Cronbach’s alpha
Explained variance of first extracted factor
High benefit expected (HBE)
- HBE 1: While kite surfing, I am often confronted with problems which can not be solved by kite surfing equipment available on the market.
0.71 0.88
54.55%
(n=30) - HBE 2: The equipment available in kite surfing stores is sufficient for my needs.b
0.51
- HBE 3: I am dissatisfied with some pieces of commercially available equipment.
0.78
- HBE 4: I have already had problems with my equipment which could not be solved with the manufacturer's conventional offerings.
0.81
- HBE 5: In my opinion, there are still unresolved problems with kite surfing equipment.
0.68
- HBE 6: I am constantly searching for improved kite surfing equipment.b
0.45
- HBE 7: I have needs related to kite surfing which are not covered by the products currently offered on the market.
0.64
- HBE 8: I often get irritated about the lack of sophistication in certain pieces of kite surfing equipment.
0.55
Technical expertise (TE)
- TE 1: I can repair my own equipment. 0.61 0.88 55.55%
(n=30)
- TE 2: I always try to keep up to date with regard to the materials, innovations and possibilities with regard to my equipment.b
0.53
- TE 3: I can help other kite surfers solve problems with their equipment.
0.74
- TE 4: I am handy and enjoy tinkering. 0.73
- TE 5: I can make technical changes to my kite surfing equipment on my own.
0.82
- TE 6: I am a huge fan of the technical aspects of this area.b
0.76
- TE 7: I come from a technical background in my profession and/or education (e.g. engineering).b
0.50
Community-based resources (CR)
- CR 1: If I wanted to make changes to my equipment, I would know enough people who could help me do so.
0.71 0.90 68.35%
(n=28) - CR 2: When advice. I encounter technical problems, I know exactly who to ask for.
0.63
- CR 3: When I encounter technical problems, I know exactly who to ask for advice.
0.83
- CR 4: I know many kite surfers who have a thorough knowledge of kite surfing equipment.
0.85
- CR 5: In my surroundings, I can find people who possess all of abilities I would require to make improvements to kite surfing equipment.
0.64
- CR 6: If I were to make changes to my kite surfing equipment, I could count on getting positive feedback about the changes from my fellow kite surfers.
0.76
a All items are measured on 5-point scales (1=strongly disagree; 5=strongly agree) b Eliminated after validity tests in main study

37
ENDNOTE
1 There are several reasons that our calculated response rate is likely to be below actual. Two
major reasons follow. First, we have learned from previous on-line surveys that many delivered
e-mail are not read by recipients due to causes ranging from spam filters to e-mail accounts that,
while functional, are no longer actually accessed by their owners. Second, due to our decision to
contact several kite surfing websites, we often sent multiple surveys to single individuals -
because many individuals have membership in more than one site. For example, site webmasters
reported to us that 75% of members of the community DWSV also belong to Kiteforum or Oase,
and that at least 30% were also members of additional sites that we sampled. A conservative
estimation of membership overlap in our 15 samples is roughly 50%. If we assume, as is likely,
that individuals contacted multiple times would only answer our survey once, our response rates
would double based on this factor alone.