nigeria watchnigeriawatch.org/media/html/nga-watch-report14.pdf · nigeria watch: fourth report on...
TRANSCRIPT

Nigeria Watch
Fourth Report
on Violence in Nigeria
(2006–2014)

Nigeria Watch: Fourth Report on Violence (2006–2014)
June 2014 - 2 -
I am pleased to introduce our new team at the French Institute for Research in Africa
(IFRA-Nigeria) on the campus of the University of Ibadan, where the Nigeria Watch Project was relocated in July 2013, with Coordinator Timothy Adeola Adams, Assistant Coordinator Afeno Super Odomovo, and Information retrieval specialists Abiola Victoria Ayodokun and Vitus Nwankwo Ukoji. I also wish to thank Ghislain Benrais and Manuel Reinert for their assistance with the supervision, the training and the statistics used in this report, as well as the whole team of IFRA and the Nigeria Stability and Reconciliation Programme (NSRP) for their continuous support.
This fourth report on lethal violence in Nigeria is based on data collated between 1
June 2006 and 31 May 2014, a period during which we reported 14,006 lethal incidents, resulting in 60,858 deaths. Most incidents produce a small number of casualties and last only one day.
As Nigeria Watch is not a human rights organization but a research group, the report
does not issue recommendations and highlights only the main findings.
Prof. Marc-Antoine Pérouse de Montclos Institut français de géopolitique, Université Paris 8
Associate Fellow, Africa Programme, Chatham House PRIO Global Fellow (Peace Research Institute in Oslo)
The Nigeria Watch research work is supported by the Nigeria Stability and Reconciliation Programme (NSRP). Please visit, www.nsrp-nigeria.org for more information about NSRP

Nigeria Watch: Fourth Report on Violence (2006–2014)
June 2014 - 3 -
Contents
I The General context .............................................................................................................. 4
I.1. A reminder on methodological challenges ...................................................................... 4 I.2. An update and summary of previous findings ................................................................. 5
II The main causes of violence ................................................................................................ 7
II.1 Accidents ......................................................................................................................... 7 II.2 Crime ............................................................................................................................... 8 II.3 Political violence ............................................................................................................. 9 II.4 Religious and ethnic fighting ......................................................................................... 10 II.5 Oil and land clashes ....................................................................................................... 11
Executive Summary
⇒ The main causes of death due to violence in 2006–2014 are, in order of prevalence, accidents, crime, political conflicts, ethno-religious fighting, and economic issues. ⇒ We observe an increase in violence since 2012 because of the Boko Haram crisis. ⇒ Political fighting is the only cyclical violence we could identify, and this was during the elections of April 2007 and April 2011. ⇒ Oil distribution is much more dangerous than oil production. ⇒ The Nigerian security forces are responsible for many killings on a daily basis. ⇒ Few foreigners are killed in Nigeria.

Nigeria Watch: Fourth Report on Violence (2006–2014)
June 2014 - 4 -
Nigeria Watch
Fourth Report on Violence
(2006–2014)
I The general context
Violence impacts on human security and development from an economic and social point of view. But the body count of victims is also a political affair because it pertains to strategic issues regarding communication, the identification of perpetrators, and legal evidence. The statistics of mortality due to violence can be used for many purposes in this regard: to assess risk and monitor the situation or evaluate a performance for security analysts, decision-makers and investors; to appraise needs or adapt coping mechanisms for relief and medical organizations; to alert the international community or, in some cases, argue for a military intervention to save lives for human rights defenders, etc.
I.1. A reminder on methodological challenges To measure the intensity of violence is quite complex. Its quantification comes up
against three main difficulties: first, researchers have to rely on sources that are often contested; second, they have to agree on indicators that cannot be comprehensive; and third, they have to define categories that do not always properly reflect the complexity of a society. The number of homicides, for instance, does not capture all the aspects of violence; they help only to identify trends because they are easier to compare than, say, burglaries.
These methodological challenges and the quality of our sources have been analysed in
previous reports that are available online.1 Access to reliable crime statistics are still a problem in Nigeria. Between 1990 and 2003, the police failed to produce any annual reports.2 Even today, it does not keep adequate records and sometimes manipulates data to produce artificially low numbers. Ad hoc press conferences on crime provide no information on national trends. They seldom give relevant figures and reveal many discrepancies. Successive Inspectors-General of Police, for instance, have made contradictory statements on the number of alleged armed robbers killed by their men: inflating them to boast of their “success” when speaking to the local press, or deflating them when reporting to the UN Special Rapporteur on Extrajudicial, Summary or Arbitrary Executions.3
By contrast, Nigeria Watch relies on several open sources, including official data
whenever it is available. These figures are then crosschecked. They are definitely not exhaustive. But they constitute a reliable sample because we expect the margin of error to be the same from one year to another and one region to another. In other words, our data is
1 See for instance: http://www.nigeriawatch.org/media/html/NGA-Pol-Viol.pdf 2 Alemika, Etannibi [2004], “Crime Statistics and Information Management in Nigerian Justice and Security Systems”, in Alemika, Etannibi & Chukwuma, Innocent (ed.), Crime and Policing in Nigeria : Challenges and Options, Lagos, Centre for Law Enforcement Education, p. 103. 3 Odinkalu, Chidi Anselm [2010], Criminal Force? Torture, Abuse, and Extrajudicial Killings by the Nigeria Police Force, New York, Open Society Justice Initiative, p. 62.

Nigeria Watch: Fourth Report on Violence (2006–2014)
June 2014 - 5 -
robust enough to generate trends and produce a GIS (Geographic Information System) to answer four fundamental questions:
- Is violence increasing or decreasing? - What are the main causes of violence (criminal, accidental, ethnic, religious, etc.)? - What is the probability of being killed? - Where does violence occur?
I.2. An update and summary of previous findings Life expectancy is generally low in Nigeria. Despite an impressive demographic
growth, the most populated country in Africa suffers from a deficient public health system, in addition to violence. In Nigeria, life expectancy is 52 years, below the average on the continent. It is worse than in Sudan, Liberia, Afghanistan, Democratic Republic of Congo, and Mali, and almost equal to the levels recorded in war-torn Somalia or the Central African Republic. In this regard, the mortality due to intentional violence or accidents is only part of the problem of human security.
During the study period covered by Nigeria Watch, no cycles of violence could be
identified, except for political clashes and assassinations before, during, and after the period of elections in April 2007 and April 2011. There is absolutely no evidence to substantiate the urban legend of rising crime before Christmas. In addition, contrary to common wisdom, few foreigners are killed in Nigeria (‘foreigners’ includes all non-Nigerians, aside from nationals of immediately neighbouring countries). In 8 years, most of these victims died in accidents; and from a total of 98, 21 were Chinese, 11 American, 10 Lebanese, 9 Indian, 7 British, 3 North Koreans, 3 Filipino, 2 Italian, 2 French, and 2 Dutch.
Figure 1: Rising number of violent deaths per year (2006–2014)
Note: Data collated for the period between 1 June 2006 and 31 May 2014.

Nigeria Watch: Fourth Report on Violence (2006–2014)
June 2014 - 6 -
Because of the Boko Haram crisis, cumulative figures for the years 2006–2014 show that Borno is, by far, the most dangerous place regarding the number of violent deaths per inhabitant, followed by Plateau State. Damaturu, in neighbouring Yobe State, is also the most dangerous Local Government Area, followed by Maiduguri. Before 2009, however, the North-East was very peaceful and violence of all types was concentrated in the South. In this regard, it is important to remember that the location of risk can change in the course of time. In 2000, Lagos was severely disrupted by violence connected with the Oodua Peoples Congress (OPC). It was then the turn of Onitsha with the Movement for the Actualization of the Sovereign State of Biafra (MASSOB) in 2006 and Port Harcourt with the Movement for the Emancipation of the Niger Delta (MEND) in 2005–2009.
Figure 2: Security map of Nigeria
(according to the number of violent deaths per state, 2006–2014)
Note: Data collated for the period between 1 June 2006 and 31 May 2014.
During the study period, the most violent incidents collated by Nigeria Watch were
pipeline explosions in Lagos (610 deaths in December 2006, 100 in May 2008, and 58 in December 2007), the military assault on Boko Haram and civilians in Borno and Bauchi in July 2009 (597 deaths), a military attack on MEND in Delta State (593 deaths in May 2009), the MASSOB uprising in Onitsha (589 deaths in June–July 2006), inter-communal riots in Plateau (557 deaths in January 2010, 540 in November 2008, and 520 in March 2010), and protests in Kaduna over presidential election results (331 deaths in April 2011).
The Nigerian security forces are responsible for many killings on a daily basis, not to
mention torture and extra-judicial executions. They are trigger-happy and unable to maintain law and order professionally and peacefully. On the contrary, the more they intervene, the bloodier the fighting. In a majority of violent cases where they got involved, they were responsible for causing death. The police, for instance, killed in 1,561 of 2,707 lethal

Nigeria Watch: Fourth Report on Violence (2006–2014)
June 2014 - 7 -
incidents where it intervened in 2006–2014, an annual average of 58% lethal interventions that peaked at 80% in 2013–2014. The proportion is quite similar (57%) if we take into account all government security forces for the period 2006–2014, including the army, the secret services, customs, immigration, and civil defence. The pattern is too systematic to permit us think that this so-called “collateral damage” consisted of unfortunate mistakes. It has much more to do with a general culture of violence and impunity within the security forces.
II The main causes of violence
Cumulative figures for the years 2006–2014 show that the main causes of violent deaths are, in order of importance, accidents, crime, political clashes, ethno-religious fighting, and economic issues. In 2014, however, this pattern changed because of the Boko Haram crisis in the North-East. On a national level, political clashes, religious fighting, and crime became the main causes of violent deaths after emergency rule was put in place in May 2013.
Figure 3: The main causes of violence (2006-2014)
Note: Each incident might have several causes. Hence cumulative figures are higher than the total number of deaths recorded in the database between 1 June 2006 and 31 May 2014.
II.1 Accidents If not for the Boko Haram crisis, “accidents” are by far the main cause of violent death
in Nigeria. Cars are responsible for most fatalities, followed by fires and explosions, other

Nigeria Watch: Fourth Report on Violence (2006–2014)
June 2014 - 8 -
accidents (plane crash, boat mishap, animal attack, electrocution, drowning, suffocation, building collapse), and natural disasters.
On a national level, the highest number of road fatalities collated by Nigeria Watch was
in Lagos, the most populated city in the country. But there has been much improvement. Our data confirm that the policy of the governor of Lagos reduced fatal road accidents, as Babatunde Raji Fashola claimed in an interview to The News on 31 March 2014 (see Figure 4). Moreover, Abuja is more dangerous when compared with the number of inhabitants. The probability of having a fatal car accident is much higher in the Federal Capital Territory. This might be because people drive faster. Abuja has larger avenues and fewer traffic jams than Lagos. Moreover, the Capital Territory ranks second or third regarding the registration of new vehicles and the issue of drivers’ licences in the Federation.
Figure 4: The reduction of fatal road accidents in Lagos
Note: Data collated for the period between 1 January 2007 and 31 December 2013.
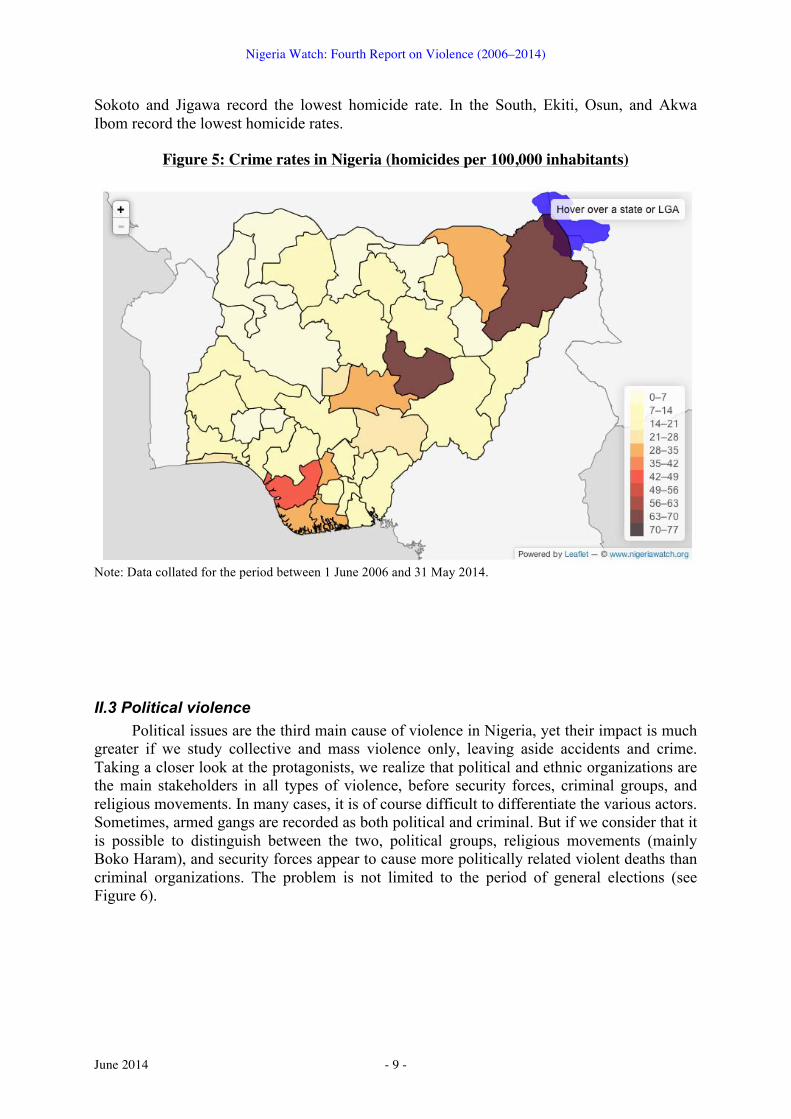
II.2 Crime The second main cause of violence is crime. Usually, crime is heavily concentrated in
the South, especially in populated areas such as Lagos and Port Harcourt (see previous reports of Nigeria Watch). Since 2001, Plateau State also recorded higher crime rates (see map below). But the Boko Haram crisis changed this pattern, and Borno has become the most insecure place in Nigeria. By contrast, many regions appear to be safe. On a national level,
Nigeria Watch: Fourth Report on Violence (2006–2014)
June 2014 - 9 -
Sokoto and Jigawa record the lowest homicide rate. In the South, Ekiti, Osun, and Akwa Ibom record the lowest homicide rates.
Figure 5: Crime rates in Nigeria (homicides per 100,000 inhabitants)
Note: Data collated for the period between 1 June 2006 and 31 May 2014.
II.3 Political violence Political issues are the third main cause of violence in Nigeria, yet their impact is much
greater if we study collective and mass violence only, leaving aside accidents and crime. Taking a closer look at the protagonists, we realize that political and ethnic organizations are the main stakeholders in all types of violence, before security forces, criminal groups, and religious movements. In many cases, it is of course difficult to differentiate the various actors. Sometimes, armed gangs are recorded as both political and criminal. But if we consider that it is possible to distinguish between the two, political groups, religious movements (mainly Boko Haram), and security forces appear to cause more politically related violent deaths than criminal organizations. The problem is not limited to the period of general elections (see Figure 6).

Nigeria Watch: Fourth Report on Violence (2006–2014)
June 2014 - 10 -
Figure 6: Political violence in Nigeria:
A timeline on a monthly basis (2006–2014)
Note: Data collated for the period between 1 June 2006 and 31 May 2014.
II.4 Religious and ethnic fighting Religious and ethnic fighting cause fewer fatalities than political issues. Since the peak
of 2010, for instance, the death toll of inter-communal conflicts has decreased in Plateau State. On the contrary, ethnic and, mainly, religious fighting has increased in Borno. Since the 2011 elections, the rising trend of fatalities in Nigeria has indeed been caused by the Boko Haram crisis, especially with the emergency rule in mid-2013, which amplified violence (see Figure 7). If not for this crisis, the rest of Nigeria would confirm a worldwide trend, that is, a general decline in violence.4
4 Pinker, Steven [2011], The Better Angels of Our Nature: The Decline of Violence in History and Its Causes, New York, Viking, 802 pp.
0"
200"
400"
600"
800"
1000"
1200"
1400"
1600"
Number'of'deaths'
General"Elec0ons"
Emergency"rule"in"Borno,"Yobe"&"Adamawa"
General"Elec0ons"
Communal"Riots"in"Plateau"
Local"Elec0ons"in"Plateau"
Army"vs"MEND"in"Delta"
MASSOB"Uprising"

Nigeria Watch: Fourth Report on Violence (2006–2014)
June 2014 - 11 -
Figure 7: The Boko Haram crisis
Number of deaths caused by security forces and insurgents
Note: Data collated for the period between 1 June 2006 and 31 May 2014.
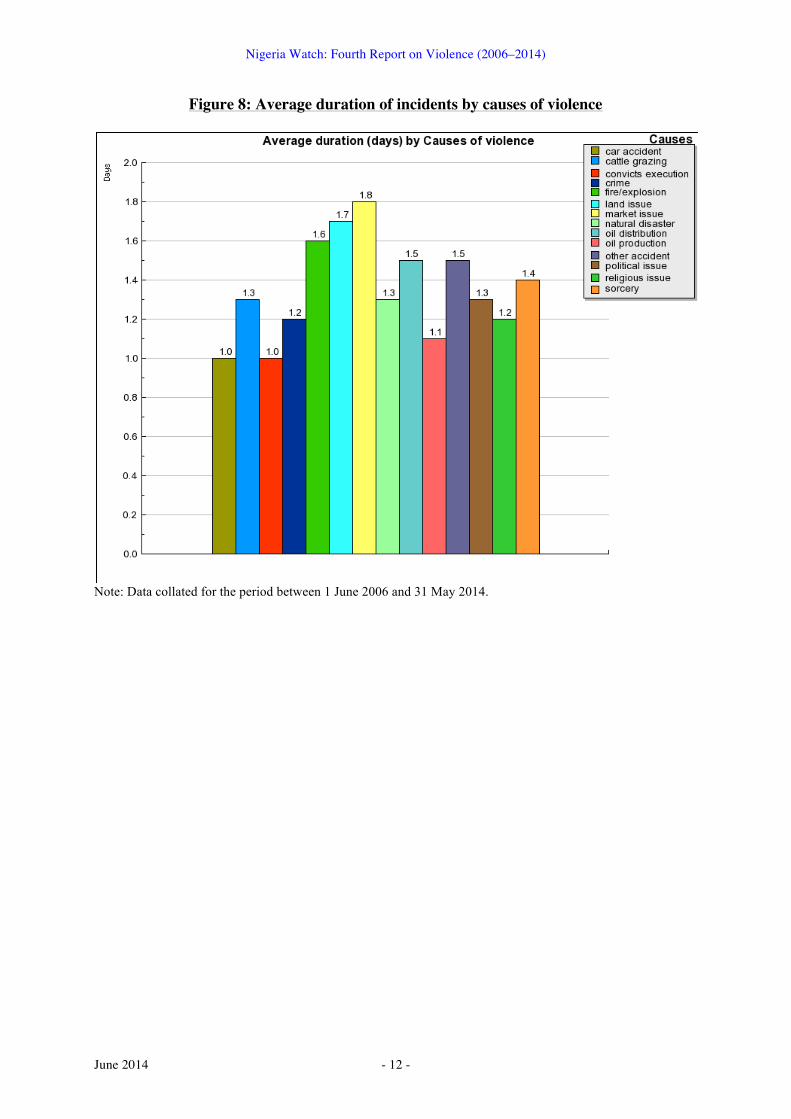
II.5 Oil and land clashes The fifth main cause of violence in Nigeria is directly related to economic issues.
Despite the amnesty in the Niger Delta, oil is by far the most disputed resource, followed by land, cattle, and market-control. Clashes related to land and market issues tend to last longer, however (Figure 8). Moreover, the role of oil in violence is different in the upstream and downstream sectors. On a national level, oil distribution is far more dangerous, as it includes armed attacks on filling stations, tanker accidents, and the theft of petrol or inflammable products that are much more lethal than crude oil in the event of an explosion. In contrast, violence in oil production is limited to extraction areas only, mainly in the Niger Delta. Apart from a few industrial accidents and acts of piracy, this has more to do with political or criminal attacks to gain control of the resource. An assessment of the protagonists involved in violence confirms this. “Major oil companies”, which are concentrated in oil-producing states, are much less affected than “other oil companies”, that is, the NNPC (Nigerian National Petroleum Company) and independent oil companies, which are both involved in production and distribution on a national level.
0"
200"
400"
600"
800"
1000"
1200"
1400"
1600"Number'of'deaths'
Source:'www.nigeriawatch.org'
The'Boko'Haram'crisis:'Number'of'deaths'caused'by'insurgents'and'security'forces''
Military"repression"in"Borno"&"Bauchi"
Emergency"Rule"in"Borno,"Yobe"&"Adamawa"
Local"elecDons"in"Plateau"(the"involvement"of"Boko"Haram"is"not"proven)"
Nigeria Watch: Fourth Report on Violence (2006–2014)
June 2014 - 12 -
Figure 8: Average duration of incidents by causes of violence
Note: Data collated for the period between 1 June 2006 and 31 May 2014.