nigeria inter-bank settlement system (nibss) plc. december 04, 2012 financial derivatives company...
TRANSCRIPT

NIGERIA INTER-BANK SETTLEMENT SYSTEM (NIBSS)
PLC.
December 04, 2012
Financial Derivatives Company Limited
PROJECT REPORT
LAGOS PoS ADOPTION SURVEY for
Conducted by:
Commissioned by:
1
Outline
Executive Summary Background Methodology Survey Findings Summary and Conclusion Recommendations and Next Steps
2

Executive Summary
3

Executive Summary
NIBSS commissioned FDC in October 2012 to conduct a PoS adoption survey in Lagos (Project NIBSS)
The project goal is to ascertain the level of adoption and/or inhibitions to the widespread adoption of PoS terminals in Lagos
The project scope entails a market survey of both merchants and end-users (cardholders) of PoS terminals in Lagos
Market survey conducted via administration of questionnaires in four categories of market areas across Lagos
4

PoS Adoption Rate In Context
Deductions from available data on total number of PoS terminals deployed and volume of transactions conducted indicates that PoS terminals deployed recorded an average of 46 transactions and a maximum of 56 transactions per PoS terminal monthly over the period under consideration
5
Source: NIBSS
Research ObjectivesActive profiles
Understand the profiles of merchants and end-users
Service attractiveness Investigate the attractiveness of the PoS
Terminals Compare with other means of payment
Service weakness Identify perceived obstacles with the use of the
PoS Terminals Identify solutions that will enhance the adoption,
subscription and effective utilisation of the card payment system
Geographical Dynamics Understanding the dynamics and challenges in the
use of PoS Terminals, geographically6

Results and Findings
7

Merchants with PoS
8

Merchants with PoS TerminalsAccording to the survey
results, of the 3,562 merchants with PoS terminals47% are general merchants22.4% operate
supermarkets10.9% are pharmaceutical
stores/hospitals 7.3% are
restaurants/eateries12.4% are other forms of
businessesThese business types are
mostly located in open markets (39.5%)Neighborhood shops
constitute 29.5% 29.5% are in shopping
malls and 1.5% are kiosk locations
Business Location
9
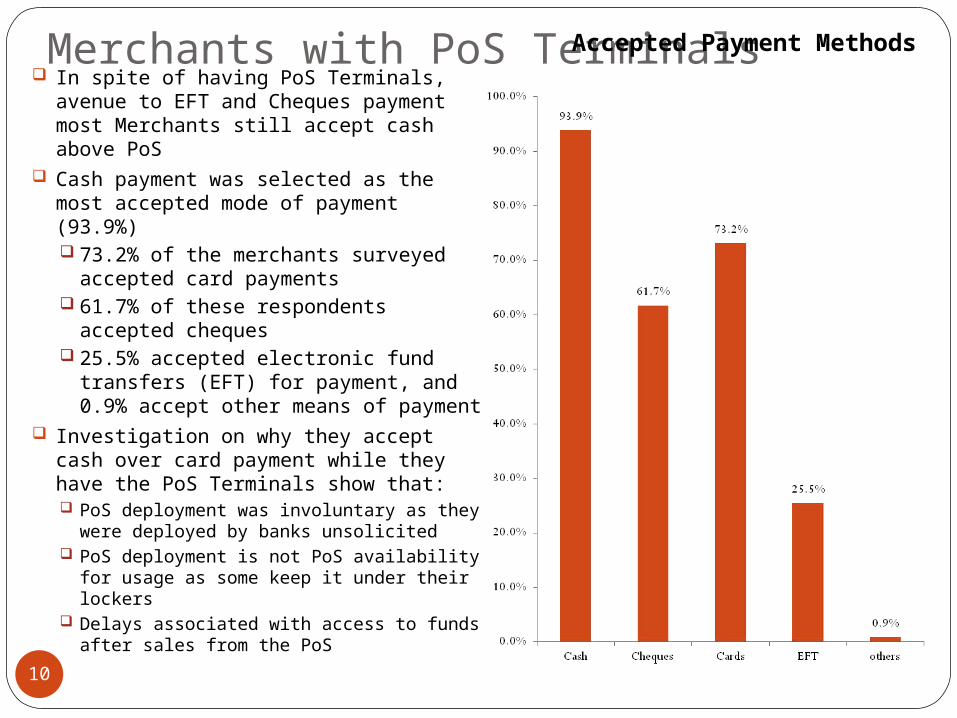
Merchants with PoS Terminals In spite of having PoS Terminals, avenue
to EFT and Cheques payment most Merchants still accept cash above PoS
Cash payment was selected as the most accepted mode of payment (93.9%) 73.2% of the merchants surveyed
accepted card payments 61.7% of these respondents accepted
cheques 25.5% accepted electronic fund
transfers (EFT) for payment, and 0.9% accept other means of payment
Investigation on why they accept cash over card payment while they have the PoS Terminals show that: PoS deployment was involuntary as they
were deployed by banks unsolicited PoS deployment is not PoS availability for
usage as some keep it under their lockers Delays associated with access to funds
after sales from the PoS
Accepted Payment Methods
10

Merchants with PoS Terminals By preference
75.5% of merchants prefer cash as the method of payment
9.1% rating for cheques 11.5% for cards 2.5% for EFTs 1.3% for other means of
payments
Accepted Payment Methods
11

For the non-cash options, 47% of merchants
prefer the card payment scheme to other payment schemes.
On the available card types40.7% of merchants
prefer the Master CardVISA is the next
preferred card payment type with 31.9% of the responses followed by Verve with 27.4% of the responses.
Merchants with PoS Terminals
12

A total of 24.4% of merchants indicated that the success rate of cards is less than 25%
29.8% of merchants believe the success rate to be between 25% and 55%.
29.6% claimed that success rate was between 55% and 75%
16.2% of the merchants indicated that the success rate of card payment was above 75%
Merchants with PoS Terminals
13
Recommendation – Merchants With PoS Terminals
Based on the findings above, our recommendations are as follows:Periodic checks should be carried out by the Payments Terminal
Service Providers (PTSPs) in order to ascertain the condition of the PoS Terminals and get feedback about the functionality of PoS TerminalsThe PTSPs’ technician contact number should be made
available to merchants, so that they can receive quick/first hand technical assistance when they need it
The role of the NIBSS certification laboratory/facility to certify/approve PoS Terminal models should be popularised and communicated to merchants to boost confidence in the system and regulate PoS Terminals in circulation
PoS Terminal certifying agency should conduct periodic spot-checks of PoS Terminals with merchants.
14
Recommendation – Merchants With PoS Terminals
There should be partnership among banks, mobile payments operators, all other existing payment schemes and other support service providers to foster high availability and adoption of PoS Terminals, with the goals of:
Mitigating current network connectivity problemsDelays in accessing proceed of sales
A fair transaction charge should be agreed upon among banks, which should be communicated to the merchants, as:
Some merchants in certain locations are price-sensitive15
Merchants Without PoS
16
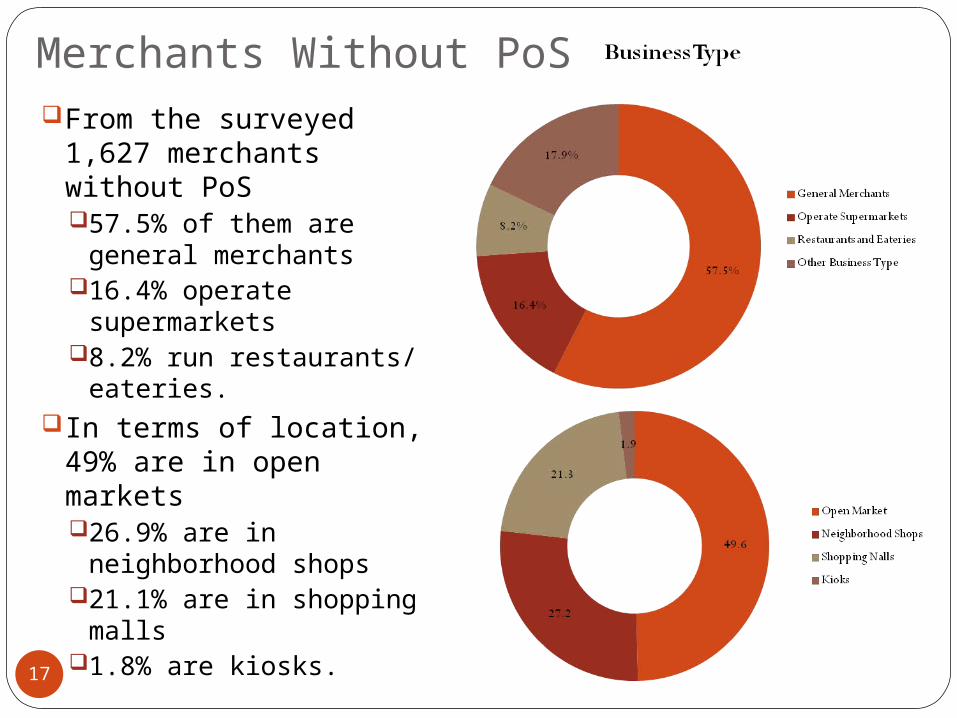
Merchants Without PoSFrom the surveyed 1,627
merchants without PoS57.5% of them are
general merchants16.4% operate
supermarkets 8.2% run restaurants/
eateries. In terms of location, 49%
are in open markets 26.9% are in
neighborhood shops21.1% are in shopping
malls1.8% are kiosks.
17
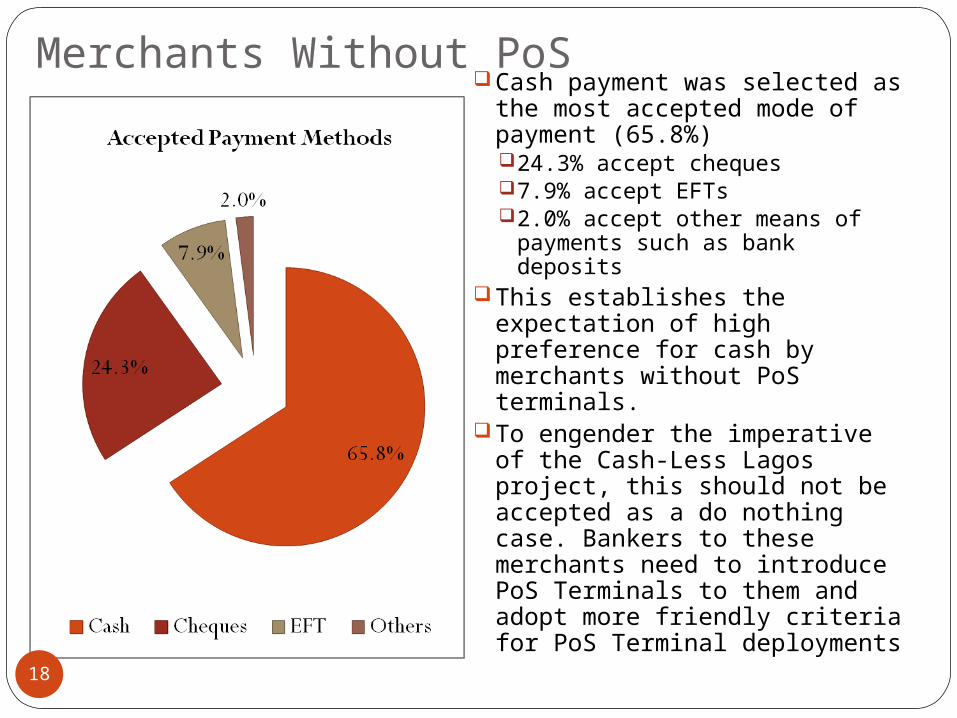
Merchants Without PoSCash payment was selected as
the most accepted mode of payment (65.8%) 24.3% accept cheques7.9% accept EFTs2.0% accept other means of
payments such as bank deposits
This establishes the expectation of high preference for cash by merchants without PoS terminals.
To engender the imperative of the Cash-Less Lagos project, this should not be accepted as a do nothing case. Bankers to these merchants need to introduce PoS Terminals to them and adopt more friendly criteria for PoS Terminal deployments18

Reasons alluded for not having PoS Terminals in descending order are:Fear of default and
fraud - 30.2%Easy access to cash –
27.7%Bank refusal to deploy
– 26.6%Customer’s insistence
to use cash – 25.7%Technical
malfunctioning – 21.6%
PoS Deployment/Transaction fee – 20.0%
Connectivity – 18.1%
Merchants Without PoS
19

70.0% of the merchants expressed willingness to accept PoS Terminal mode of payments.
Merchants Without PoS
20
We make the following suggestions based on our finding above: Banks need to revise the criteria for PoS Terminal
deployment in such a way as to encourage Merchants without PoS Terminals
A massive awareness program should be undertaken to publicize the purpose and benefits of the PoS system and allay fears of default/fraud in the following ways:Publicity through radio and direct contact
Focus on high and medium density areas (e.g. Oke-Arin, Nnamdi Azikiwe markets) because less sophisticated merchants are located in this areas.
Publicity in more sophisticated areas (e.g. Ikoyi, Victoria Island) should emphasize direct contact with the merchants and/or formal letters of introduction.
Other publicity means to be explored like bill boards, fliers, social media and TV adverts
Recommendation – Merchants Without PoS Terminals
21

PTSPs to be encouraged to accept frontal roles in PoS deployment in line with approved guidelines
Training on the usage of PoS Terminals immediately after
deployments PTSPs should check on the merchants after a few days of
training in order to ensure that merchants understand how
to use the PoS Terminals and are using them appropriatelyThe same procedures mentioned under the ‘merchants
with PoS’ section should be followed in order to ensure network problems and technical faults are addressed promptly
The fear of frauds would be resolved once the PoS Terminals are functioning properly because trust in the PoS system would have been built
Recommendation – Merchants Without PoS Terminals
22

Consumers/End-Users
23
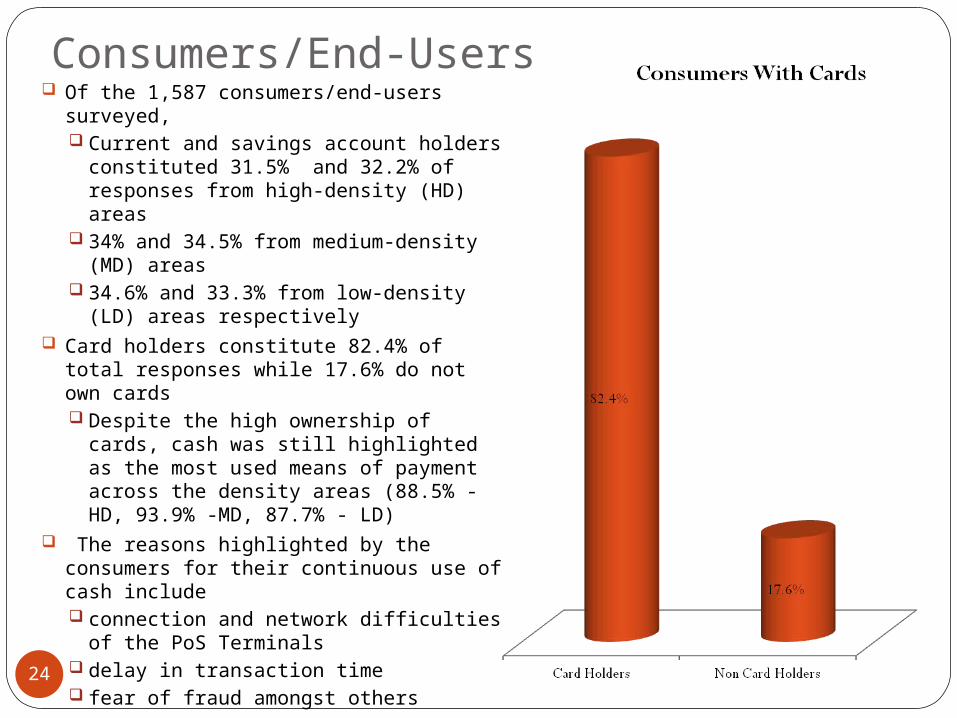
Consumers/End-Users Of the 1,587 consumers/end-users
surveyed, Current and savings account holders
constituted 31.5% and 32.2% of responses from high-density (HD) areas
34% and 34.5% from medium-density (MD) areas
34.6% and 33.3% from low-density (LD) areas respectively
Card holders constitute 82.4% of total responses while 17.6% do not own cards Despite the high ownership of cards,
cash was still highlighted as the most used means of payment across the density areas (88.5% - HD, 93.9% -MD, 87.7% - LD)
The reasons highlighted by the consumers for their continuous use of cash include connection and network difficulties of
the PoS Terminals delay in transaction time fear of fraud amongst others
24

Consumers/End-Users We also identified the closeness
of banks and ATMs’ to both merchants and consumers as a major inhibition to PoS Terminal adoption
Despite the inhibitors, the respondents indicated that they feel most comfortable using the PoS and card payment systems where available and secure. This explains comfort to use cards in supermarkets than in the open marketsSupermarkets (24.8%), malls
(17.0%), general merchants’ stores (15.0%), pharmaceutical stores and hospitals (11.5%), others (17.8%)
73% of consumers indicated they would encourage others to use the PoS and card payment systems based on their experience with the payment systems so far25
Recommendations – Consumers/End-UsersBased on our findings above, our suggestions are as
follows:A massive awareness program to publicize the purpose
and benefits of the PoS system (similar to that recommended for merchants without PoS)Publicity through radio, bill boards, fliers, social media and TV
advertsTown storms and road shows are recommended to fast track
end-users adoption Ensure transparency in the PoS system process
All transaction costs and other issues associated with PoS Terminal usage should be made known to consumers during the publicity program
Necessary steps to ensure that the PoS Terminals are working as expected should be publicized to build trust
26

Recommendations – CONSUMERS/END-USERSCarrying cash by consumers should be made
less attractive through policy formulationThe cash withdrawal limit by individuals should be
revised downward with more stringent charges for withdrawals above specified limits
The cash deposit limits for corporate account holders should be reduced and the penalty for large deposits should be increased
27
ConclusionThe potential for growth of the usage of PoS Terminal
in Lagos metropolis remains strong.With a population of over 16 million people, there
are presently approximately 8 million card holders in Lagos State
Based on the aggregated data from the 6,776 survey sample, the study found out the following:
Challenges / Perceived Obstacles to usage of PoS TerminalsTwo out of the three categories of respondents (i.e.
Merchants with PoS and Merchants without PoS Terminals) identify basically the same challenges and perceived obstacles to the smooth operation of the PoS Terminals
28
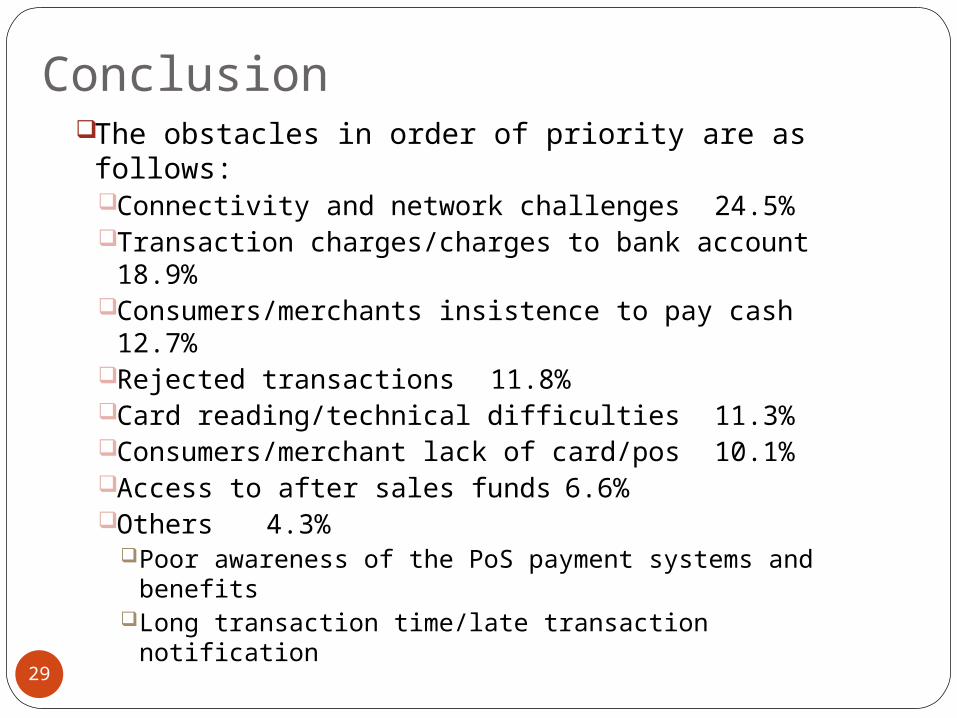
ConclusionThe obstacles in order of priority are as follows:
Connectivity and network challenges24.5%
Transaction charges/charges to bank account18.9%
Consumers/merchants insistence to pay cash12.7%
Rejected transactions 11.8%Card reading/technical difficulties
11.3%Consumers/merchant lack of card/pos 10.1%Access to after sales funds 6.6%Others 4.3%
Poor awareness of the PoS payment systems and benefits
Long transaction time/late transaction notification29
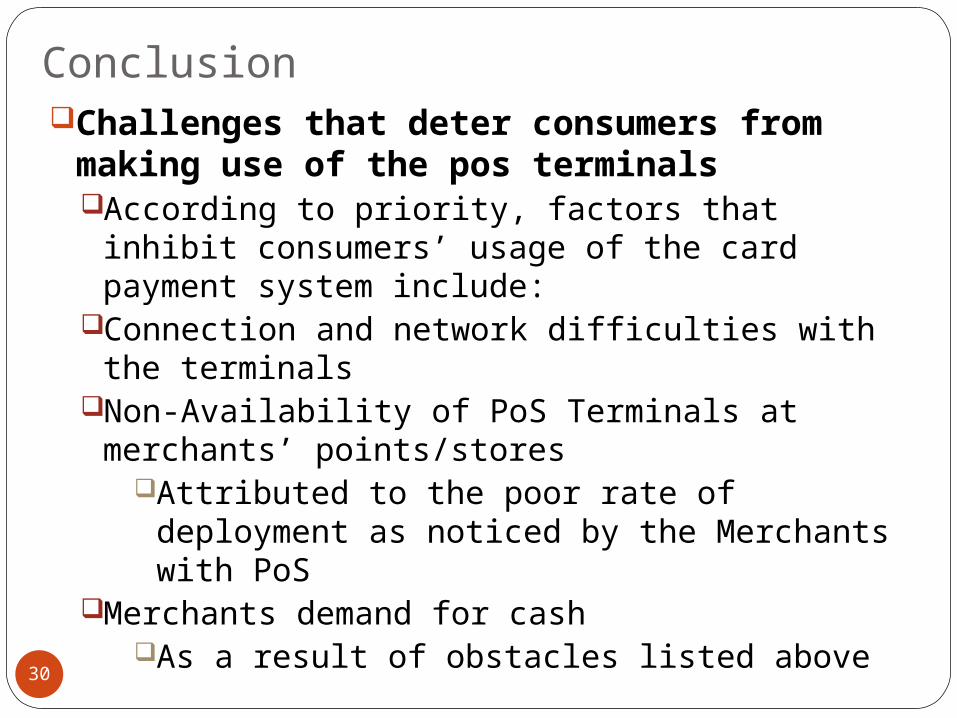
ConclusionChallenges that deter consumers from
making use of the pos terminalsAccording to priority, factors that inhibit
consumers’ usage of the card payment system include:
Connection and network difficulties with the terminals
Non-Availability of PoS Terminals at merchants’ points/stores
Attributed to the poor rate of deployment as noticed by the Merchants with PoS
Merchants demand for cash As a result of obstacles listed above
30

Conclusion
Long/delayed transaction timeFear of fraud
Some consumers gave personal experiences on being debited twice
In some cases the terminals reject the transaction, however the consumer receives a debit alert some hours after the unsuccessful transaction
31

Next Steps
32

Next StepsWe suggest a follow-up integration survey in Lagos
State most importantly in the areas not covered by this surveyThis will help to further identify other cultural and
fundamental barriers to the adoption of the PoS Terminals
Popularisation of NIBSS role as PoS Terminal certification agency and regular spot checks of PoS Terminals in use at merchant points
There is need for a pilot survey in other key cities where the Cash-less policy will be introduced before implementation This will help to identify the necessary pre-
implementation steps to be taken; identify the trend and compare results with the Lagos density areas
This will help underscore the model to be adopted for each of the new locations
33

Background & Methodology
34

Background and Methodology
The “Project NIBSS” entails a market survey of both merchants and end-users (cardholders) of PoS terminals in Lagos
Market survey conducted via administration of questionnaires in four categories of market areas across Lagos
Stratification of sample area (Lagos State) intoLagosYaba IkejaBadagry
Further stratification into high, medium and low density areas
35

Background and Methodology
Spot Check on enumerators during enumerationBy both FDC and NIBSS team
Project update presented during the course of the surveyFeedback from update incorporated
36

Scope of Survey
37
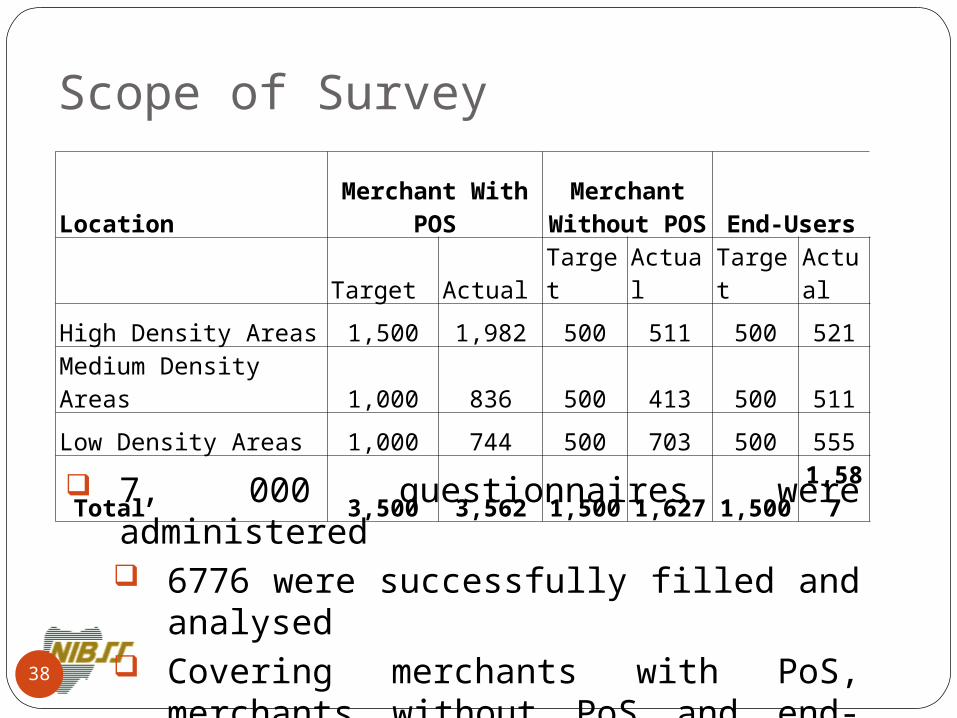
Scope of Survey
Location Merchant With POSMerchant
Without POS End-Users
Target Actual Target Actual Target Actual
High Density Areas 1,500 1,982 500 511 500 521
Medium Density Areas 1,000 836 500 413 500 511
Low Density Areas 1,000 744 500 703 500 555
Total 3,500 3,562 1,500 1,627 1,500 1,587
7, 000 questionnaires were administered 6776 were successfully filled and
analysed Covering merchants with PoS,
merchants without PoS and end-users ( Card and Non-card holders)
38

Drawbacks Drawbacks included
Several duplication of addresses of merchants with PoS
Incorrect addresses of merchants with PoS Difficulty in meeting owners and managers
where sales personnel's/other staff insist they cannot fill the questionnaires
Some questionnaires administered were not returned as a result of merchants insistence on enumerators picking them up later
Respondents fear of confidentiality Angry respondents (basically as a result of
their bad experiences with PoS terminal)39
Merchants with PoS
Survey Findings -Quantitative
40
Respondents Status in Relation to Business
41

Responses from Survey shows More business owners (45.43% - Yaba) responded to the
questionnaires 20.8% - Ikeja, 16.5% in Badagry and 11.6% in Lagos
21.1% in Ikeja were by managers 20.7% were by secretaries and personal assistants in Badagry 40.5% were other staff and workers in the various outlets
Respondents Status in Relation to Business
42

Equal number (25%) of respondents from the Ikeja, Badagry and Lagos zones are Owners, Managers, Partners and Sales representatives
However, a majority (38.5%) of the respondents in the Yaba medium density area were Owners
A greater proportion of the respondents in Yaba (46.7%) and Ikeja (24.0%) are Owners
Majority of the respondents in Badagry (24.0%) and Lagos (61.7%) zones are Managers
Sales representatives were 30% in the Lagos area
43
Respondent Status in Relation to Business
Nature of Business
44

35.6% (the majority) of the respondents in the Yaba high density areas were General merchants (traders)
Most respondents in Lagos (37.7%) own supermarkets
In the Badagry and Ikeja zones 20.2% and 20% own restaurants.
Most of the respondents in the Lagos (31.8%) and Yaba (43.9%) medium density areas were general merchants
In the Ikeja zone, 32.1% were owners of other kind of businesses
20% of respondents in the Badagry area were general merchants, own restaurants, supermarkets, pharmaceutical stores and hairdressing salons each
45
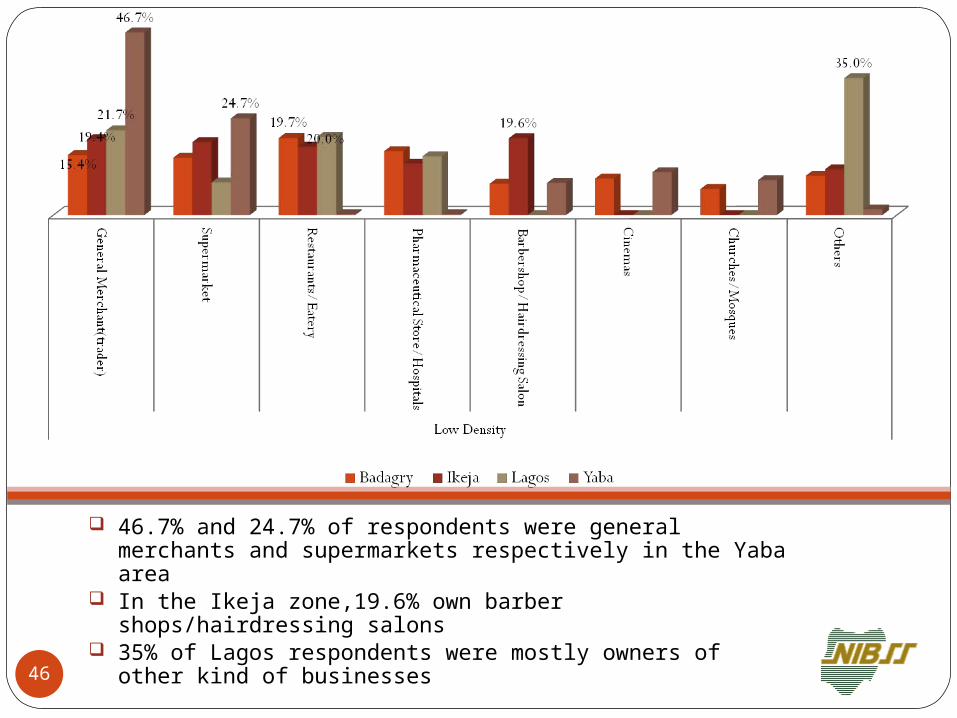
46.7% and 24.7% of respondents were general merchants and supermarkets respectively in the Yaba area
In the Ikeja zone,19.6% own barber shops/hairdressing salons
35% of Lagos respondents were mostly owners of other kind of businesses
46

Nature of Business and Business Location
47

General merchant stores (18.1%), supermarkets (7.2%), and restaurants (5.7%) were located in the open market, shopping malls, and kiosks respectively.
However, a majority of pharmaceutical stores (3.4%) and hair dressing salons (2.4%) were located in neighborhood shops.
General merchant stores (14.4%) and pharmaceutical stores (2.6%) were located in the open market
Supermarkets (7.1%), restaurants (3.7%) and hair dressing salons (1.3%) were located in kiosks, shopping malls and neighborhood shops respectively.48

Like other density areas, a majority (13.5%) of general merchants were located in open markets
Supermarkets (6.1%) and pharmaceutical stores (3.1%) were located in shopping malls
Majority of restaurants (4.1%) and hair dressing salons (2.4%) were located in neighborhood shops.
49
Nature of Business and Proximity to Banks and ATMs
50
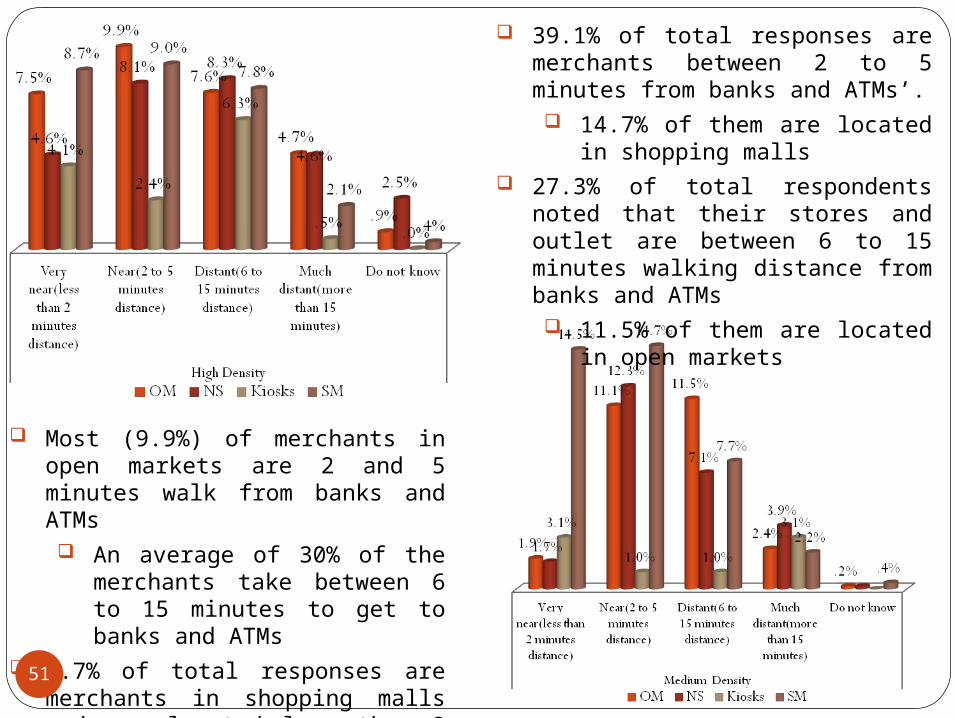
Most (9.9%) of merchants in open markets are 2 and 5 minutes walk from banks and ATMs An average of 30% of the
merchants take between 6 to 15 minutes to get to banks and ATMs
8.7% of total responses are merchants in shopping malls and are located less than 2 minutes away from banks and ATMs (24.9% - less than 2 minutes)
39.1% of total responses are merchants between 2 to 5 minutes from banks and ATMs’. 14.7% of them are located in
shopping malls 27.3% of total respondents noted
that their stores and outlet are between 6 to 15 minutes walking distance from banks and ATMs 11.5% of them are located in
open markets
51
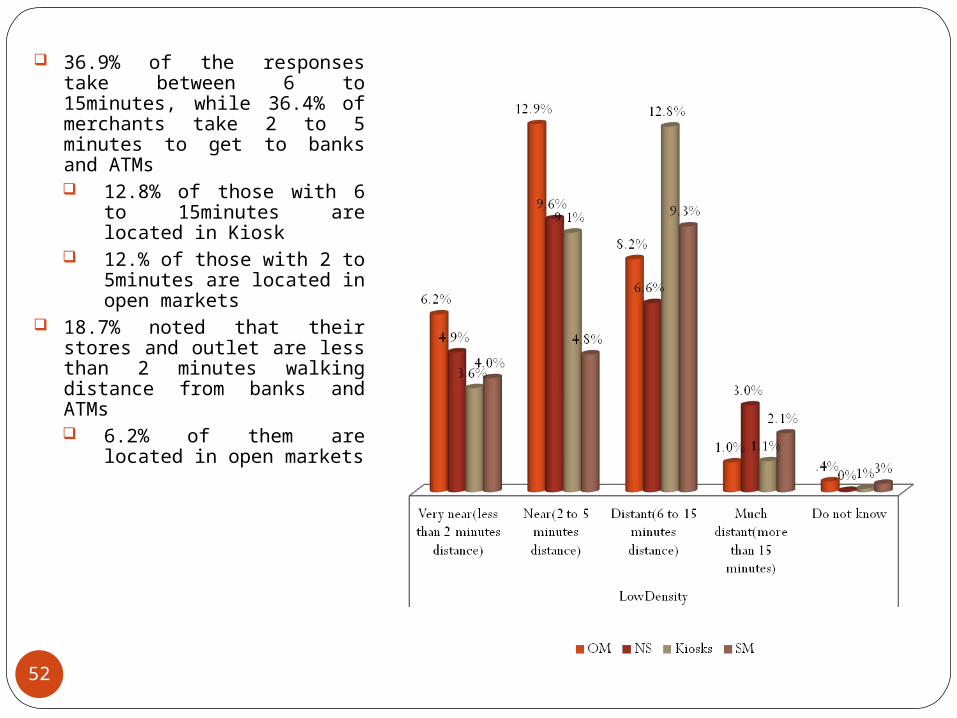
36.9% of the responses take between 6 to 15minutes, while 36.4% of merchants take 2 to 5 minutes to get to banks and ATMs 12.8% of those with 6
to 15minutes are located in Kiosk
12.% of those with 2 to 5minutes are located in open markets
18.7% noted that their stores and outlet are less than 2 minutes walking distance from banks and ATMs 6.2% of them are
located in open markets
52

Accepted Means of Payment
53
54
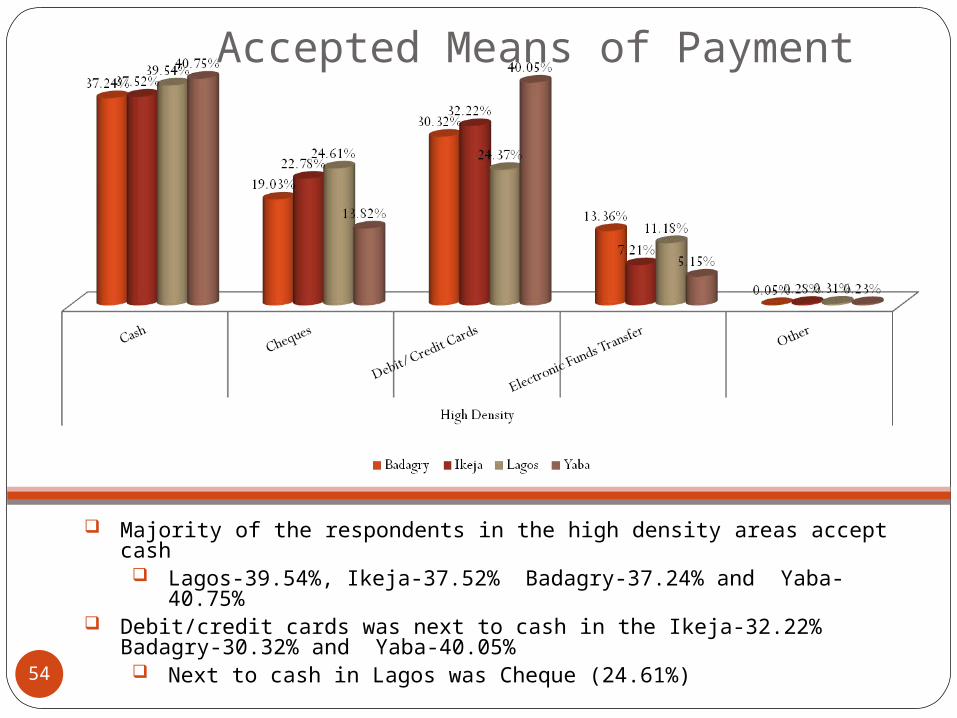
Majority of the respondents in the high density areas accept cash Lagos-39.54%, Ikeja-37.52% Badagry-37.24% and Yaba-40.75%
Debit/credit cards was next to cash in the Ikeja-32.22% Badagry-30.32% and Yaba-40.05% Next to cash in Lagos was Cheque (24.61%)
Accepted Means of Payment

Respondents in the Lagos (38.89%) and Yaba (32.47%) medium density areas accept cash.
In Ikeja (37.04%) preferred debit/credit cards Equal number (40.28%) of respondents in the Badagry area accept cash and
debit/credit cards55
Accepted Means of Payment

In the low density areas, majority of the respondents accept cash (Ikeja-38.06%, Badagry- 35.31%, and Yaba- 30.81%)
Equal number (37.65%) of respondents in the Lagos zone accept cash and debit/credit cards.
56
Accepted Means of Payment
Frequency of Usage
57

In all the high density areas, cash is used many times a day
Lagos- 85.1% Ikeja- 90% Badagry- 92.9% Yaba- 95.4%
EFT was never used Lagos- 35.8%Ikeja- 38.6%Badagry- 31.2% Yaba - 59.9%
58

Like the high density areas, cash was used many times a day in the medium density areas
Lagos- 65.2%, Ikeja-80% Badagry-89.7% Yaba-96.5%
Electronic funds transfer was never used
Lagos- 34.8% Ikeja - 68.9% Badagry (80%) Yaba- 34.2%
Many times per day
59
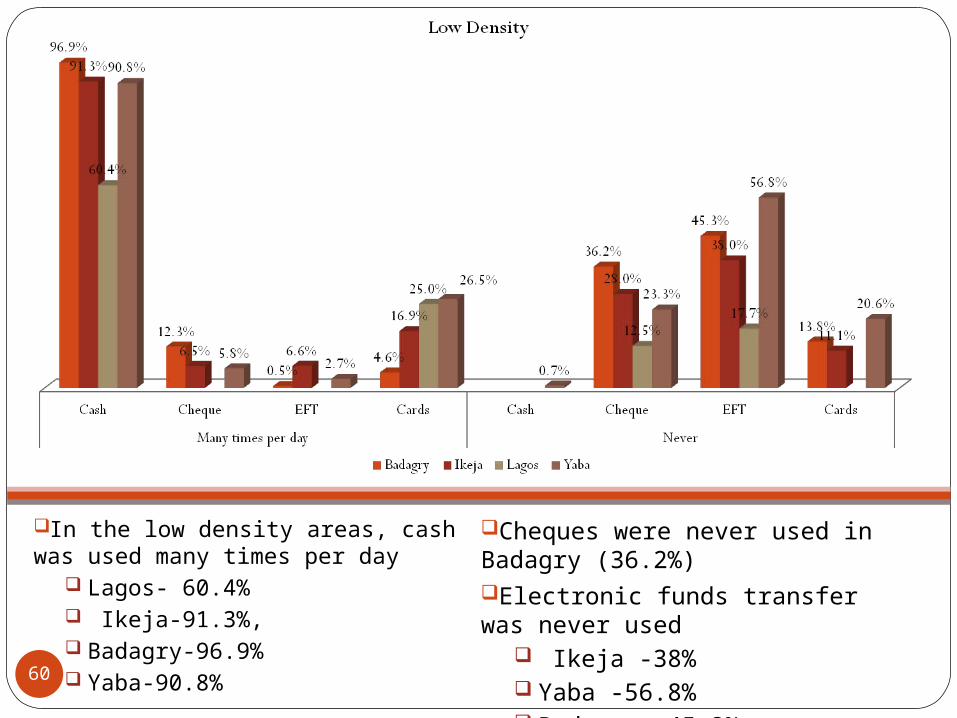
In the low density areas, cash was used many times per day
Lagos- 60.4% Ikeja-91.3%, Badagry-96.9% Yaba-90.8%
Cheques were never used in Badagry (36.2%) Electronic funds transfer was never used
Ikeja -38% Yaba -56.8% Badagry -45.3%
60

Preferred Card Scheme
61

Majority of the respondents in the Badagry (38.1%), Ikeja (30.6%) and Yaba (29.4%) high density areas preferred the MasterCard
VISA card was preferred in Lagos (22.2%) The second choice in the Badagry (30%) and Ikeja (23.7%) zones was the VISA card
MasterCard and Verve were the second best in the Lagos (20.9%) and Yaba (17.8%) zones respectively
62
Preferred Card Scheme A greater proportion of the respondents in the medium density
areas preferred the MasterCard Lagos-38.5% Ikeja -36.7% Yaba-30.4%
VISA and MasterCard are equally preferred by majority (33.3%) of the respondents in the Badagry area
VISA card is the second best in Ikeja (26.9%), Lagos (17.9%) and Yaba (19.4%)
Verve card was the second best in Badagry (31%) In the low density areas, the MasterCard was the preferred card
scheme Badagry-36.1% Ikeja-42.9% Yaba-23.8%
Verve card was the preferred card in Lagos constituting 38.9% The second best in the low density areas were as follows:
Lagos- MasterCard (27.8%) Ikeja- VISA (31.7%) Badagry-verve (32%) Yaba- VISA (20.4%)63

PoS Usage Motivation
64

Majority of the respondents in the Ikeja (16.06%) and Yaba (14.55%) zones acknowledged that the main motivation for adopting the PoS was the simplicity of its usage.
Majority in the Lagos (15.46%) zone adopted the PoS due to high costs of cash management Badagry (15.57%) zone adopted the PoS based on other reasons 65

A greater proportion of the respondents in the medium density areas adopted the PoS due to faster payment processing time, image of the outlet, and high costs of cash management respectively
Yaba (16.1%), Lagos (15.9%) and Ikeja (15.7%)
66
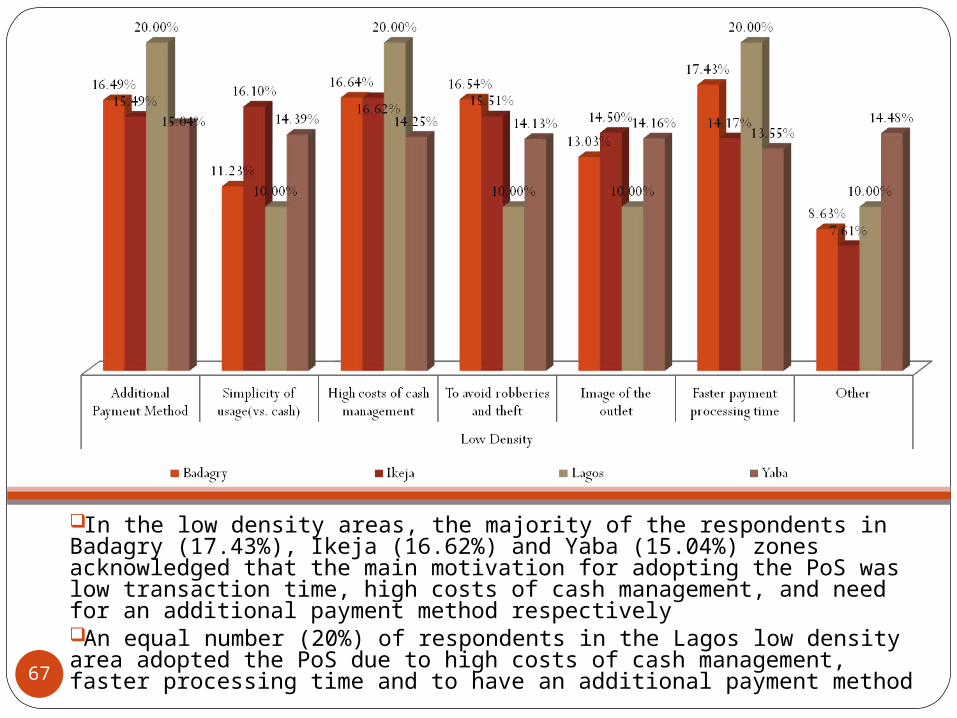
In the low density areas, the majority of the respondents in Badagry (17.43%), Ikeja (16.62%) and Yaba (15.04%) zones acknowledged that the main motivation for adopting the PoS was low transaction time, high costs of cash management, and need for an additional payment method respectivelyAn equal number (20%) of respondents in the Lagos low density area adopted the PoS due to high costs of cash management, faster processing time and to have an additional payment method
67
Perceived Inhibitions to PoS Usage
68
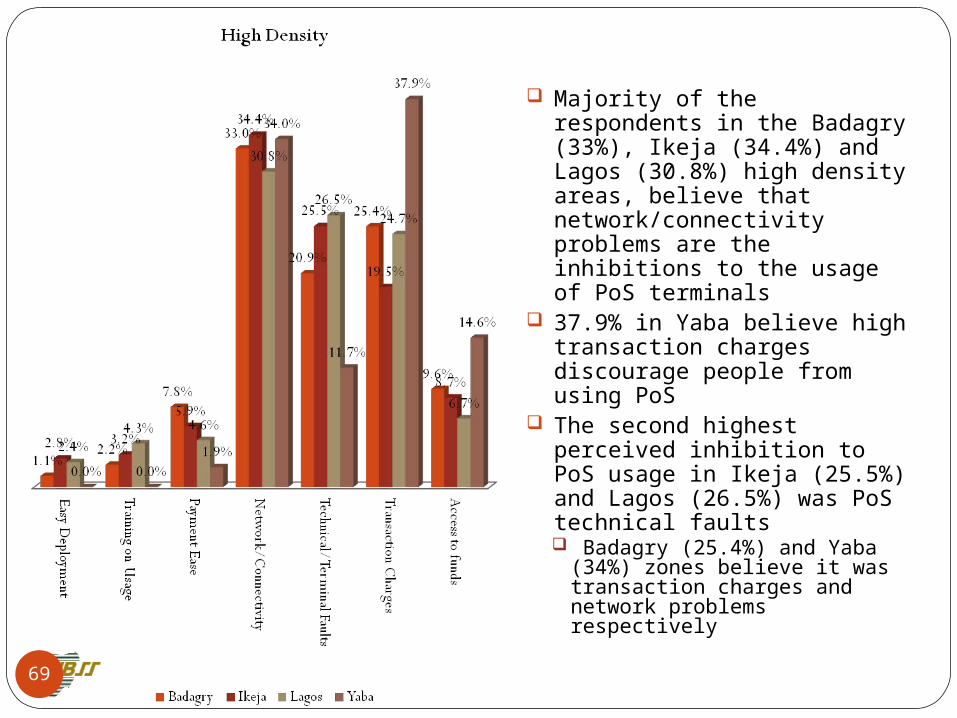
Majority of the respondents in the Badagry (33%), Ikeja (34.4%) and Lagos (30.8%) high density areas, believe that network/connectivity problems are the inhibitions to the usage of PoS terminals
37.9% in Yaba believe high transaction charges discourage people from using PoS
The second highest perceived inhibition to PoS usage in Ikeja (25.5%) and Lagos (26.5%) was PoS technical faults Badagry (25.4%) and Yaba
(34%) zones believe it was transaction charges and network problems respectively
69

Like the high density areas, 75% of the respondents Badagry, 30.6% in Lagos and 35.3% in Ikeja medium density areas believe that network/connectivity problems may prevent people from using the PoS
35.1% in Yaba believed that transaction charges was the main problem.
The second highest perceived inhibition to PoS usage in Ikeja (27.7%) and Badagry (25%) is PoS technical faults In Yaba (18.6%), delay in
access to funds is the second highest.
An equal number (27.4%) of respondents in the Lagos believe that the second highest inhibition to PoS usage was the high transaction charges and technical faults70

In all the low density areas, network/connectivity problems discouraged their usage of PoS terminals Lagos-66.7%, Ikeja-
29.9%, Badagry-38.2% and Yaba-35.6%
Technical faults are perceived to be the second highest inhibition to PoS usage in all the zones Lagos-25%, Ikeja-
24.8%, Badagry-28.7% and Yaba-28.2%71

Inhibitions to PoS Usage Based on Experience
72
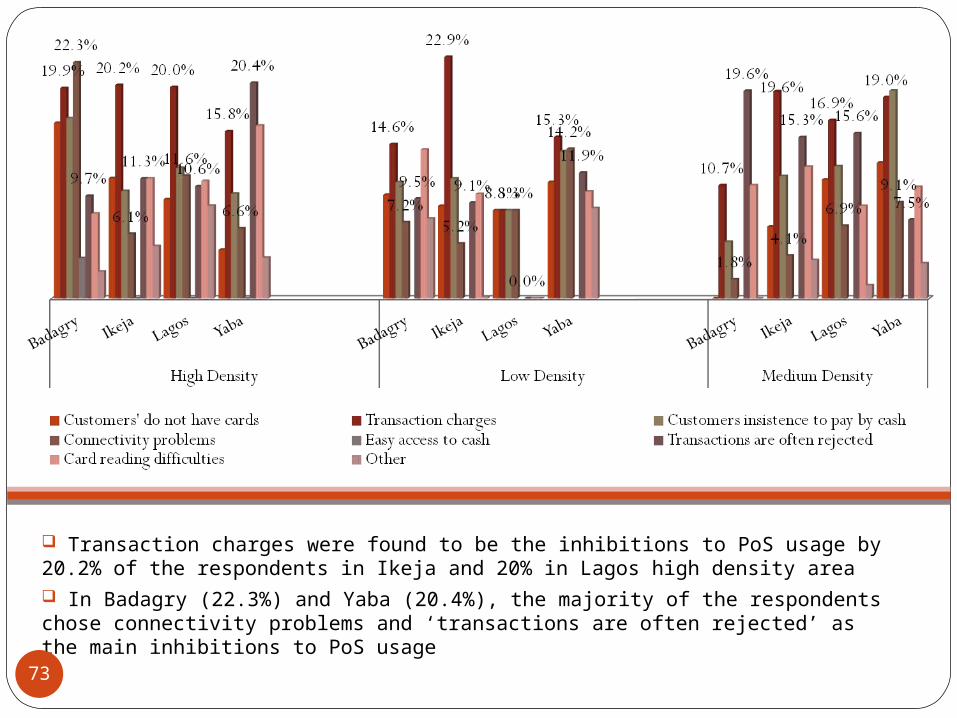
Transaction charges were found to be the inhibitions to PoS usage by 20.2% of the respondents in Ikeja and 20% in Lagos high density area In Badagry (22.3%) and Yaba (20.4%), the majority of the respondents chose connectivity problems and ‘transactions are often rejected’ as the main inhibitions to PoS usage
73

A greater proportion of the respondents in the Ikeja (19.6%) and Lagos (16.9%) medium density areas chose transaction charges as the inhibition to PoS usage
19.7% in Yaba and 19.6% in Badagry zones chose ‘customers insist to pay by cash’ and ‘transactions are often rejected’
In the Badagry (14.6%), Ikeja (22.9%) and Yaba (15.3%) low density areas, transaction charges were the main inhibitions to PoS usage
Equal percentage (8.3%) of respondents in Lagos chose connectivity problems, customer’s insistence to pay by cash, and transaction charges respectively as obstacles to PoS usage
74
Merchants without PoS
Survey Findings -Quantitative
75

Respondents Status in Relation to Business
76
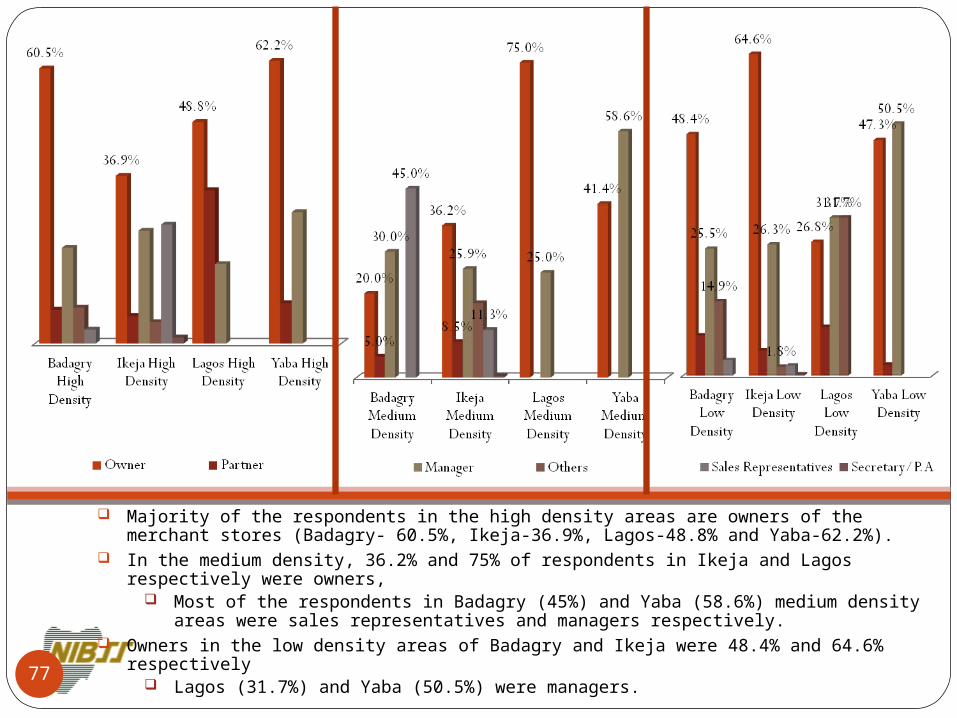
Majority of the respondents in the high density areas are owners of the merchant stores (Badagry- 60.5%, Ikeja-36.9%, Lagos-48.8% and Yaba-62.2%).
In the medium density, 36.2% and 75% of respondents in Ikeja and Lagos respectively were owners,
Most of the respondents in Badagry (45%) and Yaba (58.6%) medium density areas were sales representatives and managers respectively.
Owners in the low density areas of Badagry and Ikeja were 48.4% and 64.6% respectively Lagos (31.7%) and Yaba (50.5%) were managers. 77

Business Nature and Location
78

Most respondents (58.6%) were general merchants (traders) and they were located in the open market
16.7% of outlets business were supermarkets
Distribution of merchants’ location vary
50% were in Open markets
27% in Neighborhood shops
21% in Shopping malls
2% in Kiosk
79
Proximity to Banks and ATMs
80
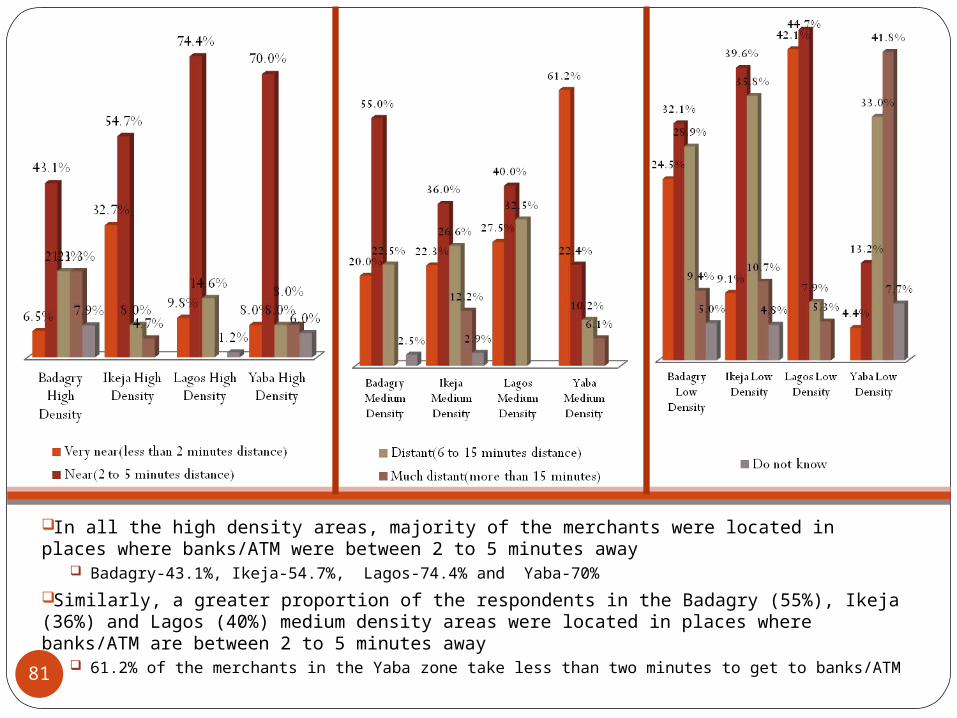
In all the high density areas, majority of the merchants were located in places where banks/ATM were between 2 to 5 minutes away
Badagry-43.1%, Ikeja-54.7%, Lagos-74.4% and Yaba-70%
Similarly, a greater proportion of the respondents in the Badagry (55%), Ikeja (36%) and Lagos (40%) medium density areas were located in places where banks/ATM are between 2 to 5 minutes away
61.2% of the merchants in the Yaba zone take less than two minutes to get to banks/ATM81
Accepted Means of Payment
82

Majority of the respondents in the high density areas accept cash
Badagry-97.4%, Ikeja-94.7%, Lagos-97.6% and Yaba-100%
Cheques were the second best accepted means of payment.
The distribution of the medium density areas was identical to the high density areas.
Majority of the respondents accept cash (Badagry-100%, Ikeja-96.8%), Lagos-100% and Yaba-98%) Cheques were the second best accepted means of payment.
In the low density areas, cash is also the favoured accepted means of payment (Badagry-96.5%, Ikeja-98.7%), Lagos-97.6% and Yaba-98.9%).
cheques were the second best in only Badagry (50.9%), Ikeja (28.1%) and Lagos (31.7%).
83
Why Merchants Discontinued Use of PoS
84

In the Yaba (66.7%), Badagry (54.2%) and Ikeja (73.1%) high density areas, the respondents discountinued use of the PoS due to;
Perceived difficulty in easy access to cash after sales customer’s insistence to use cash and technical malfunction
Equal percentage (66.7%) of respondents in the Lagos zone claimed that telecommunications and customer’s insistence to use cash were the factors that prevent them from having the PoS terminals.
85

Transaction fees and technical malfunction were the reasons most of the respondents discontinued the use of PoS terminals in the Ikeja (33.3%) and Yaba (50%) medium density areas.
In the low density areas of Ikeja and Badagry, 76.7% and 56.1% of the without PoS merchants said technical malfunction was the main impediment to the adoption of PoS terminals
In Lagos and Yaba, 40% and 77.6% chose ‘fear of fraud’ and ‘transaction fees’.
86
Cashless Policy Awareness and
Perception on PoS Usage
87
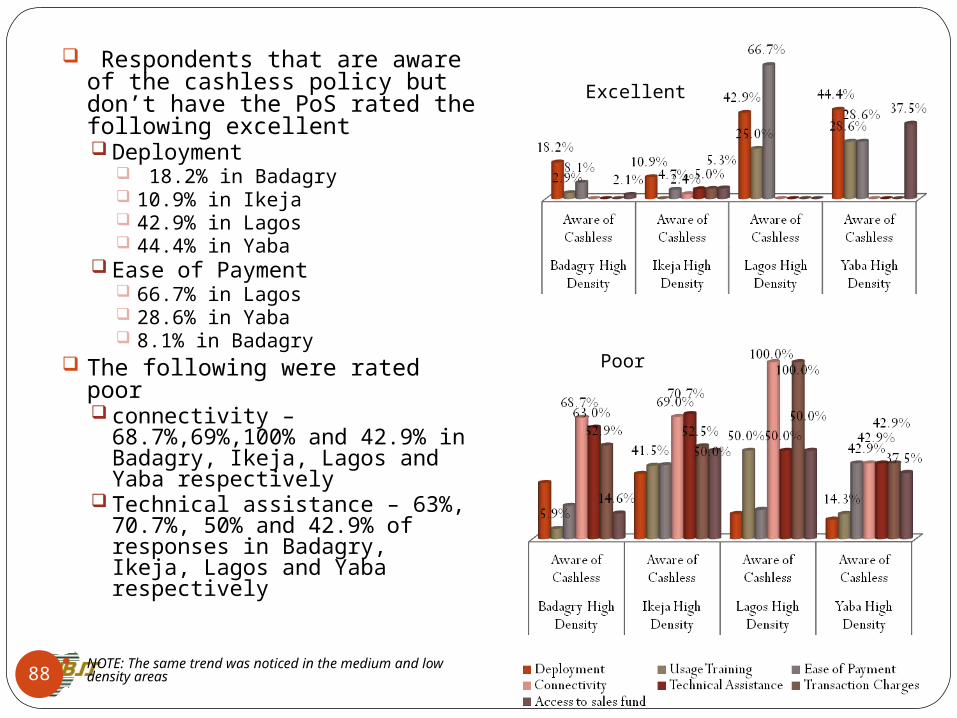
Respondents that are aware of the cashless policy but don’t have the PoS rated the following excellent Deployment
18.2% in Badagry 10.9% in Ikeja 42.9% in Lagos 44.4% in Yaba
Ease of Payment 66.7% in Lagos 28.6% in Yaba 8.1% in Badagry
The following were rated poor connectivity –
68.7%,69%,100% and 42.9% in Badagry, Ikeja, Lagos and Yaba respectively
Technical assistance – 63%, 70.7%, 50% and 42.9% of responses in Badagry, Ikeja, Lagos and Yaba respectively
NOTE: The same trend was noticed in the medium and low density areas
Excellent
Poor
88

Frequency of Usage
89

Frequency of Usage In all the high density area, cash was used many times a day
Lagos - 94.3% Ikeja - 96%Badagry- 68.3%Yaba - 88%
EFT was never used Cash was used many times a day in the medium density
areasLagos - 90.2% Ikeja - 96%Badagry - 91.3%Yaba - 97.8%Most respondents indicated that EFTs were never used by a large
percentageBadagry - 65% Ikeja - 48.1%Lagos - 47.5% %
Cheques were never used in the Yaba (54%) area Similar to the high density areas, cash was used many times
per day in the low density areas (Lagos- 60.4%, Ikeja-91.3%, Badagry-96.9%, and Yaba-90.8%) but electronic funds transfer was never used
90

End-Users
Survey Findings -Quantitative
91

Bank Proximity
92

Majority of the responses in the high density area showed that banks were within 6 to 15 minutes distance from their place of work
57.6%, 35.2%, 47.7% and 60.6% in Badagry, Ikeja, Lagos and Yaba respectively
A greater proportion of the respondents in the Lagos (60.6%) and Yaba (38.25%) medium density areas take about 6 to 15 mins to get to banks/ATMs while those in the Ikeja area take less than 5 minutes
Similar to the high density areas, banks are 6 to 15 minutes close to the respondents in the Ikeja (44.7%), Lagos (44.7%) and Yaba (48.8%) low density areasIn the Badagry it takes less than 2 minutes to get to banks/ATMs
93
Payment Frequency
94
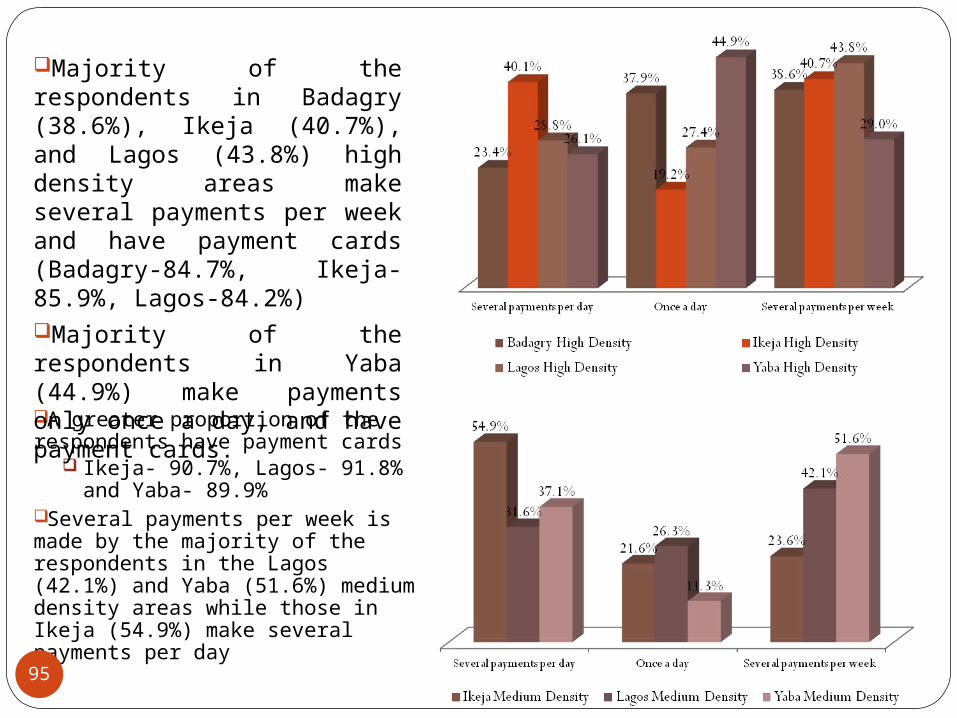
A greater proportion of the respondents have payment cards
Ikeja- 90.7%, Lagos- 91.8% and Yaba- 89.9%
Several payments per week is made by the majority of the respondents in the Lagos (42.1%) and Yaba (51.6%) medium density areas while those in Ikeja (54.9%) make several payments per day
Majority of the respondents in Badagry (38.6%), Ikeja (40.7%), and Lagos (43.8%) high density areas make several payments per week and have payment cards (Badagry-84.7%, Ikeja-85.9%, Lagos-84.2%)Majority of the respondents in Yaba (44.9%) make payments only once a day, and have payment cards.
95

In all the low density areas, most respondents make several payments per day
Badagry- 45.1% Ikeja- 51.3%Lagos- 47% Yaba- 41.3%96
Consumer with Payment Cards
97
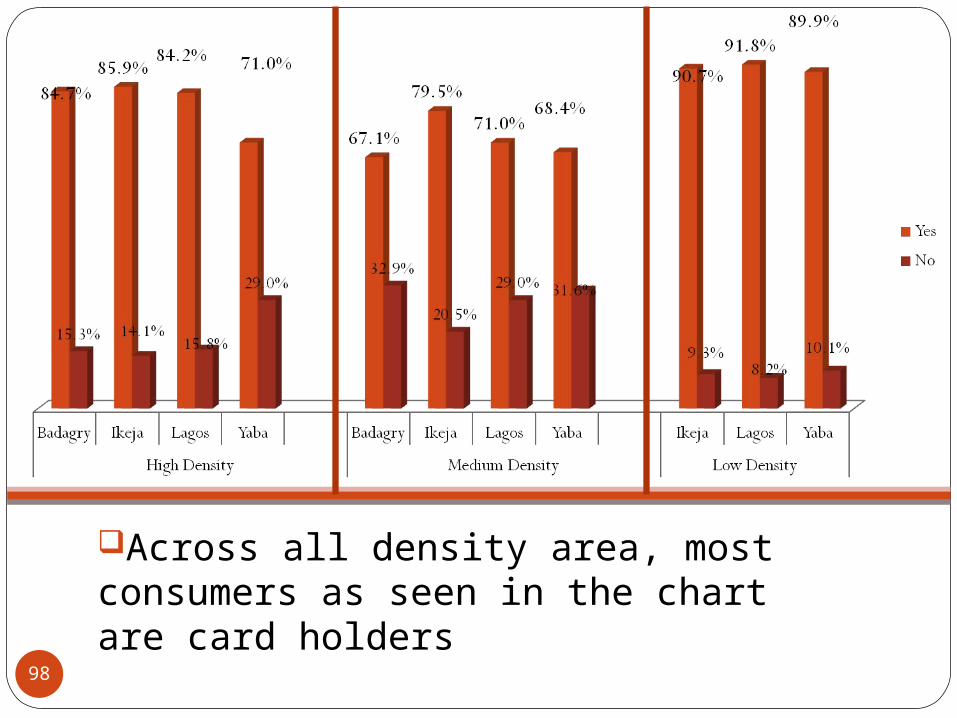
Across all density area, most consumers as seen in the chart are card holders
98
Range of Cards Owned
99

Given the range of cards owned (above) by consumers Average range of cards owned
In the high density area – 5 In medium density area – 3 In low density area – 3
100
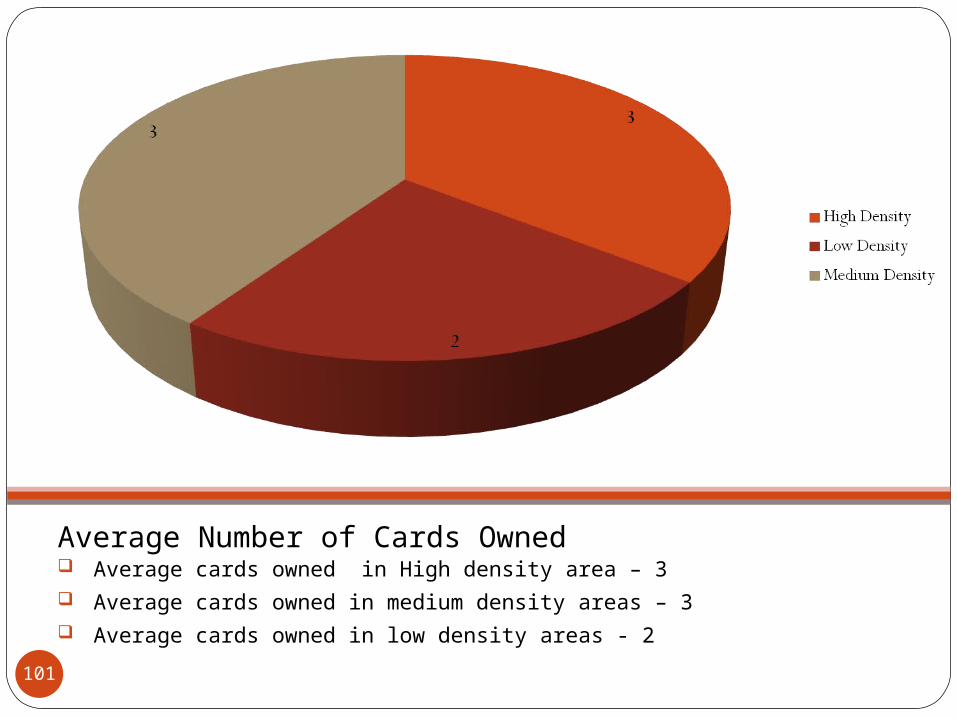
Average Number of Cards Owned Average cards owned in High density area – 3 Average cards owned in medium density areas – 3 Average cards owned in low density areas - 2
101
Factors Likely to Encourage Consumers
102
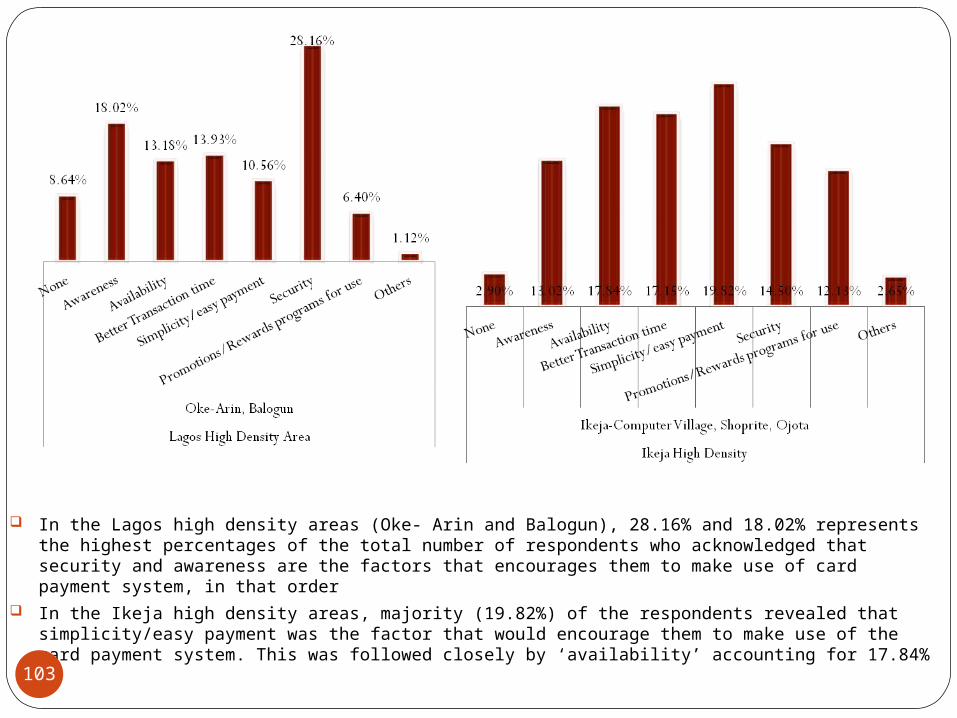
In the Lagos high density areas (Oke- Arin and Balogun), 28.16% and 18.02% represents the highest percentages of the total number of respondents who acknowledged that security and awareness are the factors that encourages them to make use of card payment system, in that order
In the Ikeja high density areas, majority (19.82%) of the respondents revealed that simplicity/easy payment was the factor that would encourage them to make use of the card payment system. This was followed closely by ‘availability’ accounting for 17.84%103

However in the Yaba high density areas, better transaction time was selected by a greater proportion (22.39%) of respondents, then availability accounts for 18.66%.
The Badagry high density area has a similar distribution to that of the Ikeja high density areas. The top two factors that encourage the use of the card payment system are simplicity/easy payment (22.28%) and availability (20.34%)104

In the Lagos medium density areas, the factors with the primary will encourage the use of the card payment system are promotions/rewards (20.57%), security (19.86%) and awareness (17.73%).
In the Ikeja areas, the distribution was as follows: security at 18.69%, and simplicity/easy payment at 18.07%.
In the Yaba area, 21.51% identified availability as the factor primary factor followed by security (20.35%), simplicity/ease of payment (19.77%) and better transaction time (18.02%).
105

In the Lagos medium density areas, the factors with the primary will encourage the use of the card payment system are promotions/rewards (20.57%), security (19.86%) and awareness (17.73%).
In the Ikeja areas, the distribution was as follows: security at 18.69%, and simplicity/easy payment at 18.07%.
In the Yaba area, 21.51% identified availability as the factor primary factor followed by security (20.35%), simplicity/ease of payment (19.77%) and better transaction time (18.02%).
106
Factors that Discourage Consumers
107

In all of the high density areas, majority of the respondents indicated that the non-connectivity of PoS terminals discourages them from using the terminalsLagos-19.39%Ikeja-23.59%Yaba-20.90%Badagry-24.22%.
The second highest selected by the various areas include: Fear of fraud- LagosDemand for cash- IkejaNon-availability of PoS at
merchant stores- Yaba PoS transaction charges-
Badagry.108

In the medium density areas, ‘terminals not connecting’ also ranks highest as the factor that discourages consumers from making use of PoS terminals Lagos-25% Ikeja-21.19% Yaba-27.81)
In the low density areas, respondents in the Lagos (25.04%) and Ikeja (22.22%) areas indicated ‘terminals not connecting’ as the factor that discourages them from using PoS terminals 38.81% of the respondents in the Badagry zone
reveal that the fear of fraud was the factor that discourages consumers from using PoS terminals
109
Locations Consumer Feel Comfortable Using Cards
110
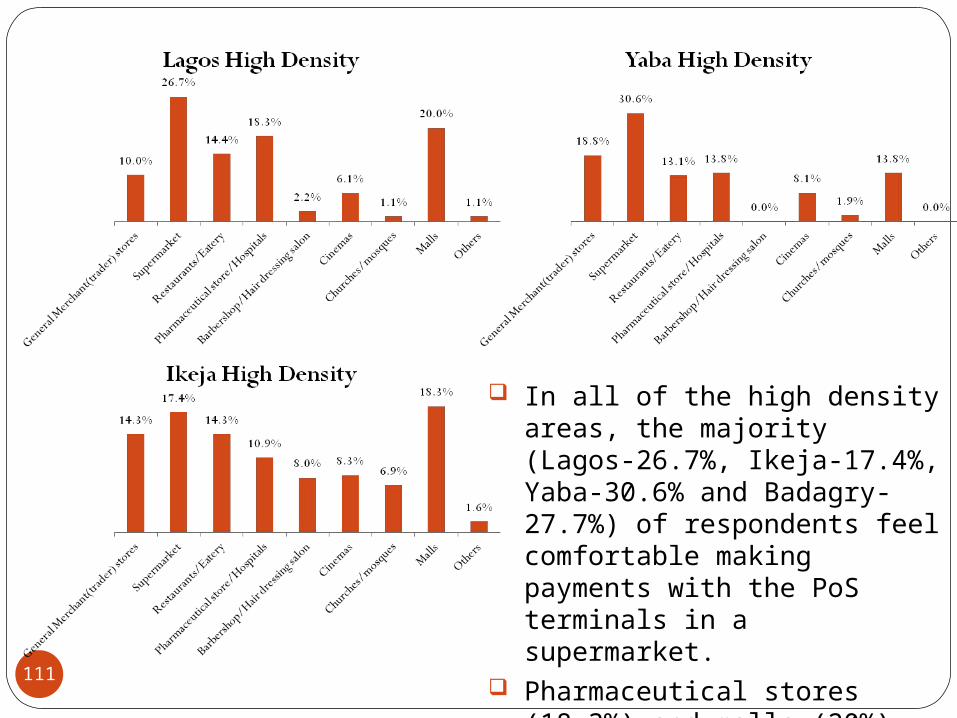
In all of the high density areas, the majority (Lagos-26.7%, Ikeja-17.4%, Yaba-30.6% and Badagry-27.7%) of respondents feel comfortable making payments with the PoS terminals in a supermarket.
Pharmaceutical stores (18.3%) and malls (20%) were preferred in the Lagos zone after supermarkets
111
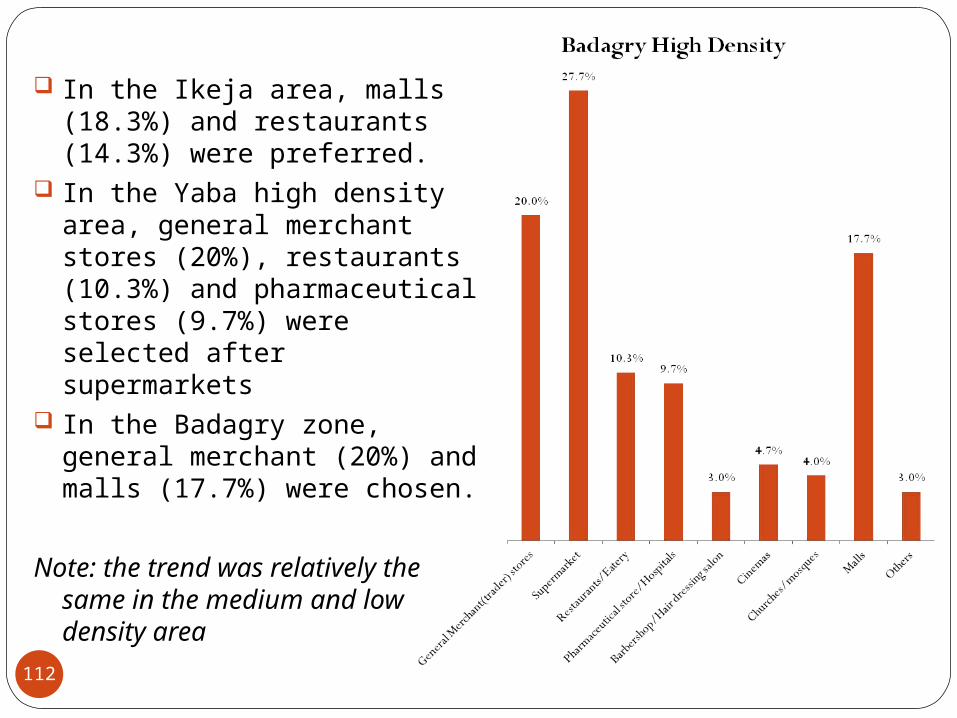
In the Ikeja area, malls (18.3%) and restaurants (14.3%) were preferred.
In the Yaba high density area, general merchant stores (20%), restaurants (10.3%) and pharmaceutical stores (9.7%) were selected after supermarkets
In the Badagry zone, general merchant (20%) and malls (17.7%) were chosen.
Note: the trend was relatively the same in the medium and low density area
112

Customer’s Insistence for Card Usage And Merchant’s
Change of Position
113
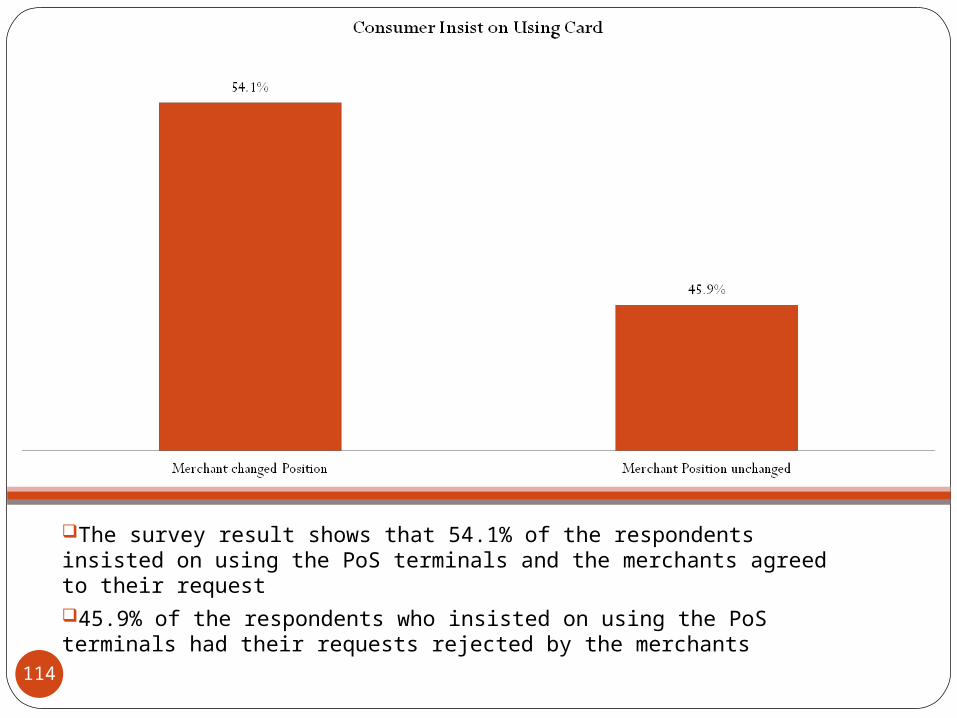
The survey result shows that 54.1% of the respondents insisted on using the PoS terminals and the merchants agreed to their request 45.9% of the respondents who insisted on using the PoS terminals had their requests rejected by the merchants
114

Conclusion
115

Conclusion
The potential for growth in the usage of PoS terminals in Lagos metropolis remains strong
With a population of over 16 million people, there are approximately 8 million card holders in Lagos state
Based on the aggregated data from the 6,776 survey sample, the study finds that:
116
ConclusionProfile of Merchants/End-Users
Most of the merchants with PoS terminals are general merchants or traders located mainly in open markets and neighborhood shops.
Over 60% of the stores and outlets are located less than 5 minutes walking distance from banks and ATMs
Though merchants accept cards and have PoS terminals for payment, the majority still prefer the cash payment method to other forms of payments (i.e. Checks, Cards and EFTs) and cash payment remains the most frequently used payment system
117
ConclusionWith regards to consumers, the majority were
fully employed and self employed Average income is between N20, 000 and
N100, 000 across the density areas (i.e. high, medium and low)
Banks and ATMs proximity to the consumer by walking is an average of 6 to 15 minutes from their place of work
Most consumers make several payments daily and weekly and prefer the cash payment option due to the challenges they often face when using PoS terminals
118

ConclusionMerchants without PoS terminals are also mostly
general merchants/traderslocated in open markets and shopping malls that
are within 2 to 5 minutes walking distance from banks and ATMs.
As expected the most preferred method of payment is cash and in some cases checks or bank drafts
Challenges / Perceived Obstacles to usage of PoS TerminalsTwo out of the three categories of respondents (i.e.
Merchants with PoS and Merchants without PoS terminals) identify basically the same challenges and perceived obstacles to the smooth operation of the PoS terminals
119

ConclusionThese obstacles are as follows according to priority:
Connectivity and network challenges24.5%
Transaction charges/charges to bank account18.9%
Consumers/merchants insistence to pay cash12.7%
Rejected transactions 11.8%Card reading/technical difficulties
11.3%Consumers/merchant lack of card/PoS 10.1%Access to after sales funds 6.6%Others 4.3%
Poor awareness of the PoS payment systems and benefitsLong transaction time/late transaction notification
120
ConclusionChallenges that deter consumers from making
use of the pos terminalsAccording to priority, factors that inhibit consumers’
usage of the card payment system include:Connection and network difficulties with the terminals Non-Availability of PoS terminals at merchants’
points/storesAttributed to the poor rate of deployment as
noticed by the merchants with PoSMerchants demand for cash
As a result of obstacles listed aboveLong transaction timeFear of fraud
Some consumers cited personal experiences of being debited twice
In some cases the terminals would reject the transaction, however the consumer receives a debit alert some hours after the unsuccessful transaction
121

RecommendationsAwareness Increased awareness of consumers will accelerate the adoption
of the PoS terminal and the card payment systemincluding the new electronic money and mobile payments
systems Collective efforts by all key stakeholders towards achieving
greater awareness via:Initial Stakeholder Road show across various key regionsPeriodic summits, workshops, seminars to enlighten and
keep targets informedMass media coverage via:
Print Media – billboards, newspapers, magazines, bulletins, publications
Digital Media – television, documentariesVoice Media – radio advertising, jingles in various local
languagesSocial Media – internet, web (facebook, twitter etc)Mobile/Vehicular Media – advertisements on mobile
vehicles122
Centralized Provider of PoS Terminals and Equipment
Maintaining a single or limited source of equipment manufacturers/type
This will simplify the deployment of PoS terminals and equipmentIt will also facilitate easy education for the
stakeholders (merchants, end-users and providers)
Recommendations
123

Improve Connectivity Our findings show that there is a low level of
coordination among banks, mobile operators, and existing payment networks
Inter-operability across provider solutions (mobile, financial institutions, networks) will be necessary to drive mass market adoption.
We suggest that NIBSS/CBN partner with mobile network operatorsCollaboration between the key regulators and mobile
network operators will bring about efficiencies in processes quick identification and resolution to network and
connectivity issues thus enhancing the merchants, end-users improved PoS
experience resulting in increased PoS adoption
Recommendations
124
Incentives In many new programs, incentives have played a major
role in attracting customersOur findings show that merchants and end-users across
the density areas are willing to adopt PoS usage irrespective of any incentive program
Despite these findings, incentives are suitable at this stage in order to encourage people and impress upon them the seriousness of implementing the cashless policy
We suggest that several promotions be put underway such as the ‘cash back’ promo as already adopted by GTBank
Suggested incentives for merchants and end-users include:Cash-Back PromotionsReward PromotionsLoyalty RewardsRaffle PromotionsCoupon/Discount Promotions
Recommendations
125

Pricing StrategyStakeholders must develop a pricing strategy
that promotes and encourages PoS adoptionCharges on provision of an electronic payment
system by a merchant should be similar and at a fair cost
The policy objectives must factor in the affordability for merchant and end-user access and adoption Some merchants in certain locations are price-
sensitive
Recommendations
126

Safety and Security of InformationMerchants and customers recognize the importance
of safety and security of information There is need for secure transaction platforms and
security of information cannot be compromisedCases of fraud or lapses in the system can have the
potential to undermine confidence in the use of the systemwhich will ultimately impact public perception.
Safeguarding transactions and client information is an imperative as a high level of security is requiredFraud prevention is required to encourage acceptance
and adoption of the electronic payment systems
Recommendations
127
Mobile Money is the Game ChangerMobile phone technology has reduced
communication costs in Nigeria to very low levelsThis transformation has increased teledensity
significantlyHowever, telco's are not allowed to lead
cashless policy implementationsThe high level of specification in roles and
responsibilities will limit innovation by banks, telco's and payment companies
Inter-operability across provider solutions (mobile, financial institutions, networks) will be necessary to drive mass market adoption
Recommendations
128

Next Steps
129
Next StepsWe suggest a follow-up integration survey in Lagos
State most importantly in the areas not covered by this surveyThis will help to further identify other cultural and
fundamental barriers to the adoption of the PoS Terminals
Popularisation of NIBSS role as PoS Terminal certification agency and regular spot checks of PoS Terminals in use at merchant points
There is need for a pilot survey in other key cities where the Cash-less policy will be introduced before implementation This will help to identify the necessary pre-
implementation steps to be taken; identify the trend and compare results with the Lagos density areas
This will help underscore the model to be adopted for each of the new locations
130

Thank You
131