ni43 101 report on - fireweed zinc: home · 2018-06-22 · i ni43‐101 technical report on the...
TRANSCRIPT

I
NI43‐101 Technical Report on
the Tom‐Jason Zinc‐Lead‐Silver
Project, Watson Lake & Mayo
Mining Districts
Yukon Territory, Canada
Centred near 63o 10’N, 130o
09’W NTS Map Sheet: 105O‐01Prepared for:
Fireweed Zinc Ltd.
2900‐595 Burrard Street
Vancouver, British Columbia
Canada V7X 1J5
Principal Author: Dennis Arne, P.Geo.
CSA Global Canada Geosciences Ltd.
Report Nº R341.2016 csaglobal.com
Effective Date: 31 January 2017

Tom and Jason Zn‐Pb‐Ag Project Yukon Territory, Canada
Report R341.2016 II
Report prepared for
Client Name Fireweed Zinc Ltd
Project Name/Job Code FWZNIR01
Contact Name George Gorzynski
Contact Title Director
Office Address 2900 – 595 Burrard Street, Vancouver, British Columbia, Canada
Report issued by
CSA Global Office Vancouver
Division Exploration
Street Address Suite 610 – 1155 West Pender Street
Postal Address Suite 610 – 1155 West Pender Street, Vancouver, British Columbia V6E 2P4
Phone +1 604 681 8000
Email [email protected]
Report information
File name R341.2016_FWZNIR01_NI43‐101reportV1.4.docx
Last edited 07/03/2017
Report Status Final
Author and Reviewer Signatures
Principal Author Dennis Arne, PhD
PGeo (BC)
RPgeo (AIG)
Signature:
Principal reviewer: Ian Trinder, M.Sc., P.Geo. (ON & MB)
Signature:
CSA Global Authorisation:
Felix Lee Director
Signature:
© Copyright 2017

Tom and Jason Zn‐Pb‐Ag Project Yukon Territory, Canada
Report R341.2016 III
Date and Signature Page
This Report titled “NI43‐101 Technical Report on the Tom‐Jason Zinc‐Lead‐Silver Project, Watson
Lake & Mayo Mining Districts, Yukon Territory, Canada Centred near 63o 10’N, 130
o 09’W NTS Map Sheet:
105O‐01” for Fireweed Zinc Ltd and dated January 31, 2017 was prepared and signed by the
following author:
“Signed and Stamped”
_________________________________
Dated at Vancouver, BC Dennis Arne, PhD, PGeo (BC), RPgeo (AIG).
January 31, 2017 Director and Principal Consultant
CSA Global Geosciences Canada Ltd
Report Effective Date:
January 31, 2017.
Tom and Jason Zn‐Pb‐Ag Project Yukon Territory, Canada
Report R341.2016 IV
Certificate
Certificate of Qualified Person – Dr. Dennis Arne
As a Qualified Person of this Technical Report covering the Project named as the NI43‐101 Technical
Report on the Tom‐Jason Zinc‐Lead‐Silver Project, Watson Lake & Mayo Mining Districts, Yukon Territory,
Canada Centred near 63o 10’N, 130
o 09’W NTS Map Sheet: 105O‐01, I, Dennis Arne do hereby certify that:
1. I am a Principal Consultant of CSA Global Geosciences Canada Ltd, and carried out this
assignment for CSA Global Geosciences Canada Ltd of Suite 610, 1155 West Pender Street,
Vancouver, British Colombia, Canada ([email protected])
2. The Technical Report to which this certificate applies is titled “NI43‐101 Technical Report on the
Tom‐ Jason Zinc‐Lead‐Silver Project, Watson Lake & Mayo Mining Districts, Yukon Territory,
Canada Centred near 63o 10’N, 130
o 09’W NTS Map Sheet: 105O‐01” and is dated January 31,
2017 (“the effective date”).
3. I hold a BSc (Hons), MSc, PhD and Graduate Diploma, and am a registered Professional Geologist
in good standing of the Association of Professional Engineers and Geoscientist of British
Colombia (#34686) and a Registered Professional Geoscientist of the Australian Institute of
Geoscientists (#10064). I am familiar with NI 43‐101 and, by reason of education, experience in
exploration and evaluation of hydrothermal deposits, including sediment‐hosted base metal
deposits, and professional registration, I fulfil the requirements of a Qualified Person as defined
in NI 43‐101. My experience includes more than 30 years in geology.
4. I personally visited the project that is the subject of this Technical Report between August 31 and
September 2, 2011 for a total of 3 days.
5. I am responsible for all sections of this Technical Report.
6. I am independent of the issuer as described in Section 1.5 of NI 43‐101.
7. I have had prior involvement with the Project that is the subject of this Technical Report through
a previous consulting engagement in 2011.
8. I have read NI 43‐101 and this Technical Report for which I am responsible has been prepared in
compliance with N1 43‐101.
9. As of the effective date of the Technical Report, to the best of my knowledge, information and
belief, the Technical Report contains all scientific and technical information that is required to be
disclosed to make the Technical Report not misleading.
Dated this 31st day of January, 2017.
“Signed and Stamped”
Dr. Dennis Arne, PGeo (BC), RPGeo (Aust)
Director and Principal Consultant ‐ Geochemistry
CSA Global Geosciences Canada Ltd.

Tom and Jason Zn‐Pb‐Ag Project Yukon Territory, Canada
Report R341.2016 V
Contents
Report prepared for .................................................................................................................................... II Report issued by .......................................................................................................................................... II Report information ...................................................................................................................................... II Author and Reviewer Signatures ................................................................................................................. II
Date and Signature Page .................................................................................................................III Certificate ....................................................................................................................................... IV Contents .......................................................................................................................................... V 1. Summary ...................................................................................................................................1 2. Introduction ..............................................................................................................................4 Issuer ........................................................................................................................................................... 4 Terms of Reference ..................................................................................................................................... 4 Sources of Information ................................................................................................................................ 4 Qualified Person Property Inspection ......................................................................................................... 4
3. Reliance on Other Experts .........................................................................................................5 4. Property Description and Location ...........................................................................................6 Property Location ........................................................................................................................................ 6 Property Description and Mineral Tenure ................................................................................................... 6 Property Agreements and Encumbrances ................................................................................................... 7 Environmental Liabilities ............................................................................................................................. 7 Permitting Considerations ........................................................................................................................... 8 First Nations Consultations .......................................................................................................................... 8 Other Significant Factors and Risks ............................................................................................................. 9
5. Accessibility, Climate, Local Resources, Infrastructure and Physiography ............................ 11 Topography, Elevation and Vegetation .....................................................................................................11 Access to Property .....................................................................................................................................12 Climate .......................................................................................................................................................13 Infrastructure ............................................................................................................................................13
6. History .................................................................................................................................... 17 Property Ownership ..................................................................................................................................17 Tom Property .........................................................................................................................................17 Jason Property .......................................................................................................................................17
Project Results – Previous Owners ............................................................................................................17 Tom Property .........................................................................................................................................17 Jason Property .......................................................................................................................................18
Historical Mineral Resource Estimates ......................................................................................................18 Production History .....................................................................................................................................20
7. Geological Setting and Mineralisation ................................................................................... 21 Regional Geology .......................................................................................................................................21 Stratigraphy ...........................................................................................................................................21 Magmatism ............................................................................................................................................25 Regional Tectonics and Structure ..........................................................................................................25
Prospect and Local Geology ......................................................................................................................25 Tom Deposit ..........................................................................................................................................25 Jason Deposit .........................................................................................................................................27
Regional Mineralisation .............................................................................................................................28 Property Mineralisation .............................................................................................................................29

Tom and Jason Zn‐Pb‐Ag Project Yukon Territory, Canada
Report R341.2016 VI
Tom Deposit ..........................................................................................................................................29 Jason Deposit .........................................................................................................................................31
8. Deposit Types ......................................................................................................................... 34 9. Exploration ............................................................................................................................. 37 2011 Surface Geochemical Programme ....................................................................................................37 Procedures .............................................................................................................................................37 Sampling ................................................................................................................................................38 Interpretation ........................................................................................................................................38
10. Drilling ................................................................................................................................. 41 2011 Drilling at the Tom Property .............................................................................................................41 Sampling ................................................................................................................................................41 Core Logging ..........................................................................................................................................41 Surveying ...............................................................................................................................................42
Significant 2011 Mineralised Drill Intervals ...............................................................................................42 Interpretation of 2011 Drill Results ...........................................................................................................44 True Thickness .......................................................................................................................................45 Mineralisation Orientation ....................................................................................................................45
11. Sample Preparation, Analyses and Security ....................................................................... 46 Pre‐2011 Sample Preparation, Analyses and Security ...............................................................................46 2011 Hudbay Drill Core Sample Preparation and Security ........................................................................46 2011 Drill Core Sample Analytical Method ................................................................................................47 2011 Drill Core Sample QA‐QC ..................................................................................................................47 Overview ................................................................................................................................................47 Analysis of QA‐QC Data .........................................................................................................................48
QA/QC Analysis Summary .........................................................................................................................50 Author’s Opinion on 2011 Sample Preparation, Security and Analytical Procedures ...............................50
12. Data Verification ................................................................................................................. 51 Site Visit .....................................................................................................................................................51 Drill collar locations ...............................................................................................................................51 Database verification .............................................................................................................................52 Collars ....................................................................................................................................................52 Downhole Surveys .................................................................................................................................53 Geology ..................................................................................................................................................53 Assay ......................................................................................................................................................53
13. Mineral Processing and Metallurgical Testing .................................................................... 54 2011 Metallurgical Testwork .....................................................................................................................54 Assumptions ..........................................................................................................................................54 Sample Selection ...................................................................................................................................54 Metallurgical Testing Procedures and Results .......................................................................................54 Other Factors .........................................................................................................................................55
14. Mineral Resource Estimates ............................................................................................... 56 15. Adjacent Properties ............................................................................................................ 57 16. Other Relevant Data and Information ................................................................................ 58 17. Interpretation and Conclusions .......................................................................................... 59 18. Recommendations .............................................................................................................. 61 19. References .......................................................................................................................... 63 Appendix 1 Listing of Claims .......................................................................................................... 66 Appendix 2 Glossary of Technical Terms and Abbreviations ........................................................ 78

Tom and Jason Zn‐Pb‐Ag Project Yukon Territory, Canada
Report R341.2016 VII
Figures
Figure 1. Location of the Tom and Jason properties (from Wells, 2012). ....................................................... 9 Figure 2. Tom and Jason claim groups (from Wells, 2012). ...........................................................................10 Figure 3. View of the Tom camp in middle distance (circled) taken in 2011 looking north down
Sekie Creek. ..................................................................................................................................11 Figure 4. Aerial view of the Jason property in the middle distance looking northwest. ...............................12 Figure 5. Pelly River barge near Ross River. ...................................................................................................13 Figure 6. Gravel airstrip at MacMillan Pass (circled) in middle distance looking north. ...............................14 Figure 7. Camp at the Tom property installed in 2011. .................................................................................14 Figure 8. 2011 GeoEye satellite image of the Tom camp and infrastructure (From Wells, 2012). ...............15 Figure 9. Regional geological setting and zinc‐lead‐silver deposits of the Selwyn Basin, including
the Tom and Jason deposits (from Goodfellow, 2007). ................................................................22 Figure 10. Geology of the MacMillan Pass region from Goodfellow (2007). ................................................23 Figure 11. Stratigraphy of the Selwyn Basin and Belt Purcell Group from Goodfellow (2007). ....................24 Figure 12. Geology of the Tom and Jason project areas from Magnall and others (2015) with
areas of Figures 13 and 14 outlined in blue boxes. ......................................................................26 Figure 13. Geology of the Tom deposit from Hudbay files. ...........................................................................27 Figure 14. Geology of the Jason deposit from Hudbay files. .........................................................................28 Figure 15. Stratigraphic reconstruction of the mineralisation facies (zones) at the Tom deposit
from Goodfellow (2007). ..............................................................................................................30 Figure 16. Preliminary Leapfrog model of the Tom West (left) and Tom East (right) Zones in plan
(A) and cross section A‐A’ (B) looking north. The green areas delineate zones where Pb>2.6% and the blue areas delineate zones where Zn>4%. .......................................................31
Figure 17. Stratigraphic reconstruction of the mineralisation facies (zones) at the Jason deposit from Goodfellow (2007). ..............................................................................................................32
Figure 18. Geological cross section of the Jason syncline (from Turner, 1991). ...........................................33 Figure 19. Conceptual models for SEDEX and MVT (Mississippi Valley‐type) Pb‐Zn deposits from
Goodfellow (2007). .......................................................................................................................35 Figure 20. Conceptual models for proximal (A) and distal (B) SEDEX deposits from Goodfellow
(2007)............................................................................................................................................36 Figure 21. Soil orientation line across the Tom West Zone (from Wells, 2012). ...........................................39 Figure 22. Soil orientation line across the Jason Main Zone (from Well, 2012). ...........................................40 Figure 23. Drill collar locations from 2011 drill program at Tom West (from Wells, 2012). .........................43
Tables
Table 1‐1. Proposed budget for Tom and Jason exploration ........................................................................... 3 Table 6‐1. Historical mineral resource estimates for the Tom and Jason deposits from Rennie
(2007)............................................................................................................................................19 Table 10‐1. Summary of 2011 drilling program (from Wells, 2012). .............................................................42 Table 10‐2. Significant drill intersections from the 2011 drilling program (modified from Wells,
2012). ............................................................................................................................................44 Table 11‐1. Summary of CRM performance for 2011 assays ........................................................................48 Table 11‐2. Summary of laboratory precision and bias from check assays for 2011 ....................................49 Table 13‐1. Summary of 2011 locked cycle test conditions and reagent consumption ‐ Tom West
drill core mineralisation ................................................................................................................55 Table 18‐1. Proposed budget for Tom and Jason exploration .......................................................................62
Tom and Jason Zn‐Pb‐Ag Project Yukon Territory, Canada
Report R341.2016 1
1. Summary
The Tom and Jason Project is in the MacMillan Pass area of western Yukon near the border with
the Northwest Territories, approximately 400 km northeast of Whitehorse. It consists of a total
of 427 claims covering 5,944 Ha, as well as a single surface lease comprising 120.7 Ha. All claims
are controlled by Hudbay Minerals Inc. (“Hudbay”) who recently optioned the project to
Fireweed Zinc Ltd. (the “Issuer”), a private company with plans to list on the TSX‐Venture
Exchange (“TSX‐V”).
Access to the site is by seasonal gravel road or by air, and there is minimal infrastructure
available in the region. The nearest population centre is at Ross River located about 200km to
the southwest.
The Tom and Jason Zn‐Pb‐Ag deposits are proximal vent SEDEX deposits formed during
Devonian rifting activity in the Selwyn Basin. They were subsequently folded during the
transition of the Pacific margin of North America from a passive to convergent plate margin.
There has been a significant amount of historical exploration on the Tom and Jason properties
commencing with the discovery of the Tom West Zone in 1951. This has resulted in the drilling
of 128 holes on the Jason property for a total of 37,924m and 212 holes on the Tom property,
for a total of 33,495m. In addition, an adit with approximately 3,423m of underground
development and a spiral decline were put into the Tom deposit to assist exploration and bulk
sampling. Exploration effectively ceased on the properties after 1992. There has been minimal
modern exploration on the properties since that time.
Hudbay Minerals Inc. commissioned a mineral resource estimate in 2007 (Rennie, 2007) that
reported 6.43Mt indicated resources at both Tom and Jason at 6.33% Zn, 5.05% Pb and 56.55g/t
Ag, and 24.55Mt inferred resources at 6.71% Zn, 3.48% Pb and 33.85g/t Ag. CSA Global have
done insufficient analysis to confirm these resource estimates as current and compliant with
NI43‐101. CSA Global and the Issuer are treating them as historical and as such they should not
be relied upon. The Author includes these historical estimates in this report because they
represent material historical information which has been previously publicly disclosed (see
Rennie (2007) in the Hudbay profile under www.sedar.com).
Exploration recommenced briefly in 2011 with the drilling of 11 new diamond holes for a total of
1,823m. These holes were drilled for metallurgical testing and in‐fill purposes in the Tom West
Zone. Five of the holes were twin holes that verify historical intersections, although there
appear to be minor discrepancies in the location of at least some of the Tom property historical
drill collars. Some of the Jason property collars appear to have a more significant locational error
of approximately 53m to the northwest, as determined from collar surveys of historical collar
locations in 2011 and comparisons with satellite imagery. Surveying to accurately locate the
location of these drill holes is included in the proposed budget of Section 18, Recommendations.

Tom and Jason Zn‐Pb‐Ag Project Yukon Territory, Canada
Report R341.2016 2
Issues impacting on the potential economic development of the Tom and Jason deposits include
the remoteness of the location and a lack of infrastructure except for the access road which will
need upgrading. Uncertainties associated with ongoing Native land claim negotiations, and as
such unresolved eventual title, remain a risk for future development of the properties although
this does not prevent the Issuer from carrying out exploration work on the properties.
The Tom and Jason properties are considered by CSA Global to be at an advanced stage of
exploration. CSA Global concludes that the Tom and Jason Project warrants additional
expenditures including a new phase of modern exploration. The main objectives of the
recommended work program are to upgrade the technical database so a new NI43‐101
compliant mineral resource may be estimated for both the Tom and Jason deposits and to carry
out exploration work toward discovery of additional high‐grade mineralization. This work will be
informed by the substantial work on the stratigraphy, structure and mineralisation of the
MacMillan Pass region undertaken by the Geological Survey of Canada after the earlier historical
exploration. The focus of this recommended exploration should be the identification of
additional mineralisation with the goal of defining high‐grade resources. At the same time, the
existing substantial historical drill hole database should be verified through a systematic re‐
sampling program of mineralised intervals in archived drill core, accompanied by a
comprehensive quality assurance and quality control program. The locations of historical drill
collars should be re‐surveyed. Additional twin holes may need to be drilled at both the Tom and
Jason deposits to verify the position of mineralisation in the current coordinate system if the
positions of historical drill collars cannot be confirmed. This verification work as well as mapping
and other field work should lead to the development of new geological models for both deposits
that can form a guide for further exploration.
A budget of C$700,000 is proposed for the 2017 field season as detailed in Table 1‐1. The budget
assumes that existing tracks and a fording at the site of the former bridge across the South
MacMillan River can be used to move a drill rig into position. Also included in the budget is
scope for an aerial survey of the properties in order to obtain an accurate digital elevation
model (“DEM”). A substantial geochemical budget has been included for a program of
systematically re‐sampling drill core to verify historical assays.
It is the opinion of the Author that the property is of sufficient merit that the recommended
budget as outlined represents a worthwhile and sensible work program if carried out by
qualified competent personnel. The project manager may make small adjustments to this
program and budget as circumstances require during the work.

Tom and Jason Zn‐Pb‐Ag Project Yukon Territory, Canada
Report R341.2016 3
Table 1‐1. Proposed budget for Tom and Jason exploration
Expense Category Estimates
Camp Management & Logistics $120,000
Geoscience equipment / Supplies / Consumables $70,000
General Transport & Shipping $20,000
Diamond Drilling (2,000m) $320,000
Geochemical Analyses $40,000
Metallurgical Tests $25,000
Aerial Topographic Survey $30,000
Surveying $15,000
Contractor Services $50,000
Project Air Support $10,000
Total: $700,000

Tom and Jason Zn‐Pb‐Ag Project Yukon Territory, Canada
Report R341.2016 4
2. Introduction
Issuer
This report has been prepared by CSA Global Canada Geosciences Ltd (“CSA Global”) for
Fireweed Zinc Ltd (“Issuer”), a private company registered in the Yukon Territory with corporate
offices in Vancouver, British Columbia, Canada.
Terms of Reference
CSA Global has been commissioned by the Issuer to provide a National Instrument 43‐101
compliant Technical Report on the Tom and Jason Project in the Yukon. The Issuer requires the
Technical Report as part of the listing requirements for Tier 2 mining companies on the TSX‐V.
Sources of Information
This report has been prepared by CSA Global based on information supplied to them by the
Issuer, much of which in turn was provided to them by Hudbay Minerals Inc. (“Hudbay”) and on
information from public sources referenced in Section 19 and elsewhere in this report. CSA
Global has taken reasonable steps to verify the information provided where possible, and
through their predecessor company, Revelation Geoscience Ltd (“Revelation”), is familiar with
the most recent exploration data and existing verification issues.
Qualified Person Property Inspection
The Qualified Person authoring this report undertook a three‐day site visit to the Tom and Jason
properties between August 31 and September 2, 2011 during the most recent drilling program
at the Project conducted by Revelation for Hudbay. There have been no material changes to the
project since this program and the Author confirmed this through discussions with the Issuer
and Hudbay, and has checked the Yukon Assessment Report Library online (link:
http://virtua.gov.yk.ca:8080/search/query?match_1=MUST&field_1=&term_1=105o&facet_ngp
=NTS+105O‐01&facet_date_1=201&theme=emr). As such the Author considers this site visit
current under section 6.2 of NI43‐101.

Tom and Jason Zn‐Pb‐Ag Project Yukon Territory, Canada
Report R341.2016 5
3. Reliance on Other Experts
CSA Global has relied on information provided to them by the Issuer on claim ownership and the
option agreement between themselves and Hudbay (Sections 4.2, 4.3 and 4.4). The claim
ownership information in this report was provided by the Issuer to the Author and is based on
written legal opinions for the Tom claims and the Jason claims by Austring, Fendrick & Fairman,
Barristers & Solicitors, of Whitehorse, Yukon, and dated January 17, 2017 (Austring, Fendrick &
Fairman, 2017a; Austring, Fendrick & Fairman, 2017b). The Issuer has informed the Author that
the Definitive Option Agreement between Hudbay and the Issuer is dated December 14, 2016
and has provided the Author with the terms of the agreement as reproduced in Section 4 –
Property Agreements and Encumbrances. CSA Global has not independently verified ownership
or mineral title beyond information that is publicly available or been provided by the Issuer.
Historical environmental permits have been reviewed and those that have expired have been
noted. The Issuer has confirmed to CSA Global that all necessary environmental and operation
permits for the project are either current and/or will be applied/re‐applied for (see Section 4‐
Permitting Considerations).
Tom and Jason Zn‐Pb‐Ag Project Yukon Territory, Canada
Report R341.2016 6
4. Property Description and Location
Property Location
The Tom and Jason project is in the MacMillan Pass area of the Yukon of Canada near the border
with the Northwest Territories (Figure 1). It is located approximately at latitude 63o 10’N and
longitude 130o 09’W on NTS map sheet 105O‐01, approximately 400km northeast of
Whitehorse, a major regional city, and 200km northeast of the community of Ross River, which
is the nearest settlement.
Property Description and Mineral Tenure
The Tom and Jason project consists of two historically distinct but contiguous properties/claim
groups (Figure 2). The Tom property/mining lease consists of a total of 144 claims covering
2295 Ha (Appendix 1) with an anniversary date of October 12, 2018 which can be extended. The
group also includes a surface lease comprising 120.68 Ha over the Tom deposits which expires
February 28, 2022 but can also be extended. The Jason property/claim group consists of a total
of 283 claims for an area of 3,528 Ha (Appendix 1) that are renewed on an annual basis, with a
current anniversary date of December 31, 2017 which also can be extended.
The Tom property and Jason property claims are held by Hudbay (Figure 2) and located in the
Watson Lake and Mayo Mining Districts.
Continued tenure to mineral rights on a lode mineral claim (termed a “quartz claim” in the
Yukon) is dependent upon work performed on the claim or a group of claims. When work has
been done on a claim and is being used for the renewal of that claim, a full report of the work
done must be submitted to the Mining Recorder Office. A renewal certificate will not be issued
until the report and/or survey has been approved for the value required. The Yukon Quartz
Mining Act (QMA) does not specify work to be performed, except in dollar terms. Renewal of a
quartz claim requires that C$100 of work be done per claim per year, based on the Schedule of
Representation Work outlined in the QMA. Where work is not performed, the claimant may
make a payment in lieu of work. The fee for payment in lieu is C$100 per claim per year plus C$5
for the certificate of work per claim per year. Work must be performed on every claim unless
groupings are filed. An application can be made to group adjoining claims; the maximum
number of claims per grouping is 750. Grouping allows work to be performed on one or more
claims and can be distributed to any or all other claims in the group. As such, annual work
requirements for the Jason claims total C$28,300 per year. The Tom claims are a mining lease
and are only subject to annual permit fees totaling $28,960 per year. In recent years, these work
requirements and fees have been waived by the Yukon government due to the staking
withdrawal in the region (described below under First Nations Consultations). The annual fee
for the 120.68 Ha surface lease on the Tom property is $2,311 per year.

Tom and Jason Zn‐Pb‐Ag Project Yukon Territory, Canada
Report R341.2016 7
Property Agreements and Encumbrances
The following information has been provided to the Author by the Issuer as described in
Section 3.
The Issuer executed a Definitive Option Agreement with Hudbay on December 14, 2016 to
acquire the Tom mining lease and Tom surface lease, the Jason quartz claims and all existing
permits and infrastructure. The total payment to acquire 100% of the project is C$1,000,000, to
consist of C$100,000 payable on signing of the Definitive Agreement (paid), a further C$150,000
payable upon listing on the TSX‐V, and another C$750,000 payable on exercise of the option.
The final payment will also include 15% of fully diluted shares in the Issuer at the time of
Exercise less any shares issued that relate to a project other than Tom‐Jason.
The term of the option is 24 months, but it can only be exercised after the first 12 months.
Minimum work commitments are C$1,000,000 over the two‐year option period, including a
minimum of C$250,000 in the first year.
The Jason quartz claims were purchased by Hudbay on August 3, 2006 from a consortium of
companies operating as MacPass Resources Limited. As per a royalty agreement dated August 3,
2006, the Jason property is subject to a 3% NSR royalty. As part of the original option
agreement, Hudbay also has the right to purchase, at any time, 1.5% of the NSR for C$1.25
million and the remaining 1.5% of the NSR for C$4.0 million. These obligations and rights will
pass to the Issuer upon exercise of the property option by the Issuer.
There is no NSR encumbrance on the Tom mining lease.
Environmental Liabilities
The lower adit on the Tom property was partially plugged in 2010 to flood the mine workings
and reduce the flow of acid mine drainage (“AMD”) from oxidation of sulphides in the mine
workings. A waste pile from underground development at Tom West has also been covered with
an impermeable barrier to reduce AMD from the site. The lower adit continues to make water
as designed and metal contents and other parameters of the discharge water are within
standards set in the current Type B water use licence (see Permitting Considerations below) (G.
Gorzynski, Personal Communication, January 2017).
Current environmental liabilities for the Project include on‐going monitoring of surface and
groundwater on the Tom property.
A preliminary environmental investigation of the Jason property in 2006 by Gartner Lee Limited
noted that several exploration boreholes below an elevation of 1,250m were discharging water.
Water samples from one of these boreholes and four samples of surface water exceeded the
Canadian Council of Ministers of the Environment (“CCME”) Aquatic Life guidelines for several
metals, including Cd and Zn. Elevated metal concentrations and lowered pH levels may reflect
natural groundwater discharge from the site, as the Earn Group sediments are regionally
Tom and Jason Zn‐Pb‐Ag Project Yukon Territory, Canada
Report R341.2016 8
elevated with respect to several metals, including Zn, Cd, Pb and Ag (Mackie et al., 2015). In
2015, a number of drill pads and collars at the Jason property were rehabilitated and holes
plugged with cement when ground conditions allowed it. Water still flows from some holes
where it was not possible to properly complete the cementing (G. Gorzynski, Personal
Communication, 2017).
Permitting Considerations
Exploration work is subject to the Mining Land Use Regulations of the Yukon Mining Quartz Act
and to the Yukon Environmental and Socio‐Economic Assessment Act (“YESAA”). A land use
permit must be obtained and YESAA Board approval issued before large‐scale exploration is
conducted.
A Class 3 land use permit for exploration activities on the Tom and Jason Properties (LQ00325)
under the Quartz Mining Act and Quartz Mining Land Use Regulations has been issued to
Hudbay and extended to September 21, 2021. A waste management permit issued in 2011 (81‐
029) has been extended to December 31, 2021.
Currently water use and discharge of water from the Tom adit are governed by a Type B water
use licence (QZ15‐060‐01) granted on July 24, 2015 and extended until December 31, 2020. The
discharge from the lower Tom adit has naturally elevated metals levels and has been the subject
of water quality monitoring a minimum of six times per year and reporting since 2001.
Continued efforts will be required to monitor compliance with the water licence.
Any potential future development of the Tom and Jason deposits will require an environmental
assessment under YESAA and a Yukon Mining Licence and Lease issued by the Yukon
Government. A preliminary environmental investigation was undertaken on the Jason deposit
by Gartner Lee Limited (Pearson, 2006) Additional permits will be required from the territorial
and federal governments to further develop the deposits. For example, development of mining
activities in the Yukon requires the issuance of a Type A water licence by the Yukon Water
Board.
First Nations Consultations
The Tom and Jason properties lie within an area of territorial claim by the Kaska First Nations
that has been withdrawn from staking (Ross River Area OIC 2013/224 and OIC 2013/60). The
Kaska have not reached a land claim settlement with the Yukon government, and so the terms
of any future development of the Tom and Jason deposits remain uncertain and will require
consultation with the Kaska and any other affected First Nation. However, the current staking
moratorium does not prevent exploration work to be carried out on existing claims.

Tom and Jason Zn‐Pb‐Ag Project Yukon Territory, Canada
Report R341.2016 9
Other Significant Factors and Risks
As of the effective date, CSA Global is unaware of any other significant factors and risks that may
affect access, title, or the right or ability to perform work on the Tom and Jason project.
Figure 1. Location of the Tom and Jason properties (from Wells, 2012).
Tom and Jason Zn-Pb-Ag Project
Yukon Territory, Canada
Other Significant Factors and Risks
As of the effective date, CSA Global is unaware of any other significant factors and risks that may
affect access, title, or the right or ability to perform work on the Tom and Jason project.
1\
IMM*fk
Old Crow
i«riOft
{I r"%
t
Otyr
\J:#no<Xy
\
°rTom-Jason Work Area
lyOottfQ\
J
/ VrmjKk.1
R/rtf
>«fruC&on Ml
v.
y i""N^Vjwistori l*# ^
)
White horse
OL__i' J«Jn
S
Kan*( '
'
rj H-CO
\l«>tt
Figure 1. Location of the Tom and Jason properties (from Wells, 2012).
Report R341.2016 9

Tom and Jason Zn‐Pb‐Ag Project Yukon Territory, Canada
Report R341.2016 10
Figure 2. Tom and Jason claim groups (from Wells, 2012).
Tom and Jason Zn-Pb-Ag Project
Yukon Territory, Canada
432000 434000 436000 438000 440000 442000 444000
>ys*
X e\\ \ " Jy,
rI o ">
/// /// /
I SkLJ/mJjV I
Vs-x) l V
bZ
\ % n^cT»si.»
• Jm & •• -yi i§ 1as
fI:s , ^<Z s ,
/
I ICSA ,J-- Camp Site
1ITSEgM+A
>yi. y \ vvTx II i
s
ST \VxYfDeposit
0 Camp
— Property Road
| | Airstrip
N HudBay Minerals
Canol Road
NAD83 UTM Zone 9
LJ~n \mm)r. \zJW\V>Xn
\W/c ibjyy.I 3ll1
myi v / rZ'Z':/rv;
\ ft^7//\V\9 Ji
" 5
-== - 2M1
432000 434000 436000 438000 440000 442000 444000
Figure 2. Tom and Jason claim groups (from Wells, 2012).
Report R341.2016 10
Tom and Jason Zn‐Pb‐Ag Project Yukon Territory, Canada
Report R341.2016 11
5. Accessibility, Climate, Local Resources, Infrastructure and Physiography
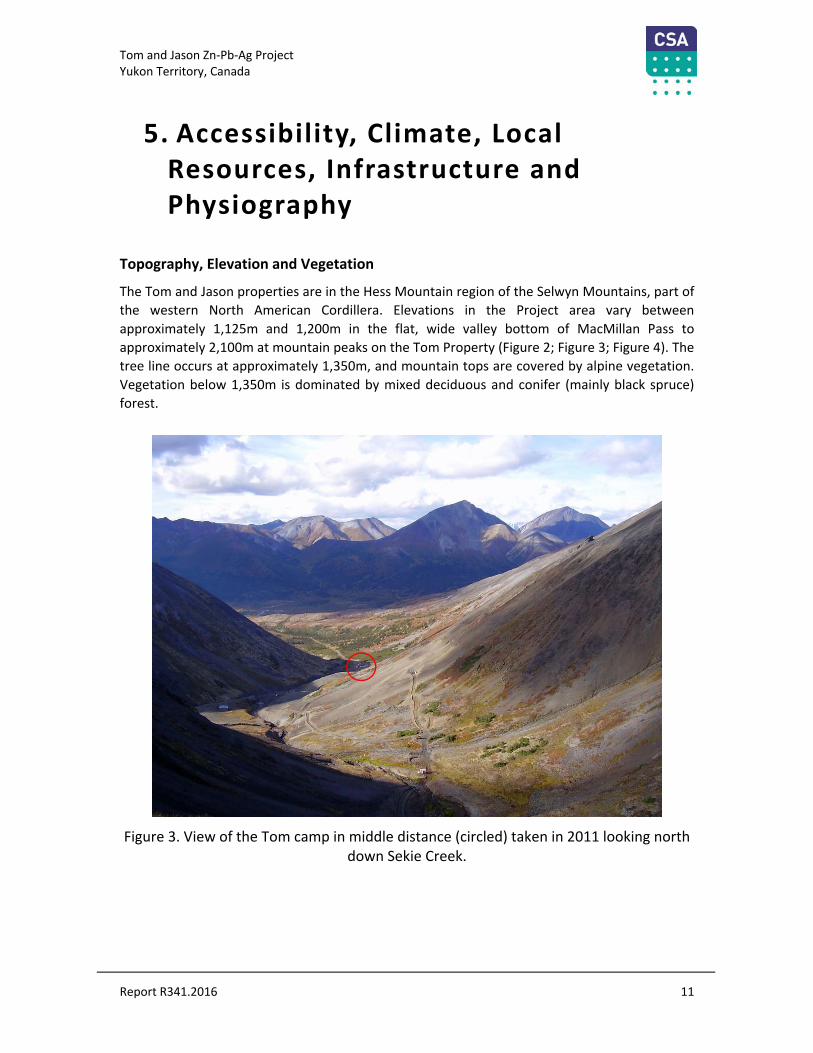
Topography, Elevation and Vegetation
The Tom and Jason properties are in the Hess Mountain region of the Selwyn Mountains, part of
the western North American Cordillera. Elevations in the Project area vary between
approximately 1,125m and 1,200m in the flat, wide valley bottom of MacMillan Pass to
approximately 2,100m at mountain peaks on the Tom Property (Figure 2; Figure 3; Figure 4). The
tree line occurs at approximately 1,350m, and mountain tops are covered by alpine vegetation.
Vegetation below 1,350m is dominated by mixed deciduous and conifer (mainly black spruce)
forest.
Figure 3. View of the Tom camp in middle distance (circled) taken in 2011 looking north down Sekie Creek.
Tom and Jason Zn‐Pb‐Ag Project Yukon Territory, Canada
Report R341.2016 12
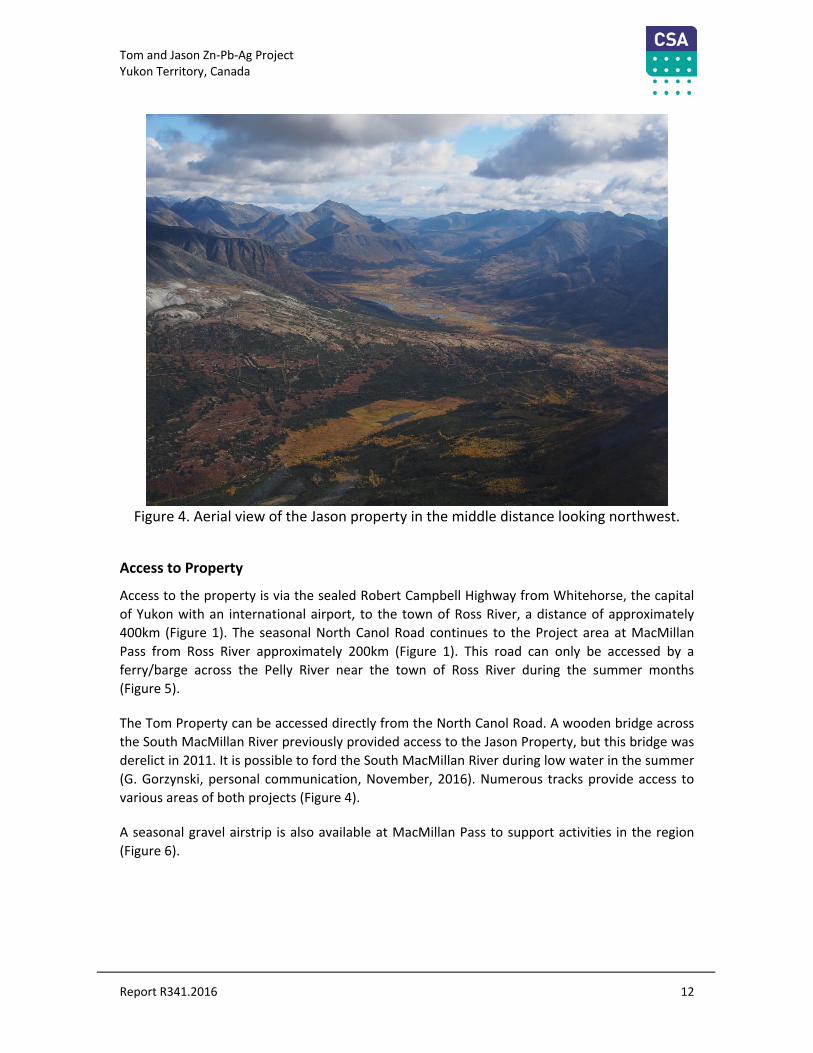
Figure 4. Aerial view of the Jason property in the middle distance looking northwest.
Access to Property
Access to the property is via the sealed Robert Campbell Highway from Whitehorse, the capital
of Yukon with an international airport, to the town of Ross River, a distance of approximately
400km (Figure 1). The seasonal North Canol Road continues to the Project area at MacMillan
Pass from Ross River approximately 200km (Figure 1). This road can only be accessed by a
ferry/barge across the Pelly River near the town of Ross River during the summer months
(Figure 5).
The Tom Property can be accessed directly from the North Canol Road. A wooden bridge across
the South MacMillan River previously provided access to the Jason Property, but this bridge was
derelict in 2011. It is possible to ford the South MacMillan River during low water in the summer
(G. Gorzynski, personal communication, November, 2016). Numerous tracks provide access to
various areas of both projects (Figure 4).
A seasonal gravel airstrip is also available at MacMillan Pass to support activities in the region
(Figure 6).

Tom and Jason Zn‐Pb‐Ag Project Yukon Territory, Canada
Report R341.2016 13
Climate
The climate of the region is sub‐arctic. Weather data collected between 1974 and 1982 at the
Mactung project located 14 km north of the Tom and Jason properties indicates an average
annual temperature of ‐7.7oC, ranging between seasonal averages of ‐30
oC in winter and +4
oC in
summer (Rennie, 2007). The average recorded annual precipitation for this period was 490mm,
with an average annual snowfall of 294cm.
The effective season for field exploration operations in the Project area runs from June through
late September or early October, depending upon when the Pelly River ferry commences and
ceases operations for the season. Mine operations in the region with supporting infrastructure,
can operate year‐round.
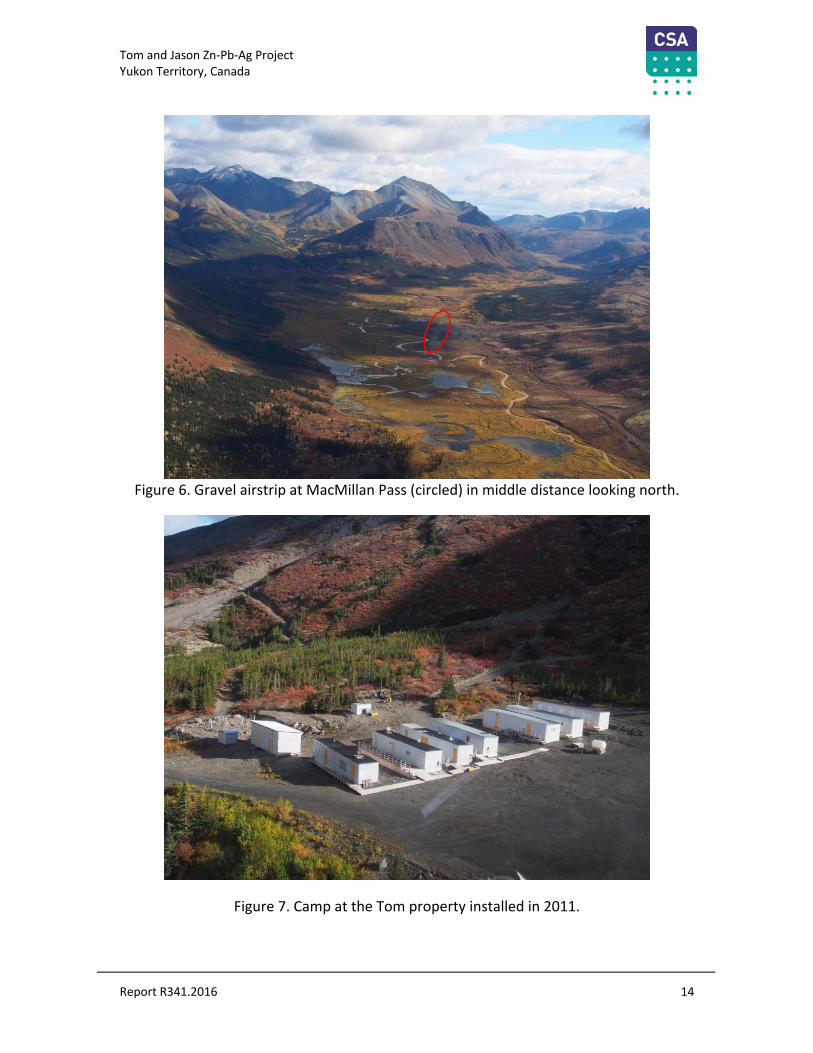
Infrastructure
There are no services available at the project site. Electricity must be generated locally by diesel
generators.
A 20‐person trailer camp was installed at the Tom property in 2011 (Figure 7), including a septic
system. All drill cores from both the Tom and Jason deposits are stored just upstream from the
Tom camp (Figure 8).
Figure 5. Pelly River barge near Ross River.
Tom and Jason Zn‐Pb‐Ag Project Yukon Territory, Canada
Report R341.2016 14
Figure 6. Gravel airstrip at MacMillan Pass (circled) in middle distance looking north.
Figure 7. Camp at the Tom property installed in 2011.
Tom and Jason Zn-Pb-Ag Project
Yukon Territory, Canada
~ , a !
Figure 6. Gravel airstrip at MacMillan Pass (circled) in middle distance looking north.
WF- ' -
.
F3
n
g? ^
sr .'ita3-.3
r
Figure 7. Camp at the Tom property installed in 2011.
Report R341.2016 14
Tom and Jason Zn‐Pb‐Ag Project Yukon Territory, Canada
Report R341.2016 15
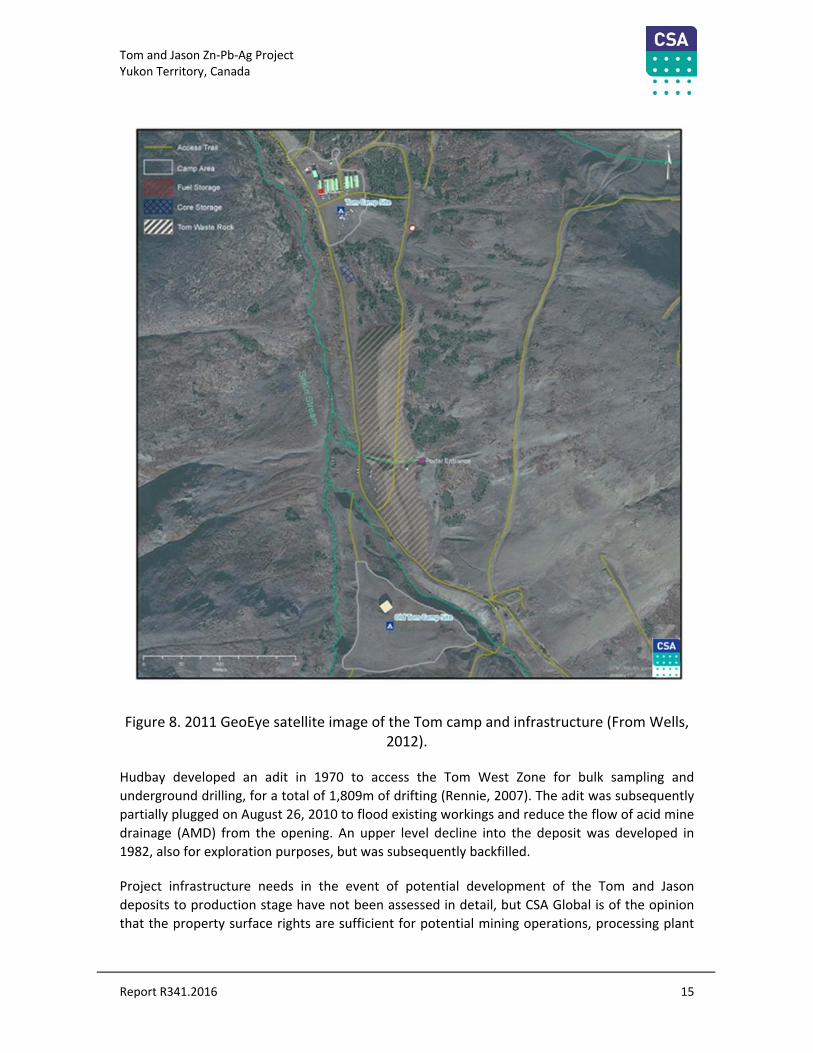
Figure 8. 2011 GeoEye satellite image of the Tom camp and infrastructure (From Wells, 2012).
Hudbay developed an adit in 1970 to access the Tom West Zone for bulk sampling and
underground drilling, for a total of 1,809m of drifting (Rennie, 2007). The adit was subsequently
partially plugged on August 26, 2010 to flood existing workings and reduce the flow of acid mine
drainage (AMD) from the opening. An upper level decline into the deposit was developed in
1982, also for exploration purposes, but was subsequently backfilled.
Project infrastructure needs in the event of potential development of the Tom and Jason
deposits to production stage have not been assessed in detail, but CSA Global is of the opinion
that the property surface rights are sufficient for potential mining operations, processing plant
Tom and Jason Zn‐Pb‐Ag Project Yukon Territory, Canada
Report R341.2016 16
sites and waste and tailings storage areas, provided necessary permits are obtained and a
satisfactory land claim settlement is reached with the Kaska First Nations. Water is readily
available, provided necessary permits can be obtained from the Yukon Water Board. The North
Canol Road would require upgrading and the construction of a bridge across the Pelly River and
South MacMillan River. Power needs would probably require installation of diesel or LNG
generators at the site. The nearest year‐round ice‐free port facilities are in Skagway, Alaska and
Stewart, British Columbia. While there is a heritage rail link between Whitehorse and Skagway
via the town of Carcross, there are no existing rail freight lines in the Yukon, meaning that metal
concentrates would likely be transported by road from the Project to the port at Stewart, a
distance of 1200km by road.
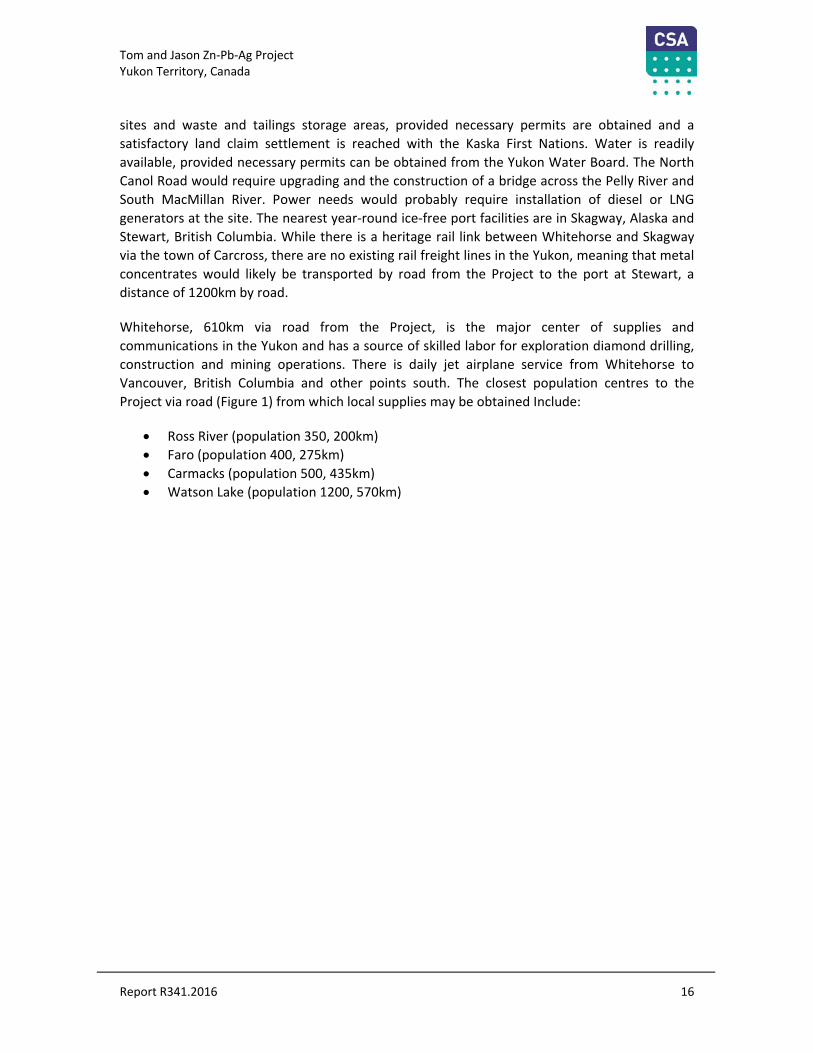
Whitehorse, 610km via road from the Project, is the major center of supplies and
communications in the Yukon and has a source of skilled labor for exploration diamond drilling,
construction and mining operations. There is daily jet airplane service from Whitehorse to
Vancouver, British Columbia and other points south. The closest population centres to the
Project via road (Figure 1) from which local supplies may be obtained Include:
Ross River (population 350, 200km)
Faro (population 400, 275km)
Carmacks (population 500, 435km)
Watson Lake (population 1200, 570km)

Tom and Jason Zn‐Pb‐Ag Project Yukon Territory, Canada
Report R341.2016 17
6. History
Property Ownership
Tom Property
The Tom property has been held continuously by Hudbay through various subsidiaries since its
discovery in 1951, although it was optioned to Cominco Ltd between 1988‐92. On December 14,
2016 Hudbay signed a Definitive Option Agreement for the Tom and Jason properties with the
Issuer as described in Section 4.
Jason Property
The following history of ownership is taken largely from Rennie (2007). The Jason claims were
first staked in 1971 by the Ogilvie Joint Venture. An interest in the property was obtained by Pan
Ocean Oil Ltd in 1979 before being acquired by Aberford in 1981. Aberford’s interest in the
property was transferred to Abermin Corporation (“Abermin”) in 1985, and thence to CSA Gold
Corporation (no connection to CSA Global). All parties transferred their interest to MacPass
Resources Ltd. and the property was then purchased by Hudbay in 2007 subject to a 3% NSR
(see Section 4 – Property Agreements and Encumbrances, for details).
Project Results – Previous Owners
Tom Property
A comprehensive history of exploration activity presented below is taken from Wells (2012). Key
events include:
discovery of the Tom West Zone in 1951 with commencement of drilling in 1952;
discovery of the Tom East Zone in 1953;
commencement of adit development in 1969 (lower adit) with 1,703m of lateral
development in 1970;
discovery of an extension to the Tom West Zone in 1979;
completion of a spiral decline in 1982 (upper adit);
optioning of the property to Cominco Ltd between 1988 and 1992;

Tom and Jason Zn‐Pb‐Ag Project Yukon Territory, Canada
Report R341.2016 18
partial plugging of the lower adit and covering of waste rock pile between 2007 and
2010;
201 drill holes totalling 31,672m completed between 1952 and 2007. Details of this
drilling are provided by Rennie (2007);
11 additional diamond drill holes totalling 1823m were drilled for metallurgical and in‐
fill drilling at the Tom property in 2011, followed by metallurgical testing; and
orientation surface geochemical soil sampling surveys on the Tom and Jason properties
in 2011.
There has been no material exploration work carried out on the Tom property since 2011.
Jason Property
The following summary of exploration is taken from Rennie (2007) and includes:
drilling of 87 holes, including 45 diamond and 33 rotary overburden holes, between
1974 and 1978;
drilling of 42 diamond drill holes between 1980 and 1982 for a total of 128 historical
diamond and rotary holes totalling 37,924m. Details of this drilling are provided by
Rennie (2007). No drilling has occurred on the property since 1991;
an option to Phelps Dodge Corporation of Canada between 1990 and 1992; and
purchase by Hudbay in 2006.
The Author is unaware of any material exploration on the Jason property undertaken since
1992.
A majority of the historical exploration work carried out at Tom and Jason was drilling with the
goal of defining economic resources.
Historical Mineral Resource Estimates
In 2007, Scott Wilson Roscoe Postle Associates Inc. (“RPA”) completed mineral resource
estimates on the Tom and Jason deposits for Hudbay in accordance to NI 43‐101 (Rennie, 2007).
Since those estimates were made, there has been no further drilling at Jason and 11 diamond
holes were drilled at Tom in 2011. The latter were either twin holes (5) sampled for
metallurgical testing or in‐fill holes (6) for the Tom West Zone.
The 2007 resource estimates are not in compliance with current NI 43‐101 standards with
respect to the Issuer and this Report. CSA Global and the Issuer are treating these resources as
historical estimates, not current mineral resources. The Author and Qualified Person has not

Tom and Jason Zn‐Pb‐Ag Project Yukon Territory, Canada
Report R341.2016 19
done the work necessary to verify the historical estimates as current estimates under NI 43‐101
and as such they should not be relied upon. The Author includes these historical estimates in
this report because they represent material historical information that has been previously
publicly disclosed (see Rennie (2007) in the Hudbay profile under www.sedar.com). These
historical resource estimates (Rennie, 2007) are presented in Table 6‐1. The Author is not aware
of any mineral resource estimates for the project after 2007.
The historical resource estimates are based on wireframe models of the mineralised zones
provided by Hudbay for Tom and constructed by Rennie (2007) for Jason. Block estimates for Pb,
Zn, Ag and Ba were calculated using inverse distance squared (IDW2) interpolation after
compositing the data to 1.52 m lengths. A search ellipse of 200m by 200m by 30 m was used for
grade estimation and a search ellipse 100m by 100m by 30m was used for resource
classification. A monetary cut‐off value of US$50 was applied to both the wireframe and block
model, based on the following price assumptions (in 2007 US dollars): $0.57/lb Zn, $0.35/lb Pb
and $7.00/oz Ag.
Bulk density data were not available for the Tom deposit. Bulk densities were estimated by
regression analysis of Zn, Pb, Ba and Fe data from 1,758 samples from the Jason deposit, for
which there were bulk density measurements, on the assumption that the relationship was
similar at Tom (Rennie, 2007).
Rennie (2007) recommended that bulk density measurements be determined for the Tom
deposit. Bulk densities were measured for selected samples from the metallurgical test holes
drilled in 2011 using the water immersion method. Composite specific gravities calculated for
entire mineralised intersections and from waste from three of the metallurgical test holes agree
closely with those estimated using the same regression equation obtained by Rennie (2007) for
the Jason deposit (Allen, 2012).
Table 6‐1. Historical mineral resource estimates for the Tom and Jason deposits from Rennie (2007).
Class Deposit Mt Zn (%) Pb (%) Ag (g/t)
Indicated Jason 1.45 5.25 7.42 86.68
Indicated Tom 4.98 6.64 4.36 47.77
Indicated Total 6.43 6.33 5.05 56.55
Inferred Jason 11.0 6.75 3.96 36.42
Inferred Tom 13.6 6.68 3.10 31.77
Inferred Total 24.6 6.71 3.48 33.85
Further in‐fill drilling to allow upgrade of the resource from inferred to indicated was also
recommended by Rennie (2007), along with geometallurgical domaining of the mineralisation.
Development of a more detailed geological model was also recommended for the Jason deposit.

Tom and Jason Zn‐Pb‐Ag Project Yukon Territory, Canada
Report R341.2016 20
In the case of both the Tom and Jason deposits, some capping of high grade Pb was also
recommended. Investigation of the low Ag grades at Jason was also suggested, and this could be
addressed through a re‐sampling and assay verification program.
CSA Global believe that a re‐sampling program of drill core from the Tom and Jason deposits, at
the rate of 5‐10% of mineralised intervals, is required to validate the assay data from these
areas prior to an update of the resource estimates. In addition, several twin diamond drill holes
may be required to validate the mineralised intersections and core recoveries from Jason and
the Tom East and Southeast Zones, depending on how reliably historical collars can located. The
metallurgical drill holes from Tom West are considered to have adequately verified the location
and grade of the mineralised zone in this area.
All drill cores from both the Tom and Jason deposits are stored just upstream from the Tom
camp (Figure 8). Most of the Tom deposit core is in a metal shed and the Jason deposit core was
transported and cross staked in piles beside the shed and protected by thick vinyl covers in
2015. Some limited core was donated to the Yukon government core library in Whitehorse
where it is accessible for viewing and, with permission, sampling. The core stored at the Tom
site was in good condition when last viewed in 2015 (G. Gorzynski, Personal Communication,
September, 2016).
Production History
There is no recorded production from the Tom or Jason deposits. An exploration adit and a
decline were developed for underground bulk sampling and exploration purposes at the Tom
deposit as described previously.

Tom and Jason Zn‐Pb‐Ag Project Yukon Territory, Canada
Report R341.2016 21
7. Geological Setting and Mineralisation
Regional Geology
The regional geology of the Tom and Jason properties has previously been described by Rennie
(2007), Goodfellow (2007) and Wells (2012). A summary is presented here from those sources.
Stratigraphy
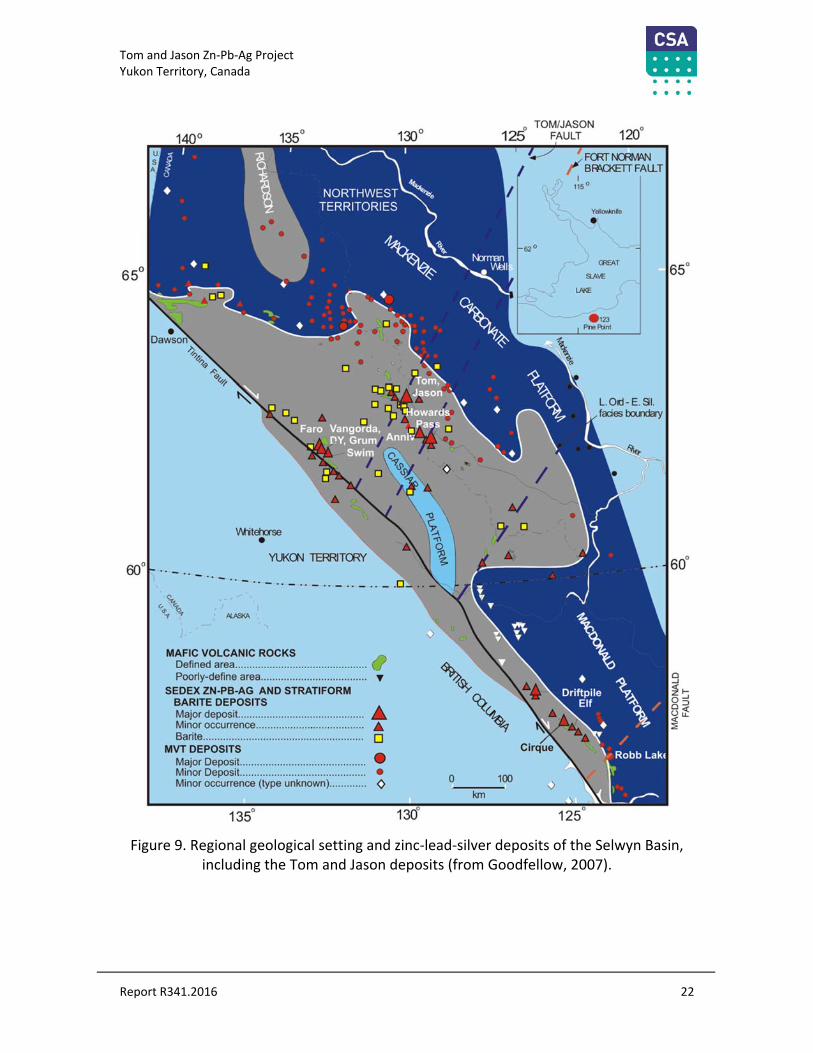
The Tom and Jason properties occur within the Selwyn Basin (Figure 9), a deep water marine
basin that was initiated off the ancestral coast of North America during the late Proterozoic with
deposition continuing through the early to middle Paleozoic. The Selwyn Basin consists of a
package of sedimentary rocks beginning with continentally‐derived sediments of the late
Proterozoic to Cambrian Windermere Supergroup. These units were followed in the late
Cambrian to Ordovician by carbonate rocks of the Rabbitkettle Formation, and then by deep
water cherts and shales of the Ordovician to early Devonian Road River Group. The Road River
Group is in turn overlain by chert, black shales and turbidite sediments of the Devonian to
Mississippian Earn Group, the host of the Tom and Jason deposits, as well as other Pb‐Zn‐Ag and
Ba mineralisation in the MacMillan Pass region (Figure 10).
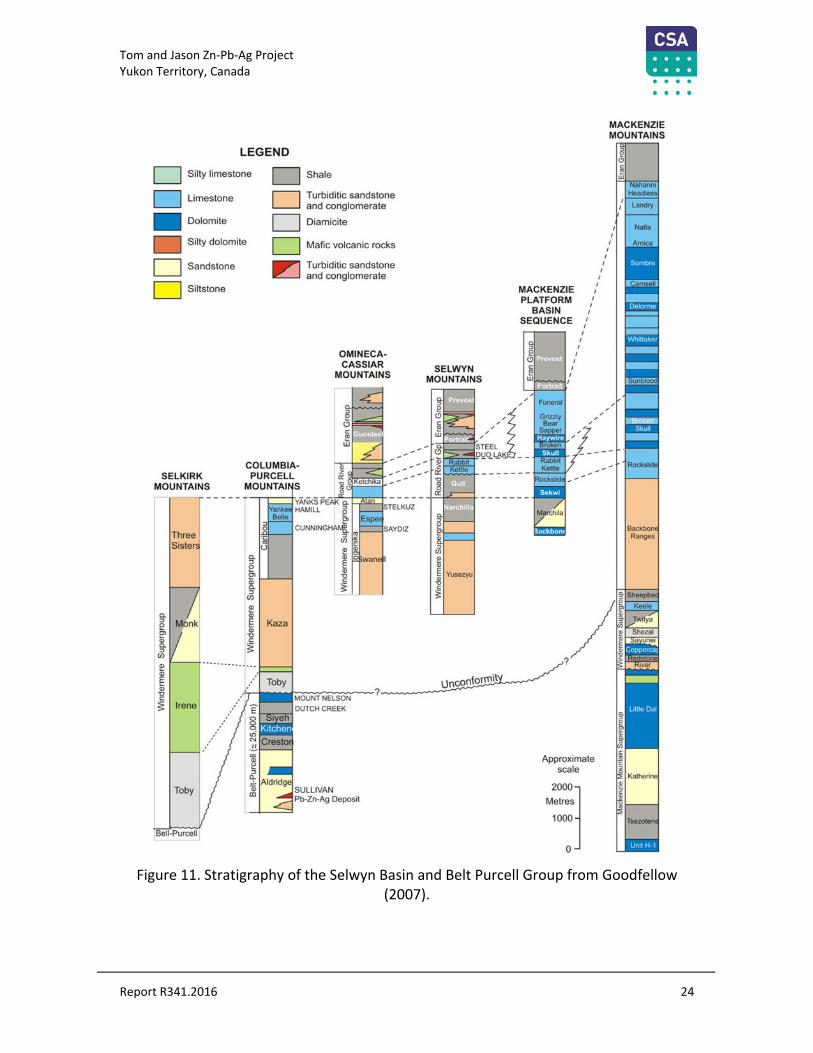
The stratigraphy of the Selwyn Basin and the adjacent Mackenzie carbonate platform that
existed to the north and east of the basin (Figure 9) is given in Figure 11. A detailed stratigraphic
description of the MacMillan Pass area is available from Abbott and Turner (1991).
Tom and Jason Zn‐Pb‐Ag Project Yukon Territory, Canada
Report R341.2016 22
Figure 9. Regional geological setting and zinc‐lead‐silver deposits of the Selwyn Basin, including the Tom and Jason deposits (from Goodfellow, 2007).
Tom and Jason Zn-Pb-Ag Project
Yukon Territory, Canada
D TOM/JASON
125 FAULT 120"130°135°140°
7T- 7IaI
, FORT NCRMAN
BFPCKETT FALLT
11S°,/NORTHWEST
|»1»1 [8]gYaltoAknle
L# -62°Normansa GREAT
65°m65° aAVE
LAKE
#123PnsRjinl
i• • ••Dawson
4v. %
^ ? KR'V
g? L.Oid-E.SI.fades boundary"n [*Ki
A
% ^
V o /yj D 4
A xA V9Witehorse
o
A\ %I % JYUKON TERRITORY
R- 60°60° I-
D^'V/ALASKA
.\"=MAFIC VOLCANIC ROCKS
Defined area
Poorly-define area
SEDEX ZN-PB-AG AND STRATIFORM
BARITE DEPOSITS
Major depositMinor occurrence
Barite
MVT DEPOSITS
Major DepositMinor DepositMinor occurrence (type unknown)
#
inc.
\ z [3
§3u 5
Driftpile%
\ /A %A
3A/
CirqueRobb Lakt
,0 1000 s>
km_
130° 125"135°
Figure 9. Regional geological setting and zinc-lead-silver deposits of the Selwyn Basin,
including the Tom and Jason deposits (from Goodfellow, 2007).
Report R341.2016 22

Tom and Jason Zn‐Pb‐Ag Project Yukon Territory, Canada
Report R341.2016 23
Figure 10. Geology of the MacMillan Pass region from Goodfellow (2007).
Tom and Jason Zn-Pb-Ag Project
Yukon Territory, Canada
/ NORTH7 A
IW
CRETACEOUS
Quartz monzomtq: I
CARBONIFEROUS TO TRIERSShale and sandstone^
T>„-Soffit
ENTRAIs
stEARN GROUP
PROVOST FORMATION
MISSISS1PPIAN
Shale and sandstone
PORTRAIT FORMATION
DEVONIAN
*:
9Shale, sandstone and conglomerate
Chert-pebble conglomerate
Mafic volcanic rocks
ROAD RIVER GROUP
ORDOVECIAN, SILURIAN AND EARLY DEVONIAN
Mudstone. sahle and chert
Fault \Thrust Fault
Boundary between major blocks
Stratiform Zn-Pb and barite deposits
A
GRIT UNIT
HADRYNIAN TO LOWER ORDOV1CIAN5 km
L JShale, sandstone and limestone
Figure 10. Geology of the MacMillan Pass region from Goodfellow (2007).
Report R341.2016 23
Tom and Jason Zn‐Pb‐Ag Project Yukon Territory, Canada
Report R341.2016 24
Figure 11. Stratigraphy of the Selwyn Basin and Belt Purcell Group from Goodfellow (2007).
Tom and Jason Zn-Pb-Ag Project
Yukon Territory, Canada• • * •
• • • •
MACKENZIE
MOUNTAINSB
LEGEND J
ILUSilly limestone
^ Limestone
Dolomite
I Silly dolomite
Sandstone
J Siltstone
| | Shale
Turbiditic sandstone
and conglomerate
Diamicite
J Mafic volcanic rocks
Turbiditic sandstoneand conglomerate
I Landry
NatlaI
It
t
/
Sombre
E/
/
t
tMACKENZIE
PLATFORM
BASIN
SEQUENCE '
i
t
i
/i
WhitlakerIi I
iOMINECA-
CASSIAR
MOUNTAINS
iProvost
UJ
SELWYN
MOUNTAINS
/
t
'
Funeral
I6 ^ /Gr ,v
P3 < • . io IUJ5
UJ
Haywire |l:reiTTil
Skull I
Portrait
[STEELbjNJji
ICOLUMBIA-
PURCELLMOUNTAINS
I Keltla
SELKIRK
MOUNTAINSteiChikg. Gull
OSekwi
YANKS PEAK /aSTELKUZ NnrehillaYflnkw HAMILL
r'£ i a-b
?
Belle
1 CUNNINGHAM BackboneRanges
iiYDIZ- AA.'-I-IlIIThree
SistersST! a "£
VU<S>
1 Itwane I
£ Yusezyur3-
7Monk
3 b" -
Keeler
-i A-
£ Kaza.
jl[
1/n r
St
EsEHQiQICoppf-rr.ii
F ; ,rv " 'TT!T Ri'.v
T
Uncorfotnjj!Toby5
?1 MOUNT NELSON
DUTCH CREEKIrene/ ? Little Dal
'erao
8 L-KitchenK
?CresH .
IApproximate
scale 5L'
Ktlhi nVr.
% Aldridge2000-t3Toby SULLIVAN
Pb-Zrt-Ag Deposit Metres ^2-2
1000-
Bell-Purcetl
Unit H-10 -1
Figure 11. Stratigraphy of the Selwyn Basin and Belt Purcell Group from Goodfellow
(2007).
Report R341.2016 24

Tom and Jason Zn‐Pb‐Ag Project Yukon Territory, Canada
Report R341.2016 25
Magmatism
Locally, mafic volcanic rocks were erupted during deposition of both the Road River and Earn
Groups, and coincide broadly with the formation of Pb‐Zn‐Ag and barite deposits in the basin.
The region was intruded by monzonite plutons during the waning stages of the Jurassic to
Cretaceous periods.
Regional Tectonics and Structure
The Selwyn Basin formed in a passive margin setting following a major phase of rifting in the late
Proterozoic to Cambrian. Gradual subsidence continued through the Paleozoic until the Antler
Orogeny in the Devonian, at which time intracontinental rifting was initiated in a back‐arc
graben setting in the MacMillan Pass region. Extension faults controlling the exhalation of
hydrothermal fluids were active at this time and are characterized by significant thickness
variations in stratigraphic units across the structures, consistent with growth faulting, and the
presence of sedimentary breccias, mass flow deposits (diamictites) and conglomerates
indicative of syn‐sedimentary faulting. The region was subject to compression during regional
east‐west shortening during the Jurassic to Cretaceous, resulting in likely re‐activation of normal
faults, folding and thrust faulting. The Macmillan Pass region occurs in the Central Block of the
MacMillan Fold Belt where south‐verging thrust faults and folds may be truncated by strike‐slip
re‐activation of Devonian normal faults (Abbott et al., 1991).
Prospect and Local Geology
The local geology of the Tom and Jason claim groups is presented in Figure 12. Detailed
descriptions are provided by Turner (1991) for the Jason deposit and Goodfellow (1991) for the
Tom deposit. Summary descriptions of both deposits are provided in Rennie (2007) and
Goodfellow (2007). The following descriptions are taken from those sources.
Tom Deposit
The Tom deposit is hosted by the Portrait Lake Formation of the Devonian Earn Group.
Specifically, sulphide mineralisation occurs within an informal unit called the Tom Sequence
(Goodfellow, 1991). The Tom Sequence is characterised by abrupt changes in sedimentary facies
and unit thickness, demonstrating the influence of syn‐sedimentary faulting. It consists of well
banded carbonaceous and radiolarian chert, with occasional sandier intervals, barite nodules
and pyrite laminae. It overlies sandy to silty laminated shales and siltstones of the MacMillan
Pass Member which are interpreted to have been deposited by deep water turbidites
(Goodfellow, 1991). The shales and siltstones are interbedded with occasional detrital chert
layers containing chert pebble conglomerates, and with mixed clast diamictite, both indicative
of submarine slumping near syn‐sedimentary faulting. The Tom Sequence is unconformably
overlain by fine grained clastic rocks of the informal Itsi Member. The sequence has been folded
about a steeply south to southeast plunging upright anticline (Figure 13). The Tom Sequence is

Tom and Jason Zn‐Pb‐Ag Project Yukon Territory, Canada
Report R341.2016 26
well exposed near the Tom deposit, although it is locally displaced along scree slopes and
disrupted by frost heave in the alpine areas.
Figure 12. Geology of the Tom and Jason project areas from Magnall and others (2015) with areas of Figures 13 and 14 outlined in blue boxes.

Tom and Jason Zn‐Pb‐Ag Project Yukon Territory, Canada
Report R341.2016 27
Figure 13. Geology of the Tom deposit from Hudbay files.
Historical drill hole collar locations are also shown.
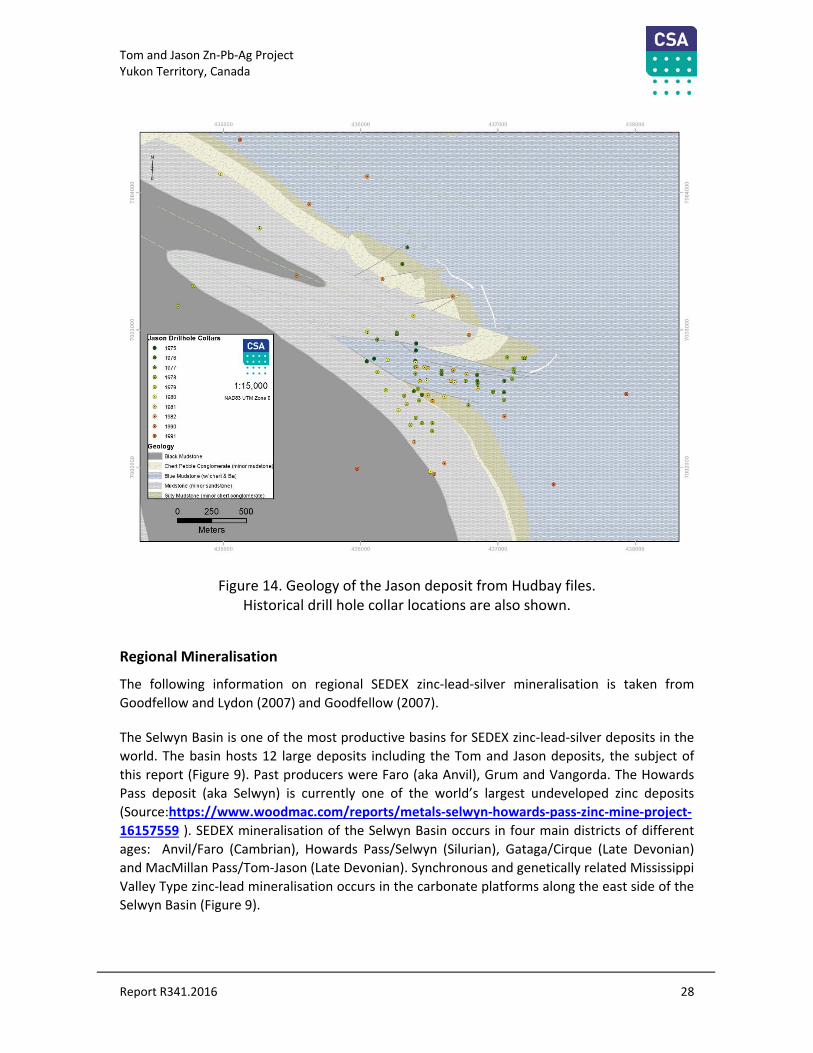
Jason Deposit
The Jason deposit is hosted by a Devonian sequence disrupted by the Hess Fault and folded into
a series of “upright tight west‐trending, shallowly east‐plunging folds” (Turner, 1991). The
position of the Jason deposit is controlled by the location of the Jason Fault, a syn‐sedimentary
growth fault that brings older rocks of the Road River Group and lower Portrait Lake Formation
of the Earn Group into contact with the MacMillan Pass Member and a stratigraphic package
considered to be the lateral equivalent of the Tom Sequence (Goodfellow, 1991). The latter
contains well developed sedimentary breccias, conglomerates and mass flow deposits
(diamictites) that thicken towards the position of the Jason Fault, consistent with syn‐
sedimentary fault movement. Bedrock exposure is good within the alpine areas, but the valley
bottoms and walls at lower elevations are concealed by a blanket of till that has inhibited
exploration.
Tom and Jason Zn‐Pb‐Ag Project Yukon Territory, Canada
Report R341.2016 28
Figure 14. Geology of the Jason deposit from Hudbay files. Historical drill hole collar locations are also shown.
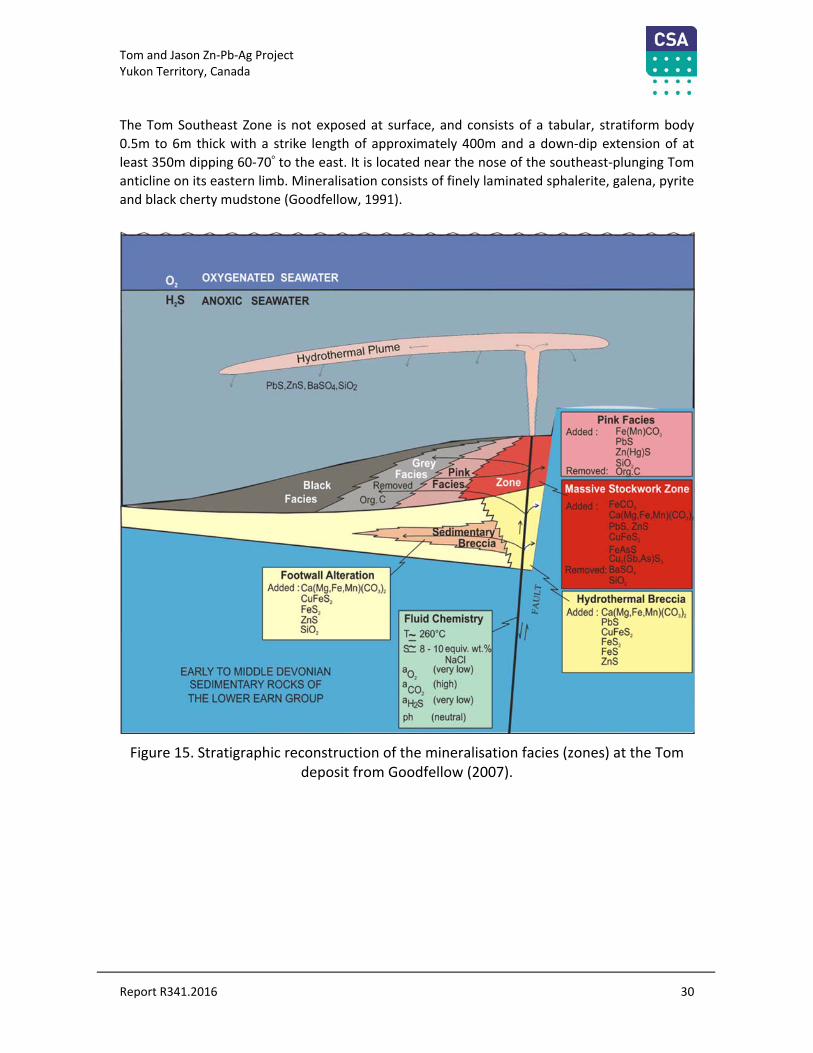
Regional Mineralisation
The following information on regional SEDEX zinc‐lead‐silver mineralisation is taken from
Goodfellow and Lydon (2007) and Goodfellow (2007).
The Selwyn Basin is one of the most productive basins for SEDEX zinc‐lead‐silver deposits in the
world. The basin hosts 12 large deposits including the Tom and Jason deposits, the subject of
this report (Figure 9). Past producers were Faro (aka Anvil), Grum and Vangorda. The Howards
Pass deposit (aka Selwyn) is currently one of the world’s largest undeveloped zinc deposits
(Source:https://www.woodmac.com/reports/metals‐selwyn‐howards‐pass‐zinc‐mine‐project‐
16157559 ). SEDEX mineralisation of the Selwyn Basin occurs in four main districts of different
ages: Anvil/Faro (Cambrian), Howards Pass/Selwyn (Silurian), Gataga/Cirque (Late Devonian)
and MacMillan Pass/Tom‐Jason (Late Devonian). Synchronous and genetically related Mississippi
Valley Type zinc‐lead mineralisation occurs in the carbonate platforms along the east side of the
Selwyn Basin (Figure 9).
Tom and Jason Zn‐Pb‐Ag Project Yukon Territory, Canada
Report R341.2016 29
Property Mineralisation
Detailed descriptions of the Jason and Tom deposits are provided by Turner (1991) and
Goodfellow (1991), respectively. The following descriptions of the Tom and Jason deposits have
been taken from summaries by Goodfellow (2007) and Rennie (2007).
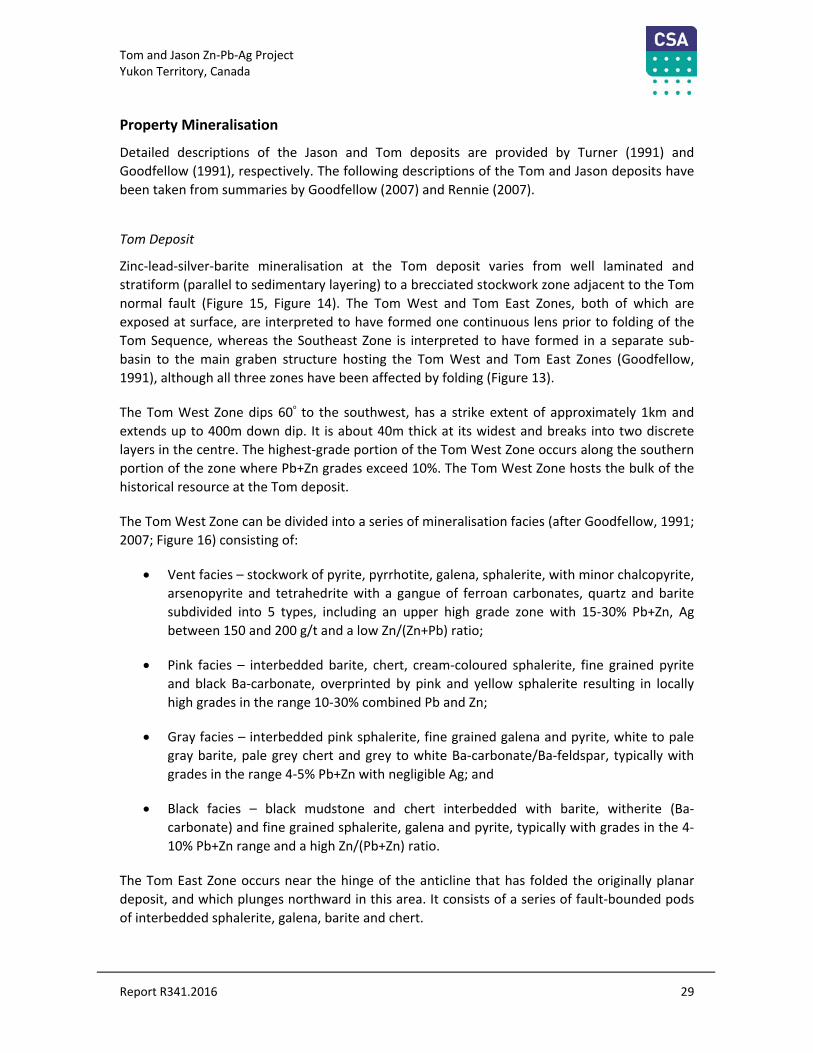
Tom Deposit
Zinc‐lead‐silver‐barite mineralisation at the Tom deposit varies from well laminated and
stratiform (parallel to sedimentary layering) to a brecciated stockwork zone adjacent to the Tom
normal fault (Figure 15, Figure 14). The Tom West and Tom East Zones, both of which are
exposed at surface, are interpreted to have formed one continuous lens prior to folding of the
Tom Sequence, whereas the Southeast Zone is interpreted to have formed in a separate sub‐
basin to the main graben structure hosting the Tom West and Tom East Zones (Goodfellow,
1991), although all three zones have been affected by folding (Figure 13).
The Tom West Zone dips 60o to the southwest, has a strike extent of approximately 1km and
extends up to 400m down dip. It is about 40m thick at its widest and breaks into two discrete
layers in the centre. The highest‐grade portion of the Tom West Zone occurs along the southern
portion of the zone where Pb+Zn grades exceed 10%. The Tom West Zone hosts the bulk of the
historical resource at the Tom deposit.
The Tom West Zone can be divided into a series of mineralisation facies (after Goodfellow, 1991;
2007; Figure 16) consisting of:
Vent facies – stockwork of pyrite, pyrrhotite, galena, sphalerite, with minor chalcopyrite,
arsenopyrite and tetrahedrite with a gangue of ferroan carbonates, quartz and barite
subdivided into 5 types, including an upper high grade zone with 15‐30% Pb+Zn, Ag
between 150 and 200 g/t and a low Zn/(Zn+Pb) ratio;
Pink facies – interbedded barite, chert, cream‐coloured sphalerite, fine grained pyrite
and black Ba‐carbonate, overprinted by pink and yellow sphalerite resulting in locally
high grades in the range 10‐30% combined Pb and Zn;
Gray facies – interbedded pink sphalerite, fine grained galena and pyrite, white to pale
gray barite, pale grey chert and grey to white Ba‐carbonate/Ba‐feldspar, typically with
grades in the range 4‐5% Pb+Zn with negligible Ag; and
Black facies – black mudstone and chert interbedded with barite, witherite (Ba‐
carbonate) and fine grained sphalerite, galena and pyrite, typically with grades in the 4‐
10% Pb+Zn range and a high Zn/(Pb+Zn) ratio.
The Tom East Zone occurs near the hinge of the anticline that has folded the originally planar
deposit, and which plunges northward in this area. It consists of a series of fault‐bounded pods
of interbedded sphalerite, galena, barite and chert.
Tom and Jason Zn‐Pb‐Ag Project Yukon Territory, Canada
Report R341.2016 30
The Tom Southeast Zone is not exposed at surface, and consists of a tabular, stratiform body
0.5m to 6m thick with a strike length of approximately 400m and a down‐dip extension of at
least 350m dipping 60‐70o to the east. It is located near the nose of the southeast‐plunging Tom
anticline on its eastern limb. Mineralisation consists of finely laminated sphalerite, galena, pyrite
and black cherty mudstone (Goodfellow, 1991).
Figure 15. Stratigraphic reconstruction of the mineralisation facies (zones) at the Tom deposit from Goodfellow (2007).

Tom and Jason Zn‐Pb‐Ag Project Yukon Territory, Canada
Report R341.2016 31
Figure 16. Preliminary Leapfrog model of the Tom West (left) and Tom East (right) Zones in plan (A) and cross section A‐A’ (B) looking north. The green areas delineate zones
where Pb>2.6% and the blue areas delineate zones where Zn>4%.
Jason Deposit
A stratigraphic reconstruction of the Jason deposit at the time of mineralisation is presented in
Figure 17. The Jason Main Zone is located on the northern limb of the east‐plunging Jason
syncline, while the Jason South Zone occurs on the southern limb (Figure 18). The South Zone
consists of two separate horizons whereas the Main zone is defined by a single horizon. These
horizons can be divided into several distinct mineralisation facies (zones), including (after
Turner, 1991):
Pb‐Zn‐Fe sulphide facies – massive, banded sphalerite‐galena and galena‐pyrite overlain
by debris flow deposits containing clasts of earlier deposited massive sulphides;
Barite‐sulphide facies – interbedded fine‐grained sphalerite, galena, barite, chert and
ferroan carbonate forming the bulk of the mineralisation at Jason;
Quartz‐sulphide facies – interbedded sphalerite, pyrite, quartz and carbonaceous chert
with quartz‐celsian (barium feldspar) bands in the lower lens;
Massive pyrite facies – massive pyrite beds interbedded with sphalerite, galena,
chalcopyrite, pyrrhotite and quartz located near the Jason Fault; and

Tom and Jason Zn‐Pb‐Ag Project Yukon Territory, Canada
Report R341.2016 32
Ferroan carbonate facies – massive beds of siderite and ankerite up to several metres
across with irregularly distributed galena, sphalerite, pyrrhotite, pyrite, quartz,
muscovite and pyrobitumen; spatially associated with a breccia pipe.
Figure 17. Stratigraphic reconstruction of the mineralisation facies (zones) at the Jason deposit from Goodfellow (2007).

Tom and Jason Zn‐Pb‐Ag Project Yukon Territory, Canada
Report R341.2016 33
Figure 18. Geological cross section of the Jason syncline (from Turner, 1991).
Tom and Jason Zn-Pb-Ag Project
Yukon Territory, Canada
tit*
A'A69
MAIN
ZONE> 0
11 22ELEVATION
in meters g65
:>8841
"V5 1 A
Iffli fm w,
if 1
-12QCU-
11& M
Abr L°„:I
1 N©I E> Bk B,MB I ! .<*„
1 1 feIs r :•••„Saw •."•••
Ki
Mi\m.m WQ\OL:l \'o\ YLo
Is IIi: mm
<4t. xg-1000
1UH eoV°
, O o o
I <,<=0°°°I Q O o
°0>«
&i
0>
i\ ml\s\ \ \ot\W\iM I W®M\ IIM\ wS
;
IPI SII illI I mif --3%eI 0 o" 0°lf o oof9 O ° O ei
I n °°o° ° ol
° 1° ° I
O O ° °o0 o o
°o%°0°°o° oX,
9JASONFAULT
g;
'°o/l Abx - A-800
*q!
&V8SHpvss
H i
PiSOUTH £> II
mZONE
87 ^ 0,51 16LH
PLra ISjoj jpQ
gBbtw|6tiAl- eoo
% si1JKMiW JT i3®'ri
i".
vi,*
if// f-yJ-;.0/i
V.-:
«•#1# Jf ^
r
fL«£>il-100
SvSi
V
/68
Figure 18. Geological cross section of the Jason syncline (from Turner, 1991).
33Report R341.2016

Tom and Jason Zn‐Pb‐Ag Project Yukon Territory, Canada
Report R341.2016 34
8. Deposit Types
The Tom and Jason deposits are examples of stratiform, sediment‐hosted, exhalative (“SEDEX”)
Zn‐Pb‐Ag‐Ba deposits (Figure 19; Goodfellow et al., 1993; Leach et al., 2005; Goodfellow et al.,
2007; Goodfellow, 2007). Historically the term SEDEX was first used in a report describing the
zinc‐lead‐silver deposits of the Selwyn Basin by Carne and Cathro (1982) and since then the term
has been used to describe these deposits worldwide. SEDEX deposits formed in rift basins
primarily in the late Paleoproterozoic and in the early Phanerozoic, with typical grades of 10%
combined Pb+Zn in producing mines. Mineralisation is interpreted to have formed at or close to
the seawater‐sediment interface either proximal or distal to submarine exhalative vents
localized along syn‐sedimentary (growth) faults (Figure 20). The more vent distal deposits are
therefore largely stratiform in nature in that the mineralised zones are concordant with
sedimentary layering, whereas proximal deposits show more complex metal zonation and
replacement textures. Proximal deposits are more closely linked spatially with syn‐sedimentary
feeder faults. A clear understanding of structural geology and stratigraphy are therefore
important aspects of exploration for SEDEX mineralisation. Metal ratios, such as Ag/Pb,
Pb/(Pb+Zn), Cu/((Zn+Pb), Zn/Fe and Zn/Ba increase towards the feeder faults providing a vector
towards the central and potentially higher grade parts of the hydrothermal system. Both the
Tom and Jason deposits are proximal SEDEX deposits (Goodfellow, 2007).
Other important guides to exploration for SEDEX mineralisation include (after Goodfellow,
2007):
the presence of footwall feeder zones involving silicification of the footwall
sedimentary package, brecciation, veining and trace element enrichments (Cu, Co, Ni,
Mo, As, Sb, Zn, Cd, Pb and Hg);
laterally extensive stratigraphic horizons equivalent to the main deposit lens with
elevated Zn, Cd, As and Hg;
hanging‐wall alteration indicative of a waning hydrothermal convection system,
characterized by elevated Ba, Zn and pyrite enriched in Co, Ni and Cu;
elevated total organic carbon, P and Zn in sediments on a regional scale indicative of
deep water, reduced (anoxic) marine conditions;
the presence of pyrite and/or pyrrhotite in vent complexes that may be detectable by
electrical and/or electromagnetic geophysical exploration methods; and
positive gravity anomalies that may be directly indicative of massive sulphide
concentrations at depth.
Many of the exploration guides described in this section were developed through extensive
research into the Tom and Jason deposits, as well as into other SEDEX deposits found within the
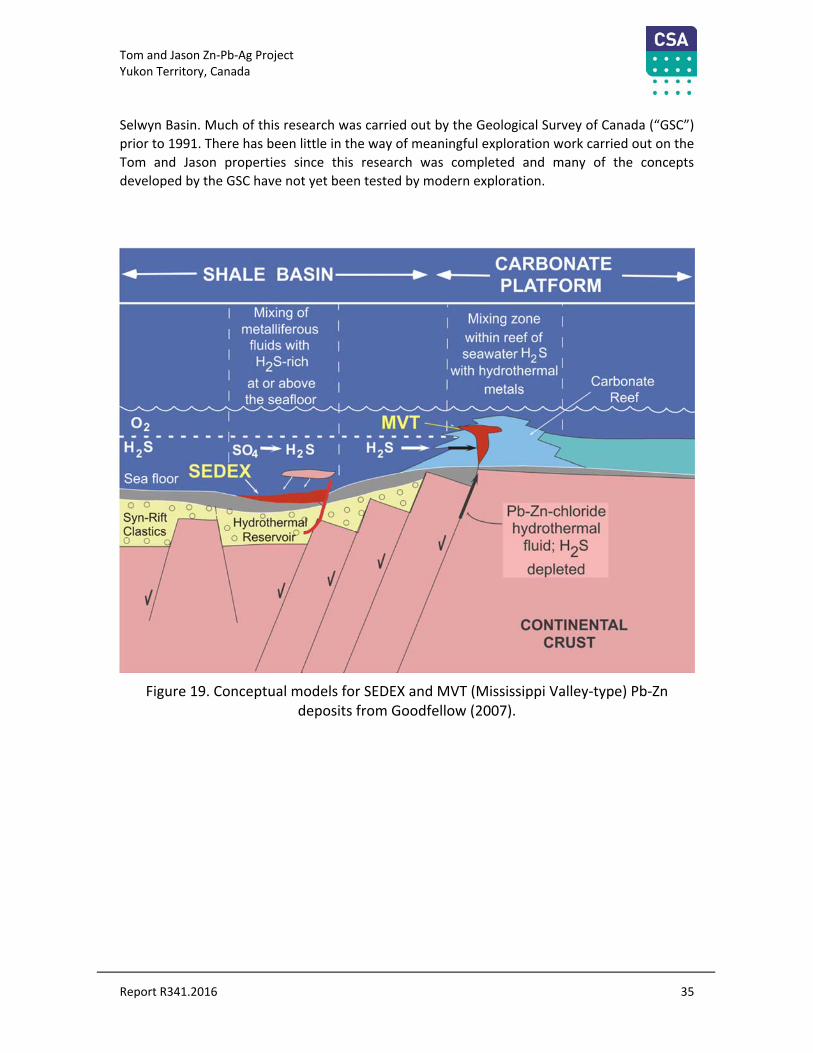
Tom and Jason Zn‐Pb‐Ag Project Yukon Territory, Canada
Report R341.2016 35
Selwyn Basin. Much of this research was carried out by the Geological Survey of Canada (“GSC”)
prior to 1991. There has been little in the way of meaningful exploration work carried out on the
Tom and Jason properties since this research was completed and many of the concepts
developed by the GSC have not yet been tested by modern exploration.
Figure 19. Conceptual models for SEDEX and MVT (Mississippi Valley‐type) Pb‐Zn deposits from Goodfellow (2007).
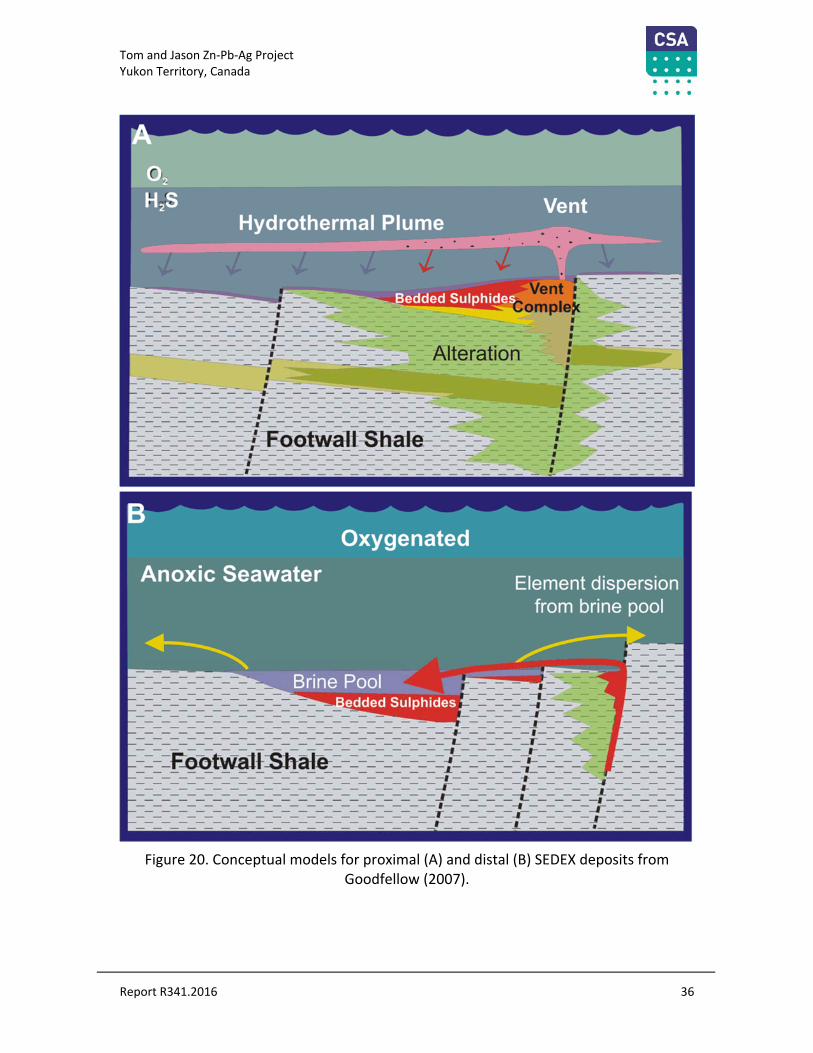
Tom and Jason Zn‐Pb‐Ag Project Yukon Territory, Canada
Report R341.2016 36
Figure 20. Conceptual models for proximal (A) and distal (B) SEDEX deposits from Goodfellow (2007).
Tom and Jason Zn-Pb-Ag Project
Yukon Territory, Canada
h2s VentHydrothermal Plume
»
\fVent !
edded Sulphid' l
omplejt
:—
Alteration
-f-
4
Footwali Shalei
f
Oxygenated
Anoxic Seawater Element dispersion
from brine pool
Brine Pool i:
edded SulphidesIs
J4-
TI I
Footwali Shale j
T "1
I»- I
ftr. 4r 1
Figure 20. Conceptual models for proximal (A) and distal (B) SEDEX deposits from
Goodfellow (2007).
Report R341.2016 36
Tom and Jason Zn‐Pb‐Ag Project Yukon Territory, Canada
Report R341.2016 37
9. Exploration
The Issuer has not conducted any exploration on the Tom or Jason properties. Section 18 of this
report makes recommendations for a large work program to be carried out by the Issuer.
The most recent exploration work at the Project was carried out in 2011 by Revelation on behalf
of Hudbay (Wells, 2012). The 2011 surface geochemical exploration is described in this section.
The 2011 diamond drill program is described in this Section 10 and 2011 metallurgical test
results are discussed in Section 13. The reader is referred to Section 6.2 for a brief history of the
historical exploration activity on the property prior to 2011.
2011 Surface Geochemical Programme
Procedures
As no soil sampling had been carried out on the Tom and Jason properties since the Tom deposit
was optioned to Cominco in 1988, two orientation surveys were undertaken in 2011 to evaluate
different approaches to sampling transported material over both the Tom (colluvium) and Jason
(till) deposits. This work was described in two internal memos from Revelation to Hudbay (Arne
2011a, 2011b).
Tom deposit
Approximately 2kg of unsieved fine‐grained talus material was collected across the Tom West
Zone. The material was sieved and centrifuged at ACME Laboratories in Vancouver (“ACME”) to
produce a ‐177 and a ‐2 micron fraction, respectively. A 0.5g aliquot of the two grain size
fractions was analysed by ICP‐MS following a modified aqua regia digestion.
Jason deposit
The Main Zone of the Jason Deposit appears to be partly covered by till below an elevation of
approximately 1300 m, although it is reported to outcrop, or sub‐crop in the area. Soil profiles
are well developed on till near the mineralised horizon and are complex in some areas where
mass movement of material down slope has buried earlier A1 (Ah) horizon layers. Samples were
collected from a single soil line across the Main Zone.
Four types of samples were collected at Jason:
1) A1 (Ah) horizon material for sieving to ‐80 mesh (‐177 micron) followed by modified aqua
regia digestion and analysis by ICP‐MS at ACME;
2) A soil sample collected approximately 20 cm below the base of the O‐horizon for Mobile
Metal Ion (“MMI”) analysis and soil pH by SGS Laboratories in Toronto;
Tom and Jason Zn‐Pb‐Ag Project Yukon Territory, Canada
Report R341.2016 38
3) A conventional C‐horizon soil for sieving to ‐80 mesh followed by modified aqua regia
digestion and analysis by ICP‐MS at ACME; and
4) Samples of recent twig growth from black spruce trees, which cover much of the Jason
property below an elevation of approximately 1,350 m. These samples had the needles
separated from the twigs, with the twigs dried, macerated and digested using nitric acid/aqua
regia, and then analysed by ICP‐MS by ACME.
Sampling
The 2011 sampling program was on an orientation basis to test for the best material and
analytical technique for future soil sampling on the Tom and Jason properties (Figure 21; Figure
22). Time constraints limited the length of the soil lines and the number of traverses that could
be conducted. The Jason orientation soil line was designed to place the Main Zone in the middle
of the traverse however, it was subsequently determined that the drill collars, and thus the
deposit wireframe used by Rennie (2007), were not in the correct positions. Adjustment of the
wireframe using a correction factor determined from several drill collars measured in 2011
placed the Main Zone at the beginning of the completed soil line.
Interpretation
MMI and C‐horizon aqua regia data from a ‐177 micron till fraction give a positive response at
Jason Main Zone. The best indicators of mineralisation are Pb, Zn, Ag and Ba for both digestions,
with As, Sb, Cu, Hg, Y and the REE also showing a positive response to buried mineralisation in
the MMI data. The interpretation of conventional aqua regia soil data is complicated by the
possibility of detecting trace metals scavenged onto secondary Fe oxides during this more
aggressive digestion, particularly in the case of Zn, As, Sb and Tl. Correction for this effect, either
using data normalisation or regression analysis is required for correct interpretation of the data.
The results from an aqua regia digestion of Ah‐horizon soils were generally negative once the
potential effects of scavenging by secondary Fe oxides in the soil were considered. Black spruce
twigs sampled at the Jason soil stations provide limited support for the MMI and C‐horizon soil
results. Given the limited distribution of black spruce trees at elevation and more consistent
results from the soil samples, the collection of soil samples is preferred over biogeochemistry
for future exploration in the area.
Data from colluvial soils across the Tom West Zone indicate clear responses for Pb and Ag at and
directly down‐slope from the sub‐cropping deposit. The best indications of the Tom West Zone
in the ‐80 mesh (‐177 micron) grain size fraction are raw Pb, Ag, S and Ba, as well as Zn, As, Sr
and Tl residuals following regression against Fe in the samples. A similar conclusion can be
drawn for Pb, Ag, S and Ba in clay separates (<2 micron) from the colluvial soil over Tom West.
The clay separates have the advantage of containing higher metal values and showing greater
anomaly to background contrast compared to the standard ‐80 mesh soil data.

Tom and Jason Zn‐Pb‐Ag Project Yukon Territory, Canada
Report R341.2016 39
Figure 21. Soil orientation line across the Tom West Zone (from Wells, 2012).
Tom and Jason Zn-Pb-Ag Project
Yukon Territory, Canada
Surface
ASample Location
West Zone Outcrop
Existing Trail
Shrub
iLeveled
Grass
Tree
I sr . o 1Rock
T::;o 02\ 0:
TSO-03
TSO-C4
\ao-ob
K1
\TSO-06 DUPLICATEjsO-06
flgj
"Mk>TSO-07•
TSO-09 :
% Fx
TSO- 10 DUPLICATE
® TSO-10y
T
P UTIJ-hACe3.Zi>fM.S\mcw*
Figure 21. Soil orientation line across the Tom West Zone (from Wells, 2012).
Report R341.2016 39

Tom and Jason Zn‐Pb‐Ag Project Yukon Territory, Canada
Report R341.2016 40
Figure 22. Soil orientation line across the Jason Main Zone (from Well, 2012).
Tom and Jason Zn-Pb-Ag Project
Yukon Territory, Canada
Surface JSQ-11
A<2* Sample Location
Ja&on Main Zona
Shrub
ILeveled
Grass Existing Trail
Tree
Rock JSO-10
y
JSO-09::
JSO-07
::
J SO
CO
JSO-05
• :/s
_ •: : 04CO//>/
00 00SO 0/. ///
//
so ss
/ soJS
//A//////,
-v /
0 0>yyyyyyy
J SO -J i //////AV>J::
10 30
Figure 22. Soil orientation line across the Jason Main Zone (from Well, 2012).
Report R341.2016 40

Tom and Jason Zn‐Pb‐Ag Project Yukon Territory, Canada
Report R341.2016 41
10. Drilling
The Issuer has not conducted any drilling on the Tom or Jason properties.
At total of 31,672m from 201 holes of historical drilling has been completed on the Tom
property (Figure 13) and 128 historic diamond and rotary holes totalling 37,924m have been
completed on the Jason property (Figure 14). Details of this drilling are provided by Rennie
(2007).
The most recent drilling at the Project was carried out in 2011 by Revelation on behalf of
Hudbay (Wells, 2012) and is described in this section. The reader is referred to Section 6.2 for a
brief history of the historical exploration activity on the property prior to 2011.
2011 Drilling at the Tom Property
An additional 11 holes were drilled in 2011 for a total of 1,823m drilled using an EF‐75‐2
diamond drill coring HQ diameter core and operated by Rodren Drilling (Figure 23; Table 10‐1).
These holes were designed to twin previous historical drill holes for metallurgical testing
purposes (TYK001 to TYK‐005) and to in‐fill some of the historical inferred resource areas for the
Tom West Zone defined by Rennie (2007; TYK‐006 to TYK‐011). In‐fill drilling resulted in 50m drill
spacing over a strike length of 250m in the core of the Tom West Zone (Wells, 2012). Existing
drill tracks were widened with a John Deere dozer to allow access for the rig.
Sampling
HQ core drilled and sampled for metallurgical testing was halved and one half cut in half again. A
quarter core sample was sent to ACME for assay. The half core was shipped to Hudbay in Flin
Flon, Manitoba for metallurgical test work. A quarter core section was retained in the core trays.
Samples for those drill holes not used for metallurgical testing were halved with the half core
sent for assay and the remaining half core section retained in the core trays.
Sample intervals were typically 1m but may be shorter where geological contacts were used to
define a sample interval.
Core Logging
All drill core from the 2011 program was logged using Hudbay lithological codes. Mineralogy was
recorded where it could be identified along with visual estimates of sulphide minerals. A rock
quality designation (“RQD”) was recorded for each core run, as were prominent structures.
Recoveries were generally excellent with complete core recovery in most runs, but there was
significant core loss in the mineralised zone for hole TYK‐003.

Tom and Jason Zn‐Pb‐Ag Project Yukon Territory, Canada
Report R341.2016 42
Surveying
Drill collars in 2011 were surveyed using a Trimble GeoExplorer 6000 GeoXH model DGPS
receiver. Down‐hole surveying in 2011 was performed using a multi‐shot Reflex instrument.
Significant 2011 Mineralised Drill Intervals
Significant mineralised intersections are presented in Table 10‐2 using weighted averages. The
metallurgical test holes, TYK‐001 to TYK‐005, twinned historical drill holes. The Zn, Pb and Ag
grades from the 2011 metallurgical test holes are comparable with the historical results and can
be used for verification purposes.
Table 10‐1. Summary of 2011 drilling program (from Wells, 2012).
Hole Number Depth (m) East (m) North (m) Elevation (m) Collar Az. Dip
TYK001 100.00 442053.7 7003743.5 1537.2 70 ‐65
TYK002 129.00 442053.5 7003743.4 1537.0 65 ‐85
TYK003 125.00 441916.1 7004015.9 1538.5 65 ‐80
TYK004 86.00 441973.0 7003907.8 1536.0 65 ‐78
TYK005 158.00 441804.8 7003964.2 1479.2 65 ‐45
TYK006 194.00 441803.6 7003963.5 1478.9 65 ‐65
TYK007 226.00 441803.1 7003963.4 1478.2 65 ‐80
TYK008 177.00 441825.6 7003908.6 1482.3 45 ‐50
TYK009 245.00 441825.2 7003908.3 1482.3 55 ‐80
TYK010 179.00 441866.8 7003866.2 1490.4 65 ‐55
TYK011 204.00 441866.7 7003866.5 1490.6 70 ‐78
Total: 1823.00

Tom and Jason Zn‐Pb‐Ag Project Yukon Territory, Canada
Report R341.2016 43
Figure 23. Drill collar locations from 2011 drill program at Tom West (from Wells, 2012).
Tom and Jason Zn-Pb-Ag Project
Yukon Territory, Canada
4420Q-t—
f ©
111I
%y!
60499ii
; \i
,igo
Ii
» y60500ii
! %- V J1' V
%+ L+1
I\ \it
*
V\
k
$ Vi%
TYK003
Kx © 9N ®
I% u
\ 00497
\\7-TYK006TYKD07
TVK005
\ \\ %\ %
old n^G^Bsiti\ ^1
\« \©
J;^ XX TYK008 TYK0092^
TYK004
I"- i
»* \;i
TYK010 TYK01.1
\ X
I1
\ \V\%\ % \X
%\ \J\ \Jks
" 60498\
XX 1
\
- -.x - ®
1 5JOTYK001 TYK002
•«
/ tt ' \/ y
.—%-2
i-1560 60495;
/iNew Road 2011
Existing Road
Historic DOH
2011 Drill Location
Camp Outline
==
\ri
\y —
\ 60496\sv
iy sCamp Area
I}
-r-
1 4 19QC
1:2,5002011 Tom Project - Drilling Locations UTW - I-JA033
i 7. 2
ZoneS'DOhvel«i(>n
Figure 23. Drill collar locations from 2011 drill program at Tom West (from Wells, 2012).
Report R341.2016 43
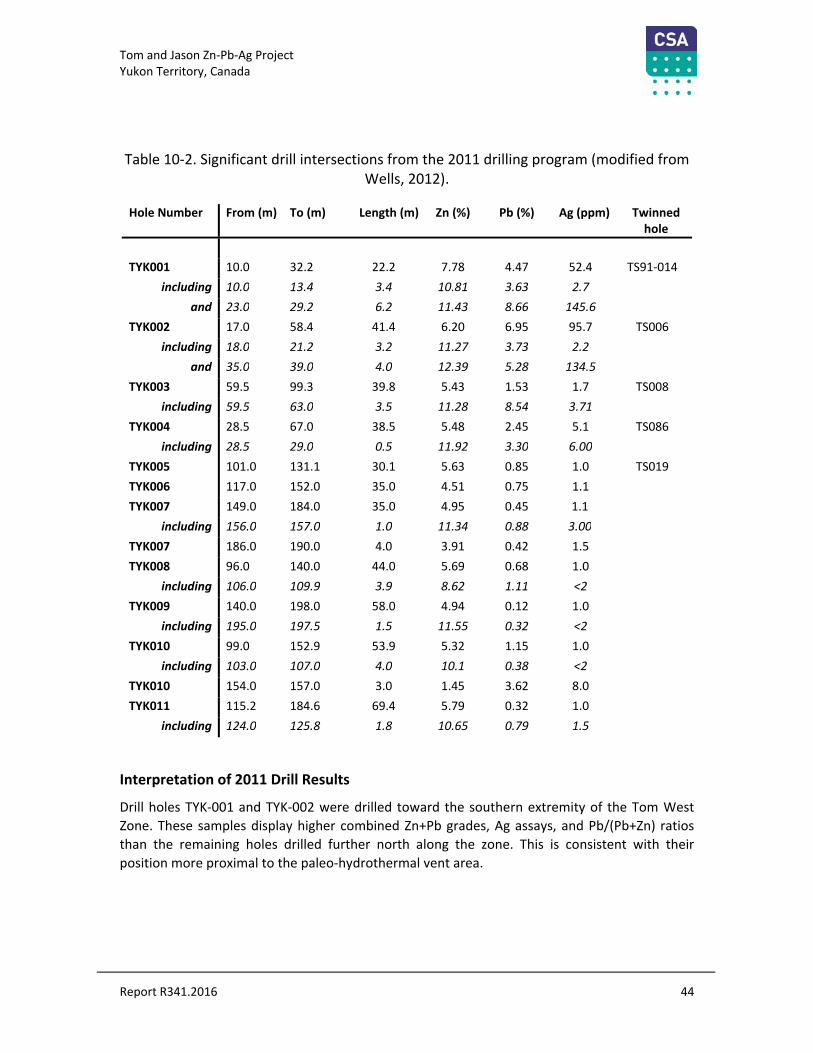
Tom and Jason Zn‐Pb‐Ag Project Yukon Territory, Canada
Report R341.2016 44
Table 10‐2. Significant drill intersections from the 2011 drilling program (modified from Wells, 2012).
Hole Number From (m) To (m) Length (m) Zn (%) Pb (%) Ag (ppm) Twinned hole
TYK001 10.0 32.2 22.2 7.78 4.47 52.4 TS91‐014
including 10.0 13.4 3.4 10.81 3.63 2.7
and 23.0 29.2 6.2 11.43 8.66 145.6
TYK002 17.0 58.4 41.4 6.20 6.95 95.7 TS006
including 18.0 21.2 3.2 11.27 3.73 2.2
and 35.0 39.0 4.0 12.39 5.28 134.5
TYK003 59.5 99.3 39.8 5.43 1.53 1.7 TS008
including 59.5 63.0 3.5 11.28 8.54 3.71
TYK004 28.5 67.0 38.5 5.48 2.45 5.1 TS086
including 28.5 29.0 0.5 11.92 3.30 6.00
TYK005 101.0 131.1 30.1 5.63 0.85 1.0 TS019
TYK006 117.0 152.0 35.0 4.51 0.75 1.1
TYK007 149.0 184.0 35.0 4.95 0.45 1.1
including 156.0 157.0 1.0 11.34 0.88 3.00
TYK007 186.0 190.0 4.0 3.91 0.42 1.5
TYK008 96.0 140.0 44.0 5.69 0.68 1.0
including 106.0 109.9 3.9 8.62 1.11 <2
TYK009 140.0 198.0 58.0 4.94 0.12 1.0
including 195.0 197.5 1.5 11.55 0.32 <2
TYK010 99.0 152.9 53.9 5.32 1.15 1.0
including 103.0 107.0 4.0 10.1 0.38 <2
TYK010 154.0 157.0 3.0 1.45 3.62 8.0
TYK011 115.2 184.6 69.4 5.79 0.32 1.0
including 124.0 125.8 1.8 10.65 0.79 1.5
Interpretation of 2011 Drill Results
Drill holes TYK‐001 and TYK‐002 were drilled toward the southern extremity of the Tom West
Zone. These samples display higher combined Zn+Pb grades, Ag assays, and Pb/(Pb+Zn) ratios
than the remaining holes drilled further north along the zone. This is consistent with their
position more proximal to the paleo‐hydrothermal vent area.

Tom and Jason Zn‐Pb‐Ag Project Yukon Territory, Canada
Report R341.2016 45
True Thickness
The core angles of bedding measured in the drill core generally vary from 25 to 75o to the long
core axis; therefore the thicknesses presented in Table 10‐2 are apparent thicknesses. The true
thicknesses of the intercepts will be significantly less for those holes that have intercepted
bedding at low angles to the long core axis.
Mineralisation Orientation
The orientation of the Tom West Zone is well established from previous drilling and 3D
modelling to strike approximately 155o relative to grid north and dip 60
o to the southwest
(Rennie, 2007). The reported 2011 intercepts are consistent with this orientation.
Tom and Jason Zn‐Pb‐Ag Project Yukon Territory, Canada
Report R341.2016 46
11. Sample Preparation, Analyses and Security
The Issuer has not conducted any exploration programs on the Tom or Jason properties.
Pre‐2011 Sample Preparation, Analyses and Security
Due to its historic nature, CSA Global has been unable to confirm the sampling protocols, core‐
handling procedures, or site security utilized on diamond drill programs prior to 2011. All drill
cores from both the Tom and Jason deposits are stored just upstream from the Tom camp
(Figure 8). Most of the Tom deposit core is in a metal shed and the Jason deposit core was
transported and cross staked in piles beside the shed and protected by thick vinyl covers in
2015. Some limited core was donated to the Yukon government core library in Whitehorse
where it is accessible for viewing and, with permission, sampling. The core stored at the Tom
site was in good condition when last viewed in 2015 (G. Gorzynski, Personal Communication,
September, 2016).
Pre‐2011 core samples were collected using a diamond saw or a blade splitter. Core samples
from both Tom and Jason were reportedly sent to a number of labs including Bondar Clegg and
Company Ltd., Chemex Labs Ltd. and Hudson Bay Mining and Smelting Co., Limited (Flin Flon,
Manitoba), prior to its acquisition by Hudbay (Rennie, 2007). CSA Global notes that the
analytical work carried out at the Hudson Bay Mining and Smelting lab was not independent as
it was performed by employees of the same company which was undertaking the exploration
drilling.
Assay certificates for historical analyses are available, although these have not been checked to
ensure that copies of original certificates are available for all samples in the database. No quality
assurance and quality control data are available for the pre‐2011 historic analyses beyond check
assays, although further detailed assessment of the historical assay certificates is required to
confirm this.
Despite this, it is CSA’s opinion that the historic sample preparation and analyses would have
been carried using industry standard procedures for that time. There is no reason to suspect
that analytical results contained in the Tom and Jason historic drill database are not
representative of in situ mineralisation and CSA Global considers the data adequate for the
purposes of this Report.
2011 Hudbay Drill Core Sample Preparation and Security
Sample preparation, analyses and security methods and protocols for the 2011 drilling program
carried out by Revelation on behalf of Hudbay (Wells, 2012) is described in this section.

Tom and Jason Zn‐Pb‐Ag Project Yukon Territory, Canada
Report R341.2016 47
Samples for analysis were collected into polypropylene bags. Security of samples prior to
dispatch to the analytical laboratory was maintained by limiting access of un‐authorized persons
to the site. Samples were stored in a secure storage area at the base camp on the Property.
Detailed records of sample numbers and sample descriptions provide integrity to the sampling
process. Labelled samples bags were packed in polypropylene rice bags and sealed for shipping.
Samples remained under the supervision of Revelation personnel while onsite at the Project and
during delivery to ACME Labs in Whitehorse, Yukon. ACME completed sample preparation
operations at their Whitehorse facility, and employ bar coding and scanning technologies that
provided complete chain of custody records for every sample. Master pulps were then shipped
by ACME to their Vancouver laboratory for analyses.
The ACME Whitehorse laboratory is certified to standards within ISO 9001:2008. The Vancouver
analytical facility is certified to standards within ISO 9001:2008 and at the time of the 2011
program was in the process of accreditation to ISO/IEC 17025:2005 from the Standards Council
of Canada (“SCC”). ISO/IEC 17025:2005 accreditation conforming to requirements of CAN‐P‐
1579 and CAN‐P‐4E was received in October 2011 for methods including the determination of
Ag, Cu, Pb and Zn by multi‐acid digestion with an atomic absorption spectrometry (“AAS”) finish.
ACME sample preparation procedures and analytical methods are routine and follow industry
best practices and procedures. CSA Global notes however that ACME’s ISO/IEC 17025:2005
accredited analytical methods do not include those utilized for the analysis of the 2011 drill core
samples.
ACME and its employees are independent from CSA Global, the Issuer, Hudbay and its
consultant Revelation. Hudbay and Revelation personnel, consultants and contractors were not
involved in the 2011 sample preparation and analysis.
2011 Drill Core Sample Analytical Method
Drill core samples from the Tom Zn‐Pb ‐Ag deposit were analysed by ACME following crushing
and pulverisation of the samples to >85% less than 75 microns. The pulps were analysed for a
suite of 24 elements using inductively‐couple plasma optical emission spectroscopy (“ICP‐OES”),
including base metals, following a hot aqua regia digestion (ACME group 7AR). Samples with
greater than 4% Pb or 20% Zn were re‐digested using a dilution to obtain data within range for
the ICP‐OES. Two samples with greater than 300 ppm Ag were also re‐analysed by fire assay.
Barium was determined by fused disc XRF (ACME group 8X – Ba). Gold was determined by aqua
regia digestion of a 15g charge (ACME group 3A01) as a preliminary check of Au levels, there
being few previous analyses. It was not intended to provide rigorous Au assay data.
2011 Drill Core Sample QA‐QC
Overview
Several in‐house certified reference materials (“CRM”) manufactured from Flin Flon, Manitoba
area base metal material and supplied by Hudbay were included with the core sample

Tom and Jason Zn‐Pb‐Ag Project Yukon Territory, Canada
Report R341.2016 48
submissions. These were A5 (7 samples), B5 (7 samples), E5 (7 samples) and the base metal
blank F6 (42 samples). Because these samples are not matrix‐matched to the sediment‐hosted
base metal deposit at Tom, two additional Pb‐Zn‐Ag CRMs manufactured from base metal
material from the Mt. Isa district in Australia were purchased from Ore Research & Exploration
and included in the sample submission – Oreas 133a (6 samples) and 134a (9 samples). In
addition, data for two ACME internal CRMs, Oreas 131b (27 analyses) and Geostats GBM997‐6
(19 analyses) were also assessed. Oreas 131b is a low‐grade Pb‐Zn‐Ag CRM made from the same
material as Oreas 133a and 134a, and GBM997‐6 is a high‐grade Pb‐Zn CRM.
Analysis of QA‐QC Data
A summary of CRM performance is provided in Table 11‐1. Samples with a bias and no failures
are considered to lie mainly within 2 standard deviations of the calculated mean for the CRM
(i.e. the expected value). A failure is taken to be any analysis that lies more than 3 standard
deviations away from the expected value, or two consecutive analyses with the same bias (i.e.
positive or negative) more than 2 standard deviations from the expected value.
Table 11‐1. Summary of CRM performance for 2011 assays
CRM Number Pb Zn Cu Ba Ag
HBMS A5 7 n/a Positive bias Negative bias n/a n/a
HBMS B5 7 n/a Positive bias Negative bias n/a n/a
HBMS E5 7 Acceptable Positive bias Excellent n/a Positive bias
HBMS F6 42 No failures 1 failure No failures n/a No failures
Oreas 133a 6 Negative bias Acceptable Negative bias 2 failures 6 failures; positive bias
Oreas 134a 9 1 failure 3 failures 2 failures; positive bias
3 failures 1 failure; positive bias
Oreas 131b 27 6 failures; negative bias
Acceptable but with drift
Not assessed Not assessed 9 failures; positive bias
GBM997‐6 19 1 failure; negative bias
Negative bias n/a n/a n/a
n/a = not applicable
The Hudbay CRM F6 is not an ideal blank material because the material is already pulverized and
thus does not pass through the crushing and pulverizing stream at the laboratory. Therefore, the
blank tests only for laboratory contamination during digestion and analysis. Aside from a single
instance of probable Zn cross contamination, the results are acceptable when the data are
filtered to remove all data within an order of magnitude of the lower limit of detection.
Laboratory precision has been assessed through an assessment of pulp duplicate analyses
provided by ACME. This estimate of laboratory precision does not include any variance
introduced during the sample preparation stages, and assesses only the combined effects of
sub‐sampling the final pulp, sample digestion and instrumental uncertainties. The analysis used
the square root of the average relative variances for individual duplicate pairs (relative standard
deviation = RSD; RMS method of Stanley and Lawie, 2007). The data were filtered to remove any
values within an order of magnitude of the lower limit of detection, as these data are inherently
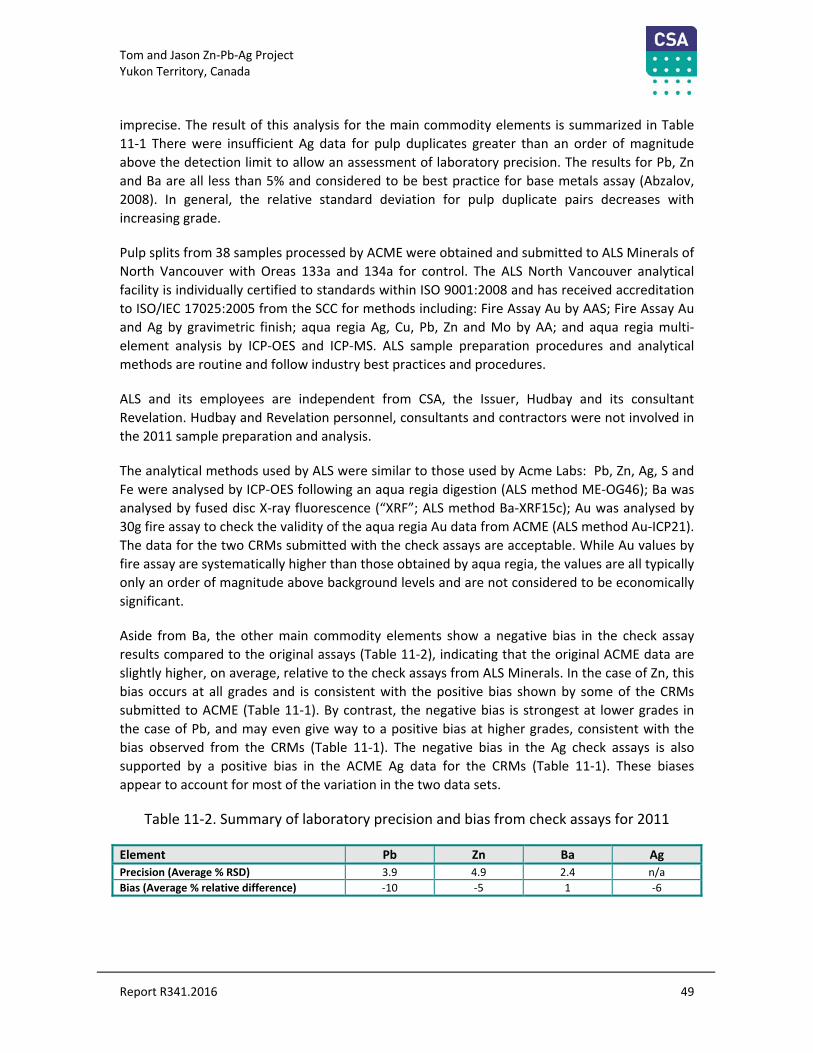
Tom and Jason Zn‐Pb‐Ag Project Yukon Territory, Canada
Report R341.2016 49
imprecise. The result of this analysis for the main commodity elements is summarized in Table
11‐1 There were insufficient Ag data for pulp duplicates greater than an order of magnitude
above the detection limit to allow an assessment of laboratory precision. The results for Pb, Zn
and Ba are all less than 5% and considered to be best practice for base metals assay (Abzalov,
2008). In general, the relative standard deviation for pulp duplicate pairs decreases with
increasing grade.
Pulp splits from 38 samples processed by ACME were obtained and submitted to ALS Minerals of
North Vancouver with Oreas 133a and 134a for control. The ALS North Vancouver analytical
facility is individually certified to standards within ISO 9001:2008 and has received accreditation
to ISO/IEC 17025:2005 from the SCC for methods including: Fire Assay Au by AAS; Fire Assay Au
and Ag by gravimetric finish; aqua regia Ag, Cu, Pb, Zn and Mo by AA; and aqua regia multi‐
element analysis by ICP‐OES and ICP‐MS. ALS sample preparation procedures and analytical
methods are routine and follow industry best practices and procedures.
ALS and its employees are independent from CSA, the Issuer, Hudbay and its consultant
Revelation. Hudbay and Revelation personnel, consultants and contractors were not involved in
the 2011 sample preparation and analysis.
The analytical methods used by ALS were similar to those used by Acme Labs: Pb, Zn, Ag, S and
Fe were analysed by ICP‐OES following an aqua regia digestion (ALS method ME‐OG46); Ba was
analysed by fused disc X‐ray fluorescence (“XRF”; ALS method Ba‐XRF15c); Au was analysed by
30g fire assay to check the validity of the aqua regia Au data from ACME (ALS method Au‐ICP21).
The data for the two CRMs submitted with the check assays are acceptable. While Au values by
fire assay are systematically higher than those obtained by aqua regia, the values are all typically
only an order of magnitude above background levels and are not considered to be economically
significant.
Aside from Ba, the other main commodity elements show a negative bias in the check assay
results compared to the original assays (Table 11‐2), indicating that the original ACME data are
slightly higher, on average, relative to the check assays from ALS Minerals. In the case of Zn, this
bias occurs at all grades and is consistent with the positive bias shown by some of the CRMs
submitted to ACME (Table 11‐1). By contrast, the negative bias is strongest at lower grades in
the case of Pb, and may even give way to a positive bias at higher grades, consistent with the
bias observed from the CRMs (Table 11‐1). The negative bias in the Ag check assays is also
supported by a positive bias in the ACME Ag data for the CRMs (Table 11‐1). These biases
appear to account for most of the variation in the two data sets.
Table 11‐2. Summary of laboratory precision and bias from check assays for 2011
Element Pb Zn Ba Ag
Precision (Average % RSD) 3.9 4.9 2.4 n/a
Bias (Average % relative difference) ‐10 ‐5 1 ‐6
Tom and Jason Zn‐Pb‐Ag Project Yukon Territory, Canada
Report R341.2016 50
QA/QC Analysis Summary
In general, the data for the in‐house HBMS CRMs were acceptable for Zn and Cu. The Pb and the
Ag levels are too close to the lower limit of detection available for the Tom deposit assays in
many of the Hudbay CRMs for a precise assessment of accuracy. There is a clear bias toward
lower Au values from the aqua regia digestion of the Hudbay CRMs that probably reflects
incomplete digestion compared to the certified fire assay results. The poor performance of the
Au assays at Tom is not considered to be relevant.
Of concern are the strong positive biases displayed by the aqua regia Ag data in the Oreas CRMs,
including the ACME internal CRM Oreas 131b, and the Hudbay CRM E5. Clearly, the Ag data for
the samples are over‐estimated by these assays, probably on the order of 5 to 10 %.
In general, the Zn assays for the Oreas CRMs are acceptable, but there appears to have been a
problem with the initial dilutions for the over‐range samples. The original Zn analyses for Oreas
134a were generally acceptable, except for one failure outside of 3 standard deviations below
the expected value and a clear negative bias. However, the over‐range re‐assays show erratic
data for several early batches, before steadying at quite good results. The Zn data for Oreas
131b show a distinct drift through the sample sequence from a negative to positive bias. The Pb
data for Oreas 131b also show a negative bias, with numerous analyses greater than 3 standard
deviations below the expected value.
The Ba data for both Oreas 133a and 134a are erratic, with both positive and negative failures.
Both CRMs have low Ba contents and the values are only an order of magnitude or so above the
lower limit of detection. Imprecise data are expected at these levels.
Given the poor performance of the CRMs for the higher‐grade material, re‐assays of two
batches were requested at ACME. Re‐assays of over range samples using method 7AR and a
dilution method showed a slight positive bias for both Pb and Zn compared to the original
analytical results, and this is reflected in Zn data from certified reference materials. Despite
these slight biases, the re‐assay data are generally within a 20 % relative difference from the
original data in the case of Pb, and within 10 % in the case of Zn. Given the absence of significant
differences between the original and re‐assay data, as well as evidence of positive bias in the
ACME data relative to check assays performed at ALS Minerals, retention of the original data in
the database was recommended.
Author’s Opinion on 2011 Sample Preparation, Security and Analytical Procedures
It is the Author’s opinion that sample security, collection, preparation and analysis undertaken
on the Tom and Jason Project during 2011 by Hudbay and its consultant Revelation were
appropriate for the sample media and mineralisation type and conform to industry standards.
The Pb, Zn and Ag data from ACME show evidence of biases, but these are generally <10%, and
are acceptable for exploration work. The higher‐grade intervals from the 2011 drilling program
should be re‐assayed prior to inclusion in a mineral resource estimate. The laboratory precision
of the data is industry best practice.
Tom and Jason Zn‐Pb‐Ag Project Yukon Territory, Canada
Report R341.2016 51
12. Data Verification
Site Visit
The Qualified Person authoring this report undertook a three‐day site visit to the Tom and Jason
properties between August 31 and September 2, 2011 during the most recent drilling program
conducted by Revelation for Hudbay. While onsite the Author and other Revelation staff
conducted drill collar checks of several drill hole collars from the Jason deposit. There have been
no material changes to the Project since this program and the Author confirmed this through
discussions with the Issuer and Hudbay, and has checked the Yukon Assessment Report Library
(link:http://virtua.gov.yk.ca:8080/search/query?match_1=MUST&field_1=&term_1=105o&fac
et_ngp=NTS+105O‐01&facet_date_1=201&theme=emr ). As such the Author considers this site
visit current under section 6.2 of NI43‐101.Data Verification
Drill collar locations
Rennie (2007) recommended that the drill collars on the Jason property be re‐surveyed. Wells
(2012) noted that verification checks of a limited number of historical drill hole collars at the
Jason deposit using a Trimble GeoExplorer 6000 GeoXH model DGPS receiver indicated that
there is a locational error in the positions of these collars in the Hudbay database; database
collar locations appear to be internally consistent with respect to one another but as a group
they are located approximately 53m northwest of their actual locations in NAD83 UTM‐Z9. A
preliminary correction of 38m east and 37m north should be applied to all historical drill collars
from the Jason deposit, and this correction confirmed through the re‐survey of all available
historical drill collars that can be located on the ground. In the event that the locations of
historical drillhole collars cannot be confirmed by re‐survey, it may be necessary to twin several
drill holes into the Jason deposit to verify locations in NAD83 UTM‐Z9.
The drill collar checks at the Jason deposit were supervised by the Author during the 2011 site
visit. Wells (2012) recommended a re‐survey of all available collar locations at the Jason
property, but it does not appear that this work was undertaken by Hudbay. Some of the drill
pads on the Jason property that were making water have subsequently been rehabilitated (G.
Gorzynski, Personal Communication 2016) and any casing removed. The location verifications
and correction described in the preceding paragraph therefore appears to be the only method
to correct the locations of the Jason deposit drill hole collars until such time that further re‐
survey work can be completed.
Those drill collars at the Tom deposit that could be identified were re‐surveyed in 2011 in
NAD83 UTM‐Z9 coordinates and the previous NAD27 UTM coordinates converted to NAD83
UTM‐Z9. Upon realization that an error occurred aligning a 2011 drill hole using a historical
collar, Wells (2012) noted that “Following discovery of the error the historic drill hole location
was surveyed with a sub‐meter GPS. This showed that the collar was located 10 metres further
north than the drill database indicated.” It appears that various translations of the historical

Tom and Jason Zn‐Pb‐Ag Project Yukon Territory, Canada
Report R341.2016 52
Tom drill collar locations from local grid to NAD27, and from NAD27 to NAD83 have also
resulted in some inaccuracies in hole locations at Tom West and these collars should also be re‐
surveyed.
Database verification
The database provided by the Issuer to CSA Global was that obtained directly from Hudbay by
the Issuer. It was evaluated by Dave Muir, Senior Data Geologist with CSA Global.
Data that were provided electronically by the Issuer in ExcelTM and CSV format as well as PDF
logging sheets were reviewed, verified where possible and collated into a master database. The
file “2.3.2.2‐Drilling.xls” was used as the base of the master template and data were added to
this file to create the master template. Once this master database had been compiled, data from
the 2011 drilling campaign handover (holes TYK001 – TYK011) were also compared to the
master database as a further check. It was determined that the database was satisfactory for
the purposes of this report.
Data were loaded into the DataShed database schema to verify drill hole names and check for
interval issues such as overlaps, negative lengths (From > To), zero lengths (From = To) and
records at depths exceeding the depth of the drill hole. Drill hole co‐ordinates were plotted to
check for outliers.
The only checks against original assay files were for the 2011 drill holes where co‐ordinates were
checked against those in the database. The only other checks were against original laboratory
assay certificates from the 2011 drill program.
The master database contains data that has been verified in terms of being cleaned for use in
software packages, but no other verifications have been undertaken. Slight discrepancies
between co‐ordinates from different source data were noted, which is attributed to different
transformation processes being used.
Collars
Two UTM projection system datums were used historically on the properties; the North
American Datum of 1927 (NAD27) and the North American Datum of 1983 (NAD83), as well as
local grid coordinates in the earlier days of the projects. NAD83 is the preferred datum for the
project data, but many historical co‐ordinates were measured in NAD27 so both have been
included in the database. It is unclear what transformation parameters have been used to
convert between the two datums.
Collars were plotted in both datums and no outliers were observed. When the 2011 collar co‐
ordinates were compared to the PDF logs, minor discrepancies were noted in eastings, northings
and elevations, which are probably due to variations in the transformation process. Differences
ranged from 1 cm to 1.5 m. Co‐ordinates from the Revelation handover file “Geocollar.csv” were
used as the final NAD83 collar co‐ordinates.

Tom and Jason Zn‐Pb‐Ag Project Yukon Territory, Canada
Report R341.2016 53
Downhole Surveys
No verification other than hole ID and depths were undertaken and no issues were noted.
Geology
A numeric lithology code has been used for the 2011 drill holes, and numeric and alpha codes
for the historical drilling. The only overlap is with numeric code ‘0’ which has been assigned
alpha codes of ‘C’ (two instances) and ‘FD’ (one instance). There are no other instances where a
numeric or alpha code has more than one corresponding alpha or numeric code. Seven holes do
not have lithology records (JS82‐088 had lithology data, but there were too many unresolvable
interval issues to include in the master database).
Instances of overlapping intervals and mFrom and mTo reversals were noted and resolved
during the merging process.
Assay
Some comments and issues with respect to the assay results were noted as follows:
The merged assay data were validated against original copies of the laboratory certificates from
2011 using several spot checks for each certificate. It was noted that whole core samples
collected for geotechnical testing by Hudbay and later analysed at ACME are missing from the
final database, although the data are available.
Duplicated sample IDs have been used in the historical data, but no interval issues were
observed, so if required, unique sample IDs could be created using the hole ID, mFrom and mTo.
Default values of ‘0’ have been used for below detection limit results in the 2011 assay results. It
is unclear whether the same process has been consistently used for the historical assay data or
whether ‘0’ has also been used in some instances where samples were not assayed for the
element of interest.
The master database provided by Hudbay was updated with assay results for holes TYK006,
TYK007, TYK008, TYK010 and TYK011 from file “6.2.2.4.1‐Hudbay_Tom_Data_Final.xlsx”, as
these data were missing from the original drill hole database.
Tom and Jason Zn‐Pb‐Ag Project Yukon Territory, Canada
Report R341.2016 54
13. Mineral Processing and Metallurgical Testing
The Issuer has not conducted any mineral processing or metallurgical testing exploration on the
Tom and Jason Project.
2011 Metallurgical Testwork
Hudbay commissioned G & T Metallurgical Services of Kamloops, British Columbia to conduct
the most recent metallurgical test work on the Project using whole drill core collected from four
2011 diamond drill holes drilled into the Tom West Zone (Johnson and Sloan, 2012). Only the
most recent test work summarized from Johnson and Sloan (2012) is presented:
Assumptions
The material sampled was assumed to be representative of both the Tom and Jason deposits
(Allen, 2012).
Sample Selection
Entire mineralised sections (whole HQ core) from holes TYK001, TYK002, TYK003 and TYK004, as
well as both footwall and hangingwall material, were submitted for testing. Recoveries from one
of the twinned metallurgical test holes (TYK004) were poor over part of the mineralised section
and so material from this hole was not submitted for test work. A total of 764 kg of whole HQ
drill core was collected.
Metallurgical Testing Procedures and Results
A bulk mineral assessment was undertaken using QEMSCAN and fragmental characteristics were
determined petrographically. A Bond ball mill work index of 11.5 kWh/tonne was calculated for
the material. Batch floatation indicated an optimum primary grind size of 72 microns, with a Pb
regrind to <15 microns K80 and a Zn regrind of <30 microns K80 required to optimize recoveries.
Concentrate grades of 71% Pb plus 673 g/t Ag and 58% Zn were obtained after three stages of
cleaning.
A single locked cycle test indicated recoveries of 83% of the Pb and 73% of the Ag in the Pb
concentrate and 79% of the Zn and 12% of the Ag in the Zn concentrate. The test conditions and
reagent consumption are summarized in Table 13‐1.

Tom and Jason Zn‐Pb‐Ag Project Yukon Territory, Canada
Report R341.2016 55
Table 13‐1. Summary of 2011 locked cycle test conditions and reagent consumption ‐ Tom West drill core mineralisation
Stage pH Reagent Addition (g/tonne)
Na2SO3 ZnSO4 NaCN SEX
Primary grind 7.9‐9.6 1000 1000 150
Lead roughers 7.9‐10.1 70
Lead regrind 7.8‐9.7 250 100 75
Lead cleaners 8.1‐9.7 133
Lime CuSO4 SIPX
Zinc roughers 11.0‐11.2 1300 750 6
Zinc regrind 11.0‐11.6 400 350
Zinc cleaners 11.0‐11.6 15
Other Factors
Mercury levels of 42 and 327 ppm were measured in the Pb and Zn concentrates, respectively.
Cadmium levels of 0.2% were measured in the Zn concentrate. These elements are deleterious
in concentrates and may attract smelter penalties. Rennie (2007) recommended additional
analysis of drill core for As, Sb and Hg, as well as Fe and Ba on a routine basis. These elements
were included in the 2011 analytical package.
Tom and Jason Zn‐Pb‐Ag Project Yukon Territory, Canada
Report R341.2016 56
14. Mineral Resource Estimates
No current resources estimates are available for the Tom and Jason deposits.

Tom and Jason Zn‐Pb‐Ag Project Yukon Territory, Canada
Report R341.2016 57
15. Adjacent Properties
Adjacent claims are owned by major and junior mining companies and most were staked to
explore for Carlin‐style gold deposits. These claims cover known precious and base metal
prospects and anomalies, none of which are at the advanced stage of the Tom‐Jason project.

Tom and Jason Zn‐Pb‐Ag Project Yukon Territory, Canada
Report R341.2016 58
16. Other Relevant Data and Information
There are no additional relevant data, information or explanation necessary to make this report
understandable and not misleading.

Tom and Jason Zn‐Pb‐Ag Project Yukon Territory, Canada
Report R341.2016 59
17. Interpretation and Conclusions
The Tom and Jason Zn‐Pb‐Ag deposits are in the MacMillan Pass area of western Yukon near the
border with the Northwest Territories. Access to the site is by seasonal gravel road or by air, and
there is minimal infrastructure available in the region.
Tom and Jason are proximal vent SEDEX deposits formed during Devonian rifting activity in the
Selwyn Basin. They were subsequently folded during the transition of the Pacific margin of
North America from a passive to convergent plate margin. SEDEX deposits are major sources of
Pb and Zn globally. Although no SEDEX deposits in the Selwyn Basin are currently in production,
the large Anvil SEDEX deposits northwest of Tom‐Jason, were a major producer of zinc, lead and
silver in the 1980s and the Selwyn (Howards Pass) SEDEX deposit southeast of Tom Jason is one
of the world’s largest undeveloped SEDEX zinc‐lead‐silver resources.
The Tom and Jason properties have undergone a significant amount of historical exploration
work commencing with the discovery of the Tom West Zone in 1951. By the early 1990s 128 drill
holes were completed on the Jason property for a total of 37,924m and 201 drill holes were
completed on the Tom property for a total of 31,672m. In addition, an adit with approximately
3,423m of underground development including a spiral decline were put into the Tom deposit to
assist exploration and bulk sampling. Exploration effectively ceased on the properties after
1992. Since then the GSC released extensive information on the geology, stratigraphy and Pb‐
Zn‐Ba mineralisation of the MacMillan Pass region which is available to guide future exploration
in the area. There has been minimal modern exploration on the properties since 1992.
Hudbay commissioned a mineral resource estimate in 2007 that reported a total of 6.43Mt
indicated resources at both Tom and Jason grading 6.33% Zn, 5.05% Pb and 56.55g/t Ag, and a
total of 24.55Mt inferred resources grading 6.71% Zn, 3.48% Pb and 33.85g/t Ag. CSA Global has
done insufficient analysis to confirm these resource estimates as compliant with NI43‐101; CSA
Global and the Issuer are treating them as historical resources.
Hudbay briefly recommenced exploration in 2011 with the drilling of 11 new diamond holes for
a total of 1,823m. These holes were drilled for metallurgical testing and in‐fill purposes in the
Tom West Zone. The five metallurgical holes were twin holes that verify historical intersections,
although there appear to be minor discrepancies in the location of at least some of the Tom
property historical drill collars. Jason property drill collars appear to have a more significant
locational error of approximately 53m to the northwest, as determined from collar surveys of
historical collar locations in 2011 and comparisons with satellite imagery.
Issues impacting on the eventual economic development of the Tom and Jason deposits include
the remoteness of the location and a lack of infrastructure except for the access road which will
need upgrading. Uncertainties associated with ongoing Native land claim negotiations and as
such unresolved eventual title remain a risk for further development of the properties although
this does not prevent the Issuer from carrying out exploration work on the properties.

Tom and Jason Zn‐Pb‐Ag Project Yukon Territory, Canada
Report R341.2016 60
CSA Global considers the Tom and Jason Project to be properties at an advanced stage of
exploration. CSA Global concludes that the Tom and Jason Project warrants additional
expenditures to verify historical drill results at the known mineralised zones and to explore for
additional high‐grade mineralisation on the properties.

Tom and Jason Zn‐Pb‐Ag Project Yukon Territory, Canada
Report R341.2016 61
18. Recommendations
A new phase of modern exploration is warranted at the Tom and Jason project. The main
objectives of the recommended work program are to upgrade the technical database so that a
new NI43‐101 compliant mineral resource may be estimated for both the Tom and Jason
deposits and to carry out exploration work toward discovery of additional high‐grade
mineralization.
This new phase of exploration will be informed by the substantial work undertaken by the GSC
after the earlier historic exploration. The focus of this exploration should be the identification of
additional mineralisation with an emphasis on defining high‐grade resources. This would be
achieved through refinements of the geological/mineralisation models, mapping, geochemical
sampling, drilling and geophysics. At the same time, the existing substantial historical drill hole
database should be verified through a systematic re‐sampling program of mineralised intervals
in archived drill core, accompanied by a comprehensive QAQC program. The locations of
historical drill collars should be re‐surveyed. Additional twin holes may need to be drilled at
both the Tom and Jason deposits to verify the position of mineralisation in the current
coordinate system NAD 83 UTM Z9 if the re‐surveying of historical drill collars is deemed
insufficient to determine the precise location of mineralised intervals. This verification work as
well as mapping and other field work should lead to the development of new geological models
for both deposits that can form a guide for further exploration.
A budget for the 2017 field season of C$700,000 is proposed as detailed in Table 18‐1. The
budget assumes that existing tracks and a fording at the site of the former bridge across the
South MacMillan River can be used to move a drill rig into position. Also included in the budget
is scope for an aerial survey of the properties in order to obtain an accurate digital elevation
model (“DEM”). A substantial geochemical budget has been included for a program of
systematically re‐sampling drill core to verify historical assays.
It is the opinion of the Author that the property is of sufficient merit that the recommended
budget as outlined represents a worthwhile and sensible work program if carried out by
qualified competent personnel. The project manager may make small adjustments to this
program and budget as circumstances require during the work.

Tom and Jason Zn‐Pb‐Ag Project Yukon Territory, Canada
Report R341.2016 62
Table 18‐1. Proposed budget for Tom and Jason exploration
Expense Category Estimates
Camp Management & Logistics $120,000
Geoscience equipment / Supplies / Consumables $70,000
General Transport & Shipping $20,000
Diamond Drilling (2,000m) $320,000
Geochemical Analyses $40,000
Metallurgical Tests $25,000
Aerial Topographic Survey $30,000
Surveying $15,000
Contractor Services $50,000
Project Air Support $10,000
Total : $700,000

Tom and Jason Zn‐Pb‐Ag Project Yukon Territory, Canada
Report R341.2016 63
19. References
Abbott, J.G., Gordey, S.P. and Templeman‐Kluit, D.J., 1991. Setting of stratiform, sediment‐
hosted lead‐zinc deposits in Yukon and northeastern British Columbia. In Abbott, J.G. and
Turner, R.J.W. (eds.) Mineral Deposits of the Northern Canadian Cordillera, Yukon – Northeast
British Columbia, Field Trip 14, Geological Survey of Canada Open File 2169, pp. 69‐98.
Abbott, J.G. and Turner, R.J., 1991, Character and paleotectonic setting of Devonian stratiform‐
hosted Zn, Pb, Ba deposits, MacMillan Fold Belt, Yukon. In Abbott, J.G. and Turner, R.J.W.
(eds.) Mineral Deposits of the Northern Canadian Cordillera, Yukon – Northeast British
Columbia, Field Trip 14, Geological Survey of Canada Open File 2169, pp. 99‐136.
Abzalov, M., 2008. Quality control of assay data: A review of procedures for measuring and
monitoring precision and accuracy. Exploration and Mining Geology, 17, 131‐144.
Allen, T., 2012, Tom and Jason metallurgical testing. Internal Hudbay memo dated March 19,
2012. 4 p.
Arne, D.C. 2011a, Soil orientation surveys at Tom and Jason deposits. Revelation Geoscience Ltd
internal memo to Hudbay Minerals Inc., September 5, 5 p.
Arne, D.C., 2011b, Soil orientation survey results at Tom and Jason deposits. Revelation
Geoscience Ltd internal memo to Hudbay Minerals Inc., December 8, 11 p.
Austring, Fendrick & Fairman, 2017a. Title opinion on the Hudbay Minerals Inc. Jason claim
group. Letter to Fireweed Zinc Ltd, January 17, 2017.
Austring, Fendrick & Fairman, 2017b. Title opinion on the Hudson Bay Exploration and
Development Company Limited Tom claim group. Letter to Fireweed Zinc Ltd, January 17,
2017.
Carne, R.C., and Cathro, R.J. (1982). Sedimentary exhalative (sedex) zinc‐lead‐silver deposits,
northern Canadian Cordillera. Canadian Mining and Metallurgical Bulletin 75, p. 66‐78.
Gault, A., 2014. Review of Tom exploration adit discharge water quality three years post adit
plug installation. Internal memo from Alexco Environmental Group to Hudbay Minerals Inc.,
31 p.
Goodfellow, W.D., 2007, Base metal metallogeny of the Selwyn Basin, Canada. In Goodfellow,
W.D. (ed.), Mineral Deposits of Canada: A Synthesis of Major Deposit Types, District
Metallogeny, the Evolution of Geological Provinces, and Exploration Methods. Geological
Association of Canada, Mineral Deposits Division, Special Publication 5, pp. 553‐579.

Tom and Jason Zn‐Pb‐Ag Project Yukon Territory, Canada
Report R341.2016 64
Goodfellow, W.D., 1991, Geological setting, geochemistry and origin of the Tom stratiform Zn‐
Pb‐Ag‐barite deposits. In Abbott, J.G. and Turner, R.J.W. (eds.) Mineral Deposits of the
Northern Canadian Cordillera, Yukon – Northeast British Columbia, Field Trip 14, Geological
Survey of Canada Open File 2169, pp. 177‐241.
Goodfellow, W.D., Lydon, J.W. and Turner, R.J.W., 1993. Geology and genesis of stratiform
sediment‐hosted (SEDEX) zinc‐lead‐silver sulphide deposits. In Kirkham, R.V., Sinclair, W.D.,
Thorpe, R.I. and Duke, J.M. (eds.), Mineral Deposit Modeling, Geological Association of Canada
Special Paper 40, pp. 201‐251.
Goodfellow, W.D. and Lydon, J.W., 2007. Sedimentary exhalative (SEDEX) deposits. In
Goodfellow, W.D. (ed.), Mineral Deposits of Canada: A Synthesis of Major Deposit Types,
District Metallogeny, the Evolution of Geological Provinces, and Exploration Methods.
Geological Association of Canada, Mineral Deposits Division, Special Publication 5, pp. 163‐
183.
Johnston, H. and Sloan, R., 2012. Metallurgical assessment of Tom ore. G & T Metallurgical
Services report KM3180 for Hudson Bay Mining & Smelting Co. Ltd., 121 p.
Leach, D.L., Sangster, D.F., Kelly, K.D., Large, R.R., Garven, G., Allen, C.R., Gutmer, J. and Walters,
S., 2005. Sediment‐hosted lead‐zinc deposits: A global perspective. In Hedenquist, J.W.,
Thompson, J.F.H., Goldfarb, R.J. and Richards, J.P. (eds.), Economic Geology One Hundredth
Anniversary Volume, pp. 561‐607.
Magnall, J.M., Stern, R.A., Gleeson, S.A. and Paradis, S. (2015). Widespread euxinic conditions
are not a prerequisite for sediment‐hosted base metal (Pb‐Zn‐Ba) mineralization at MacMillan
Pass, Yukon. In Paradis, S. (Ed.), Targeted Geoscience Initiative 4: Sediment‐hosted Zn‐Pb
Deposits: Processes and Implications for Exploration, Geological Survey of Canada Open File
7838, pp. 43‐57.
Nacisco, H. et al., 2009. Amended technical report on the Mactung property. NI43‐101 Technical
Report prepared for North American Tungsten Corporation Ltd., 372 p.
Mackie, R.A., Arne, D.C. and Brown, O., 2015. Enhanced interpretation of regional stream
sediment geochemistry from Yukon: Catchment basin analysis and weighted sums modelling.
Yukon Geological Survey Open File 2015‐10, 11 p.
Pearson, 2006 – (refers to a preliminary environmental investigation of the Jason property in
2006 by Gartner Lee Limited)
Rennie, D.W., 2007, Technical report on the Tom and Jason deposits, Yukon Territory, Canada:
(NI 43‐101) report prepared for Hudbay Minerals Inc., by Scott Wilson Roscoe Postle
Associates Inc., 202 p. Available under the Hudbay Minerals profile at www.sedar.com .
Salahub, D., 2012. Tom and Jason metallurgical testing. Hudbay internal memo, 4 p.

Tom and Jason Zn‐Pb‐Ag Project Yukon Territory, Canada
Report R341.2016 65
Stanley, C.R. and Lawie, D., 2007. Average relative error in geochemical determinations:
Clarification, calculations and a plea for consistency. Exploration and Mining Geology, 16, 267–
275
Turner, R.J.W., 1991, Jason stratiform Zn‐Pb‐barite deposit, Selwyn Basin, Canada (NTS 105‐0‐1):
Geological setting, hydrothermal facies and genesis. In Abbott, J.G. and Turner, R.J.W. (eds.)
Mineral Deposits of the Northern Canadian Cordillera, Yukon – Northeast British Columbia,
Field Trip 14, Geological Survey of Canada Open File 2169, pp. 137‐175.
Wells, K., 2012, Hudbay Minerals Inc. 2011 Summary Report: Diamond Drilling and Exploration
at the Tom‐Jason Property, Mayo and Watson Lake Mining Districts, Yukon Territory, 64 p.

Tom and Jason Zn‐Pb‐Ag Project Yukon Territory, Canada
Report R341.2016 66
Appendix 1 Listing of Claims

APPENDIX 1: TOM AND JASON CLAIMS LIST
TOM PROPERTYHolder Disposition No Disposition Name HECTARES ANNIVERSARY DATE
TOM MINING LEASESHudbay Minerals 60495 TOM 1 (OL‐00001) 20.83 Oct 12, 2018
Hudbay Minerals 60496 TOM 2 (OL‐00002) 20.82 Oct 12, 2018
Hudbay Minerals 60497 TOM 3 (OL‐00003) 20.90 Oct 12, 2018
Hudbay Minerals 60498 TOM 4 (OL‐00004) 20.90 Oct 12, 2018
Hudbay Minerals 60499 TOM 5 (OL‐00005) 18.70 Oct 12, 2018
Hudbay Minerals 60500 TOM 6 (OL‐00006) 18.70 Oct 12, 2018
Hudbay Minerals 60501 TOM 7 (OL‐00007) 20.55 Oct 12, 2018
Hudbay Minerals 60502 TOM 8 (OL‐00008) 20.55 Oct 12, 2018
Hudbay Minerals 60503 TOM 9 (OL‐00009) 18.99 Oct 12, 2018
Hudbay Minerals 60504 TOM 10 (OL‐00010) 18.98 Oct 12, 2018
Hudbay Minerals 60505 TOM 11 (OL‐00011) 19.34 Oct 12, 2018
Hudbay Minerals 60506 TOM 12 (OL‐00012) 19.34 Oct 12, 2018
Hudbay Minerals 60507 TOM 13 (OL‐00013) 19.75 Oct 12, 2018
Hudbay Minerals 60508 TOM 14 (OL‐00014) 19.76 Oct 12, 2018
Hudbay Minerals 60509 TOM 15 (OL‐00015) 19.81 Oct 12, 2018
Hudbay Minerals 60510 TOM 16 (OL‐00016) 19.81 Oct 12, 2018
Hudbay Minerals 60511 TOM 18 (OL‐00017) 20.21 Oct 12, 2018
Hudbay Minerals 60512 TOM 20 (OL‐00018) 10.59 Oct 12, 2018
Hudbay Minerals 60513 TOM 21 (OL‐00019) 14.68 Oct 12, 2018
Hudbay Minerals 60514 TOM 22 (OL‐00020) 19.49 Oct 12, 2018
Hudbay Minerals 60515 TOM 23 (OL‐00021) 19.13 Oct 12, 2018
Hudbay Minerals 60516 TOM 36 (OL‐00022) 20.90 Oct 12, 2018
Hudbay Minerals 60517 TOM 38 (OL‐00023) 20.76 Oct 12, 2018
Hudbay Minerals 60518 TOM 40 (OL‐00024) 20.90 Oct 12, 2018
Hudbay Minerals 60519 TOM 19 (OL‐00025) 20.42 Oct 12, 2018
Hudbay Minerals 60520 TOM 24 (OL‐00026) 20.72 Oct 12, 2018
Hudbay Minerals 60521 TOM 39 (OL‐00027) 20.90 Oct 12, 2018
Hudbay Minerals 60522 TOM 41 (OL‐00028) 18.53 Oct 12, 2018
Hudbay Minerals 60523 TOM 43 (OL‐00029) 15.48 Oct 12, 2018
Hudbay Minerals 60524 TOM 45 (OL‐00030) 12.74 Oct 12, 2018
Hudbay Minerals 60525 TOM 47 (OL‐00031) 20.90 Oct 12, 2018
Hudbay Minerals 60526 TOM 49 (OL‐00032) 20.90 Oct 12, 2018
Hudbay Minerals 60527 TOM 17 (OL‐00033) 20.90 Oct 12, 2018
Hudbay Minerals 60528 TOM 25 (OL‐00034) 20.83 Oct 12, 2018
Hudbay Minerals 60529 TOM 34 (OL‐00035) 20.90 Oct 12, 2018
Hudbay Minerals 60530 TOM 42 (OL‐00036) 18.53 Oct 12, 2018
Hudbay Minerals 60531 TOM 44 (OL‐00037) 17.62 Oct 12, 2018
Hudbay Minerals 60532 TOM 46 (OL‐00038) 10.16 Oct 12, 2018
Hudbay Minerals 60533 TOM 48 (OL‐00039) 20.04 Oct 12, 2018
Appendix to 'Technical Report on the Tom‐Jason Zinc‐Lead‐Silver Project' by Dennis
Arne, P.Geo. dated January 31, 2017
Hudbay Minerals 60534 TOM 50 (00040) 20.04 Oct 12, 2018
Hudbay Minerals 60535 TOM 26 (OL‐00041) 19.78 Oct 12, 2018
Hudbay Minerals 60536 TOM 32 (OL‐00042) 20.87 Oct 12, 2018
Hudbay Minerals 60537 TOM 27 (OL‐00043) 20.90 Oct 12, 2018
Hudbay Minerals 60538 TOM 28 (OL‐00044) 20.61 Oct 12, 2018
Hudbay Minerals 60539 TOM 29 (OL‐00045) 20.90 Oct 12, 2018
Hudbay Minerals 60540 TOM 30 (OL‐00046) 20.61 Oct 12, 2018
Hudbay Minerals 60541 TOM 31 (OL‐00047) 20.87 Oct 12, 2018
Hudbay Minerals 60542 TOM 33 (OL‐00048) 20.90 Oct 12, 2018
Hudbay Minerals 60543 TOM 35 (OL‐00049) 20.90 Oct 12, 2018
Hudbay Minerals 60544 TOM 37 (OL‐00050) 20.76 Oct 12, 2018
Hudbay Minerals 60545 TOM 51 (OL‐00051) 19.55 Oct 12, 2018
Hudbay Minerals 60546 TOM 52 (OL‐00052) 19.55 Oct 12, 2018
Hudbay Minerals 60547 TOM 53 (OL‐00053) 21.52 Oct 12, 2018
Hudbay Minerals 60548 TOM 54 (OL‐00054) 19.59 Oct 12, 2018
Hudbay Minerals 60549 TOM 55 (OL‐00055) 20.18 Oct 12, 2018
Hudbay Minerals 60550 TOM 56 FR.(OL‐00056) 7.26 Oct 12, 2018
Hudbay Minerals 63525 TOM 57 (OL‐00057) 20.89 Oct 12, 2018
Hudbay Minerals 63526 TOM 58 (OL‐00058) 18.70 Oct 12, 2018
Hudbay Minerals 63527 TOM 59 (OL‐00059) 20.90 Oct 12, 2018
Hudbay Minerals 63528 TOM 60 (OL‐00060) 17.80 Oct 12, 2018
Hudbay Minerals 63529 TOM 61 (OL‐00061) 14.81 Oct 12, 2018
Hudbay Minerals 63530 TOM 62 (OL‐00062) 12.14 Oct 12, 2018
Hudbay Minerals 63531 TOM 63 (OL‐00063) 9.23 Oct 12, 2018
Hudbay Minerals 63532 TOM 64 (OL‐00064) 9.44 Oct 12, 2018
Hudbay Minerals 63533 TOM 65 (OL‐00065) 0.09 Oct 12, 2018
Hudbay Minerals 63534 TOM 66 (OL‐00066) 1.11 Oct 12, 2018
Hudbay Minerals 63535 TOM 67 (OL‐00067) 1.80 Oct 12, 2018
Hudbay Minerals 63536 TOM 68 (OL‐00068) 17.49 Oct 12, 2018
Hudbay Minerals 63537 TOM 69 (OL‐00069) 5.30 Oct 12, 2018
Hudbay Minerals 63538 TOM 70 (OL‐00070) 20.63 Oct 12, 2018
Hudbay Minerals 63539 TOM 71 (OL‐00071) 18.75 Oct 12, 2018
Hudbay Minerals 63540 TOM 72 (OL‐00072) 17.12 Oct 12, 2018
Hudbay Minerals 63541 TOM 73 (OL‐00073) 13.85 Oct 12, 2018
Hudbay Minerals 63542 TOM 74 (OL‐00074) 20.61 Oct 12, 2018
Hudbay Minerals 63543 TOM 75 (OL‐00075) 15.68 Oct 12, 2018
Hudbay Minerals 63544 TOM 76 (OL‐00076) 17.63 Oct 12, 2018
Hudbay Minerals 63545 TOM 77 (OL‐00077) 20.19 Oct 12, 2018
Hudbay Minerals 63546 TOM 78 (OL‐00078) 10.63 Oct 12, 2018
Hudbay Minerals 63547 TOM 79 (OL‐00079) 18.51 Oct 12, 2018
Hudbay Minerals 63548 TOM 80 (OL‐00080) 18.68 Oct 12, 2018
Hudbay Minerals 63549 TOM 81 (OL‐00081) 19.76 Oct 12, 2018
Hudbay Minerals 63550 TOM 82 (OL‐00082) 20.90 Oct 12, 2018
Hudbay Minerals 63551 TOM 83 (OL‐00083) 20.97 Oct 12, 2018
Hudbay Minerals 63552 TOM 84 (OL‐00084) 20.83 Oct 12, 2018
Hudbay Minerals 63553 TOM 86 (OL‐00085) 20.88 Oct 12, 2018
Hudbay Minerals 63554 TOM 87 (OL‐00086) 20.25 Oct 12, 2018

Hudbay Minerals 63555 TOM 88 (OL‐00087) 20.90 Oct 12, 2018
Hudbay Minerals 63556 TOM 89 (OL‐00088) 20.87 Oct 12, 2018
Hudbay Minerals 63557 TOM 90 (OL‐00089) 19.79 Oct 12, 2018
Hudbay Minerals 63558 TOM 91 (OL‐00090) 19.32 Oct 12, 2018
Hudbay Minerals 63559 TOM 92 (OL‐00091) 19.37 Oct 12, 2018
Hudbay Minerals 63560 TOM 93 (OL‐00092) 19.02 Oct 12, 2018
Hudbay Minerals 63561 TOM 94 (OL‐00093) 17.62 Oct 12, 2018
Hudbay Minerals 63562 TOM 95 (OL‐00094) 16.69 Oct 12, 2018
Hudbay Minerals 63563 TOM 96 (OL‐00095) 16.03 Oct 12, 2018
Hudbay Minerals 63564 TOM 97 (OL‐00096) 19.49 Oct 12, 2018
Hudbay Minerals 63565 TOM 98 (OL‐00097) 17.70 Oct 12, 2018
Hudbay Minerals 63566 TOM 99 (OL‐00098) 18.82 Oct 12, 2018
Hudbay Minerals 63567 TOM 100 (OL‐00099) 12.01 Oct 12, 2018
Hudbay Minerals 63568 TOM 101 (OL‐00100) 20.63 Oct 12, 2018
Hudbay Minerals 63569 TOM 102 (OL‐00101) 18.75 Oct 12, 2018
Hudbay Minerals 63570 TOM 103 (OL‐00102) 21.58 Oct 12, 2018
Hudbay Minerals 63571 TOM 104 (OL‐00103) 9.00 Oct 12, 2018
Hudbay Minerals 63572 TOM 105 (OL‐00104) 20.79 Oct 12, 2018
Hudbay Minerals 63573 TOM 107 (OL‐00105) 19.98 Oct 12, 2018
Hudbay Minerals 63574 TOM 108 (OL‐00106) 20.89 Oct 12, 2018
Hudbay Minerals 63575 TOM 109 (OL‐00107) 20.47 Oct 12, 2018
Hudbay Minerals 63576 TOM 110 (OL‐00108) 20.90 Oct 12, 2018
Hudbay Minerals 63577 TOM 111 (OL‐00109) 12.66 Oct 12, 2018
Hudbay Minerals 63578 TOM 112 (OL‐00110) 19.33 Oct 12, 2018
Hudbay Minerals 63579 TOM 113 (OL‐00111) 16.73 Oct 12, 2018
Hudbay Minerals 63580 TOM 114 (OL‐00112) 21.98 Oct 12, 2018
Hudbay Minerals 63581 TOM 115 (OL‐00113) 20.90 Oct 12, 2018
Hudbay Minerals 63582 TOM 116 (OL‐00114) 20.80 Oct 12, 2018
Hudbay Minerals 63583 TOM 117 (OL‐00115) 20.90 Oct 12, 2018
Hudbay Minerals 66850 TOM 118 FR.(OL‐00116) 5.42 Oct 12, 2018
Hudbay Minerals 66851 TOM 119 FR.(OL‐00117) 5.42 Oct 12, 2018
Hudbay Minerals 66852 TOM 125 FR.(OL‐00118) 4.98 Oct 12, 2018
Hudbay Minerals 66853 TOM 126 FR.(OL‐00119) 3.91 Oct 12, 2018
Hudbay Minerals 66854 TOM 129 FR.(OL‐00120) 12.76 Oct 12, 2018
Hudbay Minerals 66855 TOM 130 FR.(OL‐00121) 0.16 Oct 12, 2018
Hudbay Minerals 66856 TOM 131 FR.(OL‐00122) 10.59 Oct 12, 2018
Hudbay Minerals 66857 TOM 132 FR.(OL‐00123) 9.64 Oct 12, 2018
Hudbay Minerals 66858 TOM 120 FR.(OL‐00124) 9.70 Oct 12, 2018
Hudbay Minerals 66859 TOM 121 FR.(OL‐00125) 9.74 Oct 12, 2018
Hudbay Minerals 66860 TOM 124 FR.(OL‐00126) 4.22 Oct 12, 2018
Hudbay Minerals 66861 TOM 127 FR.(OL‐00127) 4.74 Oct 12, 2018
Hudbay Minerals 66862 TOM 128 FR.(OL‐00128) 4.31 Oct 12, 2018
Hudbay Minerals 66863 TOM 133 FR.(OL‐00129) 0.39 Oct 12, 2018
Hudbay Minerals 66864 TOM 134 FR.(OL‐00130) 6.57 Oct 12, 2018
Hudbay Minerals 66865 TOM 141 FR.(OL‐00131) 14.86 Oct 12, 2018
Hudbay Minerals 66866 TOM 122 FR.(OL‐00132) 12.10 Oct 12, 2018
Hudbay Minerals 66867 TOM 123 FR.(OL‐00133) 11.16 Oct 12, 2018

Hudbay Minerals 66868 TOM 135 FR.(OL‐00134) 5.67 Oct 12, 2018
Hudbay Minerals 66869 TOM 136 FR.(OL‐00135) 3.16 Oct 12, 2018
Hudbay Minerals 66870 TOM 137 FR.(OL‐00136) 8.06 Oct 12, 2018
Hudbay Minerals 66871 TOM 138 FR.(OL‐00137) 9.32 Oct 12, 2018
Hudbay Minerals 66872 TOM 139 FR.(OL‐00138) 7.59 Oct 12, 2018
Hudbay Minerals 66873 TOM 140 FR.(OL‐00139) 7.59 Oct 12, 2018
Hudbay Minerals 67415 TOM 142 FR.(OL‐00140) 5.45 Oct 12, 2018
Hudbay Minerals 67416 TOM 143 FR.(OL‐00141) 13.15 Oct 12, 2018
Hudbay Minerals 67417 TOM 144 FR.(OL‐00142) 7.03 Oct 12, 2018
Hudbay Minerals 67418 TOM 145 FR.(OL‐00143) 4.19 Oct 12, 2018
Hudbay Minerals 67419 TOM 146 FR.(OL‐00144) 5.05 Oct 12, 2018Total Hectares: 2,295.17
TOM SURFACE LEASE
Hudbay Minerals 105O01‐003 TOM SURFACE LEASE 120.68 Feb 28, 2022

JASON PROPERTY
Holder
Disposition
No Disposition Name HECTARES
ANNIVERSARY
DATE
JASON MINERAL CLAIMS
Hudbay Minerals Y 83274 JASON 33 19.12 Dec 31, 2017
Hudbay Minerals Y 83275 JASON 34 4.95 Dec 31, 2017
Hudbay Minerals Y 83276 JASON 41 19.05 Dec 31, 2017
Hudbay Minerals Y 83277 JASON 42 18.94 Dec 31, 2017
Hudbay Minerals Y 83278 JASON 43 20.19 Dec 31, 2017
Hudbay Minerals Y 83279 JASON 44 22.37 Dec 31, 2017
Hudbay Minerals Y 84507 JASON 85 19.43 Dec 31, 2017
Hudbay Minerals Y 84508 JASON 86 12.71 Dec 31, 2017
Hudbay Minerals Y 84509 JASON 87 13.94 Dec 31, 2017
Hudbay Minerals Y 84510 JASON 88 13.98 Dec 31, 2017
Hudbay Minerals Y 84511 JASON 89 17.47 Dec 31, 2017
Hudbay Minerals Y 84512 JASON 90 13.26 Dec 31, 2017
Hudbay Minerals Y 84513 JASON 91 11.26 Dec 31, 2017
Hudbay Minerals Y 84514 JASON 92 16.69 Dec 31, 2017
Hudbay Minerals Y 84515 JASON 115 20.64 Dec 31, 2017
Hudbay Minerals Y 84516 JASON 116 16.34 Dec 31, 2017
Hudbay Minerals Y 84517 JASON 123 18.94 Dec 31, 2017
Hudbay Minerals Y 84518 JASON 124 18.56 Dec 31, 2017
Hudbay Minerals Y 84519 JASON 131 19.58 Dec 31, 2017
Hudbay Minerals Y 84520 JASON 132 16.24 Dec 31, 2017
Hudbay Minerals Y 84521 JASON 133 11.49 Dec 31, 2017
Hudbay Minerals Y 84522 JASON 134 0.67 Dec 31, 2017
Hudbay Minerals Y 84525 JASON 137 2.09 Dec 31, 2017
Hudbay Minerals Y 84530 JASON 84 4.52 Dec 31, 2017
Hudbay Minerals Y 93952 JASON 161 11.74 Dec 31, 2017
Hudbay Minerals Y 93953 JASON 162 17.88 Dec 31, 2017
Hudbay Minerals Y 93954 JASON 163 16.83 Dec 31, 2017
Hudbay Minerals Y 93955 JASON 164 13.63 Dec 31, 2017
Hudbay Minerals Y 93956 JASON 165 15.44 Dec 31, 2017
Hudbay Minerals Y 93957 JASON 166 13.02 Dec 31, 2017
Hudbay Minerals Y 93958 JASON 167 19.40 Dec 31, 2017
Hudbay Minerals Y 93959 JASON 168 18.89 Dec 31, 2017
Hudbay Minerals Y 93960 JASON 169 21.14 Dec 31, 2017
Hudbay Minerals Y 93961 JASON 170 12.21 Dec 31, 2017
Hudbay Minerals Y 93962 JASON 171 12.81 Dec 31, 2017
Hudbay Minerals Y 93963 JASON 172 12.52 Dec 31, 2017
Hudbay Minerals Y 93964 JASON 173 18.11 Dec 31, 2017
Hudbay Minerals Y 93965 JASON 174 23.54 Dec 31, 2017
Hudbay Minerals Y 93966 JASON 175 17.52 Dec 31, 2017
Hudbay Minerals Y 93967 JASON 176 16.97 Dec 31, 2017
Hudbay Minerals Y 94471 JASON 135 0.40 Dec 31, 2017
Hudbay Minerals Y 96192 Jason 1 11.91 Dec 31, 2017
Hudbay Minerals Y 96193 Jason 2 16.99 Dec 31, 2017
Hudbay Minerals Y 96194 Jason 3 1.13 Dec 31, 2017
Hudbay Minerals Y 96195 Jason 4 11.31 Dec 31, 2017
Hudbay Minerals Y 96198 Jason 7 20.51 Dec 31, 2017
Hudbay Minerals Y 96199 Jason 8 21.49 Dec 31, 2017
Hudbay Minerals Y 96200 Jason 9 20.04 Dec 31, 2017
Hudbay Minerals Y 96201 Jason 10 21.07 Dec 31, 2017
Hudbay Minerals Y 96202 Jason 11 20.93 Dec 31, 2017
Hudbay Minerals Y 96203 Jason 12 21.70 Dec 31, 2017
Hudbay Minerals Y 96204 Jason 13 20.59 Dec 31, 2017
Hudbay Minerals Y 96205 Jason 14 19.64 Dec 31, 2017
Hudbay Minerals Y 96206 Jason 15 21.14 Dec 31, 2017
Hudbay Minerals Y 96207 Jason 16 19.86 Dec 31, 2017
Hudbay Minerals Y 96208 Jason 17 5.71 Dec 31, 2017
Hudbay Minerals Y 96209 Jason 18 12.56 Dec 31, 2017
Hudbay Minerals Y 96210 JASON 19 7.36 Dec 31, 2017
Hudbay Minerals Y 96211 JASON 20 1.78 Dec 31, 2017
Hudbay Minerals Y 96212 Jason 21 20.03 Dec 31, 2017
Hudbay Minerals Y 96213 Jason 22 18.78 Dec 31, 2017
Hudbay Minerals Y 96214 Jason 23 20.15 Dec 31, 2017
Hudbay Minerals Y 96215 Jason 24 14.09 Dec 31, 2017
Hudbay Minerals Y 96216 Jason 25 14.60 Dec 31, 2017
Hudbay Minerals Y 96217 Jason 26 8.75 Dec 31, 2017
Hudbay Minerals Y 96218 Jason 27 15.09 Dec 31, 2017
Hudbay Minerals Y 96219 Jason 28 12.25 Dec 31, 2017
Hudbay Minerals Y 96220 Jason 29 6.05 Dec 31, 2017
Hudbay Minerals Y 96221 Jason 30 5.56 Dec 31, 2017
Hudbay Minerals Y 96222 JASON 31 19.49 Dec 31, 2017
Hudbay Minerals Y 96223 JASON 32 10.22 Dec 31, 2017
Hudbay Minerals Y 96224 Jason 35 14.91 Dec 31, 2017
Hudbay Minerals Y 96225 Jason 36 14.80 Dec 31, 2017
Hudbay Minerals Y 96226 Jason 37 14.39 Dec 31, 2017
Hudbay Minerals Y 96227 Jason 38 21.00 Dec 31, 2017
Hudbay Minerals Y 96228 JASON 39 19.40 Dec 31, 2017
Hudbay Minerals Y 96229 JASON 40 19.37 Dec 31, 2017
Hudbay Minerals Y 97986 Jason 45 22.25 Dec 31, 2017
Hudbay Minerals Y 97987 Jason 46 18.54 Dec 31, 2017
Hudbay Minerals Y 97988 Jason 47 20.25 Dec 31, 2017
Hudbay Minerals Y 97989 Jason 48 20.67 Dec 31, 2017
Hudbay Minerals Y 98244 Jason 49 19.77 Dec 31, 2017
Hudbay Minerals Y 98245 Jason 50 21.30 Dec 31, 2017
Hudbay Minerals Y 98246 Jason 51 19.11 Dec 31, 2017
Hudbay Minerals Y 98247 Jason 52 20.01 Dec 31, 2017
Hudbay Minerals Y 98248 Jason 53 20.98 Dec 31, 2017
Hudbay Minerals Y 98249 Jason 54 19.83 Dec 31, 2017
Hudbay Minerals Y 98250 Jason 55 16.87 Dec 31, 2017
Hudbay Minerals Y 98251 Jason 56 21.81 Dec 31, 2017
Hudbay Minerals Y 98252 Jason 57 19.60 Dec 31, 2017

Hudbay Minerals Y 98253 Jason 58 20.08 Dec 31, 2017
Hudbay Minerals Y 98254 Jason 59 18.71 Dec 31, 2017
Hudbay Minerals Y 98255 Jason 60 18.13 Dec 31, 2017
Hudbay Minerals Y 98256 Jason 61 13.63 Dec 31, 2017
Hudbay Minerals Y 98257 Jason 62 13.67 Dec 31, 2017
Hudbay Minerals Y 98258 Jason 63 20.61 Dec 31, 2017
Hudbay Minerals Y 98259 Jason 64 19.84 Dec 31, 2017
Hudbay Minerals Y 98260 Jason 65 19.27 Dec 31, 2017
Hudbay Minerals Y 98261 Jason 66 19.09 Dec 31, 2017
Hudbay Minerals Y 98262 Jason 67 19.71 Dec 31, 2017
Hudbay Minerals Y 98263 Jason 68 20.01 Dec 31, 2017
Hudbay Minerals Y 98264 Jason 69 19.30 Dec 31, 2017
Hudbay Minerals Y 98265 Jason 70 19.97 Dec 31, 2017
Hudbay Minerals Y 98266 Jason 71 20.35 Dec 31, 2017
Hudbay Minerals Y 98267 Jason 72 20.52 Dec 31, 2017
Hudbay Minerals Y 98268 Jason 73 20.24 Dec 31, 2017
Hudbay Minerals Y 98269 Jason 74 20.06 Dec 31, 2017
Hudbay Minerals Y 98270 Jason 75 21.28 Dec 31, 2017
Hudbay Minerals Y 98271 Jason 76 20.14 Dec 31, 2017
Hudbay Minerals Y 98272 Jason 77 21.18 Dec 31, 2017
Hudbay Minerals Y 98273 Jason 78 19.32 Dec 31, 2017
Hudbay Minerals Y 98274 Jason 79 18.43 Dec 31, 2017
Hudbay Minerals Y 98275 Jason 80 16.95 Dec 31, 2017
Hudbay Minerals Y 98276 Jason 81 6.17 Dec 31, 2017
Hudbay Minerals Y 98277 Jason 82 4.46 Dec 31, 2017
Hudbay Minerals Y 98278 Jason 93 18.84 Dec 31, 2017
Hudbay Minerals Y 98279 Jason 94 20.84 Dec 31, 2017
Hudbay Minerals Y 98280 Jason 95 18.56 Dec 31, 2017
Hudbay Minerals Y 98281 Jason 96 18.51 Dec 31, 2017
Hudbay Minerals Y 98282 Jason 97 20.64 Dec 31, 2017
Hudbay Minerals Y 98283 Jason 98 18.98 Dec 31, 2017
Hudbay Minerals Y 98284 Jason 99 21.35 Dec 31, 2017
Hudbay Minerals Y 98285 Jason 100 20.54 Dec 31, 2017
Hudbay Minerals Y 98286 Jason 101 20.80 Dec 31, 2017
Hudbay Minerals Y 98287 Jason 102 20.40 Dec 31, 2017
Hudbay Minerals Y 98288 Jason 103 20.08 Dec 31, 2017
Hudbay Minerals Y 98289 Jason 104 20.47 Dec 31, 2017
Hudbay Minerals Y 98290 Jason 105 20.49 Dec 31, 2017
Hudbay Minerals Y 98291 Jason 106 19.95 Dec 31, 2017
Hudbay Minerals Y 98292 Jason 107 15.20 Dec 31, 2017
Hudbay Minerals Y 98293 Jason 108 16.43 Dec 31, 2017
Hudbay Minerals Y 98294 Jason 109 21.03 Dec 31, 2017
Hudbay Minerals Y 98295 Jason 110 18.85 Dec 31, 2017
Hudbay Minerals Y 98296 Jason 111 19.37 Dec 31, 2017
Hudbay Minerals Y 98297 Jason 112 21.34 Dec 31, 2017
Hudbay Minerals Y 98298 Jason 113 10.48 Dec 31, 2017
Hudbay Minerals Y 98299 Jason 114 15.88 Dec 31, 2017
Hudbay Minerals Y 98300 Jason 117 18.53 Dec 31, 2017
Hudbay Minerals Y 98301 Jason 118 21.62 Dec 31, 2017
Hudbay Minerals Y 98302 Jason 119 20.45 Dec 31, 2017
Hudbay Minerals Y 98303 Jason 120 19.93 Dec 31, 2017
Hudbay Minerals Y 98304 Jason 121 7.41 Dec 31, 2017
Hudbay Minerals Y 98305 Jason 122 4.54 Dec 31, 2017
Hudbay Minerals Y 98306 Jason 125 21.27 Dec 31, 2017
Hudbay Minerals Y 98307 Jason 126 19.08 Dec 31, 2017
Hudbay Minerals Y 98308 Jason 127 21.02 Dec 31, 2017
Hudbay Minerals Y 98309 Jason 128 19.22 Dec 31, 2017
Hudbay Minerals Y 98310 Jason 129 19.58 Dec 31, 2017
Hudbay Minerals Y 98311 Jason 130 20.94 Dec 31, 2017
Hudbay Minerals Y 98312 Jason 141 21.70 Dec 31, 2017
Hudbay Minerals Y 98313 Jason 142 20.04 Dec 31, 2017
Hudbay Minerals Y 98314 Jason 143 20.36 Dec 31, 2017
Hudbay Minerals Y 98315 Jason 144 19.84 Dec 31, 2017
Hudbay Minerals Y 98316 Jason 145 20.09 Dec 31, 2017
Hudbay Minerals Y 98317 Jason 146 19.59 Dec 31, 2017
Hudbay Minerals Y 98318 Jason 147 19.74 Dec 31, 2017
Hudbay Minerals Y 98319 Jason 148 17.67 Dec 31, 2017
Hudbay Minerals Y 98320 Jason 149 18.66 Dec 31, 2017
Hudbay Minerals Y 98321 Jason 150 18.29 Dec 31, 2017
Hudbay Minerals Y 98322 Jason 151 18.67 Dec 31, 2017
Hudbay Minerals Y 98323 Jason 152 17.48 Dec 31, 2017
Hudbay Minerals Y 98324 Jason 153 18.75 Dec 31, 2017
Hudbay Minerals Y 98325 Jason 154 18.92 Dec 31, 2017
Hudbay Minerals Y 98326 Jason 155 19.76 Dec 31, 2017
Hudbay Minerals Y 98327 Jason 156 18.37 Dec 31, 2017
Hudbay Minerals Y 98328 Jason 157 19.80 Dec 31, 2017
Hudbay Minerals Y 98329 Jason 158 20.45 Dec 31, 2017
Hudbay Minerals Y 98330 Jason 159 18.05 Dec 31, 2017
Hudbay Minerals Y 98331 Jason 160 21.04 Dec 31, 2017
Hudbay Minerals YA07470 Ace 1 0.44 Dec 31, 2017
Hudbay Minerals YA07471 Ace 2 1.31 Dec 31, 2017
Hudbay Minerals YA07472 Ace 3 9.85 Dec 31, 2017
Hudbay Minerals YA07473 Ace 4 9.33 Dec 31, 2017
Hudbay Minerals YA07474 Ace 5 3.83 Dec 31, 2017
Hudbay Minerals YA07475 Ace 6 4.94 Dec 31, 2017
Hudbay Minerals YA07476 Ace 7 3.56 Dec 31, 2017
Hudbay Minerals YA07477 Ace 8 2.03 Dec 31, 2017
Hudbay Minerals YA07478 Ace 9 0.62 Dec 31, 2017
Hudbay Minerals YA07479 Ace 10 1.74 Dec 31, 2017
Hudbay Minerals YA07480 Ace 11 1.47 Dec 31, 2017
Hudbay Minerals YA07481 Ace 12 1.78 Dec 31, 2017
Hudbay Minerals YA07482 Ace 13 0.43 Dec 31, 2017
Hudbay Minerals YA07483 Ace 14 1.77 Dec 31, 2017
Hudbay Minerals YA07484 Ace 15 1.67 Dec 31, 2017

Hudbay Minerals YA07485 Ace 16 2.65 Dec 31, 2017
Hudbay Minerals YA07486 Ace 17 2.58 Dec 31, 2017
Hudbay Minerals YA07487 Ace 22 6.43 Dec 31, 2017
Hudbay Minerals YA07488 Ace 23 2.23 Dec 31, 2017
Hudbay Minerals YA07489 Ace 24 3.31 Dec 31, 2017
Hudbay Minerals YA07490 Ace 31 11.92 Dec 31, 2017
Hudbay Minerals YA07491 Ace 32 9.76 Dec 31, 2017
Hudbay Minerals YA07492 Ace 36 0.17 Dec 31, 2017
Hudbay Minerals YA07493 Ace 37 1.40 Dec 31, 2017
Hudbay Minerals YA07494 Ace 38 4.21 Dec 31, 2017
Hudbay Minerals YA11526 ACE 18 3.35 Dec 31, 2017
Hudbay Minerals YA11527 ACE 19 7.30 Dec 31, 2017
Hudbay Minerals YA11528 ACE 20 0.63 Dec 31, 2017
Hudbay Minerals YA11529 ACE 21 0.97 Dec 31, 2017
Hudbay Minerals YA11530 ACE 25 4.32 Dec 31, 2017
Hudbay Minerals YA11531 ACE 26 9.13 Dec 31, 2017
Hudbay Minerals YA11532 ACE 27 14.58 Dec 31, 2017
Hudbay Minerals YA11533 ACE 28 10.52 Dec 31, 2017
Hudbay Minerals YA11534 ACE 29 11.98 Dec 31, 2017
Hudbay Minerals YA11535 ACE 30 6.49 Dec 31, 2017
Hudbay Minerals YA11536 ACE 33 13.26 Dec 31, 2017
Hudbay Minerals YA11537 ACE 34 2.02 Dec 31, 2017
Hudbay Minerals YA11538 ACE 35 16.77 Dec 31, 2017
Hudbay Minerals YA11539 ACE 39 5.34 Dec 31, 2017
Hudbay Minerals YA11540 ACE 40 3.69 Dec 31, 2017
Hudbay Minerals YA11541 MIKE 4 15.92 Dec 31, 2017
Hudbay Minerals YA11542 MIKE 5 18.51 Dec 31, 2017
Hudbay Minerals YA11543 MIKE 6 20.03 Dec 31, 2017
Hudbay Minerals YA11544 MIKE 7 19.37 Dec 31, 2017
Hudbay Minerals YA11545 MIKE 8 19.44 Dec 31, 2017
Hudbay Minerals YA11546 MIKE 9 9.21 Dec 31, 2017
Hudbay Minerals YA11547 MIKE 10 20.92 Dec 31, 2017
Hudbay Minerals YA15148 Jason 189 3.42 Dec 31, 2017
Hudbay Minerals YA15149 Jason 190 1.20 Dec 31, 2017
Hudbay Minerals YA15150 Jason 191 19.93 Dec 31, 2017
Hudbay Minerals YA20135 JASON 177 2.45 Dec 31, 2017
Hudbay Minerals YA20136 JASON 178 14.17 Dec 31, 2017
Hudbay Minerals YA20137 JASON 179 11.27 Dec 31, 2017
Hudbay Minerals YA20138 JASON 180 10.38 Dec 31, 2017
Hudbay Minerals YA20139 JASON 181 2.85 Dec 31, 2017
Hudbay Minerals YA20140 JASON 182 1.12 Dec 31, 2017
Hudbay Minerals YA20141 JASON 183 5.65 Dec 31, 2017
Hudbay Minerals YA20142 JASON 184 3.36 Dec 31, 2017
Hudbay Minerals YA20143 JASON 185 5.83 Dec 31, 2017
Hudbay Minerals YA20144 JASON 186 13.58 Dec 31, 2017
Hudbay Minerals YA20145 JASON 187 10.25 Dec 31, 2017
Hudbay Minerals YA20146 JASON 188 9.62 Dec 31, 2017

Hudbay Minerals YA35586 JASON 192 1.30 Dec 31, 2017
Hudbay Minerals YA35587 JASON 193 6.73 Dec 31, 2017
Hudbay Minerals YA35588 JASON 194 4.65 Dec 31, 2017
Hudbay Minerals YA35589 JASON 195 3.69 Dec 31, 2017
Hudbay Minerals YA35590 JASON 196 8.26 Dec 31, 2017
Hudbay Minerals YA35591 JASON 197 13.68 Dec 31, 2017
Hudbay Minerals YA38265 Jason 198 8.31 Dec 31, 2017
Hudbay Minerals YA38266 Jason 199 9.22 Dec 31, 2017
Hudbay Minerals YA38267 Jason 200 2.69 Dec 31, 2017
Hudbay Minerals YA38268 Jason 201 1.30 Dec 31, 2017
Hudbay Minerals YA38269 Jason 202 4.04 Dec 31, 2017
Hudbay Minerals YA38270 Jason 203 2.93 Dec 31, 2017
Hudbay Minerals YA38271 Jason 204 0.45 Dec 31, 2017
Hudbay Minerals YA38272 Jason 205 0.79 Dec 31, 2017
Hudbay Minerals YA38273 Jason 206 2.13 Dec 31, 2017
Hudbay Minerals YA38274 Jason 207 0.04 Dec 31, 2017
Hudbay Minerals YA38275 Jason 208 1.28 Dec 31, 2017
Hudbay Minerals YA38276 Jason 209 1.15 Dec 31, 2017
Hudbay Minerals YA38277 Jason 210 1.00 Dec 31, 2017
Hudbay Minerals YA38278 Jason 211 1.03 Dec 31, 2017
Hudbay Minerals YA38279 Jason 212 6.35 Dec 31, 2017
Hudbay Minerals YA38280 Jason 213 7.64 Dec 31, 2017
Hudbay Minerals YA38281 Jason 214 7.18 Dec 31, 2017
Hudbay Minerals YA38282 Jason 215 5.31 Dec 31, 2017
Hudbay Minerals YA38283 Jason 216 1.95 Dec 31, 2017
Hudbay Minerals YA38284 Jason 217 1.63 Dec 31, 2017
Hudbay Minerals YA38285 Jason 218 0.13 Dec 31, 2017
Hudbay Minerals YA38286 Jason 219 0.37 Dec 31, 2017
Hudbay Minerals YA38287 Jason 220 1.24 Dec 31, 2017
Hudbay Minerals YA38288 Jason 221 3.03 Dec 31, 2017
Hudbay Minerals YA38289 Jason 222 5.15 Dec 31, 2017
Hudbay Minerals YA41288 Jason 223 5.42 Dec 31, 2017
Hudbay Minerals YA41289 Jason 224 6.22 Dec 31, 2017
Hudbay Minerals YA41290 Jason 225 1.22 Dec 31, 2017
Hudbay Minerals YA41291 Jason 226 1.32 Dec 31, 2017
Hudbay Minerals YA41292 Jason 227 1.67 Dec 31, 2017
Hudbay Minerals YA41293 Jason 228 3.00 Dec 31, 2017
Hudbay Minerals YA41294 Jason 229 1.24 Dec 31, 2017
Hudbay Minerals YA41295 Jason 230 3.95 Dec 31, 2017
Hudbay Minerals YA41296 Jason 231 0.77 Dec 31, 2017
Hudbay Minerals YA41297 Jason 232 2.30 Dec 31, 2017
Hudbay Minerals YA41298 Jason 233 5.47 Dec 31, 2017
Hudbay Minerals YA41299 Jason 234 6.07 Dec 31, 2017
Hudbay Minerals YA41300 Jason 235 4.79 Dec 31, 2017
Hudbay Minerals YA41301 Jason 236 4.89 Dec 31, 2017
Hudbay Minerals YA41302 Jason 237 1.98 Dec 31, 2017
Hudbay Minerals YA41303 Jason 238 3.52 Dec 31, 2017

Hudbay Minerals YA41304 Jason 239 4.05 Dec 31, 2017
Hudbay Minerals YA41305 Jason 240 2.67 Dec 31, 2017
Hudbay Minerals YA00024 MIKE 1 1.56 Dec 31, 2017
Hudbay Minerals YA00025 MIKE 2 20.03 Dec 31, 2017
Hudbay Minerals YA00805 MIKE 3 2.02 Dec 31, 2017Total Hectares: 3,528.20

Tom and Jason Zn‐Pb‐Ag Project Yukon Territory, Canada
Report R341.2016 78
Appendix 2 Glossary of Technical Terms and Abbreviations
% percent 3D Three‐dimensional model or data Ag Silver ASCII Digital computer code containing text data assay The laboratory determination of elevated values of a
particular element of economic interest AAS Atomic absorption spectroscopy – an instrumental method of
determining the concentration of an element in solution following an acid digestion
anticline A fold in which the stratigraphically oldest rocks occur with the core
aqua regia A molar ratio of 1 part nitric acid to 3 parts hydrochloric acid used to dissolve materials for assays or analyses
arsenopyrite A metallic mineral containing arsenic, iron and sulphur Au Gold azimuth Compass direction (from north) Ba Barium barite A mineral composed of barium and sulphur; the main source
of barium Bulk density A measure of the weight of a material divided by its volume ºC Celsius degrees carbonaceous Containing a significant amount of carbon Carlin‐style A style of epigenetic gold deposit found along the Carlin
Trend, Nevada celsian An uncommon barium feldspar chalcopyrite A metallic mineral consisting of copper and sulphur; the main
source of copper cm centimetre coefficient of variation (CV) In statistics, the normalized variation value in a sample
population collar The top of a drill hole or the entrance to a mine compositing In sampling and resource estimation, process designed to
carry all samples to certain equal length core sampling In exploration, a sampling method of obtaining rock samples
from a drill hole core for assay CRM
Certified Reference Material which is rock sample or powder with precisely known amounts of elements such as Zn, Pb and Ag which is used as a blind control submitted to a laboratory with a rock sample submission to check on the precision of the resulting assays and analyses.
CSV Digital computer file containing comma‐separated text data

Tom and Jason Zn‐Pb‐Ag Project Yukon Territory, Canada
Report R341.2016 79
d Diameter debris flow The mass movement of sediment, rock and water that such
as during a landslide diamictite A sedimentary rock consisting of a chaotic collection of clasts
within a finer‐grained matrix; generally indicative of submarine landslides. Sometimes referred to as debris flow deposits.
digestion The way a geochemical sample is dissolved for analysis digital terrain model Three‐dimensional wireframe surface computer model, for
example, topography (DTM) exhalative Material “exhaled” or ejected from a submarine
hydrothermal vent, sometimes referred to as “black and white smokers”
fault A break in rocks along which there has been movement, usually along a roughly planar surface
fold The geometric tilting and bending of layered rocks during tectonic compression
finish The final analysis method during assaying or geochemical analysis
FROM Beginning of a drill interval g gram Galena A mineral composed of lead and sulphur; the main source of
lead geochemical sampling In exploration, the main method of sampling rocks, soils or
other natural materials for determination the presence of metals or other elements.
geometallurgy A system of domaining a mineral deposit based on its geochemical and mineralogical characteristics that have a bearing on mineral processing
GPS Global Positioning System to determine a location based on a network of geostationary satellites
gravimetric The determination of the amount of an element or compound based on its weight
growth fault
A normal fault along which movement occurs during the deposition of overlying sediments
GSC Geological Survey of Canada, a federal government agency which conducts geological mapping, geochemical sampling and other campaigns to generate information for the benefit of the mining industry and academia.
histogram Diagrammatic representation of data distribution by calculating frequency of occurrence
hydrothermal A process of mineral deposit formation involving heated water.
ICP Inductively‐couple plasma – a device used to atomise compound in solution for chemical analysis following an acid digestion.
intrusive An igneous rock that has been intruded into the Earth’s crust

Tom and Jason Zn‐Pb‐Ag Project Yukon Territory, Canada
Report R341.2016 80
IP Induced polarisation geophysical survey in which an electrical current is transmitted through the ground and the chargeability of metallic minerals is determined.
kg kilogram km kilometre lognormal Relates to the distribution of a variable value, where the
logarithm of this variable is a normal distribution m meter M million or mega (106) MMI Mobile metal ion; refers to a geochemical method that
detects elements that appear to migrate vertically from buried mineral deposits or other metallic sources
macro A set of MICROMINE commands written as a computer program for reading and handling data
mean Arithmetic mean median Number occupying the middle position in a data set ml millilitre ml/l millilitre per litter mm millimetre monzonite A coarse‐grained intrusive igneous rock containing
approximately equal amounts of orthoclase and plagioclase feldspar
MS Mass spectrometry – the separation of elements in chemical analysis based on mass and charge
Mt million tonnes NI 43‐101 Canadian National Instrument 43‐101, a federal regulation
governing public disclosure by the mining industry NSR Net smelter return OES Optical emission spectroscopy ‐ the emission of
electromagnetic radiation from elements at a characteristic wavelength
overburden All material above bedrock Pb Lead percentile In statistics, one one‐hundredth of the data. It is generally
used to break a database down into equal hundredths population In geostatistics, a population formed from grades having
identical or similar geostatistical characteristics. Ideally, one given population is characterized by a linear distribution
ppm Parts per million pyrite A sulphide mineral comprised of iron and sulphur with a
characteristic chemical composition and structure pyrrhotite A sulphide mineral comprised of iron and sulphur Pyrobitumen A solid organic material similar in composition to bitumen QAQC Quality Assurance / Quality Control RL Elevation of the collar of a drill hole, a trench or a pit bench
above a designated datum sample A piece of material such as a rock or soil collected for

Tom and Jason Zn‐Pb‐Ag Project Yukon Territory, Canada
Report R341.2016 81
chemical analysis scatter plot Diagrammatic representation of measurement pairs about
an orthogonal axis SEDEX Sedimentary exhalative deposit SG Specific Gravity silicification A style of hydrothermal alteration in which silica is added and
hardens a rock sphalerite A mineral composed of zinc, (iron) and sulphur; the main
source of zinc standard deviation Statistical value of data dispersion around the mean value stratigraphy Refers to the order in which sedimentary and volcanic rocks
have been deposited t tonne t/m3 tonne per cubic meter tetrahedrite A sulfosalt mineral containing copper, antimony, iron and
sulphur TO TSX‐V
End of a drill interval TSX‐Venture Stock Exchange based in Toronto
turbidites Sedimentary rocks deposited from submarine landslides as the sediment settles out of the water column
uncomformable variance In statistics, the measure of dispersion around the mean
value of a data set volcanic An igneous rock that has been erupted onto the Earth’s
surface wireframe model 3D surface defined by triangles X Coordinate of the longitude of a drill hole, a trench
collar, a pit bench or other item XRF X‐ray fluorescence; an analytical method Y coordinate of the latitude of a drill hole, a trench
collar, a pit bench or other item yr year Zn Zinc
Tom and Jason Zn‐Pb‐Ag Project Yukon Territory, Canada
Report R341.2016 82
Tom and Jason Zn-Pb-Ag Project
Yukon Territory, Canada
n3'
Australia • Canada • Indonesia • Russia
Singapore • South Africa • United Kingdom
csaglobal.com
Report R341.2016 82