news & information tokyo 108-0075 japan · includes blu-ray disctm players and recorders, home...
TRANSCRIPT

1
No. 14-072E
3:00 P.M. JST, July 31, 2014
Consolidated Financial Results for the First Quarter Ended June 30, 2014
Tokyo, July 31, 2014 -- Sony Corporation today announced its consolidated financial results for the first quarter ended June 30, 2014 (April 1, 2014 to June 30, 2014). (Billions of yen, millions of U.S. dollars, except per share amounts)
First Quarter ended June 30 2013 2014 Change in yen 2014*
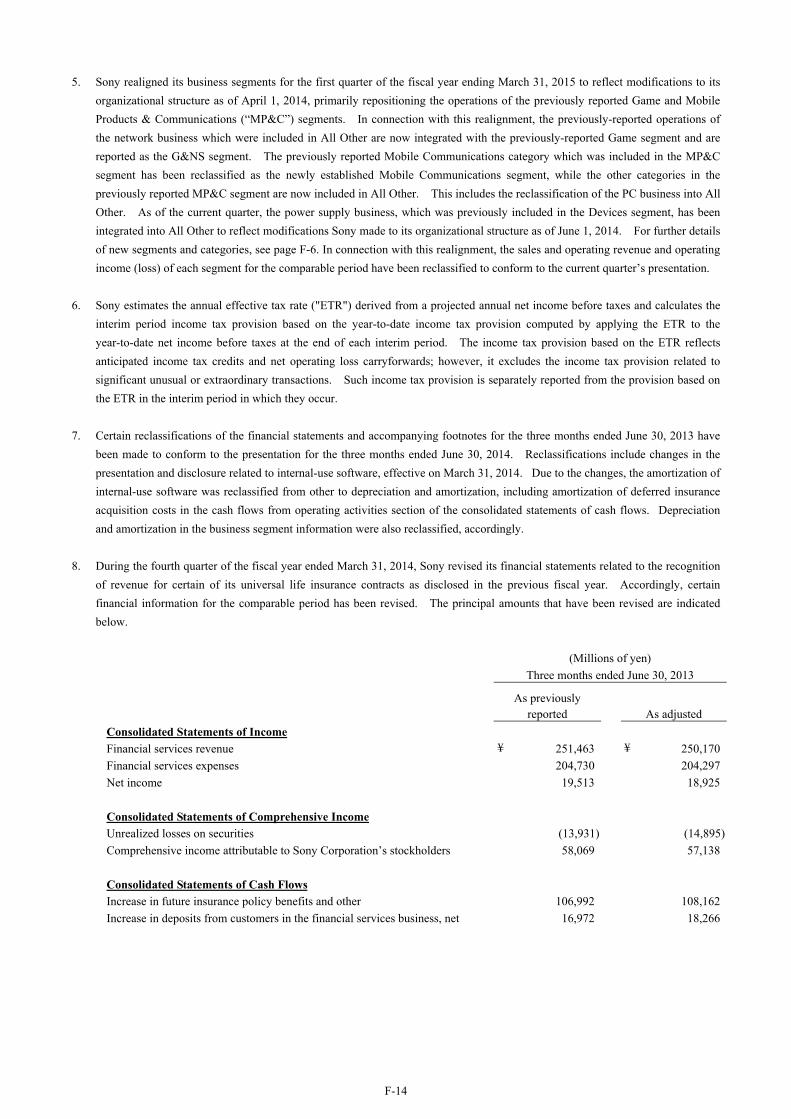
Sales and operating revenue ¥1,711.4 ¥1,809.9 +5.8% $17,920 Operating income 35.5 69.8 +96.7 691 Income before income taxes 45.4 68.4 +50.6 677 Net income attributable to Sony Corporation’s
stockholders 3.1 26.8 +757.3 265 Net income attributable to Sony Corporation’s
stockholders per share of common stock:
- Basic ¥3.09 ¥25.69 +731.4% $0.25 - Diluted 2.68 22.94 +756.0 0.23 * U.S. dollar amounts have been translated from yen, for convenience only, at the rate of 101 yen = 1 U.S. dollar, the approximate Tokyo
foreign exchange market rate as of June 30, 2014. All amounts are presented on the basis of Generally Accepted Accounting Principles in the U.S. (“U.S. GAAP”). Sony realigned its business segments from the first quarter of the fiscal year ending March 31, 2015 (“the current quarter”) to reflect modifications to its organizational structure as of April 1, 2014, primarily repositioning the operations of the previously reported Game and Mobile Products & Communications (“MP&C”) segments. In connection with this realignment, the previously-reported operations of the network business which were included in All Other have been integrated with the previously-reported Game segment and are now reported as the Game & Network Services (“G&NS”) segment. The previously reported Mobile Communications category which was included in the MP&C segment has been reclassified as the newly established Mobile Communications (“MC”) segment, while the other categories in the previously reported MP&C segment are now included in All Other. This includes the reclassification of the PC business into All Other. In addition, as of the current quarter, the power supply business, which was previously included in the Devices segment, has been integrated into All Other to reflect modifications Sony made to its organizational structure as of June 1, 2014. In connection with these realignments, the sales and operating revenue (“sales”) and operating income (loss) of each segment in the fiscal year ended March 31, 2014 have been reclassified to conform to the presentation of the fiscal year ending March 31, 2015. Certain figures for the fiscal year ended March 31, 2014 related to the Financial Services segment have been revised from the versions previously disclosed. For further details, please see Note 8 on page F-14. The average foreign exchange rates during the quarters ended June 30, 2013 and 2014 are presented below. First quarter ended June 30 2013 2014 Change
The average rate of yen 1 U.S. dollar ¥ 98.7 ¥ 102.2 3.4% (yen depreciation)
1 Euro 128.9 140.1 8.0 (yen depreciation)
Consolidated Results for the First Quarter Ended June 30, 2014 Sales were 1,809.9 billion yen (17,920 million U.S. dollars), an increase of 5.8% compared to the same quarter of the previous fiscal year (“year-on-year”). This increase was primarily due to a significant increase in G&NS
News & Information
1-7-1 Konan, Minato-ku Tokyo 108-0075 Japan

2
segment sales, reflecting the contribution of the PlayStation 4 (“PS4”) which was launched in November 2013, a significant increase in Pictures segment sales primarily due to higher theatrical revenues in Motion Pictures, as well as the favorable impact of foreign exchange rates. This increase was partially offset by a significant decrease in sales in All Other, primarily related to Sony’s exit from the PC business. On a constant currency basis, sales increased 3% year-on-year. For further details about sales on a constant currency basis, see Note on page 9. Operating income increased 34.3 billion yen year-on-year to 69.8 billion yen (691 million U.S. dollars). This increase was primarily due to a significant improvement in the operating results of the G&NS segment partially offset by a significant deterioration in the operating results of the MC segment. Operating income during the current quarter includes a gain of 14.8 billion yen (146 million U.S. dollars) recognized on the sale of certain buildings and premises at Gotenyama Technology Center in Japan, recorded in Corporate and elimination. During the current quarter, restructuring charges, net, increased 10.6 billion yen year-on-year to 15.3 billion yen (151 million U.S. dollars). PC exit costs of 18.3 billion yen (181 million U.S. dollars) were recorded in the current quarter, which includes 10.8 billion yen (107 million U.S. dollars) of restructuring charges. In addition, 2.4 billion yen (24 million U.S. dollars) of impairment charges that are mainly related to LCD televisions were also booked in the current quarter. For further details about PC exit costs, see page 7. Equity in net income of affiliated companies, recorded within operating income, was 3.2 billion yen (32 million U.S. dollars), compared to a loss of 0.4 billion yen in the same quarter of the previous fiscal year. This improvement was mainly due to the recording of equity in net income for Intertrust Technologies Corporation compared to the equity in net loss in the same quarter of the previous fiscal year. The net effect of other income and expenses was an expense of 1.4 billion yen (14 million U.S. dollars), compared to income of 9.9 billion yen in the same quarter of the previous fiscal year. This was primarily due to the recording of a net foreign exchange loss in the current quarter, compared to the recording of a net foreign exchange gain in the same quarter of the previous fiscal year, as well as a decrease in other non-operating income, partially offset by an increase in gains on sale of securities investments. The sale of securities investments in the current quarter includes a 4.8 billion yen (48 million U.S. dollars) gain on the sale of Sony’s shares in SQUARE ENIX HOLDINGS CO., LTD., which were sold in April, 2014. Income before income taxes increased 23.0 billion yen year-on-year to 68.4 billion yen (677 million U.S. dollars). Income taxes: During the current quarter, Sony recorded 26.0 billion yen (258 million U.S. dollars) of income tax expense, resulting in an effective tax rate of 38.1%. Net income attributable to Sony Corporation’s stockholders, which excludes net income attributable to noncontrolling interests, increased 23.7 billion yen year-on-year to 26.8 billion yen (265 million U.S. dollars).
Operating Performance Highlights by Business Segment “Sales and operating revenue” in each business segment represents sales and operating revenue recorded before intersegment transactions are eliminated. “Operating income (loss)” in each business segment represents operating income (loss) reported before intersegment transactions are eliminated and excludes unallocated corporate expenses.
Mobile Communications (MC) (Billions of yen, millions of U.S. dollars)
First quarter ended June 30
2013 2014 Change in yen 2014
Sales and operating revenue ¥285.5 ¥314.3 +10.1% $3,112
Operating income (loss) 12.6 (2.7) - (27)
3
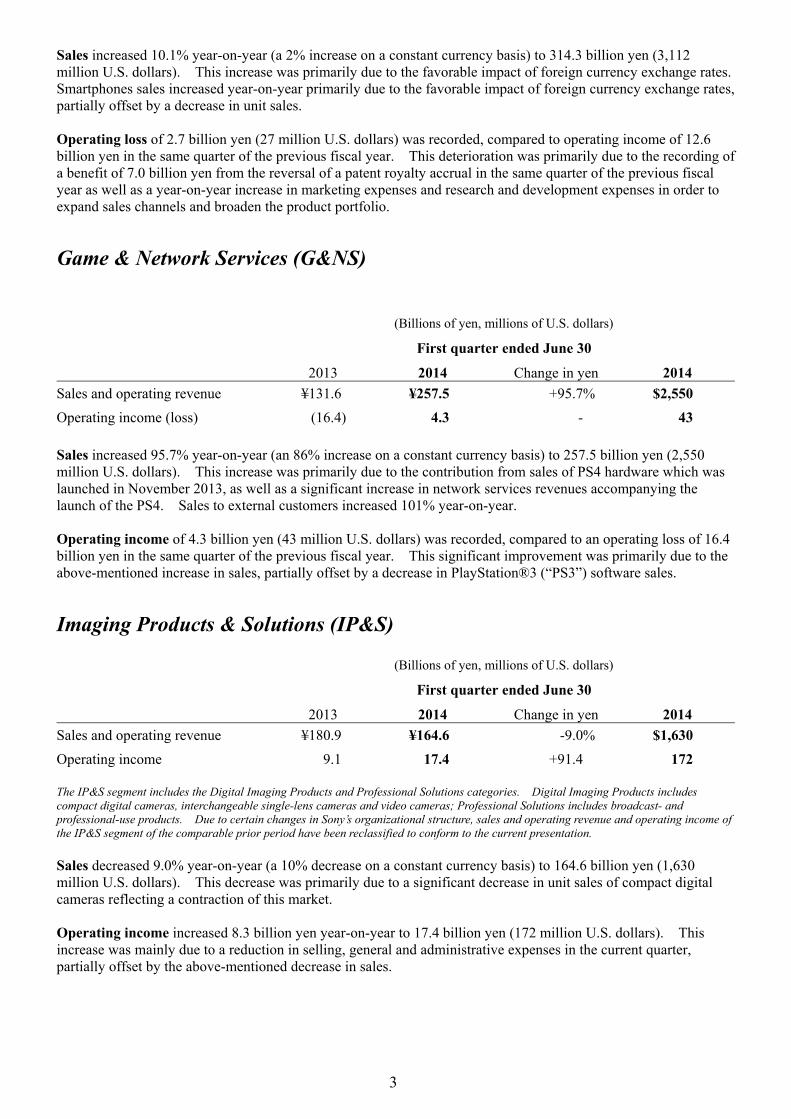
Sales increased 10.1% year-on-year (a 2% increase on a constant currency basis) to 314.3 billion yen (3,112 million U.S. dollars). This increase was primarily due to the favorable impact of foreign currency exchange rates. Smartphones sales increased year-on-year primarily due to the favorable impact of foreign currency exchange rates, partially offset by a decrease in unit sales. Operating loss of 2.7 billion yen (27 million U.S. dollars) was recorded, compared to operating income of 12.6 billion yen in the same quarter of the previous fiscal year. This deterioration was primarily due to the recording of a benefit of 7.0 billion yen from the reversal of a patent royalty accrual in the same quarter of the previous fiscal year as well as a year-on-year increase in marketing expenses and research and development expenses in order to expand sales channels and broaden the product portfolio.
Game & Network Services (G&NS) (Billions of yen, millions of U.S. dollars)
First quarter ended June 30
2013 2014 Change in yen 2014
Sales and operating revenue ¥131.6 ¥257.5 +95.7% $2,550
Operating income (loss) (16.4) 4.3 - 43
Sales increased 95.7% year-on-year (an 86% increase on a constant currency basis) to 257.5 billion yen (2,550 million U.S. dollars). This increase was primarily due to the contribution from sales of PS4 hardware which was launched in November 2013, as well as a significant increase in network services revenues accompanying the launch of the PS4. Sales to external customers increased 101% year-on-year. Operating income of 4.3 billion yen (43 million U.S. dollars) was recorded, compared to an operating loss of 16.4 billion yen in the same quarter of the previous fiscal year. This significant improvement was primarily due to the above-mentioned increase in sales, partially offset by a decrease in PlayStation®3 (“PS3”) software sales.
Imaging Products & Solutions (IP&S) (Billions of yen, millions of U.S. dollars)
First quarter ended June 30
2013 2014 Change in yen 2014
Sales and operating revenue ¥180.9 ¥164.6 -9.0% $1,630
Operating income 9.1 17.4 +91.4 172 The IP&S segment includes the Digital Imaging Products and Professional Solutions categories. Digital Imaging Products includes compact digital cameras, interchangeable single-lens cameras and video cameras; Professional Solutions includes broadcast- and professional-use products. Due to certain changes in Sony’s organizational structure, sales and operating revenue and operating income of the IP&S segment of the comparable prior period have been reclassified to conform to the current presentation. Sales decreased 9.0% year-on-year (a 10% decrease on a constant currency basis) to 164.6 billion yen (1,630 million U.S. dollars). This decrease was primarily due to a significant decrease in unit sales of compact digital cameras reflecting a contraction of this market. Operating income increased 8.3 billion yen year-on-year to 17.4 billion yen (172 million U.S. dollars). This increase was mainly due to a reduction in selling, general and administrative expenses in the current quarter, partially offset by the above-mentioned decrease in sales.
4
Home Entertainment & Sound (HE&S) (Billions of yen, millions of U.S. dollars)
First quarter ended June 30
2013 2014 Change in yen 2014
Sales and operating revenue ¥275.2 ¥285.7 +3.8% $2,829
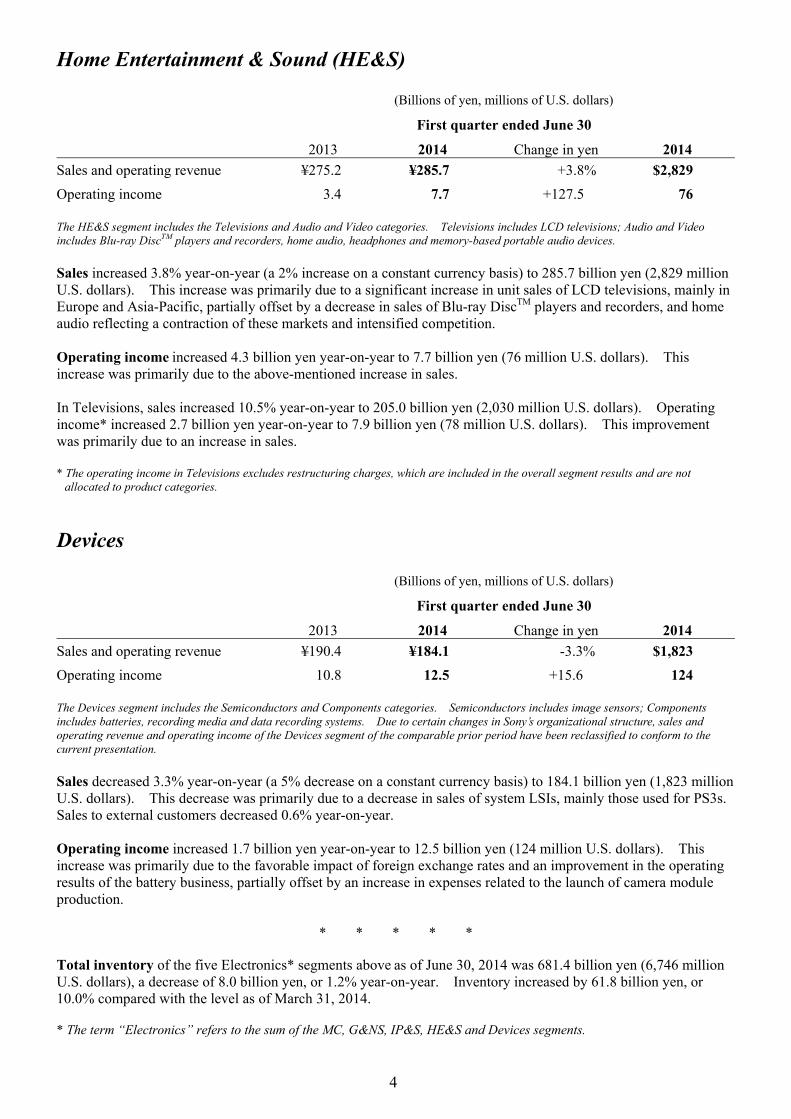
Operating income 3.4 7.7 +127.5 76 The HE&S segment includes the Televisions and Audio and Video categories. Televisions includes LCD televisions; Audio and Video includes Blu-ray DiscTM players and recorders, home audio, headphones and memory-based portable audio devices. Sales increased 3.8% year-on-year (a 2% increase on a constant currency basis) to 285.7 billion yen (2,829 million U.S. dollars). This increase was primarily due to a significant increase in unit sales of LCD televisions, mainly in Europe and Asia-Pacific, partially offset by a decrease in sales of Blu-ray DiscTM players and recorders, and home audio reflecting a contraction of these markets and intensified competition. Operating income increased 4.3 billion yen year-on-year to 7.7 billion yen (76 million U.S. dollars). This increase was primarily due to the above-mentioned increase in sales. In Televisions, sales increased 10.5% year-on-year to 205.0 billion yen (2,030 million U.S. dollars). Operating income* increased 2.7 billion yen year-on-year to 7.9 billion yen (78 million U.S. dollars). This improvement was primarily due to an increase in sales. * The operating income in Televisions excludes restructuring charges, which are included in the overall segment results and are not
allocated to product categories.
Devices (Billions of yen, millions of U.S. dollars)
First quarter ended June 30
2013 2014 Change in yen 2014
Sales and operating revenue ¥190.4 ¥184.1 -3.3% $1,823
Operating income 10.8 12.5 +15.6 124 The Devices segment includes the Semiconductors and Components categories. Semiconductors includes image sensors; Components includes batteries, recording media and data recording systems. Due to certain changes in Sony’s organizational structure, sales and operating revenue and operating income of the Devices segment of the comparable prior period have been reclassified to conform to the current presentation. Sales decreased 3.3% year-on-year (a 5% decrease on a constant currency basis) to 184.1 billion yen (1,823 million U.S. dollars). This decrease was primarily due to a decrease in sales of system LSIs, mainly those used for PS3s. Sales to external customers decreased 0.6% year-on-year. Operating income increased 1.7 billion yen year-on-year to 12.5 billion yen (124 million U.S. dollars). This increase was primarily due to the favorable impact of foreign exchange rates and an improvement in the operating results of the battery business, partially offset by an increase in expenses related to the launch of camera module production.
* * * * * Total inventory of the five Electronics* segments above as of June 30, 2014 was 681.4 billion yen (6,746 million U.S. dollars), a decrease of 8.0 billion yen, or 1.2% year-on-year. Inventory increased by 61.8 billion yen, or 10.0% compared with the level as of March 31, 2014. * The term “Electronics” refers to the sum of the MC, G&NS, IP&S, HE&S and Devices segments.
5
In connection with the realignment made from the first quarter of the fiscal year ending March 31, 2015, total inventory of the five Electronics segments as of June 30, 2013 and March 31, 2014 has been reclassified to conform to the presentation for the fiscal year ending March 31, 2015. For further details, please see page 1.
* * * * *
Pictures (Billions of yen, millions of U.S. dollars)
First quarter ended June 30
2013 2014 Change in yen 2014
Sales and operating revenue ¥158.9 ¥194.8 +22.6% $1,928
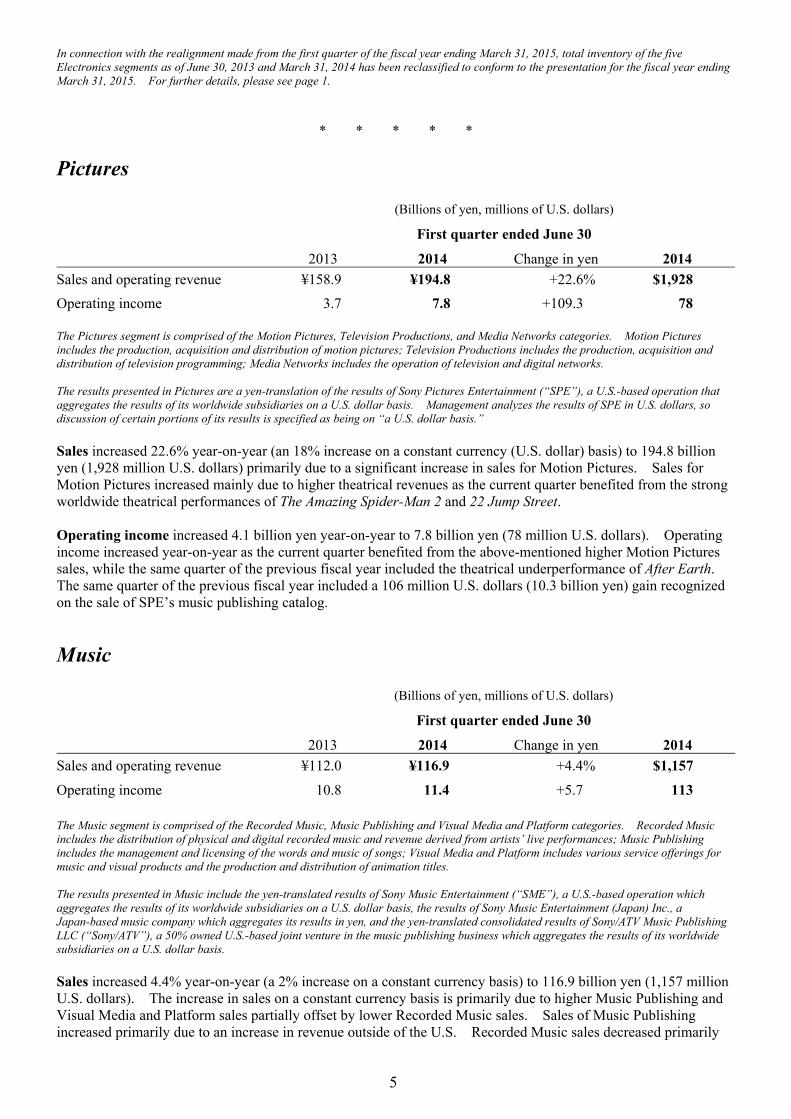
Operating income 3.7 7.8 +109.3 78 The Pictures segment is comprised of the Motion Pictures, Television Productions, and Media Networks categories. Motion Pictures includes the production, acquisition and distribution of motion pictures; Television Productions includes the production, acquisition and distribution of television programming; Media Networks includes the operation of television and digital networks. The results presented in Pictures are a yen-translation of the results of Sony Pictures Entertainment (“SPE”), a U.S.-based operation that aggregates the results of its worldwide subsidiaries on a U.S. dollar basis. Management analyzes the results of SPE in U.S. dollars, so discussion of certain portions of its results is specified as being on “a U.S. dollar basis.” Sales increased 22.6% year-on-year (an 18% increase on a constant currency (U.S. dollar) basis) to 194.8 billion yen (1,928 million U.S. dollars) primarily due to a significant increase in sales for Motion Pictures. Sales for Motion Pictures increased mainly due to higher theatrical revenues as the current quarter benefited from the strong worldwide theatrical performances of The Amazing Spider-Man 2 and 22 Jump Street. Operating income increased 4.1 billion yen year-on-year to 7.8 billion yen (78 million U.S. dollars). Operating income increased year-on-year as the current quarter benefited from the above-mentioned higher Motion Pictures sales, while the same quarter of the previous fiscal year included the theatrical underperformance of After Earth. The same quarter of the previous fiscal year included a 106 million U.S. dollars (10.3 billion yen) gain recognized on the sale of SPE’s music publishing catalog.
Music (Billions of yen, millions of U.S. dollars)
First quarter ended June 30
2013 2014 Change in yen 2014
Sales and operating revenue ¥112.0 ¥116.9 +4.4 % $1,157
Operating income 10.8 11.4 +5.7 113
The Music segment is comprised of the Recorded Music, Music Publishing and Visual Media and Platform categories. Recorded Music includes the distribution of physical and digital recorded music and revenue derived from artists’ live performances; Music Publishing includes the management and licensing of the words and music of songs; Visual Media and Platform includes various service offerings for music and visual products and the production and distribution of animation titles. The results presented in Music include the yen-translated results of Sony Music Entertainment (“SME”), a U.S.-based operation which aggregates the results of its worldwide subsidiaries on a U.S. dollar basis, the results of Sony Music Entertainment (Japan) Inc., a Japan-based music company which aggregates its results in yen, and the yen-translated consolidated results of Sony/ATV Music Publishing LLC (“Sony/ATV”), a 50% owned U.S.-based joint venture in the music publishing business which aggregates the results of its worldwide subsidiaries on a U.S. dollar basis. Sales increased 4.4% year-on-year (a 2% increase on a constant currency basis) to 116.9 billion yen (1,157 million U.S. dollars). The increase in sales on a constant currency basis is primarily due to higher Music Publishing and Visual Media and Platform sales partially offset by lower Recorded Music sales. Sales of Music Publishing increased primarily due to an increase in revenue outside of the U.S. Recorded Music sales decreased primarily
6
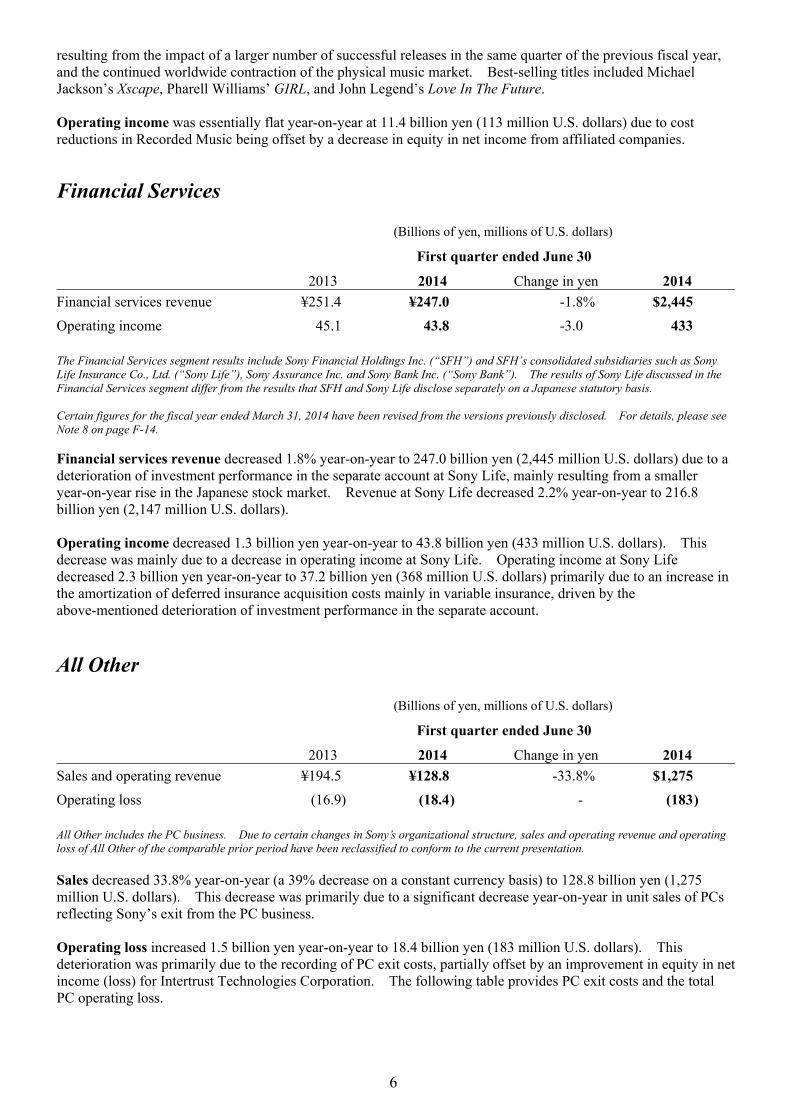
resulting from the impact of a larger number of successful releases in the same quarter of the previous fiscal year, and the continued worldwide contraction of the physical music market. Best-selling titles included Michael Jackson’s Xscape, Pharell Williams’ GIRL, and John Legend’s Love In The Future. Operating income was essentially flat year-on-year at 11.4 billion yen (113 million U.S. dollars) due to cost reductions in Recorded Music being offset by a decrease in equity in net income from affiliated companies.
Financial Services (Billions of yen, millions of U.S. dollars)
First quarter ended June 30
2013 2014 Change in yen 2014
Financial services revenue ¥251.4 ¥247.0 -1.8% $2,445
Operating income 45.1 43.8 -3.0 433 The Financial Services segment results include Sony Financial Holdings Inc. (“SFH”) and SFH’s consolidated subsidiaries such as Sony Life Insurance Co., Ltd. (“Sony Life”), Sony Assurance Inc. and Sony Bank Inc. (“Sony Bank”). The results of Sony Life discussed in the Financial Services segment differ from the results that SFH and Sony Life disclose separately on a Japanese statutory basis. Certain figures for the fiscal year ended March 31, 2014 have been revised from the versions previously disclosed. For details, please see Note 8 on page F-14. Financial services revenue decreased 1.8% year-on-year to 247.0 billion yen (2,445 million U.S. dollars) due to a deterioration of investment performance in the separate account at Sony Life, mainly resulting from a smaller year-on-year rise in the Japanese stock market. Revenue at Sony Life decreased 2.2% year-on-year to 216.8 billion yen (2,147 million U.S. dollars). Operating income decreased 1.3 billion yen year-on-year to 43.8 billion yen (433 million U.S. dollars). This decrease was mainly due to a decrease in operating income at Sony Life. Operating income at Sony Life decreased 2.3 billion yen year-on-year to 37.2 billion yen (368 million U.S. dollars) primarily due to an increase in the amortization of deferred insurance acquisition costs mainly in variable insurance, driven by the above-mentioned deterioration of investment performance in the separate account.
All Other (Billions of yen, millions of U.S. dollars)
First quarter ended June 30
2013 2014 Change in yen 2014
Sales and operating revenue ¥194.5 ¥128.8 -33.8% $1,275
Operating loss (16.9) (18.4) - (183) All Other includes the PC business. Due to certain changes in Sony’s organizational structure, sales and operating revenue and operating loss of All Other of the comparable prior period have been reclassified to conform to the current presentation. Sales decreased 33.8% year-on-year (a 39% decrease on a constant currency basis) to 128.8 billion yen (1,275 million U.S. dollars). This decrease was primarily due to a significant decrease year-on-year in unit sales of PCs reflecting Sony’s exit from the PC business. Operating loss increased 1.5 billion yen year-on-year to 18.4 billion yen (183 million U.S. dollars). This deterioration was primarily due to the recording of PC exit costs, partially offset by an improvement in equity in net income (loss) for Intertrust Technologies Corporation. The following table provides PC exit costs and the total PC operating loss.

7
(Billions of yen, millions of U.S. dollars) First quarter ended June 30, 2014
All Other
Corporate and
EliminationConsolidated
Total
Change from FY13
in yen Consolidated
Total i. Expenses to compensate suppliers
for unused components held by suppliers
¥ 5.0 ¥ - ¥ 5.0 ¥ +5.0 $ 49
ii. Early retirement costs etc. 3.6 2.2 5.8 +5.8 58(I) Restructuring charges (i + ii) 8.6 2.2 10.8 +10.8 107(II) After-sales service expenses etc. 7.5 - 7.5 +7.5 75
PC exit costs (I+II) 16.1 2.2 18.3 +18.3 181Operating loss excluding exit costs (2.4) - (2.4) +2.4 (24)Total PC Operating Loss ¥(18.5) ¥(2.2) ¥(20.7) ¥(15.9) $(205)
* * * * *
Cash Flows For Consolidated Statements of Cash Flows, charts showing Sony’s cash flow information for all segments, all segments excluding the Financial Services segment and the Financial Services segment alone, please refer to pages F-4 and F-12. In the Financial Services segment, certain figures for the fiscal year ended March 31, 2014 have been revised from the versions previously disclosed. For further details, please see Note 8 on page F-14. Operating Activities: During the current quarter, there was a net cash inflow of 66.2 billion yen (657 million U.S. dollars) from operating activities, compared to a net cash outflow of 133.0 billion yen in the same quarter of the previous fiscal year. For all segments excluding the Financial Services segment, there was a net cash outflow of 27.5 billion yen (271 million U.S. dollars) for the current quarter, a decrease of outflow of 166.6 billion yen, or 85.8% year-on-year. This decrease of outflow was primarily due to the positive impact of an improvement in net income after taking into account non-cash adjustments (including depreciation and amortization, other operating expenses, deferred income taxes and equity in net income of affiliated companies), a smaller increase in inventories, and a smaller increase in other receivables from component assembly companies, included in other current assets. This decrease of outflow was partially offset by the negative impact of a smaller year-on-year increase in notes and accounts payable, trade. The Financial Services segment had a net cash inflow of 101.6 billion yen (1,006 million U.S. dollars), an increase of 33.7 billion yen, or 49.6% year-on-year. This increase was primarily due to a year-on-year decrease in the payment of surrender value amounts as well as an increase in insurance premium revenue resulting from an expansion of business at Sony Life. A lower increase of accounts receivable at SmartLink Network, Inc., a subsidiary of Sony Bank, also contributed to this increase of cash inflow. Investing Activities: During the current quarter, Sony used 124.7 billion yen (1,235 million U.S. dollars) of net cash in investing activities, an increase of 83.0 billion yen, or 199.3% year-on-year. For all segments excluding the Financial Services segment, 0.2 billion yen (2 million U.S. dollars) was provided, a decrease of 37.0 billion yen, or 99.6% year-on-year. The decrease was primarily due to the sale and leaseback of machinery and equipment in the same quarter of the previous fiscal year. Sales of fixed assets and businesses in the current quarter included the sale of certain buildings and premises at the Gotenyama Technology Center in Japan and the sale of Sony’s shares in SQUARE ENIX HOLDINGS CO., LTD. The Financial Services segment used 124.9 billion yen (1,237 million U.S. dollars) of net cash, an increase of 46.0 billion yen, or 58.4% year-on-year. This increase was mainly due to a year-on-year decrease in proceeds from the sale of investment securities at Sony Bank.

8
In all segments excluding the Financial Services segment, net cash used in operating and investing activities combined*1 for the current quarter was 27.3 billion yen (269 million U.S. dollars), a decrease of 129.6 billion yen, or 82.6% year-on-year. Financing Activities: During the current quarter, 291.4 billion yen (2,885 million U.S. dollars) of net cash and cash equivalents was used in financing activities, compared to 122.0 billion yen of net cash and cash equivalents provided in the same quarter of the previous fiscal year. For all segments excluding the Financial Services segment, there was a 253.7 billion yen (2,512 million U.S. dollars) net cash outflow, compared to a 94.2 billion yen net cash inflow in the same quarter of the previous fiscal year. This was primarily due to an issuance of straight bonds for Japanese retail investors in the same quarter of the previous fiscal year and the redemption of straight bonds and the repayment of a syndicated loan in the current quarter. In the Financial Services segment, financing activities used 45.5 billion yen (451 million U.S. dollars) of net cash, compared to 21.0 billion yen of net cash provided in the same quarter of the previous fiscal year. This was mainly due to a larger decrease in customer deposits at Sony Bank compared to the same quarter of the previous fiscal year. Total Cash and Cash Equivalents: Accounting for the above factors and the effect of fluctuations in foreign exchange rates, the total outstanding balance of cash and cash equivalents at June 30, 2014 was 687.4 billion yen (6,806 million U.S. dollars). Cash and cash equivalents of all segments excluding the Financial Services segment was 515.9 billion yen (5,108 million U.S. dollars) at June 30, 2014, a decrease of 73.7 billion yen, or 12.5% compared with the balance as of June 30, 2013, and a decrease of 290.3 billion yen, or 36.0% compared with the balance as of March 31, 2014. Sony believes that it continues to maintain sufficient liquidity through access to a total, translated into yen, of 729.4 billion yen (7,222 million U.S. dollars) of unused committed lines of credit with financial institutions in addition to the cash and cash equivalents balance at June 30, 2014. Within the Financial Services segment, the outstanding balance of cash and cash equivalents was 171.5 billion yen (1,698 million U.S. dollars) at June 30, 2014, a decrease of 40.1 billion yen, or 18.9% compared with the balance as of June 30, 2013, and a decrease of 68.8 billion yen, or 28.6% compared with the balance as of March 31, 2014. *1 Sony has included the information for cash flow from operating and investing activities combined, excluding the Financial Services
segment’s activities, as Sony’s management frequently monitors this financial measure, and believes this non-U.S. GAAP measurement is important for use in evaluating Sony’s ability to generate cash to maintain liquidity and fund debt principal and dividend payments from business activities other than its Financial Services segment. This information is derived from the reconciliations prepared in the Condensed Statements of Cash Flows on page F-12. This information and the separate condensed presentations shown below are not required or prepared in accordance with U.S. GAAP. The Financial Services segment’s cash flow is excluded from the measure because SFH, which constitutes a majority of the Financial Services segment, is a separate publicly traded entity in Japan with a significant minority interest and it, as well as its subsidiaries, secure liquidity on their own. This measure may not be comparable to those of other companies. This measure has limitations because it does not represent residual cash flows available for discretionary expenditures principally due to the fact that the measure does not deduct the principal payments required for debt service. Therefore, Sony believes it is important to view this measure as supplemental to its entire statement of cash flows and together with Sony’s disclosures regarding investments, available credit facilities and overall liquidity.
A reconciliation of the differences between the Consolidated Statement of Cash Flows reported and cash flows from operating and investing activities combined excluding the Financial Services segment’s activities is as follows: (Billions of yen, millions of U.S. dollars)
First quarter ended June 30 2013 2014 2014
Net cash provided (used) in operating activities reported in the consolidated statements ofcash flows
¥(133.0) ¥ 66.2 $ 657
Net cash used in investing activities reported in the consolidated statements of cash flows (41.7) (124.7) (1,235) (174.7) (58.5) (578)
Less: Net cash provided by operating activities within the Financial Services segment 67.9 101.6 1,006Less: Net cash used in investing activities within the Financial Services segment (78.8) (124.9) (1,237)Eliminations *2 6.9 7.9 78
Cash flow used in operating and investing activities combined excluding the FinancialServices segment’s activities
¥(156.9) ¥ (27.3) $ (269)
*2 Eliminations primarily consist of intersegment dividend payments.
9
* * * * * Note The descriptions of sales on a constant currency basis reflect sales obtained by applying the yen’s monthly average exchange rates from the same quarter of the previous fiscal year to local currency-denominated monthly sales in the current quarter. In certain cases, most significantly in the Pictures segment and SME and Sony/ATV in the Music segment, the constant currency amounts are after aggregation on a U.S. dollar basis. Sales on a constant currency basis are not reflected in Sony’s consolidated financial statements and are not measures in accordance with U.S. GAAP. Sony does not believe that these measures are a substitute for U.S. GAAP measures. However, Sony believes that disclosing sales information on a constant currency basis provides additional useful analytical information to investors regarding the operating performance of Sony.
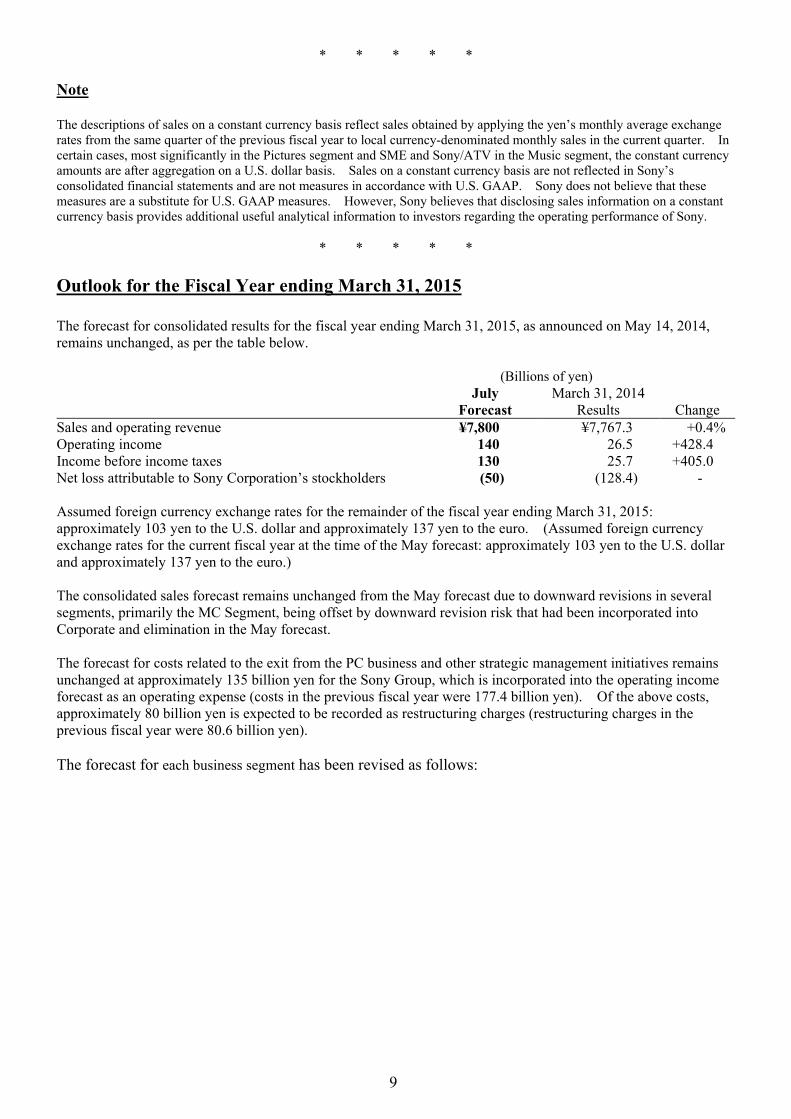
* * * * * Outlook for the Fiscal Year ending March 31, 2015 The forecast for consolidated results for the fiscal year ending March 31, 2015, as announced on May 14, 2014, remains unchanged, as per the table below. (Billions of yen) July
Forecast March 31, 2014
Results Change Sales and operating revenue ¥7,800 ¥7,767.3 +0.4%Operating income 140 26.5 +428.4 Income before income taxes 130 25.7 +405.0 Net loss attributable to Sony Corporation’s stockholders (50) (128.4) - Assumed foreign currency exchange rates for the remainder of the fiscal year ending March 31, 2015: approximately 103 yen to the U.S. dollar and approximately 137 yen to the euro. (Assumed foreign currency exchange rates for the current fiscal year at the time of the May forecast: approximately 103 yen to the U.S. dollar and approximately 137 yen to the euro.) The consolidated sales forecast remains unchanged from the May forecast due to downward revisions in several segments, primarily the MC Segment, being offset by downward revision risk that had been incorporated into Corporate and elimination in the May forecast. The forecast for costs related to the exit from the PC business and other strategic management initiatives remains unchanged at approximately 135 billion yen for the Sony Group, which is incorporated into the operating income forecast as an operating expense (costs in the previous fiscal year were 177.4 billion yen). Of the above costs, approximately 80 billion yen is expected to be recorded as restructuring charges (restructuring charges in the previous fiscal year were 80.6 billion yen). The forecast for each business segment has been revised as follows:

10
(Billions of yen) Change - July Forecast vs. July
ForecastMay
ForecastMarch 31, 2014
Results May
Forecast March 31, 2014
Results Mobile Communications Sales and operating revenue ¥1,360 ¥1,530 ¥1,191.8 -11.1% +14.1% Operating income 0 26 12.6 - - Game & Network Services Sales and operating revenue 1,240 1,220 1,043.9 +1.6 +18.8 Operating income (loss) 25 20 (18.8) +25.0 - Imaging Products & Solutions Sales and operating revenue 700 710 741.2 -1.4 -5.6 Operating income 38 38 26.3 - +44.3 Home Entertainment & Sound Sales and operating revenue 1,230 1,260 1,168.6 -2.4 +5.3 Operating income (loss) 10 10 (25.5) - - Devices Sales and operating revenue 870 870 773.0 - +12.6 Operating income (loss) 51 31 (12.4) +64.5 - Pictures Sales and operating revenue 880 880 829.6 - +6.1 Operating income 65 65 51.6 - +25.9 Music Sales and operating revenue 500 500 503.3 - -0.7 Operating income 48 48 50.2 - -4.4 Financial Services Financial services revenue 1,000 1,000 993.8 - +0.6 Operating income 164 164 170.3 - -3.7 All Other, Corporate and Elimination Operating loss (261) (262) (227.8) - - Consolidated Sales and operating revenue 7,800 7,800 7,767.3 - +0.4 Operating income 140 140 26.5 - +428.4 The forecast for each business segment is as follows: Mobile Communications Sales are expected to be below the May forecast primarily due to an expected decrease in unit sales of mid-range smartphones which were expected to significantly grow mainly in emerging market countries. Operating income is expected to be below the May forecast primarily due to the above-mentioned expected decrease in sales, partially offset by a reduction in marketing expenses and research and development expenses. The factors described above, including the current quarter’s financial performance and the revised full-year forecast for the business, as well as increasingly competitive markets in various areas, could continue to adversely affect the Mobile Communications business. In addition, in light of these developments, in July Sony began a review of its Mid-Range Plan (“MRP”) for the Mobile Communications business. This process is currently on-going, and Sony will continue to evaluate the financial and other consequences of changes, if any, in the MRP or strategic alternatives within the Mobile Communications business, as well as its financial performance. It is possible that the above-described circumstances might result in an impairment charge against various assets, including goodwill, in that reporting segment. Game & Network Services Sales are expected to be higher than the May forecast primarily due to the strong performance of the PS4. Operating income is expected to be higher than the May forecast primarily due to PS4 hardware cost reductions. Imaging Products & Solutions Sales are expected to be below the May forecast primarily due to anticipated lower sales in emerging market countries. Operating income is expected to remain unchanged from the May forecast due to the above-mentioned decrease in sales being offset primarily by cost reductions.

11
Home Entertainment & Sound Sales are expected to be below the May forecast mainly due to a downward revision in the annual unit sales forecast for LCD televisions. Operating income is expected to remain unchanged from the May forecast due to the above-mentioned decrease in sales being offset primarily by cost reductions. Devices Sales are expected to remain unchanged from the May forecast primarily due to an anticipated significant increase in sales of image sensors, offset by the transfer of the power supply business to All Other. Operating income is expected to be higher than the May forecast primarily due to the increase in sales in image sensors. The forecasts for the Pictures, Music and Financial Services segments remain unchanged from the May forecast. The effects of gains and losses on investments held by the Financial Services segment due to market fluctuations have not been incorporated within the above forecast as it is difficult for Sony to predict market trends in the future. Accordingly, future market fluctuations could further impact the current forecast. Sony’s forecast for capital expenditures, depreciation and amortization, as well as research and development expenses for the current fiscal year has been changed as per the table below. (Billions of yen) Change - July Forecast vs. July
ForecastMay
ForecastMarch 31, 2014
Results May
Forecast March 31, 2014
Results Capital expenditures (addition to
property, plant and equipment) ¥195 ¥180 ¥164.6 +8.3% +18.5%
Depreciation and amortization* 365 370 376.7 -1.4 -3.1 [for property, plant and equipment (included above)
175 180 195.8 -2.8 -10.6]
Research and development expenses 485 485 466.0 - +4.1 * The forecast for depreciation and amortization includes amortization expenses for intangible assets and for deferred insurance acquisition
costs. This forecast is based on management’s current expectations and is subject to uncertainties and changes in circumstances. Actual results may differ materially from those included in this forecast due to a variety of factors. See “Cautionary Statement” below.
12
Cautionary Statement
Statements made in this release with respect to Sony’s current plans, estimates, strategies and beliefs and other statements that are not historical facts are forward-looking statements about the future performance of Sony. Forward-looking statements include, but are not limited to, those statements using words such as “believe,” “expect,” “plans,” “strategy,” “prospects,” “forecast,” “estimate,” “project,” “anticipate,” “aim,” “intend,” “seek,” “may,” “might,” “could” or “should,” and words of similar meaning in connection with a discussion of future operations, financial performance, events or conditions. From time to time, oral or written forward-looking statements may also be included in other materials released to the public. These statements are based on management’s assumptions, judgments and beliefs in light of the information currently available to it. Sony cautions investors that a number of important risks and uncertainties could cause actual results to differ materially from those discussed in the forward-looking statements, and therefore investors should not place undue reliance on them. Investors also should not rely on any obligation of Sony to update or revise any forward-looking statements, whether as a result of new information, future events or otherwise. Sony disclaims any such obligation. Risks and uncertainties that might affect Sony include, but are not limited to: (i) the global economic environment in which Sony operates and the economic conditions in Sony’s markets, particularly levels of
consumer spending; (ii) foreign exchange rates, particularly between the yen and the U.S. dollar, the euro and other currencies in which Sony makes significant
sales and incurs production costs, or in which Sony’s assets and liabilities are denominated; (iii) Sony’s ability to continue to design and develop and win acceptance of, as well as achieve sufficient cost reductions for, its products
and services, including televisions, game platforms and smartphones, which are offered in highly competitive markets characterized by severe price competition and continual new product and service introductions, rapid development in technology and subjective and changing consumer preferences;
(iv) Sony’s ability and timing to recoup large-scale investments required for technology development and production capacity; (v) Sony’s ability to implement successful business restructuring and transformation efforts under changing market conditions; (vi) Sony’s ability to implement successful hardware, software, and content integration strategies for all segments excluding the Financial
Services segment, and to develop and implement successful sales and distribution strategies in light of the Internet and other technological developments;
(vii) Sony’s continued ability to devote sufficient resources to research and development and, with respect to capital expenditures, to prioritize investments correctly (particularly in the electronics businesses);
(viii) Sony’s ability to maintain product quality; (ix) the effectiveness of Sony’s strategies and their execution, including but not limited to the success of Sony’s acquisitions, joint ventures
and other strategic investments; (x) significant volatility and disruption in the global financial markets or a ratings downgrade; (xi) Sony’s ability to forecast demands, manage timely procurement and control inventories; (xii) the outcome of pending and/or future legal and/or regulatory proceedings; (xiii) shifts in customer demand for financial services such as life insurance and Sony’s ability to conduct successful asset liability
management in the Financial Services segment; (xiv) the impact of unfavorable conditions or developments (including market fluctuations or volatility) in the Japanese equity markets on
the revenue and operating income of the Financial Services segment; and (xv) risks related to catastrophic disasters or similar events. Risks and uncertainties also include the impact of any future events with material adverse impact. Investor Relations Contacts:
Tokyo New York London Atsuko Murakami Justin Hill Haruna Nagai +81-(0)3-6748-2111 +1-212-833-6722 +44-(0)20-7426-8696
IR home page: http://www.sony.net/IR/ Presentation slides: http://www.sony.net/SonyInfo/IR/financial/fr/14q1_sonypre.pdf

(Unaudited)Consolidated Financial StatementsConsolidated Balance Sheets
Current assets:Cash and cash equivalents \ 1,046,466 \ 687,405 \ -359,061 $ 6,806 Marketable securities 832,566 858,964 +26,398 8,505 Notes and accounts receivable, trade 946,553 963,736 +17,183 9,542 Allowance for doubtful accounts and sales returns (75,513) (65,734) +9,779 (651)Inventories 733,943 792,027 +58,084 7,842 Other receivables 224,630 235,470 +10,840 2,331 Deferred income taxes 53,068 45,489 -7,579 450 Prepaid expenses and other current assets 443,173 457,670 +14,497 4,532 Total current assets 4,204,886 3,975,027 -229,859 39,357
Film costs 275,799 264,440 -11,359 2,618
Investments and advances:Affiliated companies 181,263 182,271 +1,008 1,805 Securities investments and other 7,737,748 7,850,517 +112,769 77,728
7,919,011 8,032,788 +113,777 79,533
Property, plant and equipment:Land 125,890 125,386 -504 1,241 Buildings 674,841 674,749 -92 6,681 Machinery and equipment 1,705,774 1,693,853 -11,921 16,771 Construction in progress 39,771 38,160 -1,611 378
2,546,276 2,532,148 -14,128 25,071 Less-Accumulated depreciation 1,796,266 1,790,302 -5,964 17,726
750,010 741,846 -8,164 7,345
Other assets:Intangibles, net 675,663 654,575 -21,088 6,481 Goodwill 691,803 682,952 -8,851 6,762 Deferred insurance acquisition costs 497,772 503,156 +5,384 4,982 Deferred income taxes 105,442 107,652 +2,210 1,066 Other 213,334 203,685 -9,649 2,016
2,184,014 2,152,020 -31,994 21,307
Total assets \ 15,333,720 \ 15,166,121 \ -167,599 $ 150,160
Current liabilities:Short-term borrowings \ 111,836 \ 92,416 \ -19,420 $ 915 Current portion of long-term debt 265,918 116,470 -149,448 1,153 Notes and accounts payable, trade 712,829 757,901 +45,072 7,504 Accounts payable, other and accrued expenses 1,175,413 1,098,690 -76,723 10,878 Accrued income and other taxes 81,842 89,705 +7,863 888 Deposits from customers in the banking business 1,890,023 1,829,708 -60,315 18,116 Other 545,753 546,240 +487 5,409 Total current liabilities 4,783,614 4,531,130 -252,484 44,863
Long-term debt 916,648 854,259 -62,389 8,458 Accrued pension and severance costs 284,963 280,338 -4,625 2,776 Deferred income taxes 410,896 423,633 +12,737 4,194 Future insurance policy benefits and other 3,824,572 3,903,227 +78,655 38,646 Policyholders’ account in the life insurance business 2,023,472 2,075,157 +51,685 20,546 Other 302,299 302,281 -18 2,993 Total liabilities 12,546,464 12,370,025 -176,439 122,476
Redeemable noncontrolling interest 4,115 4,129 +14 41
Equity:Sony Corporation’s stockholders’ equity:
Common stock 646,654 646,663 +9 6,403 Additional paid-in capital 1,127,090 1,124,985 -2,105 11,138 Retained earnings 940,262 967,066 +26,804 9,575 Accumulated other comprehensive income (451,585) (473,418) -21,833 (4,687)Treasury stock, at cost (4,284) (4,297) -13 (43)
2,258,137 2,260,999 +2,862 22,386
Noncontrolling interests 525,004 530,968 +5,964 5,257 Total equity 2,783,141 2,791,967 +8,826 27,643 Total liabilities and equity \ 15,333,720 \ 15,166,121 \ -167,599 $ 150,160
LIABILITIES AND EQUITY
ASSETS 2014 2014 2014
(Millions of yen, millions of U.S. dollars)March 31 June 30 Change from June 30
March 31, 2014
F-1
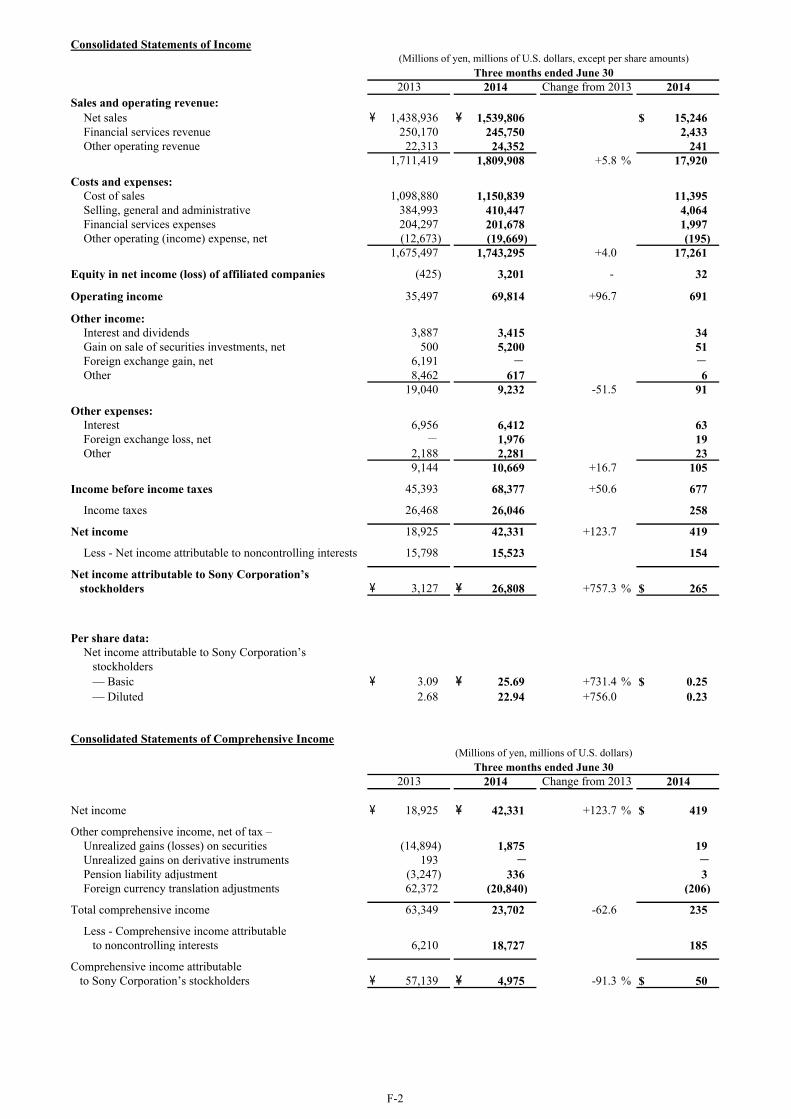
Sales and operating revenue:Net sales \ 1,438,936 \ 1,539,806 $ 15,246 Financial services revenue 250,170 245,750 2,433 Other operating revenue 22,313 24,352 241
1,711,419 1,809,908 +5.8 % 17,920
Costs and expenses:Cost of sales 1,098,880 1,150,839 11,395 Selling, general and administrative 384,993 410,447 4,064 Financial services expenses 204,297 201,678 1,997 Other operating (income) expense, net (12,673) (19,669) (195)
1,675,497 1,743,295 +4.0 17,261
Equity in net income (loss) of affiliated companies (425) 3,201 - 32
Operating income 35,497 69,814 +96.7 691
Other income:Interest and dividends 3,887 3,415 34 Gain on sale of securities investments, net 500 5,200 51 Foreign exchange gain, net 6,191 - -Other 8,462 617 6
19,040 9,232 -51.5 91
Other expenses:Interest 6,956 6,412 63 Foreign exchange loss, net - 1,976 19 Other 2,188 2,281 23
9,144 10,669 +16.7 105
Income before income taxes 45,393 68,377 +50.6 677
Income taxes 26,468 26,046 258
Net income 18,925 42,331 +123.7 419
Less - Net income attributable to noncontrolling interests 15,798 15,523 154
Net income attributable to Sony Corporation’s stockholders \ 3,127 \ 26,808 +757.3 % $ 265
Per share data:Net income attributable to Sony Corporation’s stockholders — Basic \ 3.09 \ 25.69 +731.4 % $ 0.25 — Diluted 2.68 22.94 +756.0 0.23
Net income \ 18,925 \ 42,331 +123.7 % $ 419
Other comprehensive income, net of tax –Unrealized gains (losses) on securities (14,894) 1,875 19 Unrealized gains on derivative instruments 193 - -Pension liability adjustment (3,247) 336 3 Foreign currency translation adjustments 62,372 (20,840) (206)
Total comprehensive income 63,349 23,702 -62.6 235
Less - Comprehensive income attributable to noncontrolling interests 6,210 18,727 185
Comprehensive income attributable to Sony Corporation’s stockholders \ 57,139 \ 4,975 -91.3 % $ 50
Consolidated Statements of Comprehensive Income(Millions of yen, millions of U.S. dollars)
Three months ended June 302013 2014 Change from 2013 2014
Consolidated Statements of Income(Millions of yen, millions of U.S. dollars, except per share amounts)
Three months ended June 302013 2014 2014Change from 2013
F-2
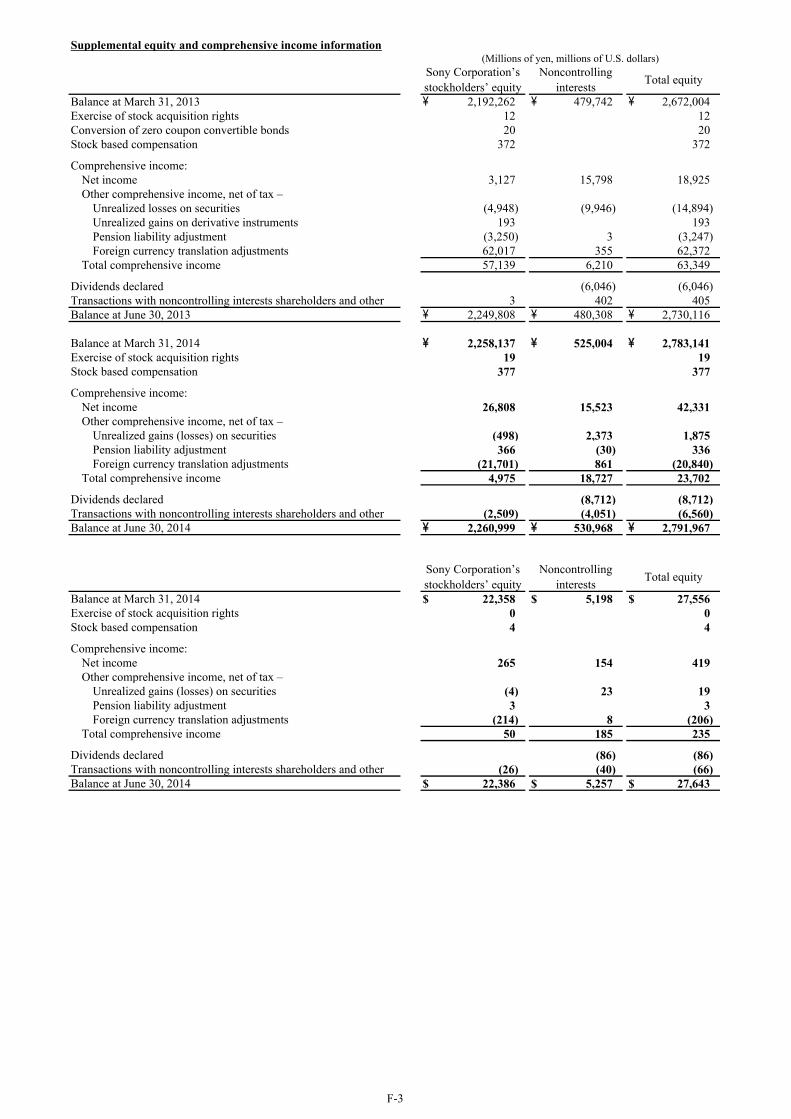
Supplemental equity and comprehensive income information
Balance at March 31, 2013 \ 2,192,262 \ 479,742 \ 2,672,004 Exercise of stock acquisition rights 12 12 Conversion of zero coupon convertible bonds 20 20 Stock based compensation 372 372
Comprehensive income:Net income 3,127 15,798 18,925 Other comprehensive income, net of tax –
Unrealized losses on securities (4,948) (9,946) (14,894)Unrealized gains on derivative instruments 193 193 Pension liability adjustment (3,250) 3 (3,247)Foreign currency translation adjustments 62,017 355 62,372
Total comprehensive income 57,139 6,210 63,349
Dividends declared (6,046) (6,046)Transactions with noncontrolling interests shareholders and other 3 402 405 Balance at June 30, 2013 \ 2,249,808 \ 480,308 \ 2,730,116
Balance at March 31, 2014 \ 2,258,137 \ 525,004 \ 2,783,141 Exercise of stock acquisition rights 19 19 Stock based compensation 377 377
Comprehensive income:Net income 26,808 15,523 42,331 Other comprehensive income, net of tax –
Unrealized gains (losses) on securities (498) 2,373 1,875 Pension liability adjustment 366 (30) 336 Foreign currency translation adjustments (21,701) 861 (20,840)
Total comprehensive income 4,975 18,727 23,702
Dividends declared (8,712) (8,712)Transactions with noncontrolling interests shareholders and other (2,509) (4,051) (6,560)Balance at June 30, 2014 \ 2,260,999 \ 530,968 \ 2,791,967
Balance at March 31, 2014 $ 22,358 $ 5,198 $ 27,556 Exercise of stock acquisition rights 0 0 Stock based compensation 4 4
Comprehensive income:Net income 265 154 419 Other comprehensive income, net of tax –
Unrealized gains (losses) on securities (4) 23 19 Pension liability adjustment 3 3 Foreign currency translation adjustments (214) 8 (206)
Total comprehensive income 50 185 235
Dividends declared (86) (86)Transactions with noncontrolling interests shareholders and other (26) (40) (66)Balance at June 30, 2014 $ 22,386 $ 5,257 $ 27,643
(Millions of yen, millions of U.S. dollars)Sony Corporation’sstockholders’ equity
Noncontrollinginterests
Total equity
Sony Corporation’sstockholders’ equity
Noncontrollinginterests
Total equity
F-3

Consolidated Statements of Cash Flows
Cash flows from operating activities:Net income \ 18,925 \ 42,331 $ 419Adjustments to reconcile net income to net cashprovided by (used in) operating activities:
Depreciation and amortization, including amortization of deferred insurance acquisition costs 92,929 84,298 835Amortization of film costs 56,324 70,892 702Stock-based compensation expense 374 376 4Accrual for pension and severance costs, less payments (1,702) (3,433) (34)Other operating (income) expense, net (12,673) (19,669) (195)Gain on sale or devaluation of securities investments, net (460) (5,198) (51)Gain on revaluation of marketable securities held in the financial services business for trading purposes, net (21,569) (10,287) (102)(Gain) loss on revaluation or impairment of securities investments held in the financial services business, net 266 (1,196) (12)Deferred income taxes (4,381) 4,888 48Equity in net (income) loss of affiliated companies, net of dividends 648 (2,046) (20)Changes in assets and liabilities: Increase in notes and accounts receivable, trade (51,916) (38,005) (376) Increase in inventories (113,680) (65,977) (653) Increase in film costs (79,056) (63,690) (631) Increase in notes and accounts payable, trade 162,054 51,364 509 Decrease in accrued income and other taxes (19,744) (1,776) (18) Increase in future insurance policy benefits and other 108,162 101,663 1,007 Increase in deferred insurance acquisition costs (20,049) (18,526) (183) Increase in marketable securities held in the financial services business for trading purposes (10,814) (8,143) (81) Increase in other current assets (106,791) (19,940) (197) Decrease in other current liabilities (108,160) (43,164) (427)Other (21,650) 11,480 113 Net cash provided by (used in) operating activities (132,963) 66,242 657
Cash flows from investing activities:Payments for purchases of fixed assets (62,926) (51,490) (510)Proceeds from sales of fixed assets 84,658 26,014 258Payments for investments and advances by financial services business (244,629) (224,724) (2,225)Payments for investments and advances (other than financial services business) (1,858) (4,481) (44)Proceeds from sales or return of investments and collections of advances by financial services business 167,185 101,317 1,003Proceeds from sales or return of investments and collections of advances (other than financial services business) 2,339 26,092 258Other 13,567 2,575 25
Net cash used in investing activities (41,664) (124,697) (1,235)
Cash flows from financing activities:Proceeds from issuance of long-term debt 161,007 8,999 89 Payments of long-term debt (33,304) (219,689) (2,175) Increase (decrease) in short-term borrowings, net 14,894 (19,015) (188) Increase (decrease) in deposits from customers in the financial services business, net 18,266 (32,462) (321) Dividends paid (12,679) (13,100) (130) Other (26,189) (16,087) (160)
Net cash provided by (used in) financing activities 121,995 (291,354) (2,885)
Effect of exchange rate changes on cash and cash equivalents 27,462 (9,252) (92)
Net decrease in cash and cash equivalents (25,170) (359,061) (3,555) Cash and cash equivalents at beginning of the fiscal year 826,361 1,046,466 10,361
Cash and cash equivalents at end of the period \ 801,191 \ 687,405 $ 6,806
(Millions of yen, millions of U.S. dollars)
2013 2014 2014Three months ended June 30
F-4

Business Segment Information
Sales and operating revenueMobile Communications
Customers \ 285,457 \ 314,310 +10.1 % $ 3,112 Intersegment 9 8 0 Total 285,466 314,318 +10.1 3,112
Game & Network ServicesCustomers 115,094 231,368 +101.0 2,291 Intersegment 16,493 26,162 259 Total 131,587 257,530 +95.7 2,550
Imaging Products & SolutionsCustomers 179,825 164,136 -8.7 1,625 Intersegment 1,063 464 5 Total 180,888 164,600 -9.0 1,630
Home Entertainment & SoundCustomers 274,114 285,053 +4.0 2,822 Intersegment 1,062 695 7 Total 275,176 285,748 +3.8 2,829
2Devices
Customers 145,677 144,738 -0.6 1,433 Intersegment 44,699 39,350 390 Total 190,376 184,088 -3.3 1,823
PicturesCustomers 158,802 194,666 +22.6 1,927 Intersegment 113 104 1 Total 158,915 194,770 +22.6 1,928
MusicCustomers 109,175 113,476 +3.9 1,124 Intersegment 2,784 3,387 33 Total 111,959 116,863 +4.4 1,157
Financial ServicesCustomers 250,170 245,750 -1.8 2,433 Intersegment 1,235 1,217 12 Total 251,405 246,967 -1.8 2,445
All OtherCustomers 177,684 104,632 -41.1 1,036 Intersegment 16,800 24,140 239 Total 194,484 128,772 -33.8 1,275
Corporate and elimination (68,837) (83,748) - (829)Consolidated total \ 1,711,419 \ 1,809,908 +5.8 % $ 17,920
Mobile Communications \ 12,566 \ (2,740) - % $ (27)Game & Network Services (16,370) 4,319 - 43 Imaging Products & Solutions 9,097 17,409 +91.4 172 Home Entertainment & Sound 3,367 7,661 +127.5 76 Devices 10,845 12,536 +15.6 124 Pictures 3,742 7,831 +109.3 78 Music 10,771 11,386 +5.7 113 Financial Services 45,109 43,772 -3.0 433 All Other (16,921) (18,432) - (183)Total 62,206 83,742 +34.6 829
Corporate and elimination (26,709) (13,928) - (138)Consolidated total \ 35,497 \ 69,814 +96.7 % $ 691
Game & Network Services (“G&NS”) intersegment amounts primarily consist of transactions with All Other.Devices intersegment amounts primarily consist of transactions with the Mobile Communications segment, the G&NS segment and the ImagingProducts & Solutions (“IP&S”) segment.All Other intersegment amounts primarily consist of transactions with the Pictures segment, the Music segment and the G&NS segment.Corporate and elimination includes certain brand and patent royalty income.
The 2013 segment disclosure above has been reclassified to reflect the change in the business segment classification discussed in Note 5.Operating income (loss) is sales and operating revenue less costs and expenses, and includes equity in net income (loss) of affiliated companies.Corporate and elimination includes headquarters restructuring costs and certain other corporate expenses, including the amortization of certainintellectual property assets such as the cross-licensing of intangible assets acquired from Ericsson at the time of the Sony Mobile Communicationsacquisition, which are not allocated to segments.
Within the Home Entertainment & Sound (“HE&S”) segment, the operating income of Televisions, which primarily consists of LCD televisions, forthe three months ended June 30, 2013 and 2014 was 5,207 million yen and 7,916 million yen, respectively. The operating income of Televisionsexcludes restructuring charges which are included in the overall segment results and are not allocated to product categories.
(Millions of yen, millions of U.S. dollars)Three months ended June 30
Operating income (loss) 2013 2014 Change 2014
(Millions of yen, millions of U.S. dollars)Three months ended June 30
2013 2014 Change 2014
F-5

Sales to Customers by Product Category
Mobile Communications \ 285,457 \ 314,310 +10.1 % $ 3,112
Game & Network Services 115,094 231,368 +101.0 2,291
Imaging Products & SolutionsDigital Imaging Products 114,420 106,135 -7.2 1,050 Professional Solutions 61,464 55,716 -9.4 552 Other 3,941 2,285 -42.0 23 Total 179,825 164,136 -8.7 1,625
Home Entertainment & SoundTelevisions 185,579 204,989 +10.5 2,030 Audio and Video 87,381 79,420 -9.1 786 Other 1,154 644 -44.2 6 Total 274,114 285,053 +4.0 2,822
DevicesSemiconductors 85,257 85,028 -0.3 842 Components 59,896 59,465 -0.7 589 Other 524 245 -53.2 2 Total 145,677 144,738 -0.6 1,433
PicturesMotion Pictures 71,234 104,626 +46.9 1,036 Television Productions 40,030 42,362 +5.8 419 Media Networks 47,538 47,678 +0.3 472 Total 158,802 194,666 +22.6 1,927
MusicRecorded Music 80,674 79,395 -1.6 787 Music Publishing 12,581 16,288 +29.5 161 Visual Media and Platform 15,920 17,793 +11.8 176 Total 109,175 113,476 +3.9 1,124
Financial Services 250,170 245,750 -1.8 2,433 All Other 177,684 104,632 -41.1 1,036 Corporate 15,421 11,779 -23.6 117
Consolidated total \ 1,711,419 \ 1,809,908 +5.8 % $ 17,920
The above table includes a breakdown of sales and operating revenue to external customers for certain segments shown in theBusiness Segment Information on page F-5. Sony management views each segment as a single operating segment. However, Sonybelieves that the breakdown of sales and operating revenue to external customers for the segments in this table is useful to investorsin understanding sales by product category.
Sony has realigned its product category configuration from the first quarter of the fiscal year ending March 31, 2015. Inconnection with the realignment, all prior period sales amounts by product category in the table above have been reclassified toconform to the current presentation.
In the IP&S segment, Digital Imaging Products includes compact digital cameras, interchangeable single-lens cameras and videocameras; Professional Solutions includes broadcast- and professional-use products. In the HE&S segment, Televisions includesLCD televisions; Audio and Video includes Blu-ray disc players and recorders, home audio, headphones, and memory-basedportable audio devices. In the Devices segment, Semiconductors includes image sensors; Components includes batteries, recordingmedia and data recording systems. In the Pictures segment, Motion Pictures includes the production, acquisition and distribution ofmotion pictures; Television Productions includes the production, acquisition and distribution of television programming; MediaNetworks includes the operation of television and digital networks. In the Music segment, Recorded Music includes thedistribution of physical and digital recorded music and revenue derived from artists’ live performances; Music Publishing includesthe management and licensing of the words and music of songs; Visual Media and Platform includes various service offerings formusic and visual products and the production and distribution of animation titles.
(Millions of yen, millions of U.S. dollars)Three months ended June 30
2013 2014 Change 2014Sales and operating revenue (to external customers)
F-6
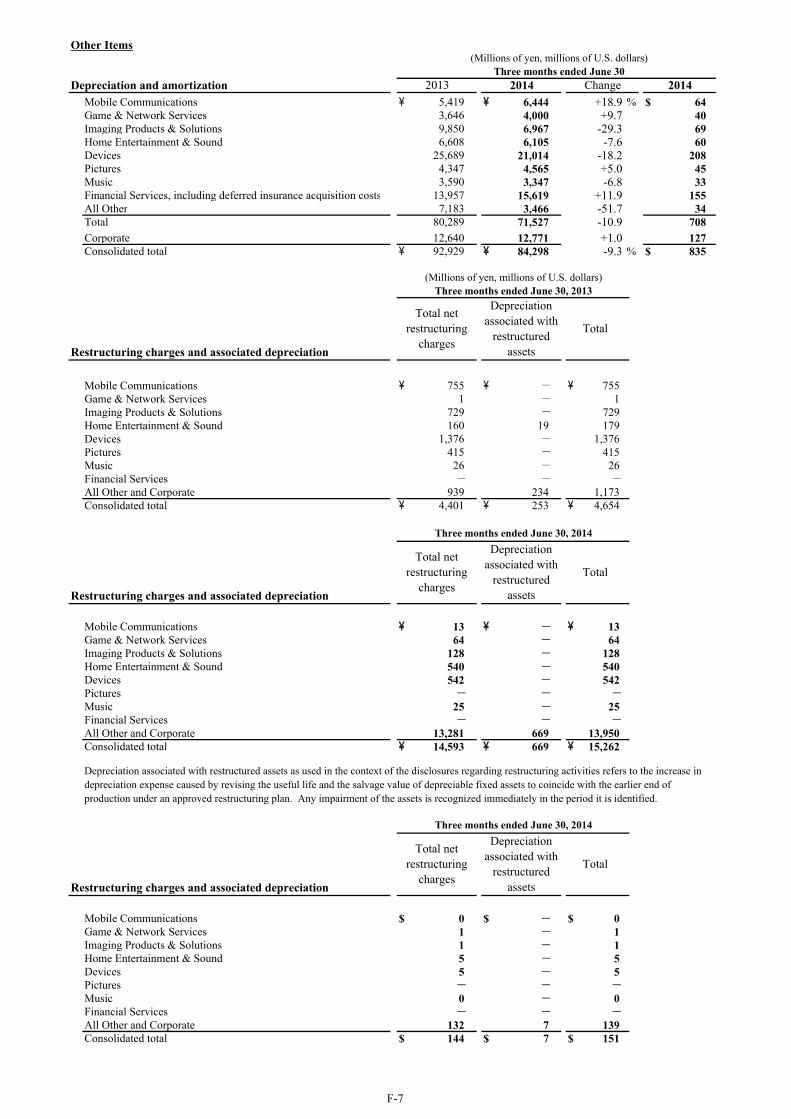
Other Items
Mobile Communications \ 5,419 \ 6,444 +18.9 % $ 64 Game & Network Services 3,646 4,000 +9.7 40 Imaging Products & Solutions 9,850 6,967 -29.3 69 Home Entertainment & Sound 6,608 6,105 -7.6 60 Devices 25,689 21,014 -18.2 208 Pictures 4,347 4,565 +5.0 45 Music 3,590 3,347 -6.8 33 Financial Services, including deferred insurance acquisition costs 13,957 15,619 +11.9 155 All Other 7,183 3,466 -51.7 34 Total 80,289 71,527 -10.9 708
Corporate 12,640 12,771 +1.0 127 Consolidated total \ 92,929 \ 84,298 -9.3 % $ 835
Mobile Communications \ 755 \ - \ 755 Game & Network Services 1 - 1 Imaging Products & Solutions 729 - 729 Home Entertainment & Sound 160 19 179 Devices 1,376 - 1,376 Pictures 415 - 415 Music 26 - 26 Financial Services - - -All Other and Corporate 939 234 1,173 Consolidated total \ 4,401 \ 253 \ 4,654
Mobile Communications \ 13 \ - \ 13 Game & Network Services 64 - 64 Imaging Products & Solutions 128 - 128 Home Entertainment & Sound 540 - 540 Devices 542 - 542 Pictures - - -Music 25 - 25 Financial Services - - -All Other and Corporate 13,281 669 13,950 Consolidated total \ 14,593 \ 669 \ 15,262
Mobile Communications $ 0 $ - $ 0 Game & Network Services 1 - 1 Imaging Products & Solutions 1 - 1 Home Entertainment & Sound 5 - 5 Devices 5 - 5 Pictures - - -Music 0 - 0 Financial Services - - -All Other and Corporate 132 7 139 Consolidated total $ 144 $ 7 $ 151
(Millions of yen, millions of U.S. dollars)
(Millions of yen, millions of U.S. dollars)Three months ended June 30
Depreciation and amortization 2013 2014 2014Change
Restructuring charges and associated depreciation
Total netrestructuring
charges
Depreciationassociated with
restructuredassets
Total
Depreciation associated with restructured assets as used in the context of the disclosures regarding restructuring activities refers to the increase indepreciation expense caused by revising the useful life and the salvage value of depreciable fixed assets to coincide with the earlier end ofproduction under an approved restructuring plan. Any impairment of the assets is recognized immediately in the period it is identified.
Three months ended June 30, 2014
Three months ended June 30, 2014
Restructuring charges and associated depreciation
Total netrestructuring
charges
Depreciationassociated with
restructuredassets
Three months ended June 30, 2013
Restructuring charges and associated depreciation
Total netrestructuring
charges
Depreciationassociated with
restructuredassets
Total
Total
F-7
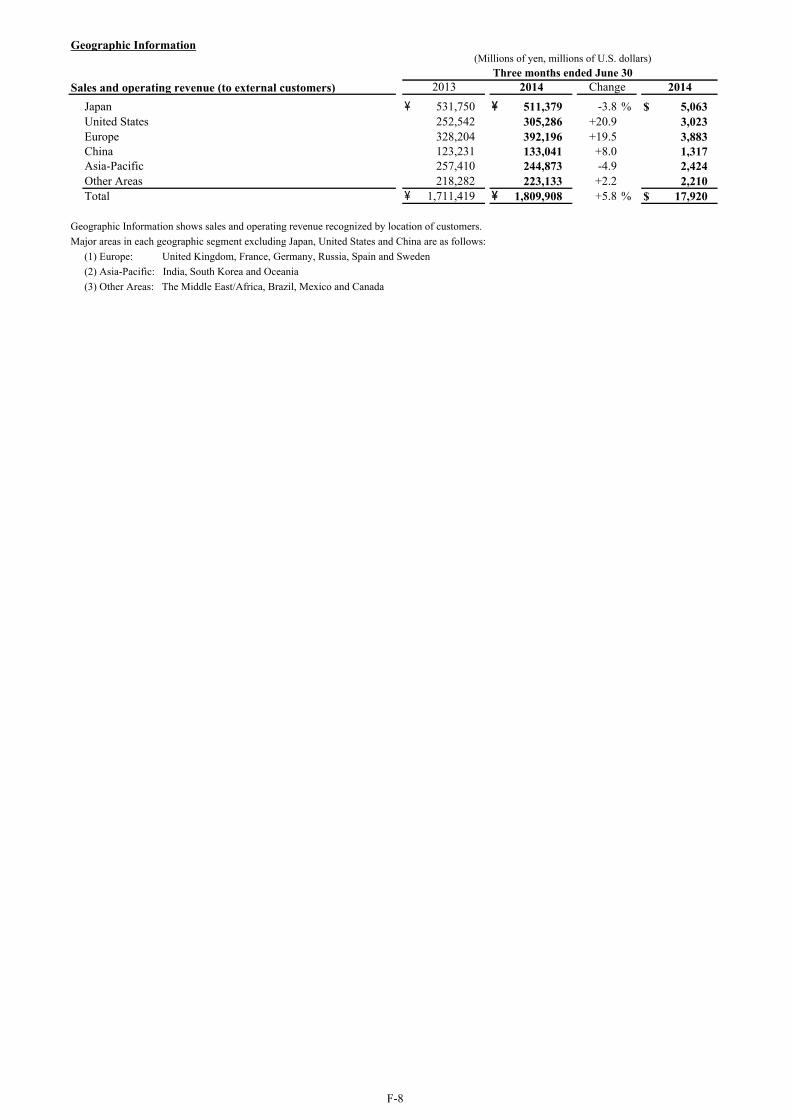
Geographic Information
Sales and operating revenue (to external customers)
Japan \ 531,750 \ 511,379 -3.8 % $ 5,063 United States 252,542 305,286 +20.9 3,023 Europe 328,204 392,196 +19.5 3,883 China 123,231 133,041 +8.0 1,317 Asia-Pacific 257,410 244,873 -4.9 2,424 Other Areas 218,282 223,133 +2.2 2,210 Total \ 1,711,419 \ 1,809,908 +5.8 % $ 17,920
Geographic Information shows sales and operating revenue recognized by location of customers.
Major areas in each geographic segment excluding Japan, United States and China are as follows:
(1) Europe: United Kingdom, France, Germany, Russia, Spain and Sweden
(2) Asia-Pacific: India, South Korea and Oceania
(3) Other Areas: The Middle East/Africa, Brazil, Mexico and Canada
(Millions of yen, millions of U.S. dollars)Three months ended June 30
2013 2014 Change 2014
F-8
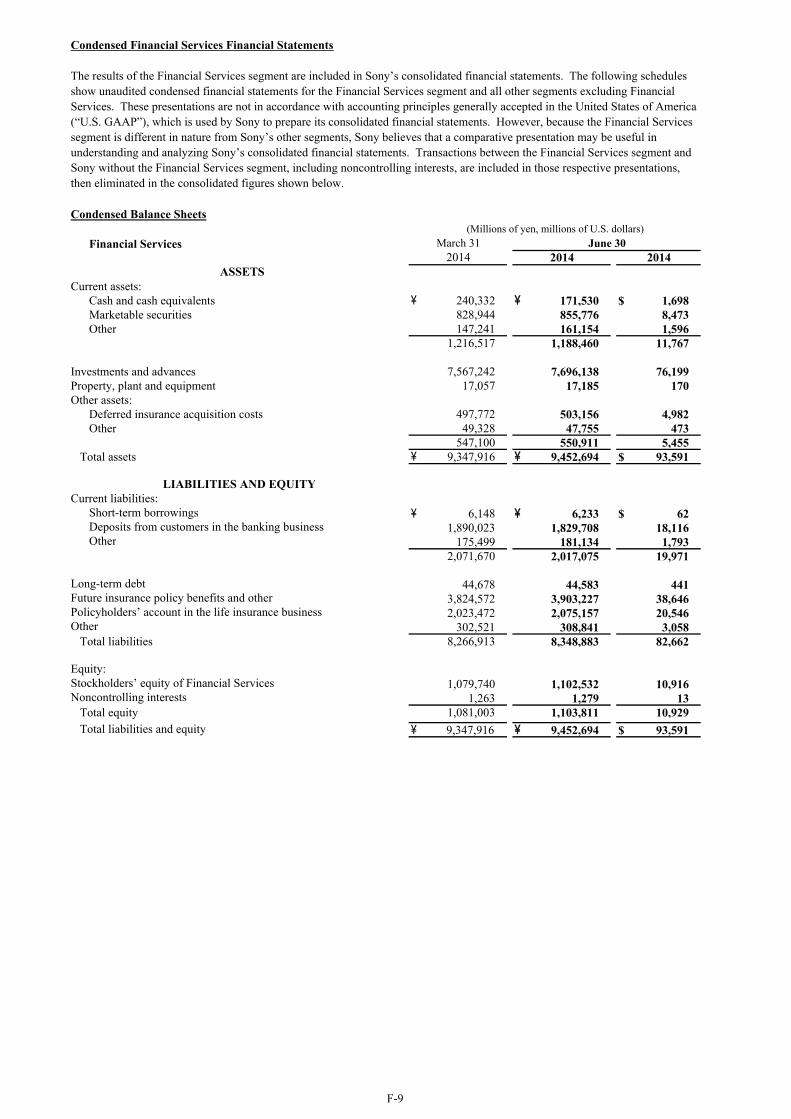
Condensed Financial Services Financial Statements
Condensed Balance Sheets
Financial Services
Current assets:Cash and cash equivalents \ 240,332 \ 171,530 $ 1,698 Marketable securities 828,944 855,776 8,473 Other 147,241 161,154 1,596
1,216,517 1,188,460 11,767
Investments and advances 7,567,242 7,696,138 76,199 Property, plant and equipment 17,057 17,185 170 Other assets:
Deferred insurance acquisition costs 497,772 503,156 4,982 Other 49,328 47,755 473
547,100 550,911 5,455 Total assets \ 9,347,916 \ 9,452,694 $ 93,591
Current liabilities:Short-term borrowings \ 6,148 \ 6,233 $ 62 Deposits from customers in the banking business 1,890,023 1,829,708 18,116 Other 175,499 181,134 1,793
2,071,670 2,017,075 19,971
Long-term debt 44,678 44,583 441 Future insurance policy benefits and other 3,824,572 3,903,227 38,646 Policyholders’ account in the life insurance business 2,023,472 2,075,157 20,546 Other 302,521 308,841 3,058
Total liabilities 8,266,913 8,348,883 82,662
Equity:Stockholders’ equity of Financial Services 1,079,740 1,102,532 10,916 Noncontrolling interests 1,263 1,279 13
Total equity 1,081,003 1,103,811 10,929 Total liabilities and equity \ 9,347,916 \ 9,452,694 $ 93,591
(Millions of yen, millions of U.S. dollars)
The results of the Financial Services segment are included in Sony’s consolidated financial statements. The following schedulesshow unaudited condensed financial statements for the Financial Services segment and all other segments excluding FinancialServices. These presentations are not in accordance with accounting principles generally accepted in the United States of America(“U.S. GAAP”), which is used by Sony to prepare its consolidated financial statements. However, because the Financial Servicessegment is different in nature from Sony’s other segments, Sony believes that a comparative presentation may be useful inunderstanding and analyzing Sony’s consolidated financial statements. Transactions between the Financial Services segment andSony without the Financial Services segment, including noncontrolling interests, are included in those respective presentations,then eliminated in the consolidated figures shown below.
ASSETS
LIABILITIES AND EQUITY
2014 2014 2014March 31 June 30
F-9

Current assets:Cash and cash equivalents \ 806,134 \ 515,875 $ 5,108 Marketable securities 3,622 3,188 32 Notes and accounts receivable, trade 864,178 892,158 8,833 Other 1,316,653 1,377,429 13,637
2,990,587 2,788,650 27,610
Film costs 275,799 264,440 2,618 Investments and advances 381,076 365,578 3,620 Investments in Financial Services, at cost 111,476 111,476 1,104 Property, plant and equipment 732,953 724,661 7,175 Other assets 1,640,385 1,604,582 15,887
Total assets \ 6,132,276 \ 5,859,387 $ 58,014
Current liabilities:Short-term borrowings \ 371,606 \ 202,653 $ 2,006 Notes and accounts payable, trade 712,829 757,901 7,504 Other 1,629,728 1,555,587 15,402
2,714,163 2,516,141 24,912
Long-term debt 875,440 813,148 8,051 Accrued pension and severance costs 262,558 257,500 2,550 Other 462,386 468,837 4,642
Total liabilities 4,314,547 4,055,626 40,155
Redeemable noncontrolling interest 4,115 4,129 41
Equity:Stockholders’ equity of Sony without Financial Services 1,722,743 1,711,931 16,950 Noncontrolling interests 90,871 87,701 868
Total equity 1,813,614 1,799,632 17,818
Total liabilities and equity \ 6,132,276 \ 5,859,387 $ 58,014
Current assets:Cash and cash equivalents \ 1,046,466 \ 687,405 $ 6,806 Marketable securities 832,566 858,964 8,505 Notes and accounts receivable, trade 871,040 898,002 8,891 Other 1,454,814 1,530,656 15,155
4,204,886 3,975,027 39,357
Film costs 275,799 264,440 2,618 Investments and advances 7,919,011 8,032,788 79,533 Property, plant and equipment 750,010 741,846 7,345 Other assets:
Deferred insurance acquisition costs 497,772 503,156 4,982 Other 1,686,242 1,648,864 16,325
2,184,014 2,152,020 21,307
Total assets \ 15,333,720 \ 15,166,121 $ 150,160
Current liabilities:Short-term borrowings \ 377,754 \ 208,886 $ 2,068 Notes and accounts payable, trade 712,829 757,901 7,504 Deposits from customers in the banking business 1,890,023 1,829,708 18,116 Other 1,803,008 1,734,635 17,175
4,783,614 4,531,130 44,863
Long-term debt 916,648 854,259 8,458 Accrued pension and severance costs 284,963 280,338 2,776 Future insurance policy benefits and other 3,824,572 3,903,227 38,646 Policyholders’ account in the life insurance business 2,023,472 2,075,157 20,546 Other 713,195 725,914 7,187
Total liabilities 12,546,464 12,370,025 122,476
Redeemable noncontrolling interest 4,115 4,129 41
Equity:Sony Corporation’s stockholders’ equity 2,258,137 2,260,999 22,386 Noncontrolling interests 525,004 530,968 5,257
Total equity 2,783,141 2,791,967 27,643
Total liabilities and equity \ 15,333,720 \ 15,166,121 $ 150,160
2014 2014
(Millions of yen, millions of U.S. dollars)June 30
2014 2014 2014March 31Sony without Financial Services
ASSETS
LIABILITIES AND EQUITY
2014
ASSETS
LIABILITIES AND EQUITY
Consolidated March 31(Millions of yen, millions of U.S. dollars)
June 30
F-10

Condensed Statements of Income
Financial services revenue \ 251,405 \ 246,967 -1.8 % $ 2,445 Financial services expenses 205,549 202,917 -1.3 2,009 Equity in net loss of affiliated companies (747) (278) - (3)Operating income 45,109 43,772 -3.0 433 Other income (expenses), net 57 - - -Income before income taxes 45,166 43,772 -3.1 433 Income taxes and other 14,905 13,851 -7.1 137 Net income of Financial Services \ 30,261 \ 29,921 -1.1 % $ 296
Net sales and operating revenue \ 1,461,554 \ 1,565,285 +7.1 % $ 15,498 Costs and expenses 1,471,969 1,542,723 +4.8 15,274 Equity in net income of affiliated companies 322 3,479 +980.4 34 Operating income (loss) (10,093) 26,041 - 258 Other income (expenses), net 16,845 6,393 -62.0 63 Income before income taxes 6,752 32,434 +380.4 321 Income taxes and other 15,256 15,748 +3.2 156 Net income (loss) of Sony without Financial Services \ (8,504) \ 16,686 - % $ 165
Financial services revenue \ 250,170 \ 245,750 -1.8 % $ 2,433 Net sales and operating revenue 1,461,249 1,564,158 +7.0 15,487
1,711,419 1,809,908 +5.8 17,920 Costs and expenses 1,675,497 1,743,295 +4.0 17,261 Equity in net income (loss) of affiliated companies (425) 3,201 - 32 Operating income 35,497 69,814 +96.7 691 Other income (expenses), net 9,896 (1,437) - (14)Income before income taxes 45,393 68,377 +50.6 677 Income taxes and other 42,266 41,569 -1.6 412 Net income attributable to Sony Corporation’s stockholders \ 3,127 \ 26,808 +757.3 % $ 265
(Millions of yen, millions of U.S. dollars)Three months ended June 30
Financial Services 2013 2014 Change 2014
(Millions of yen, millions of U.S. dollars)Three months ended June 30
Sony without Financial Services 2013 2014 Change 2014
(Millions of yen, millions of U.S. dollars)Three months ended June 30
Consolidated 2013 2014 Change 2014
F-11
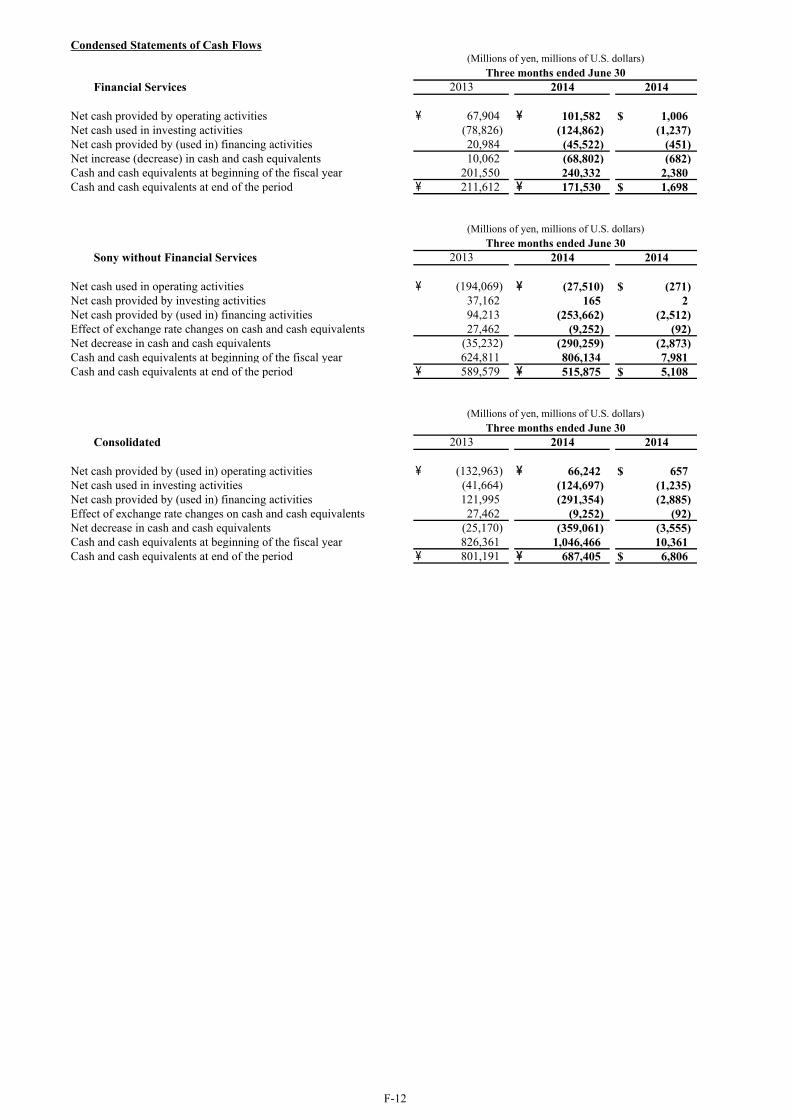
Condensed Statements of Cash Flows
Net cash provided by operating activities \ 67,904 \ 101,582 $ 1,006 Net cash used in investing activities (78,826) (124,862) (1,237)Net cash provided by (used in) financing activities 20,984 (45,522) (451)Net increase (decrease) in cash and cash equivalents 10,062 (68,802) (682)Cash and cash equivalents at beginning of the fiscal year 201,550 240,332 2,380 Cash and cash equivalents at end of the period \ 211,612 \ 171,530 $ 1,698
Net cash used in operating activities \ (194,069) \ (27,510) $ (271)Net cash provided by investing activities 37,162 165 2 Net cash provided by (used in) financing activities 94,213 (253,662) (2,512)Effect of exchange rate changes on cash and cash equivalents 27,462 (9,252) (92)Net decrease in cash and cash equivalents (35,232) (290,259) (2,873)Cash and cash equivalents at beginning of the fiscal year 624,811 806,134 7,981 Cash and cash equivalents at end of the period \ 589,579 \ 515,875 $ 5,108
Net cash provided by (used in) operating activities \ (132,963) \ 66,242 $ 657 Net cash used in investing activities (41,664) (124,697) (1,235)Net cash provided by (used in) financing activities 121,995 (291,354) (2,885)Effect of exchange rate changes on cash and cash equivalents 27,462 (9,252) (92)Net decrease in cash and cash equivalents (25,170) (359,061) (3,555)Cash and cash equivalents at beginning of the fiscal year 826,361 1,046,466 10,361 Cash and cash equivalents at end of the period \ 801,191 \ 687,405 $ 6,806
Three months ended June 30(Millions of yen, millions of U.S. dollars)
Financial Services
Three months ended June 30(Millions of yen, millions of U.S. dollars)
2013
Sony without Financial Services
(Millions of yen, millions of U.S. dollars)Three months ended June 30
2014
Consolidated
2014
2014 2014
2013 2014 2014
2013
F-12

F-13
(Notes)
1. U.S. dollar amounts have been translated from yen, for convenience only, at the rate of ¥101 = U.S. $1, the approximate Tokyo
foreign exchange market rate as of June 30, 2014.
2. As of June 30, 2014, Sony had 1,271 consolidated subsidiaries (including variable interest entities) and 101 affiliated companies
accounted for under the equity method.
3. The weighted-average number of outstanding shares used for the computation of earnings per share of common stock are as
follows:
Weighted-average number of outstanding shares (Thousands of shares) Three months ended June 30 Net income attributable to Sony Corporation’s stockholders 2013 2014
— Basic 1,010,916 1,043,681 — Diluted 1,167,836 1,168,516
The dilutive effect in the weighted-average number of outstanding shares for the three months ended June 30, 2013 and 2014,
primarily resulted from convertible bonds which were issued in November 2012.
4. Recently adopted accounting pronouncements:
Obligations resulting from joint and several liability arrangements for which the total amount of the obligation is fixed at the
reporting date
In February 2013, the Financial Accounting Standards Board (“FASB”) issued new accounting guidance for obligations resulting
from joint and several liability arrangements for which the total amount of the obligation is fixed at the reporting date. The
guidance requires an entity to measure obligations resulting from joint and several liability arrangements for which the total
amount of the obligation within the scope of this guidance is fixed at the reporting date, as the sum of the amount the reporting
entity agreed to pay on the basis of its arrangement among its co-obligors, plus any additional amount the reporting entity expects
to pay on behalf of its co-obligors. This guidance was effective for Sony as of April 1, 2014. The adoption of this guidance
did not have a material impact on Sony’s results of operations and financial position.
Parent’s accounting for the cumulative translation adjustment upon derecognition of certain subsidiaries or groups of assets within
a foreign entity or of an investment in a foreign entity
In March 2013, the FASB issued new accounting guidance for the parent’s accounting for the cumulative translation adjustment
upon derecognition of certain subsidiaries or groups of assets within a foreign entity or of an investment in a foreign entity. The
guidance resolved diversity in practice and clarifies the applicable guidance for the release of the cumulative translation
adjustment when the parent sells a part or all of its investment in a foreign entity, ceases to have a controlling financial interest in
a subsidiary or group of assets that is a business within a foreign entity, or obtains control in a business combination achieved in
stages involving an equity method investment that is a foreign entity. After adoption of this guidance, any accumulated
translation adjustments associated with a previously held equity interest, are included in earnings in a business combination
achieved in stages. This guidance was effective for Sony as of April 1, 2014. The adoption of this guidance did not have a
material impact on Sony’s results of operations and financial position.
Presentation of an unrecognized tax benefit when a net operating loss carryforward, a similar tax loss, or a tax credit carryforward
exists
In July 2013, the FASB issued new accounting guidance for the presentation of an unrecognized tax benefit when a net operating
loss carryforward, a similar tax loss, or a tax credit carryforward exists. The guidance requires an unrecognized tax benefit to be
presented as a reduction to a deferred tax asset for a net operating loss, a similar tax loss, or a tax credit carryforward if certain
criteria are met. This guidance was effective for Sony as of April 1, 2014. The adoption of this guidance did not have a
material impact on Sony’s results of operations and financial position.
F-14
5. Sony realigned its business segments for the first quarter of the fiscal year ending March 31, 2015 to reflect modifications to its
organizational structure as of April 1, 2014, primarily repositioning the operations of the previously reported Game and Mobile
Products & Communications (“MP&C”) segments. In connection with this realignment, the previously-reported operations of
the network business which were included in All Other are now integrated with the previously-reported Game segment and are
reported as the G&NS segment. The previously reported Mobile Communications category which was included in the MP&C
segment has been reclassified as the newly established Mobile Communications segment, while the other categories in the
previously reported MP&C segment are now included in All Other. This includes the reclassification of the PC business into All
Other. As of the current quarter, the power supply business, which was previously included in the Devices segment, has been
integrated into All Other to reflect modifications Sony made to its organizational structure as of June 1, 2014. For further details
of new segments and categories, see page F-6. In connection with this realignment, the sales and operating revenue and operating
income (loss) of each segment for the comparable period have been reclassified to conform to the current quarter’s presentation.
6. Sony estimates the annual effective tax rate ("ETR") derived from a projected annual net income before taxes and calculates the
interim period income tax provision based on the year-to-date income tax provision computed by applying the ETR to the
year-to-date net income before taxes at the end of each interim period. The income tax provision based on the ETR reflects
anticipated income tax credits and net operating loss carryforwards; however, it excludes the income tax provision related to
significant unusual or extraordinary transactions. Such income tax provision is separately reported from the provision based on
the ETR in the interim period in which they occur.
7. Certain reclassifications of the financial statements and accompanying footnotes for the three months ended June 30, 2013 have
been made to conform to the presentation for the three months ended June 30, 2014. Reclassifications include changes in the
presentation and disclosure related to internal-use software, effective on March 31, 2014. Due to the changes, the amortization of
internal-use software was reclassified from other to depreciation and amortization, including amortization of deferred insurance
acquisition costs in the cash flows from operating activities section of the consolidated statements of cash flows. Depreciation
and amortization in the business segment information were also reclassified, accordingly.
8. During the fourth quarter of the fiscal year ended March 31, 2014, Sony revised its financial statements related to the recognition
of revenue for certain of its universal life insurance contracts as disclosed in the previous fiscal year. Accordingly, certain
financial information for the comparable period has been revised. The principal amounts that have been revised are indicated
below.
(Millions of yen)
Three months ended June 30, 2013
As previously reported As adjusted
Consolidated Statements of Income
Financial services revenue ¥ 251,463 ¥ 250,170
Financial services expenses 204,730 204,297
Net income 19,513 18,925
Consolidated Statements of Comprehensive Income
Unrealized losses on securities (13,931) (14,895)
Comprehensive income attributable to Sony Corporation’s stockholders 58,069 57,138
Consolidated Statements of Cash Flows
Increase in future insurance policy benefits and other 106,992 108,162
Increase in deposits from customers in the financial services business, net 16,972 18,266