news & information tokyo 108-0075 japan - sony
TRANSCRIPT

1
No: 08-062E
3:00 P.M. JST, May 14, 2008
Consolidated Financial Results for the Fiscal Year Ended March 31, 2008
Tokyo, May 14, 2008 -- Sony Corporation today announced its consolidated results for the fiscal year ended March 31, 2008 (April 1, 2007 to March 31, 2008).
New fiscal year records were achieved for consolidated sales and net income. Consolidated operating income for the current year was more than five times the prior year and
the second highest level in Sony’s history. In the Electronics segment, new records in sales and operating income were achieved. Sony plans to increase its regular annual dividend by ¥15 to ¥40 and to issue a special cash
dividend of ¥10 per share, which would result in a total annual dividend of ¥50 for the fiscal year ending March 31, 2009.
(Billions of yen, millions of U.S. dollars, except per share amounts) Fiscal year ended March 31
2007 2008 Change in
yen 2008* Sales and operating revenue ¥8,295.7 ¥8,871.4 +6.9% $88,714 Operating income 71.8 374.5 +421.9 3,745 Income before income taxes 102.0 466.3 +357.0 4,663 Equity in net income of affiliated
companies 78.7 100.8 +28.2 1,008
Net income 126.3 369.4 +192.4 3,694 Net income per share of common
stock — Basic ¥126.15 ¥368.33 +192.0 $3.68 — Diluted 120.29 351.10 +191.9 3.51 Unless otherwise specified, all amounts are presented on the basis of Generally Accepted Accounting Principles in the U.S. (“U.S. GAAP”). * U.S. dollar amounts have been translated from yen, for convenience only, at the rate of ¥100=U.S.$1, the approximate Tokyo foreign exchange market rate as of March 31, 2008. Consolidated Results for the Fiscal Year Ended March 31, 2008 Sales and operating revenue (“sales”) increased 6.9% compared to the previous fiscal year (“year-on-year”) and achieved a new fiscal year record. Electronics segment sales increased 8.9% year-on-year, achieving a new fiscal year record, due to the increase in sales of products such as BRAVIATM LCD televisions, VAIOTM PCs and Cyber-shotTM digital cameras. In the Game segment, sales increased 26.3% year-on-year primarily as a result of a significant increase in sales of PLAYSTATION®3 (“PS3”). In the Pictures segment, there was an 11.2% decrease year-on-year as motion
News & Information
1-7-1 Konan, Minato-ku Tokyo 108-0075 Japan
2
pictures sales decreased due primarily to fewer films being released during the current fiscal year. In the Financial Services segment, revenue decreased by 10.5% year-on-year mainly due to net loss from investments in the separate account and deterioration in net valuation gains from convertible bonds in the general account reflecting a significant decline in the Japanese stock market and partially offset by an increase in insurance premium revenue at Sony Life Insurance Co., Ltd. (“Sony Life”). On a local currency basis, consolidated sales increased 6% year-on-year. For references herein to sales on a local currency basis, see Note on page 10. Operating income increased 421.9% year-on-year resulting in Sony’s second highest level of operating income. In the Electronics segment, operating income increased, achieving a new fiscal year record, primarily as the result of an increase in sales as well as the positive impact from the depreciation of the yen against the euro. Products within the segment including VAIO PCs, Cyber-shot digital cameras, system LSIs, and Handycam® video cameras each achieved their highest levels of operating income in history, and contributed to the overall increase in operating income. In the Game segment, the operating loss decreased significantly primarily due to a decrease in the operating losses of the PS3 business as a result of successful PS3 hardware cost reductions and increased sales of PS3 software. In the Pictures segment, operating income increased mainly due to the strong performance of prior year films in the home entertainment and television markets as well as the benefit from the sale of a bankruptcy claim against KirchMedia, a former licensee of film and television product. In the Financial Services segment, a decline in operating income was mainly attributable to a deterioration in net valuation gains from convertible bonds and an impairment loss on equity securities in the general account of Sony Life reflecting significant decline in the Japanese stock market. In addition, in the previous fiscal year a ¥51.2 billion provision was recorded for charges related to recalls by certain notebook computer makers and the subsequent global replacement program by Sony and certain notebook computer makers involving battery packs containing Sony-manufactured battery cells. A portion of the provision totaling ¥15.7 billion ($157 million) was reversed in the current fiscal year based on the actual results of recalls and replacements as compared to our original estimates. During this fiscal year, restructuring charges of ¥47.3 billion ($473 million) were recorded as operating expenses compared to ¥38.8 billion in the previous fiscal year. Substantially all of these restructuring charges in both years relate to the Electronics segment. Operating income during the current fiscal year included one-time gains primarily from a gain on the sale of a portion of the site of Sony’s former headquarters of ¥60.7 billion ($607 million), a ¥15.6 billion ($156 million) gain relating to the sale of a portion of Sony’s semiconductor operations in Nagasaki, Japan, including machinery and equipment, and a ¥10.0 billion ($100 million) gain on the sale of the urban entertainment complex “The Sony Center am Potsdamer Platz” in Berlin, Germany. Operating income in the previous fiscal year included a gain on the sale of a portion of the site of Sony’s former headquarters of ¥21.7 billion. Operating income during the current fiscal year included a gain from the reversal of a portion of a legal provision as a result of the resolution of a legal matter, while a comparable gain was recorded in the previous fiscal year attributed to the reversal of a portion of patent-related provisions. Income before income taxes was ¥466.3 billion ($4,663 million), a new fiscal year record and a year-on-year increase of 357.0%, due to the increase in operating income discussed above and an improvement of ¥61.5 billion ($615 million) in the net effect of other income and expenses. The improvement in the net effect of other income and expenses was primarily due to the recording of a gain of ¥81.0 billion ($810 million) for the change in ownership interest in subsidiaries and investees as a result of the global initial public offering of shares of Sony Financial Holdings Inc. (“SFH”) in connection with the listing of shares on the First Section of the Tokyo Stock Exchange in October 2007, and the recording of a net foreign exchange gain in the current fiscal year versus a net foreign exchange loss recorded in the previous fiscal year.
3
Income taxes: During the current fiscal year, Sony recorded ¥203.5 billion ($2,035 million) of income taxes resulting in an effective tax rate of 43.6%. Equity in net income of affiliated companies increased 28.2% year-on-year to ¥100.8 billion ($1,008 million), a new fiscal year record. Sony recorded equity in net income for Sony Ericsson Mobile Communications AB (“Sony Ericsson”) of ¥79.5 billion ($795 million), a decrease of ¥5.8 billion year-on-year primarily due to higher R&D expenses as a percentage of sales. Sony also recorded equity in net income of ¥10.0 billion ($100 million) for SONY BMG MUSIC ENTERTAINMENT (“SONY BMG”), a year-on-year increase of ¥5.0 billion. This increase was due to lower restructuring, marketing and overhead costs as well as a gain on the sale of an interest in a joint venture of SONY BMG and the positive impact from the effect of foreign currency exchange rate fluctuations. Equity in net income of ¥7.4 billion ($74 million) was recorded for S-LCD Corporation (“S-LCD”), a joint-venture with Samsung Electronics Co., Ltd., a year-on-year increase of ¥2.4 billion. Sony did not record any equity gain or loss for Metro-Goldwyn-Mayer Inc. (“MGM”) in the current fiscal year compared to equity in net loss of ¥18.9 billion recorded in the prior fiscal year. As of March 31, 2007, Sony no longer had any book basis in MGM and accordingly, no additional losses were recorded during the fiscal year ended March 31, 2008. As a result of the changes in the items discussed above, net income increased 192.4% year-on-year to ¥369.4 billion ($3,694 million), a new fiscal year record. Operating Performance Highlights by Business Segment “Sales and operating revenue” in each business segment represents sales and operating revenue recorded before intersegment transactions are eliminated. “Operating income (loss)” in each business segment represents operating income (loss) reported before intersegment transactions and unallocated corporate expenses are eliminated. Electronics (Billions of yen, millions of U.S. dollars)
Fiscal year ended March 31
2007 2008 Change in
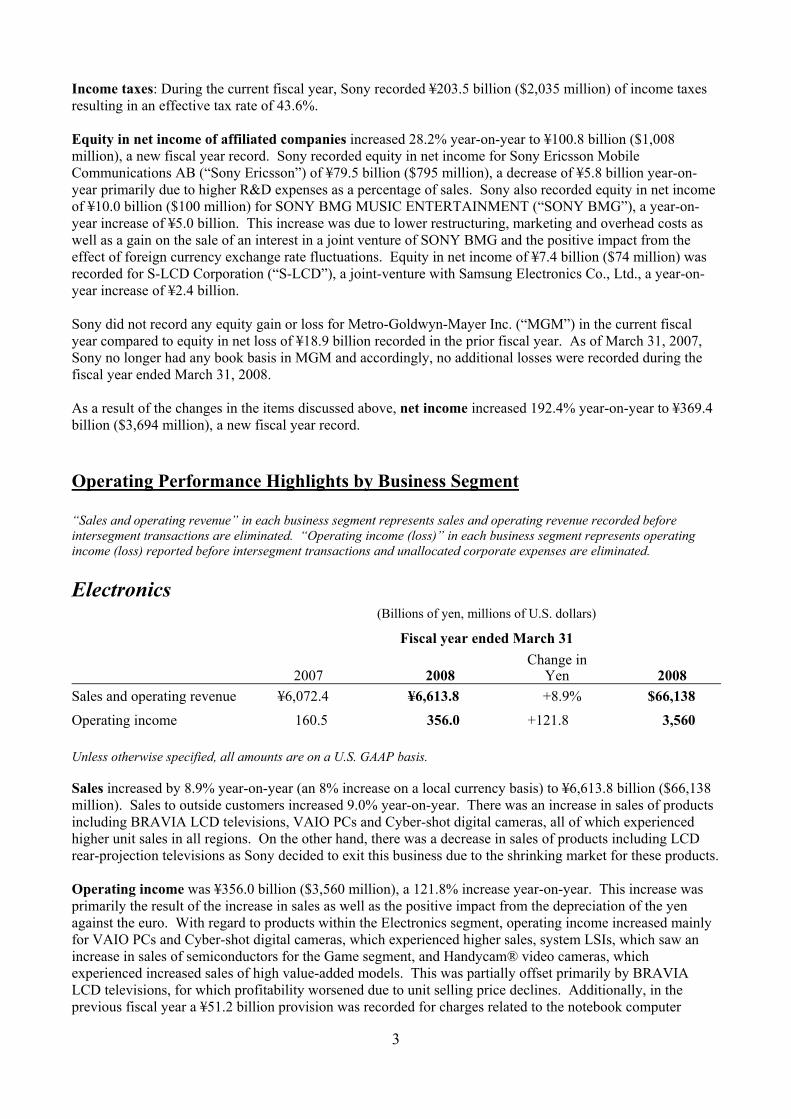
Yen 2008 Sales and operating revenue ¥6,072.4 ¥6,613.8 +8.9% $66,138
Operating income 160.5 356.0 +121.8 3,560 Unless otherwise specified, all amounts are on a U.S. GAAP basis. Sales increased by 8.9% year-on-year (an 8% increase on a local currency basis) to ¥6,613.8 billion ($66,138 million). Sales to outside customers increased 9.0% year-on-year. There was an increase in sales of products including BRAVIA LCD televisions, VAIO PCs and Cyber-shot digital cameras, all of which experienced higher unit sales in all regions. On the other hand, there was a decrease in sales of products including LCD rear-projection televisions as Sony decided to exit this business due to the shrinking market for these products. Operating income was ¥356.0 billion ($3,560 million), a 121.8% increase year-on-year. This increase was primarily the result of the increase in sales as well as the positive impact from the depreciation of the yen against the euro. With regard to products within the Electronics segment, operating income increased mainly for VAIO PCs and Cyber-shot digital cameras, which experienced higher sales, system LSIs, which saw an increase in sales of semiconductors for the Game segment, and Handycam® video cameras, which experienced increased sales of high value-added models. This was partially offset primarily by BRAVIA LCD televisions, for which profitability worsened due to unit selling price declines. Additionally, in the previous fiscal year a ¥51.2 billion provision was recorded for charges related to the notebook computer

4
battery pack recalls and subsequent global replacement program. A portion of the provision totaling ¥15.7 billion ($157 million) was reversed in the current fiscal year based on the actual results of recalls and replacements as compared to our original estimates. Inventory, as of March 31, 2008, was ¥822.0 billion ($8,220 million), which increased ¥96.2 billion, or 13.3%, compared with the level as of March 31, 2007 and decreased ¥71.3 billion, or 8.0%, compared with the level as of December 31, 2007. Operating Results for Sony Ericsson Mobile Communications AB The following operating results for Sony Ericsson, which is accounted for by the equity method as Sony Corporation’s ownership percentage is 50%, are not consolidated in Sony’s consolidated financial statements. However, Sony believes that this disclosure provides additional useful analytical information to investors regarding operating performance of Sony.
(Millions of euro)
Year ended March 31 2007 2008 Change in euro Sales and operating revenue €11,892 €12,693 +7% Income before income taxes 1,509 1,405 -7 Net income 1,142 993 -13 Sales for the year ended March 31, 2008 increased 7% year-on-year, boosted by strong sales of Walkman® and Cyber-shot phones. Income before income taxes decreased 7% year-on-year to €1,405 million. This was primarily due to higher R&D expenses as a percentage of sales. As a result, Sony recorded equity in net income of ¥79.5 billion ($795 million). Game (Billions of yen, millions of U.S. dollars)
Fiscal year ended March 31
2007 2008 Change in
yen 2008 Sales and operating revenue ¥1,016.8 ¥1,284.2 +26.3% $12,842
Operating income (loss) (232.3) (124.5) - (1,245) Unless otherwise specified, all amounts are on a U.S. GAAP basis. Sales increased 26.3% year-on-year (a 24% increase on a local currency basis) to ¥1,284.2 billion ($12,842 million). Hardware: Overall hardware sales increased as a result of a significant increase in sales of PS3, in addition to increased sales of PSP® (PlayStation®Portable) (“PSP”), for which a new slimmer, lighter model was released. Sales of PlayStation®2 (“PS2”) decreased year-on-year. Software: Overall software sales increased as a result of an increase in PS3 software sales. The operating loss was ¥124.5 billion ($1,245 million), an improvement of ¥107.8 billion year-on-year, and profit was recorded in the second half of the current fiscal year. The significant decrease in operating loss in the current fiscal year was primarily due to a decrease in the operating losses of the PS3 business as a result of
5
successful PS3 hardware cost reductions and increased sales of PS3 software, as well as the strong performance of the PSP business with the introduction of a new model. Worldwide hardware unit sales (increase/decrease year-on-year):*
→ PS2: 13.73 million units (a decrease of 0.98 million units) → PSP: 13.89 million units (an increase of 4.36 million units) → PS3: 9.24 million units (an increase of 5.63 million units)
Worldwide software unit sales (increase/decrease year-on-year):* → PS2: 154.0 million units (a decrease of 39.5 million units) → PSP: 55.5 million units (an increase of 0.8 million units) → PS3: 57.9 million units (an increase of 44.6 million units)
*Beginning with the quarter ended June 30, 2007, the method of reporting hardware and software unit sales has been changed from production shipments to recorded sales.
Inventory, as of March 31, 2008, was ¥181.6 billion ($1,816 million), which represents a ¥17.3 billion, or 8.7%, decrease compared with the level as of March 31, 2007. Inventory decreased by ¥1.4 billion, or 0.8%, compared with the level as of December 31, 2007. Pictures
(Billions of yen, millions of U.S. dollars)
Fiscal year ended March 31
2007 2008 Change in
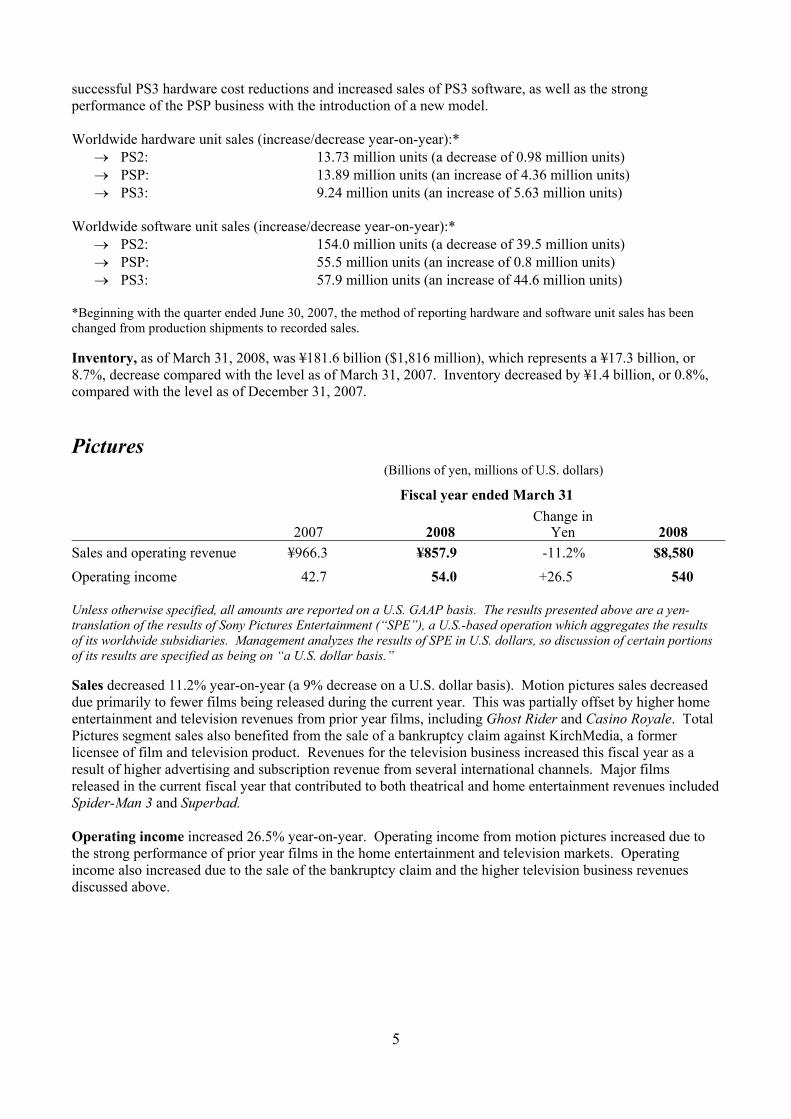
Yen 2008 Sales and operating revenue ¥966.3 ¥857.9 -11.2% $8,580 Operating income 42.7 54.0 +26.5 540 Unless otherwise specified, all amounts are reported on a U.S. GAAP basis. The results presented above are a yen-translation of the results of Sony Pictures Entertainment (“SPE”), a U.S.-based operation which aggregates the results of its worldwide subsidiaries. Management analyzes the results of SPE in U.S. dollars, so discussion of certain portions of its results are specified as being on “a U.S. dollar basis.” Sales decreased 11.2% year-on-year (a 9% decrease on a U.S. dollar basis). Motion pictures sales decreased due primarily to fewer films being released during the current year. This was partially offset by higher home entertainment and television revenues from prior year films, including Ghost Rider and Casino Royale. Total Pictures segment sales also benefited from the sale of a bankruptcy claim against KirchMedia, a former licensee of film and television product. Revenues for the television business increased this fiscal year as a result of higher advertising and subscription revenue from several international channels. Major films released in the current fiscal year that contributed to both theatrical and home entertainment revenues included Spider-Man 3 and Superbad. Operating income increased 26.5% year-on-year. Operating income from motion pictures increased due to the strong performance of prior year films in the home entertainment and television markets. Operating income also increased due to the sale of the bankruptcy claim and the higher television business revenues discussed above.

6
Financial Services (Billions of yen, millions of U.S. dollars)
Fiscal year ended March 31
2007 2008 Change in
yen 2008 Financial service revenue ¥649.3 ¥581.1 -10.5% $5,811 Operating income 84.1 22.6 -73.1 227 In Sony's Financial Services segment, results include SFH, Sony Life, Sony Assurance Inc., Sony Bank Inc. (“Sony Bank”) and Sony Finance International Inc. Unless otherwise specified, all amounts are reported on a U.S. GAAP basis. Therefore, the results of Sony Life shown below differ from the results that SFH and Sony Life disclose on a Japanese statutory basis. As a result of the global initial public offering of shares of SFH, Sony Corporation’s ownership percentage in SFH is 60%. Consolidated results for SFH continue to be consolidated in Sony’s consolidated financial statements. Financial service revenue decreased 10.5% year-on-year due to a decrease in revenue at Sony Life. Revenue at Sony Life was ¥464.1 billion ($4,641 million), a ¥81.0 billion or 14.9% decrease year-on-year. Revenue decreased due to a net loss from investments in the separate account, a deterioration in net valuation gains from convertible bonds and an impairment loss on equity securities in the general account reflecting a significant decline in the Japanese stock market this fiscal year. Partially offsetting this was an increase in insurance premium revenue reflecting an increase in policy amounts in force. Operating income decreased 73.1% as the result of a deterioration in profitability at Sony Life. Operating income at Sony Life was ¥11.5 billion ($115 million), a ¥70.1 billion or 85.9% decrease compared to the previous fiscal year. This decrease was mainly due to a deterioration in net valuation gains from convertible bonds and an impairment loss on equity securities in the general account which more than offset the contribution from increased insurance premium revenue at Sony Life. All Other (Billions of yen, millions of U.S. dollars)
Fiscal year ended March 31
2007 2008 Change in
yen 2008 Sales and operating revenue ¥355.1 ¥382.2 +7.6% $3,822
Operating income 28.9 50.2 +73.9 502 Unless otherwise specified, all amounts are on a U.S. GAAP basis. Sales increased 7.6% year-on-year. Sales within All Other increased mainly due to the contribution from the sales at the U.S. music publishing company Famous Music LLC (“Famous Music”), acquired by Sony’s U.S.-based music publishing subsidiary Sony/ATV Music Publishing LLC (“Sony/ATV”) and consolidated in the current fiscal year, the receipt of a settlement payment related to copyright infringement claims, an increase in sales at Sony Music Entertainment (Japan) Inc. (“SMEJ”), and higher fee revenue from broadband connection services, especially fiber-optic, at So-net Entertainment Corporation (“So-net”). An increase in trademark royalty income from Sony Ericsson also contributed to the increase in sales. Sales at SMEJ increased year-on-year mainly as a result of an increase in music download sales. SMEJ’s best-selling albums during the current fiscal year included ORANGE and RANGE by ORANGE RANGE, FAKIN’ POP by Ken Hirai and CAN’T BUY MY LOVE by YUI.

7
Operating income increased 73.9% year-on-year. Operating income within All Other increased principally as a result of a ¥10.0 billion ($100 million) gain on the sale of “The Sony Center am Potsdamer Platz” in Berlin, the above-mentioned receipt of a settlement payment related to copyright infringement claims and an increase in the above-mentioned trademark royalty income from Sony Ericsson. Operating Results for SONY BMG MUSIC ENTERTAINMENT The following operating results for SONY BMG, which is accounted for by the equity method as Sony Corporation’s ownership percentage is 50%, are not consolidated in Sony’s consolidated financial statements. However, Sony believes that this disclosure provides additional useful analytical information to investors regarding operating performance of Sony.
(Millions of U.S. dollars)
Year ended March 31
2007 2008 Change in
U.S. dollars Sales and operating revenue $4,101 $3,934 -4%
Income before income taxes 135 257 +90
Net income 84 178 +111 During the year ended March 31, 2008, sales revenue at SONY BMG decreased by 4% year-on-year primarily due to the continued decline in the physical music market worldwide not being offset by the growth in digital product sales. Despite the decrease in sales, income before income taxes increased by 90% compared to the previous year primarily due to a year-on-year reduction in restructuring costs of $67 million, lower marketing costs, reductions in overhead costs from continued restructuring, a gain on the sale of an interest in a joint venture of SONY BMG and the favorable impact of currency fluctuations. As a result, equity in net income of ¥10.0 billion ($100 million) was recorded by Sony. Best selling releases during the year included Alicia Keys’ As I Am, Avril Lavigne’s The Best Damn Thing, Celine Dion’s Taking Chances and Leona Lewis’ Spirit.

8
Cash Flows The following charts show Sony’s unaudited cash flow information for all segments excluding the Financial Services segment and for the Financial Services segment alone. These separate condensed presentations are not required under U.S. GAAP, which is used in Sony’s consolidated financial statements. However, because the Financial Services segment is different in nature from Sony’s other segments, Sony utilizes this information to analyze its results without Financial Services and believes that these presentations may be useful in understanding and analyzing Sony’s consolidated financial statements. Cash Flows - Consolidated (Excluding Financial Services segment)
Operating Activities: During the fiscal year ended March 31, 2008, despite an increase in inventory primarily in the Electronics segment, net cash was generated due to the contribution of net income after taking into account depreciation and amortization in the Electronics segment. Investing Activities: During the fiscal year ended March 31, 2008, net cash was used to purchase semiconductor fabrication equipment and acquire Famous Music by Sony/ATV. This was partially offset by proceeds from the sale of SFH shares, the sale of “The Sony Center am Potsdamer Platz” in Berlin and the sale of a portion of the site of Sony’s former headquarters. As a result, the net cash generated by operating activities and used in investing activities during the fiscal year ended March 31, 2008 was ¥504.2 billion ($5,042 million). Financing Activities: During the fiscal year ended March 31, 2008, cash was used to redeem straight bonds and for dividend payments. Cash and Cash Equivalents: As a result of the above factors, and taking into account the effect of exchange rate changes, the total balance of cash and cash equivalents was ¥948.7 billion ($9,487 million) at March 31, 2008, an increase of ¥425.9 billion compared to March 31, 2007.
(Billions of yen, millions of U.S. dollars)
Fiscal year ended March 31
Cash flows 2007 2008 Change in yen 2008
- From operating activities ¥305.6 ¥519.1 ¥+213.5 $5,191 - From (used in) investing
activities (431.1) (14.9) +416.2 (149)
- From (used in) financing activities 59.6 (12.1) -71.7 (121)
Cash and cash equivalents at beginning of the fiscal year 585.5 522.9 -62.6 5,228
Cash and cash equivalents at end of the fiscal year 522.9 948.7 +425.9 9,487

9
Cash Flows - Financial Services segment
Operating Activities: Net cash provided by operating activities was generated primarily due to an increase in revenue from insurance premiums, reflecting an increase in policy amounts in force at Sony Life. Investing Activities: Payments for investments and advances mainly carried out at Sony Life, and at Sony Bank where operations are expanding, exceeded proceeds from maturities of marketable securities, sales of securities investments and collections of advances. Financing Activities: In addition to an increase in policyholders’ accounts at Sony Life, there was an increase in deposits from customers at Sony Bank. Cash and Cash Equivalents: As a result of the above, the balance of cash and cash equivalents was ¥137.7 billion ($1,377 million) at March 31, 2008, a decrease of ¥139.3 billion compared to March 31, 2007. Consolidated Results for the Fourth Quarter ended March 31, 2008 Sales were ¥1,952.8 billion ($19,528 million), a decrease of 6.5% (virtually flat on a local currency basis) compared to the same quarter of the previous fiscal year (“year-on-year”). In the Electronics segment, although there was an increase in sales to outside customers, overall sales decreased primarily due to a decrease in intersegment sales to the Game segment. Sales primarily of BRAVIA LCD televisions, VAIO PCs and Cyber-shot digital cameras increased, while sales of mobile phones produced for wireless customers, LCD rear-projection televisions and CRT televisions decreased. In the Game segment, despite an increase in sales from the PSP business, overall sales decreased mainly as a result of the decrease in sales from the PS2 business. In the Pictures segment, sales decreased primarily because fewer current year films were released into the home entertainment market compared to the same quarter of the previous year. Partially offsetting this decrease were the proceeds from the sale of a bankruptcy claim against KirchMedia. In the Financial Services segment, revenue decreased due to a net loss from investments in the separate account, a deterioration in net valuation gains from convertible bonds and an impairment loss on equity securities in the general account at Sony Life. An operating loss of ¥4.7 billion ($47 million) was reported, an improvement of ¥108.7 billion year-on-year. In the Electronics segment, despite a decrease in sales, the amount of loss decreased mainly as a result of a reversal of a portion of the provision for charges related to the notebook computer battery pack recalls and subsequent global replacement program as well as a gain relating to the sale of a portion of Sony’s semiconductor operations in Nagasaki, including machinery and equipment. In the Game segment, there was a significant decrease in operating losses primarily due to a decrease in the operating losses of the PS3 business as a result of successful PS3 hardware cost reductions. Operating income for the Pictures segment increased due to the above-mentioned sale of the bankruptcy claim and lower marketing expenses year-on-
(Billions of yen, millions of U.S. dollars)
Fiscal year ended March 31
Cash flows 2007 2008 Change in yen 2008
- From operating activities ¥256.5 ¥242.6 ¥-13.9 $2,426 - From (used in) investing
activities (276.7) (873.6) -596.9 (8,736)
- From financing activities 179.6 491.7 +312.1 4,917 Cash and cash equivalents at beginning of the fiscal year 117.6 277.0 +159.4 2,770 Cash and cash equivalents at end of the fiscal year 277.0 137.7 -139.3 1,377
10
year for films not yet released. These factors more than offset the impact of fewer current year films being released into the home entertainment market. In the current quarter, an operating loss was recorded within the Financial Services segment compared to operating income recorded in the same quarter of the previous fiscal year due to a deterioration in net valuation gains from convertible bonds and an impairment loss on equity securities in the general account of Sony Life noted above. Operating income within All Other increased principally as a result of a gain on the sale of “The Sony Center am Potsdamer Platz” and the receipt of a settlement payment related to copyright infringement claims. During the current quarter, restructuring charges of ¥14.2 billion ($142 million) were recorded as operating expenses compared to ¥23.1 billion in the same quarter of the previous fiscal year. Nearly all of these restructuring charges in both periods relate to the Electronics segment. Income before income taxes was ¥6.2 billion ($62 million), a ¥111.9 billion improvement from the ¥105.7 billion loss recorded in the same quarter of the prior fiscal year due to the decrease in operating loss discussed above. Income taxes: Sony recorded a ¥6.3 billion ($63 million) income tax benefit mainly due to the reversal of valuation allowances at certain Sony subsidiaries as the tax benefits previously reserved are now more likely than not to be realized. Equity in net income of affiliated companies of ¥10.8 billion ($108 million) was recorded, an 11.9% decrease year-on-year. Equity in net income of Sony Ericsson was ¥10.3 billion ($103 million), a ¥9.3 billion decrease year-on-year. This decrease was primarily due to a less favorable product mix as a result of slowing market growth in mid-to-high end phones in markets where Sony Ericsson has a strong presence and an increase in R&D expenses. For S-LCD, equity of net income of ¥3.4 billion ($34 million) was recorded, a ¥1.5 billion increase year-on-year. Equity in net loss of ¥2.3 billion ($23 million) was recorded for SONY BMG, a year-on-year deterioration of ¥1.0 billion. The increased loss was primarily due to lower revenues in the current quarter which more than offset lower restructuring expenses. Sony did not record an equity gain or loss for MGM in the current quarter compared to equity in net loss of ¥8.2 billion recorded in the same quarter of the prior fiscal year. As of March 31, 2007, Sony no longer had any book basis in MGM and accordingly, no additional losses were recorded during the quarter ended March 31, 2008. Net income of ¥29.0 billion ($290 million) was recorded during the quarter, a ¥96.6 billion improvement from the ¥67.6 billion loss recorded in the same quarter of the prior fiscal year. Note During the fiscal year ended March 31, 2008, the average value of the yen was ¥113.3 against the U.S. dollar and ¥160.0 against the euro, which was 2.4% higher against the U.S. dollar and 7.1% lower against the euro, compared with the average rates for the previous fiscal year. During the quarter ended March 31, 2008, the average value of the yen was ¥104.3 against the U.S. dollar and ¥156.2 against the euro, which was 13.6% higher against the U.S. dollar and 0.7% lower against the euro, compared with the average rates for the same quarter of the previous fiscal year. Sales on a local currency basis described herein reflect sales obtained by applying the yen’s monthly average exchange rate in the previous fiscal year and the same quarter of the previous fiscal year to local currency-denominated monthly sales in the current fiscal year and the current quarter, respectively. Sales on a local currency basis are not reflected in Sony’s consolidated financial statements and are not measures conforming with U.S. GAAP. In addition, Sony does not believe that these measures are a substitute for U.S. GAAP measures. However, Sony believes that disclosing sales information on a local currency basis provide additional useful analytical information to investors regarding operating performance of Sony.

11
Rewarding Shareholders Sony believes that continuously increasing corporate value and providing dividends are essential to rewarding shareholders. It is Sony’s policy to utilize retained earnings, after ensuring the perpetuation of stable dividends, to carry out various investments that contribute to an increase in corporate value such as those that ensure future growth and strengthen competitiveness. On May 14, 2008, a year-end cash dividend of ¥12.5 ($0.13) per share (the same as the amount paid in the previous fiscal year) payable as of June 2, 2008 was approved by the Board of Directors. Sony has already paid an interim dividend of ¥12.5 per share to each shareholder; accordingly, the total annual cash dividend per share would be ¥25.0 ($0.25). In regards to the annual dividend for the fiscal year ending March 31, 2009, Sony plans to increase its regular dividend per share by ¥15 to ¥40 per annum from ¥25 per share in the current fiscal year upon careful consideration of Sony’s results for the current fiscal year and other factors. Sony also plans to distribute a special cash dividend of ¥10 per share as part of the interim dividend, which would be paid in December 2008. This special dividend would reward our shareholders for the successful global initial public offering of shares of SFH and be in appreciation of their support during the implementation of our three-year restructuring program as well as other corporate initiatives which resulted in record consolidated net income during the fiscal year ended March 31, 2008. As a result, Sony plans to pay a total annual dividend for the fiscal year ending March 31, 2009 of ¥50 per share, comprising an interim dividend of ¥30 per share and a year-end dividend of ¥20 per share. Outlook for the Fiscal Year ending March 31, 2009
(Billions of yen) Change from previous fiscal year
Sales and operating revenue ¥9,000 +1% Operating income 450 +20 Income before income taxes 440 -6 Equity in net income of affiliated companies 70 -31 Net income 290 -22 Capital expenditures (additions to fixed assets)* ¥430 +28 Depreciation and amortization** 420 -2 (Depreciation expenses for tangible assets) (330) 0 Research and development expenses 540 +4
*Investments in S-LCD are not included within the forecast for capital expenditures. **The forecast for depreciation and amortization includes amortization of intangible assets and amortization of
deferred insurance acquisition costs. Assumed foreign currency exchange rates: approximately ¥100 to the U.S. dollar and approximately ¥158 to the euro. Forecasted consolidated operating results above have been prepared based on the current business environment and reflect the factors noted below. With regard to operating income, in the fiscal year ended March 31, 2008 there were significant one-time gains recorded including a ¥60.7 billion gain on the sale of a portion of the site of Sony’s former headquarters. We do not anticipate any similar one-time gains during the fiscal year ending March 31, 2009. The above forecast includes restructuring charges, recorded as operating expenses, of approximately ¥20 billion expected to be incurred across the Sony Group during the fiscal year, primarily within the Electronics

12
segment, compared to ¥47.3 billion of restructuring charges recorded during the fiscal year ended March 31, 2008. We anticipate a decrease in income before income taxes for the fiscal year ending March 31, 2009 due to the absence of a gain of ¥81.0 billion recorded in other income for the fiscal year ended March 31, 2008 for the change in ownership interest in subsidiaries and investees as a result of the global initial public offering of shares of SFH in connection with the listing of shares. Equity in net income of affiliated companies is expected to decrease. This is due to slowing market growth for mid-to-high end mobile phones and an increase in R&D expenses for Sony Ericsson and an increase in restructuring costs expected for SONY BMG. Capital expenditures for the fiscal year ending March 31, 2009 are expected to increase primarily within the Electronics segment. Within the Electronics segment, capital expenditures in the semiconductor business during the fiscal year are expected to increase by approximately ¥20 billion to approximately ¥110 billion due to an increase in the amount invested in image sensors. The forecast for each business segment is as follows: Electronics Despite an expected increase in sales primarily of BRAVIA LCD televisions, VAIO PCs and Cyber-shot digital cameras, sales are expected to be flat compared to the fiscal year ended March 31, 2008 mainly due to the impact of the appreciation of the yen against the U.S. dollar. Although a significant improvement in operating profitability is expected for the television business, overall operating income is expected to decrease mainly due to the impact of the appreciation of the yen against the U.S. dollar. Game Despite an expected decrease in Game segment sales as a result of a decline in sales for the PS2 business, the Game segment as a whole is expected to have positive operating income for the fiscal year ending March 31, 2009 as the profitability of the segment will improve significantly due to hardware cost reductions and an enhanced line-up of software titles in the PS3 business. Pictures A decrease in sales is expected mainly due to the impact of the appreciation of the yen against the U.S. dollar. A decrease in operating income is anticipated as the benefit from the sale of a bankruptcy claim against KirchMedia in the fiscal year ended March 31, 2008 is not expected to recur in the fiscal year ending March 31, 2009. Financial Services The effect of gains and losses on investments at Sony Life due to stock market fluctuations are not incorporated within the forecast for the fiscal year ending March 31, 2009. Therefore, we anticipate a significant increase in revenue and operating income within the segment compared to the fiscal year ended March 31, 2008 which experienced the effect of a downturn in the Japanese stock market. Note to the above Forecast The above forecast is based on the market prices of the portfolio of our Financial Services segment as of March 31, 2008. Sony cautions that a number of risks and uncertainties, including market volatility and fluctuations, could cause actual results for the Financial Services segment to differ materially from the forecasts. In addition, the impact on this portfolio may not match the changes in valuation realized in the Japanese equity markets since there may be differences between prices of individual securities and movements in market indices like the TOPIX.
13
According to a hypothetical sensitivity analysis based on our portfolio (primarily corporate investment trusts held for trading purposes and convertible bonds within the assets of Sony Life’s general account) as of March 31, 2008, a fluctuation of 10 percentage points in the TOPIX could create an impact on Sony’s consolidated operating income of approximately ¥12-13 billion. Actual profits or losses may differ materially from the above analysis because the change in the prices of individual securities held by Sony Life may not match the change in the price of the TOPIX and the specific holdings within the portfolio may change as a result of future operations such as trading or the conversion of convertible bonds, the market prices of which may be affected by the fluctuation in market interest rates. In addition, the possibility of impairment losses in equity securities (excluding equity securities included in the corporate investment trust for trading purposes) held is not included in the analysis above.
Cautionary Statement Statements made in this release with respect to Sony’s current plans, estimates, strategies and beliefs and other statements that are not historical facts are forward-looking statements about the future performance of Sony. Forward-looking statements include, but are not limited to, those statements using words such as “believe,” “expect,” “plans,” “strategy,” “prospects,” “forecast,” “estimate,” “project,” “anticipate,” “aim,” “may” or “might” and words of similar meaning in connection with a discussion of future operations, financial performance, events or conditions. From time to time, oral or written forward-looking statements may also be included in other materials released to the public. These statements are based on management’s assumptions and beliefs in light of the information currently available to it. Sony cautions you that a number of important risks and uncertainties could cause actual results to differ materially from those discussed in the forward-looking statements, and therefore you should not place undue reliance on them. You also should not rely on any obligation of Sony to update or revise any forward-looking statements, whether as a result of new information, future events or otherwise. Sony disclaims any such obligation. Risks and uncertainties that might affect Sony include, but are not limited to (i) the global economic environment in which Sony operates, as well as the economic conditions in Sony’s markets, particularly levels of consumer spending; (ii) exchange rates, particularly between the yen and the U.S. dollar, the euro and other currencies in which Sony makes significant sales or in which Sony's assets and liabilities are denominated; (iii) Sony’s ability to continue to design and develop and win acceptance of, as well as achieve sufficient cost reductions for, its products and services, including newly introduced platforms within the Game segment, which are offered in highly competitive markets characterized by continual new product introductions, rapid development in technology and subjective and changing consumer preferences (particularly in the Electronics, Game and Pictures segments, and the music business); (iv) Sony’s ability and timing to recoup large-scale investments required for technology development and increasing production capacity; (v) Sony’s ability to implement successfully business reorganization activities in its Electronics segment; (vi) Sony’s ability to implement successfully its network strategy for its Electronics, Game and Pictures segments, and All Other, including the music business, and to develop and implement successful sales and distribution strategies in its Pictures segment and the music business in light of the Internet and other technological developments; (vii) Sony’s continued ability to devote sufficient resources to research and development and, with respect to capital expenditures, to correctly prioritize investments (particularly in the Electronics segment); (viii) Sony’s ability to maintain product quality (particularly in the Electronics and Game segments); (ix) the success of Sony’s joint ventures and alliances; (x) the outcome of pending legal and/or regulatory proceedings; (xi) shifts in customer demand for financial services such as life insurance and Sony’s ability to conduct successful asset liability management in the Financial Services segment; and (xii) the impact of unfavorable conditions or developments (including market fluctuations or volatility) in the Japanese equity markets on the revenue and operating income of the Financial Services segment. Risks and uncertainties also include the impact of any future events with material adverse impacts. Investor Relations Contacts: Tokyo New York London Tatsuyuki Sonoda Sam Levenson/Justin Hill/
Miki Emura Shinji Tomita
+81-(0)3-6748-2180 +1-212-833-6722 +44-(0)20-7444-9713 Home Page: http://www.sony.net/IR/
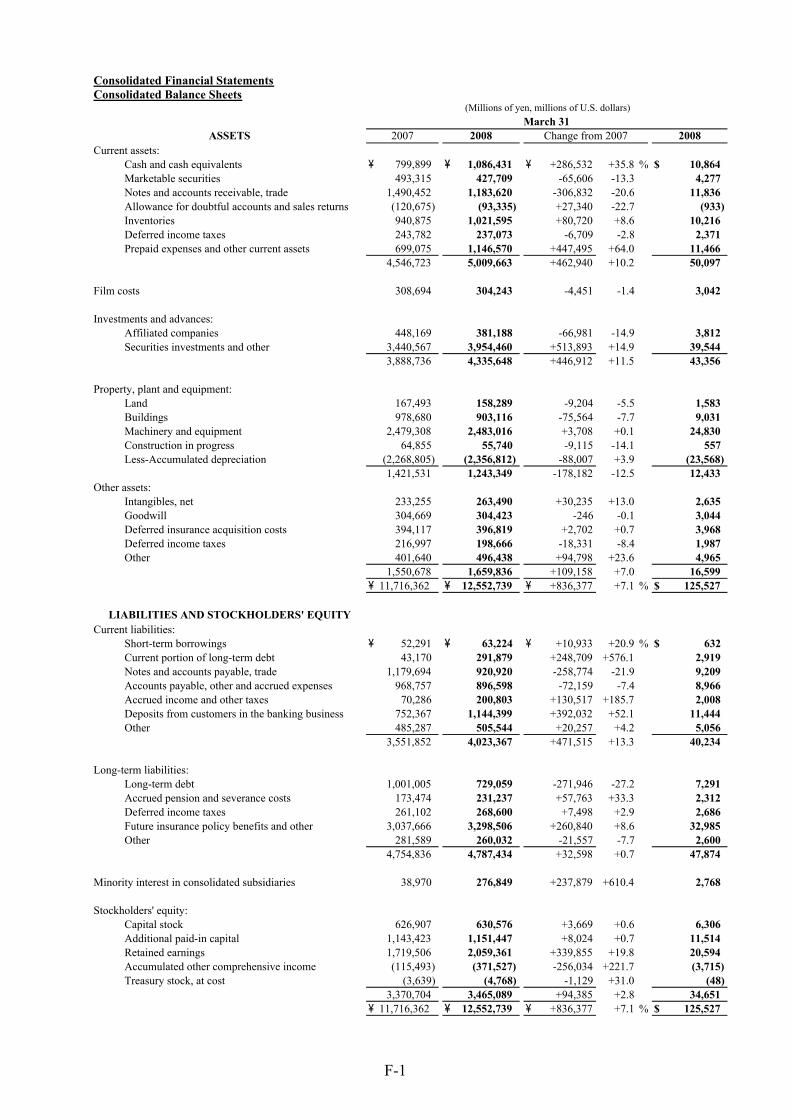
Consolidated Financial StatementsConsolidated Balance Sheets
Current assets:Cash and cash equivalents \ 799,899 \ 1,086,431 \ +286,532 +35.8 % $ 10,864 Marketable securities 493,315 427,709 -65,606 -13.3 4,277 Notes and accounts receivable, trade 1,490,452 1,183,620 -306,832 -20.6 11,836 Allowance for doubtful accounts and sales returns (120,675) (93,335) +27,340 -22.7 (933) Inventories 940,875 1,021,595 +80,720 +8.6 10,216 Deferred income taxes 243,782 237,073 -6,709 -2.8 2,371 Prepaid expenses and other current assets 699,075 1,146,570 +447,495 +64.0 11,466
4,546,723 5,009,663 +462,940 +10.2 50,097
Film costs 308,694 304,243 -4,451 -1.4 3,042
Investments and advances:Affiliated companies 448,169 381,188 -66,981 -14.9 3,812 Securities investments and other 3,440,567 3,954,460 +513,893 +14.9 39,544
3,888,736 4,335,648 +446,912 +11.5 43,356
Property, plant and equipment:Land 167,493 158,289 -9,204 -5.5 1,583 Buildings 978,680 903,116 -75,564 -7.7 9,031 Machinery and equipment 2,479,308 2,483,016 +3,708 +0.1 24,830 Construction in progress 64,855 55,740 -9,115 -14.1 557 Less-Accumulated depreciation (2,268,805) (2,356,812) -88,007 +3.9 (23,568)
1,421,531 1,243,349 -178,182 -12.5 12,433 Other assets:
Intangibles, net 233,255 263,490 +30,235 +13.0 2,635 Goodwill 304,669 304,423 -246 -0.1 3,044 Deferred insurance acquisition costs 394,117 396,819 +2,702 +0.7 3,968 Deferred income taxes 216,997 198,666 -18,331 -8.4 1,987 Other 401,640 496,438 +94,798 +23.6 4,965
1,550,678 1,659,836 +109,158 +7.0 16,599 \ 11,716,362 \ 12,552,739 \ +836,377 +7.1 % $ 125,527
Current liabilities:Short-term borrowings \ 52,291 \ 63,224 \ +10,933 +20.9 % $ 632 Current portion of long-term debt 43,170 291,879 +248,709 +576.1 2,919 Notes and accounts payable, trade 1,179,694 920,920 -258,774 -21.9 9,209 Accounts payable, other and accrued expenses 968,757 896,598 -72,159 -7.4 8,966 Accrued income and other taxes 70,286 200,803 +130,517 +185.7 2,008 Deposits from customers in the banking business 752,367 1,144,399 +392,032 +52.1 11,444 Other 485,287 505,544 +20,257 +4.2 5,056
3,551,852 4,023,367 +471,515 +13.3 40,234
Long-term liabilities:Long-term debt 1,001,005 729,059 -271,946 -27.2 7,291 Accrued pension and severance costs 173,474 231,237 +57,763 +33.3 2,312 Deferred income taxes 261,102 268,600 +7,498 +2.9 2,686 Future insurance policy benefits and other 3,037,666 3,298,506 +260,840 +8.6 32,985 Other 281,589 260,032 -21,557 -7.7 2,600
4,754,836 4,787,434 +32,598 +0.7 47,874
Minority interest in consolidated subsidiaries 38,970 276,849 +237,879 +610.4 2,768
Stockholders' equity:Capital stock 626,907 630,576 +3,669 +0.6 6,306 Additional paid-in capital 1,143,423 1,151,447 +8,024 +0.7 11,514 Retained earnings 1,719,506 2,059,361 +339,855 +19.8 20,594 Accumulated other comprehensive income (115,493) (371,527) -256,034 +221.7 (3,715) Treasury stock, at cost (3,639) (4,768) -1,129 +31.0 (48)
3,370,704 3,465,089 +94,385 +2.8 34,651 \ 11,716,362 \ 12,552,739 \ +836,377 +7.1 % $ 125,527
LIABILITIES AND STOCKHOLDERS' EQUITY
ASSETS
(Millions of yen, millions of U.S. dollars)
2007 2008 2008Change from 2007March 31
F-1
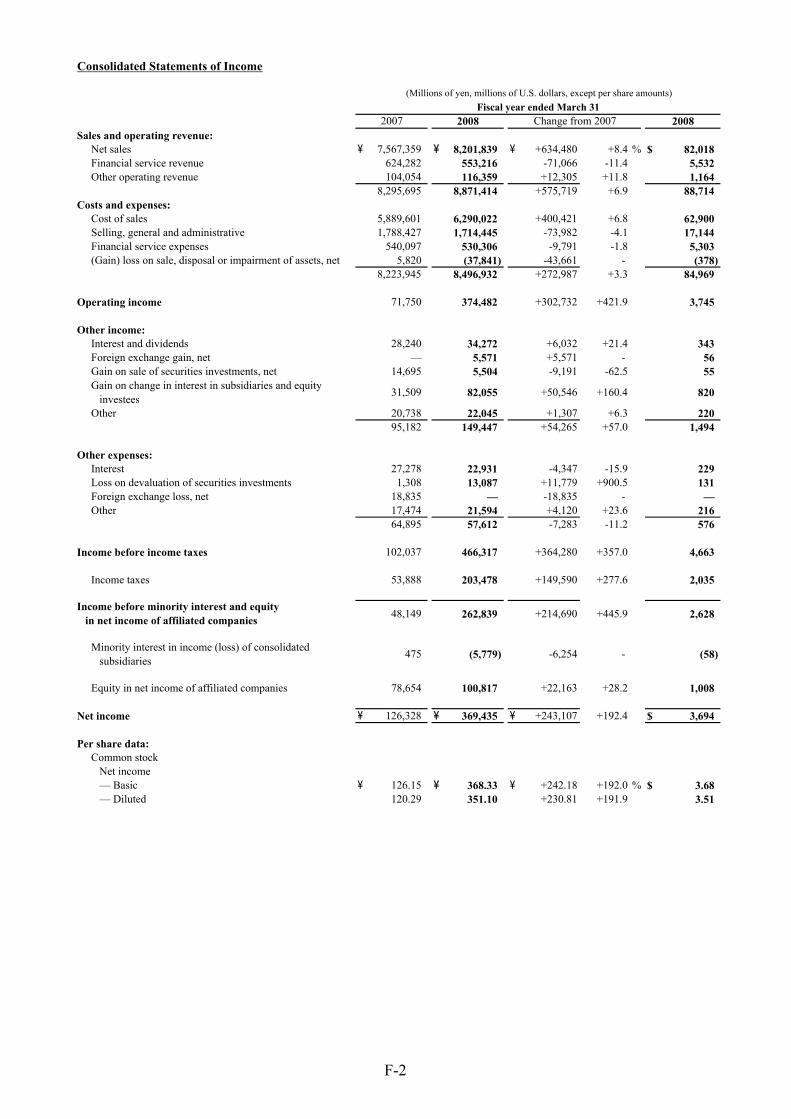
Consolidated Statements of Income
Sales and operating revenue:Net sales \ 7,567,359 \ 8,201,839 \ +634,480 +8.4 % $ 82,018 Financial service revenue 624,282 553,216 -71,066 -11.4 5,532 Other operating revenue 104,054 116,359 +12,305 +11.8 1,164
8,295,695 8,871,414 +575,719 +6.9 88,714 Costs and expenses:
Cost of sales 5,889,601 6,290,022 +400,421 +6.8 62,900 Selling, general and administrative 1,788,427 1,714,445 -73,982 -4.1 17,144 Financial service expenses 540,097 530,306 -9,791 -1.8 5,303 (Gain) loss on sale, disposal or impairment of assets, net 5,820 (37,841) -43,661 - (378)
8,223,945 8,496,932 +272,987 +3.3 84,969
Operating income 71,750 374,482 +302,732 +421.9 3,745
Other income:Interest and dividends 28,240 34,272 +6,032 +21.4 343 Foreign exchange gain, net — 5,571 +5,571 - 56 Gain on sale of securities investments, net 14,695 5,504 -9,191 -62.5 55 Gain on change in interest in subsidiaries and equity investees 31,509 82,055 +50,546 +160.4 820
Other 20,738 22,045 +1,307 +6.3 220 95,182 149,447 +54,265 +57.0 1,494
Other expenses:Interest 27,278 22,931 -4,347 -15.9 229 Loss on devaluation of securities investments 1,308 13,087 +11,779 +900.5 131 Foreign exchange loss, net 18,835 — -18,835 - — Other 17,474 21,594 +4,120 +23.6 216
64,895 57,612 -7,283 -11.2 576
Income before income taxes 102,037 466,317 +364,280 +357.0 4,663
Income taxes 53,888 203,478 +149,590 +277.6 2,035
48,149 262,839 +214,690 +445.9 2,628
Minority interest in income (loss) of consolidated d subsidiaries 475 (5,779) -6,254 - (58)
Equity in net income of affiliated companies 78,654 100,817 +22,163 +28.2 1,008
Net income \ 126,328 \ 369,435 \ +243,107 +192.4 $ 3,694
Per share data:Common stock Net income — Basic \ 126.15 \ 368.33 \ +242.18 +192.0 % $ 3.68 — Diluted 120.29 351.10 +230.81 +191.9 3.51
Income before minority interest and equity in net income of affiliated companies
(Millions of yen, millions of U.S. dollars, except per share amounts)
2007 2008 Change from 2007 2008Fiscal year ended March 31
F-2
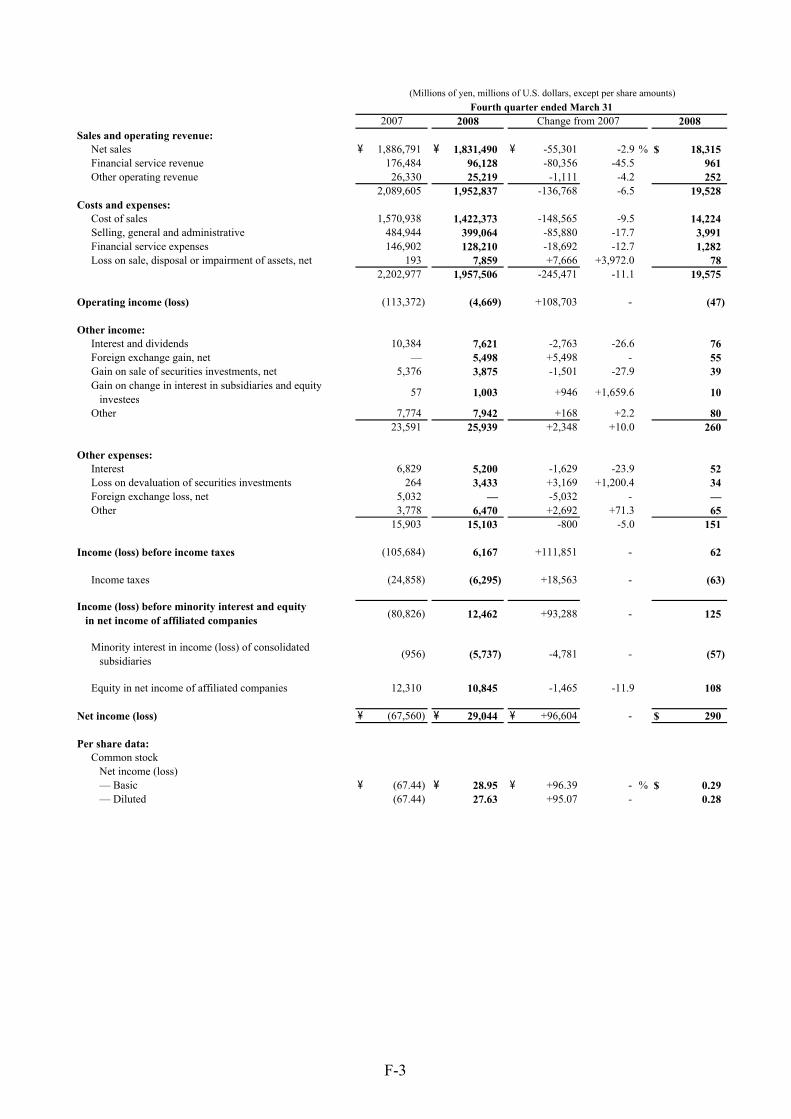
Sales and operating revenue:Net sales \ 1,886,791 \ 1,831,490 \ -55,301 -2.9 % $ 18,315 Financial service revenue 176,484 96,128 -80,356 -45.5 961 Other operating revenue 26,330 25,219 -1,111 -4.2 252
2,089,605 1,952,837 -136,768 -6.5 19,528 Costs and expenses:
Cost of sales 1,570,938 1,422,373 -148,565 -9.5 14,224 Selling, general and administrative 484,944 399,064 -85,880 -17.7 3,991 Financial service expenses 146,902 128,210 -18,692 -12.7 1,282 Loss on sale, disposal or impairment of assets, net 193 7,859 +7,666 +3,972.0 78
2,202,977 1,957,506 -245,471 -11.1 19,575
Operating income (loss) (113,372) (4,669) +108,703 - (47)
Other income:Interest and dividends 10,384 7,621 -2,763 -26.6 76 Foreign exchange gain, net — 5,498 +5,498 - 55 Gain on sale of securities investments, net 5,376 3,875 -1,501 -27.9 39 Gain on change in interest in subsidiaries and equity investees 57 1,003 +946 +1,659.6 10
Other 7,774 7,942 +168 +2.2 80 23,591 25,939 +2,348 +10.0 260
Other expenses:Interest 6,829 5,200 -1,629 -23.9 52 Loss on devaluation of securities investments 264 3,433 +3,169 +1,200.4 34 Foreign exchange loss, net 5,032 — -5,032 - — Other 3,778 6,470 +2,692 +71.3 65
15,903 15,103 -800 -5.0 151
Income (loss) before income taxes (105,684) 6,167 +111,851 - 62
Income taxes (24,858) (6,295) +18,563 - (63)
(80,826) 12,462 +93,288 - 125
Minority interest in income (loss) of consolidated d subsidiaries (956) (5,737) -4,781 - (57)
Equity in net income of affiliated companies 12,310 10,845 -1,465 -11.9 108
Net income (loss) \ (67,560) \ 29,044 \ +96,604 - $ 290
Per share data:Common stock Net income (loss) — Basic \ (67.44) \ 28.95 \ +96.39 - % $ 0.29 — Diluted (67.44) 27.63 +95.07 - 0.28
Income (loss) before minority interest and equity in net income of affiliated companies
(Millions of yen, millions of U.S. dollars, except per share amounts)
2007 2008 Change from 2007 2008Fourth quarter ended March 31
F-3

Balance at March 31, 2006 \ 624,124 \ 1,136,638 \ 1,602,654 \ (156,437) \ (3,127) \ 3,203,852 Exercise of stock acquisition rights 2,175 2,175 4,350 Conversion of convertible bonds 608 608 1,216 Stock based compensation 3,993 3,993
Comprehensive income:Net income 126,328 126,328 Cumulative effect of an accounting change, net of tax (3,785) (3,785) Other comprehensive income, net of tax
Unrealized gains on securities (14,708) (14,708) Unrealized losses on derivative instruments 974 974 Minimum pension liability adjustment (2,754) (2,754) Foreign currency translation adjustments 86,313 86,313
Total comprehensive income 192,368
Stock issue costs, net of tax (22) (22) Dividends declared (25,042) (25,042) Purchase of treasury stock (558) (558) Reissuance of treasury stock 9 46 55 Adoption of FAS No.158 (9,508) (9,508) Other 19,373 (19,373) ― Balance at March 31, 2007 \ 626,907 \ 1,143,423 \ 1,719,506 \ (115,493) \ (3,639) \ 3,370,704
Balance at March 31, 2007 \ 626,907 \ 1,143,423 \ 1,719,506 \ (115,493) \ (3,639) \ 3,370,704 Exercise of stock acquisition rights 3,538 3,685 7,223 Conversion of convertible bonds 131 131 262 Stock based compensation 4,192 4,192
Comprehensive income:Net income 369,435 369,435 Cumulative effect of an accounting change, net of tax (4,452) (4,452) Other comprehensive income, net of tax
Unrealized gains on securities (15,167) (15,167) Unrealized losses on derivative instruments (2,296) (2,296) Pension liability adjustment (26,103) (26,103) Foreign currency translation adjustments (212,468) (212,468)
Total comprehensive income 108,949
Stock issue costs, net of tax (48) (48) Dividends declared (25,080) (25,080) Purchase of treasury stock (1,231) (1,231) Reissuance of treasury stock 16 102 118 Balance at March 31, 2008 \ 630,576 \ 1,151,447 \ 2,059,361 \ (371,527) \ (4,768) \ 3,465,089
Balance at March 31, 2007 $ 6,269 $ 11,434 $ 17,195 $ (1,155) $ (36) $ 33,707 Exercise of stock acquisition rights 36 37 73 Conversion of convertible bonds 1 1 2 Stock based compensation 42 42
Comprehensive income:Net income 3,694 3,694 Cumulative effect of an accounting change, net of tax (45) (45) Other comprehensive income, net of tax
Unrealized gains on securities (152) (152) Unrealized losses on derivative instruments (23) (23) Pension liability adjustment (261) (261) Foreign currency translation adjustments (2,124) (2,124)
Total comprehensive income 1,089
Stock issue costs, net of tax (0) (0) Dividends declared (250) (250) Purchase of treasury stock (13) (13) Reissuance of treasury stock 1 1 Balance at March 31, 2008 $ 6,306 $ 11,514 $ 20,594 $ (3,715) $ (48) $ 34,651
Consolidated Statements of Changes in Stockholders' Equity(Millions of yen)
Common stockAdditional paid-
in capitalRetainedearnings
Accumulatedother
comprehensiveincome
Treasury stock,at cost Total
(Millions of U.S. dollars)
Common stockAdditional paid-
in capitalRetainedearnings
Accumulatedother
comprehensiveincome
Treasury stock,at cost Total
F-4
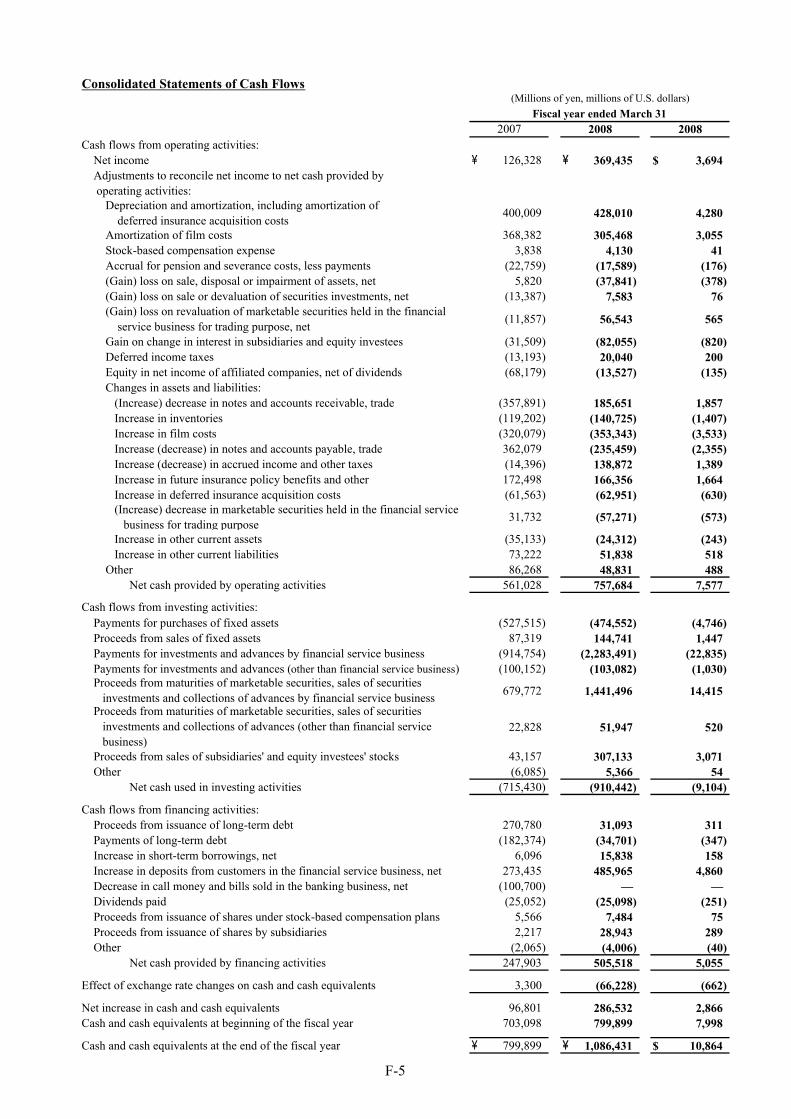
Consolidated Statements of Cash Flows
Cash flows from operating activities:Net income \ 126,328 \ 369,435 $ 3,694 Adjustments to reconcile net income to net cash provided by operating activities:
Depreciation and amortization, including amortization of deferred insurance acquisition costs 400,009 428,010 4,280
Amortization of film costs 368,382 305,468 3,055 Stock-based compensation expense 3,838 4,130 41 Accrual for pension and severance costs, less payments (22,759) (17,589) (176) (Gain) loss on sale, disposal or impairment of assets, net 5,820 (37,841) (378) (Gain) loss on sale or devaluation of securities investments, net (13,387) 7,583 76 (Gain) loss on revaluation of marketable securities held in the financial service business for trading purpose, net (11,857) 56,543 565
Gain on change in interest in subsidiaries and equity investees (31,509) (82,055) (820) Deferred income taxes (13,193) 20,040 200 Equity in net income of affiliated companies, net of dividends (68,179) (13,527) (135) Changes in assets and liabilities: (Increase) decrease in notes and accounts receivable, trade (357,891) 185,651 1,857 Increase in inventories (119,202) (140,725) (1,407) Increase in film costs (320,079) (353,343) (3,533) Increase (decrease) in notes and accounts payable, trade 362,079 (235,459) (2,355) Increase (decrease) in accrued income and other taxes (14,396) 138,872 1,389 Increase in future insurance policy benefits and other 172,498 166,356 1,664 Increase in deferred insurance acquisition costs (61,563) (62,951) (630) (Increase) decrease in marketable securities held in the financial service business for trading purpose 31,732 (57,271) (573)
Increase in other current assets (35,133) (24,312) (243) Increase in other current liabilities 73,222 51,838 518 Other 86,268 48,831 488 Net cash provided by operating activities 561,028 757,684 7,577
Cash flows from investing activities:Payments for purchases of fixed assets (527,515) (474,552) (4,746) Proceeds from sales of fixed assets 87,319 144,741 1,447 Payments for investments and advances by financial service business (914,754) (2,283,491) (22,835) Payments for investments and advances (other than financial service business) (100,152) (103,082) (1,030)
679,772 1,441,496 14,415
22,828 51,947 520
Proceeds from sales of subsidiaries' and equity investees' stocks 43,157 307,133 3,071 Other (6,085) 5,366 54
Net cash used in investing activities (715,430) (910,442) (9,104)
Cash flows from financing activities:Proceeds from issuance of long-term debt 270,780 31,093 311 Payments of long-term debt (182,374) (34,701) (347) Increase in short-term borrowings, net 6,096 15,838 158 Increase in deposits from customers in the financial service business, net 273,435 485,965 4,860 Decrease in call money and bills sold in the banking business, net (100,700) — — Dividends paid (25,052) (25,098) (251) Proceeds from issuance of shares under stock-based compensation plans 5,566 7,484 75 Proceeds from issuance of shares by subsidiaries 2,217 28,943 289 Other (2,065) (4,006) (40)
Net cash provided by financing activities 247,903 505,518 5,055
Effect of exchange rate changes on cash and cash equivalents 3,300 (66,228) (662)
Net increase in cash and cash equivalents 96,801 286,532 2,866 Cash and cash equivalents at beginning of the fiscal year 703,098 799,899 7,998
Cash and cash equivalents at the end of the fiscal year \ 799,899 \ 1,086,431 $ 10,864
Proceeds from maturities of marketable securities, sales of securities investments and collections of advances by financial service businessProceeds from maturities of marketable securities, sales of securities investments and collections of advances (other than financial service business)
(Millions of yen, millions of U.S. dollars)
20082007Fiscal year ended March 31
2008
F-5

F-6
(Notes) 1. U.S. dollar amounts have been translated from yen, for convenience only, at the rate of ¥100 = U.S. $1, the approximate Tokyo
foreign exchange market rate as of March 31, 2008. 2. As of March 31, 2008, Sony had 991 consolidated subsidiaries (including variable interest entities). It has applied the equity
accounting method for 63 affiliated companies. 3. Weighted-average number of outstanding shares used for computation of earnings per share of common stock are as follows.
The dilutive effect in the weighted-average number of outstanding shares mainly resulted from convertible bonds.
Weighted-average number of outstanding shares (Thousands of shares) Fiscal year ended March 31 2007 2008 Net income
— Basic 1,001,403 1,003,001 — Diluted 1,050,171 1,052,212
Weighted-average number of outstanding shares (Thousands of shares) Fourth quarter ended March 31 2007 2008 Net income (loss)
— Basic 1,001,793 1,003,402 — Diluted 1,001,793 1,051,189
4. In September 2005, the Accounting Standards Executive Committee of the American Institute of Certified Public Accountants
issued the Statement of Position (“SOP”) 05-1, “Accounting by Insurance Enterprises for Deferred Acquisition Costs in Connection with Modifications or Exchanges of Insurance Contracts.” SOP 05-1 provides guidance on accounting for deferred acquisition costs on internal replacements of insurance and investment contracts other than those specifically described in FAS No. 97, “Accounting and Reporting by Insurance Enterprises for Certain Long-Duration Contracts and for Realized Gains and Losses from the Sales of Investments.” Sony adopted SOP 05-1 on April 1, 2007. The adoption of SOP 05-1 did not have a material impact on Sony’s results of operations and financial position.
5. In March 2006, the Financial Accounting Standards Board (“FASB”) issued FAS No. 156, “Accounting for Servicing of
Financial Assets - an amendment of FASB Statement No. 140.” This statement amends FAS No. 140, “Accounting for Transfers and Servicing of Financial Assets and Extinguishments of Liabilities” with respect to the accounting for separately recognized servicing assets and servicing liabilities. Sony adopted FAS No. 156 on April 1, 2007. The adoption of FAS No. 156 did not have a material impact on Sony’s results of operations and financial position.
6. In June 2006, the FASB issued FASB Interpretation (“FIN”) No. 48, “Accounting for Uncertainty in Income Taxes, an
interpretation of FASB Statement No. 109.” FIN No. 48 clarifies the accounting for uncertainty in income taxes recognized in an enterprise's financial statements in accordance with FAS No. 109, “Accounting for Income Taxes.” FIN No. 48 prescribes a minimum recognition threshold and measurement attribute for the financial statement recognition and measurement of a tax position taken or expected to be taken in a tax return. FIN No. 48 also provides guidance on derecognition, classification, interest and penalties, accounting in interim periods, disclosure, and transition. Sony adopted FIN No. 48 effective April 1, 2007. As a result of the adoption of FIN No. 48, a charge against beginning retained earnings totaling ¥4,452 million ($45 million) was recorded. As of April 1, 2007, total unrecognized tax benefits were ¥223,857 million ($2,239 million). If Sony were to prevail on all unrecognized tax benefits recorded, ¥129,632 million ($1,296 million) of the ¥223,857 million would reduce the effective tax rate.
7. In June 2006, the Emerging Issues Task Force (“EITF”) issued EITF Issue No. 06-3, “How Taxes Collected from Customers and Remitted to Governmental Authorities Should be Presented in the Income Statement.” EITF Issue No. 06-3 requires disclosure of the accounting policy for any tax assessed by a governmental authority that is imposed concurrently on a specific revenue-producing transaction between a seller and a customer. EITF Issue No. 06-3 should be applied to financial reports for

F-7
interim and annual reporting periods beginning after December 15, 2006. Sony adopted EITF Issue No. 06-3 on April 1, 2007. The adoption of EITF Issue No. 06-3 did not have a material impact on Sony’s results of operations and financial position.
Other Consolidated Financial Data (Millions of yen, millions of U.S. dollars) Fiscal year ended March 31 2007 2008 Change 2008 Capital expenditures (additions to property, plant and equipment) ¥ 414,138 ¥ 335,726 -18.9% $ 3,357Depreciation and amortization expenses* 400,009 428,010 +7.0 4,280(Depreciation expenses for tangible assets) (315,773) (328,940) +4.2 (3,289)Research and development expenses 543,937 520,568 -4.3 5,206 Fourth quarter ended March 31 2007 2008 Change 2008 Capital expenditures (additions to property, plant and equipment) ¥ 102,093 ¥ 97,862 -4.1% $ 979Depreciation and amortization expenses* 115,155 113,771 -1.2 1,138(Depreciation expenses for tangible assets) (89,804) (86,316) -3.9 (863)Research and development expenses 147,560 137,370 -6.9 1,374 * Including amortization expenses for intangible assets and for deferred insurance acquisition costs
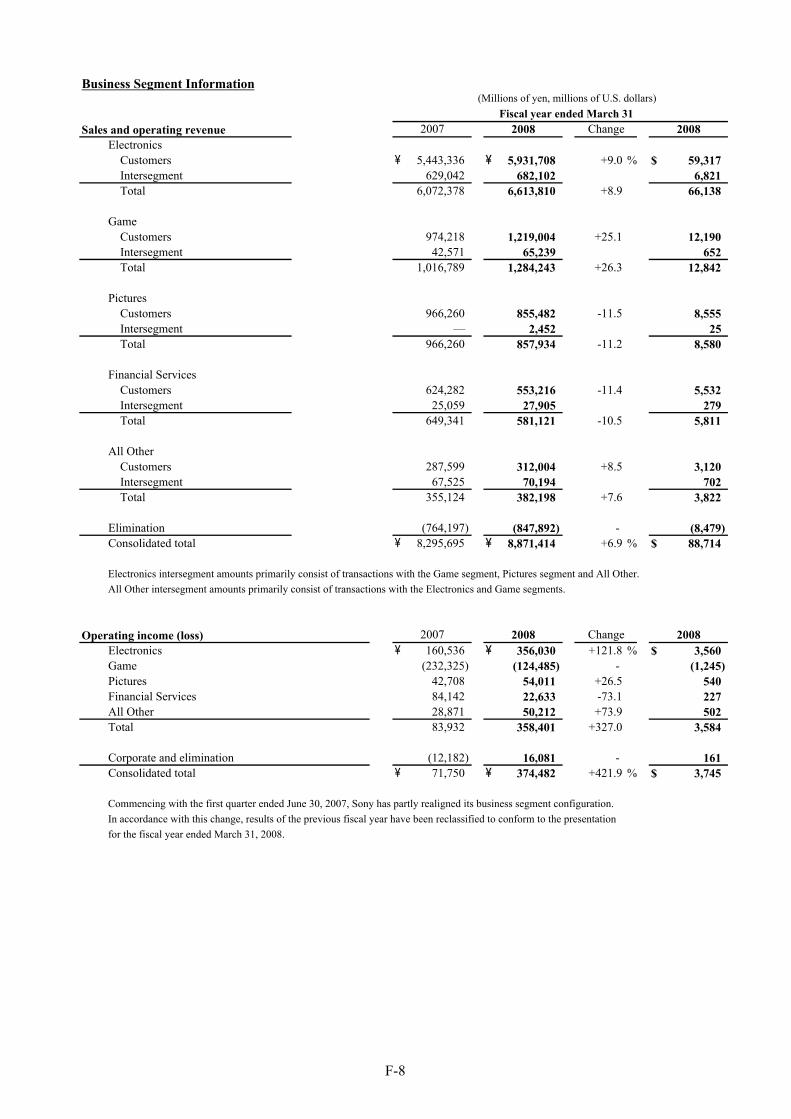
Business Segment Information
Sales and operating revenueElectronics
Customers \ 5,443,336 \ 5,931,708 +9.0 % $ 59,317 Intersegment 629,042 682,102 6,821 Total 6,072,378 6,613,810 +8.9 66,138
GameCustomers 974,218 1,219,004 +25.1 12,190 Intersegment 42,571 65,239 652 Total 1,016,789 1,284,243 +26.3 12,842
PicturesCustomers 966,260 855,482 -11.5 8,555 Intersegment — 2,452 25 Total 966,260 857,934 -11.2 8,580
Financial ServicesCustomers 624,282 553,216 -11.4 5,532 Intersegment 25,059 27,905 279 Total 649,341 581,121 -10.5 5,811
All OtherCustomers 287,599 312,004 +8.5 3,120 Intersegment 67,525 70,194 702 Total 355,124 382,198 +7.6 3,822
Elimination (764,197) (847,892) - (8,479) Consolidated total \ 8,295,695 \ 8,871,414 +6.9 % $ 88,714
Electronics intersegment amounts primarily consist of transactions with the Game segment, Pictures segment and All Other.All Other intersegment amounts primarily consist of transactions with the Electronics and Game segments.
Operating income (loss)Electronics \ 160,536 \ 356,030 +121.8 % $ 3,560 Game (232,325) (124,485) - (1,245) Pictures 42,708 54,011 +26.5 540 Financial Services 84,142 22,633 -73.1 227 All Other 28,871 50,212 +73.9 502 Total 83,932 358,401 +327.0 3,584
Corporate and elimination (12,182) 16,081 - 161 Consolidated total \ 71,750 \ 374,482 +421.9 % $ 3,745
Commencing with the first quarter ended June 30, 2007, Sony has partly realigned its business segment configuration.In accordance with this change, results of the previous fiscal year have been reclassified to conform to the presentationfor the fiscal year ended March 31, 2008.
Change 2008
(Millions of yen, millions of U.S. dollars)Fiscal year ended March 31
2007 2008
2007 2008 2008Change
F-8

Sales and operating revenueElectronics
Customers \ 1,281,997 \ 1,305,655 +1.8 % $ 13,057 Intersegment 253,341 146,333 1,463 Total 1,535,338 1,451,988 -5.4 14,520
GameCustomers 270,290 250,567 -7.3 2,506 Intersegment 10,891 12,515 125 Total 281,181 263,082 -6.4 2,631
PicturesCustomers 286,401 211,642 -26.1 2,116 Intersegment — 1,492 15 Total 286,401 213,134 -25.6 2,131
Financial ServicesCustomers 176,484 96,128 -45.5 961 Intersegment 7,745 6,753 68 Total 184,229 102,881 -44.2 1,029
All OtherCustomers 74,433 88,845 +19.4 888 Intersegment 17,041 17,966 180 Total 91,474 106,811 +16.8 1,068
Elimination (289,018) (185,059) - (1,851) Consolidated total \ 2,089,605 \ 1,952,837 -6.5 % $ 19,528
Electronics intersegment amounts primarily consist of transactions with the Game segment, Pictures segment and All Other.All Other intersegment amounts primarily consist of transactions with the Electronics and Game segments.
Operating income (loss)Electronics \ (73,945) \ (1,485) - % $ (15) Game (107,827) (11,515) - (115) Pictures 32,912 34,852 +5.9 349 Financial Services 29,526 (30,088) - (301) All Other 5,316 21,338 +301.4 213 Total (114,018) 13,102 - 131
Corporate and elimination 646 (17,771) - (178) Consolidated total \ (113,372) \ (4,669) - % $ (47)
Commencing with the first quarter ended June 30, 2007, Sony has partly realigned its business segment configuration.In accordance with this change, results of the previous fourth quarter have been reclassified to conform to the presentationfor the fourth quarter ended March 31, 2008.
Change 2008
(Millions of yen, millions of U.S. dollars)Fourth quarter ended March 31
2007 2008
2007 2008 2008Change
F-9

Electronics Sales and Operating Revenue to Customers by Product Category
Sales and operating revenueAudio \ 522,879 \ 558,624 +6.8 % $ 5,586 Video 1,143,120 1,279,225 +11.9 12,792 Televisions 1,226,971 1,367,078 +11.4 13,671 Information and Communications 950,461 1,098,574 +15.6 10,986 Semiconductors 205,757 228,711 +11.2 2,287 Components 852,981 847,131 -0.7 8,471 Other 541,167 552,365 +2.1 5,524 Total \ 5,443,336 \ 5,931,708 +9.0 % $ 59,317
Sales and operating revenueAudio \ 110,243 \ 112,134 +1.7 % $ 1,121 Video 234,586 235,597 +0.4 2,356 Televisions 292,614 314,869 +7.6 3,149 Information and Communications 263,374 275,545 +4.6 2,756 Semiconductors 53,085 55,985 +5.5 560 Components 199,322 200,635 +0.7 2,006 Other 128,773 110,890 -13.9 1,109 Total \ 1,281,997 \ 1,305,655 +1.8 % $ 13,057
The above table is a breakdown of Electronics sales and operating revenue to customers in the Business Segment Information on pages F-8 and F-9. The Electronics segment is managed as a single operating segment by Sony's management. However, Sony believes that the information in this tableis useful to investors in understanding the product categories in this business segment.
Geographic Segment Information
Sales and operating revenueJapan \ 2,127,841 \ 2,056,374 -3.4 % $ 20,564 United States 2,232,453 2,221,862 -0.5 22,219 Europe 2,037,658 2,328,233 +14.3 23,282 Other Areas 1,897,743 2,264,945 +19.3 22,649 Total \ 8,295,695 \ 8,871,414 +6.9 % $ 88,714
Sales and operating revenueJapan \ 544,476 \ 455,253 -16.4 % $ 4,552 United States 541,416 484,966 -10.4 4,850 Europe 539,385 518,225 -3.9 5,182 Other Areas 464,328 494,393 +6.5 4,944 Total \ 2,089,605 \ 1,952,837 -6.5 % $ 19,528
Classification of Geographic Segment Information shows sales and operating revenue recognized by location of customers.
(Millions of yen, millions of U.S. dollars)
Fourth quarter ended March 31
20082007
2007 2008 Change 2008Fiscal year ended March 31
2008
2007 2008 Change 2008
Change
(Millions of yen, millions of U.S. dollars)
Fourth quarter ended March 31
Fiscal year ended March 312007 2008 Change 2008
F-10
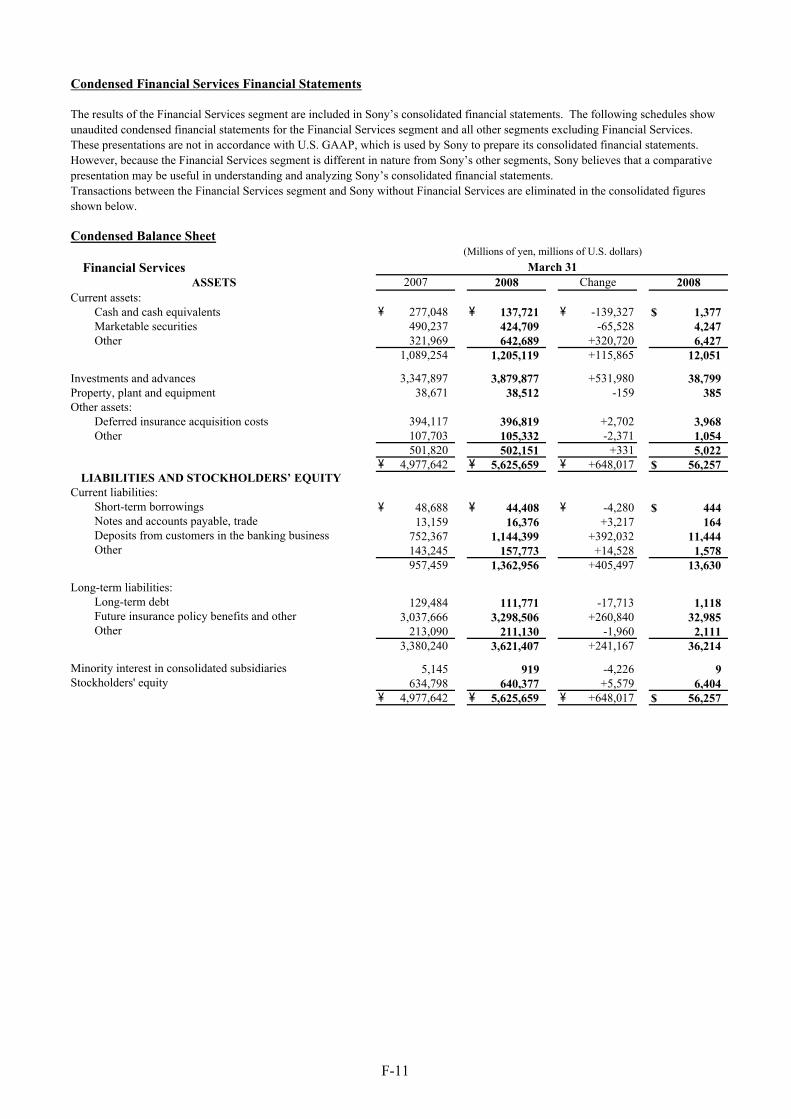
Condensed Financial Services Financial Statements
The results of the Financial Services segment are included in Sony’s consolidated financial statements. The following schedules showunaudited condensed financial statements for the Financial Services segment and all other segments excluding Financial Services.These presentations are not in accordance with U.S. GAAP, which is used by Sony to prepare its consolidated financial statements. However, because the Financial Services segment is different in nature from Sony’s other segments, Sony believes that a comparativepresentation may be useful in understanding and analyzing Sony’s consolidated financial statements.Transactions between the Financial Services segment and Sony without Financial Services are eliminated in the consolidated figuresshown below.
Condensed Balance Sheet
Financial Services
Current assets:Cash and cash equivalents \ 277,048 \ 137,721 \ -139,327 $ 1,377 Marketable securities 490,237 424,709 -65,528 4,247 Other 321,969 642,689 +320,720 6,427
1,089,254 1,205,119 +115,865 12,051
Investments and advances 3,347,897 3,879,877 +531,980 38,799 Property, plant and equipment 38,671 38,512 -159 385 Other assets:
Deferred insurance acquisition costs 394,117 396,819 +2,702 3,968 Other 107,703 105,332 -2,371 1,054
501,820 502,151 +331 5,022 \ 4,977,642 \ 5,625,659 \ +648,017 $ 56,257
Current liabilities:Short-term borrowings \ 48,688 \ 44,408 \ -4,280 $ 444 Notes and accounts payable, trade 13,159 16,376 +3,217 164 Deposits from customers in the banking business 752,367 1,144,399 +392,032 11,444 Other 143,245 157,773 +14,528 1,578
957,459 1,362,956 +405,497 13,630
Long-term liabilities:Long-term debt 129,484 111,771 -17,713 1,118 Future insurance policy benefits and other 3,037,666 3,298,506 +260,840 32,985 Other 213,090 211,130 -1,960 2,111
3,380,240 3,621,407 +241,167 36,214
Minority interest in consolidated subsidiaries 5,145 919 -4,226 9 Stockholders' equity 634,798 640,377 +5,579 6,404
\ 4,977,642 \ 5,625,659 \ +648,017 $ 56,257
(Millions of yen, millions of U.S. dollars)March 31
LIABILITIES AND STOCKHOLDERS’ EQUITY
2007 2008 ASSETS 2008Change
F-11
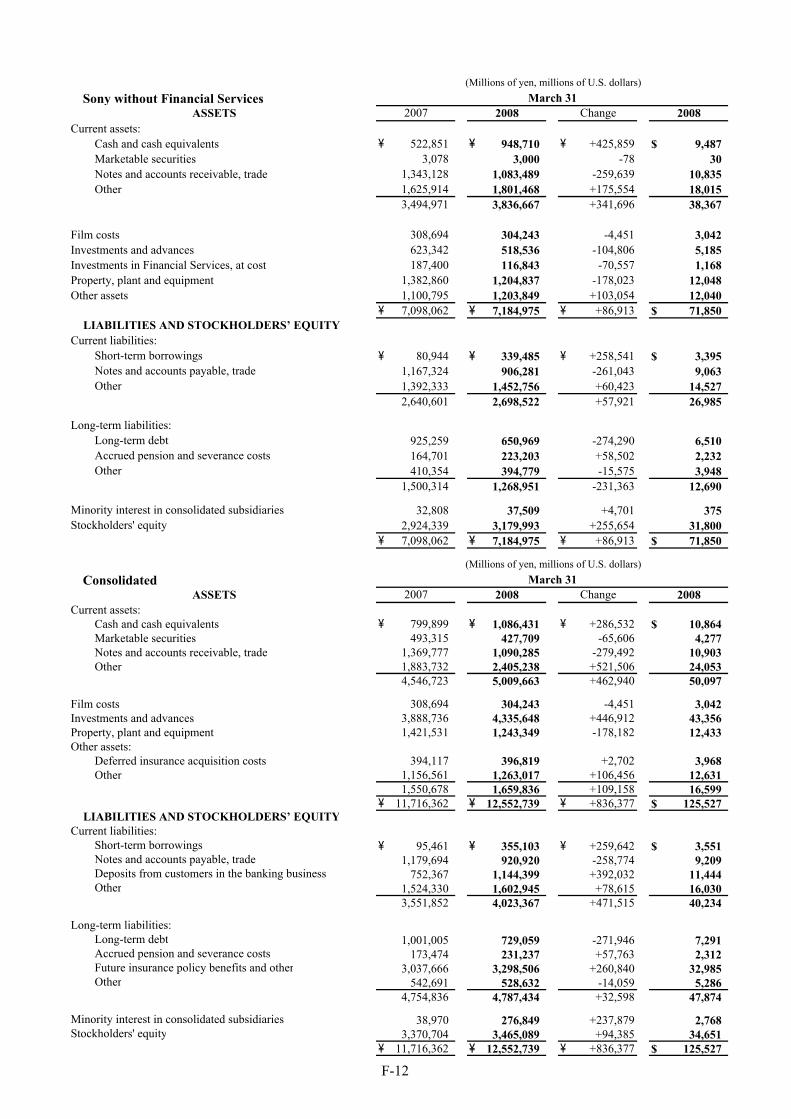
Sony without Financial Services
Current assets:Cash and cash equivalents \ 522,851 \ 948,710 \ +425,859 $ 9,487 Marketable securities 3,078 3,000 -78 30 Notes and accounts receivable, trade 1,343,128 1,083,489 -259,639 10,835 Other 1,625,914 1,801,468 +175,554 18,015
3,494,971 3,836,667 +341,696 38,367
Film costs 308,694 304,243 -4,451 3,042 Investments and advances 623,342 518,536 -104,806 5,185 Investments in Financial Services, at cost 187,400 116,843 -70,557 1,168 Property, plant and equipment 1,382,860 1,204,837 -178,023 12,048 Other assets 1,100,795 1,203,849 +103,054 12,040
\ 7,098,062 \ 7,184,975 \ +86,913 $ 71,850
Current liabilities:Short-term borrowings \ 80,944 \ 339,485 \ +258,541 $ 3,395 Notes and accounts payable, trade 1,167,324 906,281 -261,043 9,063 Other 1,392,333 1,452,756 +60,423 14,527
2,640,601 2,698,522 +57,921 26,985
Long-term liabilities:Long-term debt 925,259 650,969 -274,290 6,510 Accrued pension and severance costs 164,701 223,203 +58,502 2,232 Other 410,354 394,779 -15,575 3,948
1,500,314 1,268,951 -231,363 12,690
Minority interest in consolidated subsidiaries 32,808 37,509 +4,701 375 Stockholders' equity 2,924,339 3,179,993 +255,654 31,800
\ 7,098,062 \ 7,184,975 \ +86,913 $ 71,850
Consolidated
Current assets:Cash and cash equivalents \ 799,899 \ 1,086,431 \ +286,532 $ 10,864 Marketable securities 493,315 427,709 -65,606 4,277 Notes and accounts receivable, trade 1,369,777 1,090,285 -279,492 10,903 Other 1,883,732 2,405,238 +521,506 24,053
4,546,723 5,009,663 +462,940 50,097
Film costs 308,694 304,243 -4,451 3,042 Investments and advances 3,888,736 4,335,648 +446,912 43,356 Property, plant and equipment 1,421,531 1,243,349 -178,182 12,433 Other assets:
Deferred insurance acquisition costs 394,117 396,819 +2,702 3,968 Other 1,156,561 1,263,017 +106,456 12,631
1,550,678 1,659,836 +109,158 16,599 \ 11,716,362 \ 12,552,739 \ +836,377 $ 125,527
Current liabilities:Short-term borrowings \ 95,461 \ 355,103 \ +259,642 $ 3,551 Notes and accounts payable, trade 1,179,694 920,920 -258,774 9,209 Deposits from customers in the banking business 752,367 1,144,399 +392,032 11,444 Other 1,524,330 1,602,945 +78,615 16,030
3,551,852 4,023,367 +471,515 40,234
Long-term liabilities:Long-term debt 1,001,005 729,059 -271,946 7,291 Accrued pension and severance costs 173,474 231,237 +57,763 2,312 Future insurance policy benefits and other 3,037,666 3,298,506 +260,840 32,985 Other 542,691 528,632 -14,059 5,286
4,754,836 4,787,434 +32,598 47,874
Minority interest in consolidated subsidiaries 38,970 276,849 +237,879 2,768 Stockholders' equity 3,370,704 3,465,089 +94,385 34,651
\ 11,716,362 \ 12,552,739 \ +836,377 $ 125,527
(Millions of yen, millions of U.S. dollars)
2008
LIABILITIES AND STOCKHOLDERS’ EQUITY
2008
ASSETS
ASSETS
2008
LIABILITIES AND STOCKHOLDERS’ EQUITY
2007
2007March 31
2008Change
ChangeMarch 31
(Millions of yen, millions of U.S. dollars)
F-12

Condensed Statements of Income
Financial Services
Financial service revenue \ 649,341 \ 581,121 -10.5 % $ 5,811 Financial service expenses 565,199 558,488 -1.2 5,584 Operating income 84,142 22,633 -73.1 227 Other income (expenses), net 9,886 (383) — (4) Income before income taxes 94,028 22,250 -76.3 223 Income taxes and other 33,536 11,908 -64.5 120 Net income \ 60,492 \ 10,342 -82.9 % $ 103
Sony without Financial Services
Net sales and operating revenue \ 7,680,578 \ 8,324,828 +8.4 % $ 83,248 Costs and expenses 7,694,375 7,974,630 +3.6 79,746 Operating income (loss) (13,797) 350,198 — 3,502 Other income (expenses), net 27,917 100,479 +259.9 1,005 Income before income taxes 14,120 450,677 +3,091.8 4,507 Income taxes and other (57,991) 93,373 — 934 Net income \ 72,111 \ 357,304 +395.5 % $ 3,573
Consolidated
Financial service revenue \ 624,282 \ 553,216 -11.4 % $ 5,532 Net sales and operating revenue 7,671,413 8,318,198 +8.4 83,182
8,295,695 8,871,414 +6.9 88,714 Costs and expenses 8,223,945 8,496,932 +3.3 84,969 Operating income 71,750 374,482 +421.9 3,745 Other income (expenses), net 30,287 91,835 +203.2 918 Income before income taxes 102,037 466,317 +357.0 4,663 Income taxes and other (24,291) 96,882 — 969 Net income \ 126,328 \ 369,435 +192.4 % $ 3,694
2007 2008 Change 2008
Change 2008
Fiscal year ended March 31(Millions of yen, millions of U.S. dollars)
Fiscal year ended March 312007
(Millions of yen, millions of U.S. dollars)
(Millions of yen, millions of U.S. dollars)Fiscal year ended March 31
2007 2008 2008Change
2008
F-13
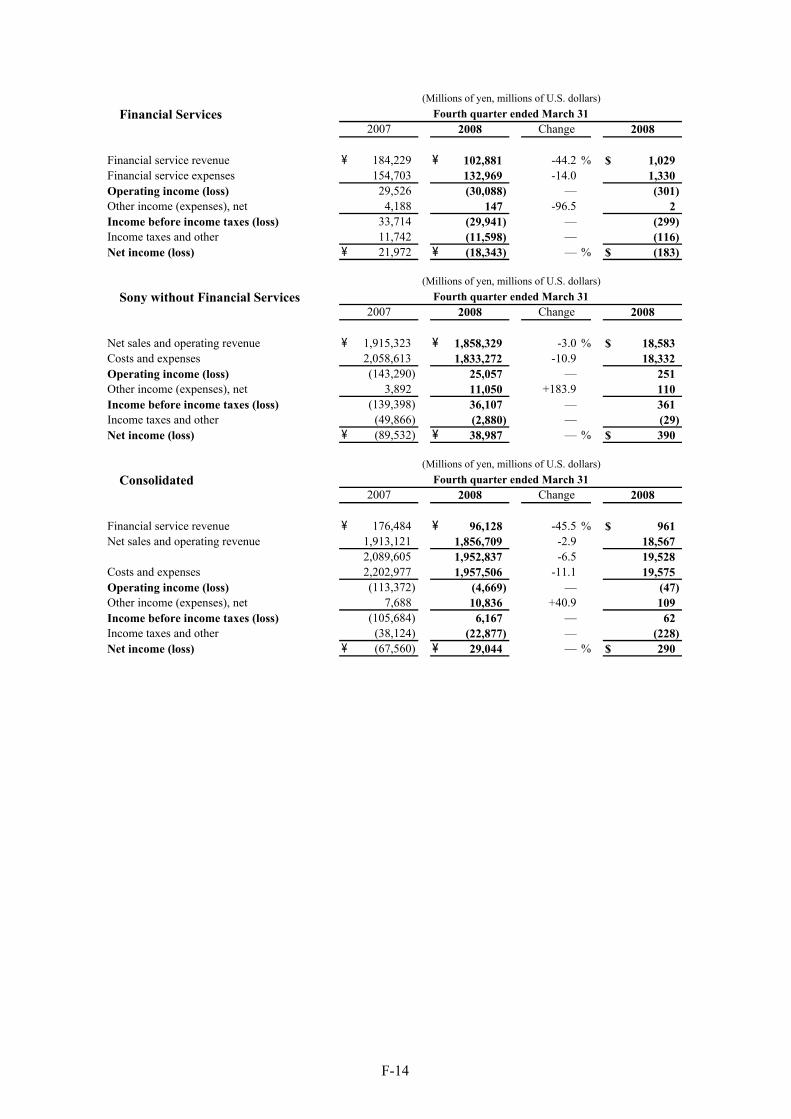
Financial Services
Financial service revenue \ 184,229 \ 102,881 -44.2 % $ 1,029 Financial service expenses 154,703 132,969 -14.0 1,330 Operating income (loss) 29,526 (30,088) — (301) Other income (expenses), net 4,188 147 -96.5 2Income before income taxes (loss) 33,714 (29,941) — (299) Income taxes and other 11,742 (11,598) — (116) Net income (loss) \ 21,972 \ (18,343) — % $ (183)
Sony without Financial Services
Net sales and operating revenue \ 1,915,323 \ 1,858,329 -3.0 % $ 18,583 Costs and expenses 2,058,613 1,833,272 -10.9 18,332 Operating income (loss) (143,290) 25,057 — 251 Other income (expenses), net 3,892 11,050 +183.9 110 Income before income taxes (loss) (139,398) 36,107 — 361 Income taxes and other (49,866) (2,880) — (29) Net income (loss) \ (89,532) \ 38,987 — % $ 390
Consolidated
Financial service revenue \ 176,484 \ 96,128 -45.5 % $ 961 Net sales and operating revenue 1,913,121 1,856,709 -2.9 18,567
2,089,605 1,952,837 -6.5 19,528 Costs and expenses 2,202,977 1,957,506 -11.1 19,575 Operating income (loss) (113,372) (4,669) — (47) Other income (expenses), net 7,688 10,836 +40.9 109 Income before income taxes (loss) (105,684) 6,167 — 62 Income taxes and other (38,124) (22,877) — (228) Net income (loss) \ (67,560) \ 29,044 — % $ 290
Fourth quarter ended March 312007
(Millions of yen, millions of U.S. dollars)
(Millions of yen, millions of U.S. dollars)Fourth quarter ended March 31
2007 2008 2008Change
2008 Change 2008
Fourth quarter ended March 31(Millions of yen, millions of U.S. dollars)
2007 2008 Change 2008
F-14

Condensed Statements of Cash Flows
Financial Services
Net cash provided by operating activities \ 256,540 \ 242,610 $ 2,426 Net cash used in investing activities (276,749) (873,646) (8,736) Net cash provided by financing activities 179,627 491,709 4,917 Net increase (decrease) in cash and cash equivalents 159,418 (139,327) (1,393) Cash and cash equivalents at beginning of the fiscal year 117,630 277,048 2,770 Cash and cash equivalents at the end of the fiscal year \ 277,048 \ 137,721 $ 1,377
Sony without Financial Services
Net cash provided by operating activities \ 305,571 \ 519,112 $ 5,191 Net cash used in investing activities (431,086) (14,925) (149) Net cash provided (used in) by financing activities 59,598 (12,100) (121) Effect of exchange rate changes on cash and cash equivalents 3,300 (66,228) (662) Net increase (decrease) in cash and cash equivalents (62,617) 425,859 4,259 Cash and cash equivalents at beginning of the fiscal year 585,468 522,851 5,228 Cash and cash equivalents at end of the fiscal year \ 522,851 \ 948,710 $ 9,487
Consolidated
Net cash provided by operating activities \ 561,028 \ 757,684 $ 7,577 Net cash used in investing activities (715,430) (910,442) (9,104) Net cash provided by financing activities 247,903 505,518 5,055 Effect of exchange rate changes on cash and cash equivalents 3,300 (66,228) (662) Net increase in cash and cash equivalents 96,801 286,532 2,866 Cash and cash equivalents at beginning of the fiscal year 703,098 799,899 7,998 Cash and cash equivalents at the end of the fiscal year \ 799,899 \ 1,086,431 $ 10,864
(Millions of yen, millions of U.S. dollars)Fiscal year ended March 31
2008 20082007
(Millions of yen, millions of U.S. dollars)Fiscal year ended March 31
2007 2008 2008
(Millions of yen, millions of U.S. dollars)Fiscal year ended March 31
2007 2008 2008
F-15