news from xerox - amazon web...
TRANSCRIPT
Xerox Reports Third-Quarter 2011 Earnings Third-quarter GAAP earnings per share of 22 cents Adjusted EPS of 26 cents, up 18 percent Revenue up 3 percent, 1 percent constant currency Operating margin increased to 9.6 percent Stock repurchase of $309 million NORWALK, Conn., Oct. 25, 2011 – Xerox Corporation (NYSE: XRX) announced today third-quarter 2011 results that include adjusted earnings per share of 26 cents, up 18 percent from third-quarter 2010. Adjusted EPS excludes 4 cents related to the amortization of intangibles, resulting in GAAP EPS of 22 cents.
“We delivered steady revenue growth this quarter along with earnings and cash in line with our expectations,” said Ursula Burns, Xerox chairman and chief executive officer. “Our consistent performance positions us well to grow full-year adjusted EPS by 15 to 18 percent, reflecting our global strengths in business process and document management and the efficiencies we’re driving across our enterprise.”
Third-quarter revenue of $5.6 billion was up 3 percent or 1 percent in constant currency. Revenue from technology, representing the sale of document systems, supplies, technical service and financing of products, was up 1 percent or down 1 percent in constant currency. “Supply constraints due to the natural disaster in Japan have eased considerably,” noted Burns. “As we continue to meet new demand, all while reducing our backlog, we’re confident these challenges are entirely behind us.”
Revenue from services was up 6 percent or 5 percent in constant currency, reflecting growth in business process and document outsourcing, while revenue from IT outsourcing was flat. Signings for Xerox’s services were very strong, totaling $3.9 billion in the third quarter – an increase of 33 percent from third quarter 2010, and down 9 percent on a trailing 12-month basis due to the cyclicality of large deals. “Our services-led, technology-driven approach gives us a competitive advantage in the many markets we serve, especially as businesses and governments seek more efficient ways to run their operations and turn to Xerox for the long term benefits of our outsourcing expertise,” said Burns.
“Backed by a growing pipeline, our increasing services signings boost our annuity stream and contribute to a strong revenue base. Notable in the quarter was 12 percent revenue growth in our document outsourcing business as we continue to lead the industry with our broad-based managed print services, and 6 percent growth in business process outsourcing.
“As demand increased for services, we did see an impact on gross margin, which we continued to offset with cost reductions and operational improvements that helped deliver solid bottom-line results,” she added.
News from Xerox
For Immediate Release Xerox Corporation 45 Glover Avenue P.O. Box 4505 Norwalk, CT 06856-4505 tel +1-203-968-3000
2
Third-quarter gross margin was 32.7 percent, and selling, administrative and general expenses were 19.9 percent of revenue. Operating margin of 9.6 percent was up 0.4 points from third-quarter 2010. Xerox generated $366 million in operating cash flow during the third quarter. As planned, the company resumed its stock buyback program during the third quarter, repurchasing $309 million in Xerox shares with approximately $400 million more expected in the fourth quarter. Xerox expects fourth-quarter 2011 GAAP earnings per share of 28 cents to 31cents, resulting in full-year GAAP earnings per share of 92 cents to 95 cents. Fourth-quarter adjusted EPS is expected to be 32 cents to 35 cents per share, delivering full-year adjusted EPS of $1.08 to $1.11. About Xerox Xerox Corporation is a $22 billion leading global enterprise for business process and document management. Through its broad portfolio of technology and services, Xerox provides the essential back-office support that clears the way for clients to focus on what they do best: their real business. Headquartered in Norwalk, Conn., Xerox provides leading-edge document technology, services, software and genuine Xerox supplies for graphic communication and office printing environments of any size. Through ACS, A Xerox Company, which Xerox acquired in February 2010, Xerox also offers extensive business process outsourcing and IT outsourcing services, including data processing, HR benefits management, finance support, and customer relationship management services for commercial and government organizations worldwide. The 134,000 people of Xerox serve clients in more than 160 countries. For more information, visit http://www.xerox.com, http://news.xerox.com, http://www.realbusiness.com or http://www.acs-inc.com. For investor information, visit http://www.xerox.com/investor. Non- GAAP Measures: This release refers to the following non-GAAP financial measures: • Adjusted EPS (earnings per share) for the third quarter of 2011 and 2010 as well
as for the fourth quarter and full year 2011 guidance that excludes certain items. • Operating margin for the third quarter 2011 that excludes certain expenses. • Constant Currency revenue growth that excludes the effects of currency
translation. Refer to the “Non-GAAP Financial Measures” section of this release for a discussion of these non-GAAP measures and their reconciliation to the reported GAAP measure. Forward-Looking Statements This release contains "forward-looking statements" as defined in the Private Securities Litigation Reform Act of 1995. The words “anticipate,” “believe,” “estimate,” “expect,” “intend,” “will,” “should” and similar expressions, as they relate to us, are intended to identify forward-looking statements. These statements reflect management’s current beliefs, assumptions and expectations and are subject to a number of factors that may cause actual results to differ materially. These factors include but are not limited to: changes in economic conditions, political conditions, trade protection measures, licensing requirements, environmental regulations and tax matters in the United States and in the foreign countries in which we do business; changes in foreign

3
currency exchange rates; the outcome of litigation and regulatory proceedings to which we may be a party; actions of competitors; our ability to expand equipment placements and to drive the expanded use of color in printing and copying; development of new products and services; interest rates, cost of borrowing and access to credit markets; our ability to protect our intellectual property rights; our ability to obtain adequate pricing for our products and services and to maintain and improve cost efficiency of operations, including savings from restructuring actions; the risk that unexpected costs will be incurred; reliance on third parties for manufacturing of products and provision of services; the risk that we will not realize all of the anticipated benefits from the acquisition of Affiliated Computer Services, Inc.; our ability to recover capital investments; the risk that subcontractors, software vendors and utility and network providers will not perform in a timely, quality manner; the risk that multi-year contracts with governmental entities could be terminated prior to the end of the contract term; the risk that individually identifiable information of customers, clients and employees could be inadvertently disclosed or disclosed as a result of a breach of our security; and other factors that are set forth in the “Risk Factors” section, the “Legal Proceedings” section, the “Management’s Discussion and Analysis of Financial Condition and Results of Operations” section and other sections of our Quarterly Reports on Form 10-Q for the quarters ended March 31, 2011 and June 30, 2011 and our 2010 Annual Report on Form 10-K filed with the Securities and Exchange Commission. The Company assumes no obligation to update any forward-looking statements as a result of new information or future events or developments, except as required by law.
-XXX- Media Contacts: Karen Arena, Xerox Corporation, +1-203-849-5521, [email protected] Ken Ericson, Xerox Corporation, +1-410-571-0161, [email protected] Note: To receive RSS news feeds, visit http://news.xerox.com/pr/xerox/rss.aspx. For open commentary, industry perspectives and views from events visit http://twitter.com/xeroxcorp, http://twitter.com/xeroxoffice, http://twitter.com/xeroxproduction, http://twitter.com/servicesatxerox, http://twitter.com/xeroxevents, http://www.xerox.com/blogs, http://www.xerox.com/podcasts. XEROX®, XEROX and Design® are trademarks of Xerox Corporation in the United States and/or other countries.

4
Xerox Corporation
Condensed Consolidated Statements of Income (Unaudited)
(in millions, except per-share data) 2011 2010 % Change 2011 2010 % Change
RevenuesSales 1,738$ 1,700$ 2% 5,129$ 5,169$ (1%)Service, outsourcing and rentals 3,689 3,567 3% 11,052 9,990 11% Finance income 156 161 (3%) 481 498 (3%)
Total Revenues 5,583 5,428 3% 16,662 15,657 6%
Costs and ExpensesCost of sales 1,154 1,127 2% 3,383 3,381 0% Cost of service, outsourcing and rentals 2,545 2,417 5% 7,597 6,647 14% Equipment financing interest 56 61 (8%) 176 186 (5%)Research, development and engineering expenses 183 189 (3%) 542 588 (8%)Selling, administrative and general expenses 1,109 1,136 (2%) 3,347 3,398 (2%)Restructuring and asset impairment charges (4) 4 * (28) 210 *Acquisition-related costs - 5 * - 68 *Amortization of intangible assets 87 85 2% 259 227 14% Other expenses, net 86 76 13% 268 314 (15%)
Total Costs and Expenses 5,216 5,100 2% 15,544 15,019 3%
367 328 12% 1,118 638 75% Income tax expense 81 98 (17%) 284 232 22% Equity in net income of unconsolidated affiliates 43 26 65% 111 52 *
Net Income 329 256 29% 945 458 *
Less: Net income attributable to noncontrolling interests 9 6 50% 25 23 9%
Net Income Attributable to Xerox 320$ 250$ 28% 920$ 435$ *
Basic Earnings per Share 0.23$ 0.18$ 28% 0.65$ 0.32$ *Diluted Earnings per Share 0.22$ 0.17$ 29% 0.63$ 0.32$ 97%
* Percent change not meaningful.(1) Referred to as "Pre-Tax Income" throughout the remainder of this document.
Income before Income Taxes & Equity Income(1)
Nine Months Ended September 30,
Three Months Ended September 30,

5
Xerox Corporation Condensed Consolidated Balance Sheets (Unaudited)
September 30, December 31,
(in millions, except share data in thousands) 2011 2010AssetsCash and cash equivalents 785$ 1,211$ Accounts receivable, net 3,001 2,826 Billed portion of finance receivables, net 170 198 Finance receivables, net 2,178 2,287 Inventories 1,209 991 Other current assets 1,138 1,126 Total current assets 8,481 8,639 Finance receivables due after one year, net 4,007 4,135 Equipment on operating leases, net 505 530 Land, buildings and equipment, net 1,645 1,671 Investments in affiliates, at equity 1,388 1,291 Intangible assets, net 3,172 3,371 Goodwill 8,786 8,649 Deferred tax assets, long-term 414 540 Other long-term assets 2,143 1,774 Total Assets 30,541$ 30,600$ Liabilities and Equity Short-term debt and current portion of long-term debt 2,096$ 1,370$ Accounts payable 1,811 1,968 Accrued compensation and benefits costs 752 901 Unearned income 375 371 Other current liabilities 1,618 1,807 Total current liabilities 6,652 6,417 Long-term debt 7,099 7,237 Liability to subsidiary trust issuing preferred securities - 650 Pension and other benefit liabilities 1,748 2,071 Post-retirement medical benefits 885 920 Other long-term liabilities 888 797 Total Liabilities 17,272 18,092
Series A Convertible Preferred Stock 349 349
Common stock 1,425 1,398 Additional paid-in capital 6,788 6,580 Treasury stock, at cost (309) - Retained earnings 6,736 6,016 Accumulated other comprehensive loss (1,886) (1,988) Xerox shareholders' equity 12,754 12,006 Noncontrolling interests 166 153 Total Equity 12,920 12,159 Total Liabilities and Equity 30,541$ 30,600$
Shares of common stock issued 1,424,765 1,397,578 Treasury stock (37,712) - Shares of common stock outstanding 1,387,053 1,397,578
6
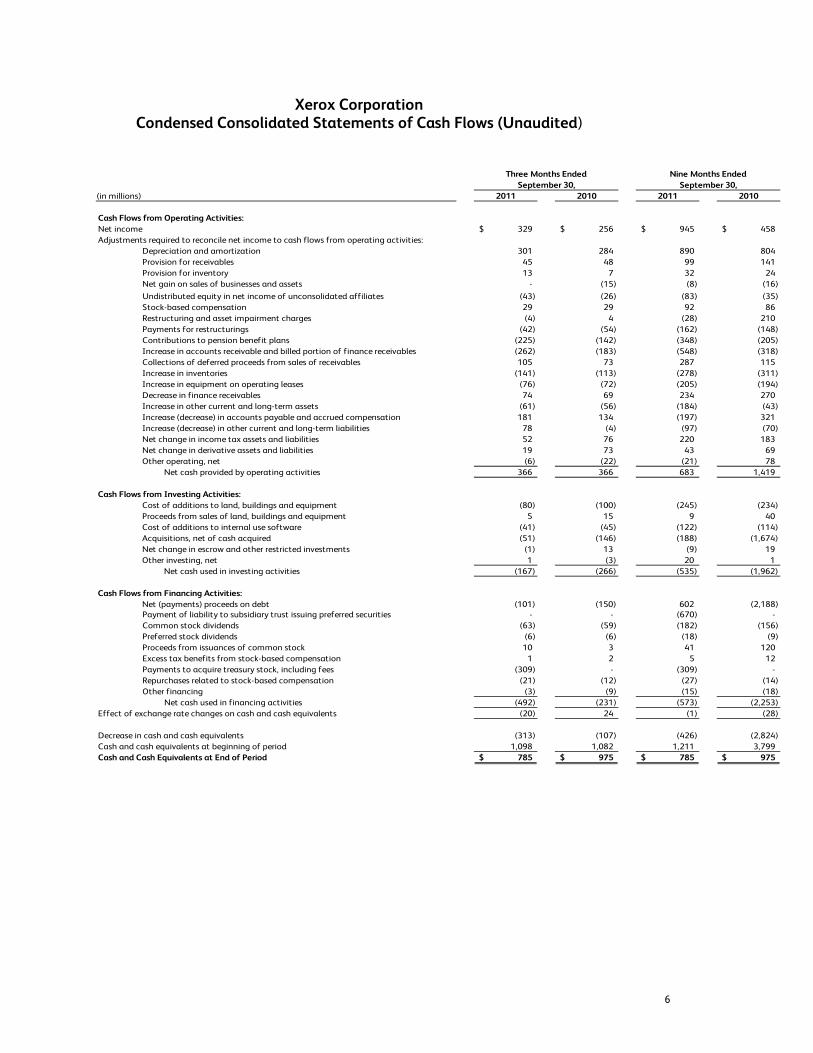
Xerox Corporation Condensed Consolidated Statements of Cash Flows (Unaudited)
Three Months Ended Nine Months EndedSeptember 30, September 30,
(in millions) 2011 2010 2011 2010
Cash Flows from Operating Activities:Net income 329$ 256$ 945$ 458$ Adjustments required to reconcile net income to cash flows from operating activities:
Depreciation and amortization 301 284 890 804 Provision for receivables 45 48 99 141 Provision for inventory 13 7 32 24 Net gain on sales of businesses and assets - (15) (8) (16) Undistributed equity in net income of unconsolidated affiliates (43) (26) (83) (35) Stock-based compensation 29 29 92 86 Restructuring and asset impairment charges (4) 4 (28) 210 Payments for restructurings (42) (54) (162) (148) Contributions to pension benefit plans (225) (142) (348) (205) Increase in accounts receivable and billed portion of finance receivables (262) (183) (548) (318) Collections of deferred proceeds from sales of receivables 105 73 287 115 Increase in inventories (141) (113) (278) (311) Increase in equipment on operating leases (76) (72) (205) (194) Decrease in finance receivables 74 69 234 270 Increase in other current and long-term assets (61) (56) (184) (43) Increase (decrease) in accounts payable and accrued compensation 181 134 (197) 321 Increase (decrease) in other current and long-term liabilities 78 (4) (97) (70) Net change in income tax assets and liabilities 52 76 220 183 Net change in derivative assets and liabilities 19 73 43 69 Other operating, net (6) (22) (21) 78
Net cash provided by operating activities 366 366 683 1,419
Cash Flows from Investing Activities:Cost of additions to land, buildings and equipment (80) (100) (245) (234) Proceeds from sales of land, buildings and equipment 5 15 9 40 Cost of additions to internal use software (41) (45) (122) (114) Acquisitions, net of cash acquired (51) (146) (188) (1,674) Net change in escrow and other restricted investments (1) 13 (9) 19 Other investing, net 1 (3) 20 1
Net cash used in investing activities (167) (266) (535) (1,962)
Cash Flows from Financing Activities:Net (payments) proceeds on debt (101) (150) 602 (2,188) Payment of liability to subsidiary trust issuing preferred securities - - (670) - Common stock dividends (63) (59) (182) (156) Preferred stock dividends (6) (6) (18) (9) Proceeds from issuances of common stock 10 3 41 120 Excess tax benefits from stock-based compensation 1 2 5 12 Payments to acquire treasury stock, including fees (309) - (309) - Repurchases related to stock-based compensation (21) (12) (27) (14) Other financing (3) (9) (15) (18)
Net cash used in financing activities (492) (231) (573) (2,253) Effect of exchange rate changes on cash and cash equivalents (20) 24 (1) (28)
Decrease in cash and cash equivalents (313) (107) (426) (2,824) Cash and cash equivalents at beginning of period 1,098 1,082 1,211 3,799 Cash and Cash Equivalents at End of Period 785$ 975$ 785$ 975$

7
Financial Review Revenues
(in millions) 2011 2010 % Change 2011 2010
Equipment sales 938$ 907$ 3% 17% 17%Annuity revenue(1) 4,645 4,521 3% 83% 83%Total Revenue 5,583$ 5,428$ 3% 100% 100%
Memo: Color(2) 1,668$ 1,527$ 9% 30% 28%
Reconciliation to Condensed Consolidated Statements of Income:Sales 1,738$ 1,700$ Less: Supplies, paper and other sales (800) (793) Equipment Sales 938$ 907$
Service, outsourcing and rentals 3,689$ 3,567$ Add: Finance income 156 161 Add: Supplies, paper and other sales 800 793 Annuity Revenue(1) 4,645$ 4,521$
% of Total RevenueThree Months Ended
September 30,
Third quarter 2011 total revenues increased 3% compared to the third quarter 2010, including a 2-percentage point positive impact from currency. Total revenues included the following: • 3% increase in annuity revenue1, including a 2-percentage point positive impact
from currency. Annuity revenue1 is comprised of the following: o Service, outsourcing and rentals revenue of $3,689 million increased 3%,
including a 2-percentage point positive impact from currency. This was primarily driven by growth in document and business process outsourcing revenue in our Services segment.
o Supplies, paper and other sales of $800 million increased by 1%, including a 2-percentage point positive impact from currency. A 4% increase in supplies revenue was offset by a 6% decline in paper revenue.
• 3% increase in equipment sales revenue, including a 2-percentage point positive impact from currency. This increase was driven by partial recovery of the Japan related supply constraints as well as continued positive performance in mid-range and high-end color installs. Consistent with prior quarters, price declines were in the range of 5%to 10%.
• 9% increase in color revenue2, including a 3-percentage point positive impact from currency, reflects:
o 9% increase in color2 annuity1 revenue, including a 4-percentage point positive impact from currency. The increase was driven by higher color page volumes.

8
o 11% increase in color2 equipment sales revenue, including a 4-percentage point positive impact from currency. Growth of 40% in mid-range install activity assisted in part by recovery of some of the Japan related supply constraints and 3%in high-end install activity was partially offset by a 3% decline in entry install activity.
An analysis of the change in revenue for each business segment is included in the “Segment Review” section.
Costs, Expenses and Other Income Summary of Key Financial Ratios
The following is a summary of key financial ratios used to assess our performance:
2011 2010
Total Gross Margin 32.7% 33.6% (0.9) pts.RD&E as a % of Revenue 3.3% 3.5% 0.2 pts.SAG as a % of Revenue 19.9% 20.9% 1.0 pts.Operating Margin (3) 9.6% 9.2% 0.4 pts.
Pre-Tax income margin 6.6% 6.0% 0.6 pts.
Three Months EndedSeptember 30,
B/(W)
Third quarter 2011 operating margin3 of 9.6% increased 0.4-percentage points as compared to the third quarter 2010. The increase was primarily due to disciplined cost and expense management. Gross Margin Gross margin of 32.7% decreased 0.9-percentage points, as compared to the third quarter 2010. The decrease was driven by the ramping of new services contracts, the line of business mix within the Services segment and the higher mix of Services revenue. Technology gross margin decreased by 0.6-percentage points as compared to the third quarter 2010, due primarily to a lower supplies margin driven by mix within supplies sales. Price erosion was more than offset by the impact of cost productivities and restructuring savings. Services gross margin decreased by 0.9-percentage points as compared to the third quarter 2010, due primarily to the ramping of new services contracts within BPO and ITO as well as the line of business mix within the Services segment.

9
Third quarter 2011 RD&E as a percent of revenue of 3.3% decreased 0.2-percentage points from the third quarter 2010. In addition to lower spending, the decrease was driven by the positive mix impact of the continued growth in Services revenue, which historically has a lower RD&E percent of revenue.
Research, Development and Engineering Expenses (“RD&E”)
RD&E of $183 million in the third quarter 2011 was $6 million lower than the third quarter 2010, reflecting the impact of restructuring and productivity improvements. Innovation is one of our core strengths and we continue to invest at levels that enhance this core strength, particularly in color, software and services. Xerox R&D is strategically coordinated with Fuji Xerox.
SAG as a percent of revenue of 19.9%decreased 1.0-percentage points from the third quarter 2010. In addition to spending reductions including lower compensation, the decrease was driven by positive mix impact from the continued growth in Services revenue, which historically has a lower SAG percent of revenue.
Selling, Administrative and General Expenses (“SAG”)
SAG Expenses of $1,109 million in the third quarter 2011 were $27 million lower than the third quarter 2010. There was a $26 million unfavorable impact from currency for the quarter. SAG expenses reflect the following: • $15 million decrease in selling expenses, reflecting benefits from restructuring,
productivity improvements and a decrease in brand advertising, partially offset by the impact of acquisitions.
• $10 million decrease in general and administrative expenses, reflecting the benefits from restructuring and operational improvements.
• $2 million decrease in bad debt expenses, as improvements in the write-off trends for the U.S. and Canada were partially offset by higher write-offs in Europe. 2011 third quarter bad debt expense continued to remain at less than one percent of receivables.
Restructuring and Asset Impairment Charges During the third quarter 2011, we recorded net restructuring and asset impairment credits of $4 million, primarily resulting from net reversals and changes in estimated reserves from prior period initiatives. During the third quarter 2010, we recorded $4 million of net restructuring and asset impairment charges for actions primarily in North America.
The restructuring reserve balance as of September 30, 2011, for all programs was $126 million, of which approximately $119 million is expected to be spent over the next twelve months.
Acquisition Related Costs Acquisition related costs associated with our acquisition of ACS were $5 million in the third quarter 2010. These costs primarily represent incremental external costs directly related to the integration of ACS and Xerox. Amortization of Intangible Assets During the third quarter 2011, we recorded $87 million of expense related to the amortization of intangible assets, which is $2 million higher than third quarter 2010.

10
Worldwide Employment Worldwide employment of 134,200 at September 30, 2011 decreased approximately 2,300 from year-end 2010, primarily due to restructuring related actions more than offsetting the impact of acquisitions. Other Expenses, Net
(in millions) 2011 2010
Non-financing interest expense 60$ 87$ Interest income (5) (4) Gains on sales of businesses and assets - (15) Currency losses, net 10 - Litigation matters 3 2 All other expenses, net 18 6
Total Other Expenses, Net 86$ 76$
Three Months EndedSeptember 30,
Non-Financing Interest Expense Third quarter 2011 non-financing interest expense of $60 million was $27 million lower than third quarter 2010 primarily reflecting a lower average debt balance due to the redemption of the $550 million 2013 Senior Notes in October 2010 and other repayments of debt, as well as the benefit of lower borrowing costs achieved as a result of utilizing the commercial paper program. Gains on Sales of Businesses and Assets Third quarter 2010 gains on sales of businesses and assets of $15 million was related primarily to the sale of a facility in Latin America. Currency Losses, net Third quarter 2011 currency losses of $10 million were primarily due to the significant movement in exchange rates during the quarter among the U.S. Dollar, Euro, Yen and several developing market currencies. Income Taxes Third quarter 2011 effective tax rate was 22.1%. On an adjusted basis3, third quarter 2011 tax rate was 25.1%, which was lower than the U.S. statutory tax rate primarily due to geographical mix of profits as well as a higher foreign tax credit benefit as a result of our decision to repatriate current year income from certain non U.S. subsidiaries. Third quarter 2010 effective tax rate was 29.9%. On an adjusted basis3, third quarter 2010 tax rate was 31.8%, which was lower than the U.S. statutory tax rate primarily due to the net tax benefits from the geographical mix of income before taxes and the related tax rates in these jurisdictions as well as the settlement and remeasurement of certain previously unrecognized

11
tax benefits. These benefits were partially offset by the incremental U.S. tax cost on foreign income. Xerox operations are widely dispersed. The statutory tax rate in most non U.S. jurisdictions is lower than the combined U.S. and state tax rate. The amount of income subject to these lower foreign rates relative to the amount of U.S. income will impact our effective tax rate. However, no one country outside of the U.S. is a significant factor to our overall effective tax rate. Certain foreign income is subject to U.S. tax net of any available foreign tax credits. Our full year estimated effective tax rate includes a benefit of approximately 9 percentage points from these non U.S. operations which is comparable to 2010. Our effective tax rate is based on nonrecurring events as well as recurring factors, including the taxation of foreign income. In addition, our effective tax rate will change based on discrete or other nonrecurring events that may not be predictable. We anticipate that our effective tax rate for fourth quarter 2011 will be approximately 29%, excluding the effects of intangibles amortization and discrete events. Equity in Net Income of Unconsolidated Affiliates Equity in net income of unconsolidated affiliates, which primarily reflects our 25% share of Fuji Xerox net income, was $43 million, an increase of $17 million compared to third quarter 2010. Third quarter 2011 equity income includes charges of $1 million related to our share of Fuji Xerox after-tax restructuring compared to $6 million of charges for the third quarter 2010.
Net Income Third quarter 2011 net income attributable to Xerox was $320 million, or $0.22 per diluted share. On an adjusted basis3, net income attributable to Xerox was $374 million, or $0.26 per diluted share. Third quarter 2011 adjustments to net income include amortization of intangible assets. Third quarter 2010 net income attributable to Xerox was $250 million, or $0.17 per diluted share. On an adjusted basis3, net income attributable to Xerox was $314 million, or $0.22 per diluted share. The Net Income and EPS reconciliation table in the Non-GAAP Financial Measures section contains the third quarter adjustments to net income. The calculations of basic and diluted earnings per share are included as Appendix I. See Non-GAAP financial measures for calculation of adjusted EPS.

12
Segment Review
(in millions)Total
Revenues% of Total Revenue
Segment Profit (Loss)
Segment Margin
2011Technology 2,500$ 45% 258$ 10.3% Services 2,717 49% 323 11.9% Other 366 6% (86) (23.5%)Total 5,583$ 100% 495$ 8.9%
2010Technology 2,466$ 45% 247$ 10.0% Services 2,554 47% 286 11.2% Other 408 8% (79) (19.4%)Total 5,428$ 100% 454$ 8.4%
Three Months Ended September 30,
Refer to Appendix II for the reconciliation of Segment Profit to Pre-tax Income. Technology Our Technology segment includes the sale of products and supplies, as well as the associated technical service and financing of those products. Revenue
(in millions) 2011 2010 Change
Equipment sales 798$ 805$ (1%)Annuity revenue(1) 1,702 1,661 2%Total Revenue 2,500$ 2,466$ 1%
Three Months EndedSeptember 30,
Third quarter 2011 Technology revenue of $2,500 million increased 1% from the third quarter 2010, including a 2-percentage point positive impact from currency. Revenue results included the following: • 1% decrease in equipment sales revenue with a 2-percentage point positive
impact from currency. This decrease was driven by continued positive performance in mid-range and high-end color installs more than offset by a decline in entry installs. Consistent with prior quarters, price declines were in the range of 5%to 10%. Technology revenue excludes sales in our document outsourcing offerings. As noted in the Revenues section above, combined with our

13
Services-related equipment sales revenue, total company equipment sales increased 3%from third quarter 2010.
• 2% increase in annuity revenue1 with a 3-percentage point positive impact from currency. An increase in supplies revenue was offset by a decline in pages, while revenue per page continued to increase.
• Technology revenue mix was 22% entry, 58% mid-range and 20% high-end. Segment Margin Third quarter 2011 Technology segment margin of 10.3% increased 0.3 percentage points from third quarter 2010. Lower cost and expense from restructuring savings in addition to an increase in equity in net income from unconsolidated affiliates more than offset the gross margin decline. Installs Entry • 11% decrease in total black-and-white and color multifunction devices and color
printers driven by a combination of continued higher backlog and timing of product introductions.
Mid-Range • 40% increase in installs of mid-range color devices partially driven by recovery of
some of the Japan related constraints. Growth was strong in all geographies and was driven by demand for the Xerox Color 550/560 and WorkCentre® 7545/7556. Growth in these products has enabled market share gains in the fastest growing segment of the office color market.
• 6% decrease in installs of mid-range black-and-white devices driven by declines in Europe.
High-End • 3% increase in installs of high-end color systems driven by continued growth of
the Xerox Color 800 and 1000 and the iGen, which continues to enable market share growth in the fastest growing segment of the Production market. This growth was partially offset by a decline in the Entry Production Color products. Two new products were recently announced that will improve our future competitiveness in the Entry Production Color product category.
• 8% decrease in installs of high-end black-and-white systems. Note: Install activity percentages include installations for Document Outsourcing and the Xerox-branded products shipped to GIS. “Entry”, “Mid-Range” and “High-End” are defined in Appendix II. Services Our Services segment comprises three service offerings: Document Outsourcing (“DO”), Business Process Outsourcing (“BPO”) and Information Technology Outsourcing (“ITO”). Revenue Third quarter 2011 Services total revenue of $2,717 million increased 6%, including a 1-percentage point positive impact from currency.

14
• DO revenue increased 12%, including a 3-percentage point positive impact from currency, and represented 33% of total Services revenue. Growth was driven primarily by new signings . DO revenue includes revenues from our partner print services offerings.
• BPO delivered growth of 6% and represented 55% of total Services revenue. Consistent with our strategy to expand our services offerings through tuck-in acquisitions, BPO growth was driven by recent acquisitions. In addition, the human resource services, customer care, transportation solutions and healthcare payer services businesses contributed to growth.
• ITO revenue was flat in comparison to third quarter 2010 and represented 12% of total Services revenue.
Segment Margin Third quarter 2011 Services segment margin of 11.9% increased 0.7-percentage points from third quarter 2010. Lower cost and expense from productivity and restructuring savings more than offset the gross margin decline. Metrics Pipeline Our total services sales pipeline, including synergy opportunities, grew 5% over the third quarter 2010. This sales pipeline includes the Total Contract Value (“TCV”) of new business opportunities that potentially could be contracted within the next six months and excludes business opportunities with estimated annual recurring revenue in excess of $100 million. Signings Signings are defined as estimated future revenues from contracts signed during the period, including renewals of existing contracts. Services signings were an estimated $3.9 billion in TCV for the quarter. • BPO signings of $2.3 billion TCV. • DO signings of $1.0 billion TCV. • ITO signings of $0.6 billion TCV. Signings increased 33% from the third quarter 2010, driven by strong growth across all three service offerings. Signings decreased 9% on a trailing twelve month basis as compared to the comparable prior year period driven by the cyclicality of large deals. Signings continued to trend positively, increasing sequentially for the second straight quarter. Note: TCV is estimated total revenue for future contracts for pipeline or signed contracts for signings as applicable. Other Revenue Third quarter 2011 Other revenue of $366 million decreased 10%, including a 3-percentage point positive impact from currency due to a decline in paper sales, wide format systems and other supplies partially offset by an increase in network integration and electronic presentation systems. Paper comprised approximately 60% of the third quarter 2011 Other segment revenue.
15
Segment Margin Third quarter 2011 Other loss of $86 million increased $7 million from third quarter 2010, primarily driven by the revenue declines referenced above and partially offset by a decline in SAG expense. Notes (1) Annuity revenue = Service, outsourcing and rentals + Supplies, paper and other sales +
Finance income.
(2)Represents revenues from color devices and is a subset of total revenues and excludes Global Imaging Systems (“GIS”) revenues.
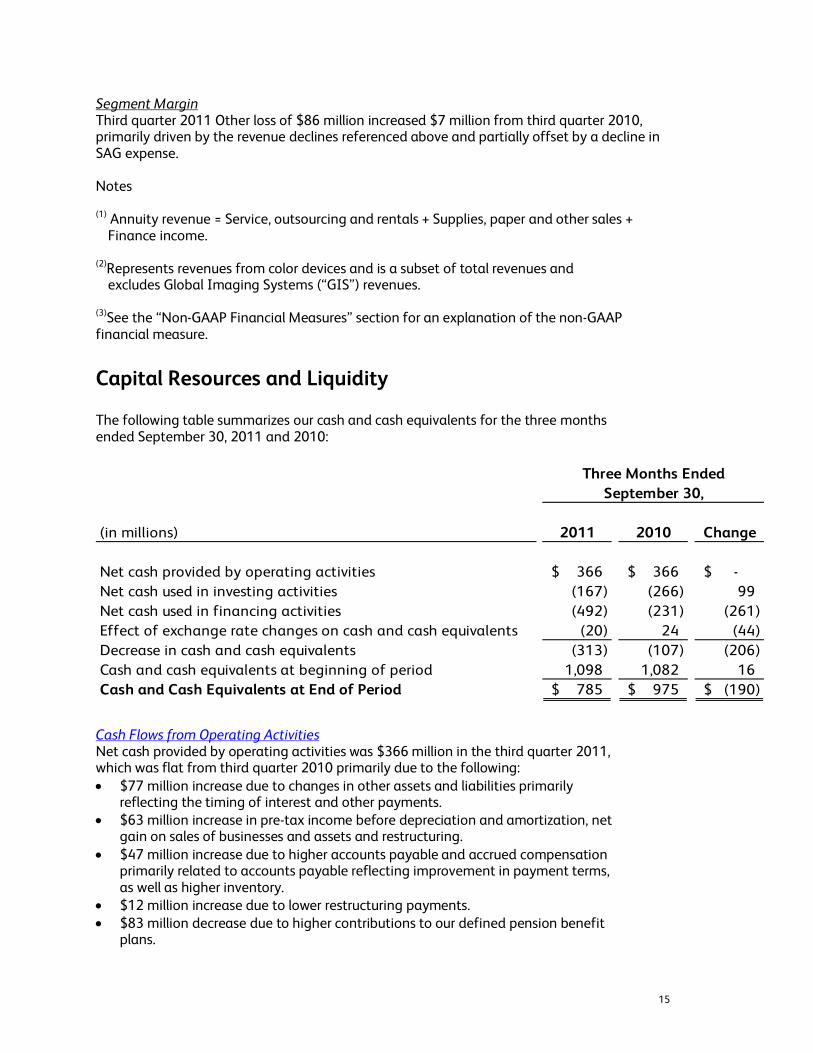
(3)See the “Non-GAAP Financial Measures” section for an explanation of the non-GAAP financial measure. Capital Resources and Liquidity The following table summarizes our cash and cash equivalents for the three months ended September 30, 2011 and 2010:
(in millions) 2011 2010 Change
Net cash provided by operating activities 366$ 366$ -$ Net cash used in investing activities (167) (266) 99 Net cash used in financing activities (492) (231) (261)
(20) 24 (44) Decrease in cash and cash equivalents (313) (107) (206) Cash and cash equivalents at beginning of period 1,098 1,082 16 Cash and Cash Equivalents at End of Period 785$ 975$ (190)$
September 30,
Effect of exchange rate changes on cash and cash equivalents
Three Months Ended
Cash Flows from Operating Activities Net cash provided by operating activities was $366 million in the third quarter 2011, which was flat from third quarter 2010 primarily due to the following: • $77 million increase due to changes in other assets and liabilities primarily
reflecting the timing of interest and other payments. • $63 million increase in pre-tax income before depreciation and amortization, net
gain on sales of businesses and assets and restructuring. • $47 million increase due to higher accounts payable and accrued compensation
primarily related to accounts payable reflecting improvement in payment terms, as well as higher inventory.
• $12 million increase due to lower restructuring payments. • $83 million decrease due to higher contributions to our defined pension benefit
plans.

16
• $54 million decrease in derivatives primarily due to the absence of proceeds from the early termination of certain interest rate swaps.
• $47 million decrease due to a lower benefit from accounts receivable sales partially offset by improved collections.
• $28 million decrease due to higher inventory levels reflecting anticipated fourth quarter 2011 activity.
In September 2011, we also elected to make a US pension contribution of 16.6 million shares of our common stock, with an aggregate value of approximately $130 million, to meet our planned level of funding for 2011.
Cash Flows from Investing Activities Net cash used in investing activities was $167 million in the third quarter 2011. The $99 million decrease in the use of cash from third quarter 2010 was primarily due to the following: • $95 million decrease primarily due to the 2011 acquisition of ESM for $43 million
as compared to the acquisitions of ExcellerateHRO, LLP for $125 million and Georgia Duplication Products for $21 million in 2010.
• $24 million decrease due to lower capital expenditures (including internal use software).
• $10 million increase due to lower cash proceeds from asset sales. Cash Flows from Financing Activities Net cash used in financing activities was $492 million in the third quarter 2011. The $261 million increase in the use of cash from third quarter 2010 was primarily due to the following: • $309 million resulting from the resumption of our share repurchase program. • $49 million decrease from net debt activity. Third quarter 2011 reflects the
repayment of $750 million of Senior Notes and net payments of $2 million on other debt offset by net proceeds of $651 million on Commercial Paper. Third quarter 2010 reflects net payments of $100 million on the Credit Facility and $50 million on other debt.
Customer Financing Activities The following represents our Total finance assets, net associated with our lease and finance operations:
September 30 December 31,(in millions) 2011 2010
Total Finance receivables, net (1) 6,355$ 6,620$ Equipment on operating leases, net 505 530Total Finance Assets, net 6,860$ 7,150$
The decrease of $290 million in Total finance assets, net includes favorable currency of $42 million. (1) Includes (i) billed portion of finance receivables, net, (ii) finance receivables, net and (iii)
finance receivables due after one year, net as included in our Condensed Consolidated Balance Sheets.

17
The following summarizes our debt: September 30, December 31,
(in millions) 2011 2010
Principal debt balance(1) 8,997$ 8,380$ Net unamortized discount (7) (1) Fair value adjustments 205 228
Total Debt 9,195 8,607 Less: current maturities and short-term debt (2,096) (1,370)
Total Long-Term Debt 7,099$ 7,237$ _____________(1) Includes Commercial Paper of $651 million and $300 million as of September 30, 2011 and December 31, 2010, respectively. September 30, 2011 balance also includes $650 million in debt resulting from the refinancing of the Xerox Capital Trust I preferred securities. Our lease contracts permit customers to pay for equipment over time rather than at the date of installation; therefore, we maintain a certain level of debt (that we refer to as financing debt) to support our investment in these lease contracts, which are reflected in Total finance assets, net. For this financing aspect of our business, we maintain an assumed 7:1 leverage ratio of debt to equity as compared to our finance assets. Based on this leverage, the following represents the breakdown of total debt between financing debt and core debt:
September 30, December 31,(in millions) 2011 2010
Financing Debt(1) 6,003$ 6,256$ Core Debt 3,192 2,351 Total Debt 9,195$ 8,607$
(1) Financing Debt includes $5,561 million and $5,793 million as of September 30, 2011 and December 31, 2010, respectively, of debt associated with Total Finance receivables, net and is the basis for our calculation of "Equipment financing interest" expense. The remainder of the financing debt is associated with equipment on operating leases.
Sales of Accounts Receivables We have facilities in the U.S., Canada and several countries in Europe that enable us to sell to third-parties, on an on-going basis, certain accounts receivable without recourse. The accounts receivables sold are generally short-term trade receivables with payment due dates of less than 60 days. Accounts receivable sales were as follows:
(in millions) 2011 2010
Accounts receivable sales 754$ 574$ Deferred proceeds 93 97 Fees associated with sales 5 3 Estimated decrease to operating cash flows (1) (35) (11)
Ended September 30,Three Months
(1) Represents the difference between current and prior period receivable sales adjusted for the
effects of the deferred proceeds, collections prior to the end of the quarter and currency.

18
Forward-Looking Statements This release contains "forward-looking statements" as defined in the Private Securities Litigation Reform Act of 1995. The words “anticipate,” “believe,” “estimate,” “expect,” “intend,” “will,” “should” and similar expressions, as they relate to us, are intended to identify forward-looking statements. These statements reflect management’s current beliefs, assumptions and expectations and are subject to a number of factors that may cause actual results to differ materially. These factors include but are not limited to: changes in economic conditions, political conditions, trade protection measures, licensing requirements, environmental regulations and tax matters in the United States and in the foreign countries in which we do business; changes in foreign currency exchange rates; the outcome of litigation and regulatory proceedings to which we may be a party; actions of competitors; our ability to expand equipment placements and to drive the expanded use of color in printing and copying; development of new products and services; interest rates, cost of borrowing and access to credit markets; our ability to protect our intellectual property rights; our ability to obtain adequate pricing for our products and services and to maintain and improve cost efficiency of operations, including savings from restructuring actions; the risk that unexpected costs will be incurred; reliance on third parties for manufacturing of products and provision of services; the risk that we will not realize all of the anticipated benefits from the acquisition of Affiliated Computer Services, Inc.; our ability to recover capital investments; the risk that subcontractors, software vendors and utility and network providers will not perform in a timely, quality manner; the risk that multi-year contracts with governmental entities could be terminated prior to the end of the contract term; the risk that individually identifiable information of customers, clients and employees could be inadvertently disclosed or disclosed as a result of a breach of our security; and other factors that are set forth in the “Risk Factors” section, the “Legal Proceedings” section, the “Management’s Discussion and Analysis of Financial Condition and Results of Operations” section and other sections of our Quarterly Reports on Form 10-Q for the quarters ended March 31, 2011 and June 30, 2011 and our 2010 Annual Report on Form 10-K filed with the Securities and Exchange Commission. The Company assumes no obligation to update any forward-looking statements as a result of new information or future events or developments, except as required by law.
Non-GAAP Financial Measures We have reported our financial results in accordance with generally accepted accounting principles (“GAAP”). In addition, we have discussed the non-GAAP measures described below. A reconciliation of these non-GAAP financial measures to the most directly comparable financial measures calculated and presented in accordance with GAAP are set forth below as well as in the 2011 third quarter presentation slides available at www.xerox.com/investor. These non-GAAP financial measures should be viewed in addition to, and not as a substitute for, the Company’s reported results prepared in accordance with GAAP. Adjusted Earnings Measures To better understand the trends in our business and the impact of the ACS acquisition, we believe it is necessary to adjust the following amounts determined in

19
accordance with GAAP to exclude the effects of the certain items as well as their related income tax effects. Note: In 2011, adjustments are expected to be limited to the amortization of intangible assets and other discrete items. • Net income and Earnings per share (“EPS”) • Effective tax rate • Operating income and margin
The above have been adjusted for the following items: • Restructuring and asset impairment charges (including those incurred by Fuji
Xerox) (2010 only): Restructuring and asset impairment charges consist of costs primarily related to severance and benefits for employees terminated pursuant to formal restructuring and workforce reduction plans. We exclude these charges because we believe that these historical costs do not reflect expected future operating expenses and do not contribute to a meaningful evaluation of our current or past operating performance. In addition, such charges are inconsistent in amount and frequency. Such charges are expected to yield future benefits and savings with respect to our operational performance.
• Acquisition related costs (2010 only): We incurred significant expenses in connection with our acquisition of ACS which we generally would not have otherwise incurred in the periods presented as a part of our continuing operations. Acquisition related costs include transaction and integration costs, which represent external incremental costs directly related to completing the acquisition and the integration of ACS and Xerox. We believe it is useful for investors to understand the effects of these costs on our total operating expenses.
• Amortization of intangible assets: The amortization of intangible assets is driven by our acquisition activity which can vary in size, nature and timing as compared to other companies within our industry and from period to period. Accordingly, due to the incomparability of acquisition activity among companies and from period to period, we believe exclusion of the amortization associated with intangible assets acquired through our acquisitions allows investors to better compare and understand our results. The use of intangible assets contributed to our revenues earned during the periods presented and will contribute to our future period revenues as well. Amortization of intangible assets will recur in future periods.
In addition to the above excluded items, operating income and margin also exclude other expenses, net. Other expenses, net is primarily composed of non-financing interest expense.
Constant Currency To better understand trends in our business, we believe that it is helpful to adjust revenue to exclude the impact of changes in the translation of foreign currencies into U.S. dollars. We refer to this adjusted revenue as “constant currency.” Currencies for developing market countries (Latin America, Brazil, Middle East, India, Eurasia and Central-Eastern Europe) that we operate in are reported at actual exchange rates for both actual and constant revenue growth rates because (1) these countries historically have had volatile currency and inflationary environments and (2) our subsidiaries in these countries have historically taken pricing actions to mitigate the impact of inflation and devaluation. Management believes the

20
constant currency measure provides investors an additional perspective on revenue trends. Currency impact can be determined as the difference between actual growth rates and constant currency growth rates. Management believes that these non-GAAP financial measures provide an additional means of analyzing the current periods’ results against the corresponding prior periods’ results. However, these non-GAAP financial measures should be viewed in addition to, and not as a substitute for, the Company’s reported results prepared in accordance with GAAP. Our non-GAAP financial measures are not meant to be considered in isolation or as a substitute for comparable GAAP measures and should be read only in conjunction with our consolidated financial statements prepared in accordance with GAAP. Our management regularly uses our supplemental non-GAAP financial measures internally to understand, manage and evaluate our business and make operating decisions. These non-GAAP measures are among the primary factors management uses in planning for and forecasting future periods. Compensation of our executives is based in part on the performance of our business based on these non-GAAP measures. A reconciliation of these non-GAAP financial measures and the most directly comparable measures calculated and presented in accordance with GAAP are set forth on the following tables: Net Income and EPS reconciliation:
(in millions; except per share amounts) Net Income EPS Net Income EPSReported 320$ 0.22$ 250$ 0.17$
Adjustments:Amortization of intangible assets 54 0.04 53 0.04 Xerox and Fuji Xerox restructuring charges 8 0.01 ACS acquisition-related costs 3 -
54 0.04 64 0.05 Adjusted 374$ 0.26$ 314$ 0.22$
Weighted average shares for adjusted EPS 1,453 1,444__________(1) For 2011, we are only adjusting for Amortization of intangible assets.
Three Months EndedSeptember 30, 2011(1)
Three Months EndedSeptember 30, 2010
Average shares for the calculation of adjusted EPS for the third quarter 2011 were 1,453 million and include 27 million shares associated with the Series A convertible preferred stock and therefore the quarterly dividend of $6 million is excluded. Third quarter 2010 shares of 1,444 million also include the 27 million shares associated with the Series A convertible preferred stock and the quarterly dividend of $6 million was excluded. We evaluate the dilutive effect of the Series A convertible preferred stock on an “if-converted” basis.

21
2011 Guidance:
Q4 2011 FY 2011
GAAP EPS $0.28 - $0.31 $0.92 - $0.95
Adjustments:Amortization of intangible assets 0.04 0.15Loss on early extinguishment of liability - 0.01
0.04 0.16
Adjusted EPS $0.32 - $0.35 $1.08 - $1.11
Estimated weighted average shares for adjusted EPS 1,425 1,450 Estimated fully diluted shares at 12/31/2011 1,405
Earnings Per Share
Effective Tax reconciliation:
Three Months Ended Three Months Ended
(in millions)Pre-Tax Income
Income Tax
ExpenseEffective Tax Rate
Pre-Tax Income
Income Tax
ExpenseEffective Tax Rate
Reported 367$ 81$ 22.1% 328$ 98$ 29.9%
Adjustments:Amortization of intangible assets 87 33 85 32 Xerox restructuring charge 4 2 ACS acquisition-related costs 5 2 Adjusted 454$ 114$ 25.1% 422$ 134$ 31.8%
_______________(1) For 2011, we are only adjusting for Amortization of intangible assets.
September 30, 2011(1) September 30, 2010

22
Operating Income / Margin reconciliation
(in millions) Profit Revenue Margin Profit Revenue MarginReported pre-tax income 367$ 5,583$ 6.6% 328$ 5,428$ 6.0%Adjustments:Xerox restructuring (credit) charge (4) 4 ACS acquisition-related costs - 5 Amortization of intangible assets 87 85 Other expenses, net 86 76 Adjusted Operating 536$ 5,583$ 9.6% 498$ 5,428$ 9.2%Fuji Xerox restructuring charge 1 6 Equity in net income of unconsolidated affiliates 43 26 Other expenses, net* (85) (76) Segment Profit/Revenue 495$ 5,583$ 8.9% 454$ 5,428$ 8.4%_______________* Includes rounding adjustments.
Three Months Ended Three Months EndedSeptember 30, 2011 September 30, 2010

23
APPENDIX I
Xerox Corporation Earnings per Common Share
(in millions, except per share data. Shares in thousands)
2011 2010 2011 2010
Basic Earnings per Share:
Net income attributable to Xerox 320$ 250$ 920$ 435$ Accrued Dividends on preferred stock (6) (6) (18) (15)
Adjusted net income available to common shareholders 314$ 244$ 902$ 420$
Weighted average common shares outstanding 1,396,176 1,387,110 1,398,855 1,301,950
Basic Earnings per Share 0.23$ 0.18$ 0.65$ 0.32$
Diluted Earnings per Share:
Net income attributable to Xerox 320$ 250$ 920$ 435$ Accrued Dividends on preferred stock (6) (6) (18) (15) Interest on Convertible Securities, net - - 1 -
Adjusted net income available to common shareholders 314$ 244$ 903$ 420$
Weighted average common shares outstanding 1,396,176 1,387,110 1,398,855 1,301,950 Common shares issuable with respect to: Stock options 7,952 11,691 10,932 11,795 Restricted stock and performance shares 19,578 15,912 19,906 15,036 Convertible preferred stock - - - - Convertible securities 1,992 1,992 1,992 - Adjusted weighted average common shares outstanding 1,425,698 1,416,705 1,431,685 1,328,781
Diluted Earnings per Share 0.22$ 0.17$ 0.63$ 0.32$
The following securities were not included in the computation of diluted earnings per share because to do so would have been anti-dilutive:Stock options 56,507 70,747 53,527 70,643 Restricted stock and performance shares 23,692 24,147 23,364 25,022 Convertible preferred stock 26,966 26,966 26,966 26,966 Convertible Securities - - - 1,992
107,165 121,860 103,857 124,623
Dividends per Common Share 0.0425$ 0.0425$ 0.1275$ 0.1275$
September 30, September 30,Three Months Ended Nine Months Ended

24
APPENDIX II
Xerox Corporation Reconciliation of Segment Operating Profit to Pre-Tax Income
(in millions) 2011 2010Segment Profit 495$ 454$ Reconciling items:
Restructuring and asset impairment charges 4 (4) Restructuring charges of Fuji Xerox (1) (6) Acquisition-related costs - (5) Amortization of intangible assets (87) (85) Equity in net income of unconsolidated affiliates (43) (26) Other (1) -
Pre-Tax Income 367$ 328$
Three Months EndedSeptember 30,
Our reportable segments are aligned to how we manage the business and view the markets we serve. Our reportable segments are Technology, Services and Other. Technology: The Technology segment is centered around strategic product groups,
which share common technology, manufacturing and product platforms. This segment includes the sale of document systems and supplies, provision of technical service and financing of products. Our products range from:
“Entry”, which includes A4 devices and desktop printers. “Mid-Range”, which includes A3 devices that generally serve
workgroup environments in mid to large enterprises. This includes products that fall into the market categories, Color 41+ppm <$100K and Light Production 91+ppm <$100K.
“High-End”, which includes production printing and publishing systems that generally serve the graphic communications marketplace and large enterprises.
Services: The Services segment comprises three service offerings:
Document Outsourcing, which includes Managed Print Services and revenues from our partner print services offerings.
Business Process Outsourcing, which includes Xerox’s historic Business Process Outsourcing services.
Information Technology Outsourcing.
Other: The Other segment includes Xerox Supplies Business Group (“XSBG”) (predominantly paper), Wide Format Systems, licensing revenue, GIS network integration solutions and electronic presentation systems, and non-allocated corporate items.