newbits d2.1 overview of its initiatives in eu and …newbits-project.eu/deliverables/newbits_d2.1...
TRANSCRIPT

This project has received funding from the European Union's Horizon 2020 research and innovation programme under the European Union's Horizon 2020 research and innovation programme under grant agreement No 723974
Project Acronym: NEWBITS
Project Title: New business models for ITS
Project Number: 723974
Topic: MG.6.3-2016
Type of Action: CSA
D2.1 Overview of ITS initiatives in the EU and US
(Version 1.0, 14/03/2017)

D2.1 Overview of ITS initiatives in the EU and US
© NEWBITS consortium www.newbits-project.eu Page 2 of 211
Deliverable: D2.1 Overview of ITS initiatives in the EU and US
Work Package: WP2: Mapping C-ITS context
Due Date: 28/02/2017
Submission Date: 14/03/2017
Start Date of Project: 01/10/2016
Duration of Project: 30 Months
Organisation Responsible of Deliverable:
CE Delft / Ortelio Ltd
Version: 1.0
Status: Final
Author name(s): Peter Scholten, Xavier Leal, Arno Schroten, Olatunde Baruwa
Reviewer(s): Eleni Anoyrkati, Riccardo Enei, Leonardo Domenico, Ivan Zaldivar
Nature: R – Report P – Prototype
D – Demonstrator O - Other Dissemination level: PU - Public
CO - Confidential, only for members of the consortium (including the Commission)
RE - Restricted to a group specified by the consortium (including the Commission Services)

D2.1 Overview of ITS initiatives in the EU and US
© NEWBITS consortium www.newbits-project.eu Page 3 of 211
Revision history
Version Date Modified by Comments
0.1 14/10/2016 Consortium representatives Approval of scope on C-ITS and basic framework at Kick-off Meeting
0.2 21/11/2016 Mr. Arno Schroten Draft template reviewed internally
0.3 02/12/2016 Mr. Arno Schroten Data collection
0.4 19/12/2016 Mr. Arno Schroten Inclusion of content
0.5 11/01/2017 Mr. Arno Schroten Inclusion of content
0.6 28/01/2017 Mr. Arno Schroten Intermediate version edited for partner revision
0.7 05/02/2017 Mr. Xavier Leal, Dr. Olatunde Baruwa, Mr. Maurizio Tomassini, Ms Eleni Anoyrkati, Dr. Alexeis Garcia, Mr. Ivan Zaldivar, Dr. Kristin Kiesow
Input provision on intermediate version
0.8 09/02/2017 Mr. Arno Schroten Integration of input, structure adjustment.
0.9 15/02/2017 Mr. Xavier Leal Deliverable structure modification. Methodological redefinition
0.10 20/02/2017 Mr. Xavier Leal, Dr. Olatunde Baruwa, Mr. Peter Scholten
Inclusion of content
0.11 03/03/2017 Mr. Xavier Leal, Dr. Olatunde Baruwa, Mr. Peter Scholten
Inclusion of content
0.12 09/03/2017 Ms. Eleni Anoyrkati, Mr. Ivan Zaldivar, Mr. Riccardo Enei, Dr. Kristin Kiesow, Mr. Leonardo Domanico, Mr. Maurizio Tomassini
Revision, inclusion of content
0.13 13/03/2017 Mr. Xavier Leal, Dr. Olatunde Baruwa, Mr. Peter Scholten
Inclusion of content, validation

D2.1 Overview of ITS initiatives in the EU and US
© NEWBITS consortium www.newbits-project.eu Page 4 of 211
0.14 14/03/2017 Mr. Xavier Leal, Dr. Olatunde Baruwa
Edition
1.0 14/03/2017 Mr. Xavier Leal Final revision, submission

D2.1 Overview of ITS initiatives in the EU and US
© NEWBITS consortium www.newbits-project.eu Page 5 of 211
Table of Contents Table of Contents ..................................................................................................................... 5
List of Figures ........................................................................................................................... 6
List of Tables ............................................................................................................................ 7
Abbreviations ............................................................................................................................ 8
Abstract .................................................................................................................................. 11
0. Executive summary ......................................................................................................... 12
1. Introduction ..................................................................................................................... 14
1.1 NEWBITS project .................................................................................................... 14
1.2 Description of WP2 ................................................................................................. 15
1.3 Deliverable 2.1 Objectives and methodology in a nutshell ..................................... 17
1.4 Structure of the report ............................................................................................. 18
2. Definitions and Methodological approach ....................................................................... 20
2.1 Definition of Intelligent Transport Systems ............................................................. 20
2.2 Definition of Cooperative Intelligent Transport Systems ......................................... 24
2.3 Macro and Meso levels definition ........................................................................... 25
2.4 Methodological approach ........................................................................................ 27
2.5 Stages and steps in NEWBITS approach ............................................................... 28
2.5.1 Step 1. Data identification (#1) ........................................................................... 29
2.5.2 Step 2. Defining the categorization framework (conceptualization #1) ............... 30
2.5.3 Step 3. Data identification (#2: Iteration to capture data at service level) ........... 30
2.5.4 Step 4. Validating the categorization method (conceptualization #2) ................. 31
2.5.5 Step 5. Codification of the data ........................................................................... 31
2.5.6 Overview of steps, processes and tools ............................................................. 31
2.6 Boundaries of D2.1 approach ................................................................................. 33
3. Data Identification and definition of the categorization framework .................................. 39
3.1 Step 1. Data identification (#1) ............................................................................... 39
3.1.1 Internal discussion amongst partners about the approach to the data ............... 40
3.1.2 Desk research: acquiring of basic information of initiatives ................................ 41
3.1.3 Defining interviews and implementing ................................................................ 48
3.2 Step 2. Defining the categorization method (conceptualization #1) ........................ 51
3.2.1 Literature review of categorization approach and assessment ........................... 51
3.2.2 Systematic approach for categorisation in NEWBITS ........................................ 56
3.2.3 Literature review and establishment of long list criteria ...................................... 57
3.3 Step 3. Data identification (#2: Iteration to capture data at service level) ............... 60

D2.1 Overview of ITS initiatives in the EU and US
© NEWBITS consortium www.newbits-project.eu Page 6 of 211
3.3.1 Desk research: Identification of services and collection of data. ........................ 61
4. Codification and Mapping of ITS services ....................................................................... 68
4.1 Validation of ITS Market Categorisation ................................................................. 68
4.1.1 Construct decision hierarchy .............................................................................. 69
4.1.2 Construct the pairwise comparison matrix .......................................................... 70
4.1.3 Internal voting ..................................................................................................... 71
4.1.4 Synthesis of judgements ..................................................................................... 72
4.1.5 Develop priority ranking and determine the best categorisation ......................... 75
4.2 Characteristics of Selected Services ...................................................................... 76
4.3 Mapping .................................................................................................................. 78
4.3.1 Identification of Subcategories for Service Differentiation .................................. 79
4.3.2 Tabular One-to-One Mapping ............................................................................. 80
4.3.3 Three-dimensional Mapping and Classification .................................................. 81
4.3.4 Extended Visualisation of Mappings ................................................................... 83
5. Conclusions ..................................................................................................................... 88
References ............................................................................................................................. 91
Appendices ............................................................................................................................. 95
Appendix 1 Long list of initiatives ........................................................................................ 95
Appendix 2 Interview Format ............................................................................................ 103
Appendix 3 Long list of services ....................................................................................... 106
Appendix 4 Synthesis of Judgement process ................................................................... 111
Appendix 5 Service Fiches ............................................................................................... 113
Appendix 6 Mapping of services ....................................................................................... 207
Appendix 7 Tree maps ...................................................................................................... 210
List of Figures Figure 1 Overview of NEWBITS project key phases .............................................................. 14Figure 2 Diagram for key interrelations in NEWBITS ............................................................. 15Figure 3 Deliverable 2.1 Objective Tree ................................................................................. 27Figure 4 D2.1 key methodological phases ............................................................................. 28Figure 5 Mobility as a Service Framework ............................................................................. 35Figure 6 Relation between connected, cooperative and automated services ........................ 36Figure 8 Difference between connected and cooperative transport ....................................... 36Figure 8 Four Automotive Electronics and Communications technology communities .......... 37Figure 9: ITS technologies and technology functions. Source: T-TRANS project .................. 52Figure 10: Overview of ITS (sub) areas in the literature. Source: T-TRANS project .............. 54Figure 11: Overview Analytic Hierarchy Process, AHP (Saaty 1980) .................................... 69Figure 12: AHP schematic deployment for selection of categorisation .................................. 70Figure 13: Pairwise comparison of categorisation with respect to each criterion ................... 71

D2.1 Overview of ITS initiatives in the EU and US
© NEWBITS consortium www.newbits-project.eu Page 7 of 211
Figure 14: Pairwise comparison of criteria with respect to the goal ....................................... 71Figure 15: Consolidated global priorities of criteria towards achieving the goal ..................... 74Figure 16: Consolidated weights (ranking) of categorisations ................................................ 76Figure 17: Representation of primary benefits ....................................................................... 77Figure 18: Representation of transport type, mode and geographic deployment criteria ....... 78Figure 19: Representation of key enabling technology criterion ............................................ 78Figure 20: ITS/C-ITS services per category ........................................................................... 81Figure 21: 3-dimensional mapping of services ....................................................................... 82Figure 22: Classification per market segment, primary benefit and innovation level ............. 83Figure 23: Classification per market by type, primary benefits and key enabling technology 83Figure 24: Cluster dendogram of services ............................................................................. 84Figure 25: SOM of the patterns exhibited by the services, divided into four clusters ............. 85Figure 26: Self-organized mapping of the services to the four clusters ................................. 86
List of Tables Table 1 Overview of steps, processes and tools .................................................................... 32Table 2 Basic data parameters for Initiatives-Other ............................................................... 41Table 3 Basic data parameters for Initiatives-Project ............................................................. 41Table 4 Summary of Initiatives: Grey literature ...................................................................... 43Table 5 Summary of Initiatives: Policy documents ................................................................. 45Table 6 Summary of Initiatives: Scientific documents ............................................................ 46Table 7 Summary of projects: Overview ................................................................................ 47Table 8 Summary of Projects: Application ............................................................................. 48Table 9 Summary of Projects: Platform .................................................................................. 48Table 10 List of Interviewees .................................................................................................. 50Table 11 Long list of criteria for ITS services ......................................................................... 59Table 12 General information in Service Fiche Template ...................................................... 62Table 13. Summary of criteria information in Service Fiche template .................................... 63Table 14 Definition of Technology Readiness Levels ............................................................ 64Table 15 Saaty preference rating scale (Saaty, 1987) ........................................................... 71Table 16 A sample matrix response of pairwise comparisons of the criteria with respect to the overall goal ............................................................................................................................. 72Table 17 Resulting weights of criteria based on the PCMs of individual partners .................. 73Table 18 Ranking of criteria with consolidated global priorities .............................................. 73Table 19 Consolidated priorities for categorisation with respect to each criterion ................. 75Table 20 Categorisation ranking per partners ........................................................................ 75Table 21 Overview of ITS market by type and subcategories ................................................ 80
D2.1 Overview of ITS initiatives in the EU and US
© NEWBITS consortium www.newbits-project.eu Page 8 of 211
Abbreviations AHP: Analytic Hierarchic Process
AHS: Automated Highway System
APTS: Advanced Public Transport System
ATIS: Advanced Traveller Information System
ATMS: Advanced Traffic Management System
ATPS: Advanced Transport Pricing System
BHLS: Buses with a High Level of Service
BRT: Bus Rapid Transit
CCTV: Close Circuit Television
CEN: European Committee for Standardization
C-ITS: Cooperative Intelligent Transport Systems
CR: Consistency Ratio
CVS: Cooperative Vehicle System
D2.1: Deliverable 2.1 of NEWBITS
DoW: Description of Work
EC: European Commission
ERTICO: Organisation for ITS in Europe
ETSI: European Telecommunications Standards Institute
EU: European Union
FCD: Floating Car Data
FP7: Framework Program 7 of the European Commission
FRAME: EU ITS Framework Architecture
GA: Grant Agreement
GLOSA: Green Light Optimal Speed
GPS: Global Positioning System
GSM: Global System for Mobile Communication

D2.1 Overview of ITS initiatives in the EU and US
© NEWBITS consortium www.newbits-project.eu Page 9 of 211
H2020: Horizon 2020 Program of the European Commission
IaaS: Infrastructure-as-a-Service
ICT: Information and Communication Technologies
ISTEA: Intermodal Surface Transportation Efficiency Act
ITS: Intelligent Transport Systems
I2V: Infrastructure to Vehicle
KAREN: Keystone Architecture Required for European Networks
KoM: Kick-off Meeting
KPI: Key Performance Indicator
LIDAR: Laser Imaging Detection and Ranging
LVM: Finnish Ministry of Transport and Communications
MaaS: Mobility-as-a-Service
MS: Microsoft
NASA: National Aeronautics and Space Administration (US)
NFC: Near Field Communication
OEM: Original Equipment Manufacturer
OT: Objectives Tree
PCM: Pairwise Comparison Matrix
PDA: Personal Digital Assistant
PPP: Public-Private Partnership
RITA: Research and Innovative Technology Administration (US DoT)
RFID: Radio Frequency Identification
SD: Service Dominant (logic)
SME: Small and Medium Enterprise
SOM: Self-Organizing Map
TNO: Netherlands Organisation for Applied Scientific Research
TTRANS: FP7 Project “Enhancing the transfer of ITS innovations to the market”
TRL: Technology Readiness Level
UTMS: Universal Mobile Telecommunications System

D2.1 Overview of ITS initiatives in the EU and US
© NEWBITS consortium www.newbits-project.eu Page 10 of 211
US: United States
USDoT: Unites States Department of Transportation
V2I: Vehicle to Infrastructure
V2V: Vehicle to Vehicle
V2X: Vehicle to Other transport participants
WP: Work Package

D2.1 Overview of ITS initiatives in the EU and US
© NEWBITS consortium www.newbits-project.eu Page 11 of 211
Abstract In order to provide NEWBITS with a framework for approaching ITS and define relevant ITS categories for the project deployment, a mapping and assessment of ITS initiatives in the EU and US is carried out: Deliverable 2.1.
The interrelations of WP2 with the other work packages are discussed. There are numerous definitions of the term Intelligent Transport Systems (ITS) and Cooperative Transport Systems (C-ITS), but after literature research, a definition is proposed that describes the term in the NEWBITS context best. Furthermore, the different concepts of NEWBITS at macro and meso levels are described to further enhance the comprehension of those and the project scope.
The methodology used to categorize and map relevant ITS initiatives is developed to operate in a two-tier level at initiative (macro) and service (meso) levels. It follows a 3-stage categorization process based in iterative data gathering, conceptualization and codification of the data. After several literature research and assessment of the results of the initial data gathering, a categorization framework and a number of criteria are proposed, guiding the data gathering at service level. An important tool is the fiche template: through the template all partners provide information of ITS services in a structured manner. The process of validation of the categorization method follows the Analytical Hierarchy Process. A decision hierarchy is constructed and partners are asked to score the criteria and categorization parameters. Finally, the process of codify and organize data will deploy an identification of subcategories for service differentiation, presenting diverse mapping outcomes and extended visualization of the categorization.

D2.1 Overview of ITS initiatives in the EU and US
© NEWBITS consortium www.newbits-project.eu Page 12 of 211
0. Executive summary Deliverable 2.1. Overview of ITS initiatives in the EU and US is the first deliverable for work package two (WP2), and the basis for the other work packages (WPs). There are interrelations with the other WPs and these are described in Chapter 1 Introduction. The main point is that there has been and will be contact with the other WP leaders to ensure efficient and effective use of each other’s work to create synergy.
Since the terms ‘Intelligent Transport Systems’ and ‘Cooperative Intelligent Transport Systems’ will be used throughout the NEWBITS project following a dual scope, it is crucial to have a common understanding of both terms. Following research, a definition specific for NEWBITS was formulated:
We will consider ITS main function as the increased efficiency in the transport system, with special focus on the service and information provision for the full spectrum of users (drivers, passengers, vehicle owners, network operators…) which involves a diversity of stakeholders (network operators, public authorities, OEMs, service providers, technology developers…).
C-ITS are considered a subset of the overall ITS that communicates and shares information between ITS stations to give advice or facilitate actions with the objective of improving safety, sustainability, efficiency and comfort beyond the scope of stand-alone system
These definitions are specified in Chapter 2 Definitions and Methodological Approach together with the different concepts of NEWBITS at macro (initiative) and meso levels (case study, services), to further enhance the comprehension of those and offer a clearer focus of the project scope. Chapter 2 provides with an explanation of the methodological approach followed to produce the deliverable, inspired in the three stages of the knowledge management theory and backed-up by the Analytical Hierarchy Process (AHP) is also stated in this chapter, resulting in a 5-step process to be deployed in the following chapters.
Chapter 3 Data identification and definition of the categorization framework develops the first three steps of the proposed methodology: in step 1 ‘Data identification #1’, an initial data identification and gathering process is deployed. ITS initiatives are identified following the proposed scope as defined in the Description of Work. Basic information on those has been gathered and upon transversal analysis, has lead towards a first categorization and a “rough” inventory. In ‘step 2 defining the categorization framework (conceptualization #1)’, NEWBITS partners discussed about the categorization approach to be followed, acknowledging the need to consider a market oriented framework, as well as identified a long list of criteria to consider the categorization. In step 3 ‘Data identification (#2)’, NEWBITS partners identified a number of ITS applications or services, generating an ITS service inventory.
The chapter 4 Codification and Mapping of ITS and C-ITS services has a twofold focus: on the one hand, to propose a systematic methodology based on the Analytical Hierarchy Process (AHP) to determine: (1) a suitable categorisation that fits the purpose of NEWBITS, and at the same time, (b) provide a priority ranking of the long criteria list defined in Chapter 4 following pairwise comparison assessments by partners. On the other hand, to perform the mapping of

D2.1 Overview of ITS initiatives in the EU and US
© NEWBITS consortium www.newbits-project.eu Page 13 of 211
the identified ITS/C-ITS services to the selected categorisation, and provide a visual mapping with respect to the short list of criteria resulting from the ranking in (1).
Thus, Chapter 4 deploys step 4 by validating the conceptualization process and organizing and mapping the identified ITS services. The mapping methodology will be the base to support further design inputs in Task 2.2 and Task 2.3.
D2.1 Overview of ITS initiatives in the EU and US
© NEWBITS consortium www.newbits-project.eu Page 14 of 211
1. Introduction
1.1 NEWBITS project NEWBITS (New Business Models for Intelligent Transport Systems) is a Coordinated and Support Action project funded under the EC Programme Horizon 2020.
NEWBITS aims at providing further understanding of the changing conditions and dynamics that affect and influence the deployment of ITS innovations. This improved understanding must contribute to minimizing the failures inherent to ITS innovation diffusion, evolve present business models, and identify effective (policy) incentives to accelerate ITS deployment.
Although the significant added value that ITS applications can provide to the European transport system has been constantly highlighted in the past years, their deployment is considered to be slow and fragmented (C-ITS Platform, 2016; Ricardo, 2016). Robust and innovative business models that would support a truly responsive approach to accelerating commoditisation and price-competition in the market for ITS services are often missing, inter alia due to the public oriented nature of ITS users (Agelidou et al., 2015). Confidence of the core stakeholders on the (long-term) profitability of their investments in ITS services and technologies is necessary and requires sound and convincing business cases.
In consideration of this global context, the project has set the following specific objectives:
1. Applying a business ecosystem’s concept for ITS and C-ITS, introducing a higher conceptual level than that of individual organizations.
2. Improve the understanding of ITS and C-ITS enablers and barriers, implementing a holistic intelligence process
3. Effectively implement a network based business modelling method for C-ITS 4. Validation of new business models, translation and capitalization of results.
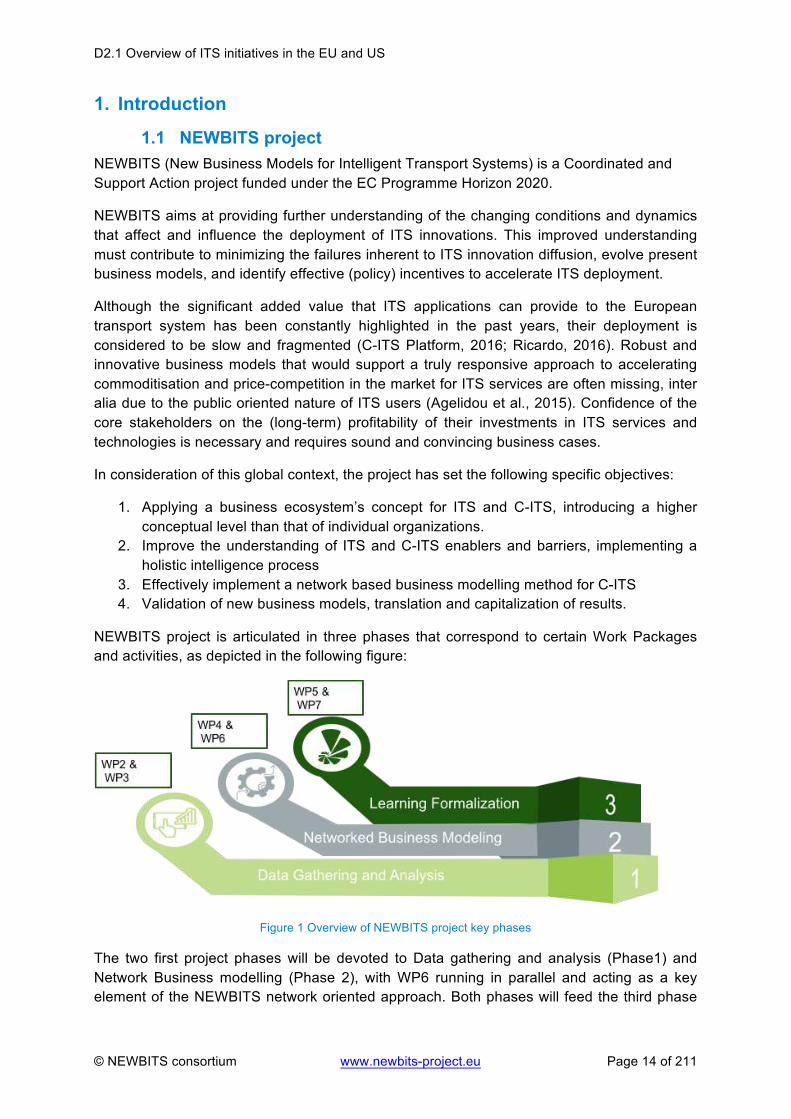
NEWBITS project is articulated in three phases that correspond to certain Work Packages and activities, as depicted in the following figure:
Figure 1 Overview of NEWBITS project key phases
The two first project phases will be devoted to Data gathering and analysis (Phase1) and Network Business modelling (Phase 2), with WP6 running in parallel and acting as a key element of the NEWBITS network oriented approach. Both phases will feed the third phase

D2.1 Overview of ITS initiatives in the EU and US
© NEWBITS consortium www.newbits-project.eu Page 15 of 211
(Phase 3), the implementation of which requires the execution of the biggest part of the work effort of the tasks of the previous phases.
1.2 Description of WP2 Work Package 2 “Mapping (C)-ITS context” is the first support Work Package of the project, having a relevant role in NEWBITS as an enabler of the understanding of the challenge underlying the NEWBITS project. WP2 aims at providing a good framework for the assessments to be carried out in the next WPs (in WP3, WP4 and WP5), being key outcomes: the assessment of ITS relevant initiatives and applications, and the validation of the project case studies.
The analysis performed by WP2 is based on three highly interlinked activities or tasks: mapping and categorizing relevant ITS initiatives and applications (services) at EU and US levels (Task 2.1); assessing Key Performance Indicators (KPIs) and barriers for implementing ITS following the categorization (Task 2.2); and define and validate valid case studies to deploy the business modelling method while generating an accurate taxonomy (Task 2.3).
Work Package 2 is configured considering the need to deploy an assessment at both the macro level (ITS initiatives) and the meso-level (ITS business ecosystems and services), in order to achieve its objectives. It is not intended to provide an accurate picture of the ITS environment, being this out of the project reach and scope, but to categorize such a diverse and evolving domain in order to assess the representativeness of NEWBITS case studies towards ITS.
Taking into consideration the relevance of WP2 as the work package in which NEWBITS framework is categorized and case studies are validated, there are interrelations within WP2, but also with other WPs, tasks and activities. These interrelations, highlighted in the Risk Management of the project, have been taken into consideration throughout the execution of the WP2. The most important foreseen and existing interrelations are described, as well as the steps that are to be taken - or already have been taken - in order to ensure efficient and effective interaction.
Figure 2 Diagram for key interrelations in NEWBITS

D2.1 Overview of ITS initiatives in the EU and US
© NEWBITS consortium www.newbits-project.eu Page 16 of 211
The key interrelations of WP2 are summarized as follows:
§ Interrelation within WP2 The three WP2 deliverables and the work to be done to implement them are strongly interrelated. D2.1 (Overview of ITS initiatives in the EU and US) sets the operative ground for D2.2 (Assessment of existing KPIs and barriers for implementation of C-ITS) by identifying relevant initiatives and services (covering both macro and meso level), validating key criteria to implement a systematization of the ITS universe towards the objectives of NEWBITS project, and ultimately mapping most relevant ITS services using a qualitative analysis. The study of barriers for implementation is a key of NEWBITS project. D2.3 (Case study taxonomy), will build up on the results of both previous outcomes, further defining and validating case studies suitable for deploying the project method, and generating a taxonomy of those based on the prior systematization and categorization defined in D2.1.
NEWBITS partners involved in the direction of each of WP2 tasks (CED and UAB), supported by Project Coordinator, have been collaborating and discussing the design of the most appropriate methodology since the inception of Task 2.1 in order to ensure that the outcomes are highly relevant to facilitate the processes in WP2.
§ WP2 & WP3 The interrelation of WP2 activities with WP3 “Holistic Intelligence process” is considered. The key outcome of WP2 will be a validation of the case studies for NEWBITS project, based on a three-step approach represented by the three abovementioned WP2 tasks. The case studies are the critical enabler of the envisaged project methodology, further articulating the processes designed to fulfil the project objectives. WP3 focuses the multi-layered market analysis on the case studies: Task 3.1 Market research analysis and Task 3.2 Perform conjoint analysis to analyze user preferences on the case studies, will deeply rely on the output of WP2 and D2.3 particularly. Thus, WP3 builds upon the outcome of WP2, being strongly conditioned by the criteria utilized to validate the NEWBITS case studies.
The consideration of the impact of WP2 outputs in WP3, has been acknowledged in the process of definition of Task 2.1 as first critical step to frame NEWBITS overall approach, guiding the actions of the consortium to deploy this deliverable. Since the implementation of WP2 follows an inter-linked rationale, it has also been considered for defining Task 2.2 (launched in M5, during the time of finalization of this document) and will be considered in Task 2.3. WP2 Leader (CED) and WP3 Leader (ATOS) have been in constant communication, supported by PC (ORT), in order to ensure a comprehensive approach in WP2 that considers the needs of WP3, and vice versa.
§ WP2 & WP4 WP4 “Developing Innovative Business Models” focuses on the economic and commercial aspects of ITS, and will research for new business models for the selected NEWBITS case studies. Thus, the scope of WP4 is entirely devoted to the meso-level (case studies) and will draw on the results from both WP2 and WP3.

D2.1 Overview of ITS initiatives in the EU and US
© NEWBITS consortium www.newbits-project.eu Page 17 of 211
WP4 leader (ORT) has been involved in the definition of the relevant parameters to be considered by WP2 and Task 2.1 methodology regarding the deployment of WP4. Since the project does not foresee any further iteration past Task 2.3 on the case study validation, this outcome is of critical relevance. The process for selecting the most relevant criteria in the categorization process has considered WP4 needs. Moreover, and following the duality in the DoW with respect to the focus of T2.1 in initiatives, but also in services-applications, the final methodological approach has considered the service level as a priority in view of the inputs of both WP3 and WP4 leaders.
§ WP2 & WP5 The interrelations of WP2 with WP5 “NEWBITS Business case validation, guidelines and training” are also considered. WP5 embeds the process of learning formalization and generalization from the case studies towards ITS environment. The assessment of the criteria of relevance for categorizing and ultimately validating the case studies has also considered WP5 approach. This has been ensured with the active participation of WP5 leader (CUE) in Task 2.1 deployment, though it was not initially established in DoW, and the specific communication between CED partner (WP2 and D2.1 Leader) and CUE on the matter.
§ WP2 & WP6 The results of WP2 are a key conditioner of WP6 “NEWBTIS Network”. The concept of Communities of Interest (CoIs) is to be articulated initially around the NEWBITS case studies. The key assumption of NEWBITS project is that business models are understood as a network, thus the process of engaging stakeholders towards a networked oriented value proposition generation is strongly linked to the nature of the validated case studies.
Similarly to the abovementioned Work Package leaders, WP6 Leader (INTELS) has provided input to WP2 and D2.1 Leader (CED) so that WP6 constrains and focus is considered in Task 2.1 and WP2 deployment, and vice versa since both WPs are running in parallel till M10.
1.3 Deliverable 2.1 Objectives and methodology in a nutshell Task 2.1 sets the frame within which most analyses and processes that will follow in the NEWBITS project will be carried out. The activity deployed in this task has been collated into this Deliverable 2.1, which aims to fulfil 2 major objectives:
1. Provide NEWBITS with a framework at ITS macro-level.
This objective will be fulfilled by identifying ITS and C-ITS initiatives at EU and US levels, and generating a rough inventory collating the information gathered. This macro-framework intends to provide with an overview of the complex and evolving ITS domain, not to be an accurate delimitation of it, and will contain basic information about the initiatives identified (description), stakeholders involved on those (if relevant), transport mode covered and geographic context.
2. Define relevant ITS categories for the project deployment

D2.1 Overview of ITS initiatives in the EU and US
© NEWBITS consortium www.newbits-project.eu Page 18 of 211
NEWBITS categorization exercise proposed and deployed in this deliverable intends to fulfil three transversal objectives: to frame the context of ITS into useful and valid parameters for the project purposes; to support the process of validation of the case studies (deployed in Task 2.3); to facilitate the process of result generalization from the case studies to a more ITS generic level (to be performed in WP5).
Taking in consideration those expected impacts for the resulting categorization, this objective requires to fulfil a higher level of systematization than at global initiative level. Thus, the categorization at initiative level will be consolidated towards the identification of ITS services. Further information will be collated and assessed in order to assess the relevant key criteria at service level, which will also consider the above mentioned transversal impacts expected.
In order to achieve the two core objectives, considering the relevance of the task and the need to pivot in both macro and meso levels, a 3-stage methodological approach has been designed and implemented inspired in Knowledge Management theory: Data Identification; Conceptualization; and Codification.
The 3 stages rely on 5 implementation steps which ensure the required iteration at data identification and the need to cover both levels of the project (macro and meso levels). Those steps are: Step 1 Data Identification; Step 2 Defining the categorization framework; Step 3 Data identification; Step 4 Validation of the categorization method; Step 5 Data codification.
Further detail on the methodological approach is provided in Chapter 2, sections 2.4 and 2.5.
1.4 Structure of the report The structure of this document follows the methodology proposed in the NEWBITS description of work.
Chapter 1: Introduction
Within an introduction to the NEWBITS project, the work package 2 and the task 2.1, the special background and requirements of this task are explained.
Chapter 2: Definitions and methodological approach
The results of a thorough literature review are presented by giving definitions of key terms and summarizing the existing classifications at both EU and US levels for ITS. A short explanation of the NEWBITS macro and meso levels is introduced, linked with relevance of both concepts at methodological level.
The methodological approach of the deliverable is introduced. The method designed operates in a two-tier level, at initiative (macro) and application/service (meso) levels. A 3-stage categorization process is deployed, which embeds both tiers towards a feasible mapping at service level and is effectively deployed in a 5-step iterative process (Table 1 Overview of steps, processes and tools).
Chapter 3: Data Identification and definition of the categorization framework

D2.1 Overview of ITS initiatives in the EU and US
© NEWBITS consortium www.newbits-project.eu Page 19 of 211
In a first step, ITS initiatives are identified following the proposed scope as defined in the Description of Work. Basic information on those has been gathered and upon transversal analysis, has lead towards a first categorization and a “rough” inventory
In step 2, NEWBITS partners discussed about the categorization approach to be followed, as well as identified a long list of criteria to consider the categorization.
In step 3, NEWBITS partners identified a number of ITS applications or services, generating an ITS service inventory.
Chapter 4: Codification and Mapping of ITS and C-ITS services
Also in this chapter, two steps are combined:
In step 4, the process of conceptualization is finalized, validating the categorization proposed for NEWBITS using an Analytical Hierarchy Process based approach.
In step 5, the data is finally organized and codified, using a mapping method as base to support further design inputs in Task 2.2 and Task 2.3.
Chapter 5: Conclusion
In the last chapter, all previous are summarized and their findings and outcomes are stated again at a glance.
Chapter 6: Annexes
All figures, graphics, tables and other data gathering and collection tools (fiches, questionnaires) that are useful to understand project-related issues and outputs, but exceed the normal size of 1 page and therefor would impede the flow of reading are attached in the Annex section. There is also a glossary that collects all abbreviations used in this report and explains those of them, that haven’t a self-explanatory name when it is written out.

D2.1 Overview of ITS initiatives in the EU and US
© NEWBITS consortium www.newbits-project.eu Page 20 of 211
2. Definitions and Methodological approach The dual ITS and C-ITS scope of NEWBITS is embedded into the project’s approach since its inception. NEWBITS responds to the Topic MG-6.3-2016 “Roadmap, new business models, awareness raising, support and incentives for the roll-out of ITS”. Though the topic intended to address ITS holistically, there was also a special focus on the “need to develop tools and guidance to support public and private stakeholders in the development of efficient policies for Collaborative ITS (C-ITS) deployment based on consolidated knowledge across the EU”.
In consequence, NEWBITS proposes an approach to ITS as a domain, with specific emphasis throughout the project implementation, and in specific stages, to C-ITS.
In what regards to the methodology followed in this report, NEWBITS project as a whole is aligned with the Service Dominant Logic, considering services at the core of the methodological approach, and setting the ground for a Value Network based analysis. In order to fulfil the objectives of Task 2.1 Mapping and assessing relevant ITS and C-ITS initiatives at EU and US levels, a 3-stage approach based on classical knowledge management theory and practice has been proposed, further implemented in a 5-step process which determines the structure of this report.
The following sections in this chapter will further elaborate on the definitions adopted by NEWBITS, and provide with a concise yet robust explanation to the methodological approach. The results of this approach will be assessed in Chapters 3 and 4.
2.1 Definition of Intelligent Transport Systems In the past few years, Intelligent Transport Systems (ITS) research and practice has developed an ever-growing body of knowledge while the application of ITS technologies has already had a significant impact on the current transport environment. With few doubts existing nowadays about the wide reaching and cross-cutting benefits of ITS, it is important to state that ITS is still a relatively young discipline.
Some references set the origins in late 1960s in the United States (US), with the deployment of the first dynamic messaging signs, and the later-on deployment of first generation bus automatic vehicle location mapping technologies. As a matter of fact, the first-time appearance of the term ITS as such occurs during the 1980s, when a new discipline, Telematics, appeared on the market as a synergy of two existing disciplines: Telecommunications and Informatics.
The embryonic ITS domain grow in relevance during the 1990’s decade, especially after the “Intermodal Surface Transportation Efficiency Act” (ISTEA) was passed by US Congress, and the first federal ITS research program was established.
It has been though in the past 15 years when ITS have risen as a key technology and application spectrum, envisaged to provide an effective answer to the increase in transport demand under tight constrains, and to the need of dimension efficiently the limited capacity of transport infrastructures while releasing pressure on the environment and energy

D2.1 Overview of ITS initiatives in the EU and US
© NEWBITS consortium www.newbits-project.eu Page 21 of 211
resources and providing a higher comfort and security for both passenger and goods transport.
This recent commonly granted holistic perception of ITS (or the role of ITS) based on a broad scope of ITS, coexists with a more narrow-focused one. As stated in the Report on Australia’s future in Intelligent Transport Systems, “for non-ITS experts and popular broadcasters, automated vehicles and ITS are often synonymous…even if they represent one part of a much richer menu of computerised intelligence supporting travel by vehicles” (ITS Australia, 2017).
The lack of a commonly accepted and holistic definition of the ITS term is linked to its fast exponential development and highly cross-cutting and interdisciplinary nature, together with the original preponderance of ITS in the US context and its, still predominant, deployment in the road mode.
In this sense, the first step towards a NEWBITS definition of ITS is to acknowledge the two possible expressions of ITS:
- Intelligent transport systems
- Intelligent transportation systems
In this project, we will not further distinguish between both versions as there is no real difference between those terms rather than at a language use level.
In what regards to ITS meaning, the lack of a homogenised definition is still prevailing nowadays. A brief overview for the most extended definitions in the three macro-regions which are the primary object of study of NEWBITS project (United States, European Union and Australia), reveals this disparity.
United States has played an indisputable role in the global definition of ITS as key enabler for enhanced transport system performance. Though the US role worldwide has been overpassed by other players, namely Japan, Singapore and South Korea (ITIF, 2010), US has recently re-assessed the relevance of ITS at strategic level. Moreover, the commonly shared transport research issues, challenges and goals with the European Union (EU), has pushed towards a progressively more intertwined agenda in both regions.
The US Department of Transportation defines ITS as:
“Intelligent transportation systems (ITS) provide a proven set of strategies for advancing transportation safety, mobility, and environmental sustainability by integrating communication and information technology applications into the management and operation of the transportation system across all modes.” (US DoT, 2014)
Similarly, the definition of ITS in the Strategic Plan 2015-2019 states:
“ITS is a set of tools that facilitates a connected, integrated, and automated transportation system that is information-intensive to better serve the interests of users and be responsive to the needs of travellers and system operators”. (US DoT, 2015)

D2.1 Overview of ITS initiatives in the EU and US
© NEWBITS consortium www.newbits-project.eu Page 22 of 211
At EU level, the high cross cutting nature of ITS and their importance and potential have determined their consideration of an integral part of the Common Transport Policy. European Commission (EC) has highlighted the ITS potential to support major EU priorities as regard of economic growth by 2020 (EC, 2010a). According to the EC:
“ITS are ‘advanced applications which –without embodying intelligence as such – aim to provide innovative services relating to different modes of transport and transport management and enables various users to be better informed and make safer, more coordinated and ‘smarter’ use of transport networks” (European Commission, 2010b).
EC uses also refers to ITS in a very holistic description:
“Intelligent Transport Systems (ITS) apply information and communication technologies to transport.” (European Commission, 2012)
The European Telecommunications Standard Institute (ETSI) provides the following definition:
“Intelligent Transport Systems (ITS) use information and communications technologies (ICT) to improve safety, reliability, efficiency and quality of transport. The technologies are therefore added to infrastructures and are integrated at the corresponding transport vehicles.” (ETSI, 2012)
Australia has a long history of ITS deployment, with the first systems introduced in the early 1970s and a context in which public authorities, transport industry and users have come to rely more heavily on the efficient operation of ITS. In this sense, the existing strong linkages amongst NEWBITS and Australian based ITS players has favoured the consideration of Australia as secondary object of study to be included in NEWBITS project. Thus, the definitions provided for ITS from an Australian perspective have also been considered at this stage of project implementation.
In this sense, ITS-Australia defined Intelligent Transport Systems (ITS) as:
“ITS are the application of modern computer and communication technologies to transport systems, to increase efficiency, reduce pollution and other environmental effects of transport and to increase the safety of the travelling public.” (ITS Australia, 2002)
More recently, the Australian Department of Infrastructure and Transport provided the following definition:
“ITS encompass the application of information and communications technologies to transport. ITS include stand-alone infrastructure applications such as traffic management systems, as well as cooperative ITS (C-ITS) applications involving

D2.1 Overview of ITS initiatives in the EU and US
© NEWBITS consortium www.newbits-project.eu Page 23 of 211
telematics, vehicle-infrastructure and vehicle-vehicle communications. These technologies cover private and public transport by road, rail, water and air, as well as cycling and walking, together with applications for cross modal transport and transport hubs.” (Australian Department of Infrastructure and Transport, 2012)
An updated definition, also by ITS Australia:
“The term ‘Intelligent Transport Systems’ (ITS) covers the development and deployment of advanced information and communications technologies to deliver safer, more efficient and environmentally sustainable transport across all public and private modes – air, sea, road and rail.” (ITS Australia, 2017b)
Finally, the PIARC World Association ITS Handbook, defined ITS as:
“ITS - Intelligent Transport Systems - is a generic term for the integrated application of communications, control and information processing technologies to the transportation system.” (ITS Handbook, 2011)
Thus, we can resume that ITS in its more simplistic definition (Taylor, 2001; EC 2012) refers to the application of information and communication technologies (ICT) to the transport sector.
ITS covers all modes of transport and considers all elements – the vehicles, the infrastructure, the drivers and users – all interacting together dynamically (ITS Handbook, 2011). ITS can have applications in a broad range of fields, including infrastructure, vehicles and users, traffic and mobility management, and interfaces with other modes of transport. More specifically, ITS cover travel information services, transport management systems, a broad range of mobility services (e.g. smart travel cards, integrated ticketing services), vehicle control and safety systems (e.g. anti-collision warning and control systems) and transportation pricing systems (e.g. electronic toll collection, variable parking fees) (CE Delft et al., 2011).
As for the NEWBITS project, the definition of ITS is basically aligned with that provided by the ITS Handbook, which anchors ITS in the implementation of ICT in transport. We will consider ITS main function as the increased efficiency in the transport system, with special focus on the service and information provision for the full spectrum of users (drivers, passengers, vehicle owners, network operators…) which involves a diversity of stakeholders (network operators, public authorities, OEMs, service providers, technology developers…).
The impact of ITS in NEWBITS will be considered in a transversal manner, considering ITS as enablers of improved traffic flow, enhanced safety, de-creased environmental impacts, generating a wide array of advantageous services for users and establishing convenient multimodal mobility service use (LVM, 2014) which reverts into a higher capillarity and efficiency of the whole system.

D2.1 Overview of ITS initiatives in the EU and US
© NEWBITS consortium www.newbits-project.eu Page 24 of 211
2.2 Definition of Cooperative Intelligent Transport Systems Having provided with several references for ITS in the previous section, and established a commonly agreed valid definition for NEWBITS, this section will briefly introduce the C-ITS concept as part of the ITS broader domain.
Cooperative ITS (C-ITS) is a subset of ITS that has been defined by the European Committee for Standardization (CEN) TC278 WG16/ISO TC204 WG18 and European Telecommunications Standards Institute (ETSI) EC ITS together as: ‘A subset of the overall ITS that communicates and shares information between ITS stations to give advice or facilitate actions with the objective of improving safety, sustainability, efficiency and comfort beyond the scope of stand-alone systems”. (EC, 2016) What C-ITS distinguishes from other ITS is the communication between different systems (i.e. personal ITS stations (e.g. mobile phones), vehicles, transport infrastructure or traffic management centres), which increases the ability for applications to collect and deliver information, and hence increases the overall quality of ITS services.
C-ITS typically involves communication between vehicles (vehicle to vehicle, V2V), between vehicles and infrastructure (vehicle to infrastructure, V2I; infrastructure to vehicle, I2V) and/or between vehicles and other transport participants (V2X), such as pedestrians and cyclists: • V2V applications provide the opportunity to transmit messages about the vehicle’s speed,
location, direction, brake status and other information to other vehicles, and receive the same type of information from other vehicles. In this way information can be shared that cannot be provided by sensors, cameras, radar or the human eye, such that travellers receive the same information sooner or receive higher quality / more reliable information. Based on this information the transport users can act accordingly or, one step further, the vehicle can act autonomously, e.g. to prevent dangerous situations.
• In V2I / I2V applications, the infrastructure plays a coordinating role, e.g. by collecting information of road conditions and suggesting or imposing certain behaviours on a group of vehicles.
• V2X applications provide the opportunity for communication between vehicles and other travel participants (e.g. pedestrians). For example, vehicles communicate with mobile devices, e.g. smart phones) carried by pedestrians so that both the user of the vehicle and the pedestrian can be warned in case of any possible conflict.
As for the NEWBITS project, the definition of C-ITS is aligned with that provided jointly by CEN and ETSI.

D2.1 Overview of ITS initiatives in the EU and US
© NEWBITS consortium www.newbits-project.eu Page 25 of 211
2.3 Macro and Meso levels definition NEWBITS proposed in WP2 a “Mapping of the C-ITS context” in which an analysis of barriers and Key Performance Indicators (KPIs) will be deployed at two levels: Macro level and Meso Level. These two tiers are also mentioned in diverse stages of the project. The original definitions were introduced at proposal level:
§ Macro Level: Analysing ITS supporting initiatives and applications with focus on
the C-ITS subarea (at both initiatives and applications levels)
§ Meso Level: Case studies for specific sub-areas, covering concrete C-ITS related projects/programs.
Though the meaning of terms initiatives, applications, case studies, projects and programs can be in general and broadly accepted, could be at the same time questioned and challenged, since they are rather wide in terms of their concept covering many overlapped and interrelated aspects, thus they can be interpreted subjectively by different persons and viewpoints.
In this sense, the interdependency in the original definition between initiatives and applications, positioned at the same level of analysis (Macro level) requires of further assessment. NEWBITS provided with a description of what were considered initiatives, when describing Task 2.1: “FP7-H2020 projects, scientific papers, policy reports, research reports, other strategic reports and communications”. Besides offering a heterogeneous base for the definition, which was the intention of the data gathering process in D2.1, this definition has the impediment of including elements referred also in the Meso level as defined in the proposal (projects).
Furthermore, the original definition did not provide with sufficient background guideline regarding the key enabling tool in which NEWBITS project pivots: the case studies (i.e. the Meso level).
Thus, both Macro and Meso levels need to be defined at this initial stage of project implementation, and the terms of Initiative, Application and Case Study defined as key parts of the categorization and mapping (D2.1), the KPIs and barrier assessment (D2.2) and the taxonomy (D2.3).
The following lines are devoted to provide an operative description of all key elements in NEWBITS approach.
1. Initiative: As stated in NEWBITS DoW, initiatives are considered in its original scope and width in order to enable a generic approximation to the ITS domain. Thus, Initiatives are defined as FP7-H2020 projects, scientific papers, policy reports, research reports, other strategic reports and communications.
2. Case Study: NEWBITS follows a case study based approach as a qualitative research method to bring understanding of the complexities of ITS and strengthen the existing know-how. Case studies are envisaged to emphasize contextual analysis of a limited number of conditions and their relationships. In this sense, NEWBITS is aligned with the classic definition of case study research as an empirical inquiry that investigates a

D2.1 Overview of ITS initiatives in the EU and US
© NEWBITS consortium www.newbits-project.eu Page 26 of 211
contemporary phenomenon within its real-life context, when the boundaries between phenomenon and context and not clearly evident and in which multiple sources of evidence are used (Yin, 1984). The process of selection and validation the case studies is due to be performed in a later stage of WP2 (during Task 2.3), having gained information on the background of ITS and existing barriers and enablers. Thus, it will be in D2.3 when an accurate description of NEWBITS case studies will be offered.
Key elements underlying the definition of case study already at proposal stage that are taken into consideration in the selection and validation process, and thus are embedded into the NEWBITS consideration of the case studies, are summarized in the following bullet points:
§ The case studies have a market vision, and intend to cover different ITS application areas (or key business areas) as resulting from the categorization exercise in this task.
§ Case studies are service based, since NEWBITS moves from the supplier value chain to the value network of the involved stakeholders (“balanced centricity”), considering service as the output.
§ Case studies need to be context appropriate, pivoting on existing capabilities and knowledge of the actors involved, and linked to prior or on-going (but accessible) research.
§ Case studies have to enable the definition of a network of stakeholders, facilitating knowledge sharing and fulfilling the premise of a value network.
3. Application: In Information and Communication Technologies, an application is the use of a technology, system or product. In this sense, NEWBITS considers applications as the use given to ITS in order to achieve a purpose. In line with T-TRANS project (2013), applications refer to the combination and use of several technologies in order to fulfil user requirements related to a transport mode (or the integration of more than one transport mode) on a certain market. This term is to be distinguished from Application area, which relates to ITS areas, and thus, to the Macro-level. In this sense, applications are aligned with the concept of Service, being sometimes indistinctively used in the project, and having a key relevance in the definition of the case studies and the meso level configuration. Examples of ITS services are traffic jam ahead warning, green light optimal speed advisory, cooperative forward collision warning, V2V merging assistance, platooning. ITS technologies are components of the ITS services. They are defined as the use of materials, tools, techniques, infrastructures and sources of power to make communication between ITS stations (e.g. vehicles, infrastructure, mobile phones) possible. They do not have a relation to any certain market and are not dedicated to a certain transport mode. But by combining them, they can be used to satisfy certain user needs as ITS services.

D2.1 Overview of ITS initiatives in the EU and US
© NEWBITS consortium www.newbits-project.eu Page 27 of 211
2.4 Methodological approach In order to carry out the activities envisaged in Task 2.1, it is highly relevant to have a clear understanding of the objectives of the Task, and its relevance in the following tasks in WP2. Figure 4 summarizes Task 2.1 objectives using a basic Objectives Tree (OT) or objectives hierarchy, which shows how higher order objectives are linked to sub-objectives and eventually to implementation measures or attributes.
Figure 3 Deliverable 2.1 Objective Tree Following WP2 rationale, it has been considered by this consortium to proceed to a 2-tier based approach. Tier 1 being a set of processes leading to a categorization of the ITS and C-ITS macro-level (at initiative level), and thus fulfilling the objective 1 of Framing the complex context of ITS. Tier 2 has been considered at Application or Service levels (both used indistinctively in NEWBITS). Based on a categorization and systematization of the higher initiative level, a set of processes have followed also to ensure a categorization and mapping at service-application levels, therefore fulfilling the objectives 2.2 and 2.3 of the Task, and furthermore, paving the way for the development of Task 2.2 (“Assessment of existing KPIs and barriers for implementation of C-ITS”) and robustly supporting the fulfilment of Task 2.3 (“Taxonomy of the case studies”) critical objectives: validate the NEWBITS case studies, and develop an accurate taxonomy of those, both requiring a solid data codification at the meso level (service-application). The following assumptions, discussed at consortium internal level during the implementation of this deliverable, have motivated this approach:
a) The assessment of barriers and enablers to be performed in Task 2.2 is feasible and brings high added value to the project at an ITS Service/application level, not at the higher initiative level due to the high disparity of the pre-established initiative categories (projects, reports, scientific papers, strategic papers…);

D2.1 Overview of ITS initiatives in the EU and US
© NEWBITS consortium www.newbits-project.eu Page 28 of 211
b) The core objective of case study validation to be implemented in the second stage
of Task 2.3, is strongly anchored in tier 2. Thus, it is only possible if the categorization of the ITS and C-ITS domain has been implemented, even though considering tier 1, at a service based level (tier 2).
2.5 Stages and steps in NEWBITS approach The proposed methodological approach of D2.1 contains 3 stages. The approach is based on the initial phase of the knowledge management cycle, in which emphasis is given to elicit tacit knowledge, trigger the creation of new knowledge, and to subsequently, organize this content in a systematic manner (Dalkir, 2005) under a knowledge or data categorization. NEWBITS has considered these three stages in an iterative approach, in order to consider the 2 tiers explained above.
The following diagram outlines the process implemented in Deliverable 2.1:
Figure 4 D2.1 key methodological phases
The key stages of the adopted process can be summarized as follows:
1. Data identification: We scanned and gathered a long list of ITS and C-ITS initiatives. The data identification considered both explicit data (by desktop analysis) and tacit data (at individual Level, by interviewing experts using semi-structured interviews). Following NEWBITS DoW, a number of major differentiation attributes were established as initiatives (national and EU projects, research papers, policy reports, research reports, other strategic reports). Those have been addressed in this stage, resulting in a “rough” inventory of ITS and C-ITS initiatives. The data identification will be iterated at service level.

D2.1 Overview of ITS initiatives in the EU and US
© NEWBITS consortium www.newbits-project.eu Page 29 of 211
2. Conceptualization and categorization: In order to propose a categorization model, NEWBITS consortium reviewed relevant literature related to system configuration, categorization of ITS and design thinking. As a result, a number of major differentiation concepts were introduced to organize the inventory. A first key outcome of this process has been the confirmation of the inefficiency of developing a categorization at initiative level, due the disparity of elements to categorize. Thus, NEWBITS consortium framed the categorization according to ITS parameters, resulting in the introduction of a market-oriented categorization. Upon this generic focus of the categorization, a second literature review was performed in order to detect relevant criteria to guide the categorization process.
This outcome has led to the first iteration in the process (“refine requirements”), in order to identify “entities” at the meso level to fulfil the categorization: ITS and C-ITS services. Thus, the conceptualization at initiative level has developed a second identification stage, and the elaboration of a ITS and C-ITS inventory based on a number of key criteria. This process has been backed up following an Analytic Hierarchy Process (AHP) in order to determine the most suitable categorization method and the criteria required.
3. Codification of the data: In this stage, NEWBITS consortium has reviewed and
organized the data, following an explicit knowledge codification process. In order to ensure the utility of the categorization for the NEWBITS objectives and in view of the data acquired, the consortium has developed a priority ranking sub process based on Analytical Hierarchy Process devoted to assess and select key relevant criteria. As a result, stage 3 has implemented a mapping of ITS services to category according to selected criteria, allowing further assessment on the categorization (second iteration in the process: refine concepts).
Despite the difficulties encountered and the need to tailor a simple yet effective methodological approach to enable the implementation of Task 2.1, the relevance and substantial importance of Deliverable 2.1 lies in the fact that organizes comprehensively the huge available information in the ITS and C-ITS domains. It forms a framework for understanding the challenge underlying the NEWBITS project and, moreover, sets the backbone of the assessments to be carried out in next work packages and activities. The following document sub-sections provide a basic outline regarding each stage. Considering the iterations introduced at Data identification and Data conceptualization stages, a sequential process based on 5 key steps has been introduced. For a complete overview of the process, including the objectives and tools, see Table 1 at the end of this section.
2.5.1 Step 1. Data identification (#1) This step is about the identification and collection of data at ITS initiative level, by means of internal discussion, reviewing of reports and literature. The process of explicit data gathering has been complemented by interviews to ITS experts following a semi-structured approach. In summary, the processes implemented in this step have been:
D2.1 Overview of ITS initiatives in the EU and US
© NEWBITS consortium www.newbits-project.eu Page 30 of 211
i. Internal discussion amongst partners about the approach to the C-ITS and ITS
data ii. Desk research: acquiring basic information about ITS initiatives iii. Defining interviews and implementing
The main outcome of this step is a global inventory of ITS and C-ITS initiatives. The tool used by partners to gather the data is been a MS Excel, annexed in this document (Annex 1 Long List of Initiatives). Interview template in MS word has been also used by partners upon design and distribution by CED (Annex 2 Interview Template).
2.5.2 Step 2. Defining the categorization framework (conceptualization #1) The key assumption guiding this step has been the need to assess the nature of the diverse possible categorization methods, and the ways in which those are applied, in order to determine what methodological approach is more useful for NEWBITS purposes. NEWBITS consortium engaged a literature review and assessment of categorization and systematization methods which could be translated for the purpose of modelling the existing inventory.
At this stage of the conceptualization process, NEWBITS partners reached the conclusion that the categorisation to be considered should support a user-driven approach, rather than a theoretical-driven technological solution. Thus, the conceptualization process was decided to be scaled down from an initiative level (macro level) towards a service level (meso level).
This process was followed by a literature review and assessment in order to identify a long list of criteria to consider in the categorization.
In summary, the processes implemented in this stage have been:
i. Literature review of categorization approach and assessment ii. Systematic approach for categorization in NEWBITS iii. Literature review and establishment of long list criteria
The outcomes of this step are twofold: at global methodological level, it is decided to include the service-application level in order to assess the categorization framework proposed; at operative level, a long list of criteria is introduced.
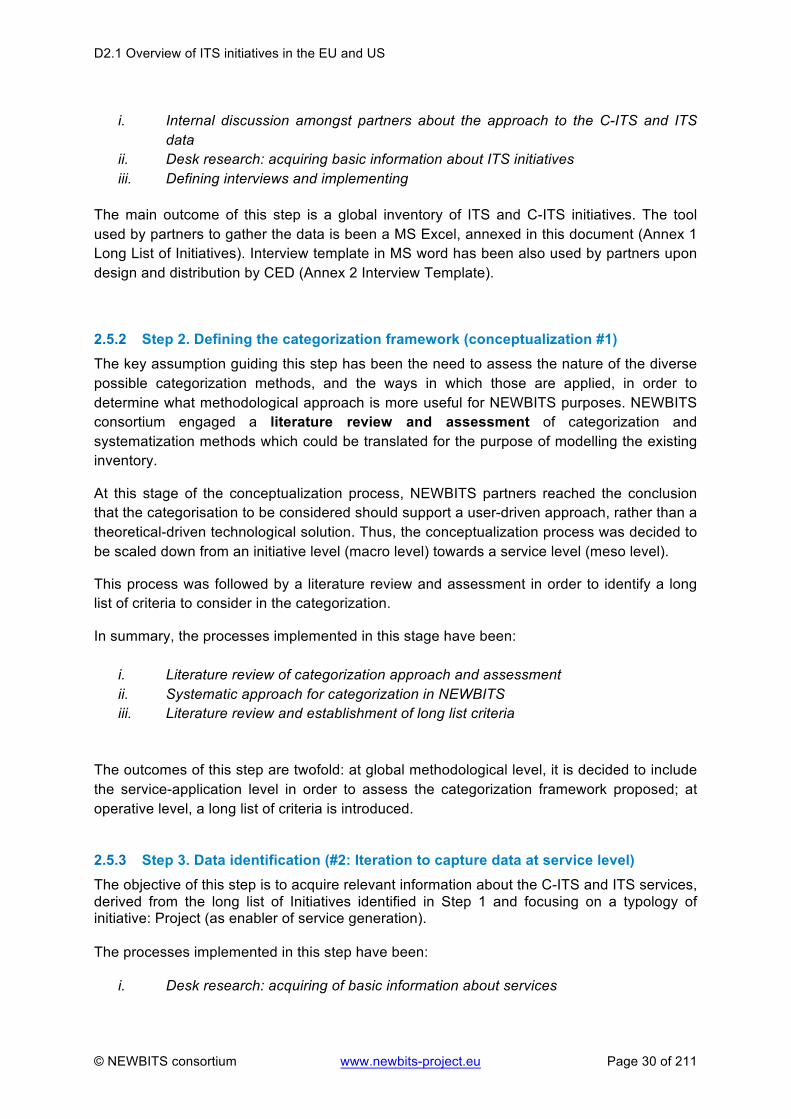
2.5.3 Step 3. Data identification (#2: Iteration to capture data at service level) The objective of this step is to acquire relevant information about the C-ITS and ITS services, derived from the long list of Initiatives identified in Step 1 and focusing on a typology of initiative: Project (as enabler of service generation). The processes implemented in this step have been:
i. Desk research: acquiring of basic information about services

D2.1 Overview of ITS initiatives in the EU and US
© NEWBITS consortium www.newbits-project.eu Page 31 of 211
The main outcome of this step is an inventory of ITS and C-ITS services. The tools used by partners to gather the data is been: a MS Word template fiche, and a MS Excel sheet collating all the data at service level (Annex 3 Long List of Services).
2.5.4 Step 4. Validating the categorization method (conceptualization #2) In order to assist the decision-making process, we adopt the analytic hierarchy process (AHP) after a series of brainstorming sessions with the partners. Partners were asked to set up internal groups of experts and hold internal consultation sessions on the possible answers to the AHP. Once the process was finalised, partners were asked to report to the official AHP template/questionnaire with one single answer per institution which represented the consensus of the opinions of the internal experts who participated in the process. The aim is to achieve two objectives in one process; the ranking of relevant criteria, and the priority ranking of the market segment categorisations. The processes implemented in this step have been:
i. Construct decision hierarchy ii. Develop pairwise comparison matrix iii. Internal voting process for the collective of subjective judgements iv. Synthetize judgements: set of weights v. Develop priority ranking and selection of categorisation.
The main outcome of this step is a validated categorisation and criteria for NEWBITS project.
2.5.5 Step 5. Codification of the data The key activity to be deployed in this step is to review and organize the data. Basically, step 5 will proceed to codify the explicit knowledge (in the form of data) generated by NEWBITS by applying a mapping method.
i. Identification of subcategories for service differentiation ii. Tabular one-to-one mapping iii. Three-dimensional mapping iv. Extended mapping visualization
The main outcome of this step is a visual mapping of NEWBITS services.
2.5.6 Overview of steps, processes and tools The following table depicts the key steps, processes and tools deployed in this deliverable:
Step Process Tools
Step 1. Data identification #1
i. Internal discussion amongst partners about the approach to the C-ITS and ITS data
§ Long list of ITS initiatives (MS Excel)

D2.1 Overview of ITS initiatives in the EU and US
© NEWBITS consortium www.newbits-project.eu Page 32 of 211
Obj1: Acquire first rough inventory
ii. Desk research: acquiring basic
information about ITS initiatives
iii. Defining interviews and implementing
§ Template for interviews
Step 2. Defining the categorization framework
Obj2: Define systematization
Obj3: Identify criteria
i. Literature review of categorization approaches and assessment of results
ii. Systematic approach for a
categorization framework in NEWBITS
iii. Literature review and establishment of long list criteria
§ Long list of criteria (MS Word)
Step 3. Data identification # 2
Obj4: Acquire systematized inventory
i. Desk research: collection of data at ITS service level
§ Long List of ITS services (MS Excel)
§ Template for data gathering (MS Word)
Step 4. Validating the categorization method
Obj5: Validate categorization method
Obj6: Validate relevance criteria
i. Construct Decision Hierarchy
ii. Develop pairwise comparison
matrix iii. Internal voting process
iv. Synthetized judgements: weights v. Develop priority ranking and
categorization selection
§ Ranked categorization and criteria via AHP § MS Excel list of
Services
Step 5. Codification
Obj7: Codify and organize data
i. Identification of subcategories for service differentiation
ii. Tabular one-to-one mapping iii. Three-dimensional mapping
iv. Extended visualization
§ Diverse mapping outcomes
Table 1 Overview of steps, processes and tools

D2.1 Overview of ITS initiatives in the EU and US
© NEWBITS consortium www.newbits-project.eu Page 33 of 211
2.6 Boundaries of D2.1 approach The field of ITS applications and services is complex, highly dynamic and interdisciplinary. Though it would have been very interesting to deploy a holistic approach to the domain, it is not the intention of this deliverable to do so but to establish a valid categorization that facilitates the sub-objectives as stated in figure 3 of this section.
This means reversely that some still interesting issues and applications cannot be considered at this stage of the project. In this subsection, we have highlighted two higher level concepts under current development in the ITS domain that besides being extremely relevant, are not directly approached in D2.1 though they are transversally taken into account and will be considered in future work deployed by the NEWBITS project. Those are the “Multiple Servicizing Concept” and the “Connected and Automated Transport”.
Multiple Servicizing concept The transport sector has witnessed a paradigm shift in the recent years, shifting the focus from movement to creation of access (Litman, 2013). The impossibility to exponentially increase the infrastructure capacity (at least in urban areas), and the irruption of new technologies facilitating a more efficient and affordable transport organization, have pushed towards an increased multimodal approach. The increased deployment of a combination of ITS is enabling a more efficient utilization of resources, including infrastructure and fleets, improved fluidity of traffic and enhanced provision of mobility services. This trend has favoured the inclusion of new actors in the provision of mobility and transport services (telecom operators, online mobility booking agencies, payment engine platforms, technology solution providers and mobility integrators). Transport sector is not isolated from the global changes that are pushing from the supplier value chain to the value network of all stakeholders (“balanced centricity”) and services, as a new paradigm towards a Service Economy. As a matter of fact, recent development in the transport domain are showing an increased focus in the design of service systems for business and societal purposes, generating a new context and culture in which the focus is on mobility demand (not only offer), and in which ITS have a key role in the mobility management. This shift towards customer/user satisfaction needs is commonly referred as “servicizing”. Plainly speaking, servicizing refers to a phenomenon in which the organizing and selection action is bought and performed by someone else, and customers receive merely the outcome of the actions (Heikkilä, 2014). Servicizing concept is aligned with the Service Dominant (S-D) Logic defined by Lusch and Vargo, in which the concept of service is given a new meaning, going from an undefined input to the value of the output and value-in-use or in a more generalized way to value-in-context. Service is the fundamental basis of exchange and goods are merely distribution mechanisms of service. A service provider can only offer a value proposition to the market; the beneficiaries are always co-creators of value. The network aspect is implicit through the statement that all social and economic actors are co-creators and resource integrators,

D2.1 Overview of ITS initiatives in the EU and US
© NEWBITS consortium www.newbits-project.eu Page 34 of 211
implying that value creation takes place through interaction in complex networks and systems (Vargo and Lusch, 2004). NEWBITS project is aligned with this logic, considering services at the core of the methodological approach, and setting the ground for a Value Network based analysis. In what regards to the ITS domain, the servicizing evolution has generated diverse frameworks in which a combination of ITS are deployed to enable higher level concepts or systems, deriving into a multiple servicizing. Examples of this are: Mobility as a Service (MaaS), a system in which a comprehensive range of mobility services are provided; Fleet as a Service (FaaS), a system in which fleets of vehicles are provided; Infrastructure as a Service (IaaS), a system in which infrastructure owners sell the right use it. Similar approach can be extracted from concepts like Bus Rapid Transit (DRT) and Buses with a High Level of Service (BHLS).
In order to ensure a valid categorization approach that served the purposes of the NEWBITS project, in this study we have attempted to consider ITS services “per se”, and not mobility services that make use of (several) ITS services such as MaaS or BHLS. These higher or multiple service level concepts (as an example, see text below a short description of MaaS) make extensive use of ITS and C-ITS services, and are stimulators of those, providing them a potential business case. We will consider them as enablers for ITS services. Thus, they will be discussed in NEWBITS Deliverable 2.2.
MaaS: Mobility as a Service Mobility-as-a-Service (MaaS), being a new transport paradigm, has many definitions. One of those defines MaaS as “an innovative operating model generating user-centric mobility and freight services based on a seamless, co-operative and sustainable transport system. The system builds upon fully utilizing digitalization and data, as well as strong cooperation with the public sector, business and users” (Huktalla et al, 2015)
MaaS describes the shift from personally owned modes of transport (vehicle, train ticket, taxi fare) towards mobility services that are consumed as a service. New mobility services fit into this framework very well.
Vehicle sharing, pop-up transport and self-driving vehicles are steps that reduce the need to own your own vehicle. Ultimately this would combine public and private transport and allow this to be payed using a single account. This requires cooperation between different transport providers.
The development towards services has happened in other areas, for example Netflix for TV series and Spotify for music. Mobility would start with a travel advice that combines different modes of transport to give an advice based on your preferences. The customer could decide based on costs, time or comfort. The bookings and payment would then be done by the service provider. Payment could be in the form of a monthly subscription or pay-as-you-go.

D2.1 Overview of ITS initiatives in the EU and US
© NEWBITS consortium www.newbits-project.eu Page 35 of 211
Figure 5 Mobility as a Service Framework Source: LVM (2016)
Connected, cooperative and automated transport Cooperative ITS are closely related to connected and automated transport, as is illustrated by Figure 6. Connected and cooperative transport are often used interchangeably, although they refer to different concepts (see also Figure 7). Connected vehicles/drivers are connected to the internet by a service provider (via a cloud), either directly or by smartphone integration (Scholliers, 2016). The vehicle/driver is always connected to a single operator, i.e. the OEM cloud or the service provider cloud (in case of smartphone integration) by cellular communication technologies.
Cooperative vehicles/drivers, on the other hand, are directly connected to the infrastructure or to other vehicles (by using direct wireless communication technologies), providing them the opportunity to exchange information directly. These differences between cooperative and connected transport is also reflected by the related ITS services, as is shown in Figure 6.

D2.1 Overview of ITS initiatives in the EU and US
© NEWBITS consortium www.newbits-project.eu Page 36 of 211
Figure 6 Relation between connected, cooperative and automated services
Source: Amsterdam Group (2016)
Figure 7 Difference between connected and cooperative transport Source: Based on Scholliers (2016)
Highly cooperative systems may provide the opportunity to automate specific functions of the vehicle, leading to semi-automated vehicles. By making vehicles and infrastructure more and more cooperative, they will become able to drive automatically in the end. Cooperative services may, therefore, be a first step to automated transport.
However, as discussed by Rathenau Instituut (2015), this is just one possible pathway to automated transport. Another pathway, based on highly intelligent autonomous vehicles (robot vehicles), is possible as well (see the textbox below).
Service provider 3
Service provider 2
Service provider 1
Vehicle 1 Vehicle 2 Vehicle 3 Vehicle 2
Vehicle 3Vehicle 1
Infrastructure
Connected transport Cooperative transport

D2.1 Overview of ITS initiatives in the EU and US
© NEWBITS consortium www.newbits-project.eu Page 37 of 211
Robotic vehicles Increasing levels of cooperative transport may be one pathway to the development of fully automated vehicles. However, there is another pathway to this destination, based on the intelligence of the vehicles themselves (Rathenau Instituut, 2015). By using sensor technology, cameras, GPS, radar and support programmes, vehicles can autonomously ‘read’ their environment and on that basis, take over the tasks of the driver. As these vehicles do not depend on cooperative communication systems, they are often referred to as autonomous or robotic vehicles. Google car and Tesla’s autopilot are examples of this type of vehicles. In contrast to cooperative vehicles, which will gradually evolve towards automated vehicles, robotic vehicles are a more disruptive innovation, aiming to switch to automated vehicles at once.
Connected and Automated Vehicles can be considered as a systemic integration of diverse technology blocks, emerged from diverse Automotive Electronics and Communications communities (Underwood, 2015). Figure 7 summarizes the complexity behind the connected autonomy in terms of the communities involved in the design of the automated and connected vehicle:
Figure 8 Four Automotive Electronics and Communications technology communities Source: Underwood (2015)
This study aims at providing an overall framework for ITS, with special focus on Cooperative ITS services. However, it should be noticed that within the range of C-ITS services, some are

D2.1 Overview of ITS initiatives in the EU and US
© NEWBITS consortium www.newbits-project.eu Page 38 of 211
closely related to connected services while others supply a lot of automated functions. In other words, C-ITS services may differ in the level of cooperation they require between vehicles or between vehicles and infrastructure.
NEWBITS will consider Connected Autonomy as a systemic enabler of C-ITS services: when the vehicles systems are connected with the environment, an additional layer of benefits enhancing network management and relieving congestion can be achieved. Thus, they will be assessed and discussed in NEWBITS Deliverable 2.2.

D2.1 Overview of ITS initiatives in the EU and US
© NEWBITS consortium www.newbits-project.eu Page 39 of 211
3. Data Identification and definition of the categorization framework As stated in Chapter 2 of this document, the proposed methodology for Deliverable 2.1 is based on an iterative 3 stage process, which relies on 5 implementation steps. This chapter englobes the 3 first steps of the Deliverable 2.1 method, namely: data identification at initiative level (step 1), definition of the categorization method (step 2), and data identification at service level (step 3). In essence, this chapter engages with a first approach to the ITS and C-ITS domain and an initial data gathering of a number of highly heterogeneous initiatives (Step 1). Upon the results of this initial search and collection of structured data, and the outcomes of semi-structured interviews to a number of experts, the consortium engaged in step 2 a thorough assessment of the categorization framework in order to establish a valid approach for NEWBITS project holistically. Thus, considering all the inter-relations existing in the diverse activities of the project. The main outcome of Step 2 has been the reinforced assumption, already considered in the very beginning of project launching at Kick off Meeting, of the need to focus the categorization at a market level, and thus, the need to deploy a second data identification this time focused at service level (meso level). Step 3 represents the first key iteration in the methodological process, deploying a data identification and collection at ITS and C-ITS level to allow a categorization which results valid for NEWBITS objectives, ultimate purpose of this deliverable. The following sections in this chapter will further elaborate on the processes adopted and activities undertaken by NEWBITS partners during the abovementioned 3 steps, and provide with an assessment of the results and outputs generated.
3.1 Step 1. Data identification (#1) The approach used to capture, describe, and subsequently categorize the data depends on the type of knowledge and data. Deliverable 2.1 defined a number of higher level attributes or sources to guide the data identification already at proposal stage. Those are considered as Initiatives: FP7/H2020 projects, scientific papers, research reports, policy and other strategic reports (reference: NEWBITS GA). According to the nature of the data sources, considered mostly as explicit knowledge (public and accessible), the consortium defined a process of data identification and collection based essentially in internal discussion and reviewing of reports and literature. Nevertheless, due to the complexity of ITS domain, NEWBITS partners also designed a sub-process to include tacit knowledge capture at individual level, by defining and carrying out semi-structured interviews with experts. Therefore, the data identification in Step 1 has been implemented following three interconnected processes:
i. Internal discussion amongst partners about the approach to the C-ITS and ITS data

D2.1 Overview of ITS initiatives in the EU and US
© NEWBITS consortium www.newbits-project.eu Page 40 of 211
ii. Desk research: acquiring basic information about ITS initiatives iii. Defining interviews and implementing
The description of the activities and outcomes derived from the three abovementioned processes are explained in the following lines.
3.1.1 Internal discussion amongst partners about the approach to the data In order to facilitate the gathering of data NEWBITS partners have decided on the approach to be taken. The internal discussion on the approach to be followed was focused on two elements: the scope of the research, and the process of gathering data. Data gathering in this stage is concentrated at initiative level (macro level) as described in DoW. No distinction amongst types of modes is made, thus including passenger and freight transport as well as urban and interurban transport. Supportive actions and policies will be discussed in later stages of the NEWBITS project such as the analysis of enablers and barriers in task 2.2 (“Assessment of existing KPIs and barriers for implementation of C-ITS”) and during task 3.3 (“Benchmarking ITS innovation diffusion and ITS production processes EU vs. US”), therefore they are not fully considered in this stage rather than at the framework level in which they are defined. FP7/H2020 projects, national projects, scientific papers and research reports, and other types of literature and reports where therefore considered as main sources for the data capturing and description. The method deployed to capture the existing knowledge is adapted to the nature of the data (initiatives). In this sense, it was agreed that initiatives were clearly explicit knowledge, being the data available and well described, though might require to abstract or summarize the content in order to fit the task purposes. Thus, a desk research approach to collect data from existing sources was approved to be the most appropriate method. In parallel, NEWBITS partners considered the need to include tacit knowledge capture at individual level (knowledge acquisition from individuals) as a valuable expertise transfer from a knowledge source (experts) towards a knowledge repository (long list of initiatives). Following classic theory about the approaches to deploy knowledge acquisition from individuals and groups (Parsaye, 1988), the integration of tacit knowledge was decided to be at an individual level, defining semi-structured interviews to a number of selected experts from a long list generated by NEWBITS consortium. Interviews would primarily support the process of data gathering of relevant initiatives and furthermore, gather data relevant for Task 2.2 by including questions on barriers and enablers of ITS. In this way, the added value of interviews would extend beyond Task 2.1. The outcome of the discussion was an agreement among the partners involved about the initial data gathering of initiatives. All partners would search for references to generate a long list of relevant interviewees and a long list of relevant reports and literature (initiatives).

D2.1 Overview of ITS initiatives in the EU and US
© NEWBITS consortium www.newbits-project.eu Page 41 of 211
Moreover, further discussion was held in order to define the most appropriate level of data gathering to be conducted in the next process, as well as the most effective tools. After several rounds of communication, and initial un-structured approximation to the knowledge base object of study, partners agreed on the need to group the defined initiatives into two blocks: Projects and Other (reports-studies), and elaborate simple, yet specific data gathering tools for each, in order to be able to provide with basic information for each of those. In this sense, two fiches were developed in MS Word in order to facilitate the data identification in the next process, as summarized in the following tables: Initiative: Relevant studies Basic Information Authors Title Dates Link
Brief summary
Type of study Grey literature Scientific
study/paper Policy document
Table 2 Basic data parameters for Initiatives-Other Initiative: H2020 and FP7 projects Basic Information Acronym Title Dates
Description
Contact info Person Organization Project web
Table 3 Basic data parameters for Initiatives-Project In consideration of the main output expected for this step, a long list of initiatives configuring a rough inventory, partners agreed on the use of a MS Excel sheet to collate the future data, considering the basic information parameters as established in the above tables.
3.1.2 Desk research: acquiring of basic information of initiatives The process of desk research was engaged after the validation of the approach was confirmed in the prior process, and aimed at generating a long list of ITS and C-ITS initiatives. Partners devoted their efforts in approaching the knowledge base by means of:
• Consulting internal know-how • Internet research, including data-base access and information gathering • Review of literature • Contact with external ITS experts active at each organisation’s network’ level

D2.1 Overview of ITS initiatives in the EU and US
© NEWBITS consortium www.newbits-project.eu Page 42 of 211
As agreed in the prior phase, the Other-Initiatives data stream was intended to include the following types:
• Policy documents: Officially released documents and directives from National and EU or International policy makers
• Academic literature: Academic studies and scientific articles • Grey literature (IGLWG, 1995): Literature that is not realised via the traditional
commercial or academic distribution channels. Included are reports, roadmaps, and white papers from industry representatives, research institutes, and consultants among other institutes.
In what regards to the Project-Initiatives data stream, NEWBITS partners focalized the search and data gathering by utilizing databases that focus on FP7 and H2020 projects. In this sense, NEWBITS has made use of both TIPS (2013) and Transport Research & Innovation Portal (TRIP1) databases in order to track and acquire basic information about a number of FP7 and Horizon 2020 with relation to the field of ITS. A short analysis of the TRIP database, by selecting Intelligent Transport Systems in the search tool, showed that there is a vast amount of FP7 and H2020 projects in the field of ITS, being focused in very diverse areas of ITS. In order not to predetermine any parameter of relevance, the search was focalized in combining both ITS and C-ITS words. Thus, the information collected for FP7 and H2020 projects, as established in the fiches template (Table 3) includes basic information such as the project acronym and full title to retrace the project. Dates provide information on the duration of the projects. Main contact persons and organization are included to indicate possible interview candidates or primary sources of more information about the initiative. A brief description is provided to back-up further investigation in latter stages of the NEWBITS project. The desk research resulted in two differentiated streams of initiatives: 76 FP7/H2020 projects and 62 initiatives from other types (policy documents, academic/scientific documents and grey literature). The total initiatives are collated into Annex 1: Long list of initiatives. In the following tables, we provide with an overview and basic assessment of all initiatives collected at this stage, following the two abovementioned streams. Grey literature The table below illustrates the grey literature indicated by NEWBITS partners during the process of data gathering:
1 TRIP is a single portal for information on all transport research and innovation conducted at European and national levels. Their website is: http://www.transport-research.info/

D2.1 Overview of ITS initiatives in the EU and US
© NEWBITS consortium www.newbits-project.eu Page 43 of 211
Title Authors YearAutomated,ConnectedandElectricVehicleSystems.Expertforecastandroadmapforsustainabletransportation
InstituteforAdvancedVehicleSystems,UniversityofMichigan(USA)
2015
C-ITSfinalReport C-ITSplatform 2016C-ITSintheUSA:AStatusUpdateon5.9GHzDSRC JohnB.KenneyToyotaInfo
TechnologyCentre,USA2016
CommunicationTechnologiesforfutureC-ITSservicescenarios
ERTICO 2015
ConnectedCarinEurope Pac 2015ConvergingRoads-Linkingself-drivingcarstopublicgoals RathenauInstitute 2015GuideabouttechnologiesforfutureC-ITSservicescenarios ERTICO 2015StatusofITSCommunicationStandards EU-USITSTaskForce 2012IntelligentTransportationSystems,ExplaininginternationalITapplicationleadership
ITIF 2010
IntelligentTransportationSystems.Benefits,CostsandLessonsLearnt2014Report
USDoT,ITSJointProgrammeOffice
2014
ITSStrategicPlan2013-2018“DeliveringSafer,moreefficient,moresustainablemobilitysolutions
ITSAustralia 2012
Planningforthefutureoftransportation:connectedvehiclesandITS
USDoT 2015
Qualityontrafficinformation TISA 2016ResearchThemeAnalysisReport-CooperativeIntelligentTransportSystems
TransportResearch&InnovationPortal(TRIP)
2016
RoadmapbetweenautomotiveindustryandinfrastructureorganisationsoninitialdeploymentofCooperativeITSinEurope
AmsterdamGroup 2013
RoadmapforpromotingITS–20globalactions–2014/2020 UNECE(UnitedNationsEconomicCommissionforEurope)
2014
SafetyApplicationsofITSinEUandJapan,InternationalTechnologyScanningProgram
USDoT,FederalHighwayadministration
2006
SmartTransportforAustralia,Enhancingliveablecitiesandcommunities
ITSAustralia 2016
TISApositionconcerningapublicconsultationoftheEuropeanCommissionontheProvisionofEU-wideReal-timeTrafficInformationServices
TISA 2014
TISAProvisionofEU-widemultimodaltravelinformationservices
TISA 2015
TowardsanarchitectureforCITSapplicationsintheNetherlands
BETA 2015
TripC-ITS Trip 2016Websitereportonstate-of-the-artstrategyforC-ITSdeployment
OnnoTool,Rijkswaterstaat;FredVerweij,Rijkswaterstaat
2015
Whitepaperontruckplatooning TNO 2015 Table 4 Summary of Initiatives: Grey literature
All the initiatives have been published in a recent time span, and are considered to provide with a valid sample and overview of the state-of-the-art. Cooperative, connected and automated driving are topics that appear and are explained in several studies, especially in

D2.1 Overview of ITS initiatives in the EU and US
© NEWBITS consortium www.newbits-project.eu Page 44 of 211
the form of roadmaps and future guides. Literature also differs in the type and modes of transport. Certain studies focus at passenger transport while other focus on freight. Simultaneously, certain studies have a special focus on urban solutions following the intersection of Smart Cities and ITS. The topics of the literature in recent year is dominated by connected, cooperative and automated driving. The selected reports have been elaborated or commissioned by different organisations, including well known research institutes like TNO, BETA and the Rathenau Institute. European-level initiatives and platforms relevant in the ITS field, such as ERTICO, TRIP, Amsterdam group and the C-ITS platform, are another type of authors that has been considered in the data gathering as key source of grey literature. Furthermore, global coverage is provided by initiatives from the US Department of Transportation, the United Nations Economics Commission and ITS Australia. Policy documents The table below illustrates the policy documents indicated by the NEWBITS consortium. Title Authors YearCooperativeITSRegulatoryPolicyIssuesDiscussionPaper
MarcusBurkeandJamesWilliams,NTAAustralia
2012
ITSActionPlan AlgoéConsultantsSA,RappTrans,AlainBensoussanAvocats,LibertyIncentives&Congresses
2012
Guidelinesforpolicymakers:policychallengesonthewaytothedevelopmentofCVIS
FVerweij,NHoose,SSondeijker,MKuiken,JPommerandWSavenije
2010
AMasterPlanforthedeploymentofInteroperableCooperativeIntelligentTransportSystemsintheEU
EuropeanCommissionCommunication
2016
KeyPerformanceIndicators(KPIs)forroadtransportIntelligentTransportSystems(ITS),
AECOMforDGMOVE 2015
ITSActionPlanActionB-EU-widereal-timetrafficinformationservices
TomvandeVen,MarkWedlock(RAPPTRANS)forDGMOVE
2014
AllWaysTravelling:TodevelopandvalidateaEuropeanpassengertransportinformationandbookingsystemacrosstransportmodes
ZeppelinUniversity,Amadeus,Thales,UNIFE,IATA
2014
ITSActionPlanStudyregardingReservationServicesforSafeandSecureParkingPlacesforTrucksandCommercialVehicles
HugoChauvin,CornelievanDriel,Karl-GerhardFreyer,PhilippeGaches,PeterRapp,IanWilkinson
2013
Mid-termevaluationoftheimplementationoftheITSActionPlan
Ramboll 2013
ITSActionPlanActionC-FreeRoadSafetyTrafficInformation
TomvandeVen,MarkWedlock(RAPPTRANS)forDGMOVE
2013
CooperativeIntelligentTransportSystemsandServices
StefanKlug,BerndBeckert(FraunhoferISI/D)
2013
USDoTITSStrategicPlan2015-2019 USDOT 2014ITSinitiativeinJapan Ministryofland,infrastructures,
transportandTourism2014
CooperativeIntelligentTransportSystemsandServices(C-ITS)
SmartCitiesStakeholderPlatform
2013

D2.1 Overview of ITS initiatives in the EU and US
© NEWBITS consortium www.newbits-project.eu Page 45 of 211
Table 5 Summary of Initiatives: Policy documents
In EU, the ITS Action Plan and directive have a predominant role, and have resulted in a variety of documents. Similarly, in the United States the Department of Transportation has issued the ITS Strategic Plan which can be considered the critical framework document for ITS. Due to the timing of the strategic plans most policy documents are published in 2013 and 2014. Authors are policy makers or research institutes and industry experts commissioned by those. The policy papers are either focused in specific areas or tackle ITS broadly. Scientific reports Title Authors YearTrafficmanagement2.0-TheWin-Win KarlRehrletal. 2016Trafficmanagementofthefutureandroadautomation
EvangeliaPortoulietal. 2016
IntelligentTransportSystems(ITS);DecentralizedCongestionControlMechanismsforIntelligentTransportSystemsoperatinginthe5GHzrange;
EuropeanTelecommunicationsStandardsInstitute
2011
Aco-operativemethodologytoestimatecarfuelconsumptionbyusingsmartphonesensors;EcosmartandTutorDrive:toolsforfuelconsumptionreduction
VittorioAstarita,GiuseppeGuido,DomenicoMongelli&VincenzoPasqualeGiofrè
2015
Coordinatingdangerousgoodsvehicles:C-ITSapplicationsforsaferoadtunnels
LeiChenetal. 2015
PerformancestudyofaGreenLightOptimizedSpeedAdvisory(GLOSA)applicationusinganintegratedcooperativeITSsimulationplatform
KonstantinosKatsaros,RalfKernchen,MehrdadDianati,DavidRieck
2011
TheGrandCooperativeDrivingChallenge2016:boostingtheintroductionofcooperativeautomatedvehicles
CristoferEnglundet.al 2016
CooperativeITS—EUstandardstoacceleratecooperativemobility
LeiChenandCristoferEnglund 2014
ImpactanalysisoftheecoApproachadviceapplication RobbinBlokpoel,Md.FaqhrulIslam,JaapVreeswijk
2014
SoCar:ASocialCar2CarFrameworktoRefineRoutesInformationBasedonRoadEventsandGPS
WalterBalzano,MariaRosariaDelSorbo,DomenicoDelPrete
2015
DeploymentPathAnalysisforCooperativeITSSystems StevenE.Shladover 2008TowardsanArchitectureforCooperative-IntelligentTransportSystem(C-ITS)ApplicationsintheNetherlands
MarcelvanSambeeket.Al 2015
iTETRIS:Amodularsimulationplatformforthelarge-scaleevaluationofcooperativeITSapplications
MicheleRondinoneetal. 2013
C-ITSandServices KarlOskarProskawetz 2013TowardsaReferenceArchitectureforaCollaborativeIntelligentTransportSystemInfrastructure
A.LuisOsorioetal 2014
CooperativeITSstandardsinEurope(IEEECom.Mag) AndreasFestagTUDresden 2014DeploymentPathAnalysisforCooperativeITSSystems StevenE.Shladover,UCBerkeley 2009ASurveyofIntelligentTransportationSystems Sheng-HaiAn,UniversityofSouth
Korea2011
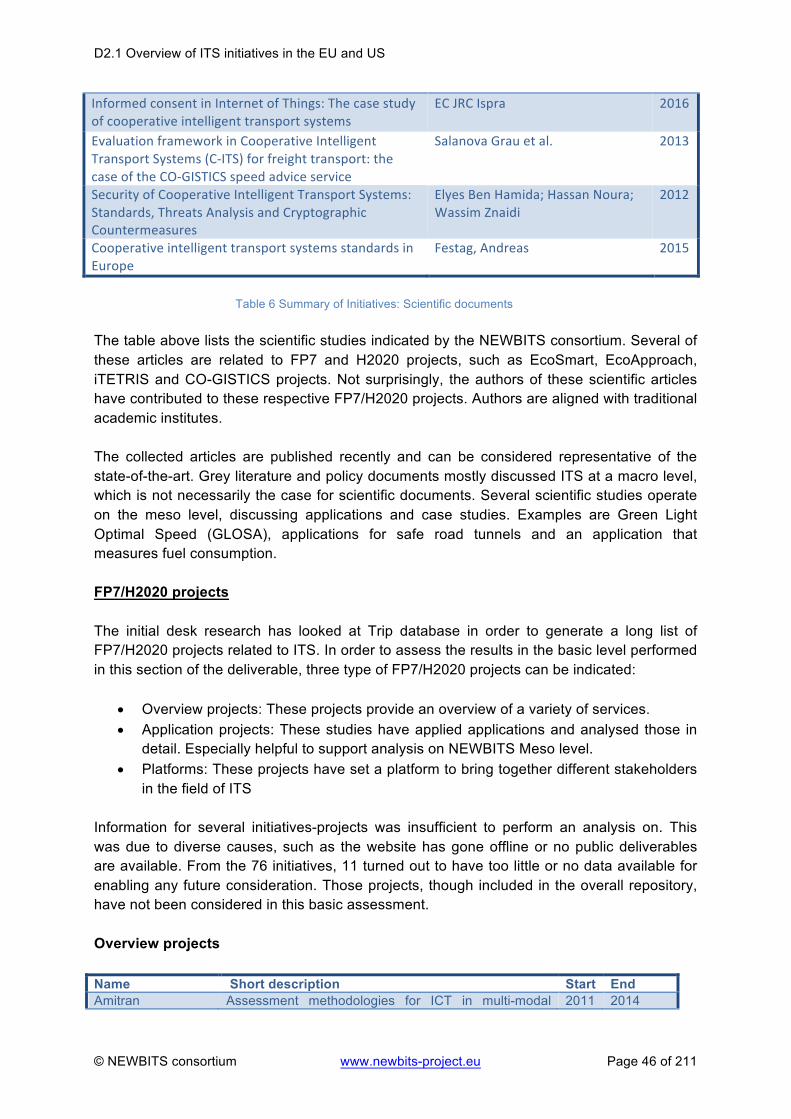
D2.1 Overview of ITS initiatives in the EU and US
© NEWBITS consortium www.newbits-project.eu Page 46 of 211
InformedconsentinInternetofThings:Thecasestudyofcooperativeintelligenttransportsystems
ECJRCIspra 2016
EvaluationframeworkinCooperativeIntelligentTransportSystems(C-ITS)forfreighttransport:thecaseoftheCO-GISTICSspeedadviceservice
SalanovaGrauetal. 2013
SecurityofCooperativeIntelligentTransportSystems:Standards,ThreatsAnalysisandCryptographicCountermeasures
ElyesBenHamida;HassanNoura;WassimZnaidi
2012
CooperativeintelligenttransportsystemsstandardsinEurope
Festag,Andreas 2015
Table 6 Summary of Initiatives: Scientific documents
The table above lists the scientific studies indicated by the NEWBITS consortium. Several of these articles are related to FP7 and H2020 projects, such as EcoSmart, EcoApproach, iTETRIS and CO-GISTICS projects. Not surprisingly, the authors of these scientific articles have contributed to these respective FP7/H2020 projects. Authors are aligned with traditional academic institutes. The collected articles are published recently and can be considered representative of the state-of-the-art. Grey literature and policy documents mostly discussed ITS at a macro level, which is not necessarily the case for scientific documents. Several scientific studies operate on the meso level, discussing applications and case studies. Examples are Green Light Optimal Speed (GLOSA), applications for safe road tunnels and an application that measures fuel consumption. FP7/H2020 projects The initial desk research has looked at Trip database in order to generate a long list of FP7/H2020 projects related to ITS. In order to assess the results in the basic level performed in this section of the deliverable, three type of FP7/H2020 projects can be indicated:
• Overview projects: These projects provide an overview of a variety of services. • Application projects: These studies have applied applications and analysed those in
detail. Especially helpful to support analysis on NEWBITS Meso level. • Platforms: These projects have set a platform to bring together different stakeholders
in the field of ITS Information for several initiatives-projects was insufficient to perform an analysis on. This was due to diverse causes, such as the website has gone offline or no public deliverables are available. From the 76 initiatives, 11 turned out to have too little or no data available for enabling any future consideration. Those projects, though included in the overall repository, have not been considered in this basic assessment. Overview projects Name Short description Start End Amitran Assessment methodologies for ICT in multi-modal 2011 2014

D2.1 Overview of ITS initiatives in the EU and US
© NEWBITS consortium www.newbits-project.eu Page 47 of 211
transport from user behavior to C02 reduction Cimec Cooperative ITS for mobility in European cities 2015 2017 Co-cities Cooperative cities extend and validate mobility
services 2011 2013
Comesafety2 Communications for e-safety 2011 2014 Cover Coordination of vehicle and road safety initiatives 2009 2013 Ecomove Cooperative mobility systems and energy services 2010 2014 Efuture Efficient mobility 2010 2013 Icar support Intelligent car support 2009 2012 Optimism Optimizing passenger transport information 2011 2015 Race2050 Future outlook to mobility Scout Safe and connected automation in road transport 2016 2018 Tips Transport R&D for innovation 2012 Ongoing Ttrans ITS products and services to market 2012 2014 Ttrim Tomorrow's road infrastructure monitoring and
management 2011 2014
Usemobility Analysis of European mobility behavior 2011 2015 Table 7 Summary of projects: Overview
The projects indicated above touch up on topics like vehicle communication, transport innovation, automated driving and other developments at a macro level. The gathered projects are state-of-the-art that have just finished or are still deployed. Application projects Name Short description Start End 79ghz 79GHZ communication test 2012 2014 Adaptive Automated driving demonstration 2014 Ongoing Assess Assessment of Integrated vehicle safety
systems 2009 2013
Carnet Rapid data communication network for connected cars
2015 2017
Cogistics Cooperative logistics 2014 2016 Colombo Cooperative self organizing system for low
carbon mobility at low penetration rates 2012 2015
Companion Cooperative mobility solution for supervised platooning
2013 2016
Compass4d Cooperative driving solutions 2012 2015 Drive c2x Accelerate cooperative mobility 2010 2014 Ecogem Cooperative Advanced Driver Assistance
System for Green Cars 2010 2013
Eurofot European Field operational test on active safety systems
2008 2012
Fotsis European Field operational test on safe, intelligent and sustainable road operation
2011 2015
Hights Precise location 2015 2018 Inroads Intelligent Renewable Optical advisory System 2011 2015 Intersafe Cooperative intersection safety 2008 2011 Local 4 global System-of-systems that act locally for
optimizing globally 2013 2016
Mobility 2.0 Toolset for urban electro-mobility 2012 2015 Mobincity Smart Mobility in Smart City 2014 2015 Preserve Secure v2x communication 2011 2015 Roadart Research on alternative diversity aspects for
trucks 2015 2018

D2.1 Overview of ITS initiatives in the EU and US
© NEWBITS consortium www.newbits-project.eu Page 48 of 211
Satre Safe road trains for the environment 2009 2012 Straightsol Strategies for smarter urban freight solutions 2011 2014 Timon Enhanced real time services 2015 2018
Table 8 Summary of Projects: Application The table above indicates projects that research deployment of specific applications. Tested services include platooning, advanced driver assistance systems, cooperative intersection safety among others. These projects have the possibility to discuss case studies that are relevant for the NEWBITS project. Start and end dates exemplify that the selected studies are among the state-of-the-art. Platform Projects Name Short description Start End Codecs Cooperative its deployment coordination support 2015 2018 ITS observatory
ITS observatory 2014 Ongoing
Nearctis Excellence in co-operative traffic management 2011 2013 Fot-net Field Operational Test Networking and Data Sharing
Support 2014 2016
Vra Vehicle and Road Automation 2013 2016 Civitas Cleaner and better transport in cites 2002 2016 Eranet European research network area Ongoing Etna 2020 European transport network alliance 2016 2019 Euridice European inter-disciplinary research on intelligent
cargo for efficient, safe and environmental-friendly logistics
2008 2012
Centrico Central European region transport telematics implementation project
2001 2006
Table 9 Summary of Projects: Platform
As stated previously, platform based projects bring different stakeholders within the field of ITS together. The above table shows the list of those identified in this step of NEWBITS. In essence, the process of data gathering at initiative level has shown a large variety of sources. Policy documents, Scientific articles, diverse types of grey literature and many FP7/H2020 projects have been indicated by our initial data gathering in the inventory. The wide spectrum of ITS has resulted in diverse topics for studies.
3.1.3 Defining interviews and implementing
In order to complemented the data gathered via desk research, interviews with experts in the field of ITS have been conducted. The goal of these interviews was to include tacit knowledge of experts during the data gathering. Furthermore, the output of the interviews helped to determine the approach of the categorization. NEWBITS partners carried out a

D2.1 Overview of ITS initiatives in the EU and US
© NEWBITS consortium www.newbits-project.eu Page 49 of 211
desk research that resulted in a long list of interview candidates, which has been used as repository to select a short list of candidates to implement the interviews. This section will elaborate how the interview candidates have been selected, the approach followed and the general results of the interviews. In order to detect and gather information on possible relevant interviewees, two complementary guiding criteria were agreed:
- Partners should focus on possible experts related to the already identified initiatives (long list of initiatives).
- Relevant interviewees should be representative of the NEWBITS target groups, precisely: ITS developers and providers, Academia and Research, Public Actors (infrastructure managers, transport authorities, operators) and Policy Makers.
Information for possible candidates is collected via a MS Excel sheet (Long List of Candidates) which included the name of candidate, organization of the candidate, nationality of the candidate, expertise of the candidate and contact information. The long list included 108 possible interviewees from a variety of organizations from SMEs to large multinational firms and from local to European level including: national ITS organizations and associations, Service providers, Universities and Research Centers, Transport and ICT specialized consultancies, Transport Authorities and Policy makers. The experts were representative Experts from the US and Australia have been also considered to provide coverage in the two relevant regions of NEWBITS besides the European Union. In order to generate a short list which resulted representative, 3 criteria have been determined by the NEWBITS consortium:
• Single-Organization representation. Several candidates on the long list were affiliated to the same organization. Based on an internet search and LinkedIn® scan, it was investigated which candidate had more “visible” expertise in the field of ITS. This process resulted in One primary candidate per organization was established in the short list, while others would function as in reserve-list mode.
• Variety of regions. Special attention was paid in order to include experts from different regional areas inside and outside Europe.
• Variety of organizations, covering as much as possible the range of NEWBITS target groups as indicated for the long list, while ensuring a balance amongst those.
• Involvement in projects. Based on an internet search and LinkedIn® scan, it has been assessed whether the listed candidate has participated in projects and events.
The resulting short list included 17 experts in the field of ITS which were considered to fulfill the above-mentioned criteria. Having the repository of experts streamlined, partners proceeded to design the template for the interviews. The expected inputs from the interviews where two-fold. Primarily the goal was to complement and support the data gathering process of initiatives. However, there was also a qualitative element considered extract the knowledge of the experts towards ensuring cohesion on the data gathered. Due to the diverse expertise of the candidates the interview format is used as a general guideline rather than a strict questionnaire. Interviewers had the

D2.1 Overview of ITS initiatives in the EU and US
© NEWBITS consortium www.newbits-project.eu Page 50 of 211
freedom to go beyond format to make the best use of the knowledge of the interviewed experts. The format of the interview is shown in the Appendix 2: Interview Format of this document. In essence, experts have been asked in 4 blocks of questions covering:
§ General Information about the role of their organization in the ITS domain § Vision for C-ITS applications (main applications, future trends, primary benefit of ITS) § KPIs, barriers and enablers § Open questions
NEWBITS partners have finally interviewed in total 12 experts, which are listed in the table below.
Interviewee
Country Organisation
Alessandro Lue Italy Poliedra Andre Perpey France Geoloc Systems Avery Ash United States INRIX Claus Doll Germany Fraunhofer Eric Koenders Netherlands Dynniq Evangelos Mitsakis Greece Hellenic Institute of Transport Fabio Nussio Italy Rome Mobility Agency Jose Martinez Spain CTAG Kerry Malone Netherlands TNO Lluís Alegre Spain Metropolitan Transport
Authority Martin Bohm Austria Austriatech Mohamad Talas United States NY Department of
Transportation Vladislav Maraš Serbia University of Belgrade
Table 10 List of Interviewees
The interviewed experts work for a variety of organizations including universities, public authorities, research institutes and service providers. Two interviews with candidates from the United States have been conducted to ensure NEWBITS supra-regional coverage. During the interviews a large variety of initiatives have been mentioned. Some of these initiatives resulted as input for process ii. Simultaneously, most the initiatives discussed by the experts operated on the service level, resulting in meaningful discussions with the experts. For example, the added value of ITS applications was discussed by providing examples like road works warning systems and advanced traffic signal control. One of the key takeaways from the interviews is that projects are directly linked with the services that they offer. Furthermore, services determine the benefits of Intelligent Transport Systems as well as the image for end users. Due to the interest of NEWBITS in focalizing the interviews within a C-ITS framework (whenever possible), the developments in automated, connected and cooperative driving have been introduced. The interviews helped NEWBITS consortium to further understand the

D2.1 Overview of ITS initiatives in the EU and US
© NEWBITS consortium www.newbits-project.eu Page 51 of 211
relation between these areas. One of the key findings was that developments in these three areas not necessarily complement each other. Different future paths of development are possible, depending on (international) cooperation between all stakeholders.
3.2 Step 2. Defining the categorization method (conceptualization #1)
After concluding step 1 with a rough inventory of data at initiative level, a first attempt to provide a valid framework for the data modelling and categorization was implemented in step 2.
The results from step 1 at initiative (macro) level showed a high conceptual and contextual disparity, based on the own heterogeneous and unparalleled character of the elements involved in the data identification: FP7/H2020 projects, scientific papers, research reports, policy and other strategic reports.
This highly heterogeneous level of analysis based on the macro level was already highlighted at the start of project implementation, with most partners showing their concern about the feasibility to perform a valid categorization exercise at the initiative framework. In order to formalize a valid approach for knowledge conceptualization, consortium partners engaged in step 2 a process to assess the categorization framework and context more appropriate for NEWBITS overall objectives, and WP2 and Task 2.1 specific objectives.
This initial conceptualization stage has been implemented by deploying the following processes:
i. Literature review of categorization approach and assessment ii. Systematic approach for categorization in NEWBITS iii. Literature review and establishment of long list criteria
The description of the activities and outcomes derived from the three abovementioned processes are explained in the following lines.
3.2.1 Literature review of categorization approach and assessment
The key assumption guiding this step has been the need to assess the nature of the diverse possible categorization and systematization methods and frameworks, and the ways in which those are applied, in order to determine what methodological approach is more useful for NEWBITS purposes.
To come up with a well-defined categorisation of ITS fitting the objectives of Task 2.1 (and the interlinks existing with the diverse tasks throughout the project), it was first important to identify the relevant concepts in NEWBITS context.

D2.1 Overview of ITS initiatives in the EU and US
© NEWBITS consortium www.newbits-project.eu Page 52 of 211
From the DoW, the relevant requirements are focused on market analysis, stakeholder analysis, users and their preferences (need and demand), and the value network analysis. Thus, the first conclusion reached by partners was that the level of categorisation for NEWBITS should be at a level that would allow “making categories” based on those project requirements.
NEWBITS consortium followed the premise of considering classification and categorization systems in a broad sense, as having an important role in business decision-making tasks by classifying the available information on some criteria (Kiang, 2003).
The vast literature existing on categorization methods, concept and approach, and the highly interdisciplinary character of categorization approaches applied from Cognitive Science to Machine Learning, advised NEWBITS to concentrate the literature search in categorization models at ITS level. Thus, the second conclusion was to concentrate the efforts in the different ways proposed in the literature to categorize ITS.
From the scientific literature reviewed, some systematizations are based on single dimensional categorisation based on technological perspective (Figueredo et al, 2001; Perallos et al, 2015), market areas (McQueen et al, 1999) or a multidimensional approach based on application areas (Kanminen, 1995; Samper et al, 2006; RITA, 2009; Toral et al, 2010). Technology based categorisation Technology based categorisations tend to split ITS into different technology functions or technological architectures such as communication, navigation, hardware, in-vehicle etc. Those are composed by a combination of technologies. As stated in T-TRANS project Deliverable 3.1 ITS State of the art assessment (available online at: http://www.ttransnetwork.eu/ttrans/its-state-of-the-art-assessment/), “at technological point of view, there are similar approaches that classify technologies by their functions”. The following figure summarizes this statement:
ITSTechnologies
Function
Function
Function
TechnologyTechnology
TechnologyTechnology
TechnologyTechnology Technologies
Functions
Figure 9: ITS technologies and technology functions. Source: T-TRANS project
Technology based systematizations approach ITS as multisystem structures that combine tasks of management, information collection and actuation systems, and which have to be

D2.1 Overview of ITS initiatives in the EU and US
© NEWBITS consortium www.newbits-project.eu Page 53 of 211
synchronized to meet the objectives of the whole system. The focus of this approach tends to rely on the architecture of the system as key operative framework containing the set of common assumptions for the system itself (Perallos et al, 2015). At the broader level, ITS architectures integrate 3 main elements:
• The functions that are required for the systems (ITS) • The system partitioning into functional entities (Subsystems or modules) • The information and data flows that connect the functions and subsystems together
In this sense, there are several architectures of reference in EU and US that share the aim to help ITS providers and designers to define and plan effective operational systems that contribute to improve the mobility experience. Thus, they are often referenced in technology based systematizations. At EU level, the key reference is the European ITS Framework Architecture (FRAME), developed under the EU funded project KAREN (Keystone Architecture Required for European Networks). At US level, the reference is the National ITS Architecture. As a matter of fact, technology based categorizations based or derived from the broader system architectures, are quite helpful from the designer perspective and no doubt, a great enabler for an ITS initiative. However, they provide no real focus on the requirements of ITS users such as the needs, at least directly, since their goal is to frame the technological components in a given system, and/or map their interdependencies. Multidimensional approach based on ITS areas and application areas A multiplicity of strategic documents and scientific papers propose a diversity of approaches to ITS based-on areas and/or application areas, which tend to be then subdivided in sub-areas. Some of these studies are limited either in scope or focused in specific ITS subsystems. For instance, Kanninen provided back in 1995 a ITS structure based on three basic subsections:
• Advanced Traveller Information Systems (ATIS) • Automated Highway Systems (AHS) • Intelligent Transit Systems (ITS)
Samper et. al. (2006) for example give an insight into Traveller Information Systems, without considering the interconnections amongst other areas, sectors and subareas of ITS.
T-TRANS (2013) project performed an analysis of the main ITS areas and subareas following a number of references which identified 5 main areas:
• Information Services • Security, Safety and Control • Freight and logistics • Booking, Payment and Pricing • Traffic Management

D2.1 Overview of ITS initiatives in the EU and US
© NEWBITS consortium www.newbits-project.eu Page 54 of 211
The figure extracted summarizes the areas and subareas in relation to the sources found in diverse systematization studies:
Figure 10: Overview of ITS (sub) areas in the literature. Source: T-TRANS project
The ITS area oriented categorizations, despite providing a framework that tends to be aligned with ITS applications, offers a limited view on ITS and disregards many other possible application sectors being often relevant for the specificities of the studies in which they are deployed, but not considering a truly holistic approach to ITS. Still, the consideration of ITS areas tends to be relevant in order to define the ever-changing ITS domain.
Market areas based categorisation Following the roots of the above mentioned ITS area systematization, the market areas approach focuses on identifying ITS users and group them according to their needs and demands. ITS market areas have been defined as the groupings of ITS users, operators and procurers with similar needs and buying characteristics (McQueen, 1999).
Kannin
en(19
95)Die
bold(1
995)
Woott
onand
García
-Ortiz
(1995)
Weilan
d(1999
)Ins
tituteo
ftrans
portat
ionen
gineer
s(2000
)NV
FRoad
Transp
ortInf
ormatic
s(2002
)Sam
peret
al.(20
06)ITS
Japan
(2007)
RITAU
SDOT
(2009)
ECTra
nsport
(2012)
Aparic
io(201
2)
ITSarea ITSsubareaInformationServices x x x x x x x x x x x
PublicTransportInformation x x x x x x xIndividualTravellerInformation x x x x x x x x x x x
Security,SafetyandControl x x x x x x x x x xDriversAssistance x x x x xEmergencyManagement x x xCollisionManagement x x x xSafety&Security x x x x xControl x x x x x x x xSmartGrid
FreightandLogistics x x x x x xTransshipment xStorage xTransport x x x x
Booking,PaymentandPricing x x x x x x xElectronicPayment x x x x x x xPricing x xBooking x
TrafficManagement x x x x x x x x x xFleetManagement x x x xOperations&Maintenance x xDemandManagement x x x
Sources
ITSAREAS

D2.1 Overview of ITS initiatives in the EU and US
© NEWBITS consortium www.newbits-project.eu Page 55 of 211
There are several examples in the literature providing with a diversity of market segments or areas. Generally, these studies have great potential; however, they are based on theoretical research and limited data captured from a few sources. Toral et al (2010) identify nine market areas:
• Traffic management • Emergency management • Transportation planning • Traveller information • Commercial vehicles • Transit management • Intelligent vehicles • Incident management • Payment systems
From the industry research point of view, a wide variety of data sources are usually considered ranging from independent studies, government and regulatory published materials, technical journals, to trade magazines. Two of such recent studies (ITS Market Analysis, 2016; ITS Market Insight, 2016) segment ITS market by component, type, and application. The first component segment relates to market characterised by technology, comprising surveillance camera, interface board, monitoring & detecting system, telecommunication network, software and others. The second classification by type segments the market into:
• Advanced Traveller Information System (ATIS) • Advanced Traffic Management System (ATMS) • Advanced transportation pricing system (ATPS) • Advanced public transportation system (APTS) • Cooperative vehicle system (CVS).
The third segment by application is divided into eight categories namely.
• Traffic management • Road safety and security • Freight management • Public transport • Environment protection • Automotive telematics • Parking management • Road user charging

D2.1 Overview of ITS initiatives in the EU and US
© NEWBITS consortium www.newbits-project.eu Page 56 of 211
These results emanated from exhaustive research employing well-founded statistical and mathematical analysis tools like weighted average analysis, correlation, regression and time-series analysis, which have been verified by key industry participants. Other business research reports (Markets and Markets 2014) have also expanded the market categorisation to the geographical level namely North America, Europe, APAC, and Rest of the World. Since the geographical coverage of NEWBITS has a limited scope out of Europe, covering only some initiatives from the US and Australia, the latter categorisation has little impact towards achieving NEWBITS objectives.
3.2.2 Systematic approach for categorisation in NEWBITS
In view of the results generated by the literature review on categorisation for ITS, NEWBITS partners internally discussed about how to approach the categorization method to be adopted to fulfil NEWBITS objectives. For the particular case of the systematic categorisation of the rather extensive and heterogeneous list of initiatives, it was decided that it was not possible to define a valid categorisation method. Thus, the first conclusion derived from the data gathering process (step 1) and the initial process of step 2 has been the need to iterate a second data identification step towards a more suited component of ITS. Keeping the reference in the macro level, NEWBITS consortium determined to focus the data gathering process at the specific type of initiative: Projects. This decision was determined also by the following two key elements:
1. Projects provide with a more homogeny base to apply a categorisation method. 2. Projects embed outcomes in the form of services, being a catalyser between the
macro and meso levels as defined in NEWBITS. Moreover, based on the existing information in the initial inventory, and the outcomes of this step, NEWBITS considered that amongst all three possible categorization frameworks tracked, the market oriented definition, fit the adopted business ecosystem conceptualization for ITS and C-ITS which determines the operational level of NEWBITS as: the structure and behaviour of a number of organizations sharing a key platform and the set of relationships (symbiosis) between those actors (Moore, 1993). For NEWBITS purposes, it was decided to consider a categorisation that could support a user-driven approach rather than a theoretical-driven technological or generic solution. Yet, considering the variety of methods available to categorise ITS from a market perspective (component, type, application), it becomes rather difficult at this stage to select an appropriate segmentation that would fulfil NEWBITS project's objectives. The resulting conclusions from this step being:

D2.1 Overview of ITS initiatives in the EU and US
© NEWBITS consortium www.newbits-project.eu Page 57 of 211
1. The categorisation could not be deployed at initiative level due the high disparity of the elements. The next steps required to focus on one typology of initiatives: projects
2. The framework to develop a categorisation for NEWBITS required a Market driven approach in order to be aligned with WP2 and overall project objectives.
3. The market oriented framework and the need to build a well-organised and comprehensive inventory required to iterate the data identification moving from the initial initiative level (macro) towards a service-application level (meso).
3.2.3 Literature review and establishment of long list criteria
Following the conclusions of the prior process, NEWBITS consortium engaged in a process to support the future data gathering at a service-application level by identifying criteria that would guide the second phase of data gathering on a service-application level in Step 3. The long list of criteria is constructed using a review of the literature indicated in Step 1. Criteria used by state-of-the-art initiatives in similar mapping exercises are analysed by the NEWBITS consortium. In addition to the criteria indicated by the literature review, multiple criteria of relevance are added by the NEWBITS consortium. These criteria are proposed by individual NEWBITS partners for their relevance to the project objectives and relation with upcoming Work Packages. Many recent studies that perform a mapping exercise focus on ITS and in the specific area of C-ITS. C-ITS Platform (2016), Ricardo (2016) and Trip (2016) are three important studies in the field of (C-)ITS that have performed a mapping exercise. The following sources have been used to detect criteria for NEWBITS:
§ The C-ITS platform (2016) aims to boost development of C-ITS deployment and have grouped services into ‘Day 1 services’ and ‘Day 1.5 services’ based on societal benefits and maturity of technology. These two groups have been further bundled based on the type of C-ITS communication (V2V, V2I, V2X) and primary purpose of the service. A latter stage distinguished between urban and non-urban services. The goal of these three-dimensional bundling was to generate different levels of deployment for bundles of services. Some bundles would be close to market deployment, whereas others are not, which is closely related to the objectives of the C-ITS platform.
§ TRIP (2016) operates on a project level and distinguishes between modes and types of transport to map FP7 and H2020 projects.
§ Ricardo (2016) describes a variety of C-ITS bundles. Based on technological
maturity, type of communication/technology, application areas, type of transport and type of ITS service. Furthermore, the benefits of services for the grouping of bundles.
§ The ITS Roadmap (2007) mapped applications per the primary benefit they offer,
distinguishing efficiency, safety, environmental and economic benefits, while considering also the type and mode of transport.

D2.1 Overview of ITS initiatives in the EU and US
© NEWBITS consortium www.newbits-project.eu Page 58 of 211
§ AECOM (2015) has performed a multi-level mapping exercise based on the categories defined by the 2DECIDE project. Criteria include geographical coverage, area of transport, primary problem ITS service tackles, primary objective, and several types of ITS measures.
The criteria used by the different literature sources have been documented and cross-matched to provide a long list of criteria used to categorise ITS services. Moreover, the NEWBITS partners have added three criteria to the long list configured, which are included because of the envisaged relevance to the NEWBITS objectives:
- Information on the institutional framework of the service, - the stakeholders involved, and - the possibility to scale and transfer the service have been included
Table 11 provides with an overview of the criteria identified and used by different literature to map ITS services, as well as certain parameters used to quantify the criteria.
Criteria Parameters Sources
Technology maturity Innovation phase Ricardo (2016), Amsterdam Group (2013), C-ITS Platform (2016)
ITS enabling technology
Ricardo (2016), TRIP (2016), Spaanderman and Broeders (2016), T-TRANS (2013), ERTICO (2015) AECOM (2015)
Targeted geographic deployment area
Urban, interurban, all
Ricardo (2016), TRIP (2016), Adaptive (2015) ITS Roadmap Outline (2007) C-ITS Platform (2016) 2DECIDE (2011)
Transport mode Scheduled, Unscheduled
TRIP (2016), ITS Roadmap Outline (2007), 2DECIDE (2011)
Type of transport Freight, passenger Ricardo (2016), ITS Roadmap Outline (2007), 2DECIDE (2011)
Primary benefits Safety, Efficiency, Comfort, Environmental benefits
TRIP (2016), Ricardo (2016), Spaanderman and Broeders (2016) Harding et al. (2014) ITS Roadmap Outline (2007), 2DECIDE (2011)
Institutional framework
Private, public, PPP Added because of potential relevance for NEWBITS assessments
Stakeholders Users, vehicle suppliers / OEMs, infrastructure authorities, governments, ITS companies, service providers, universities/research institutes, others
Added because of potential relevance for NEWBITS assessments

D2.1 Overview of ITS initiatives in the EU and US
© NEWBITS consortium www.newbits-project.eu Page 59 of 211
Criteria Parameters Sources
Transferability Added because of potential relevance for NEWBITS assessments
Table 11 Long list of criteria for ITS services
A brief description on each criterion configuring the long list is provided in the following lines:
§ Innovation level The innovation level refers to the extent by which the service or application is still in the development phase or ready for market introduction. It is applied by several studies to categorise (C-) ITS services (Amsterdam Group, 2013; C-ITS Platform, 2016; Ricardo, 2016). Often a distinction is made between Day 1 and Day 1.5 services (e.g. by Ricardo, 2016; C-ITS Platform). Day 1 services are expected to be available on the market in the short term, while Day 1.5 services are technology wise mature, but all required specifications or standards are not completely ready yet.
§ Type of technologies Technologies, and Communication Technologies are often applied by recent studies (Ricardo, 2016; Spaanderman and Broeders, 2016; TRIP, 2016) to categorise C-ITS services. A common distinction is between Vehicle to Vehicle (V2V) and Vehicle to infrastructure (V2I). Beyond communication technologies other categories are needed for ITS services, like hardware (ITS stations) and sensing devices (e.g. cameras, sensors). ITS enabling technologies have been used by several studies (TTRANS, 2013; AECOM, 2015).
§ Geographic deployment area The geographic deployment area refers to the type of areas where the C-ITS service is mainly applied (in urban areas, on motorways, etc.). This criterion is used by several studies to categorise (C-)ITS services (Adaptive, 2015; ITS Roadmap Outline, 2007; Ricardo, 2016; TRIP, 2016). Often a distinction is made between urban applications in city environments and interurban applications.
§ Transport mode ITS and C-ITS services may also be categorised based on the transport mode (e.g. road, rail, aviation, inland shipping), as was done by TRIP (2016) and ITS Roadmap Outline (2007). ITS services significantly differ between different transport modes as different levels of coordination between vehicles are required.
§ Type of transport The type of transport can be used as criteria for the categorisation of (C-)ITS services, as has be done by Ricardo (2016) and ITS Roadmap Outline (2007). Parameters used by the literature include freight and passenger transport. Where further breakdowns to public, road are possible. A breakdown to transport motive (e.g. commuting, business, leisure) is less relevant, as the ITS services targeted on passenger transport can be applied for all transport motives.

D2.1 Overview of ITS initiatives in the EU and US
© NEWBITS consortium www.newbits-project.eu Page 60 of 211
§ Primary benefit ITS services may contribute to more safety, efficiency, comfort or environmental benefits. These benefits of (C-)ITS services are often used as criterion for the categorisation of (C-)ITS services (e.g. by TRIP, 2016; Ricardo, 2016; Spaanderman and Broeders, 2016; Harding et al., 2014; ITS Roadmap Outline, 2007).
§ Institutional framework Although not used by other studies for categorising ITS services, NEWBITS has considered to add the institutional framework to the longlist of criteria as it may be a relevant criterion with respect to the NEWBITS objectives. It could provide information on the financing of the identified service. This could indicate if the service has reached market maturity or whether different it is still in development
§ Stakeholders
As institutional framework, (type of) stakeholders is not used by other studies as criteria to categorise C-ITS services. However, the key assessments that will be carried out in NEWBITS pivot on a network based approach which requires a thorough identification of stakeholders and the consideration of the value fluxes existing in the network in which those interoperate (e.g. stakeholder analysis, Value Network Analysis, Communities of Interest).
§ Transferability Transferability is added because this of relevance to the NEWBITS project. In later stages information on case studies will be aggregated to a higher level. Transferable and scalability of services is an important prerequisite to aggregate results.
3.3 Step 3. Data identification (#2: Iteration to capture data at service level)
In Step 3 the necessary data will be collected at a service level. The documentation of the services has been done in line with the criteria identified, and considering the conclusions of the categorization assessment.
Based on the criteria and parameters identified by the NEWBITS partners, a fiche has been constructed to facilitate the data gathering at a service level. Step 1 has indicated relevant FP7 and H2020 deployment projects. In this step, those have been analysed into greater detail in order to document ITS services. This desk research process has been complemented by a further investigation from the NEWBITS partners involved to find operational applications and services in national projects.
In this sense, fiches are constructed based on the deployment projects. Multiple services can be deployed via a single project, in this case multiple fiches are provided. Data gathering via the fiches was performed by the NEWBITS partners involved, with CED being responsible for

D2.1 Overview of ITS initiatives in the EU and US
© NEWBITS consortium www.newbits-project.eu Page 61 of 211
the gathering of the different services, which have been analysed and documented in a long list in Microsoft Excel format that forms the basis for the categorisation in Step 4 and 5.
Taking into consideration Step 3 as an iteration in the data gathering activity, essentially linked to the prior steps conclusions, this step has been basically implemented in one core process:
i. Desk Research: identification of services and collection of data
3.3.1 Desk research: Identification of services and collection of data. At this stage, NEWBITS partners have followed a very similar desk research approach to the one performed in Step 1, but without involving further interviews.
The goal of the data gathering in step 3 is to collect state-of-the-art ITS services deployed or piloted in projects in Europe and outside Europe. A first preparatory activity was to engage the identification of services in the projects already described in the Long list of Initiatives, and complemented by other possible relevant projects at national level. Thus, two main sort of initiatives were considered in the initial approach as embedding or deploying services:
• Projects and applications at a national level • FP7 and H2020 projects
NEWBITS consortium has investigated initiatives at a national level to identify relevant services. Research on a national level is done in the country of origin of the NEWBITS partners. The following countries are covered by the research on a national level: Austria, Belgium, Germany, France, Ireland, Italy, the Netherlands, Spain, and the UK. Furthermore, projects in Australia and the United States are researched to provide a comparison as was stated in NEWBITS DoW.
The result was an initial, not structured list of services linked to the projects.
In order to avoid the generation of an extensive list of services without any added value for the categorization framework and the criteria identified in step 2, the next point of step 3 has been the definition of an appropriate scope and tool for data gathering considering the nature of the targeted data and the conclusions of previous steps. In this sense, a MS Word doc was defined and distributed amongst partners labelled as “Fiche Template”.
Thus, NEWBITS consortium was involved in designing a fiche which contained two blocks of information to be filled by the partners in the process of data gathering for each identified service:
§ General information § Criteria parameters
Both information blocks are further explained in the following lines:
1. General Information: To structure the data, general information has been collected for the identified services.

D2.1 Overview of ITS initiatives in the EU and US
© NEWBITS consortium www.newbits-project.eu Page 62 of 211
The following table summarizes the level of description required for the general information block.
Input Explanation
Name Name of the project
Status Ongoing, Planned, Finished and duration of the service
Country or region of deployment Country, Region of piloted service or area of application
Brief description A brief description of the project and the service or organisation that offers the service is provided.
Table 12 General information in Service Fiche Template
The general information for each service is used to provide a better understanding of the collected services, though is not considered at this step relevant for the mapping exercise in step 5. In this sense, for each identified service the status of the service has been collected. Active services without an end date have been labelled ongoing. Services deployed during a pilot project have been labelled: planned, active or finished in combination with the duration of the pilot. This provided information on the status the specific service was based on
The country in which the services is applied or piloted has been documented. In case the service has been deployed in multiple countries, for example in FP7/H2020 projects, the region has been documented, which would be Europe in this case. Services which are applied globally are documented as global. Furthermore, the status and regional information provide relevant information on whether the collected services represent state-of-the-art services offered globally.
A brief description of the service, including the type of ITS following a market oriented framework, is provided which explains the main information of the service and the project in which it has been deployed.
2. Criteria parameters: following the long list of criteria indicated in Step 2, NEWBITS partners has determined those to be embedded into the data gathering process at service level. These parameters are the key input for these fiches constructed to collect relevant ITS services.
The following table summarizes the level of description required for the criteria block.
Criteria Parameters
Technology maturity Innovation phase (TRL)

D2.1 Overview of ITS initiatives in the EU and US
© NEWBITS consortium www.newbits-project.eu Page 63 of 211
Criteria Parameters
ITS key-enabling technology Communication technologies, Hardware infrastructure, Software infrastructure, Algorithms, Positioning technologies, Sensors (monitoring and detection), Identification technologies
Targeted geographic deployment area
Urban, Interurban, All
Transport mode Scheduled, Unscheduled, Both
Type of transport Freight truck, Passenger car, Road vehicles, Rail, Air
Primary benefits Safety, Efficiency, Comfort, Environmental benefits
Institutional framework Private, Public, PPP
Stakeholders Users, vehicle suppliers / OEMs, infrastructure authorities, governments, ITS companies, service providers, universities/research institutes, others
Transferability Yes, No
Table 13. Summary of criteria information in Service Fiche template
a) Technology maturity
The first criteria to be developed in the data gathering was the innovation level of the service, or the technological maturity of the service. After an internal discussion, the NEWBITS consortium decided to measure innovation level by the Technology Readiness Level (TRL) of services. This is an often-used indicator to reflect the innovation. TRLs have originally been introduced by NASA in 1974 and have since been evolved into the current 9 levels of technology maturity. We follow the definition as proposed by the European Union in Work Programme 2014-2015 for Horizon 2020 (European Commission, 2014) as shown in
Table 14.
Definition of Technology Readiness Levels
TRL 1 Basic principles observed
TRL 2 Technology concept formulated
TRL 3 Experimental proof of concept
TRL 4 Technology validated in lab
TRL 5 Technology validated in relevant environment (industrially relevant environment in the case of key enabling technologies)
TRL 6 Technology demonstrated in relevant environment (industrially relevant environment in the case

D2.1 Overview of ITS initiatives in the EU and US
© NEWBITS consortium www.newbits-project.eu Page 64 of 211
Definition of Technology Readiness Levels
of key enabling technologies)
TRL 7 System prototype demonstration in operational environment
TRL 8 System complete and qualified
TRL 9 Actual system proven in operational environment (competitive manufacturing in the case of key enabling technologies; or in space)
Table 14 Definition of Technology Readiness Levels
In this study, a pre-condition of the data gathering was to focus in ITS services that are close to implementation or are implemented in the market already. As the NEWBITS project aims to provide a better understanding of the deployment process of ITS services, a certain maturity of the innovative ITS service is required. Therefore, services identified will be considered if they are currently piloted or applied (TRL 7 or higher). However, several services with a TRL of 5 or 6 have been included as well as the boundaries between the different innovation levels are not always clearly defined.
b) Key enabling technologies NEWBITS partners have reported the key enabling technologies supporting the different services. Key enabling technologies are introduced in the following lines, being the key reference the 8 technology blocks proposed by TTRANS project (2013): Communication technologies; Hardware Infrastructure; Software Infrastructure; Algorithms; Positioning technologies; Sensors (monitoring and detection); Identification technologies. The following lines provide with a brief description of the major technologies considered in each of the technology blocks:
• Communication technologies o Cellular network: Cellular communication technologies have developed
during the last decade and multiple techniques are possible. The earlier second generation (2G/GSM/GPRS/EDGE) is occasionally used for ITS applications. Most applications use the third generation (3G/UTMS/HSPA) or the fourth generation (4G/LTE) network. Currently the 5th generation (5G) of mobile network is under development. This 5th generation could facilitate direct communication between vehicles. The 5th generation mobile network is expected to become available gradually available from 2020 onwards. Vehicle-to-vehicle communication using 5G will therefore be something to be seen in the future. The currently available technologies are best suited for longer range communication and are for example used to provide real time navigation.
o Urban Wi-Fi and landline internet: wired and wireless internet are very important for the functioning of C-ITS services. C-ITS services use a lot of data, especially when all sources come together at traffic management centres and other platforms. Due to the large amount of data landlines are used. Wireless networks are slower and less stable as landlines. However, they are mobile, and therefore are suitable when no wired network is possible.

D2.1 Overview of ITS initiatives in the EU and US
© NEWBITS consortium www.newbits-project.eu Page 65 of 211
o Other technologies. Bluetooth, GSM-R and Zigbee are three technologies that facilitate communication for ITS. Bluetooth is commonly used for short range communication, GSM-R is the of the art communication standard for railways. Zigbee is an ad-hoc wireless network which is a de-facto standard for industrial wireless sensors.
• Hardware infrastructure o Integrated Stations: inside vehicles hardware is installed that allows the
vehicle to set up communication using Wi-Fi-p. Vehicle manufacturers are technology wise ready to equip vehicles with Wi-Fi-p. Currently the customer demand is not large and therefore only a very limited number of vehicles has an integrated Wi-Fi-p module installed. It will take at least several years until Wi-Fi-P hardware is common in new cars.
o Mobile telephones: another option for C-ITS applications is to rely on the cellular network. Information is sent towards the smartphone of the driver where the message will be displayed. Several services use this method and it is effective specifically for providing real time information.
o Stand-alone unit/ tablet / PDA: almost no vehicle has hardware installed to support Wi-Fi-p yet. In pilot’s vehicles are therefore equipped with stand-alone Wi-Fi-p units that allow communication using vehicular Wi-Fi. These stand-alone units behave similarly as a stand-alone navigation system. Stand-alone unit could be used for aftermarket installation of a Wi-Fi-p module inside a car.
o Sensors inside vehicle: board computers inside vehicles are becoming more advanced and are able to collect more data on the driving behaviour. For example, driving speeds, braking intensity, and weather conditions are measured by vehicles. Examples are (advanced) board cameras, speed and distance measuring through radar (LIDAR). RFID systems to track and scan vehicles (for example. In parking garages). This information is relevant for C-ITS applications. For example, cars could automatically inform the road operator about the occurrence of slippery road conditions.
• Software o Cloud services: more and more data is been send and stored in the cloud.
This means data is not stored on a central place but rather on a ‘cloud’ of computers online. Floating car data (FCD) is data that continuously transmits location, speed and direction of a car. This is used to generate real time traffic advice. Cloud computing is perfect for this type of data, as it is not necessary to save this data for a long period.
• Algorithms: traffic is often analysed using algorithms. Certain initiatives are improving these algorithms especially with an eye on C-ITS services. An example is personalized real time traffic advice that differs between users to disperse traffic. As data platforms become more advanced the effect and importance of algorithms increases.
• Positioning o Satellites: In order to determine the location of vehicles satellite based
location is most commonly used. This would involve the Global Positioning

D2.1 Overview of ITS initiatives in the EU and US
© NEWBITS consortium www.newbits-project.eu Page 66 of 211
System (GPS) which is maintained by the US, or the European satellite system Galileo.
o Real time location systems: Positioning data is often combined to generate a real-time location of vehicles. These exact and moving locations facilitate advanced ITS applications. An example is floating car data, which are car movement data generated from GPS and cellular connectivity.
• Sensors o Road side beacons: Roads could be equipped with beacons that
broadcast using Wi-Fi-p technology. These Wi-Fi-p beacons allow traffic managers, road side infrastructure and other users to send and receive information using Wi-Fi-p. Currently these beacons are only installed for pilot projects. In the future, they have the potential to be common for (dense) roads.
o Dynamic road signs: these signs installed above the road or on the side of the road. These inform road users about a variety of issues. Matrix signs do not communicate directly but are regulated via a traffic centre.
o Conditions sensors: Sensors could measure weather conditions, acceleration, fuel level, and many other conditions in- and outside vehicles.
o Inductive loops: integrated sensors or loops that for example sense whether a vehicle is occupying a parking spot or is approaching an intersection.
o Video cameras: certain stretches of road are equipped with video cameras that operate on a closed circuit (CCTV).
• Identification technologies o Smartcards. Cards that incorporate a chip. These have become
mainstream technology and are widely deployed. o Charge cards: Charge cards enable vehicles to tank fuel and charge it
automatically using a separate account. This could be traditional fuel as well as electricity in the case of electric vehicles.
o NFC: Near Field Communication (NFC) is used by smartcards for quick, simple and secure ticketing. Many new mobile telephones are equipped with NFC technology in order to facilitate payments with mobile telephones.
o RFID: Radio-frequency identification allows wireless identification and tracking of objects. Common for track and trace processes.
Each of the reported services could use multiple types of technologies. Based on the available data specific technologies or standards are reported. However, one type of technology is key for the functioning of the service. For example, many C-ITS services depend on direct V2V communication, exemplifying that communication technologies are the key type of technology for this service. Identification technologies are key for electronic toll collection. Following this rationale, a key technology has been identified for the different services selected by the NEWBITS consortium.

D2.1 Overview of ITS initiatives in the EU and US
© NEWBITS consortium www.newbits-project.eu Page 67 of 211
c) Geographical scale
The geographical deployment area of services is documented by the NEWBITS project. In line with existing literature services are classified under urban, interurban or both to reflect their geographical scale. For example, advanced traffic lights apply to urban solutions, whereas highway management systems are interurban solutions.
d) Type of transport
The multiple types and modes of transport a service applies to have been documented. The NEWBITS project follows the parameters used in the literature. Firstly, it is indicated whether the service aims at passenger, freight or both types of transport. Secondly, the transport mode for which the service applies for scheduled, non-scheduled or multimodal transport.
e) Type of stakeholders
The type of stakeholders involved in the service have been reported. Different stakeholders are research institutes, universities, industry, OEMs, public authorities and end users among many others. The types of stakeholders are identified via the project website, deliverables or other communication methods.
f) Institutional arrangements
The type of financing for the service has been documented. Three options are chosen to measure institutional arrangements: private, public or a public private partnership (PPP).
g) Transferability
NEWBITS partners have assessed to what extent the service is transferable and scalable to other regions. The fiches provide an indication of NEWBITS partners on the transferability of the service. The long list of services contains two options; services are transferable or not transferable.
The performed desk research generated a number of fiches on a service level, containing the above referenced information at the two blocks level.
If multiple services are deployed in one project, multiple fiches were constructed to present the information correctly. This differentiation between services was not possible for all identified initiatives. For several projects, there was not enough information available to construct fiches at the service level.
Therefore, from the 160 identified initiatives 94 fiches have been constructed on a service level. The fiches are shown in Annex 7 Service Fiches.

D2.1 Overview of ITS initiatives in the EU and US
© NEWBITS consortium www.newbits-project.eu Page 68 of 211
4. Codification and Mapping of ITS services A number of categorisations in terms of market segmentation have been identified for ITS in Chapter 3. Also, a long list of relevant criteria has been proposed in the same chapter collected from a wide range of literature sources including those with potential relevance to NEWBITS assessments. Given these two inputs, the objectives of this chapter are:
1. To propose a systematic methodology based on the analytical hierarchy process (AHP) to determine: (a) A suitable categorisation that fits the purpose of NEWBITS, and at the same time, (b). Provide a priority ranking of the long criteria list defined in Chapter 4 following pairwise comparison assessments by partners.
2. To perform the mapping of the identified ITS/C-ITS services to the selected categorisation, and provide a visual mapping with respect to the short list of criteria resulting from the ranking in (1).
As stated in the introductory section of Chapter 3, we will not take into consideration categorisations proposed by theoretical research methods from the scientific literature. Our focus is on market segments emanating from industrial market research reports excluding the geographical scope.
4.1 Validation of ITS Market Categorisation Owing to the different categorisation schemes available from market research reports and the several potential criteria that need to be considered, it becomes difficult to choose a suitable categorisation scheme that would satisfy all the criteria identified. This constitutes a multicriteria decision making problem for the consortium about the best categorisation that meets the requirements of NEWBITS objectives.
In order to assist with the decision-making process, we adopt the AHP (Saaty 1980) to find the right categorisation among several alternatives after a series of brainstorming sessions with the partners. For this purpose, the AHP framework is preferred to a more extensive method such as analytic network process (Jharkharia and Shankar 2007), because of its simplicity to assess collective judgements for effective decisions by expediting a natural decision-making process (Saaty 1980). As agreed by the consortium, AHP would allow us take the advantage of the individual strengths and expertise of partners' opinions including ITS experts and to deal with any disagreements by installing voting rules based on preference ratings. The aim is to achieve two objectives in one process; the ranking of relevant criteria, and the priority ranking of the market segment categorisations. The AHP process has been useful for complex decision making in a variety of domains including in industry and in government. The main idea behind AHP is to select an alternative or a rank of alternatives (goal in level 1) from a set of different decision alternatives (level 2) given a set of criteria (level 3). Figure 11 shows the AHP structure. Several levels of sub-criteria can be added to the hierarchy, for the purpose of this task, we are only considering one criteria level. The process requires the decision maker (partners and experts) to provide judgments about the relative importance of each criterion and then specify a preference for each decision alternative on each criterion.

D2.1 Overview of ITS initiatives in the EU and US
© NEWBITS consortium www.newbits-project.eu Page 69 of 211
Figure 11: Overview Analytic Hierarchy Process, AHP (Saaty 1980)
To achieve these goals, clearly defined methodological processes have been defined, which includes establishing the relevant criteria for the assessment of categorisation schemes, through to synthesis and ranking of criteria and categorisation. The deployed AHP consists of five sub-processes in total:
i. Process 1: Construct the decision hierarchy (decompose the decision-making problem into goal, criteria, and decision alternatives).
ii. Process 2: Construct the pairwise comparison matrix. iii. Process 3: Internal voting process for the collection of partners' subjective
judgements. iv. Process 4: Synthesise judgements to obtain the set of overall weights for
achieving the goal and evaluate the degree of consistency among the pairwise judgements.
v. Process 5: Develop priority ranking and determine the best categorisation. Each of these processes is further developed as subsections in this chapter. The outcome of this process is expected to set the baseline for Task 2.3 in selecting and validating case studies that are representative of the variety in types of the ITS/C-ITS services.
4.1.1 Construct decision hierarchy The first process in the AHP involves the model of the problem in a hierarchic or network structure. This kind of representation involves defining the decision problem and the goal of the problem, specifying the criteria to be considered, and the decision alternatives. To apply the AHP, the hierarchic formulation for the problem then becomes: Choose or rank market categorisation(s) (goal) from the existing categorisation available for ITS market according to a given set of relevant criteria that would satisfy NEWBITS objectives. The three decision alternatives are the MARKET by component, by type and by application. A set of 10 relevant criteria are considered namely; innovation level (C1), ITS enabling technology (C2), targeted geographic deployment area (C3), transport mode (C4), transport type (C5), primary benefits (C6), institutional framework (C7), stakeholders (C8), transferability (C9), and deployment

D2.1 Overview of ITS initiatives in the EU and US
© NEWBITS consortium www.newbits-project.eu Page 70 of 211
period (C10). The hierarchy is shown in Figure 12. For simplicity sake, not all the criteria are listed in the structure.
Figure 12: AHP schematic deployment for selection of categorisation
4.1.2 Construct the pairwise comparison matrix The next process is to develop the pairwise comparison matrix (PCM). PCM is an essential tool in the AHP that serves to establish relations within the hierarchical structure. It allows the partners (decision makers in this process) to judge the preference of one criteria or decision alternative relative to the other. Each element in the adjacent upper level is used to compare the elements in the level immediately below it. For the three-level structure described in Figure 4.2, the relations are established at both the lower and upper level leading to the following PCMs:
i. Pairwise comparison of categorisations according to a given criterion - This indicates the preference or priority for each categorisation in terms of how it contributes to each criterion. To fill an entry in the matrix, the question asked to compare any two elements is: Q. On criterion C, how important is categorisation A relative to categorisation B?
ii. Pairwise comparison of criteria with respect to the goal of choosing a suitable categorisation – This is the relative importance of each criterion in terms of its contribution to the achievement of the overall goal. The question for this comparison is: Q. To select a categorisation suitable to achieve NEWBITS objectives, how important is the criterion Ci relative to the criterion Cj?
The PCMs are developed in a spreadsheet template consisting of 11 sheets in total; the first 10 PCMs are repetitively generated for each criterion (Figure 13) and the last sheet is used for comparing the criteria with respect to the goal (Figure 14).

D2.1 Overview of ITS initiatives in the EU and US
© NEWBITS consortium www.newbits-project.eu Page 71 of 211
Figure 13: Pairwise comparison of categorisation with respect to each criterion
Figure 14: Pairwise comparison of criteria with respect to the goal
4.1.3 Internal voting In this process, partners are asked to provide their responses in the decision matrix by comparing the categorisation candidates under each criterion separately as well as the 10 criteria towards achieving the goal. Partners make comparison judgements in pairs based on a scale with values from 1 to 9 (Table 15) to reflect their relative preferences.
Intensity of importance Definition Explanation
1 Equally important Two factors contribute equally to the objective
3 Moderately more important Experience and judgment slightly favour one over the other
5 Strongly more important Experience and judgment strongly favour one over the other
7 Very strongly more important Experience and judgment very strongly favour one over the other. Its importance is demonstrated in practice
9 Absolutely more important The evidence favouring one over the other is of the highest possible validity
2,4,6,8 Intermediate values between the two adjacent judgements
When compromise is needed
Table 15 Saaty preference rating scale (Saaty, 1987)
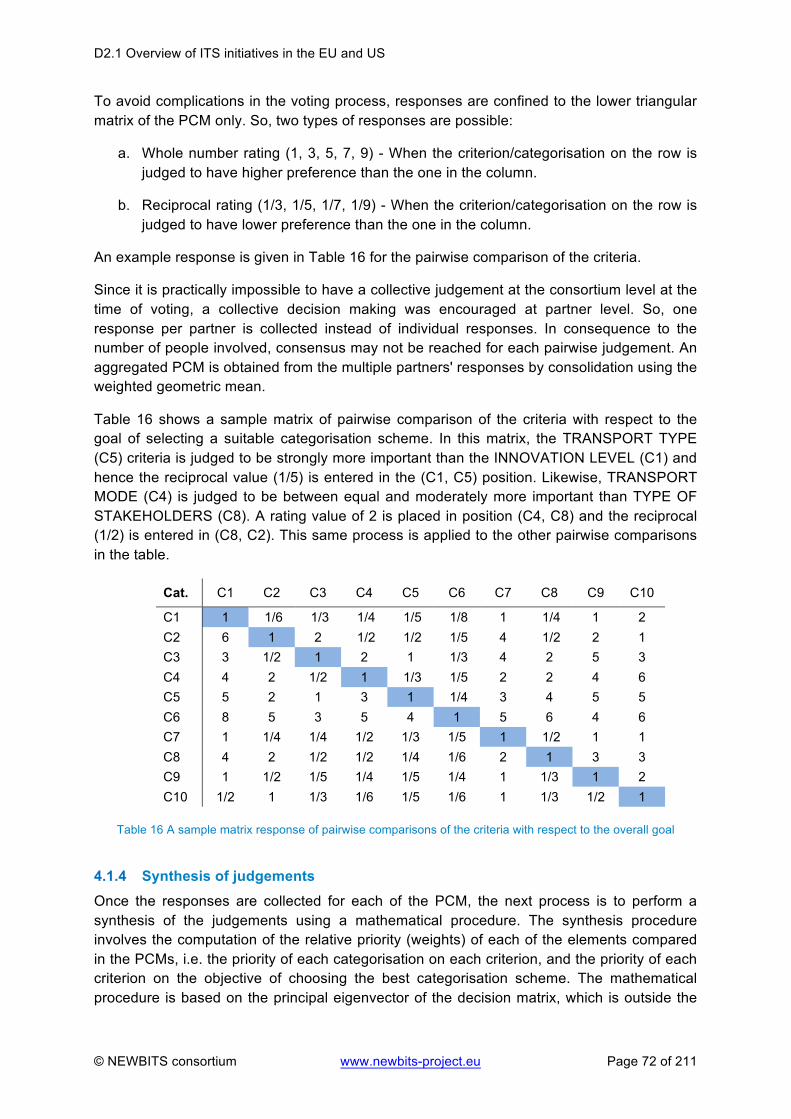
D2.1 Overview of ITS initiatives in the EU and US
© NEWBITS consortium www.newbits-project.eu Page 72 of 211
To avoid complications in the voting process, responses are confined to the lower triangular matrix of the PCM only. So, two types of responses are possible:
a. Whole number rating (1, 3, 5, 7, 9) - When the criterion/categorisation on the row is judged to have higher preference than the one in the column.
b. Reciprocal rating (1/3, 1/5, 1/7, 1/9) - When the criterion/categorisation on the row is judged to have lower preference than the one in the column.
An example response is given in Table 16 for the pairwise comparison of the criteria.
Since it is practically impossible to have a collective judgement at the consortium level at the time of voting, a collective decision making was encouraged at partner level. So, one response per partner is collected instead of individual responses. In consequence to the number of people involved, consensus may not be reached for each pairwise judgement. An aggregated PCM is obtained from the multiple partners' responses by consolidation using the weighted geometric mean.
Table 16 shows a sample matrix of pairwise comparison of the criteria with respect to the goal of selecting a suitable categorisation scheme. In this matrix, the TRANSPORT TYPE (C5) criteria is judged to be strongly more important than the INNOVATION LEVEL (C1) and hence the reciprocal value (1/5) is entered in the (C1, C5) position. Likewise, TRANSPORT MODE (C4) is judged to be between equal and moderately more important than TYPE OF STAKEHOLDERS (C8). A rating value of 2 is placed in position (C4, C8) and the reciprocal (1/2) is entered in (C8, C2). This same process is applied to the other pairwise comparisons in the table.
Cat. C1 C2 C3 C4 C5 C6 C7 C8 C9 C10
C1 1 1/6 1/3 1/4 1/5 1/8 1 1/4 1 2 C2 6 1 2 1/2 1/2 1/5 4 1/2 2 1 C3 3 1/2 1 2 1 1/3 4 2 5 3 C4 4 2 1/2 1 1/3 1/5 2 2 4 6 C5 5 2 1 3 1 1/4 3 4 5 5 C6 8 5 3 5 4 1 5 6 4 6 C7 1 1/4 1/4 1/2 1/3 1/5 1 1/2 1 1 C8 4 2 1/2 1/2 1/4 1/6 2 1 3 3 C9 1 1/2 1/5 1/4 1/5 1/4 1 1/3 1 2 C10 1/2 1 1/3 1/6 1/5 1/6 1 1/3 1/2 1
Table 16 A sample matrix response of pairwise comparisons of the criteria with respect to the overall goal
4.1.4 Synthesis of judgements Once the responses are collected for each of the PCM, the next process is to perform a synthesis of the judgements using a mathematical procedure. The synthesis procedure involves the computation of the relative priority (weights) of each of the elements compared in the PCMs, i.e. the priority of each categorisation on each criterion, and the priority of each criterion on the objective of choosing the best categorisation scheme. The mathematical procedure is based on the principal eigenvector of the decision matrix, which is outside the

D2.1 Overview of ITS initiatives in the EU and US
© NEWBITS consortium www.newbits-project.eu Page 73 of 211
scope of this deliverable. To facilitate the computational process, the AHP online tool (Goepel, 2017) is employed for this purpose. Part of this procedure involves normalising the resulting PCMs and averaging the values in each row to get the corresponding weight.
This process is further divided into two: First, the weights of the criteria are calculated, and Second, the categorisations are evaluated based on the criteria weights.
(a) Determine the weight (priority) of each criterion – The priorities of individual partners (expressed as a percentage of weights) are shown in Table 17.
Part. C1 C2 C3 C4 C5 C6 C7 C8 C9 C10
ISSIN 11.70% 10.00% 6.60% 5.70% 5.50% 25.40% 6.90% 12.30% 8.30% 7.70%
UAB 14.50% 5.80% 5.30% 5.20% 2.50% 25.70% 3.50% 21.80% 9.20% 6.40%
TTS 14.60% 7.50% 2.80% 3.00% 4.90% 13.40% 4.90% 26.30% 11.30% 11.20%
S2i 4.60% 7.40% 4.00% 1.90% 2.40% 19.40% 9.10% 19.30% 19.10% 12.80%
ORT 16.60% 10.10% 8.20% 5.20% 8.00% 14.80% 4.40% 17.90% 6.10% 8.60%
CUE 21.90% 13.00% 7.40% 11.50% 6.30% 19.40% 6.20% 4.00% 7.50% 2.80%
CED 3.10% 9.00% 11.80% 10.40% 15.90% 31.70% 3.60% 7.80% 3.60% 3.20%
ATOS 17.70% 6.70% 6.70% 1.10% 4.50% 20.00% 2.80% 25.90% 6.40% 8.10%
Table 17 Resulting weights of criteria based on the PCMs of individual partners
From the table, there is an agreement to a certain extent at the consortium level on four criteria (marked green); innovation level (C1), ITS enabling technology (C2), primary benefits (C6), and type of stakeholders (C8). The priorities are then consolidated to calculate the global priorities (Table 18). The consolidated global priorities reflect the judgement of all partners. The overall consistency ratio (CR) for the consolidated priorities is computed as 2.7%, which is within an acceptable range following Saaty's rule. Appendix 4.1 shows the consolidated decision matrix for criteria comparison.
Category Priority Rank 1 Innovation level 12.70% 3 2 ITS enabling technology 9.00% 4 3 Geographic deployment area 7.00% 7 4 Transport mode 4.50% 10 5 Transport type 5.90% 8 6 Primary benefits 24.00% 1 7 Institutional framework 5.10% 9 8 Type of stakeholders 16.70% 2 9 Transferability 8.00% 5
10 Deployment period 7.20% 6
Table 18 Ranking of criteria with consolidated global priorities
From the consolidated priorities, the AHP group consensus indicator is calculated as 76.4%. This indicates the degree of agreement among partners (0% total disagreement, 100% total agreement), which can be considered a fairly acceptable agreement. Figure 15 shows the

D2.1 Overview of ITS initiatives in the EU and US
© NEWBITS consortium www.newbits-project.eu Page 74 of 211
consolidated ranking of each criterion by priority computed from the aggregation of the individual priorities from Table 17.
Figure 15: Consolidated global priorities of criteria towards achieving the goal
The ranking shows that three criteria (C6, C8, C1) are considered the most critical, while four criteria (C2, C9, C10, C3) are equally important. With respect to selecting an ITS market categorisation for the project, it can be concluded that:
• PRIMARY BENEFITS is the most influential criterion for categorisation going by the consolidated judgements of the partners. This can be linked with its relation to the main objectives of ITS due to its importance of the societal benefits derived from solving transportation problems by taking advantage of advanced ICT. The reported benefits have contributed to drive the deployment of ITS/C-ITS services. The result of this priority also coincides with the survey results in Grant-Muller & Usher (2014) in which stakeholders from various organisations and networks have singled out an improved demonstration of ITS benefits in enabling the greater uptake of ITS.
• TYPE OF STAKEHOLDERS is highly preferred to achieving NEWBITS objectives due to the crucial role of stakeholders' cooperation for the deployment of the value network analysis in WP4 and its importance in selecting case studies in Task 2.3.
• INNOVATION LEVEL is seen as a priority criterion relevant to NEWBITS on the basis of its importance of innovation for business models. It will help to clarify the services applied or piloted and as a consequence, to determine services that are very close to the market and those that may already have a well-defined business model.
(b) Determine the weight of categorisation in terms of each criterion:

D2.1 Overview of ITS initiatives in the EU and US
© NEWBITS consortium www.newbits-project.eu Page 75 of 211
The resulting priority of the evaluation process for the categorisation is presented in Table 19. The impact of each criterion is determined by analysing the importance of each categorisation on every other categorisation using the PCMs. The consolidated decision matrix for each categorisation according to each criterion can be found in Appendix 4.2.
Cat. Priority
C1 C2 C3 C4 C5 C6 C7 C8 C9 C10 Cat. 1 40.20% 70.60% 10.00% 10.30% 11.10% 8.40% 14.60% 14.20% 16.40% 23.50% Cat. 2 35.90% 14.10% 30.70% 42.50% 49.50% 35.50% 42.60% 39.40% 51.50% 33.10% Cat. 3 23.90% 15.30% 59.40% 47.20% 39.40% 56.00% 42.80% 46.40% 32.10% 43.40%
Cat.1 – Market by component, Cat. 2 – Market by application, Cat. 3 – Market by Type
Table 19 Consolidated priorities for categorisation with respect to each criterion
4.1.5 Develop priority ranking and determine the best categorisation In this process, the selection of the best categorisation depends on the priorities obtained in the previous process. The weighted average rating of each categorisation is computed taking into account the weights of each criterion and its impact on the overall goal. Table 20 shows the breakdown of the individual ranking of categorisations by partner.
Partners Market by Component
Market by Application
Market by Type CR
ISSINOVA 25.10% 32.30% 42.60% 0.00%
UAB 18.80% 41.60% 39.60% 0.00%
TTS 20.80% 33.80% 45.50% 0.00%
S2i 21.60% 27.70% 50.70% 0.00%
ORT 22.90% 40.50% 36.60% 0.00%
CUE 26.90% 30.60% 42.50% 0.00%
CED 22.70% 36.10% 41.20% 0.00%
ATOS 24.50% 46.90% 28.60% 0.00% Table 20 Categorisation ranking per partners
There is total agreement in the assigned preferences by partners with a group consensus indicator of 98.4%. Based on this evaluation, the weights of categorisations are then consolidated in order to identify the right categorisation (Figure 16).

D2.1 Overview of ITS initiatives in the EU and US
© NEWBITS consortium www.newbits-project.eu Page 76 of 211
Figure 16: Consolidated weights (ranking) of categorisations
As shown Figure 16, the MARKET BY TYPE categorisation (ATMS, ATIS, ATPS, APTS, CVS) proves to be the best categorisation alternative suitable to achieve NEWBITS objectives. Overall, the partners' judgements in the whole AHP have taken into consideration criteria that are most critical to meet the requirements of the respective work packages in the project. The decision hierarchy of the entire AHP is presented in Appendix 4.3.
4.2 Characteristics of Selected Services The indicated projects in Appendix 3 have resulted in 160 different indicated services. However, this contained services that have been collected at initiative level making them not suitable for analysis at a service level. After removing the faulty data, we are left with 94 services. The details are shown in Appendix 5. This section will analyse the details of the services analysed by the NEWBITS consortium. The functioning of an ITS service is not correlated with the country of region in which a service is deployed. The effect often is larger if more people are affected by a service but this does not affect the functioning of a service. This section focuses on service-level analysis by looking at some functional criteria and how they are reflected by the services.
On the first criterion, the different services and based on project description assigned a primary benefit. For example, the primary benefit of road works warnings is safety, whereas a real-time route planner improves comfort of travellers. Many ITS services offer multiple benefits simultaneously. However, the NEWBITS project has decided on the primary benefit in order to enable it to be used as part of the mapping procedure. The primary benefit is mostly discussed in the project information; this has been decided based on the expert opinion of the NEWBITS partners. Efficiency is the most common primary benefit with a share of 44% of the services as shown in Figure 17. The other benefits are also well represented by the list of selected services.

D2.1 Overview of ITS initiatives in the EU and US
© NEWBITS consortium www.newbits-project.eu Page 77 of 211
Scheduled17%
Unscheduled
78%
Multimodal5% Type of transport
Scheduled Unscheduled Multimodal
Urban28%
Interurban
29%
Both43%
Geographical deployment
Urban Interurban Both
Figure 17: Representation of primary benefits
The selected services offer a good coverage of the different ITS areas and goals of ITS services. Another element is to see the types of transport covered by the list of services. Figure 4.8 shows that about 30% of the services apply to an urban context, examples are inner city parking guidance and smart pedestrian crossing. Another 30% of the services specifically aims at highways, for example highway monitoring systems and cooperative truck platooning. The largest entry involves services that apply for an urban and interurban context. Examples are weather warning systems and real time route planners. The majority of the services apply to unscheduled transport, being freight trucks, passenger cars and other road users. Scheduled transport incorporates public transport (Buses, rail transport) and air transport.
Communication technologies are most often the key technology in the set of identified of services (Figure 18). In 50% of the identified services, communication technologies are key to the functioning of the service. This illustrates the emphasis on connected and cooperative driving at the macro level. The other technologies are also relevant in certain services as well. The only exception being energy related technologies, which is not a key technology in the group of ITS services identified by the NEWBITS consortium.
Safety20%
Efficiency44%
Comfort21%
Environmental15%
Safety Efficiency Comfort Environmental

D2.1 Overview of ITS initiatives in the EU and US
© NEWBITS consortium www.newbits-project.eu Page 78 of 211
Figure 18: Representation of transport type, mode and geographic deployment criteria
Figure 19: Representation of key enabling technology criterion
4.3 Mapping The key activity to be deployed in this step is to organise and map the identified services.
In a broader sense, a categorisation scheme otherwise called classification (Tan et. al 2006) would allow the mapping of a service or a group of services to a specific category without any form of ambiguity. In other words, a service must belong to a category that must be as unique as possible and most likely be different from the services in the other categories. Ideally, the mapping will be based on the services identified in the inventory and include the most important criteria resulting from the ranking established in the AHP procedure.
27%
12%
40%
2%9%
8%
2%
Road vehicles Trucks Cars Rail Multimodal Buses Air
12%
50%10%
14%
4%5%
5%
Identification technologies Communication technologies
Hardware infrastructure Software infrastructure
Sensors Algorithms
Positioning technologies

D2.1 Overview of ITS initiatives in the EU and US
© NEWBITS consortium www.newbits-project.eu Page 79 of 211
4.3.1 Identification of Subcategories for Service Differentiation Following the selection of the appropriate market segment, the first task is to organise the services by establishing a one-to-one mapping of each service to its respective category according to the Market by Type segmentation. This exercise seems straightforward from the outset. However, some categories are somewhat implicit except for the description of the CVS category whose characteristics can be directly interpreted from its name. To allow for the correct mapping of the services, we first identify all the possible subcategories under each category.
ITS subcategories are discussed by the Information Technology & Innovation Foundation in Ezell (2010). A wide range of ITS applications are available, and it is useful to categorise them to some extent beyond the market segmentation. Therefore, Ezell (2010) introduce subcategories that cover the main purposes of ITS applications. It is important to note that applications could have functionalities that fall into multiple subcategories. The list of subcategories defined by Ezell (2010) was not meant to be inclusive, but should contain the most prominent ones. The NEWBITS consortium adopted a similar approach to define the most prominent subcategories within each market segment. The NEWBITS consortium has updated the main subcategories defined by Ezell (2010) based on the following literature; Amitran (2014), C-ITS platform (2016), Ricardo 2016, and the market research during Step 2. Table 4.7 summarizes the description of each category with its associated (updated) subcategories. The market segment of CVS is currently in development and no clear subcategories have emerged as of yet. V2V services, platooning and emergency braking systems represent one large category. V2I services represent another large category
Market by Type Category
Description Subcategory
ATMS
"ITS services that focus on traffic control devices, such as traffic signals, ramp metering, and the dynamic (or “variable”) message signs on highways that provide drivers real-time messaging about traffic or highway status" (ITIF 2010).
Signal control Highway systems Enforcement systems Parking management Traffic monitoring Demand and access management
ATIS
ITS services that "provide drivers with real-time travel and traffic information, such as transit routes and schedules; navigation directions; and information about delays due to congestion, accidents, weather conditions, or road repair work" (ITIF 2010).
In-vehicle route and navigation systems In-vehicle motorist service information systems In-vehicle signing information systems In-vehicle safety and warning systems Commercial vehicle operations
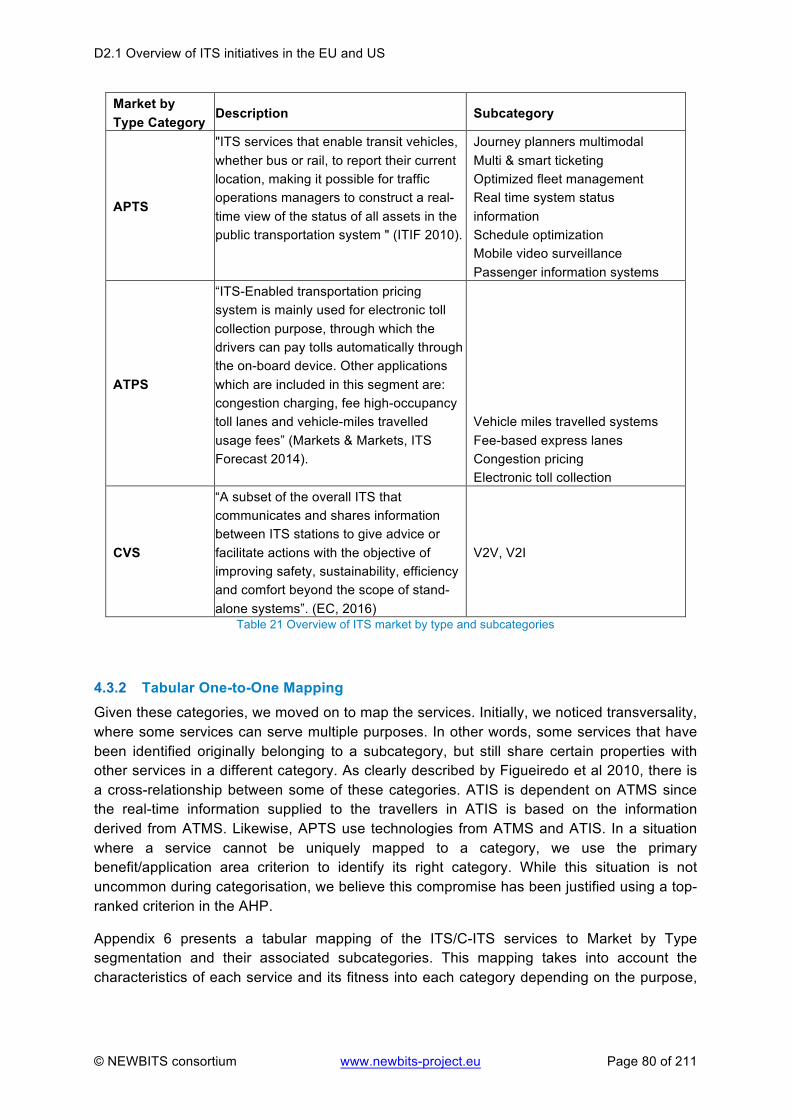
D2.1 Overview of ITS initiatives in the EU and US
© NEWBITS consortium www.newbits-project.eu Page 80 of 211
Market by Type Category
Description Subcategory
APTS
"ITS services that enable transit vehicles, whether bus or rail, to report their current location, making it possible for traffic operations managers to construct a real-time view of the status of all assets in the public transportation system " (ITIF 2010).
Journey planners multimodal Multi & smart ticketing Optimized fleet management Real time system status information Schedule optimization Mobile video surveillance Passenger information systems
ATPS
“ITS-Enabled transportation pricing system is mainly used for electronic toll collection purpose, through which the drivers can pay tolls automatically through the on-board device. Other applications which are included in this segment are: congestion charging, fee high-occupancy toll lanes and vehicle-miles travelled usage fees” (Markets & Markets, ITS Forecast 2014).
Vehicle miles travelled systems Fee-based express lanes Congestion pricing Electronic toll collection
CVS
“A subset of the overall ITS that communicates and shares information between ITS stations to give advice or facilitate actions with the objective of improving safety, sustainability, efficiency and comfort beyond the scope of stand-alone systems”. (EC, 2016)
V2V, V2I
Table 21 Overview of ITS market by type and subcategories
4.3.2 Tabular One-to-One Mapping Given these categories, we moved on to map the services. Initially, we noticed transversality, where some services can serve multiple purposes. In other words, some services that have been identified originally belonging to a subcategory, but still share certain properties with other services in a different category. As clearly described by Figueiredo et al 2010, there is a cross-relationship between some of these categories. ATIS is dependent on ATMS since the real-time information supplied to the travellers in ATIS is based on the information derived from ATMS. Likewise, APTS use technologies from ATMS and ATIS. In a situation where a service cannot be uniquely mapped to a category, we use the primary benefit/application area criterion to identify its right category. While this situation is not uncommon during categorisation, we believe this compromise has been justified using a top-ranked criterion in the AHP.
Appendix 6 presents a tabular mapping of the ITS/C-ITS services to Market by Type segmentation and their associated subcategories. This mapping takes into account the characteristics of each service and its fitness into each category depending on the purpose,

D2.1 Overview of ITS initiatives in the EU and US
© NEWBITS consortium www.newbits-project.eu Page 81 of 211
function, and whether it involves some sort of communication between vehicles, vehicles and infrastructure, and/or between vehicles and other transport participants.
The resulting classification of the services is shown in Figure 20 according to the different subcategories identified in each market segment. It illustrates the distribution of the identified services over the ITS market segment. The largest proportion of the services comes from CVS, which accounts for about 28%, approximately one-third of the total (26). This is then followed by the second largest segments with an equal proportion of ATIS and ATMS services, making up 23 each of the total. These three areas are influenced mostly by the developments in connected, automated and cooperative driving. European and US policies focus on connected and cooperative driving (C-ITS Action plan & US policy), and as a consequence, this type of services is well represented in our long list of services. The remaining services in the APTS and ATPS segments are much smaller accounting for 23% combined, with 15 and 7 services, respectively. CVS is dominant because its scope extends beyond the road transport mode. Overall, we are able to cover all the five segments in the chosen ITS market categorisation. This is considered paramount if the case studies to be selected in Task 2.3 must be representative of the variety in types of the ITS market segments.
Figure 20: ITS/C-ITS services per category
4.3.3 Three-dimensional Mapping and Classification Going forward, we limit the short list of criteria to the top 5 according to the priority ranking; Primary benefits, Type of stakeholders, Innovation level, ITS enabling technology, and transferability. For mapping purpose, we consider three criteria from this short list for mapping purposes. Type of stakeholders does not allow one-to-one mapping due to the varying number of stakeholder groups involved in the deployment of each service, while transferability is more of a qualitative criterion. Subsequent deliverables in WP3 will consider
CooperativeVehicleSystem
(CVS)28%
AdvancedTransportationPricingSystem
(ATPS)7%Advanced
PublicTransportationSystem(APTS)
16%
AdvancedTrafficManagementSystem(ATMS)
25%
AdvancedTraveller
InformationSystem(ATIS)
24%

D2.1 Overview of ITS initiatives in the EU and US
© NEWBITS consortium www.newbits-project.eu Page 82 of 211
the degree of similarity between the stakeholders involved across the different services. This can reveal a cluster of stakeholders, which would then identify the different classes from the most important group to the less important ones.
As a first level mapping, we consider a three-dimensional (3D) space to map the identified services (Figure 21) by the primary benefit and innovation level criteria with respect to the classification of the services by market segment, and then quantifying the key enabling technology. Each point in the 3D map represents each of the 94 services in Appendix 5.
Figure 21: 3-dimensional mapping of services
To better understand the distribution of the services in the 3D mapping, mapping by classification is used to fit services into boxes. Figure 22 shows the classification of the services according to their (1) market segment, (2) primary benefit, and (3) innovation level. Figure 23 also depicts the classification of services by primary benefit and by key enabling technology. All the market segments are mostly dominated by communication technologies as their key enabling technology.

D2.1 Overview of ITS initiatives in the EU and US
© NEWBITS consortium www.newbits-project.eu Page 83 of 211
Figure 22: Classification per market segment, primary benefit and innovation level
Figure 23: Classification per market by type, primary benefits and key enabling technology
Finally, tree maps are used to visualise the mapping of the market segments by primary benefits and technology (Appendix 7). The dominant enabling technologies for CVS and ATPS services are communication and identification technologies, respectively. For the other services that fall into the ATMS, ATIS and APTS market segments, the six key technologies are sparsely distributed. Though communication still remains significant, software infrastructure is also significant. This classification is based on the data collected but could be seen as a useful tool for mapping a wider variety of services.
4.3.4 Extended Visualisation of Mappings Beyond the market segment, we noticed that there is some overlapping of services occupying one or regions in the 3D map. Actually, not all the services are separately represented on the map. Some have been deployed in the same market segment and also have similar enabling technology and primary benefit, and currently at the same innovation level.
Clustering methods and self-organising maps (SOM) are some of the most popular techniques for customer segmentation (Hanafizadeh & Mirzazadeh (2011)) and georeferenced data (Gorricha & Lobo, V. J. (2011)).

D2.1 Overview of ITS initiatives in the EU and US
© NEWBITS consortium www.newbits-project.eu Page 84 of 211
To further improve the mapping, a hierarchical clustering method is used to identify possible clusters or groups of services sharing similar characteristics based on the combination of market segment and the selected three criteria.
The possible sets of clusters are represented using a dendogram (Figure 24) to provide a visual representation of the similarity between services. From the dendogram, it is quite difficult to determine the appropriate number of clusters and also, visualise patterns in order to discover more information about the data.
Figure 24: Cluster dendogram of services
To overcome this limitation, SOM is employed to visualise the clustering. SOM is a tool that provides the visualisation of high-dimensional data which implements an orderly mapping of a high-dimensional distribution onto a regular low-dimensional grid (Kohonen, 1998).
SOM can be used to reveal the true characteristics of the data/patterns in the distributions of the services and criteria. Figure 25 shows the SOM of the patterns displayed by the services given the market segment and the criteria. The individual fan diagram in the visual map represents the magnitude of each variable (criterion) in each node.

D2.1 Overview of ITS initiatives in the EU and US
© NEWBITS consortium www.newbits-project.eu Page 85 of 211
To determine the optimum number of clusters that correctly describes the services, we perform several iterations with different number of clusters. Finally, we obtained a map consisting of four cluster types that is well represented by the data. Each cluster is separated by a black line. The dominant criteria in each cluster are well illustrated. Figure 25 describes the mapping of each service to its own cluster.
Figure 25: SOM of the patterns exhibited by the services, divided into four clusters

D2.1 Overview of ITS initiatives in the EU and US
© NEWBITS consortium www.newbits-project.eu Page 86 of 211
Figure 26: Self-organized mapping of the services to the four clusters
From the SOMs, we can deduce that these clusters define the different groups of services that can be offered and reveal some knowledge underlying the collected services. The definition of each cluster is given as follows:
1. Type 1 Service: These are services found in the red area of the map. This cluster is largely dominated by services that are already in the market (IL=9) spreading over three different market segments (ATMS, APTS, and ATPS). Comfort and efficiency are the most common primary benefits, while the key enabling technologies are restricted to three technologies; identification, communication, and hardware infrastructure.
2. Type 2 Service: This cluster is characterised by services whose primary benefits are safety and environmental. These are in the purple area of the map and are mainly dominated by the CVS and ATIS market segments. The technology readiness level of these services is mostly at IL=7 with the enabling technologies concentrated at communication and hardware infrastructure.
3. Type 3 Service: These services are represented in the green area of the map. The cluster comprises services having significant usage of a mix of three technologies; software infrastructure, positioning, and algorithms. It also has a heterogeneous mix of three market segments (ATIS, ATMS, and APTS) and innovation levels of 7, 8, and 9, while the dominating primary benefit is efficiency.
4. Type 4 Service: A particular market segment is well represented in this cluster (greenish-blue area of the map), the CVS. The main primary benefit is efficiency, while the dominating technology is communication. Most of the services in this cluster are at innovation level of 7.

D2.1 Overview of ITS initiatives in the EU and US
© NEWBITS consortium www.newbits-project.eu Page 87 of 211
A snapshot of the validation and mapping steps:
1. Five criteria are considered to be highly relevant to NEWBITS objectives following a general group consensus indicator of 76.4%: Primary benefits, Type of stakeholders, Innovation level, ITS enabling technology, and Transferability.
2. The Market by Type segment is ranked the best ITS market categorisation with a consortium agreement of 98.4%. It outperforms the Market by Application and Market by Component by relative gaps of 6% and 21%, respectively.
3. The selected services provide a well-balanced picture of the ITS market categorisation. This will maximise the usefulness of the results and recommendations provided by the NEWBITS project in the real world.
4. Four types of services are determined using the self-organising maps given the characteristics reflected by the dominant criteria in each cluster.

D2.1 Overview of ITS initiatives in the EU and US
© NEWBITS consortium www.newbits-project.eu Page 88 of 211
5. Conclusions Intelligent Transport Systems have become an integrated element in modern day transportation by offering services for multiple application areas, transport modes and types of transport. Companies, organizations and policy makers have acknowledged the potential of ITS in order to tackle transportation related issues, like congestion, emissions and safety related incidents. Furthermore, ITS offers secondary benefits by reducing the costs of transport and increasing the quality of transport.
ITS services help to manage traffic, inform travellers, improve logistical processes, offer emergency services, provide real time information among many other purposes. Advanced traffic lights, integrated on board units, and traffic management systems are examples of ITS stations used to offer these services. Often, ITS services require cooperation of many stakeholders bringing service providers, research and development, public authorities and traffic managers together. Although the added value of ITS is commonly acknowledged, their deployment is considered to be slow and fragmented (C-ITS Platform, 2016; Ricardo, 2016). The NEWBITS project will introduce a business modelling approach in order to accelerate future ITS deployment.
The first step of the NEWBITS project is to provide a good framework for the assessments to be carried out in the next WPs. An initial step in this process is to provide NEWBITS with a framework at ITS macro-level by identifying ITS and C-ITS initiatives at EU and US levels, and generating a rough inventory collating the information gathered. The analysis has indicated four prominent types of initiatives:
• Academic literature • FP7 & H2020 studies • Grey literature • Policy documents
The results from this analysis on a macro level showed a high conceptual and contextual disparity, based on the own heterogeneous and unparalleled character of the types of initiatives.
An internal discussion of the NEWBITS partners concluded that a categorisation could not be deployed due to the high disparity of the elements. The approach towards the categorisation was reassessed based on NEWBITS purposes. In line with the objectives of NEWBITS a market driven approach was preferred. The focus for the mapping exercise shifted towards one typology of initiatives: projects. Projects provide with a more homogeny base to apply a categorisation method. Furthermore, projects embed outcomes in the form of services, being a catalyser between the macro and meso levels as defined in NEWBITS.
The market oriented framework and the need to build a well-organised and comprehensive inventory required to iterate the data identification moving from the initial initiative level (macro) towards a service-application level (meso). This shift towards a meso level induced a second phase of data gathering. The criteria to guide this data search are based on a review of existing literature and input from the NEWBITS consortium.
The literature uses a variety of criteria in order to define the technological maturity, deployment area, type and mode of transport for ITS services. The NEWBITS consortium

D2.1 Overview of ITS initiatives in the EU and US
© NEWBITS consortium www.newbits-project.eu Page 89 of 211
has included three criteria based on NEWBITS objectives: Institutional framework, stakeholders and transferability. A fiche has been constructed to collect the information required for the long list of criteria.
In total 94 services have been selected by the NEWBITS consortium based on pilot projects and operational applications. The desk research by NEWBITS partners captured ITS services operating in Europe, the United States and Australia. The details of the selected services are presented in Annex 3.
A systematic methodology using AHP has been deployed for ranking the long list of criteria and selecting the best ITS market categorisation for NEWBITS. The outcome of the process established the selection of the market by type segment over markets by application and by component after a consortium agreement of 98.4%. It is worth mentioning that market by application can be given due consideration in related future projects since the relative gap from market by type is considerably small.
Within the same AHP process, five criteria were considered to be highly relevant to NEWBITS objectives following a general group consensus indicator of 76.4%:
• Primary benefits • Type of stakeholders • Innovation level • ITS enabling technology • Transferability.
However, for mapping purposes, the Type of stakeholders does not allow one-to-one mapping due to the varying number of stakeholder groups involved in the deployment of each service, while transferability is more of a qualitative criterion.
Subsequently, a service-level analysis is performed for the short list of 94 services by looking at some functional criteria and how they are reflected by the services. The results indicate that the selected services provide a well-balanced picture of the chosen ITS market categorisation. This will maximise the usefulness of the results and recommendations provided by the NEWBITS project in the real world.
We applied three criteria for mapping purposes, and the initial 3D mapping reveals the possibility of clusters of services since some of the services are not separately represented on the map. To further reveal the true characteristics of the patterns in the distributions of the services, an extended visualisation of service mapping is done using the combination of self-organising maps and clustering. This results in the identification of four types (clusters) of services given the characteristics reflected by the dominant market segment and criteria in each cluster.
The four clusters of services will be used in the following processes of the NEWBITS project. For each cluster of services, barriers, enablers and KPIs will be investigated. Furthermore, the validation and taxonomy of case studies will be supported by the clusters. This deliverable has therefore provided important steps for the construction of a framework for the NEWBITS project, key objective of WP2.

D2.1 Overview of ITS initiatives in the EU and US
© NEWBITS consortium www.newbits-project.eu Page 90 of 211

D2.1 Overview of ITS initiatives in the EU and US
© NEWBITS consortium www.newbits-project.eu Page 91 of 211
References AECOM (2015), Key performance indicators for Intelligent Transport Systems, Bristol.
Amitran project (2014), D3.1: Methodology for classification of ITS.
Amsterdam Group (2016). Declaration of Amsterdam – Cooperation in the field of connected and automated driving, Amsterdam.
Australian Department of Infrastructure and Transport (2012). Standing Council on Transport and Infrastructure. Policy framework for Intelligent Transport Systems in Australia.
CE Delft, TML, CTL, DLR, CUE, ZHAW, JRC, LNEC, FHERL, UCD, SIGNOSIS (2011). Identification of ICT options enhancing co-modality, Deliverable 4.1 in the OPTIMISM project (Optimising Passenger Transport Information to Materialize Insights for Sustainable Mobility), Delft.
Curedale, R. (2013). Mapping methods for design and strategy. First Edition, Topanga, CA, USA Design Community College.
C-ITS Platform (2016), Final report, Brussels.
Dalkir, K. (2005), Knowledge management in Theory and Practice. Elsevier.
European Commission (2008). Action Plan for the Deployment of Intelligent Transport Systems in Europe – Communication from the Commission, COM (2008)886 final, Brussels
European Commission (2010a). Directive 2010/40/EU of the European Parliament and of the Council of 7 July 2010 on the framework for the deployment of Intelligent Transport Systems in the field of road transport and for interfaces with other modes of transport, Brussels.
European Commission (2010b). A strategy for smart, sustainable and inclusive growth, EUROPE 2020, Communication from the Commission, COM (2010) 2020, Brussels, 2010.
European Commission (2012): Intelligent transport systems, [Online], Available: http://ec.europa.eu/transport/themes/its/index_en.htm, 15th March 2013.
European Commission (2014). Horizon 2020 – Work programme 2014-2015, Brussels
European Commission (2016). Cooperative Intelligent Transport Systems, Research Theme Analysis Report.
European Telecommunications Standards Institute (ETSI) (2012): Intelligent Transport Systems, [Online], Available: http://www.etsi.org/index.php/technologies-clusters/technologies/intelligent-transport, 8th April 2013.
ERTICO (2015), Guide about technologies for future C-ITS service scenarios, Brussels
Ezell S. (2010) Explaining international IT application leadership: Intelligent Transportation Systems. Information technology and innovation foundation.

D2.1 Overview of ITS initiatives in the EU and US
© NEWBITS consortium www.newbits-project.eu Page 92 of 211
Figueiredo, L., Jesus, I., Machado, J. T., Ferreira, J. R., & De Carvalho, J. M. (2001). Towards the development of intelligent transportation systems. In Intelligent Transportation Systems, 2001. Proceedings. 2001 IEEE (pp. 1206-1211). IEEE.
FMI (2016) Intelligent Transportation System ITS Market: Global Industry Analysis and Opportunity Assessment 2015-2025, London
Goepel Klaus D. (2017) Business Performance Management Singapore http://bpmsg.com/academic/ahp.php
Gorricha, J. M., & Lobo, V. J. (2011). On the Use of Three-Dimensional Self-Organizing Maps for Visualizing Clusters in Georeferenced Data. In Information Fusion and Geographic Information Systems (pp. 61-75). Springer Berlin Heidelberg.
Grand View Research (2016) Intelligent Transportation System (ITS) Market Analysis By Type (ATIS, ATMS, ATPS, APTS, Cooperative Vehicle System), By Application (Traffic Management, Road Safety And Security, Freight Management, Public Transport, Environment Protection, Automotive Telematics, Parking Management, Road User Charging) And Segment Forecasts To 2024, San Francisco.
Grant-Muller, S., & Usher, M. (2014). Intelligent Transport Systems: The propensity for environmental and economic benefits. Technological Forecasting and Social Change, 82, 149-166
Hanafizadeh, P., & Mirzazadeh, M. (2011). Visualizing market segmentation using self-organizing maps and Fuzzy Delphi method–ADSL market of a telecommunication company. Expert Systems with Applications, 38(1), 198-205.
Heikkilaä, S. (2014). Mobility as a Service, a proposal for action for the Public Administration. Aalto University School of Engineering.
Huhtala (2015). Article by K. Huhtala-Jenks & M. Forsblom “Mobility as a Service – the new transport paradigm”, in Tafik & Veje, August 2015.
Intelligent Transportation System ITS Market: Global Industry Analysis and Opportunity Assessment 2015-2025. (2016). http://www.futuremarketinsights.com/reports/intelligent-transportation-system-its-market
Intelligent Transportation System (ITS) Market Analysis By Type, By Application And Segment Forecasts To 2024 (2016) http://www.grandviewresearch.com/industry-analysis/intelligent-transportation-systems-industry/methodology
ITS Australia (2002). Intelligent Transport Systems: Potential benefits and immediate issues, Facing the Main Roads Lecture Series, Main Roads Western Australia, www.mrwa.wa.gov.au/projects/strategies/future/its_paper04.pdf; accessed: 26 September, 2002.
ITS Australia (2017). Report on Australia’s future in Intelligent Transport Systems. Leveraging the 2016 ITS World Congress in Melbourne.
ITS Roadmap Outline (2007), Intelligent Transport Systems(ITS) for more efficient, safer and cleaner road transport.

D2.1 Overview of ITS initiatives in the EU and US
© NEWBITS consortium www.newbits-project.eu Page 93 of 211
Jharkharia, S., & Shankar, R. (2007). Selection of logistics service provider: An analytic network process (ANP) approach. Omega, 35(3), 274-289.
Kanninen (1995): Intelligent Transportation Systems: An Economic and Environmental Policy Assessment, published in Transpn. Res.-A. Vol. 30, No. 1, pp. 1-10, 1996.
Kiang, M.Y. (2003), A comparative assessment of classification methods, Journal of Decision Support Systems, Volume 35, Issue 4, Pages 441-454.
Kohonen, T. (1998). The self-organizing map. Neurocomputing, 21(1), 1-6.
Litman, T. (2013). The New Transportation Planning Paradigm [Online Journal]. Institute of Transportation Engineers. ITE Journal. Vol. 83:6, 20-28. P. 20-22
LVM (2014) Ministry of Transport and Communications. Intelligent transport [Online]. Available at: http://www.lvm.fi/en/intelligent_transport. Accessed: 31st January 2014. Markets and Markets (2014). Intelligent Transportation System Market by Component, System, Application, and Geography - Analysis & Forecast to 2015 - 2020. Vancouver, WA: Markets and Markets. McQueen, B., & McQueen, J. (1999). Intelligent transportation systems architectures.
Moore, J. (1993), Predators and prey, a new ecology of competition. Harvard Business Review, May-June.
Parsaye, K. (1988). Acquiring and verifying knowledge automatically. AI Expert, 3 (5): 48–63. Perallos, A. et al (2015). Intelligent Transport Systems: technologies and applications. John Wiley & Sons. Rathenau Instituut (2015). Converging roads – Linking self-driving cars to public goals, The Hague.
Ricardo (2016), Study on the Deployment of C-ITS in Europe: Final Report, London
RITA (2009): Applications Overview, [Online], Available: http://www.itsoverview.its.dot.gov/
Saaty, R. W. (1987). The analytic hierarchy process—what it is and how it is used. Mathematical modelling, 9(3-5), 161-176.
Saaty TL. The analytic hierarchy process. New York, NY: McGraw-Hill; 1980.
Samper et al. (2006): An Ontological Infrastructure for Traveller Information Systems; Proceedings of the IEE ITSC 2006, 2006 IEEE Intelligent Transportation Systems Conference, Tonto, Canada, September 17th-20th, 2006.
Spaaderman, P., Broeders, W. (2016) C-ITS deployment in the Netherlands
Scholliers, J. (2016), Nordic Way – System Design, Espoo
Tan, P.N., Steinbach, M., & Kumar, V. (2006). Introduction to Data Mining.

D2.1 Overview of ITS initiatives in the EU and US
© NEWBITS consortium www.newbits-project.eu Page 94 of 211
Taylor, M.A.P. (2001) “Intelligent transport systems,” in K.J. Button and D.A: Hensher, eds, Handbook of transport systems and traffic control. Oxford: Pergamon. TIPS (2013), Selection of Projects – Enhancing the capacity of EU transport projects to transform research results into innovative products and services. TRIP (2016), Cooperative Intelligent Transport Systems – Research Theme Analysis Report, Transport Research & Innovation Portal, London TRT (2016). Study on Urban Mobility – Assessing and improving the accessibility of urban areas – Task 2 Report: Estimation of European Urban Road Congestion Costs TTRANS project (2013). Enhancing transfer of ITS innovations to the market, Deliverable 3.1- ITS state of the art assessment [Online], Available at: http://www.ttransnetwork.eu/ttrans/its-state-of-the-art-assessment/
Underwood, S. (2015). Automated, Connected and Electric Vehicle Systems. Expert Forecast and Roadmap for Sustainable Transportation. Institute for Advanced Vehicle Systems, University of Michigan.
US Department of Transportation (2014). ITS Joint Programme Office 2014: Intelligent Transportation Systems Benefits, Costs and Lessons Learnt, 2014 report.
US Department of Transportation (2015). Intelligent Transport Systems Strategic Plan 2015-2019
Vargo, S. L., and Lusch, R. F. (2004). ‘Evolving to a New Dominant Logic for Marketing’ Journal of Marketing, 68(1), 1-17.
Yin, R. K. (1984). Case study research: Design and methods. Newbury Park, CA: Sage.

D2.1 Overview of ITS initiatives in the EU and US
© NEWBITS consortium www.newbits-project.eu Page 95 of 211
Appendices
Appendix 1 Long list of initiatives Table A.1.i Other
Authors Title Year Brief summary A. Luis Osorio et al Towards a Reference Architecture for a
Collaborative Intelligent Transport System Infrastructure
2014 This paper discusses an approach to the required ICT-based intelligent infrastructure based on a collaborative network of stakeholders as contributors to the business service offering
AECOM for DG MOVE Key Performance Indicators (KPIs) for road transport Intelligent Transport Systems (ITS),
2015 This study was commissioned by DG MOVE to establish a set of common Key Performance Indicators (KPIs) for road transport Intelligent Transport Systems (ITS), with supporting guidance on their application, presentation and reporting
Algoé Consultants SA, Rapp Trans, Alain Bensoussan Avocats, Liberty Incentives & Congresses
ITS Action Plan 2012 Final report on DG MOVE study on the adoption of an open in-vehicle platform architecture for the provision of ITS services and applications, including standard interfaces
Amsterdam Group Roadmap between automotive industry and infrastructure organisations on initial deployment of Cooperative ITS in Europe
2013 The intention of this Road Map document is the identification and agreement: 1) on necessary steps regarding Cooperative Systems and Services, in this way defining a Joint Deployment Strategy for those who are eager to go for C-ITS implementations; 2) on common open issues / necessary activities required to be solved for the initial deployment of Cooperative Systems and Services in vehicles and at infrastructure side; 3) on a timeline to accomplish the open issues / necessary activities. This document on the road map therefore aims at practical recommendations (not binding) for their members for the initial deployment of (Day One) cooperative services. Information exchange, discussion and creation of solutions between the involved stakeholders in the context of C-ITS are key for forming these recommendations.
Andreas Festag Cooperative ITS standards in Europe (IEEE Com. Mag)
2014 Provides a comprehensive overview of standards
BETA Towards an architecture for CITS applications in the Netherlands
2015 Describe the architecture for C_ITS in the Netherlands. Discussing role of stakeholders in the Dutch context
Car-to-Car Consortium Statement Deployment of V2X services based on ITS-G5 2016 Communication on the development of to deploy wireless Vehicle-to-Vehicle (V2V) and Vehicle-to-Infrastructure (V2I) communication based on the ITS-G5 standard (IEEE 802.11p).
C-ITS platform C-ITS final Report 2016 Extensive report on C-ITS its barriers and uses Cristofer Englund et. al The Grand Cooperative Driving Challenge 2016:
boosting the introduction of cooperative automated vehicles
2016 The article discusses the motivation of the GCDC challenge based on the context of intensive work in C-ITS. GCDC is a unique event for worldwide researchers to showcase their recent developments on cooperative and automated vehicles based on the newly finalized C-ITS standards.
Dr. Evangelia Portouli, Dr. Angelos Amditis, Dr. Panagiotis Lytrivis, Dr. Johanna Tzanidaki, Josep Laborda, Nuno Rodrigues, Frans van Waes, Johannes Liebermann, Pablo
Traffic management of the future and road automation
2016 How traffic management must prepare for the road automation.

D2.1 Overview of ITS initiatives in the EU and US
© NEWBITS consortium www.newbits-project.eu Page 96 of 211
Dafonte García E. Strn Chalmers University "On Medium Access and Physical 2011 Spectrum allocation and the physical and medium access control layers of EC JRC Ispra Informed consent in Internet of Things: The case
study of cooperative intelligent transport systems 2016 Describe a potential implementation for informed consent in C-ITS using a policy-based framework,
where privacy settings and preferences can be defined by the user, thus empowering the user in the control of his/her private data.
Elyes Ben Hamida; Hassan Noura; Wassim Znaidi
Security of Cooperative Intelligent Transport Systems: Standards, Threats Analysis and Cryptographic Countermeasures [Part Of: Electronics (Basel), 01 July 2015, Vol.4(3), pp.380-423]
2015 This article reviews the current research challenges and opportunities related to the development of secure and safe ITS applications. It first explores the architecture and main characteristics of ITS systems and surveys the key enabling standards and projects. Then, various ITS security threats are analyzed and classified, along with their corresponding cryptographic countermeasures. Finally, a detailed ITS safety application case study is analyzed and evaluated in light of the European ETSI TC ITS standard. An experimental test-bed is presented, and several elliptic curve digital signature algorithms (ECDSA) are benchmarked for signing and verifying ITS safety messages. To conclude, lessons learned, open research challenges and opportunities are discussed.
ERTICO Guide about technologies for future C-ITS service scenarios
2015 The Guide was developed by the ERTICO Task Force on Communication Technologies for C-ITS services. The document, which has laid the foundation for the report on C-ITS service scenarios, is the result of the joint efforts of 26 members of the ERTICO Partnership, under the guidance Anders Fagerholt (Ericsson) and Francois Fischer (ERTICO office). This guide is intended as a tutorial or guidance for those who need a more detailed insight in the ITS technologies, standards and initiatives.
European Commission Communication
A Master Plan for the deployment of Interoperable Cooperative Intelligent Transport Systems in the EU
2016 EC Roadmap to the adoption of a Masterplan for the deployment of C-ITS appliocations
European Telecommunications Standards Institute
Intelligent Transport Systems (ITS); Decentralized Congestion Control Mechanisms for Intelligent Transport Systems operating in the 5 GHz range;
2011 Review of standards and architecture for C-ITS applications
EU-US ITS Task Force Standards Harmonization Working Group Harmonization Task Group 3
Status of ITS Communication Standards 2012 List of references for standardization documentation concerning C-ITS
F Verweij, N Hoose, S Sondeijker, M Kuiken, J Pommer and W Savenije
Guidelines for policy makers: policy challenges on the way to the development of CVIS
2010 Overview of the main Areas of policy that CVIS will interact with and to provide a number of recommendations from the policy perspective
Festag, Andreas Cooperative intelligent transport systems standards in Europe [IEEE Communications Magazine, Vol. 52, Issue 12, pp.64–70, December 2015]
2015 This article provides a comprehensive overview of standards and complementary industry specifications for cooperative systems in Europe, covering relevant aspects of access technologies, network and transport protocols, facilities, applications, security, and management.
Hugo Chauvin, Cornelie van Driel, Karl-Gerhard Freyer, Philippe Gaches, Peter Rapp, Ian Wilkinson
ITS Action Plan Study regarding Reservation Services for Safe and Secure Parking Places for Trucks and Commercial Vehicles
Final Report on the study regarding Reservation Services for Safe and Secure Parking Places for Trucks and Commercial Vehicles. Technologies for making reservation have been analysed
John B. Kenney Toyota Info Technology Centre, USA
C-ITS in the USA: A Status Update on 5.9 GHz DSRC
2016 Short range communication
Karl Rehrl, Josep Maria Salanova Traffic management 2.0 - The Win-Win 2016 Exchange of data and information from the road vehicles and the Traffic Management and Control

D2.1 Overview of ITS initiatives in the EU and US
© NEWBITS consortium www.newbits-project.eu Page 97 of 211
Grau, Josep Laborda, Johanna Despoina Tzanidaki, Frans van Waes
Centres
Konstantinos Katsaros, Ralf Kernchen, Mehrdad Dianati, David Rieck
Performance study of a Green Light Optimized Speed Advisory (GLOSA) application using an integrated cooperative ITS simulation platform
2011 This paper aims to implement a GLOSA system to reduce traffic congestion by decreasing the average stop time behind traffic lights while reducing fuel consumption and CO2 emissions. The GLOSA application provides the advantage of timely and accurate information about traffic lights cycles and traffic lights position information through infrastructure-to vehicle (I2V) communication, and provides drivers with speed advice guiding them with a more constant speed and with less stopping time through traffic lights
Lei Chen and Cristofer Englund Cooperative ITS — EU standards to accelerate cooperative mobility
2014 EU standards for C-ITS
Lei Chen, Azra Habibovic, Cristofer Englund, Alexey Voronov, and Anders Lindgren Walter
Coordinating dangerous goods vehicles: C-ITS applications for safe road tunnels
2015 Investigates the potential of C-ITS applications for coordinating dangerous goods vehicles to minimize the risk by maintaining safe distances between them in road tunnels.
Marcel van Sambeek et. Al Towards an Architecture for Cooperative-Intelligent Transport System (C-ITS) Applications in the Netherlands
2015 Discusses the C-ITS applications of 7 projects in the Netherlands, the business model design, system and implementation architectures
Marcus Burke and James Williams, NTA Australia
Cooperative ITS Regulatory Policy Issues Discussion Paper
2012 Regulatory options for the safe and effective deployment and support of Cooperative Intelligent Transport Systems in Australia
Michele Rondinone et al. iTETRIS: A modular simulation platform for the large-scale evaluation of cooperative ITS applications
2013 Presentation of the ITETRIS simulation platform capable to test, with high modelling accuracy, cooperative ITS systems and applications in large scale scenarios
Ministry of land, infrastructures, transport and Tourism
ITS initiative in Japan 2014 Platooning, C-ITS is a priority
Onno Tool, Rijkswaterstaat; Fred Verweij, Rijkswaterstaat
Website report on state-of-the-art strategy for C-ITS deployment
2015 Starting point for this research on strategic issues for C-ITS deployment are the country reports submitted to the European Commission within the framework of the ITS Directive 2010-40. Following this directive, countries are requested to submit reports on the status and plans with respect to ITS. In this inventory, in total 61 reports have been reviewed, including initial ITS reports, national five year ITS plan reports, progress reports and other reports discussing C-ITS. The main focus of the report will be on cooperative ITS related to road transport.
Pac Connected Car in Europe 2015 Strategies and technologies for connected driving in Europe Ramboll Mid-term evaluation of the implementation of the
ITS Action Plan 2013 The report contains the findings of the “Mid-term evaluation of the implementation of the ITS"
performed by Ramboll Management Consulting between July 2012 and February 2013 in the context of the ITS Action Plan’
Rathenau Institute Converging Roads - Linking self-driving cars to public goals
2015 About the trouble and challenges of rapid autonomous development and the development of cooperate ITS
Robbin Blokpoel, Md. Faqhrul Islam, Jaap Vreeswijk
Impact analysis of the ecoApproach advice application
2014 Ecoapproach advice is one of the cooperative applications developed in the ecomove project with a view to avoid excessive stops, unnecessary acceleration and braking.
Salanova Grau, Josep Maria; Rusich, Andrea; Mitsakis, Evangelos; Ukovich, Walter; Fanti, Maria Pia; Aifadopoulou, Georgia;
Evaluation framework in Cooperative Intelligent Transport Systems (C-ITS) for freight transport: the case of the CO-GISTICS speed advice service [Part Of: International Journal of
2016 The current paper overviews the impact assessment methodologies applied in recent founded projects with the aim of defining an evaluation framework for the ongoing 7th Framework Program project “cooperative logistics for sustainable mobility of goods (CO-GISTICS)”.

D2.1 Overview of ITS initiatives in the EU and US
© NEWBITS consortium www.newbits-project.eu Page 98 of 211
Nolich, Massimiliano; Scala, Elisabetta; Papadopoulos, Christos
Advanced Logistics, 02 January 2016, Vol.5(1), p.30-43]
Sheng-Hai An, university of South Korea
A Survey of Intelligent Transportation Systems 2011 Focuses on the comparison and analysis of international ITS research and
Smart Cities Stakeholder Platform Karl Oskar Proskawetz
C-ITS and Services 2013 Analysis of C-ITS key innovations with higher potential impact to be deployed into smart cities framework
Stefan Klug, Bernd Beckert (Fraunhofer ISI/D)
Cooperative Intelligent Transport Systems and Services
2013 Description of C-ICT application in the context of EU Smart Cities Stakeholders Platform
Steven E. Shladover Deployment Path Analysis for Cooperative ITS Systems
2008 Discusses the deployment (institutional and technological) challenges faced by cooperative information systems and cooperative vehicle-highway automation systems, both of which require coordination of deployment of vehicle and infrastructure-based elements
TISA TISA Provision of EU-wide multimodal travel information services
Multimodal travel
TISA TISA position concerning a public consultation of the European Commission on the Provision of EU-wide Real-time Traffic Information Services
2014 Real-time Traffic Data and Real-time Traffic Information Services
TISA Quality on traffic information 2016 Travel and traffic information service perspective about quality of traffic information TNO Whitepaper on truck platooning 2015 Paper about the current situation and development of Truck Platooning Tom van de Ven, Mark Wedlock (RAPPTRANS) for DG MOVE
ITS Action Plan Action C - Free Road Safety Traffic Information
2013 The report provides an overview of the current situation of safety related traffic information (SRTI) in Member States
Tom van de Ven, Mark Wedlock (RAPPTRANS) for DG MOVE
ITS Action Plan Action B - EU-wide real-time traffic information services
2014 Final Report on the necessary requirements to make EU-wide real-time traffic information (RTTI) services accurate and available across borders to ITS users
Transport Research & Innovation Portal (TRIP)
Research Theme Analysis Report - Cooperative Intelligent Transport Systems
2016 This report gives an overview of research performed (mostly) in the EU collated by TRIP, providing a view across many projects that fall under the cooperative intelligent transport systems (ITS) theme title
UNECE (United Nations Economic Commission for Europe)
Road map for promoting ITS – 20 global actions – 2014/2020
2014 Road map for the ITS implementation
US Department of Transportation Planning for the future of transportation: connected vehicles and ITS
2015 Planning for the future of transportation: connected vehicles and ITS
US DOT USDoT ITS Strategic Plan 2015- 2019 2014 priorities on V2V connection and automate guidance van Wees and K Brookhuis, Delft University of Technology
Product liability for ADAS; legal and human factors perspectives,
2005 contribution the European Product Liability Directive’s concept of a defective product is described and analysed from both a legal and a human factors perspective
Vittorio Astarita, Giuseppe Guido, Domenico Mongelli & Vincenzo Pasquale Giofrè
A co-operative methodology to estimate car fuel consumption by using smartphone sensors; Eco smart and TutorDrive: tools for fuel consumption reduction
2015 A co-operative system which offer drivers the ability to manage their consumption and driving style, suggesting corrections to the usually adopted behaviour. The proposed system allows drivers to analyse detailed information about their individual driving style and statistics on their fuel consumption.
Walter Balzano, Maria Rosaria Del Sorbo, Domenico Del Prete
SoCar: A Social Car2Car Framework to Refine Routes Information Based on Road Events and GPS
2015 Deals with an enhancement of the maps for satellite navigation with additional information layers, containing current events observed by the vehicles and transmitted by Car2Car (C2C) exchange and not by a centralized infrastructure.
Zeppelin University, Amadeus, Thales, UNIFE, IATA
All Ways Travelling: To develop and validate a European passenger transport information and booking system across transport modes
2014 Final report for the DG MOVE establishment of a well-functioning marketplace for MultiModal Information and Ticketing Systems (MMITS)

D2.1 Overview of ITS initiatives in the EU and US
© NEWBITS consortium www.newbits-project.eu Page 99 of 211
Table A.1.ii FP7/H2020 projects
Project acronym
Begin End Project description Website Organisation
79GHZ 2011 2014 An international automotive 79 ghz frequency harmonisation initiative and worldwide operating vehicular radar frequency standardisation platform
Http://www.79ghz.eu/
Adaptive 2014 Ongoing Various automated driving functions for daily traffic by dynamically adapting the level of automation to situation and driver.
Https://www.adaptive-ip.eu/ Volkswagen group research
Amidst 2015 2010 Analysis of massive data streams Http://amidst.eu/ Hugin expert Amitran 2011 2014 The Amitran project defined a reference methodology to assess the impact of intelligent transport
systems on CO2 emissions. Http://www.amitran.eu/
Assess 2009 2013 Mobilises the European research community and car industry to develop a relevant set of test and assessment methods applicable to a wide range of integrated vehicle safety systems.
Http://www.assess-project.eu/ Humanetics
Carnet 2015 2017 KDPOF in the automotive market for increased data use http://cordis.europa.eu/project/rcn/196392_en.html
CHARM PCP 2012 2017 Stimulating innovations to improve traffic management centres. -> C--ITS module Https://staticresources.rijkswaterstaat.nl/binaries/CHARM%20factsheet_tcm21-36475.pdf
Highways Agency UK
CIMEC 2015 2017 Cimec will explore the role C-ITS can play to support city authorities, both in managing their transport networks and the delivery of other transport-linked services. Reaching out to key stakeholders to ensure smooth and efficient deployment
Cimec-project.eu
Civitas 2002 2005 Platform to exchange ideas and experiences about cleaner transport in cities Www.civitas.eu Regional Environmental Center Hungary
Co-Cities 2011 2013 Closed the 'feedback loop' of cooperative mobility services and elaborated a development path for traffic management in European cities
Http://www.co-cities.eu/ Austriatech
Codecs 2015 2018 Cooperative ITS Deployment Coordination Support www.codec-project.eu Cogistics 2014 2016 Deployment of C-ITS focused-on logistics. Http://cogistics.eu/factsheet/ Ertico Colombo 2012 2015 How to overcome the need for a large penetration rate with C-ITS Http://www.colombo-fp7.eu/ Imtech travel Comesafety2 2011 2014 Coordinating all activities towards the realisation of cooperative systems on EU roads Http://cordis.europa.eu/project/r
cn/80584_en.html
Bmw
Companion 2013 2016 Platooning project with Scania using V2V http://www.companion-project.eu/
Scania
COMPASS4D 2013 2015 Field testing three C-ITS services: Energy efficient intersection, road hazard warning, red light violation warning
Http://www.compass4d.eu/en/about/
Ertico
Cover 2009 2013 Coordination of vehicle and road safety initiatives. Also, comparison with an US system. Http://cordis.europa.eu/project/rcn/90174_en.html
Humanetics
DRIVE C2X 2005 2005 Laying foundation for c-its systems in Europe Http://www.drive-c2x.eu/ Daimler AG Ecogem 2010 2013 Full electric vehicle energy efficiency in route possible. And using information services and adjusting
route on the move. http://www.ecogem.eu/
Ecohubs 2012 2015 Ecohubs provides models and capabilities for cooperation and communication between green hubs’ stakeholders, plus establishing value added services making co-modal networks attractive to use
Http://www.ecohubs.eu/

D2.1 Overview of ITS initiatives in the EU and US
© NEWBITS consortium www.newbits-project.eu Page 100 of 211
and, at the same time, contributors to reduction in greenhouse gas emissions and other pollutants. Ecomove 2010 2014 To create an integrated solution for road transport energy efficiency to help drivers, freight and road
operators to reduce unnecessary kilometres, save fuel and manage traffic more efficiently Http://www.ecomove-project.eu/about-ecomove/
Ertico Europe
Efuture 2010 2013 Efuture wants to prepare the next generation of electric vehicle based on our first prototype by creating a platform which minimises its energy needs but can still optimise dynamically its decision between safety and energy efficiency.
http://www.efuture-eu.org/
Eranet 2008 2018 One of these horizontal future initiatives will be the provision of a database on national transport research programmes and national R&D results. Furthermore, the Era-net Transport sees a need to encourage and enable less-experienced partners to participate in trans-national cooperation as well as in the European Framework Program
Http://transport-era.net/results/sustainable/
Rijkswaterstaat
Esbf_2 2015 Ongoing European bus system of the future phase 2 Http://ebsf2.eu/ ETNA 2020 2016 2019 Linkage between the ‘Smart, Green and Integrated Transport’ NCPs and all the research and
business stakeholders in the transport sector, including all the transport modes and several cross-cutting areas
Http://www.transport-ncps.net/funding-map-database/
ETNA 2020
Euridice 2008 2012 Project that will create the necessary concepts, technological solutions and business models to establish an information services platform centred on the context of individual cargo items and their interaction with the surrounding environment and the types of users
http://cordis.europa.eu/project/rcn/85573_en.html
Eurofot 2008 2012 European Field operational test on active safety systems Http://www.eurofot-ip.eu/ Ertico Fot-net 2014 2016 The FOT-Net project has been in place for six years (2008-2013) as the networking platform for
stakeholders involved or interested in Field Operational Tests Http://fot-net.eu/context/ Ertico
Fotsis 2011 2015 Largescale field testing of the road infrastructure management systems needed for the operation of seven close-to-market cooperative I2V, V2I & I2I technologies (Fotsis Services), in order to assess in detail both 1) their effectiveness and 2) their potential for a full-scale deployment in European roads.
Http://www.fotsis.com/
Green emotion 2011 2015 The project has defined and demonstrated a European framework that connects all electro mobility stakeholders for a seamless, cost-efficient, and interoperable electro mobility ecosystem
http://cordis.europa.eu/project/rcn/186970_en.html
HIGHTS 2015 2018 Precise location position for C-ITS applications Http://hights.eu/ Jacobs university bremen
Icar support 2009 2012 The objective of Icar was to give support to the implementation of actions and recommendations resulting from the work of the imobility Forum and the Intelligent Car Initiative
Http://www.transport-research.info/project/intelligent-car-support
Ertico
Icargo 2011 2015 Icargo will build an open affordable information architecture that allows real world objects, existing systems, and new applications to efficiently co-operate, enabling more cost effective and lower-CO2 logistics through improved synchronisation and load factors across all transport modes.
Http://i-cargo.eu/partners
ICSI 2012 2015 Proposing a new architecture where the intelligence for sensing and actuation is distributed over some of the elements, called gateways, which host a software platform for running ITS applications, using the local storage and computation capabilities available.
Http://www.ict-icsi.eu/ Intecs spa
Inroads 2011 2015 "This project aims to develop Intelligent Road Studs (IRS) combining LED lighting, sensor systems and communication technologies to gain a better understanding of driver interactions with In-Vehicle Technologies
http://cordis.europa.eu/project/rcn/102011_en.html
Intersafe @ 2008 2011 Develop and demonstrate a CISS (cooperative intersection safety systems using v2v and v2i Http://cordis.europa.eu/project/r IBEO

D2.1 Overview of ITS initiatives in the EU and US
© NEWBITS consortium www.newbits-project.eu Page 101 of 211
cn/87267_en.html
Itetris 2001 2010 Itetris is aimed at producing the necessary building blocks and interfaces to conduct large-scale tests in open source integrated wireless and traffic emulation platforms to propose and optimize innovative V2V and V2I communication capabilities to improve road traffic management. Such type of evaluations cannot be carried out today with the required level of accuracy
Http://www.ict-itetris.eu/simulator/objectives.htm
I-Tour 2014 2014 The I-TOUR project is designed to promote the use of public transport by encouraging sustainable travel choices and by providing rewarding mechanisms for users choosing public travel options
http://cordis.europa.eu/result/rcn/141312_en.html
FORMIT SERVIZI S.p.A
ITS observatory Platform that maps all ITS community, data bank with impact and benefits etc. Http://its-observatory.eu/ Local 4 Global 2013 2016 Test and TMCS elements to be fully autonomous and make smart decisions Http://local4global-fp7.eu/ Cetre for
research and technology Hellas
Mobility 2.0 2012 2015 C-ITS communication between electric vehicles Http://mobility2.eu/ Mobincity 2014 2015 Smart mobility in smart city http://www.mobincity.eu/ Nearctis 2013 Grouping academics to find main problems with cooperative traffic Http://www.nearctis.org/home/p
roject/ IFSTTAR
Nodes 2005 2005 Efficient integration of public transport services Http://www.nodes-interchanges.eu/
FORMIT SERVIZI S.p.A.
Optimism 2005 2005 OPTIMISM project will propose a set of strategies, recommendations and policy measures, through the scientific analysis of social behaviour, mobility patterns and business models, for integrating and optimising transport system.
http://www.optimismtransport.eu/
Optimum 2015 2018 Setting up a big data infrastructure. Deploy in real life and integrate with Car2x http://www.optimumproject.eu/ PRESERVE 2011 2015 Design, implement and test a secure and scalable V2X security subsystem Https://preserve-
project.eu/about
University Twente
Roadart 2015 2018 To investigate and optimise the integration of ITS communication in trucking. T2T and T2I Http://www.roadart.eu/ IMST GMBH Safetrip 2009 2013 To provide an integrated system platform that will allow any third-party company to develop
applications for the road market. During the project, the safetrip platform developed and demonstrated the following applications: Provision of real-time traffic information and warnings generated by the collection of data from other vehicles, -emergency call system, -tracking in real-time of vulnerable passenger’s transports.
Http://www.safetrip.eu/ Sanef
Satre 2008 2012 Safe road trains with platooning http://www.sartre-project.eu Ricardo Scout 2016 2018 Identifying pathways for an accelerated proliferation of safe and connected high-degree automated
driving. VDI/VDE
Straightsol 2011 2014 Creation of new smart urban freight systems. Https://drive.google.com/file/d/0byctqr4yifydufu1x2d5dkdreek/view
Institute of Transport Economics, Oslo, Norway
Tide 2012 2015 The mission of the TIDE project is to enhance the broad transfer and take-up of 15 innovative urban transport and mobility measures throughout Europe and to make a visible contribution to establish them as mainstream measures.
http://www.tide-project.eu/
Timon 2015 2018 TIMON aims to deliver a framework of services to all users of the transport ecosystem – drivers, vulnerable road users, and businesses.
http://www.timon-project.eu/
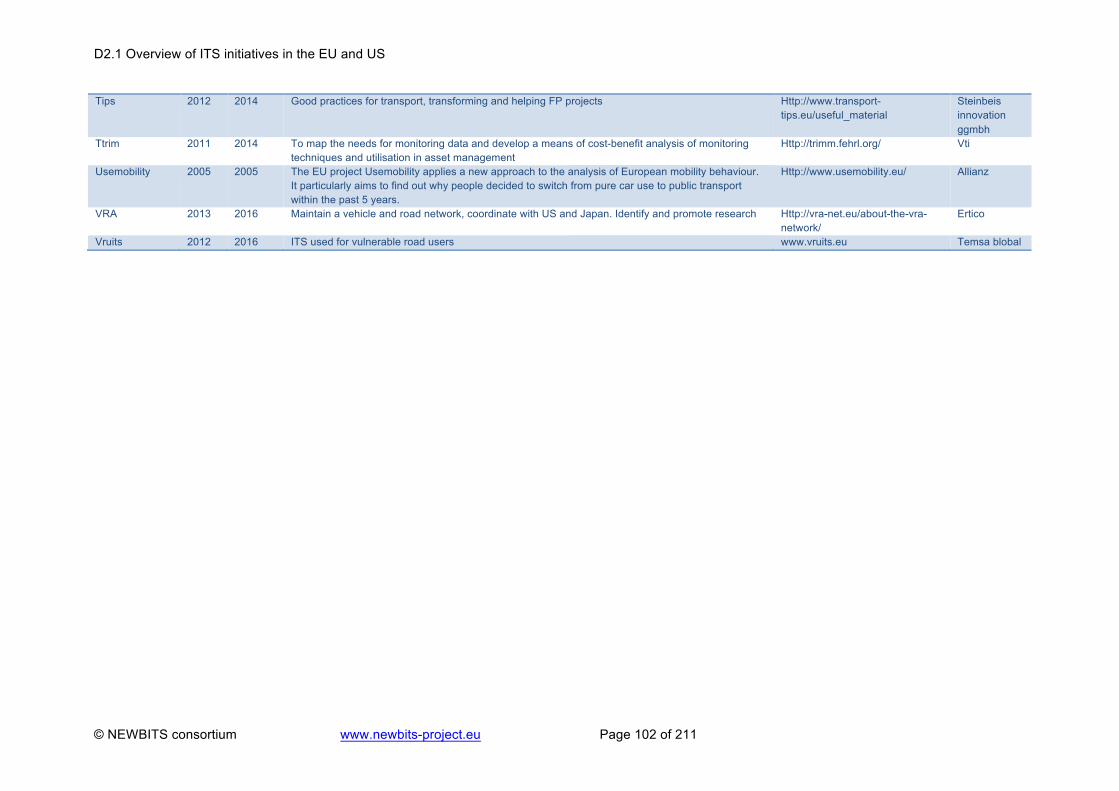
D2.1 Overview of ITS initiatives in the EU and US
© NEWBITS consortium www.newbits-project.eu Page 102 of 211
Tips 2012 2014 Good practices for transport, transforming and helping FP projects Http://www.transport-tips.eu/useful_material
Steinbeis innovation ggmbh
Ttrim 2011 2014 To map the needs for monitoring data and develop a means of cost-benefit analysis of monitoring techniques and utilisation in asset management
Http://trimm.fehrl.org/ Vti
Usemobility 2005 2005 The EU project Usemobility applies a new approach to the analysis of European mobility behaviour. It particularly aims to find out why people decided to switch from pure car use to public transport within the past 5 years.
Http://www.usemobility.eu/ Allianz
VRA 2013 2016 Maintain a vehicle and road network, coordinate with US and Japan. Identify and promote research Http://vra-net.eu/about-the-vra-network/
Ertico
Vruits 2012 2016 ITS used for vulnerable road users www.vruits.eu Temsa blobal

D2.1 Overview of ITS initiatives in the EU and US
© NEWBITS consortium www.newbits-project.eu Page 103 of 211
Appendix 2 Interview Format Questionnaire on ITS applications
A. Background For a European Commission funded research project, entitled NEWBITS (see Box 1 for more information), we aim, among other things, to identify and assess current initiatives in the field of intelligent transport systems (ITS). ITS applications refer to ITS technologies that allow vehicles to communicate with other vehicles (vehicle-to-vehicle systems) or with infrastructure (vehicle-to-infrastructure or infrastructure-to-vehicle systems). In this respect we apply a broad scope, including ITS applications for all types of transport modes and all types of transport (e.g. both long- and short-distance trips).
As input for our analyses we will use several assessment methods, one of which is interviewing some relevant experts/stakeholders from all over Europe and the US. The first objective of these interviews is to identify specific ITS applications that are currently implemented/tested in Europe and the US. Secondly, we would like to gather data on the key performance indicators used with respect to ITS applications as well as information on the main barriers and enablers for these applications.
In the remainder of this note you find the questions we would like to discuss with you face-to-face or by phone.
Box 1 NEWBITS – NEW business models for ITS
The main objective of the NEWBITS project is to improve the understanding of the changing conditions and dynamics that affect and/or influence the deployment and performance of innovative ITS innovations. This knowledge should minimize the failures inherent to (C-)ITS innovation diffusion, evolve present business models, and identify effective incentives to accelerate ITS deployment. To acquire this knowledge, an in-depth analysis of current/future ITS applications , their barriers and enablers, market conditions, user preferences, etc. will be carried out. Additionally, NEWBTIS acknowledge the fundamental importance of people in implementing complex innovations like ITS. The project will therefore thoroughly study the networks of ITS innovations, both internal and external to the organisations acting in the ITS fields, in order to provide insight in the different roles stakeholders have in these networks, their interactions and the added value of cooperation between these actors. Based on all knowledge acquired in this project, guidelines and strategies to foster ITS deployment and performance will be developed as well as a training program for specific stakeholders.
B. General information Name of organisation: Name of Interviewee(s): Position of the interviewee: Interviewer(s): Date and Time: Location:
1) In what way are you (or is your organisation) involved in the field of ITS solutions?

D2.1 Overview of ITS initiatives in the EU and US
© NEWBITS consortium www.newbits-project.eu Page 104 of 211
C. ITS applications
2) What are/should be, in your opinion, the main objectives of implementing ITS applications (e.g. reducing traffic jams, improving traffic safety, reducing emissions, etc.)? Multiple answers possible.
3) What are, to your knowledge, the main ITS applications that are currently applied/tested?
4) To your expectations, which developments will affect ITS most in the medium term (2025)?
Please consider technological, financial/economic, social, and policy related developments.
D. Key performance indicators
5) What are in your opinion the preferred KPIs with respect to: a. the deployment of ITS applications? b. the performance of ITS applications? How do these preferred KPIs differ between various types of ITS applications?
6) What are the main barriers to apply these KPIs? And how could these barriers be overcome?
7) What are the KPIs that are actually applied for the specific ITS applications identified in
question 3? Please consider both KPIs for the deployment and performance of the specific ITS application.
E. Barriers
8) What are, in general, the most important barriers currently for: a. the deployment of ITS applications; b. the performance of ITS applications. How do these barriers differ between various types of ITS applications?
9) What are the main barriers with respect to the specific ITS applications identified in question 3? Please consider both barriers for the deployment and performance of the specific ITS application.
10) What do you foresee to be the largest barriers for the deployment and performance of ITS applications in the future?
11) What are, in your opinion, the best options to tackle the barriers identified in questions 8-10?
F. Enablers
12) What are, in general, the main enablers for: a. the deployment of ITS applications; b. the performance of ITS applications. How do these enablers differ between various types of ITS applications?

D2.1 Overview of ITS initiatives in the EU and US
© NEWBITS consortium www.newbits-project.eu Page 105 of 211
13) What are the main enablers with respect to the specific ITS applications identified in
question 3? Please consider both enablers for the deployment and performance of the specific ITS application.
14) What are, in your opinion, the main options to strengthen the enablers identified by question 12 and 13?
G. Final questions
15) Is there anything else you would like to add to this interview?
16) Could you recommend two additional stakeholders who you feel it might be useful to speak to for this study?
17) We would like to provide a summary of names of people interviewed in a NEWBITS deliverable. Is this fine by you?
18) If there are any further questions/clarifications needed, do you mind if we get in touch with you again?

This project has received funding from the European Union's Horizon 2020 research and innovation programme under the European Union's Horizon 2020 research and innovation programme under grant agreement No 723974
Appendix 3 Long list of services Table A.3 Long list of services Project Short description of service Key enabling
technology TRL Geographic
area Type of transport
Transport mode
Primary benefits of ITS
Institutional arrangements
Belfast rapid transit
new and dynamic public transport Belfast
Communication 7 Interurban Unscheduled Road Safety PPP
CBTC Communication based train control Identification 9 Urban Unscheduled Road Environmental Public Co-Cities European real time traffic information Hardware 9 Interurban Unscheduled Road Efficiency PPP eBrio+ (VIX) innovative smart booking, ticketing and
payment Sensors 9 Both Scheduled Buses Efficiency Private
Enhanced Wisetrip
multi modal international journey planning system
Communication 9 Urban Scheduled Rail Efficiency Private
ERMTS European train communication technology
Communication 7 Interurban Unscheduled Trucks Efficiency PPP
FAMS Testing GPs, GPRS to assist DRT Identification 9 Urban Unscheduled Road Efficiency Public FAMS virtual agency model service Software 7 Urban Unscheduled Road Efficiency PPP IFM interoperable fare management project Communication 8 Both Scheduled Buses Comfort PPP On vehicle CCTV
On board camera systems Communication 7 Interurban Unscheduled Cars Efficiency PPP
Onschedule and Ontime
Planning of crew and vehicle assignment
Communication 7 Interurban Unscheduled Cars Safety PPP
Oyster Card London smartcard Communication 5 Interurban Unscheduled Cars Safety PPP RTPI Real time passenger information Ireland Software 9 Urban Scheduled Multimodal Efficiency PPP Scot Rail smartcard
Scottish smartcard Communication 7 Interurban Unscheduled Trucks Efficiency PPP
TIMON Enhanced real time traffic API Communication 9 Both Scheduled Air Safety PPP EcoGem Cooperative route planning Hardware 6 Urban Unscheduled Road Safety PPP Ecomove Environmental driving advice
(ecoSmartDriving) Communication 7 Interurban Unscheduled Cars Environmental PPP
Ecomove Environmental route planner (EcoTRip) Communication 7 Urban Unscheduled Cars Environmental PPP

D2.1 Overview of ITS initiatives in the EU and US
© NEWBITS consortium www.newbits-project.eu Page 107 of 211
Ecomove Real time route planner Software 7 Both Both Multimodal Comfort PPP Flitsmeister Real time traffic advice Communication 7 Interurban Unscheduled Road Environmental PPP Fotsis Extended Ecall Communication 7 Urban Unscheduled Cars Environmental PPP Fotsis Safety incident management Communication 7 Urban Unscheduled Road Safety PPP HeEro eCall pilots Software 7 Urban Unscheduled Cars Environmental PPP I-5 smart truck parking
Smart truck parking project Positioning 7 Both Both Multimodal Efficiency PPP
In-Time multimodal real time traffic information Communication 7 Both Unscheduled Cars Environmental PPP Mobility 2.0 App for electric vehicle optimization Communication 6 Interurban Unscheduled Cars Efficiency PPP Octo U Measuring telematics Communication 7 Both Unscheduled Cars Environmental PPP Parckr Cooperative truck parking app Software 9 Both Both Multimodal Comfort Private Praktijkproef Amsterdam Adam
Real time travel advice Hardware 7 Both Unscheduled Trucks Environmental PPP
Praktijkproef Amsterdam Superroute
Real time travel advice Algorithms 8 Both Scheduled Multimodal Efficiency PPP
ProbeIT foresight vehicle
Providing timely and location based advise
Communication 7 Interurban Unscheduled Cars Environmental PPP
Q-Warn Queue warning Hardware 7 Both Unscheduled Cars Environmental PPP Smartfreight Urban freight management on board
system Communication 7 Both Both Road Efficiency PPP
SmarTrAC innovative application that collects travel data
Communication 7 Urban Unscheduled Cars Environmental PPP
VSC -A DSRC 5.9 GHZ positioning project Hardware 7 Urban Unscheduled Cars Environmental PPP Vx-TINFO Weather response traffic information
systems Software 9 Both Unscheduled Cars Comfort Private
Waze Real time travel and traffic advice Communication 9 Both Scheduled Rail Efficiency PPP Zoof Cooperative traffic information mobile
application Software 8 Interurban Scheduled Air Efficiency PPP
Access control in Rome
Access control for polluting vehicles Communication 8 Interurban Unscheduled Cars Efficiency PPP
ASPI Highway management Autostrada per L'Italia
Communication 7 Interurban Unscheduled Trucks Efficiency PPP
Automatic passenger counting systems
Counts passengers automatically Hardware 7 Both Unscheduled Cars Safety PPP
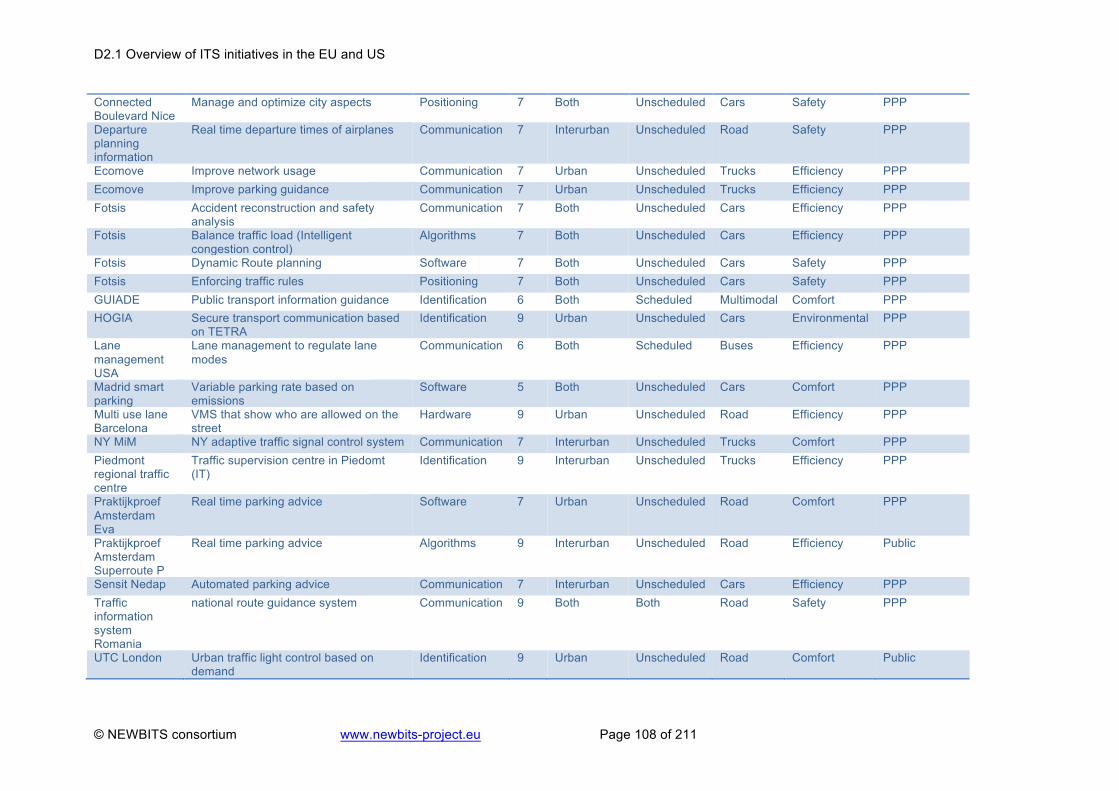
D2.1 Overview of ITS initiatives in the EU and US
© NEWBITS consortium www.newbits-project.eu Page 108 of 211
Connected Boulevard Nice
Manage and optimize city aspects Positioning 7 Both Unscheduled Cars Safety PPP
Departure planning information
Real time departure times of airplanes Communication 7 Interurban Unscheduled Road Safety PPP
Ecomove Improve network usage Communication 7 Urban Unscheduled Trucks Efficiency PPP Ecomove Improve parking guidance Communication 7 Urban Unscheduled Trucks Efficiency PPP Fotsis Accident reconstruction and safety
analysis Communication 7 Both Unscheduled Cars Efficiency PPP
Fotsis Balance traffic load (Intelligent congestion control)
Algorithms 7 Both Unscheduled Cars Efficiency PPP
Fotsis Dynamic Route planning Software 7 Both Unscheduled Cars Safety PPP Fotsis Enforcing traffic rules Positioning 7 Both Unscheduled Cars Safety PPP GUIADE Public transport information guidance Identification 6 Both Scheduled Multimodal Comfort PPP HOGIA Secure transport communication based
on TETRA Identification 9 Urban Unscheduled Cars Environmental PPP
Lane management USA
Lane management to regulate lane modes
Communication 6 Both Scheduled Buses Efficiency PPP
Madrid smart parking
Variable parking rate based on emissions
Software 5 Both Unscheduled Cars Comfort PPP
Multi use lane Barcelona
VMS that show who are allowed on the street
Hardware 9 Urban Unscheduled Road Efficiency PPP
NY MiM NY adaptive traffic signal control system Communication 7 Interurban Unscheduled Trucks Comfort PPP Piedmont regional traffic centre
Traffic supervision centre in Piedomt (IT)
Identification 9 Interurban Unscheduled Trucks Efficiency PPP
Praktijkproef Amsterdam Eva
Real time parking advice Software 7 Urban Unscheduled Road Comfort PPP
Praktijkproef Amsterdam Superroute P
Real time parking advice Algorithms 9 Interurban Unscheduled Road Efficiency Public
Sensit Nedap Automated parking advice Communication 7 Interurban Unscheduled Cars Efficiency PPP Traffic information system Romania
national route guidance system Communication 9 Both Both Road Safety PPP
UTC London Urban traffic light control based on demand
Identification 9 Urban Unscheduled Road Comfort Public

D2.1 Overview of ITS initiatives in the EU and US
© NEWBITS consortium www.newbits-project.eu Page 109 of 211
Congestion charge London
Charge system for traffic (peak) hours Sensors 9 Both Scheduled Buses Safety Private
Maut German and Austrian km toll system for freight
Identification 9 Both Scheduled Multimodal Comfort PPP
Milano Area C Low emission zone & charging scheme Communication 7 Interurban Unscheduled Trucks Comfort PPP Sanef Automated toll Uk Liber-t Sensors 9 Both Unscheduled Cars Safety Private Stockholm congestion pricing
Congestion pricing and management in Stockholm
Communication 9 Both Scheduled Buses Efficiency Private
Telepass Automated toll recognition Algorithms 9 Urban Unscheduled Road Efficiency PPP TEXpress Texan express lane Algorithms 9 Both Unscheduled Road Efficiency PPP ADS-B Plane communication technology Communication 9 Urban Unscheduled Cars Comfort Private Austroads heavy vehicle platooning
Truck platooning Software 9 Interurban Unscheduled Road Efficiency PPP
C-ACC Cooperative adaptive cruise control test in United States
Communication 7 Urban Unscheduled Cars Comfort PPP
CITI Collision warning system Communication 7 Urban Unscheduled Cars Comfort PPP C-ITS corridor Netherlands
Vehicles receive a warning about road works
Communication 9 Both Unscheduled Cars Comfort Private
C-ITS corridor Netherlands
Vehicles send data automatically to probes
Communication 7 Interurban Unscheduled Cars Efficiency PPP
Companion Truck platooning Communication 7 Both Unscheduled Cars Efficiency PPP Connected cruise control
Connected cruise control Communication 7 Both Unscheduled Cars Efficiency PPP
Dante Intersection collision warning Hardware 7 Urban Unscheduled Cars Safety PPP Ecomove Improve intersection control Communication 7 Interurban Unscheduled Road Safety PPP Ecomove Intersection control, visualisation and
prioritisation Hardware 9 Interurban Unscheduled Cars Comfort Private
Ecomove Lane advice Communication 7 Interurban Unscheduled Road Safety PPP Ecomove Merging support Identification 9 Both Scheduled Multimodal Comfort Private Ecomove Ramp control Software 7 Urban Unscheduled Trucks Efficiency PPP Ecomove Speed and lane advice Identification 9 Interurban Unscheduled Road Efficiency Private Ecomove Traffic light control (GLOSA) Software 6 Both Scheduled Buses Efficiency PPP eSENAL Intelligent signalling system Communication 9 Both Scheduled Buses Comfort Private Flowpatrol Cooperative traffic information mobile
application Positioning 7 Interurban Unscheduled Road Efficiency PPP
Fotsis Tracking of special vehicles Identification 9 Interurban Unscheduled Road Comfort PPP

D2.1 Overview of ITS initiatives in the EU and US
© NEWBITS consortium www.newbits-project.eu Page 110 of 211
Fotsis Trucks intersection priority Communication 7 Both Unscheduled Road Safety PPP Freilot Truck priority at intersections Communication 7 Both Unscheduled Cars Safety PPP Intelvia Intelligent Electronic Traffic Signalling
System Communication 7 Both Unscheduled Trucks Efficiency PPP
Roadart Truck platooning in special situations Sensors 9 Urban Unscheduled Road Efficiency Public Safecross Smart pedestrian crossing. Identification 9 Urban Unscheduled Road Efficiency PPP Satre Road train
Safe road train Positioning 7 Both Unscheduled Multimodal Comfort PPP
Uk Autodrive automated and connected car trial Communication 7 Both Unscheduled Cars Efficiency PPP

D2.1 Overview of ITS initiatives in the EU and US
Appendix 4 Synthesis of Judgement process Appendix 4.1. Consolidated Decision Matrix for Criteria Comparison
Aggregation of individual judgments for 8 Partners
C1 C2 C3 C4 C5 C6 C7 C8 C9 C10
C1 1 1.75 3.07 2.61 1.86 0.48 2.82 0.59 1.25 1.83
C2 0.57 1 1.63 2.48 2.38 0.23 2.52 0.50 1.08 0.71
C3 0.33 0.61 1 1.48 1.99 0.28 1.47 0.42 0.96 1.16
C4 0.38 0.40 0.67 1 0.93 0.20 0.55 0.32 0.40 0.96
C5 0.54 0.42 0.50 1.08 1 0.23 1.76 0.48 0.53 1.39
C6 2.09 4.28 3.63 4.94 4.37 1 3.87 1.30 2.97 3.01
C7 0.35 0.40 0.68 1.80 0.57 0.26 1 0.41 0.81 0.54
C8 1.68 2.01 2.38 3.16 2.07 0.77 2.46 1 2.59 3.07
C9 0.80 0.93 1.04 2.53 1.89 0.34 1.23 0.39 1 0.76
C10 0.55 1.42 0.86 1.04 0.72 0.33 1.85 0.33 1.32 1
Appendix 4.2 Consolidated Decision Matrix for Categorisation with respect to each criterion
Aggregation of individual judgments for 8 Partners
Criterion Innovation level 1 1.39 1.36
0.72 1 1.87
0.74 0.54 1
Criterion ITS enabling Technology 1 4.88 4.73
0.20 1 0.90
0.21 1.11 1
Criterion Geographic scope 1 0.27 0.20
3.67 1 0.43
4.99 2.31 1
Criterion Transport mode 1 0.23 0.22
4.26 1 0.87
4.45 1.15 1
Criterion Transport type 1 0.25 0.25
4.00 1 1.40
3.97 0.71 1
Criterion Primary benefits 1 0.23 0.16
4.41 1 0.61

D2.1 Overview of ITS initiatives in the EU and US
6.37 1.65 1
Criterion Institutional framework 1 0.39 0.30
2.60 1 1.12
3.31 0.89 1
Criterion Type of stakeholders 1 0.37 0.30
2.73 1 0.86
3.31 1.16 1
Criterion Transferability 1 0.51 0.32
1.95 1 2.59
3.17 0.39 1
Criterion Deployment period 1 0.58 0.66
1.72 1 0.62
1.51 1.61 1
Consensus 98.39%
Appendix 4.3 The overall AHP decision hierarchy

D2.1 Overview of ITS initiatives in the EU and US
Appendix 5 Service Fiches Belfast Rapid Transit
Description
Status Ongoing (2013 – 2018)
Country Northern Ireland, UK
Description of
service
Belfast Rapid Transit (BRT) is an innovative and ambitious project that will create a
new and dynamic public transport system for Belfast. The system will use high
quality rapid transit vehicles which will provide a modern, comfortable environment
for passengers in terms of space, security and on-board information. the BRT
vehicles will have on-board information screens providing real time journey
information and audio visual next halt and destination announcements. Free on-
board Wi-Fi will also be provided. The BRT vehicles will be equipped with CCTV
for both passenger and driver safety. Also, the halts will provide travel information.
Main objective There will be a noticeable impact on the general traffic that uses the BRT corridors,
particularly as the system gets established, but the impact will reduce as more
people realise the benefits of using BRT.
It is acknowledged that there is a need for many people to continue using their cars
and for commercial traffic to be able to move about the city. It is therefore the aim
to deliver an appropriate balance between the competing demands. Also, users will
be better informed and make safer, more coordinated, and ‘smarter’ use of public
transport networks (efficiency and environment).
Innovation
phase
8
Type of ITS The main type of ITS used seems to be APTS, Real time system status update.
Stations used are: on-board information screens, mobile phones, automatic vehicle
location system and signal control systems.
Technology
used
The technologies used seem to be:
• cellular;
• internet/wi-fi;
• automatic vehicle location system technology;
• signal control systems technology.
Geographical
scale
The first phase of the BRT network, which is currently being implemented, will link
East Belfast, West Belfast and Titanic Quarter via the City Centre.
It is the intention to extend the BRT network to other areas of Belfast, subject to the
success of phase 1 and the availability of funding. The Department is already
engaging with those responsible for proposed developments on potential routes
outside the current network to ensure as far as possible that the future provision of
BRT to key areas is not prejudiced.
Type of
transport
Buses
Type of
stakeholders
The investment comes from the Department for Regional Development of Northern
Ireland.
Belgian-based company Van Hool won the contract. They are a highly regarded
independent manufacturer of buses, coaches and industrial vehicles and the 4th
largest employer in Belgium.
They will be supported locally by Road Trucks Limited, based in Larne, which will
provide commissioning, maintenance and specialist support services for the BRT
vehicles. The BRT system will be operated by Translink when it begins services in
September 2018.
Institutional
arrangements
The funds seem to be entirely public (it’s not very clear).
Transferability The service can be transferred to other regions and modes of transport.

D2.1 Overview of ITS initiatives in the EU and US
Communications based train control
Description
Status Applied in multiple initiatives
Country Globally. Paris, New York, London
Description of
service
Urban Metro communicates their location directly to the traffic management centre.
This allows them to continuously broadcast their location, allowing a more efficient
use of the system. Train have safety barriers (blocks) before and after their
occupancy. In older systems, this was fixed depending on points that the train
passed. CBTC allows these safety blocks to move along with the train. Even
controlling metros automatically and thus removing the driver. An example of the
system is Bombardier CityFlo
Main objective • Efficiency: trains are able to drive closer to each other as the safety
distance is applied better
• Environmental: less energy used due to less unnecessary braking
Innovation
phase
Operational. TRL 9
Type of ITS APTS Real time system status information
Technology
used
The following technologies are used:
GSM-R
Geographical
scale
Regional level: on specific parts of national highways and local test facilities.
Type of
transport
Trains and specifically metro and subway
Type of
stakeholders
• Railway operators
• Manufacturers of metros
• Service providers of rail management systems
Institutional
arrangements
Not applicable
Transferability Transferable to other cities and countries. Limited to rail transport

D2.1 Overview of ITS initiatives in the EU and US
European Real Time Traffic Information (Co-Cities)
Description
Status Co Cities Project started 2011 to 2014
Country UK, Spain, Czech Republic, Austria, Belgium, Germany, Italy
Description of
service
Co-Cities focused on providing one standardized interface between city traffic
information and the Traffic Information Service Providers, the In-Time common
interface.
The availability of the full “feedback loop” enables an end-to-end testing and
validation process for the single traffic information service in the cities and
elaborates the future expansion steps for cities and service providers. The core
service provided by Co-Cities being Interoperable and multimodal RTTI services to
end-users, offered by Traffic Information Service Providers (TISPs).
Main objective The increased reliability and actual real-time delivery of the traffic and travel
information services to the individual traveller and to the traffic management centres
(efficiency); the extension of the In-Time Commonly Agreed Interface to a number
of EU cities in order to increase the data and information flow and management; the
reduction of energy consumption in urban areas (environment) across different
modes of transport; the increased attractiveness of transport information services to
users in urban areas.
Innovation
phase
TRL9. Based on the outcomes from In-TIME and Co-Cities services were piloted in
diverse cities. The proposed service model of Co-Cities CAI (Commonly Agreed
Interface) was made fully operative at the end of the project.
Type of ITS APTS Real Time Passenger Transport Information
Technology
used
Co-Cities used different hardware and software platforms such as personal
navigation devices, smart phones and web services and developed Europe–wide
services based on regional traffic and travel data.
Geographical
scale
Urban level, EU wide.
Type of
transport
Multi modal applications covering both passenger and freight applications
Type of
stakeholders
• Government/cities
• European Union
• Service providers
• Research institutes
• OEMS
• Automotive suppliers
• Emergency services
• Parking operators
• Travellers/passengers
• Road operators
Institutional
arrangements
PPP
Co-Cities was a CIP/ ICT PSP project under the 7th Framework Programme
Transferability Co-Cities highlighted global possibilities where consistent standards are adopted
throughout Regions, Countries. Technologies can be applied across all modes

D2.1 Overview of ITS initiatives in the EU and US
eBrio+ (VIX)
Description
Status On-going
Country Australia
Description of
service
Vix Technology has been designing, delivering, operating and maintaining some of
the world's leading transit ticketing systems for the past 30 years.
The VIX portfolio includes innovative smart booking, ticketing and secure payment
systems.
eBrio+ is an integrated, multi-modal, multi-operator and multi-media closed-loop
ticketing solution. This ticketing solution can manage multiple transport operators
and a variety of fare payment media including contactless magnetic cards, paper
tickets and smartphone apps. Vix eBrio+ is implemented as a complete end-to-end
fare collection system including devices and back office systems.
Main objective • Efficiency
• Comfort
• Environment
Innovation
phase
Mature for global market
Type of ITS APTS Smart Ticketing
Technology
used
Key Enabling technology:
• Identification technologies (smart card)
• Hardware: contactless readers, ticketing machines (on-vehicle, on-
platform), portable terminals
• Communication technologies (Wi-Fi, Bluetooth, LTE, WLAN)
• Software infrastructure: Electronic data interchange
• Identification technologies
Geographical
scale
Global
Type of
transport
Multi Modal Passenger Transport
Type of
stakeholders
• Government/cities
• Service providers
• Automotive suppliers
• Travellers/passengers
Institutional
arrangements
Private
Transferability Can be used by any operator, transport authority

D2.1 Overview of ITS initiatives in the EU and US
Multi Modal International Journey Planning system (Enhanced Wisetrip)
Description
Status Wisetrip and Enhanced Wisetrip were EU funded research projects under the FP7
programme.
They were implemented from 2008 to 2014.
Country UK, Netherlands, Finland, Italy, Spain, Greece, China, Brazil.
Description of
service
Building on the knowledge developed in the WISETRIP
project, Enhanced WISETRIP aimed to improve the possibilities for individual
planning, booking and making multimodal journeys. The system is designed to take
into consideration all user needs, multiple trip criteria, environmental impact and
personal preferences using ITS services in real time covering: Bus, Coach, Rail,
Ferry, Flights etc. In real time.
Main objective The key objective of WISETRIP being to increase accuracy of travel information
data and facilitate exchange of data.
• Safety
• Efficiency
• Comfort
• Environment
Innovation
phase
TRL 8. Platform now used by Google transit.
Type of ITS APTS. WISETRIP platform falls under the ITS subcategory (or market sub-
segment) of Multimodal Journey Planners.
A multimodal journey planner (JP) is an IT system able to propose a set of one or
more transport services answering at least the question “How can I go from
location A to location B at a given departure/arrival date and time and under which
conditions”.
Simplistically, the system operates with information taken from participating
Journey Planning systems that receive real time information from buses, coaches,
trains, ferries, planes.
Technology
used
Key “technology blocks” used and developed in WISETRIP platform are:
Advanced real time integration technologies, sourced from variant data providers
allowing Real-time event data and consideration of extraordinary conditions;
Dynamic trip re-planning.
Software Infrastructure: Flexible Application Programming Interface (API) allowing
mobile demonstrator and integrated ticket approach.
Algorithms: A backward label-setting algorithm is proposed for solving the multi-
criteria time-dependent shortest path problem in a multimodal network.
Geographical
scale
Enhanced WISETRIP platform aimed to support a EU level integrated multimodal
journey planner.
Type of
transport
All types / modes of PT at Local, Regional, National and International level.
Scheduled terrestrial collective transport services are the core object of multimodal
travel information.
Type of
stakeholders
• Government/cities
• European Union
• Service provider
• Research institutes
• Travellers/passengers
• Road operators
Institutional
arrangements
Wisetrip platform is a Public-Private Partnership, being developed under European
Commission FP7 Programme.
Transferability This application is easily transferable where other Journey Planning providers
agree to share real time information and integrate systems.

D2.1 Overview of ITS initiatives in the EU and US
European rail traffic management system
Description
Status Being deployed
Country Global, EU initiative
Description of
service
Standardisation of train management systems. Cooperative system that should
allow trains to operate cross border (if track gauges are same) as the
communication language is the same. The ERTMS provides standardized rail
messages to trains. Using (wireless) communication trains could transmit location,
speed, direction and more route information to the traffic centre and other trains.
This allows automatically calculations of routes and available track.
Main objective Efficiency (Cross border operations and higher track capacity)
Safety (often replaces outdated equipment)
Innovation
phase
9 Operational but not fully deployed
Type of ITS APTS Real time system status information
Technology
used
GSM-R for wireless communication
Geographical
scale
Railway
Type of
transport
Scheduled trains
Type of
stakeholders
• Train manufacturers
• Railway managers
• Train drivers
• European Union
Institutional
arrangements
ERTMS is developed as an initiative from the European Union and now has
become a standard.
Transferability Transferable to other railways

D2.1 Overview of ITS initiatives in the EU and US
Testing GPs, GPRS to assist the development of Demand Responsive Transport services in real time
(FAMS)
Description
Status Research project funded by EU ITS programme 2002 -2004.
Country UK (Scotland) and Denmark
Description of
service
Testing how GPS, GPRS, could assist development of Multi Modal Transport
Solutions using Travel Dispatch Centre to broker solutions between users and multi
modal supply chain. Contact centre takes bookings from individuals and
stakeholders to provide multi modal solutions using ITS platform to send information
to/from vehicle to allow real time services to operate in the most cost effective
manner.
GPS, GPRS was used to track vehicles and allocate trips in real time to vehicles
within pilot area. Reduction in duplication of resources, maximising use of
resources to meet known demands.
Main objective Results have demonstrated significant savings in costs, reduction in journey time,
increased customer satisfaction. Reduced pollution due to less vehicles usage
(environment), increased comfort (best vehicle used to meet client requirements)
and increased passenger numbers.
Innovation
phase
Technologies are now mature. UBER business model is based on this concept.
Type of ITS Public Transport Information: Real time system status information and Schedule
optimization
Technology
used
Key enabling technologies:
• Positioning technologies: Global Navigation Satellite Systems (GNSS,
GPS); Real time locating Systems (RTLS); On-board Antenna receive and
forward units
• Communication technologies (GSM-R Antenna, GSM/GPRS, Internet, Wi-
Fi)
• Hardware (On-board computers, CBI)
Geographical
scale
Application can work in any area globally. Depends on ability to provide sufficient
bandwidth to cope with data demands from 100s of vehicles and 1000s of
passengers.
Type of
transport
Business model (FAMS) can support passenger transport, freight using multi modal
supply chain.
Type of
stakeholders
• Government/cities
• European Union
• Service providers
• Research institutes
• OEMS
• Automotive suppliers
• Emergency services
• Parking operators
• Travellers/passengers
• Road operators
Institutional
arrangements
PPP
This service was tested under FAMS project, funded by EC ITS Programe
Transferability Model has been transferred over the years with UBER, Lyft, Parcel Delivery
Companies using agency model. Basic model can be adopted to meet all transport
demands. Data input requirement required in real time to link needs of customer
with availability of vehicles to provide services.

D2.1 Overview of ITS initiatives in the EU and US
Virtual Agency Model Service (FAMS)
Description
Status Pilot project (2002-2004)
Country Scotland, Italy
Description of
service
The objective of the FAMS (Flexible Agency for Collective Demand Responsive
Mobility Services) Trial Project was to scale up technology, services and business
models currently adopted in DRT and to support the evolution from single DRT
applications towards the concept of a Flexible Agency for Collective Demand
Responsive Mobility Services.
FAMS has innovated solutions for DRT planning and operation by the
implementation and trial of the Flexible Agency. Existing DRT management tools
have been adapted and made interoperable within an e-Business collaborative
environment allowing cooperation amongst transport service suppliers.
Main objective The main objective of this application is to improve Demand Responsive Transport
Concept utilising ITS platform to create a virtual agency to provide cost effective
solutions, reducing duplication in services, increase number of passengers at
reduced travel times, increasing traffic safety and reduce the number of incidents
(safety), to reduce the number of traffic jams and improve the efficiency of road use
(efficiency), and to ensure that traffic flows are smoother resulting in less CO2-
emission (environment).
Innovation
phase
TRL 7
Type of ITS APTS: Demand Responsive Transport is not an ITS “per se”, but a form of shared-
ride public transport that requires of multi-data sourced information to be put in
place, as well as several enabling ITS such as AVM and AVL. As Flexible Routing
and Scheduling applications, DRTs could be at the intersection of Schedule
Optimization and Optimized Fleet Management.
Technology
used
FAMS utilised several enabling ICTs:
• Booking and reservation systems to manage customer requests
• Internet, IVRS and palm-top devices (PDAs, smart phones)
• Dispatching software
• Communication systems to link TDC software platform with drivers and
customers
• GPS based or GMS-based vehicle location systems
• Smart card
• Management information systems for data analysis
Geographical
scale
Local-Regional level.
FAMS involved 4 EU countries and pilots were deployed at two cities (Florence
Metropolitan Area and Angus).
Type of
transport
FAMS model was tested for Cars, Taxis, Community Transport, Bus, Coach. The
service is useful for all type of PT real time demands.
Type of
stakeholders
• Local Authorities
• Operators
• ITS providers
• User groups
Institutional
arrangements
PPP
FAMS platform was developed under a EC funded project.
Transferability service can be transferred anywhere globally. UBER, Lyft have adopted concept

D2.1 Overview of ITS initiatives in the EU and US
Interoperable Fare Management Project – IFM
Description
Status Finished (duration January 2008 – December 2009)
Country The partners involved in the project were based in United Kingdom, Germany,
Belgium and France.
Description of
service
In 2006, the French, German and UK based national interoperable transport
organisations, who with many others across the world had been working together to
write the International Standard on IFM (ISO EN 20014), came together to propose
a project to the European Commission relating to IFM.
Its main objective was to provide travellers with common styles of contactless
media throughout Europe which can be used for multiple transport products in
different geographic areas and for sustainable modal switching, such as the use of
'Park and Ride', unlike existing smart cards which are restricted to specific city or
regional geographies.
The project expected to significantly lower the barriers to mobility and encourage
the use of public transport, contributing to a reduction of carbon emissions and a
reduction or elimination of paper tickets, thus further enhancing the impact of smart
media on environment and on the efficiency of public transport.
Main objective The project was aimed at making the mobility of people more efficient and
environmentally sustainable by facilitating informed modal switching and the
seamless accessibility of public transport. It aimed at innovative, safe and reliable
ticketing and fare management across Europe using interoperable smart media with
the specific aim of encouraging increased usage of public transport.
Innovation
phase
6
Type of ITS APTS. Smart & multi ticketing
Technology
used
Smartcard technology.
Geographical
scale
The partners involved in the project were based in United Kingdom, Germany,
Belgium and France. However, the main National IFM organisations had a shared
vision to create an EU-IFM network to provide direction, co-ordination, networking
of Best Practice; implement a pan-European IFM initiative; promote further links to
ISO and European Standards including NFC and the Security and Certification of
devices.
Type of
transport
Public passenger transport.
Type of
stakeholders
The Partners involved in the projects were:
• United Kingdom: ITSO Limited (Coordinator); University of Newcastle upon
Tyne
• Germany: TUV Rheinland Consulting GmbH; VDV Kernapplikations GmbH
& Co-KG
• Belgium: International Association of Public Transport
• France: PREDIM / Urba 2000; Societe National des Chemins de fer France;
Université Paris Ouest Nanterre La Défense; Regie Autonome des
Transports Parisiens
Institutional
arrangements
The IFM project has been funded by the European Commission under the 7th
Community Framework Programme for research and technological development, as
the first project of the IFM initiative.
Transferability The service was designed to provide world leadership in its segment and to deliver
results which can be transferred to areas outside of the transportation sector world-
wide.

D2.1 Overview of ITS initiatives in the EU and US
On Vehicle CCTV Systems
Description
Status On-going. Commercial products manufactured and commercialized globally.
Country Global solutions
Description of
service
Passenger security and driving surveillance using UMTS / WLAN. Video cameras
installed inside and outside bus to monitor passenger behaviour and other road
users.
Main objective • Safety
• Comfort
Innovation
phase
Mature market, TRL 9
Type of ITS APTS On Vehicle CCTV Systems can be considered in the category of Mobile
Video Surveillance applications for transport. The term Mobile is added to most
computer based systems as synonymous of several different concepts, ranging on
ubiquitousness, wireless connection, and portability.
On Vehicle CCTV Systems refer to the instalment of surveillance systems in
portable environments (such as buses or trains), which require wireless access for
infrastructure and internet services. Furthermore, camera devices might connect to
the system core by wireless links to address/overcome the environmental
conditions.
Technology
used
Surveillance systems are typically made of:
Several sensors, analysis units and actuators. Those can be deployed with several
degrees of mobility.
The key enabler technologies to support portability/mobility are related to
Communication technologies. Precisely, wireless communication and mobile
technologies (UMTS/WLAN/Wi-Fi), which allow efficient transmission, feature rich
and powerful mobile and wireless devices.
Geographical
scale
Mobile CCTV systems and applications for train and buses are currently available
globally
Type of
transport
All modes both public and freight transport
Type of
stakeholders
• ITS Service providers (R2P, Synectics, Vidiwave, Viseum, Tactical
Micro…)
• Emergency services (Law Enforcement Agencies, Health)
• Road operators
• Public Transport Operators
• Public Transport Authorities
Institutional
arrangements
Due to the maturity of the key technologies involved, on vehicle CCTV Private
companies offer services and applications to Public or Private Operators in the
Train and Bus modes.
Transferability High level of transferability. Mobile CCTV systems can be installed and operate on
any vehicle

D2.1 Overview of ITS initiatives in the EU and US
Optibus: Ontime & Onschedule
Description
Status On-going.
Country Israel
Description of
service
Optimization application, based on new patent pending algorithms. OnSchedule™,
powered by Optibize™, plans crew and vehicle assignments using Interactive
Schedule Optimization (ISO) methodology. Schedulers compare and evaluate
different alternatives, immediately choosing the one that is most efficient and
appropriate. Optibus OnTime™, also powered by Optibize™, lets control room
operators respond in real time to unplanned incidents or changes, preventing
negative implications on passenger service and cost.
Main objective The main objective of this application is to improve public transport companies to
operate more efficiently, reducing cost (efficiency) and delivering better passenger
service.
Innovation
phase
TRL 9. Mature and already deployed in global markets
Type of ITS APTS Real time scheduling Solutions (Scheduling optimization)
Technology
used
Communication technologies (WLAN/WiFi, Bluetooth, Zigbee, LTE)
Software infrastructure: cloud computing (SaaS)
Hardware (Smartphones and mobile computing devices, CBI computer)
Algorithms (routing)
Geographical
scale
Local, Regional, National
Type of
transport
Initially used by Bus companies (Road mode, Public transport).
Type of
stakeholders
Service providers
Institutional
arrangements
Private funding
Transferability Any operator could purchase and link to their systems to provide real time up to
date solutions to optimise performance of networks. Highly transferable to Multi
Modal Public Transport.

D2.1 Overview of ITS initiatives in the EU and US
Oyster card
Description
Status On-going
Country UK (London)
Description of
service
Oyster is a smartcard which can hold pay as you go credit, Travelcard and Bus &
Tram Pass season tickets. Use it to travel on bus, Tube, tram, DLR, London
Overground, TfL Rail, Emirates Air Line, River Bus services and most National Rail
services in London.
Main objective • Efficiency
• Comfort
• Environment
Innovation
phase
Mature transferrable
Type of ITS APTS Multi Modal Smart Ticketing Systems using Mobile devices and smartcards
Technology
used
Key Enabling technology:
• Identification technologies (smart card)
• Data storage technologies: RFID
Geographical
scale
Greater London
Type of
transport
All modes of public transport
Type of
stakeholders
• Government/cities
• Service providers
• Travellers/passengers
Institutional
arrangements
PPP
Public Transport Authority supported by ITS providers (DLR)
Transferability Could work anywhere where operators and authorities agree on system and
funding costs

D2.1 Overview of ITS initiatives in the EU and US
Real Time Passenger Information
Description
Status Application in use.
Country Ireland
Description of
service
Real Time Passenger Information (RTPI) shows when the bus is due to arrive at
the bus stop so the journey can be planned more accurately. RTPI is displayed on
signs at bus stops and shelters.
Main objective The RTPI shows when the bus is due to arrive at the bus stop so the journey can
be planned more accurately (efficiency).
In addition, the experience of real time bus arrival systems in other countries has
shown that they can contribute to an increase in the number of people choosing to
use the bus (environment).
Innovation
phase
8
Type of ITS APTS. Passenger information systems
Technology
used
Buses must be equipped with an Automatic Vehicle Location transmitter, which can
track the bus, using a Global Positioning System (GPS) and transmit the data in a
standard protocol. On-board software predicts the arrival time at the next bus stop.
This information is then sent to the sign through a central control system. The
screen at the bus stop counts down the minutes until the bus arrives. Updates are
usually received from the vehicle location system at 30 second intervals, so
information on the signs is regularly updated.
Geographical
scale
The National Transport Authority is currently providing a RTPI service for bus
passengers in the Greater Dublin Area and the regional cities (Cork, Galway,
Limerick and Waterford).
Type of
transport
The application is used for buses.
Type of
stakeholders
The National Transport Authority is responsible for the Real Time Passenger
Information service. Established in December 2009, they have responsibility for
contracting and securing the provision of public passenger transport services for
the travelling public, including information services.
The RTPI service is delivered in co-operation with Dublin Bus and Bus Éireann,
which is responsible for the roll out of the automatic vehicle location system and
the real time arrival predictions for its buses.
Dublin City Council provided technical expertise, managed the procurement of the
signs and software system and it is also coordinating the installation of signs, in
tandem with the relevant local authorities.
As the service is launched in other cities across Ireland, the National Transport
Authority is working to ensure that other public transport operators are included in
the future.
Institutional
arrangements
National Transport Authority seems to be an investor, but it is not clear.
Transferability The application could be transferred to other regions and mode of transport.
The Real Time Passenger Information system is designed to be able to take
information from other licenced bus operators, once information for their fleet is
available and tested. The National Transport Authority is in discussions with
representatives of LUAS and Irish Rail on their feeds.

D2.1 Overview of ITS initiatives in the EU and US
Scot Rail Smartcard
Description
Status In operation
Country United Kingdom
Description of
service
This is a smartcard that can be used on Scottish Rail services and on the SPT
Subway.
With a Smartcard there isn’t any need for paper tickets as they are all loaded onto a
single, reusable card. Several types of tickets are available, depending on the type
of travelling. The price is the same than the paper tickets, but some benefits are
available only on Smartcard.
It’s also faster and easier as the tickets can be bought online and there’s no need to
queue at the ticket office.
Main objective The main objectives were efficiency for both passengers (ease of use, greater
choice on how to pay for travel, time saving) and operators (less cash handling,
more information about customers, more marketing opportunities, quicker boarding
times, improvement of journey times and connection), economic (access to new
ticket types and discounts for passengers), environment (reduce emissions, more
use of public transport).
Innovation
phase
9
Type of ITS APTS Smartcard.
Technology
used
Smartcard technology.
Geographical
scale
Scotland
Type of
transport
Passenger rail and subway transport.
Type of
stakeholders
The main stakeholder is ScotRail (operated by Dutch firm Abellio).
Institutional
arrangements
Private.
Transferability The service could be transferred to other regions or modes of transport.
KPIs, barriers and enablers
Performance
indicators
No information available.
Barriers No information available.
Enablers An important enabler is the general reduction of travelling time and costs for both
passengers and operators.
Impacts
Evidenced
impacts
No information available.
Evidenced costs No information available.

D2.1 Overview of ITS initiatives in the EU and US
Enhanced Real Time Traffic API (TIMON project)
Description
Status On-going (01/6/2015 to 30/11/18)
Country Germany, Spain, Italy, UK, Hungary, Slovenia, Belgium, Netherlands
Description of
service
TIMON aims to deliver a framework of services to all users of the transport
ecosystem – drivers, vulnerable road users, and businesses. Enhanced Real Time
Traffic API is on service offered.
An amount of services will be gathered in an API that can be used to improve
functionalities of other smartphone applications focused on enhancing road
transport efficiency, such as car sharing applications, Electro Mobility services. The
application will be capable of providing highly accurate predictions on traffic
congestion based on ITS and open data. This service is also intended for
business-oriented applications, such as fleet management companies (logistics
companies, postal services, etc.), requiring a reliable estimation of the time delay
on the selected route.
Main objective The main objective of this application is to enhance real time traffic information,
thus improving the efficiency of road use (efficiency), supporting traffic safety and
response to contingencies in the network (traffic) and reducing CO2 emissions
(environment) by means of an optimized road transport network use.
The services to be provided by the application aim at supporting the overall project
view for building a cooperative ecosystem in which people, vehicles, infrastructure
and businesses are connected. This ecosystem will rely on cooperative networks
and open data (TIMON Collaborative ecosystem).
Innovation
phase
TRL 6
Type of ITS APTS Real Time Information
Technology
used
• Positioning technologies: GNNS, GPS
• Sensors
• Software infrastructure (Decision support systems, cloud computing,
extensible mark-up language)
• Hardware (Smartphones and mobile computing devices)
• Communication technologies (GSM, STM, WLAN-WiFi, LTE
Geographical
scale
Local, Regional, National, International
Type of
transport
Initially focused on Road mode, both public and freight
Type of
stakeholders
• Government/cities
• European Union
• Service providers
• Research institutes
• Automotive suppliers
• Travellers/passengers
• Road operators
Institutional
arrangements
PPP
Funded by EC Horizon 2020
Transferability Could be adopted globally

D2.1 Overview of ITS initiatives in the EU and US
EcoGem - Cooperative Advanced Driver Assistance System for Green Cars
Description
Status Finished (2010-2013)
Country Italy, Turkey, Germany
Description of
service
Taking into account the limited energy storage capabilities and recharging time of
fully-electric vehicles (FEVs), EcoGem aims to design and develop an FEV-
oriented Advanced Driver Assistance System (ADAS) equipped with suitable
monitoring, learning, reasoning and management capabilities to automatically
manage battery charging, energy saving, and route planning (that will help
increase the FEV's autonomy and energy efficiency)
Main objective To reduce energy consumption through autonomous and cooperative route
planning as well as the optimisation of recharging points while increasing the
energy efficiency and autonomy of electric vehicles.
Innovation
phase
7
Type of ITS ATIS IRANS
Technology
used
• Satellite
• Sensor
• Wireless
• Cellular networks
• Radio
Geographical
scale
Urban
Type of
transport
Road – passenger cars
Type of
stakeholders
• OEMs – FEV manufacturers
• Research institutes
• Application developers (ICT solutions providers)
• Telecoms operator
• Mapping industry
• Transport organisations
• European Commission: Financing
Institutional
arrangements
Public-private partnership. The project is co-funded by the EU 7th framework
programme for research and technological development.
Transferability This service is easily transferable to other road vehicles and to other types of
roads.

D2.1 Overview of ITS initiatives in the EU and US
EcoMove SP3 – ecoSmartDriving
Description
Status Finished, run from 2010-2013
Country European project
Description of
service
Ecosmartdriving exist out of a combination of several services that reduce
inefficiencies for passenger cars that influence fuel consumption. Several-ITS
services to reduce emissions are introduced, For instance:
• Control vehicle condition (tyre pressure)
• EcoUse of vehicle (no airco, seat heating)
• Support EcoDriving
• In & off board feedback on Economic driving behaviour
Main objective Sustainably changing the driving behaviour of individual drivers to a more fuel-
efficient driving style, both during the trip as well as by learning from previous
trips.
Supporting drivers in choosing the route with the lowest fuel consumption.
Innovation
phase
7
Type of ITS ATIS IRANS
Technology
used
• Nomadic devices on boardà stand alone
• Integrated on board units
• Sensors that measure driving situation
Geographical
scale
Diverse types of roads.
Type of
transport
Behaviour of passenger cars.
Type of
stakeholders
• Automotive suppliers
• Service providers
• Technology providers
• Vehicle manufacturer
• Car clubs
• Vehicle drivers
Institutional
arrangements
EU fp7 program
Transferability Transferable to other systems

D2.1 Overview of ITS initiatives in the EU and US
EcoMove SP3 – dynamic navigation
Description
Status Finished, run from 2010-2013
Country European project
Description of
service
Ecosmartdriving exist out of a combination of several services that reduce
inefficiencies for passenger cars that influence fuel consumption.
• Planning ecoTrip
• Dynamic ecoNavigation
• Dynamic ecoGuidance
Main objective • Sustainably changing the driving behaviour of individual drivers to a
more fuel-efficient driving style, both during the trip as well as by
learning from previous trips.
• Supporting drivers in choosing the route with the lowest fuel
consumption.
Innovation
phase
7
Type of ITS ATIS IRANS
Technology
used
• Nomadic devices on boardà stand alone
• Integrated on board units
• Sensors that measure driving situation
Geographical
scale
Diverse types of roads.
Type of
transport
Behaviour of passenger cars.
Type of
stakeholders
• Automotive suppliers
• Service providers
• Technology providers
• Vehicle manufacturer
• Car clubs
• Vehicle drivers
Institutional
arrangements
EU fp7 program
Transferability Transferable to other systems

D2.1 Overview of ITS initiatives in the EU and US
EcoMove Sp4 Freight - EcoTRIP
Description
Status Finished, run from 2010-2013
Country European project
Description of
service
SP4 of EcoMove aims to reduce fuel use of trucks by several cooperative and non-
cooperative solutions. Cooperative solution are included in EcoTrip, an
environmental based trip planner using:
• Efficient planning based on emissions with use of real time information
• Active guidance of drivers based on navigation that combines fuel use and
travel time and providing fuel efficient advise by a coaching system.
• Driver evaluation based on post trip analysis on defined performance
criteria
• Truck authorization based on quality of trucks (zoning)
Main objective • Increase awareness about CO2 emissions caused by road transport
• Minimize CO2 emissions caused by road transport as much as feasible
Innovation
phase
7
Type of -ITS ATIS IRANS
Technology
used
• On-board navigation/application
• Floating vehicle data
Geographical
scale
Mixed settings.
Type of
transport
Trucks
Type of
stakeholders
• Carriers
• Transport planners
• Consumers
• Vehicle manufacturer
• Local authorities
• Truck driver/owner/driving schools
Institutional
arrangements
EU fp7 program
Transferability Transferable to other systems

D2.1 Overview of ITS initiatives in the EU and US
Flitsmeister
Description
Status Active service since 2010
Country Netherlands origin. Services (partly) available in all EU countries.
Description of
service
Real time traffic information application with over 1 million users in the
Netherlands. Originally aimed at providing location of speed traps via user reports.
Currently more functions have been used and the service is integrated with other
service operators. The main functions are (mobile) Speed traps and traffic jam.
Secondary functions included are reports of:
• Accident
• Stationary vehicle on the road
• Object on the road
• Congestion
• Road works
• Slippery roads
• Bad road conditions
• Wrong-way driver
• Mist/ bad visibility
Users can report these situations, and this will be displayed to other app users.
Services are expanding The Netherlands, providing real time information for 7
other European countries. The app is currently available inside Tesla vehicles.
The app uses voice messages and audio to alarm drivers. This allows the app to
run in the background which reduces battery dependency and reduces the change
to distract drivers.
Main objective Improving comfort and efficiency were the original goals. As services expand
safety becomes more important.
Innovation
phase
9
Type of ITS ATIS. IRANS
Technology
used
Cellular network
Geographical
scale
Full road coverage
Type of
transport
Aimed towards passenger cars, but other road users can use the service as well.
Type of
stakeholders
Private company that cooperates with:
• Media services (radio, car platforms)
• Car consumer institute (ANWB)
• Software developer (Bemobile)
• Road operator (Rijkswaterstaat)
Institutional
arrangements
Private company
Transferability This service has the potential to be applied across Europe. Services might depend
on local legislation: ability to report speed traps.

D2.1 Overview of ITS initiatives in the EU and US
FOTsis 1 emergency management service/extended eCall
Description
Status Finished (2011-2015)
Country Tested in Spain and Greece on stretches of highways
Description of
service
An extended emergency call (eCall) system that bring fast assistance to motorist
through:
An emergency message send via the smartphone of the driver towards the public
safety answering point (PSAP)
Existing road side infrastructure detects an accident (loops, CCTV). The road side
managers than informs the public safety answering point.
Both measures aim to reduce the notification times necessary for accidents. After
an incident, the road operator and emergency vehicles will be notified if
necessary. Furthermore, other road users will be informed after an accident
occurs. Emergency vehicles are equipped with a tablet pc that informs,
recommends and communicates with the PSAP. Furthermore, vehicles could be
equipped with a mobile router to manage communication with the On Board Unit
of a car and the traffic control centre. This project, as well as FOTsis in general is
aimed towards a well-functioning infrastructure/i.e. the. Backoffice.
Main objective The main objective is to improve the quality and speed of the infrastructure behind
emergency systems. Informing emergencies earlier reduces time before
emergency services arrive (safety) as well as reducing the congestion after an
accident (efficiency). Furthermore, the information is better specified increasing
the efficiency of emergency services (better informed increased the safety of all
road users) and reducing the change for secondary accidents. Furthermore, the
lower congestion improves emissions.
Innovation
phase
7
Type of ITS ATIS ISAWS
Technology
used
The following technologies are used:
3G/4G cellular network
GPS to locate the position of the vehicle/accident
Geographical
scale
Regional level: on specific parts of national highways.
Type of
transport
This ITS service is tested for passenger cars and is relevant for both short- and
long distance trips.
Type of
stakeholders
Road managers : management and development
Research institutes
ITS companies
Emergency services
Road users
Institutional
arrangements
Partly EU funded under FP7. Consortium with 25 Partners from 9 European
Countries. Partners include Road operators, universities, telecom operators,
maps providers, technology integrators, research centres, users’ association, and
industry associations.
Transferability This service is easily transferable to other road vehicles and to other types of
roads.

D2.1 Overview of ITS initiatives in the EU and US
FOTsis 2- Safety incident management
Description
Status Finished (2011-2015)
Country Spain, two stretches of highway
Description of
service
F-SIMS provides real time information to drivers in order to warn them against risks
or critical situations that have been detected by the road infrastructure.
Warnings include
Congestion and other incidents
Recommended travel speed
Difficult driving conditions due to observed or forecasted weather
Information is gathered by the Highway Control Centre operator through roadside
equipment.:
Automatically detected via infrastructure systems
Congestion via loop detection
Bad weather via meteorological sensors
HCC operator will assign the alert back through road side infrastructure or via
smartphone.
Main objective Real time warnings towards drivers. This improves awareness which increases the
safety on the road and improves mobility. Additionally, this improves sustainability
as well.
Innovation
phase
7
Type of ITS ATMS traffic monitoring
Technology
used
The following technologies are used:
3G/4G cellular network
Highway detection infrastructure: loops, cameras, etc.
WiFi-P if available
Geographical
scale
Regional level: on specific parts of national highways.
Type of
transport
This ITS service is tested for passenger cars and is relevant for both short- and
long distance trips.
Type of
stakeholders
Road managers : management and development
Research institutes
ITS companies
Highway drivers
Institutional
arrangements
Partly EU funded under FP7. Consortium with 25 Partners from 9 European
Countries. Partners include Road operators, universities, telecom operators, maps
providers, technology integrators, research centres, users’ association, and
industry associations.
Transferability This service is easily transferable to other road vehicles and to other types of
roads.
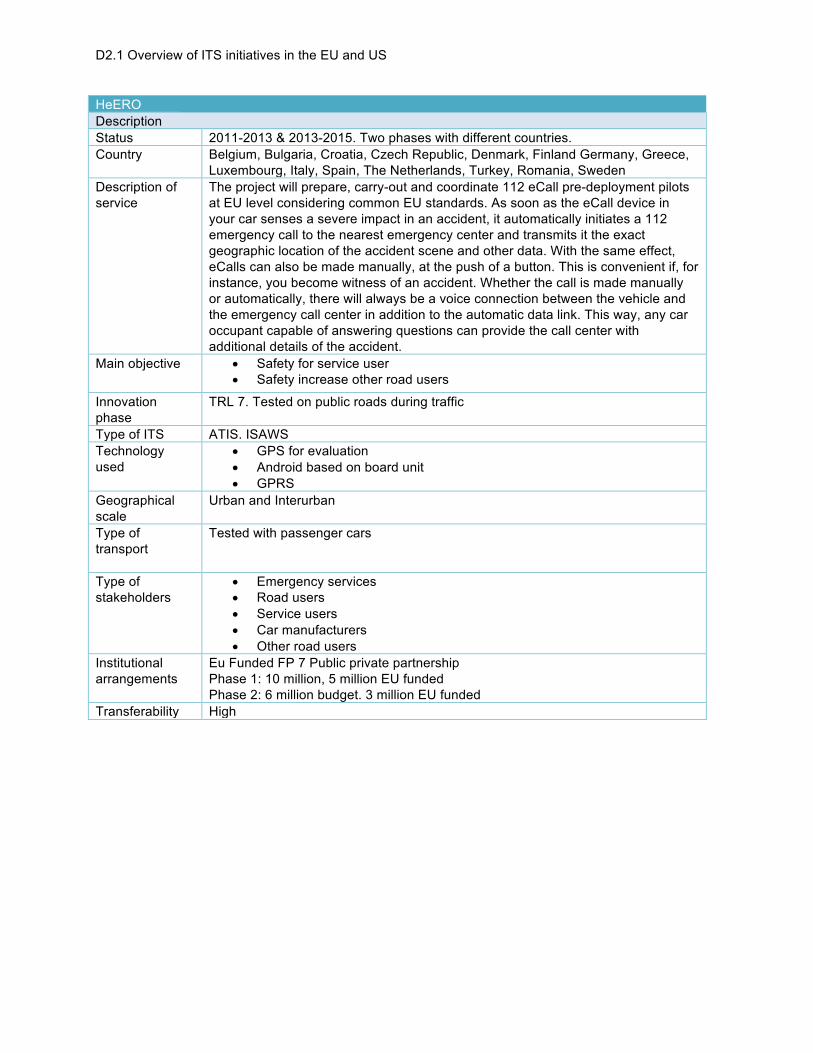
D2.1 Overview of ITS initiatives in the EU and US
HeERO
Description
Status 2011-2013 & 2013-2015. Two phases with different countries.
Country Belgium, Bulgaria, Croatia, Czech Republic, Denmark, Finland Germany, Greece,
Luxembourg, Italy, Spain, The Netherlands, Turkey, Romania, Sweden
Description of
service
The project will prepare, carry-out and coordinate 112 eCall pre-deployment pilots
at EU level considering common EU standards. As soon as the eCall device in
your car senses a severe impact in an accident, it automatically initiates a 112
emergency call to the nearest emergency center and transmits it the exact
geographic location of the accident scene and other data. With the same effect,
eCalls can also be made manually, at the push of a button. This is convenient if, for
instance, you become witness of an accident. Whether the call is made manually
or automatically, there will always be a voice connection between the vehicle and
the emergency call center in addition to the automatic data link. This way, any car
occupant capable of answering questions can provide the call center with
additional details of the accident.
Main objective • Safety for service user
• Safety increase other road users
Innovation
phase
TRL 7. Tested on public roads during traffic
Type of ITS ATIS. ISAWS
Technology
used
• GPS for evaluation
• Android based on board unit
• GPRS
Geographical
scale
Urban and Interurban
Type of
transport
Tested with passenger cars
Type of
stakeholders
• Emergency services
• Road users
• Service users
• Car manufacturers
• Other road users
Institutional
arrangements
Eu Funded FP 7 Public private partnership
Phase 1: 10 million, 5 million EU funded
Phase 2: 6 million budget. 3 million EU funded
Transferability High

D2.1 Overview of ITS initiatives in the EU and US
I-5 Smart Truck Parking
Description
Status Finished (2015)
Country USA
Description of
service
Truck drivers are faced with a critical shortage in truck parking due to a dramatic
growth in commercial vehicle truck travel on US nation’s roads. A fatigued driver
that must drive to search for a parking place can become not only a roadway
hazard but an environmental hazard because they generate unnecessary diesel
emissions. In this project, sponsored by FHWA (Federal Highway Administration),
TSRC (Transportation Sustainability Research Center) is partnering with Caltrans
to explore possible roles for Intelligent Transportation Systems (ITS) in alleviating
the truck parking problem. The I-5 corridor in California will serve as a test bed for
the use of ITS technologies to determine parking availability at participating truck
stops. This information, as well as truck stop amenities and the opportunity to
make a reservation, will be transmitted to commercial vehicle drivers. This suite of
information may allow truckers to better plan and to operate more efficiently when
they can by-pass a full truck stop and go directly to one that has space available.
ParkingCarma and NAVTEQ are assisting TSRC with the parking availability,
reservations, truck stop amenities, and routing. The information may be collected
and disseminated through a variety of means including sensors, the Internet,
mobile phones, changeable message signs, and radio.
Main objective • Broadcast truck parking information to truckers through web and mobile
applications
• Display of dynamic truck parking availability, so truckers can use
information to understand when and where parking is available
• Provide truck stop attributes.
• Capability to make advanced parking reservations
Innovation
phase
7
Type of ITS Advanced Traveller Information Systems (ATIS), Commercial Vehicle Operations
(CVO)
Technology
used
• Cellular
• Radio
• RFID
• GPS
Geographical
scale
Regional
Type of
transport
Freight transport (trucks)
Type of
stakeholders
• Government
• Research institutes
• Service Providers
• Road Operators
• Truck Drivers
Institutional
arrangements
Private/public collaboration
Transferability Several other US regions are testing similar solutions so the applications is
perfectly transferable.

D2.1 Overview of ITS initiatives in the EU and US
In-TIME
Description
Status Finished (2009-2012)
Country Austria
Description of
service
Multimodal Real Time Traffic and Travel Information (RTTI) services are seen as
strategic measures for drastically reducing energy consumption in urban areas
across the different modes of transport, by changing the mobility behaviour (modal
shift) of the individual traveller from car to more sustainable means of collective
transport. This change of traveller behaviour will result in less pollution and
CO2emissions, less particle emissions, and less noise.
In-Time aims to address these challenges by implementing and piloting an ICT
infrastructure to facilitate the deployment and delivery of Multimodal RTTI services
for drivers and travellers in European cities. In-Time aims to deploy and validate
and innovative pan-European approach to Real Time Traffic and Travel Information
(RTTI) services, largely based on ICT and ITS European standards, enabling the
interoperability of information and services between local data/service providers,
end-user Travel/Traffic Information Service Providers (TISPs) and across
European cities.
Main objective • Efficiency
• Comfort
• Environmental
Innovation
phase
7
Type of ITS Advanced Traveller Information Systems (ATIS), In-vehicle Route and Navigation
Systems (IRANS) and In-vehicle Motorist Service Information Systems (IMSIS)
Technology
used
• Cellular
• GPS
• SoA
• Web Services
• EU ITS Standards (DATEX 2, TPEG, IFOPT, SIRI, JourneyWeb, OpenLS)
Geographical
scale
Urban. In-Time implemented pilots in 6 sites: Brno, Bucharest, Florence, Munich,
Oslo and Vienna.
Type of
transport
Passenger transport (car, cycle or pedestrian). At some extent, public transport.
Type of
stakeholders
• European Commission.
• Government/cities
• Service providers
• Research institutes
• Travelers/passengers
Institutional
arrangements
Public-Private Partnership
Transferability Should be transferable to other cities.
Mobiliy 2.0
Description
Status Completed (2012 - 2015).
Country 11 partners from 7 countries: Slovakia, France, The Netherlands, UK, Italy, Spain,
Greece

D2.1 Overview of ITS initiatives in the EU and US
Description of
service
The project developed an integrated approach to enhance the catch up of the use
of fully electric vehicles (FEV). The integrated approach has implied that the
application developed by Mobility2.0 has utilised co-operative systems to
simultaneously consider the bottlenecks undermining the FEV use, so that an
overall optimisation in the use of FEV has been achieved. Mobility2.0 has focused
on assisting the daily urban commute, which represents the bulk of urban mobility
in order to compensate for the limited autonomy range
Main objective Mobility2.0 has developed and tested an in-vehicle commuting assistant for FEV
mobility, resulting in more reliable and energy-efficient electro-mobility.
Innovation
phase
Technology readiness level 5. The project has validated the approach in the
relevant environment.
Type of ITS ATIS. In vehicle services
Technology
used
• the FEV inherent relation with the smart grid (while plugged-in) as well as
the FEV capability of sending and receiving internet data is expected to
complement the ability of 5.9GH communication abilities of modern electric
vehicles
• Recharging spot notification geo-broadcasting data. The broadcasted data
includes varying application types, such as EGNOS data (corrections to
GPS raw data), digital map databases, or vehicle firmware updated over
the air.
Geographical
scale
Urban
Type of
transport
Tested with passenger cars
Type of
stakeholders
• Municipalities
• Research institutes
• SMEs
• Service providers
Institutional
arrangements
The project has received public funding from the European Union‘s Horizon 2020
FP7-ICT - Information and Communication Technologies
Transferability The system has been tested in two cities: Barcelona and Reggio Emilia, setting
the pre-conditions for the transferability to other municipalities
OCTO U
Description
Status Ongoing application (2015 -)
Country Italy, UK, Spain, France, US

D2.1 Overview of ITS initiatives in the EU and US
Description of
the application
Octo Telematics is an Italian company, whose headquarter has been recently
shifted to London, with offices in US, France and Spain. The company was
founded in 2002, pioneering the use of telematics in the car insurance sector. Octo
applies proprietary algorithms to this market to deliver information into driver risk,
informing solutions that benefit both auto insurance companies and drivers.
In 2015, a new Octo U app was launched. The app Octo U uses telematics
technology to monitor and score driver behaviour, measuring speed, braking
intensity and acceleration. Drivers who obtain the satisfactory score of 7.5 and
above are then rewarded with the service of submitting their score to a panel of
insurers for a quote discount of up to 10%, which they can choose to accept at
their discretion.
The app key algorithm is based on GPS point-retrieving technology to gather
journey information and ranking each trip based on factors such as speed,
breaking and acceleration, OCTO U also takes into account outside variables often
directly affected by weather, such as road and traffic conditions, to determine driver
scoring. For example, in the UK, drivers with good scores are rewarded with the
service of a discounted insurance. The Octo company is in advanced discussions
with insurance partners to launch this model in a growing number of international
markets.
Main objective The main objectives of the service concern with improving safety in road transport.
Innovation
phase
Technology readiness level 9. The app is fully operational.
Type of ITS ATIS. CVO
Technology
used
The following technologies are used:
Once downloaded and registered directly from Apple Store, and Google Play Octo
U begins immediately to collect data on the movements of the conductor.
The app collects and sends data from the front end of the mobile device to the
back end of intelligence, which analyses the trip in order to ensure the integrity and
reliability of the scoring mechanism.
The application detects, reconstructs and analyses the events that occurred during
the trip, such as sudden braking, rapid acceleration, excessive speed or way of
taking curves.
Using a proprietary GPS algorithm, the app calculates the "g force" generated
during the events of driving without the corruption inherent in non-fixed
accelerometer data. OCTO U then assigns a score to the trip.
Geographical
scale
Urban and extra-urban scale.
Type of
transport
Passenger and freight vehicles, long and short distance trips.
Type of
stakeholders
• ICT companies
• Insurance companies
• Service providers
Institutional
arrangements
Private company, start-up initially funded by venture capital, then owned by
Investment Funds.
Transferability This service is currently operating in Italy, Spain, France, UK and US.

D2.1 Overview of ITS initiatives in the EU and US
Parckr Cooperative truck parking
Description
Status 2011 – 2012 tested, active currently
Country Netherlands
Description of
service
Informing Truck users about actual (via cooperative system in app) and
predicted/future availability of parking spots. This allows drivers to better adjust
driving times and reduces the necessity of dangerous parking. It uses historical
data, real time traffic data and reported availability by other truck drivers. The
service uses a mobile application called Parckr. About 2000 Benelux parking
places are included. Available in France, Dutch, German, English and Polish.
Main objective • Increasing efficiency as drivers can find the best suitable parking place on
their route
• Increases safety as there will be less dangerous parking as drivers are
better informed. Furthermore, they do not have to park on parking places
considered dangerous.
• Increase comfort of drivers. Less stress about finding a suitable parking
place, less worries about driving times.
Innovation
phase
7
Type of ITS ATIS IMSIS
Technology
used
3g/4g
Geographical
scale
Highways and parking spots close to highways
Type of
transport
Truck
Type of
stakeholders
• Public authorities: province, municipality, ministry of infrastructure
• Industry: OEM, research institutes, traffic research
• Universities
• App users
Institutional
arrangements
850.000 budget, Of which 465.000 privately financed.
Transferability Transferable to other Roads and Countries. Not to other types of vehicles as they
don’t have regulated resting periods.

D2.1 Overview of ITS initiatives in the EU and US
Praktijkproef Amsterdam ADAM application: cooperative travel app
Description
Status finished, 1-2014 until 1-2015 active tested
Country Netherlands
Description of
service
Mobile application like superroute app but designed by a different consortium and
in a different year. The application provided real time information about people who
are entering/ exiting Amsterdam during rush hour especially. Information is
gathered using floating car data (FCD) from app users and other sources available
for road managers. App provides following advice:
• Pre tip information
• Optimal route/ alternative routes
• Travel times
• Parking information
• Congestion
• Real time information and push up messages in the case of relevant
changes.
App users can send voicetweet to traffic centres about relevant conditions.
The app enables users to make the best choices before and during their trip. It is
aimed at commuters who are familiar with the possible routes.
Main objective Increasing efficiency
Innovation
phase
TRL 7
Type of ITS ATIS. IRANS
Geographical
scale
Regional level: on all roads around Amsterdam
Technology
used
3g/4g cellular network
Type of
transport
This ITS service is tested for passenger cars and is relevant for both short- and
long distance trips.
Type of
stakeholders
• Service/app users
• Road authority
• Municipality
• Research institutes
• Service providers/app developer
Institutional
arrangements
It is a public private partnership. The funding has been received from several
sources:
Transferability This service is easily transferable to other road vehicles and to other types of
roads.

D2.1 Overview of ITS initiatives in the EU and US
Praktijproef Amsterdam (PPA) –Superroute app: Real time travel advice
Description
Status Finished, Active during the year 2015
Country The Netherlands
Description of
service
Supperroute is a mobile application for smartphones that provides real time
information for people who are entering Amsterdam. Information is gathered
using floating car data (FCD) from app users and other sources available to
road managers. The mobile application provides following advice:
• Departure time
• Optimal route
• Travel times
• Navigation
• Speed limit
• Congestion
• Real time information and push up messages in the case of relevant
changes
Before the first use users have filled in a questionnaire which determines a type
of traveller: comfort, speed, reliability and adventure. Based on this types
different routes are advised. Furthermore, in the case of a change in route due
to for example a closed route, different users get different advises. This reduces
the change of a congested secondary/alternative road.
Main objective Higher efficiency through optimal advice
Less congestion by spreading traffic
Innovation
phase
TRL 7
Type of ITS ATIS. IRANS
Technology
used
• Cellular 3g/4g network
• Existing sensor systems
Geographical
scale
Regional level: on all roads around Amsterdam
Type of
transport
This ITS service is tested for passenger cars in and near Amsterdam using both
urban roads as highways.
Type of
stakeholders
• Municipality of Amsterdam
• Research institutes
• Service provider
• Passengers/ App users
• Road Authority
Institutional
arrangements
It is a public private partnership. The funding has been received from several
sources.
Transferability This service is easily transferable to other road vehicles and to other types of
roads.

D2.1 Overview of ITS initiatives in the EU and US
PROBEIT Foresight Vehicle
Description
Status Finished (08/00 – 12/03)
Country United Kingdom
Description of
service
The ProbeIT project aims to build and demonstrate a system that will both allow
dynamically changing information from traffic authority databases to be transmitted
to vehicles, and for sensor data from vehicles to be received back and processed.
The work was undertaken in 3 phases of integration:
Non-dynamic data flow phase involved the collection of underlying map data to be
used in the digital maps for navigation;
The dynamic data flow phase involved production of data concerning speed limits,
parking, dynamic navigation, real-time speed/traffic information;
The final floating vehicle application phase concerned advanced probe vehicle
information such as road works or air bag alert
Main objective The objective of the project was to develop an end-to-end process for the sourcing
and exchange of geo-referenced information between traffic management systems,
a uniform data source and vehicles utilising the Travel Information Highway (TIH)
and cellular communication.
The aim of this process was to provide timely and accurate location-based
information in the vehicle, such that Advanced Driver Assistance Systems (ADAS)
are possible (efficiency and safety).
Innovation
phase
7
Type of-ITS ATIS. In vehicle motorist service information
Technology
used
Mainly cellular. Also positioning technologies.
Geographical
scale
The primary test site location for the project was the 5 mile square located around
the town of Braintree, Essex, UK.
A separate test route on the motorway M25 to the west of London was identified to
represent the corresponding physical factor combinations.
Type of
transport
The service is for vehicles in general. There are not specific details.
Type of
stakeholders
ProbeIT is a Foresight Vehicle project, 50% funded by the Highways Agency (HA)
and supported by Essex County Council. The research is performed by a UK
consortium, which includes WS Atkins Transport Systems Limited, Jaguar Cars
Ltd, Navigation Technologies, Kingston University and the University of
Southampton's Transportation Research Group
Besides funding, Essex County Council provides views on potential benefits of
such a system and how traffic regulation data can be integrated.
Institutional
arrangements
The financial sources are mainly public and come from the Highways Agency
(replaced by Highways England in April 2015) and Essex County Council.
Transferability This service is potentially transferable to any vehicle and any region.
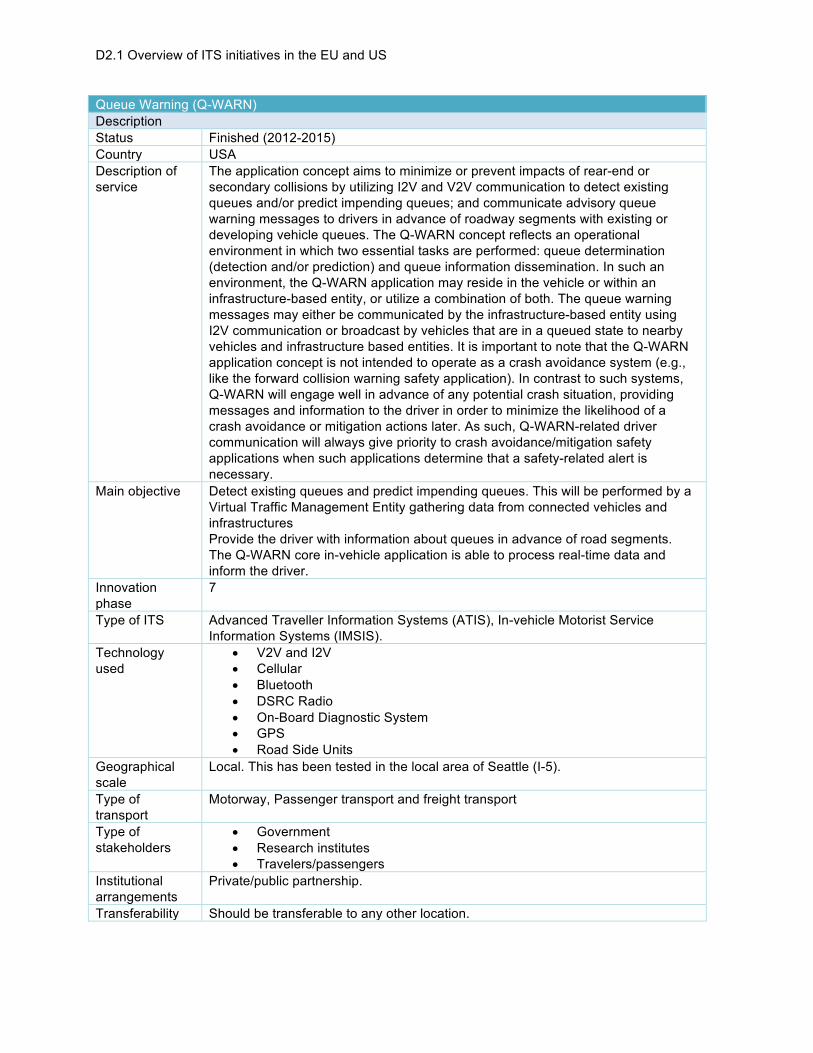
D2.1 Overview of ITS initiatives in the EU and US
Queue Warning (Q-WARN)
Description
Status Finished (2012-2015)
Country USA
Description of
service
The application concept aims to minimize or prevent impacts of rear-end or
secondary collisions by utilizing I2V and V2V communication to detect existing
queues and/or predict impending queues; and communicate advisory queue
warning messages to drivers in advance of roadway segments with existing or
developing vehicle queues. The Q-WARN concept reflects an operational
environment in which two essential tasks are performed: queue determination
(detection and/or prediction) and queue information dissemination. In such an
environment, the Q-WARN application may reside in the vehicle or within an
infrastructure-based entity, or utilize a combination of both. The queue warning
messages may either be communicated by the infrastructure-based entity using
I2V communication or broadcast by vehicles that are in a queued state to nearby
vehicles and infrastructure based entities. It is important to note that the Q-WARN
application concept is not intended to operate as a crash avoidance system (e.g.,
like the forward collision warning safety application). In contrast to such systems,
Q-WARN will engage well in advance of any potential crash situation, providing
messages and information to the driver in order to minimize the likelihood of a
crash avoidance or mitigation actions later. As such, Q-WARN-related driver
communication will always give priority to crash avoidance/mitigation safety
applications when such applications determine that a safety-related alert is
necessary.
Main objective Detect existing queues and predict impending queues. This will be performed by a
Virtual Traffic Management Entity gathering data from connected vehicles and
infrastructures
Provide the driver with information about queues in advance of road segments.
The Q-WARN core in-vehicle application is able to process real-time data and
inform the driver.
Innovation
phase
7
Type of ITS Advanced Traveller Information Systems (ATIS), In-vehicle Motorist Service
Information Systems (IMSIS).
Technology
used
• V2V and I2V
• Cellular
• Bluetooth
• DSRC Radio
• On-Board Diagnostic System
• GPS
• Road Side Units
Geographical
scale
Local. This has been tested in the local area of Seattle (I-5).
Type of
transport
Motorway, Passenger transport and freight transport
Type of
stakeholders
• Government
• Research institutes
• Travelers/passengers
Institutional
arrangements
Private/public partnership.
Transferability Should be transferable to any other location.

D2.1 Overview of ITS initiatives in the EU and US
Smartfreight
Description
Status Finished (2008-2011)
Country Norway
Description of
service
This project aimed to make urban freight transport more efficient, environmentally
friendly and safe through smarter use of the distribution networks and improved
delivery and return-load systems. The basic idea was to integrate urban traffic
management systems with freight management and on board systems.
Main objective Develop new traffic management measures towards individual freight vehicles
through open ICT services, on-board equipment and integrated wireless
communication infrastructure
Innovation
phase
7
Type of ITS Advanced Traveller Information Systems (ATIS), Commercial Vehicle Operations
(CVO)
Technology
used
• Cellular
• Radio
• DSRC
• CALM standard
• Sensors
Geographical
scale
Test site studies in Winchester, Bologna, Dublin and Trondheim
Type of
transport
Freight transport
Type of
stakeholders
• European Commission.
• Government/cities
• Service providers
• Research institutes
• Travelers/passengers
Institutional
arrangements
Private/public collaboration
Transferability Transferable to other regions

D2.1 Overview of ITS initiatives in the EU and US
SmarTrAC
Description
Status Finished (07/2014-02/2015)
Country USA
Description of
service
SmarTrAC is an innovative smart phone application that collects highly-detailed
activity and travel behaviour data with minimal user burden, providing a compelling
alternative to the traditional diary-based method typically used to collect individual
travel and activity information.
Key features:
It automatically detects and classifies daily activity and travel episodes using
smartphone GPS and accelerometer data.
It allows users to view, correct, and augments the automatically detected and
classified information.
It provides annotated and aggregated activity/trip details.
Main objective Combine smartphone sensing with advanced data mining techniques to
automatically detect and classify daily activity and travel episodes.
It further integrates the data mining function with effective user communication to
allow users to view, correct and augment the automatically classified information,
as well as to allow the use of user input data to continuously optimize the data
mining function
Innovation
phase
7
Type of ITS Advanced Traveller Information Systems (ATIS), In-vehicle Route and Navigation
Systems (IRANS).
Technology
used
Sensors
Cellular
Geographical
scale
Urban and interurban service
Type of
transport
Applies for passenger transport
Type of
stakeholders
• Government
• Research institutes
• Travelers/passengers
Institutional
arrangements
Public/private
Transferability Yes transferable

D2.1 Overview of ITS initiatives in the EU and US
VSC-A
Description
Status Finished (2006-2009)
Country USA
Description of
service
Determine if DSRC (Dedicated Short Range Communications) @5.9 GHz &
Vehicle Positioning can improve upon autonomous vehicle-based safety systems
and/or enable new communication-based safety applications.
Strong emphasis on resolving current communication and vehicle positioning
issues so that the interoperable future deployments of DSRC+Positioning based
safety systems will be enabled
Main objective Assess how previously identified crash imminent safety scenarios in autonomous
systems could be addressed and improved by DSRC+Positioning Systems
Define a set of DSRC+Positioning based vehicle safety applications and
application specification including minimum system performance requirements.
Develop a well understood and agreed upon benefits versus market penetration
analysis and potential deployment models for a selected set of communication-
based vehicle safety systems.
Develop scalable, common vehicle safety communication architecture, protocols
and messaging framework (interfaces) necessary to achieve interoperability and
cohesiveness among different vehicle manufacturers. Standardize this messaging
framework and the communication protocols (including message sets) to facilitate
future deployments.
Develop accurate and affordable vehicle positioning technology needed, in
conjunction with the 5.9 GHz DSRC, to support most of the safety applications with
high-potential benefits.
Develop and verify a set of Objective Test Procedures (OTP) for the vehicle safety
communication applications.
Innovation
phase
7
Type of ITS Advanced Traveller Information Systems (ATIS), In-Vehicle Safety and Warning
Systems (IVSAWS)
Technology
used
• GPS and Real-Time Kinematic (RTK)
• ECDSA (Elliptic Curve Digital Signature Algorithm)
• TESLA (Timed Efficient Stream Loss-Tolerant Authentication)
• OTA (Over-the-air) messages
Geographical
scale
Urban and Freeway
Type of
transport
Passenger transport (car)
Type of
stakeholders
5 OMS (Ford, GM, Honda, Mercedes, Toyota) and US Department of Transport.
Institutional
arrangements
Private/public collaboration
Transferability Yes

D2.1 Overview of ITS initiatives in the EU and US
Vx-TINFO
Description
Status Finished (2016)
Country USA
Description of
service
Weather Response Traffic Information System (Wx-TINFO) project’s purpose is to
design a system that brings together near- time environmental/weather-related
data collected from both fixed and mobile data sources.
Fixed:
• Road Weather Information Systems (RWIS) Stations.
• National Weather Service (NWS) Stations.
• NWS Radar.
• NWS Warnings (text)
Mobile:
• Integrated Mobile Observations (IMO) Project Fleet
• Safety Pilot Model Deployment Project Fleet.
Main objective • Improve the real-time traffic management capabilities of Michigan
Department of Transportation (MDOT) Transportation Operation Center
(TOC) staff during weather events.
• Improve the timeliness and content of road weather condition reporting
updates to the traveling public.
• Provide road weather condition information that MDOT Maintenance staff
perceive as valuable for possible use in future road weather maintenance
operations.
Innovation
phase
7
Type of ITS Advanced Traveller Information Systems (ATIS), In-vehicle Motorist Service
Information Systems (IMSIS).
Advanced Traffic Management Systems (ATMS)
Technology
used
• Sensors
• Cellular
Geographical
scale
Regional
Type of
transport
Passenger transport and freight transport.
Type of
stakeholders
• Government
• Service Providers
• Research institutes
• Travelers/passengers
Institutional
arrangements
Private/public partnership.
Transferability Should be transferable to other regions.

D2.1 Overview of ITS initiatives in the EU and US
Waze
Description
Status Active service since 2010
Country Israel origin, globally available and used service.
Description of
service
Community based mapping and navigation service that connects drivers with each
other to offer real time information. Available for smartphones it allows users to
communicate with each other to form a ‘waze community’. This community has its
own ‘map developers’ to generate their maps. Users contribute due to passively
reporting floating car data as well as actively by reporting accidents, speed traps,
dangerous situations. Due to the accurate navigation and real time traffic
information Waze has become a very large player in navigation, especially in
countries where not many cars are equipped with navigation systems (Brazil) but
the owners do have smartphones. Has total maps in 13 countries, ranging from
western (USA, Germany) to developing (Chile, South-Africa)
Main objective Improving comfort and efficiency were the original goals. As services expand
safety becomes more important.
Innovation
phase
9
Type of ITS ATIS IMSIS
Technology
used
Cellular network
GPS
Geographical
scale
Full road coverage
Type of
transport
Aimed towards passenger cars, but other road users can use the service as well.
Type of
stakeholders
Private company that cooperates with:
• App users
• City partners: road authorities and transport companies of certain
cities/areas provide information to Waze. The maps of Waze then become
available for these partners.
Institutional
arrangements
Private company recently acquired by Google
Transferability This service has the potential to be applied across Europe. Services might depend
on local legislation: ability to report speed traps.

D2.1 Overview of ITS initiatives in the EU and US
ZooF : cooperative traffic information mobile app
Description
Status Active from 2014 – currently
Country Netherlands
Description of
service
Zoof is a mobile application that provides smart advice to reduce traffic jams. It is
intended to be used as a secondary screen next to navigation. The purpose of Zoof
is to provide real time information about the road that is used. Zoof uses the 3g/4g
network to receive information. The information includes: optimal speed, merging
advice and distance in traffic jams.
Main objective The goal of Zoof is to improve the efficiency. This has a positive effect on reduction
congestion, and hence improving safety.
Innovation
phase
First version tested, TRL 7
Type of ITS ATIS. IRANS
Technology
used
3g/4g cellular network
Geographical
scale
Regional level: on specific parts of national highways.
Type of
transport
This ITS service is tested for passenger cars and is relevant for both short- and
long distance trips.
Type of
stakeholders
• Research institutes
• Service providers
• Road networking organisation
Institutional
arrangements
It is a public private partnership. The funding has been received from several
sources: Province Noord-Brabant, European Commission.
Transferability This service is easily transferable to other road vehicles and to other types of
roads.

D2.1 Overview of ITS initiatives in the EU and US
Access Control in Rome
Description
Status Ongoing
Country Italy
Description of
service
In Rome the structure of the city and the limited resources in term of mass transit
supply requires to limit congestion and traffic environmental impacts as well as the
strong need to preserve the historical and archaeological city:
Rome decided to implement a series of clean zones with a complex series of
actions, according to the guideline provided by the Urban General Traffic Plan
(PGTU), now reinforced and enlarged by the Strategic Sustainable Mobility Plan
(SSMP), approved in 2010.
The turning point was the implementation of the LTZ system with “electronic gates”
in October 2001. The system is based on a ANPR procedure as well as the use of
OBU connected via DSRL with the entrance gantries.
The general idea is to forbid access to cars, increase the supply of Public
Transport and increase the number of parking pricing slots along the LTZ cordons.
A “White List” of authorized users is defined and constantly updated, so that non-
authorized vehicles acceding the zones during the enforcement times are detected
by the ANPR system and automatically fined
Main objective • Efficiency
• Environment
Innovation
phase
9
Type of ITS Advanced Traffic Management Systems / Demand and Access Management
Technology
used
DSRC
Geographical
scale
Urban level
Type of
transport
Freight and passenger transport
Transport mode: car, truck,
Transport type/motive: urban trips
Type of
stakeholders
• City of Rome
• Service providers (utilities)
• Emergency services
• Parking operators
• Resident associations
• Retail associations
• Disable people associations
• Local PT
Institutional
arrangements
Totally public. the main financing sources for the project is represented by national
public funds; the “on the way” extension to rail road is funded by EU structural
funds.
Transferability Fully transferrable: barriers represented by acceptance by people. Enablers: strong
communication campaigns, involvement of people in the decision process. Impacts
can be similar.

D2.1 Overview of ITS initiatives in the EU and US
Highway network traffic management Autostrade per l’Italia (ASPI)
Description
Status Finished and in operational
Country Italy
Description of
service
Autostrade per l’Italia (ASPI) is a motorway operator directly responsible for a
network of 2,854 km and it provides systems and services to its sister companies
managing approximately further 600 km. Everyday over 4 million drivers use the
3,400 km network managed by ASPI and by the other concessionaires of the
Atlantia Group.
The system features are such that:
Allow operators to manage traffic in the event of incidents, road works and normal
day to day activities of motorway operation;
Contribute to reducing congestion on the motorway;
Improve safety for motorway users and people working on the motorway;
Provide accuracy and reliability of the system;
Increase comfort and reduce stress for motorway users;
Guarantee efficient interoperability with existent systems and flexibility to future
upgrades and changes;
The overall architecture of the ASPI system for Traffic Management is represented
in the figure below.
Main objective The main objectives of the ITS application.
• Safety
• Efficiency
• Environment
• Tolling
• Overweight of trucks
Innovation
phase
TRL: 9
Type of ITS Advanced Traffic management Systems (ATMS)
Used stations: traffic management centres, road side units, floating car data
Technology
used
• Cellular
• Satellite
• DSRC
• Sensors
• Variable Message Sign
• Monitoring systems
• Speed detector
Geographical
scale
National level/large majority of the Italian motorway network
Type of
transport
Road transport of any type (passengers on private vehicles and collective; freight)
Type of
stakeholders
• Government: concessioner
• Service providers: typical on route services
• Emergency services: police, fire brigade, towing, repairing.
• Travellers/passengers
Institutional
arrangements
Private enterprise operating on the base of concession from public body.
Revenues from fares agreed in the service contract.
Transferability Totally transferrable: no impacts on KPI foreseen

D2.1 Overview of ITS initiatives in the EU and US
Automatic Passenger Counting Systems
Description
Status Available from numerous companies globally.
Country Global
Description of
service
Counting passengers on/off bus allows operators to manage resources to meet
demands.
APC systems are electronic machines that count the number of passengers that
board and disembark at every bus stop. Together with AVL systems, they form the
two most important technologies that every transit system should have. In systems
that have them, they replace the schedule checkers that previously collected
ridership information manually. APC allows informed decisions about where people
are riding, and when they are doing it. This is critical information for making service
changes, establishing budgets, securing funding, and responding to changing
ridership patterns.
Main objective The main advantage of APCs are that, unlike schedule checkers, they collect
ridership for as many as every single trip operated, if APC units are installed on
100% of the bus/tram fleet. They also reduce cost (efficiency), because even if
initial startup costs are high in the long term it costs much less to collect ridership
information via APC units than it does to hire employees to manually collect it.
Other objectives of APC are linked to enhanced traffic monitoring, queue
management, security and safety applications.
The main disadvantage is that APC units, while accurate, are sometimes not as
accurate as manual collection - APC units collect accurate information from 80 -
95% of the time while manual collection is generally accurate between 90 and 95%
of the time.
Innovation
phase
TRL 9.
Type of ITS APTS Passenger Information Systems, Fleet management optimization
Technology
used
Key enabling technologies:
• Hardware Infrastructure (on-board computers/ticket printers; smartphones,
analyzers for data transmission, human-machine interfaces, meters,
actuators)
• Sensors (infrared, digital video camera)
• Software infrastructure (IoT, WLAN-WiFi, GPS, Ethernet, Cloud
computing)
Geographical
scale
Urban, Regional, National
Type of
transport
All modes Public Transport (Trains, Trams, Buses).
Type of
stakeholders
• Service providers
• Automotive suppliers
• Travellers/passenger
• Road operators
Institutional
arrangements
Private, Public
Transferability Can operate on any vehicle fitted with system.

D2.1 Overview of ITS initiatives in the EU and US
The connected boulevard, Nice
Description
Status Finished (2008-2014?)
Country France.
Description of
service
Manage and optimize all aspects of city management, including parking and traffic,
street lighting, waste disposal and environment quality.
Main objective Focusing in the smart parking and smart traffic management parts, the objectives
are to reduce the number of traffic incidents (safety), reduce traffic congestion and
optimize parking (efficiency and comfort) and reduce air pollution (environmental).
Innovation
phase
6
Type of ITS ATMS. Smart parking 200 sensors and detecting devices installed on street-lights,
the roadway and garbage depositories. The data is processed into real-time
information and converted into intelligence with the help of context-aware location
analytics and then it is disseminated to serve multiple services in city operations
and for city dwellers.
Technology
used
The following technologies are used:
• Zigbee.
• Wireless sensor network.
• 3G/4G cellular network.
• Street network (fibre/copper/WiFi).
Geographical
scale
Urban level. City of Nice.
Type of
transport
This ITS service is tested for passenger cars and is relevant for short distance
trips. It also covers public transport.
Type of
stakeholders
• City managers
• Service providers
• Parking operators
• Travellers/passengers
Institutional
arrangements
Public private partnership between the city of Nice as part of the Nice Côte d’Azur
Métropole and private entities such as Cisco and Think Global.
Transferability The service should be transferable to other cities in the world.

D2.1 Overview of ITS initiatives in the EU and US
Departure Planning Information
Description
Status Ongoing (dates not available)
Country United Kingdom
Description of
service
The Transport Systems Catapult’s Departure Planning Information (DPI)
Programme is carried out in cooperation with the Civil Aviation Authority (CAA) and
the National Air Traffic Services (NATS).
The programme is rolling out real-time flight departure technology at airports
across the UK. Fully integrated with the European flight information network
EuroControl, DPI allows air traffic controllers to provide real-time information about
the departure of aircraft, which in turn enables EuroControl and National Air Traffic
Control Centres to make much better assessments regarding the arrival times of
those aircraft.
Main objective The main benefits being realised by the DPI are reduced passenger delays and
improved airspace efficiency (efficiency); reduction in fuel consumption, noise
pollution and carbon emissions (environment).
Innovation
phase
8
Type of ITS ATMS Traffic monitoring
Technology
used
Real-time flight departure technology (software).
Geographical
scale
The service has been used in several airports across the UK. Previously only in
place at Heathrow and Gatwick, DPI capability has then been successfully installed
at London City, Stansted, Manchester, Edinburgh, Glasgow and Aberdeen airports,
with Luton airport due to follow shortly.
Type of
transport
The service is used for air transport.
Type of
stakeholders
The Transport Systems Catapult cooperates with two partners, Civil Aviation
Authority and National Air Traffic Services.
Institutional
arrangements
Information not available
Transferability The service is being used in several airports in the UK. It can be transferred in
other areas and maybe in other modes of transport.

D2.1 Overview of ITS initiatives in the EU and US
EcoMove Improve Network Usage
Description
Status Finished, run from 2010-2013
Country European project
Description of
service
When driving in a road network, vehicles share information on their origin and
destination to road side systems. By including data on green ratios and cycles
times from local traffic controls, traffic state and fuel consumption data from the
EnergyMap, and emission data from emission models, an optimal route distribution
is computed for all origin-destination relations using specific cost and objective
functions.
Main objective • Determine a macroscopic network traffic state in terms of dynamic source-
destination route distributions that reflects minimal fuel consumption for the
totality of traffic.
• Provide a benchmark for optimal fuel consumption in a road network.
• Compute routes which serve the system and the driver requirements (win-
win routes).
• Provide a data base for other eCoMove components / Service to support
their control and management strategies.
Innovation
phase
7
Type of ITS ATMS.
Technology
used
On Board Unit
GPS
Geographical
scale
Inner city roads with a sequence of traffic lights
Type of
transport
All type of vehicles
Type of
stakeholders
• Research institutes
• Traffic managers
Institutional
arrangements
EU fp7 program
Transferability Transferable to other cities and Countries

D2.1 Overview of ITS initiatives in the EU and US
EcoMove Improve traffic flow stability
Description
Status Finished, run from 2010-2013
Country European project
Description of
service
Infrastructure systems gather information about speeds and headways of vehicles
in the traffic flow. Based on this information the stability of the traffic flow is judged.
Advice on speed and headway is given to drivers in order to improve the stability of
the traffic flow and smooth out the speed profiles of the vehicles.
Main objective • Avoid frequent heavy braking and acceleration from vehicles driving too
close to each other, and thus reduce fuel consumption.
• Prevention of shock waves by ensuring that disturbances in traffic flow do
not grow in magnitude as they propagate upstream.
• Indirectly, improve road safety and comfort
Innovation
phase
7
Type of ITS ATMS
Technology
used
• On-board units
• Roadside units
Geographical
scale
Dense but not yet congested traffic
Type of
transport
All type of vehicles
Type of
stakeholders
• Road users
• Service providers
• Traffic managers
• Vehicle users
Institutional
arrangements
EU fp7 program
Transferability Transferable to other cities and countries

D2.1 Overview of ITS initiatives in the EU and US
EcoMove Parking
Description
Status Finished, run from 2010-2013
Country European project. Tested at three France highways
Description of
service
Improve parking guidance by providing real time information on the location of
available parking spaces and dynamic routing to available parking facilities
considering network state, events and current levels of pollutants. This should
make finding a parking spot more efficient for road users, which reduces the stain
on the traffic system. Which benefits the road operator. Road operators are aware
of free parking spaces and want to advise vehicles about parking opportunities.
Main objective Reducing unproductive travel kilometres and through this the environmental impact
of road transport.
Innovation
phase
7
Type of ITS The sensors measure the cars; no direct communication is happening. Type of ITS
is Traffic management, parking.
Technology
used
Application
Geographical
scale
Urban parking places
Type of
transport
Inner city cars and trucks.
Type of
stakeholders
• Road users
• Traffic managers
• Vehicle users
Institutional
arrangements
EU fp7 program
Transferability Transferable to other cities and Countries

D2.1 Overview of ITS initiatives in the EU and US
FOTsis 6 – Advanced Enforcement
Description
Status Finished (2011-2015)
Country 1 highway in Greece and 1 highway in Portugal
Description of
service
This service uses different means and technologies besides the ones currently
used to carry out traffic law enforcement. An example is the use of an On Board
Unit that measures the maximum speed. Drivers get a warning when they exceed
limits and enforcement actions when these warnings are violated. The basis of
service is to see how notifications shown to drivers can be enforced. And how
these data are managed and stored in the on board unit. Three elements are
covered:
• Speed enforcement
• Lane enforcement
• Minimum distance between vehicles
The on board unit sends information towards the traffic centre. The road side
infrastructure does the same. It is visible if the vehicle (on board unit) informs the
same speed as is currently possible at the stretch of the road. It is than possible to
see if the vehicle drives an acceptable speed. Non-compliance could trigger
enforcement actions in real time and afterwards. This not only holds for going too
fast, also slow drivers have the possibility to impose a lot of danger.
Main objective Better speed enforcement has a positive influence on the safety of road users. A
higher road safety reduces the number of accidents and this reduces congestion.
This has a positive effect on the sustainability as emissions reduce.
Innovation
phase
7
Type of ITS ATMS enforcement with C-ITS V2I technology
Technology
used
The following technologies are used:
• Mobile router equipped with WiFi-p
• Highway detection infrastructure: loops, cameras, etc.
• 3G
Geographical
scale
Regional level: on specific parts of national highways.
Type of
transport
This ITS service is tested for passenger cars and is relevant for both short- and
long distance trips.
Type of
stakeholders
• Road managers : management and development
• Research institutes
• ITS companies
• Service users
• Road users
Institutional
arrangements
Partly EU funded under FP7. Consortium with 25 Partners from 9 European
Countries. Partners include Road operators, universities, telecom operators, maps
providers, technology integrators, research centres, users’ association, and
industry associations.
Transferability This service is applicable to other countries

D2.1 Overview of ITS initiatives in the EU and US
FOTsis 3 - Intelligent Congestion Control
Description
Status Finished (2011-2015)
Country Spain 1 highway. Germany 3 highways
Description of
service
• Improve the traffic load balancing in the road networks by introducing new
algorithms to integrate dynamic data from diverse traffic information
sources.
• Provide and integrate different data sources and deploy a suitable
communication network
• Integrate infrastructure based detection of the traffic and weather
conditions, incidents and the interaction between those
• Manage traffic flow by controlling maximum speed and real time
communication with drivers
• Service based mostly on existing infrastructure
Main objective Provide a high-level traffic management system. Gains are improved safety and
mainly mobility through speed advice, less lane changes and less rear-end
collisions. Additionally, the traffic capacity could increase and comfort and
sustainability could increase.
Innovation
phase
7
Type of ITS ATMS demand and access management
Technology
used
The following technologies are used:
• 3G/4G cellular network
• Highway detection infrastructure: loops, cameras, etc.
Geographical
scale
Regional level: on specific parts of national highways.
Type of
transport
This ITS service is tested for passenger cars and is relevant for both short- and
long distance trips.
Type of
stakeholders
• Road managers : management and development
• Research institutes
• ITS companies
• Road users
• Policy makers
• Automotive associations and organisations
• Industry representatives.
Institutional
arrangements
Partly EU funded under FP7. Consortium with 25 Partners from 9 European
Countries. Partners include Road operators, universities, telecom operators, maps
providers, technology integrators, research centres, users’ association, and
industry associations.
Transferability This service is easily transferable to other road vehicles and to other types of
roads.

D2.1 Overview of ITS initiatives in the EU and US
Fotsis 4 - Dynamic Route Planning
Description
Status Finished (2011-2015)
Country Germany 3 highways and 1 highway in Spain
Description of
service
The goal of this service is to manage traffic via dynamic route recommendations for
predefined network meshes. Infrastructures generate information that provides a
detailed overview of the traffic and weather situation. Based on current and
forecasted traffic an optimal route is generated/altered to give a best service. The
service provides a route recommendation. This improves road safety, comfort and
reduces emissions. Reroutes have the costs that traffic at alternative roads is
increasing. Data is collected from road side sensors and other equipment.
Furthermore, data is collected from passing vehicles (position/speed). Historic data
about input traffic, capacity of network, turning rates, and more is used to estimate
the optimal routes given current traffic and weather conditions.
Main objective Increase Efficiency and improving safety. Additionally, comfort and sustainability
increase.
Innovation
phase
7
Type of ITS ATMS. Highway systems
Technology
used
The following technologies are used:
• GPS
• Highway detection infrastructure: loops, cameras, etc.
• Smartphone
• Mobile router inside car -> connection via 3G and WiFi.
Geographical
scale
Regional level: on specific parts of national highways.
Type of
transport
This ITS service is tested for passenger cars and is relevant for both short- and
long distance trips.
Type of
stakeholders
• Road managers: management and development
• Research institutes
• ITS companies
• Road users
• Policy makers
• Automotive associations and organisations
• Industry representatives.
Institutional
arrangements
Partly EU funded under FP7. Consortium with 25 Partners from 9 European
Countries. Partners include Road operators, universities, telecom operators, maps
providers, technology integrators, research centres, users’ association, and
industry associations.
Transferability This service is transferable to other road vehicles and to other types of roads.

D2.1 Overview of ITS initiatives in the EU and US
FOTsis 7 – Infrastructure safety assessment
Description
Status Finished (2011-2015)
Country 2 highways in Portugal
Description of
service
This service addresses the benefits of the exploitation of the information coming
from the infrastructure in combination with information recorded by the on board
unit. This will be used to identify and reconstruct specific related ‘situations’ that
may occur in the road infrastructure. The performance of a road will be assessed
post-process with use of the data measured by the on board unit. Three categories
are defined:
• Normal driving conditions
• Degraded driving conditions due to weather, condition of driver, etc.
• Imminent crash situations
The data is very useful for feedback towards highway operators, emergency
vehicles but also third parties, for instance insurance companies. This service is
purely aimed about generating the data.
Main objective As more information about road conditions become available safety increases. This
has a positive effect on efficiency and sustainability.
Innovation
phase
7
Type of ITS ATMS Traffic monitoring
Technology
used
On board unit/black box
• 3G
• Mobile Routers
• Beacons on the end of the stretch of road
Geographical
scale
Regional level: on specific parts of national highways.
Type of
transport
This ITS service is tested for passenger cars and is relevant for both short- and
long distance trips.
Type of
stakeholders
• Road managers : management and development
• Research institutes
• ITS companies
Institutional
arrangements
Partly EU funded under FP7. Consortium with 25 Partners from 9 European
Countries. Partners include Road operators, universities, telecom operators, maps
providers, technology integrators, research centres, users’ association, and
industry associations.
Transferability Transferable to other road types and vehicles

D2.1 Overview of ITS initiatives in the EU and US
Guiade
Description
Status Finished (2009-2011)
Country Spain
Description of
service
GUIADE aims to achieve automation in the positioning and guidance of public
transport vehicles based on the multimodal perception of the environment, using
the information collected by the vehicles as well as those supplied from the ITS
infrastructure.
Equipped public transport vehicles obtain information about their local
environments using vision-based vehicle detection system (cameras etc.) and
floating car data (FCD) technology.
The cameras capture relevant information such as weather and daytime
conditions, the number of vehicles in the local range of the bus as well as their
relative position and velocity, while the FCD system captures information like
global location, speed, and direction.
The vehicles transmit this information to a central control unit wireless technology
via GPRS/UMTS cellular protocols.
The central unit then integrates the data collected by the fleet in order to generate
updated traffic status and weather maps which will be used for fleet management
tasks as well as to estimate the time of arrival.
To minimize failure points of cellular networks, a backup V2V communication
system based on WiFi is used so that in-range vehicles will exchange the most
updated information available.
Warnings of possible incidents detected by the ITS infrastructure are issued in
advanced to the drivers through the ADAS systems of equipped vehicles.
Main objective To improve traffic efficiency, reduce energy consumption, and improve service
quality of public transport
Innovation
phase
6
Type of ITS APTS Real time system status information
Technology
used
• Sensor
• ADAS
• GPS
• GSM
• WiFi (WLAN)
• Camera
• GPRS/UMTS
Geographical
scale
Urban, interurban
Type of
transport
Passenger transport (bus)
Type of
stakeholders
• Universities
• Research institutes
• ICT solutions provider
• Wireless solutions provider
• Ministry of Science and Innovation (Funding)
Institutional
arrangements
Public-private partnership. The project is funded by the Spanish Ministry of Science
and Innovation (MICINN) and the European Regional Development Fund,
(FEDER)
Transferability This service is easily transferable to other road vehicles and to other types of
roads.

D2.1 Overview of ITS initiatives in the EU and US
Secure Transport Communication based on TETRA (HOGIA)
Description
Status On-going (recently launched, 2016)
Country Sweden, UK
Description of
service
HOGIA system helps bus companies to improve the efficiency of communication
between traffic management and bus drivers. Based on TETRA technology, Hogia
can link up traffic management systems to national radio communication systems.
This provides buses with a stable, user-friendly radio system and creates a safer,
less stressful working environment for staff. Traffic managers can create
communication groups based on bus routes or departure times, without the need to
track down call numbers for individual buses or drivers. Traffic controllers can also
call individual buses directly. Bus drivers can also use the same features in order
to contact each other.
Main objective Main objective behind the application of TETRA and of specific HOGIA proposed
approach is to increase efficiency of communications while creating safer
environment. Main benefits rely then on enhanced security (alarm control, geo-
fencing features, incident communication, coded encryption, monitoring and
control); flexibility (easy-to-use, flexible configuration) and enhanced analytical
approach (data reporting/logs, status, location, call records).
• Safety
• Efficiency
• Comfort
• Emergency services
Innovation
phase
TRL 9.
Type of ITS APTS Based on TETRA technologies, HOGIA system can be considered under the
ITS category of Traffic Operation Control / Traffic Management
Technology
used
Key enabling technologies are linked to the TETRA system (Communication
technologies: Radio).
Geographical
scale
Successfully implemented for Swedish public transport companies, but as most
national communications systems in Europe are based on TETRA technology, the
solution can be implemented across the continent.
Type of
transport
Passenger Transport, all types.
Type of
stakeholders
• Government/cities
• European Union
• Service providers
• Research institutes
• Automotive suppliers
• Emergency services
• Parking operators
• Travellers/passengers
• Road operators
Institutional
arrangements
Private, PPP
Transferability Can operate in any location where stakeholders agree on system spec. Can be
used on any vehicle to communicate data.

D2.1 Overview of ITS initiatives in the EU and US
Lanes management in USA
Description
Status In operations
Country USA
Description of
service
In USA, by using lane management the following strategies can be implemented
• regulate demand
• separate traffic streams to reduce turbulence, and
• utilize available and unused capacity.
Examples of operating managed lane projects include high-occupancy vehicle
(HOV) lanes, value priced lanes, high-occupancy toll (HOT) lanes, or exclusive or
special use lanes. Each of these concepts offers unique benefits; therefore, careful
consideration is given to project goals and objectives in choosing an appropriate
lane management strategy or combination of strategies. Project goals may include
increasing transit use, providing choices to the traveller, or generating revenue.
The following figure is a diagram that captures the potential lane management
applications that fall into this broad definition of "managed lanes." On the left of the
diagram are the applications of a single operational strategy—pricing, vehicle
eligibility, or access control:
Main objective • Safety
• Efficiency
• Comfort
• Environment
Innovation
phase
TRL9
Type of ITS Discuss the type of ITS to which the application belongs: Advanced Traffic
Management Systems / Demand and Access Management
Elaborate on the type of station(s) used: road side beacon, traffic management
centre
Technology
used
• VMS
• DSRC
Geographical
scale
USA
Type of
transport
Freight or passenger transport
Transport mode: passenger car, truck,
Transport type/motive: long distance, commuter travel, leisure travel etc.
Type of
stakeholders
• DoT in each State
• Government/cities
• Federal Highway Administration
• Road operators
Institutional
arrangements
Public
Transferability Potentially high

D2.1 Overview of ITS initiatives in the EU and US
Madrid smart parking
Description
Status Finished (2014) and in operation
Country Madrid (Spain)
Description of
service
The city of Madrid has developed a Sustainable Urban Mobility Plan (SUMP) to
promote more sustainable transport in the city and to reduce the use of private cars
in favour of more sustainable modes. In the frame of the SUMP, thanks to the
parking policy, Madrid is the first city in the world to implement a variable parking
rate based on vehicle emissions
Those who park on-street pay according to the level of environmental friendliness
of the technology of the vehicles (in Euro-class): when a car is parked the driver is
asked to submit its licence plate number. This is checked against a reference
database that includes the eco-performance of the vehicle. This determines the
cost of parking.
Madrid shows that a coherent parking strategy can serve different policy goals: air
quality, traffic management, energy use and clean vehicle deployment.
Main objective • Efficiency
• Environment
Innovation
phase
TRL9
Type of ITS The type of ITS to which the application belongs: Advanced Transportation
Management Systems (ATMS).
Type of station(s) used: metered, traffic management centre, vehicles with
cameras to read vehicle number plates parked
Technology
used
• Cellular
• Radio
• Camera
• Payment systems
Geographical
scale
Madrid
Type of
transport
Passenger transport at urban level
Transport mode: passenger cars
Transport type/motive: urban distance, commuter travel, leisure travel etc.
Type of
stakeholders
• Municipality of Madrid
• Services and technologies providers
Institutional
arrangements
Project implementation funded by the Municipality of Madrid
Transferability Madrid starts from building blocks that are available to all cities in Europe: the
national vehicle register, parking hardware, parking regulations, and so on and it
also offers good practice ready for transfer.

D2.1 Overview of ITS initiatives in the EU and US
Multi-use lane in Barcelona
Description
Status Finished :2006
Planned extensions, partially deployed
Country Spain
Description of
service
In order to develop measures against the uncontrolled growth of private vehicles
operating in the City– making goods deliveries more and more difficult – the
municipality initiated a project analysing the effects of urban commercial transport
on the traffic situation.
The most advanced measure is the installation of so called multi-use lanes. Within
Barcelona three lanes are used as multi-use lanes installed with VMS technology
(variable message signs) which clarifies who is allowed to use the street (residents,
clear-way, deliveries) according to the time of the day.
Some roads in inner city area are equipped with (VMS). During the day time one
lane of the street is reserved for activities of different user groups (parking, loading
unloading, traffic flow). The variable message signs show the actual access rights
per user group to use the lane. Technically, the approach is realised in such a way
that a first VMS shows whether the lane can be used for floating traffic or whether it
is dedicated to parking and loading activities. In case the lane is dedicated to
parking and loading activities, a second VMS shows the actual allowance for a
particular user group.
Main objective • Efficiency
• Environment
Innovation
phase
TRL at the top
Type of ITS Advanced Traffic Management Systems / Demand and Access Management
Technology
used
VMS
Geographical
scale
Urban level, inner city
Type of
transport
• Freight
• Private vehicles
• Public transport
Type of
stakeholders
The carriers doing the deliveries to the local stores as well as the retailers are
involved. The municipality planned and installed the system
Institutional
arrangements
Private, main financing sources for the project: national public funds
Transferability Easy transferability, provided consensus with economic operators is reached on
solid bases

D2.1 Overview of ITS initiatives in the EU and US
New York’s Midtown in Motion (MiM) adaptive traffic signal control system
Description
Status Finished (2011-2013) and in operation
Country New York City (USA)
Description of
service
Midtown in Motion is the congestion management system implemented in July
2011 for improving mobility and reducing delays due to traffic congestion in
Midtown (New York). The program was completed in September 2013 and it
included 210 microwave sensors, 56 traffic video cameras and 48 E-ZPass RFID
readers at about 10.000 intersections to measure traffic speeds.
The database of traffic demand was used to generate a two-level strategy: at one
level, an ‘algorithm of adaptive control’ would respond to real-time traffic flow data,
adjusting green-time signal phasing to anticipate build-ups of congestion; at a
second level, TMC operators would respond to discrete incidents with appropriate
action such as activation of pre-determined signal phasing, or requesting response
from New York’s Police Department.
Midtown in Motion, the TMC, and ASTCs are some of the results of the nearly
$300 million DOT has invested in traffic management tools and advanced
technology across the city.
Main objective • Efficiency
• Comfort
• Environment
Innovation
phase
TRL9
Type of ITS Advanced Transportation Management Systems (ATMS). It consists in three main
‘building blocks’:
a modern Traffic Management Centre (TMC) (in Queens);
a comprehensive wireless communications network;
a programme of upgrading intersection traffic signal controllers.
Technology
used
Briefly discuss the technologies and message standards used. E.g.:
• Satellite
• WiFi
• RFID
Geographical
scale
New York City (about 270 block square ‘zone’)
Type of
transport
Type of transport for which the application is used:
Freight and passenger transport at urban level
Transport mode: passenger car, truck
Transport type/motive: urban distance, commuter travel, leisure travel etc.
Type of
stakeholders
• New York City
• New York State
• Federal Highway Administration
• Service providers (Transcore)
Institutional
arrangements
Project implementation funded by public authorities: New York city, New York State
and Federal Highway Administration
Transferability Totally transferrable

D2.1 Overview of ITS initiatives in the EU and US
Piedmont Regional Traffic Operation Centre: Traffic Supervisor
Description
Status In operation since 3 years
Country Piedmont Region (Italy): the system covers all the region (36.000 Km)
Description of
service
The traffic supervisor centre is the heart and the head of the Regional traffic
operation centre of Piedmont Region; it gathers real time information (provided by
traffic sensors, floating car data and road operators) to feed its traffic model and
forecast traffic for the next hour.
The Supervisor is based on a traffic model that using origin and destination matrix
and a graph describing the road network is able to estimate traffic conditions. The
model is feed with real time measurement (traffic flows, speeds) in order to
increase the reliability of traffic estimation and forecast.
Main objective The system has 3 mains objectives:
Traffic supervision
Collection of traffic data and provision of instrument to support public
administration in traffic (services, regulations and infrastructures) planning.
Real time information services devoted to general public.
These objectives can be mapped on the following categories
• Safety
• Efficiency
• Comfort
• Environment
Innovation
phase
During the design phase the Traffic Supervisor embedded a lot of very innovative
technologies and algorithms. The development lasted for several years and now
after some years of operation can be considered a product on the shelf (TRL9).
Type of ITS Advanced Traffic Management System (ATMS)
Elaborate on the type of station(s) used: traffic sensors, floating car data
Technology
used
• Satellite
• WiFi
• Radio
Geographical
scale
Regional level covering also regional motorways and with a special focus on Turin
metropolitan area.
Type of
transport
Mainly passenger transport
Transport mode: passenger car and trucks
Transport type/motive: long distance, commuter travel, leisure travel.
Type of
stakeholders
• Piedmont Region (co-founder and owner of the supervisor)
• 5t, the mobility agency of Turin
• Travellers/passengers (user of services)
• Road operators (data providers)
• Service and technology providers
Institutional
arrangements
The project has been founded by national and regional funds and carried out by a
company (5T) fully owed by public administrations.
Transferability Traffic supervisor can be transferred but require the presence of a traffic control
centre (infrastructure and staff) and a lot of data provider providing historical and
real time data.

D2.1 Overview of ITS initiatives in the EU and US
Amsterdam Mobile EVA : cooperative travel parking app
Description
Status Finished, active from 1-2014 1-2015
Country Netherlands
Description of
service
This mobile application is similar to Super route-P but was made by a different
consortium and active one year earlier. The mobile application was used to inform
visitors of 10 events in Amsterdam to the optimal route as well as the best parking
place. A portal behind this app and ADAM monitors the movement of participants
and advices them based on their location. The application was adjusted and
personalised for each event, and therefore also not available in the app stores
when no event was scheduled. Go with Eva to Bruce Springsteen is one example
of personalisation. Application is ‘active’ hours before the event, from this time
onwards it is possible to plan your trip. App will provide optimal route as well as
recommended departure time. If participants come close to the destinations the
application will provide active and actual directions towards a parking place.
Proximity is measured if the mobile phone passes a measurement point (pick-up
point). The application switched from general advice (eg. Route shown on map)
towards a more specified advice -> take a4, leave highway … and park at P2.
Participants can use the app on departure as well.
Portal receives information from parking garages, road management and uses this
to send push messages to participants.
Main objective Increase efficiency
Innovation
phase
Technology readiness 7
Type of ITS ATMS Parking management
Technology
used
3g/4g
Type of
transport
This ITS servie is tested for passenger cars and is relevant for both short- and long
distance trips.
Type of
stakeholders
• Service/app users
• Road authority
• Municipality
• Research institutes
• Service providers/app developer
Institutional
arrangements
It is a public private partnership. The funding has been received from several
sources:
Transferability Event based solution. Actual information for Amsterdam area, Scalable but not
profitable in its current form. The system in general could be used for events in
other cities or at other large events.

D2.1 Overview of ITS initiatives in the EU and US
Amsterdam onderweg Super P-route : cooperative travel/parking app
Description
Status Finished, active during 2015-2016
Country Netherlands
Description of
service
Mobile application that advices participants about parking opportunities and optimal
routes during large events in Amsterdam and its surroundings. Gives advice on
departure time and the ability to reserve a parking spot. Smart Routing algorithm
uses real time information to give multiple route alternatives during travel. App
uses load balancing (different users from the same location are advised different
routes). Back office system is like the function of Super-Route
Highlights:
• Open platform
• Advice for participants
• Receives floating car data from participants
• Uses information of road authorities
Main objective Less congestion and more reliable trip information (efficiency)
Innovation
phase
TRL 7
Type of ITS ATMS Parking management
Technology
used
3g/4g cellular network
Type of
transport
This ITS service is tested for passenger cars and is relevant for both short- and
long distance trips.
Type of
stakeholders
• Service/app users
• Road authority
• Municipality
• Research institutes
• Service providers/app developer
Institutional
arrangements
It is a public private partnership. The funding has been received from several
sources:
Transferability Event based solution. Actual information for the Amsterdam area. Scalable but not
profitable in its current form. The system in general could be used for events in
other cities or at other large events.

D2.1 Overview of ITS initiatives in the EU and US
Sensit Nedap parking
Description
Status Applied at multiple places. Kortrijk (BE) and Zoetermeer(NL) for example.
Introduced in 2006. Also applied in Moscow,
Country Netherlands
Description of
service
Wireless ground sensors that measure if parking spots are available. This is
communicated towards a central station. This information is then communicated
towards drivers. The sensors also measure times, which is used to inform
authorities if parking times are exceeded. This product is developed by a private
company NEDAP and the service is called Sensit.
Main objective Less time finding a parking spot. Which is good for comfort and reduces fuel use.
Innovation
phase
9
Type of ITS ATMS. Parking management
Technology
used
• Sensor
• Earth magnetic field
• Infra red
• 900 MHz to communicate with sensor station
Geographical
scale
Urban parking places
Type of
transport
Aimed at cars and inner city trucks
Type of
stakeholders
Private company
Institutional
arrangements
Developed and commercialized by a private company
Transferability Transferable to other cities and Countries

D2.1 Overview of ITS initiatives in the EU and US
Traffic Information System Romania
Description
Status Finished (12/2011 – 2/2013) and in operation
Country Romania: all national routes, motorways and Bucharest's main thoroughfares
Description of
service
TrafficGuide - Real-time Traffic Information System for Romania has been a project
developed by Electronic Solutions SRL and co-funded by European Union with
European Fund for Regional Development.
The project aim has been to develop a real-time traffic information system for
Romanian Motorways, National Roads and Bucharest Area, monitoring a total of
around 80,000 kilometres of road.
The data gathered is compared, validated, harmonised and merged. The data
sources are dynamically weighted during the harmonisation process to facilitate
adaptation to local circumstances. Thanks to these solutions, it is possible to
provide traffic managers with a comprehensive picture of speed, traffic densities
and congestion across their traffic network.
Main objective • Efficiency
• Comfort
• Safety
• Environment
Innovation
phase
TRL9
Type of ITS Discuss the type of ITS to which the application belongs: Advanced Traffic
Management System (ATMS)
Elaborate on the type of station(s) used: FCD, ANPR
Technology
used
• Satellite
• Radio
Geographical
scale
National level
Type of
transport
Freight or passenger transport
Transport mode: passenger car, truck
Transport type/motive: long distance, commuter travel, leisure travel etc.
Type of
stakeholders
• ELSON (coordinator, an engineering and consulting firm which specialises
in ITS solutions and is working together with ITS Romania to implement
intelligent traffic systems in Romania)
• PTV (software provider)
• Motorways operators
• National road operators
• Bucharest Traffic Management
• Road operators
Institutional
arrangements
TrafficGuide - Real-time Traffic Information System for Romania - is a project
developed by Electronic Solutions and co-funded by European Union from
European Fund for Regional Development.
Transferability Totally transferrable

D2.1 Overview of ITS initiatives in the EU and US
Urban Traffic Control (UTC) London
Description
Status Finished and in operation
Country England
Description of
service
London has one of the largest integrated traffic signal systems in the world. There
are 4.800 sets of traffic signals and all are owned and operated by Transport for
London. Of these, 2,800 are controlled centrally directly by the UTC system,
allowing the signal phasing timings to be controlled directly by the London Traffic
Control Center and by Transport for London traffic signal engineers.
Some 1300 sets of traffic signals are controlled by central computers systems that
use a dynamic, real time demand responsive management systems. This adjust
the operation of the traffic signals on a second by second basis. Vehicles detectors
buried under the road surface, monitor the volume of traffic and levels of
congestion and change the signal timings to optimise the road capacity. The
systems use the SCOOT algorithm developed by the Transport Research
Laboratory. The dynamic SCOOT approach provides significant improvement over
the alternative “Fixed Time” approach and there is a continuing programme to
extend SCOOT use.
500 sets of traffic signals are on fixed time and the relevant timing plans can be
implemented remotely using computer control systems. These plans are derived7
through traffic modelling techniques. They vary according to the time of day and
day of week and are designed to take in account of “expected” traffic conditions.
Plans can be altered by the London Traffic Control Center operation staff, usually
drawing on a growing library of pre-defined plans developed to meet a range of
operational scenario. When significant incidents take place, or there are
preparations for major events, traffic signal control engineers will develop new
plans to meet the specific circumstances.
Main objective • Safety
• Efficiency
• Environment
Innovation
phase
TRL9
Type of ITS Advanced Traffic Management Systems / Demand and Access Management
Via ITS stations: traffic lights, traffic management centre
Technology
used
Adaptive control
Geographical
scale
Urban
Type of
transport
Freight or passenger transport
Transport mode: passenger car, truck,
Type of
stakeholders
• Municipality of London
• Transport for London
• Transport Research Laboratory
Institutional
arrangements
Public
Transferability Totally transferrable
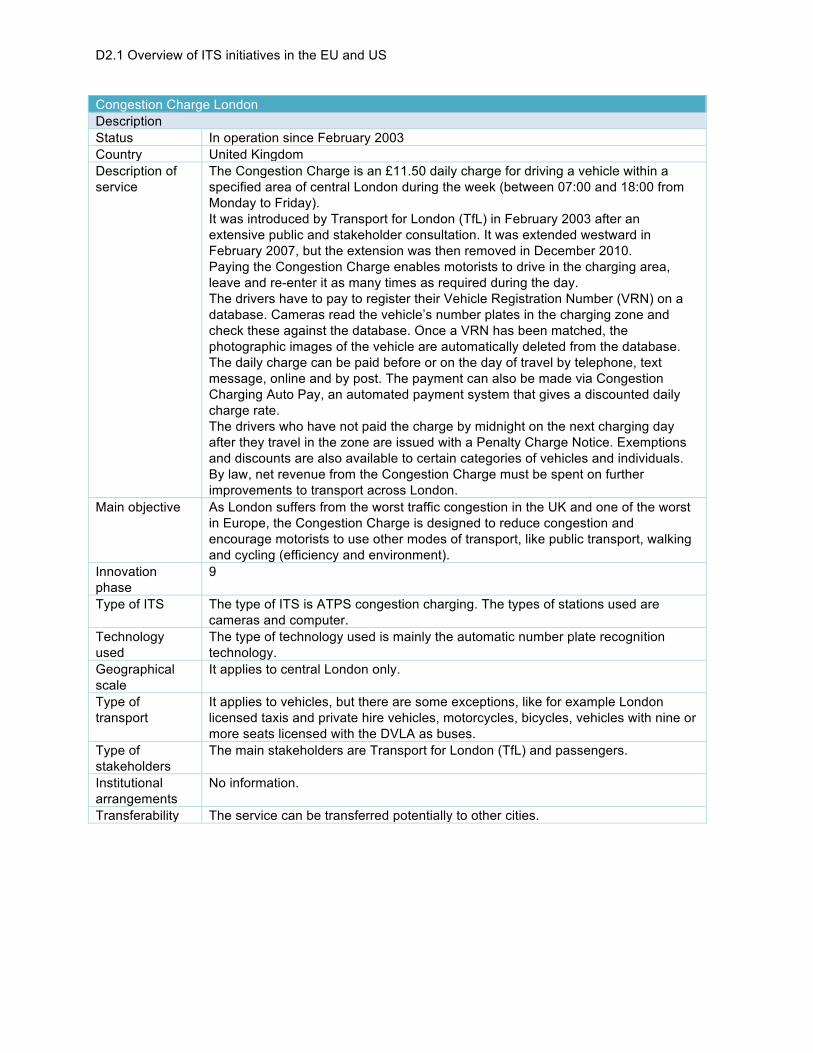
D2.1 Overview of ITS initiatives in the EU and US
Congestion Charge London
Description
Status In operation since February 2003
Country United Kingdom
Description of
service
The Congestion Charge is an £11.50 daily charge for driving a vehicle within a
specified area of central London during the week (between 07:00 and 18:00 from
Monday to Friday).
It was introduced by Transport for London (TfL) in February 2003 after an
extensive public and stakeholder consultation. It was extended westward in
February 2007, but the extension was then removed in December 2010.
Paying the Congestion Charge enables motorists to drive in the charging area,
leave and re-enter it as many times as required during the day.
The drivers have to pay to register their Vehicle Registration Number (VRN) on a
database. Cameras read the vehicle’s number plates in the charging zone and
check these against the database. Once a VRN has been matched, the
photographic images of the vehicle are automatically deleted from the database.
The daily charge can be paid before or on the day of travel by telephone, text
message, online and by post. The payment can also be made via Congestion
Charging Auto Pay, an automated payment system that gives a discounted daily
charge rate.
The drivers who have not paid the charge by midnight on the next charging day
after they travel in the zone are issued with a Penalty Charge Notice. Exemptions
and discounts are also available to certain categories of vehicles and individuals.
By law, net revenue from the Congestion Charge must be spent on further
improvements to transport across London.
Main objective As London suffers from the worst traffic congestion in the UK and one of the worst
in Europe, the Congestion Charge is designed to reduce congestion and
encourage motorists to use other modes of transport, like public transport, walking
and cycling (efficiency and environment).
Innovation
phase
9
Type of ITS The type of ITS is ATPS congestion charging. The types of stations used are
cameras and computer.
Technology
used
The type of technology used is mainly the automatic number plate recognition
technology.
Geographical
scale
It applies to central London only.
Type of
transport
It applies to vehicles, but there are some exceptions, like for example London
licensed taxis and private hire vehicles, motorcycles, bicycles, vehicles with nine or
more seats licensed with the DVLA as buses.
Type of
stakeholders
The main stakeholders are Transport for London (TfL) and passengers.
Institutional
arrangements
No information.
Transferability The service can be transferred potentially to other cities.

D2.1 Overview of ITS initiatives in the EU and US
Maut
Description
Status Ongoing
Country Germany and Austria
Description of
service
Toll system for heavy duty vehicles on German and Austrian Highways and main
national roads. The amount of the toll depends on the total distance that is driven
by the trucks. On-board registration units capture the total distance driven and the
amount of toll. This is collected automatically.
Toll amount depends on:
• Axles
• Euro emission class
The plan is to extend the toll for all road vehicles in 2018.
Main objective • Efficiency (reducing congestion)
• Environmental (polluter pays more)
Innovation
phase
TRL9. Operational
Type of ITS Advanced pricing systems. Vehicle miles travelled systems.
Technology
used
OBU
Geographical
scale
Germany and Austria
Type of
transport
Heavy duty freight
Type of
stakeholders
• Government
• Service provider
Institutional
arrangements
Public
Transferability Potentially high
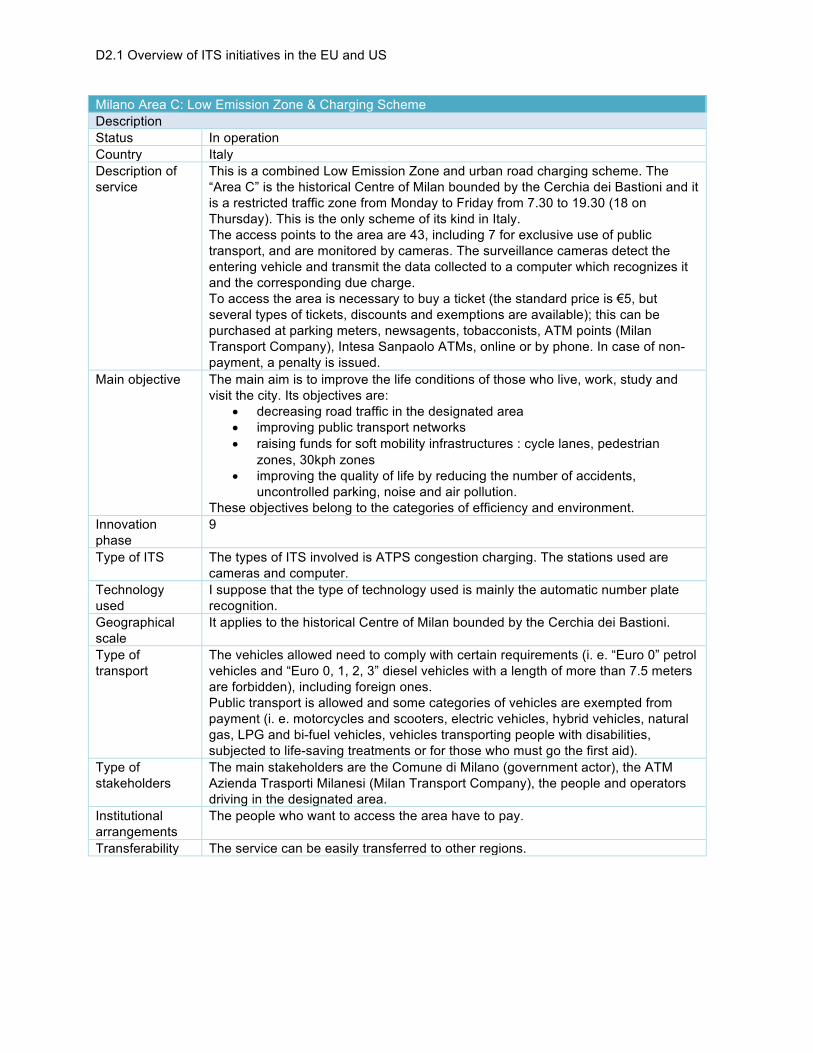
D2.1 Overview of ITS initiatives in the EU and US
Milano Area C: Low Emission Zone & Charging Scheme
Description
Status In operation
Country Italy
Description of
service
This is a combined Low Emission Zone and urban road charging scheme. The
“Area C” is the historical Centre of Milan bounded by the Cerchia dei Bastioni and it
is a restricted traffic zone from Monday to Friday from 7.30 to 19.30 (18 on
Thursday). This is the only scheme of its kind in Italy.
The access points to the area are 43, including 7 for exclusive use of public
transport, and are monitored by cameras. The surveillance cameras detect the
entering vehicle and transmit the data collected to a computer which recognizes it
and the corresponding due charge.
To access the area is necessary to buy a ticket (the standard price is €5, but
several types of tickets, discounts and exemptions are available); this can be
purchased at parking meters, newsagents, tobacconists, ATM points (Milan
Transport Company), Intesa Sanpaolo ATMs, online or by phone. In case of non-
payment, a penalty is issued.
Main objective The main aim is to improve the life conditions of those who live, work, study and
visit the city. Its objectives are:
• decreasing road traffic in the designated area
• improving public transport networks
• raising funds for soft mobility infrastructures : cycle lanes, pedestrian
zones, 30kph zones
• improving the quality of life by reducing the number of accidents,
uncontrolled parking, noise and air pollution.
These objectives belong to the categories of efficiency and environment.
Innovation
phase
9
Type of ITS The types of ITS involved is ATPS congestion charging. The stations used are
cameras and computer.
Technology
used
I suppose that the type of technology used is mainly the automatic number plate
recognition.
Geographical
scale
It applies to the historical Centre of Milan bounded by the Cerchia dei Bastioni.
Type of
transport
The vehicles allowed need to comply with certain requirements (i. e. “Euro 0” petrol
vehicles and “Euro 0, 1, 2, 3” diesel vehicles with a length of more than 7.5 meters
are forbidden), including foreign ones.
Public transport is allowed and some categories of vehicles are exempted from
payment (i. e. motorcycles and scooters, electric vehicles, hybrid vehicles, natural
gas, LPG and bi-fuel vehicles, vehicles transporting people with disabilities,
subjected to life-saving treatments or for those who must go the first aid).
Type of
stakeholders
The main stakeholders are the Comune di Milano (government actor), the ATM
Azienda Trasporti Milanesi (Milan Transport Company), the people and operators
driving in the designated area.
Institutional
arrangements
The people who want to access the area have to pay.
Transferability The service can be easily transferred to other regions.

D2.1 Overview of ITS initiatives in the EU and US
Sanef UK Liber-t Automated Toll Payment Service
Description
Status In operation
Country France
Description of
service
Sanef, the French motorway operator, has extended its Liber-t automatic toll
payment service to UK motorists. Liber-t is the French national télépéage scheme
for light vehicles operated by the members of ASFA, the association of French
motorway operators on behalf of the French government. It works on the entire
French toll road network and can also be used to pay for parking in some car
parks.
To use the service, drivers have to register on the dedicated UK website and will
receive a small electronic transponder (tag) to attach to the windscreen of the car,
just behind the rear-view mirror.
When approaching the barriers, a device by the barrier will read the transponder
(tag), extract the unique reference of that user and then automatically open the
barrier. The barrier has to be approached at walking pace and, when the
transaction has been completed, the tag will “beep”, the traffic light changes to
green and the barrier opens (on certain lanes it is possible to drive through at up to
30 km/h).
Therefore, the user will not need to stop and manually pay the toll. They will
receive an invoice and about 15 days later, the payment (in GBP) will be
automatically collected from their bank account in the UK via Direct Debit.
Main objective The main aim is to speed up travel for UK drivers and holiday makers in France.
These lanes save time because they avoid both queuing and having to keep Euro
cash handy to pay tolls (efficiency).
Innovation
phase
9
Type of ITS APS. Electronic toll collection
Technology
used
Electronic transponder technology.
Geographical
scale
The service includes all the toll motorways in France (excluding the Mont Blanc
and Fréjus tunnels). Sanef runs the toll roads in northern France, but this new tag
will work with every toll road across France.
Type of
transport
The Liber-t scheme is for light and intermediate vehicles and motorcycles only (i.e.
vehicle classes 1, 2 and 5); and it is for consumers, not businesses.
Type of
stakeholders
Sanef Tolling is a trading name of Emovis Tag UK Ltd, a wholly owned subsidiary
of Abertis SA, the ultimate majority owners of Sanef SA (a French motorway
company who operates toll roads in France and other toll systems around the
world). This is the main stakeholder, together with the UK motorists who use the
service.
Institutional
arrangements
The motorists who use the service have to pay the toll.
Transferability The application is transferable to other regions.

D2.1 Overview of ITS initiatives in the EU and US
Stockholm Congestion Pricing
Description
Status Finished:
Full operational since 2007
Country Sweden
Description of
service
In 2006, the county of Stockholm had nearly 2,000,000 residents, of which almost
half a million lived in the inner city. Of the approximately 320,000 people employed
in the inner city, more than 210,000 of them commuted from outside the inner city.
Prior to the congestion charges, the cordon around the inner city (see below
picture)was crossed by 530,000 vehicles and 800,000 transit passengers each
day.
Between March 2003 and February 2004, the Swedish Road Administration,
researched, designed and planned an access management system based upon
the concept of charging. They tested multiple traffic forecasting models to
determine how such charges would impact, among other things, public transit,
traffic congestion and air quality. Most models predicted a traffic decrease of about
16%.
There was no room on any of the city's bridges to build toll booths, so the idea of
individual vehicle transponders linked directly to bank accounts was proposed.
Eighteen unmanned electronic control points were established at all entrances into
the cordon and the tax was applied on both the entry and exit of the area.
For vehicles without a transponder, license plates were photographed using
automatic number plate recognition (ANPR) technology and cross-referenced with
Sweden's National Vehicle Registry to record the charge.
Figure below represent the process of the vehicles identification.
Main objective The primary objectives of the system were to reduce congestion, increase
accessibility and improve the environment.
Innovation
phase
The technology readiness level (TRL) of the application is at the top being
operative for 10 years and continuously optimized
Type of ITS Advanced transport pricing systems. Congestion charging.
Elaborate on the type of station(s) used: I2V carrying an on board unit linked to
road side beacon.
Technology
used
Briefly discuss the technologies and message standards used.
DSRC
Geographical
scale
Urban level, limited to the inner part of the city of Stockholm
Type of
transport
:
Freight and passenger transport
Transport mode passenger car, truck,
Transport type/motive:, commuter travel.
Type of
stakeholders
Stakeholders that are involved in the project (and their role). Possible stakeholders
are:
• Stockholm County Council regional planning and traffic unit
• Stockholm Transport
• Emergency services
• Travellers/passengers association
Institutional
arrangements
Fully public including financing sources for the project
Transferability Fully transferable provided careful planning and deep citizens involvement.
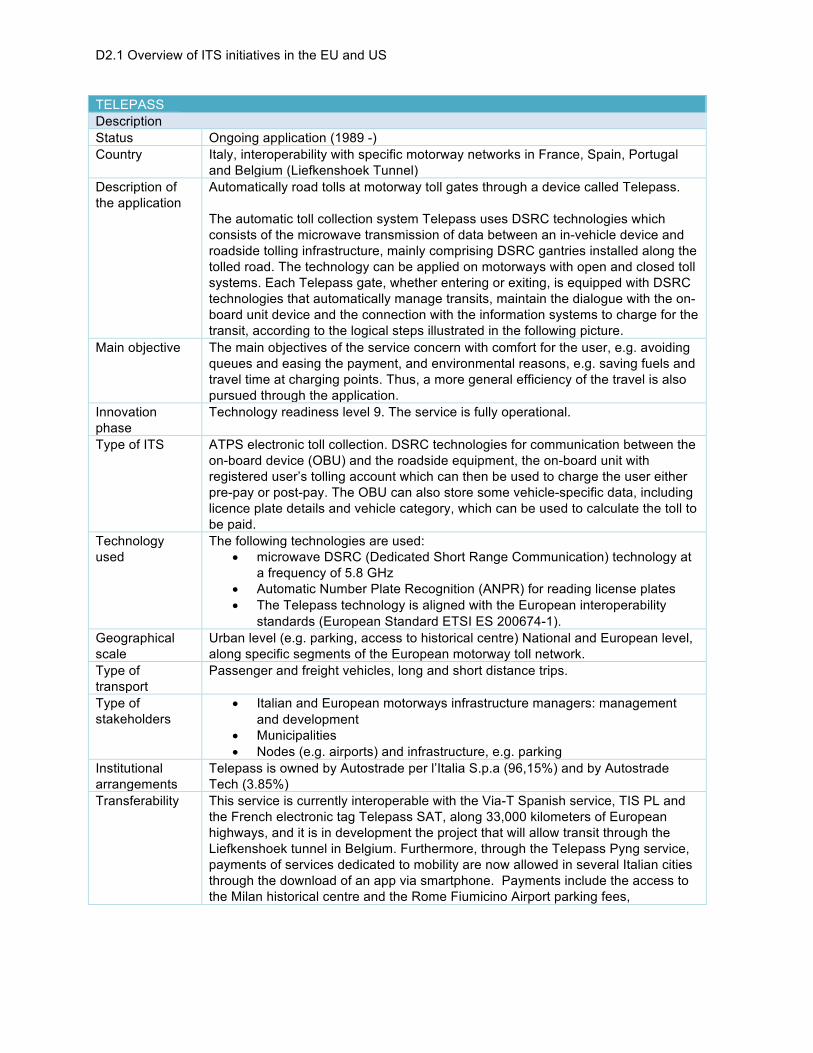
D2.1 Overview of ITS initiatives in the EU and US
TELEPASS
Description
Status Ongoing application (1989 -)
Country Italy, interoperability with specific motorway networks in France, Spain, Portugal
and Belgium (Liefkenshoek Tunnel)
Description of
the application
Automatically road tolls at motorway toll gates through a device called Telepass.
The automatic toll collection system Telepass uses DSRC technologies which
consists of the microwave transmission of data between an in-vehicle device and
roadside tolling infrastructure, mainly comprising DSRC gantries installed along the
tolled road. The technology can be applied on motorways with open and closed toll
systems. Each Telepass gate, whether entering or exiting, is equipped with DSRC
technologies that automatically manage transits, maintain the dialogue with the on-
board unit device and the connection with the information systems to charge for the
transit, according to the logical steps illustrated in the following picture.
Main objective The main objectives of the service concern with comfort for the user, e.g. avoiding
queues and easing the payment, and environmental reasons, e.g. saving fuels and
travel time at charging points. Thus, a more general efficiency of the travel is also
pursued through the application.
Innovation
phase
Technology readiness level 9. The service is fully operational.
Type of ITS ATPS electronic toll collection. DSRC technologies for communication between the
on-board device (OBU) and the roadside equipment, the on-board unit with
registered user’s tolling account which can then be used to charge the user either
pre-pay or post-pay. The OBU can also store some vehicle-specific data, including
licence plate details and vehicle category, which can be used to calculate the toll to
be paid.
Technology
used
The following technologies are used:
• microwave DSRC (Dedicated Short Range Communication) technology at
a frequency of 5.8 GHz
• Automatic Number Plate Recognition (ANPR) for reading license plates
• The Telepass technology is aligned with the European interoperability
standards (European Standard ETSI ES 200674-1).
Geographical
scale
Urban level (e.g. parking, access to historical centre) National and European level,
along specific segments of the European motorway toll network.
Type of
transport
Passenger and freight vehicles, long and short distance trips.
Type of
stakeholders
• Italian and European motorways infrastructure managers: management
and development
• Municipalities
• Nodes (e.g. airports) and infrastructure, e.g. parking
Institutional
arrangements
Telepass is owned by Autostrade per l’Italia S.p.a (96,15%) and by Autostrade
Tech (3.85%)
Transferability This service is currently interoperable with the Via-T Spanish service, TIS PL and
the French electronic tag Telepass SAT, along 33,000 kilometers of European
highways, and it is in development the project that will allow transit through the
Liefkenshoek tunnel in Belgium. Furthermore, through the Telepass Pyng service,
payments of services dedicated to mobility are now allowed in several Italian cities
through the download of an app via smartphone. Payments include the access to
the Milan historical centre and the Rome Fiumicino Airport parking fees,

D2.1 Overview of ITS initiatives in the EU and US
TEXpress
Description
Status In operation
Country Texas, USA
Description of
service
TEXpress Lanes are unique toll lanes built within an existing highway. They add
additional capacity to the highway to relieve congestion and allow traffic to flow
freely. They are adjacent to the general highway lanes, but they have independent
entrances and exits. The driver can choose to use the TEXpress lanes and pay the
tolls or to drive in the adjacent non-tolled general highway lanes.
The price of the TEXepress lanes changes depending on the level of traffic in the
corridor to maintain a minimum 50 mph speed of travel. This is different from the
traditional toll roads that instead charge the same rate at all times and do not aim
to ensure predictable travel times.
Roadside equipment monitors real-time traffic conditions and calculates real-time
traffic-based rates every 5 minutes throughout the day based upon the average
speed and number of drivers who want to use the TEXpress Lanes.
Prices may increase or decrease depending on the amount of traffic and the time
of the day (prices are lower during non-peak times); the customers are notified of
the price they would pay on the toll pricing signs prior to entering any segment of
the lanes. The variable pricing aims to ensure a predictable, higher-speed
commute.
The TEXpress Lanes are all-electronic and cashless. For customers with a Texas
tag, toll fees are automatically deducted from their pre-paid account. For those who
don’t have a tag, the video cameras will photograph the vehicle license plate and
the North Texas Tollway Authority will send the bill to the registered vehicle owner.
Main objective The main aim of the application is to offer more control over daily commute
(efficiency).
Innovation
phase
9
Type of ITS APS. Fee-Based express lanes
Technology
used
Technology for video cameras and toll pricing signs.
Geographical
scale
Currently, TEXpress Lanes are open or under construction on seven major Dallas
– Fort Worth corridors. Within the next years, other lanes will be designated on
other highly-congested roadways throughout North Texas.
Type of
transport
TEXpress Lanes can be used by anybody, including local drivers and commuters.
They are open to all types of vehicles including passenger vehicles, SUVs,
motorcycles, pickup trucks, large trucks and tractors with trailers. Special vehicles
or vehicles transporting hazardous material may have certain restrictions on some
routes.
Type of
stakeholders
The stakeholders involved are mainly government organisations (North Texas
Tollway Authority, NTTA; Texas Department of Transportation, North Central
Texas Council of Governments, Regional Transportation Council, Harris County
Toll Road Authority Organization) and drivers using the TEXpress Lanes.
Institutional
arrangements
The drivers who want to use the TEXpress Lanes have to pay. The price fluctuates
on the basis of traffic levels and demand for the lanes.
Transferability The service is potentially transferable to other regions. Actually, similar managed
lanes are already in operation in more than a dozen cities throughout the USA.

D2.1 Overview of ITS initiatives in the EU and US
Automatic dependent surveillance- broadcast
Description
Status Being deployed
Country Global
Description of
service
Technology to allow airplanes to broadcast their position, flight information and
weather conditions. This information is sent to flight control centres as well as other
airplanes. Mandatory in portions of Australian airspace, Required in US in 2020 for
some planes. Mandatory in Europe from 2017 onwards. New satellite will allow full
coverage and prevent planes ‘getting lost’.
Technique shows:
Traffic: altitude, heading, speed and distance to other aircrafts.
Weather
Flight Information (restrictions for example)
Main objective • Safety (continuous tracking of planes and weather updates)
• Efficiency (closer passing of aircrafts leads to more efficient use of space,
furthermore the technique is cheaper as radar)
Innovation
phase
Operational. TRL 9
Type of ITS ATIS IMSIS
Technology
used
The following technologies are used:
• GPS navigation source
• ADS-B unit (1090 MHz & 978 MHz)
• Ground units and on board system
Geographical
scale
Aviation
Type of
transport
Airplanes
Type of
stakeholders
• Airplane manufacturers
• Airports
• Traffic operators
• Service providers
• ADS-B manufacturers
Institutional
arrangements
60% of all passenger planes are equipped. Installations are done by private
companies and differ per navigational unit.
Transferability Not sure

D2.1 Overview of ITS initiatives in the EU and US
Heavy vehicle platooning trial Australia
Description
Status Running– C-ITS feasibility study testing autonomous heavy vehicle platooning
government-backed initiative of industry and commercial partners
With Peloton Technology set to make its driver assistance truck platooning system
commercially available in 2017 in the US, it may be fair to assume the trial will take
place next year (press release in 10/2016).
Description of
service
Heavy vehicle platooning, a group of 2 or more wirelessly-connected heavy
vehicles that travel at highway speed in close proximity, nose-to-tail.
A lead vehicle is followed by a number of other vehicles that precisely match
the lead vehicle’s speed and manoeuvres (synchronization of speed, braking and
positioning)
Under the technology, a lead truck assumes control of the convoy or platoon
through V2V communication and the trailing vehicles fall into lock-step.
Other vehicles can wirelessly connect and seamlessly join or leave the platoon at
any time
Main Objectives Facilitate demonstrations of autonomous technology for heavy vehicle platooning
Gathering valuable data and experience in safe operation of new technology
Raise awareness of autonomous vehicles and explore the benefits of truck
platooning in Australia.
Shape development of government policy + legislation for self-driving heavy
vehicles
Innovation
phase
7
Type of ITS C-ITS V2V freight
Technologies
used
Telstra’s 4G and future 5G networks
Geographical
scale
Western Australia
22 km non-public roads section of the Carina Haulroad: controlled environment
Type of
transport
• Heavy vehicle
• Long distance
Type of
stakeholders
• Main Roads Western Australia
• Australian Driverless Vehicle Initiative (ADVI), a cooperation of industry,
government and academia
• Peloton Technology (US-based automation + connected vehicle
technology company)
• Telstra (telecommunications company)
• Western Australian Road Transport Association (WARTA)
• Government of Western Australia.
Institutional
arrangements
run by Western Australia, Department of Main Roads
Transferability This service is transferable

D2.1 Overview of ITS initiatives in the EU and US
CACC - Cooperative Adaptive Cruise Control in Real Traffic Situations
Description
Status Finished – Joint demonstration study (UC Berkeley / Nissan Co. Ltd) - 2014
Country USA
Description of
service
Adaptive cruise control (ACC) systems can gain enhanced performance by adding
vehicle-vehicle wireless communication to provide additional information to
augment range sensor data, leading to cooperative ACC (CACC).
CACC was designed, developed, implemented in production cars and tested in
real-traffic scenarios (to compare to existing ACC systems).
Main objective Reduction of traffic accidents (road safety) – previous focus
Improving traffic flow, Reducing congestions on highways (efficiency, environment)
– focus of this study
A system able to reduce disturbances propagated from leading vehicle to rest of
the vehicle platoon
Tighter control of vehicle spacing + shortened time-gap settings (efficiency, drivers’
comfort) in any traffic circumstance, with smoothness + accuracy
Innovation
phase
TRL 5(-6) = Design, development, implementation + testing of a CACC system
Type of ITS C-ITS V2V Safety
Technology
used
V2V - Cooperative adaptive cruise control (ACC)
• Factory installed ACC controller
• 5.9-GHz Dedicated Short-range communication (DSRC) with GPS in
wireless safety unit (WSU) supplied by DENSO (wireless communication)
• LiDAR providing data on immediately preceding vehicle
• On-board vehicle sensors providing data on own speed, acceleration, yaw
rate
Geographical
scale
National level highways / public roads
4 equipped vehicles-scenario
Type of
transport
V2V (wireless communication)
• Freight or passenger transport = different from ACC, a vehicle gets
information not only from its preceding vehicle but also from vehicles in
front of the preceding one
Transport mode
• Passenger cars, trucks
Transport type
• High speed, long distance
Type of
stakeholders
• Automotive suppliers
• Road operators
• Traffic management operators
• Passenger/Drivers
Institutional
arrangements
Joint Publication from
Center for Automation and Robotics (CAR, UPM-CSIC, Madrid/ES)
California Partners for Advanced Transit and Highways (PATH) Program of the
Institute of Transportation Studies, UC Berkeley, Richmond, CA/USA
ITS Advanced and Product Engineering Group, Nissan Motor Co. Ltd / JPN
Nissan Technical Center North America, MI/USA
Transferability Yes, flex. in terms of vehicle type, scale, region etc.:

D2.1 Overview of ITS initiatives in the EU and US
CITI Australia
Description
Status 2013 -2018
Country Australia
Description of
service
Collision warning system test
Main objective • Increase road safety
• Increase in “time horizon” = quality + reliability of information available to
the drivers about their immediate environment, other vehicles and road
users
• Improve network efficiency
• Improvement of traffic conditions for all road-users, if heavy vehicles do not
need to accelerate/decelerate too often/much thanks to ITS
• Reduce greenhouse gases
Innovation
phase
7 (System prototype demonstration in operational environment)
Type of ITS C-ITS V2V Safety
Technology
used
• Dedicated Short Range Communication (DSRC): 5.9 GHz, 3G/4G mobile
phone network – in vehicle, plus min. 1 signalised intersection
Geographical
scale
Illawarra Region of NSW south of Sydney:
2300 km of NSW road network
Type of
transport
• Heavy vehicle
• Buses
• Passenger vehicles
• Short- and long distance trips.
Type of
stakeholders
• Heavy Transport Companies
• Suppliers of DSRC equipment
• Communications and Media Authority
• Scientific and Industrial Research Organisation
• Road safety researchers
• Hardware and software developers
Institutional
arrangements
PPP
Transferability In the future, automated vehicles may use V2I to interface with traffic lights, or V2V
to detect vehicles not in line of sight. Experts believe that a combination of
connected and automated technology is required to realise the largest potential
improvements to congestion and safety.

D2.1 Overview of ITS initiatives in the EU and US
C-ITS Corridor: Road Works Warning
Description
Status Ongoing pilot project (2015-2018)
Country The Netherlands
Description of
service
The Road Works Warning service aims to inform drivers about road works ahead.
The warnings are transmitted using a secure short-range ETSI G5 (WiFi-p)
connection and the 3G/4G mobile telephone network. Roadside beacons send a
warning message to the traffic information centre. This information is made
available to service providers who offer related services to drivers over the mobile
network (3G/4G). Road users using these services receive a message about 3
kilometres before they reach the road works, containing information about the
exact location of the road works.
With help of WiFi-P technology information on the road works is sent directly to
vehicles equipped with WiFi receivers and shown on their navigation screens. This
may include information on the (adjusted) speed limits, lane availability, etc.
The service has been tested on a small scale (two test locations with a very limited
number of passenger cars) on the national highway (A16 and A58) in the
Netherlands.
Main objective The main objective of this service is to improve traffic safety and reduce the
number of incidents (safety), to reduce the number of traffic jams and improve the
efficiency of road use (efficiency), and to ensure that traffic flows are smoother
resulting in less CO2-emission (environment).
Innovation
phase
7
Type of ITS C-ITS. V2I. Different C-ITS stations are used: road beacons, traffic centres, mobile
phones, navigation systems.
Technology
used
The following technologies are used:
• ETSI G5 WiFi beacons
• 3G/4G cellular network
• DENM Decentralized Environmental Notification Messages. ETSI/Cen
standards used
Geographical
scale
Regional level: on specific parts of national highways.
Type of
transport
This C-ITS service is tested for passenger cars and is relevant for both short- and
long distance trips. The service is useful for all type of interurban road users.
Type of
stakeholders
• Road manager (Rijkswaterstaat): management and development
• Research institutes/consultancy agencies
• ITS companies
Province: financing
Institutional
arrangements
It is a public private partnership. The funding has been received from several
sources: Province Noord-Brabant, European Commission.
Transferability This service is easily transferable to other road vehicles and to other types of
roads.

D2.1 Overview of ITS initiatives in the EU and US
C-ITS Corridor: Probe Vehicle Data
Description
Status Ongoing pilot (2015-2018)
Country Netherlands
Description of
service
The probe vehicle data service aims to collect anonymous data from vehicles
about road conditions and journey details at the stretch of road on the Dutch part of
the ‘C-ITS Corridor’. Examples of data being measured are speed, position on the
road, braking power and the current weather conditions. The goal of this
information is to allow road operators to create a more accurate image of the road.
This information than can be used for multiple purposes, a.o. providing real time
traffic warnings, performing adequate road maintenance and better analysing traffic
flows. This service has been tested on a small scale on two national highways with
a limited number of passenger cars (2) in the Netherlands.
Main objective The better information a road manager receives will be used to increase the
efficiency of the road. This reduces congestion and emissions. A better maintained
road is also beneficial for safety.
Type of ITS C-ITS V2I
Innovation
phase
TRL 7
Technology
used
• ETSI G5/ WiFi-P collect data from the passing cars
• On Board Units in cars collect and safe data about the road conditions.
These are then sent to the road side units who collect the data and
transmit it to the road operator.
Geographical
scale
Regional level: on specific parts of national highways
Type of
transport
This ITS service is tested for passenger cars and is relevant for both short- and
long distance trips.
Type of
stakeholders
• Road manager (Rijkswaterstaat): management and development
• Research institutes/consultancy agencies
• ITS companies
• Province: financing
Institutional
arrangements
It is a public private partnership. The funding has been received from several
sources: Province Noord-Brabant, European Commission.
Transferability This service is easily transferable to other road vehicles and to other types of
roads.
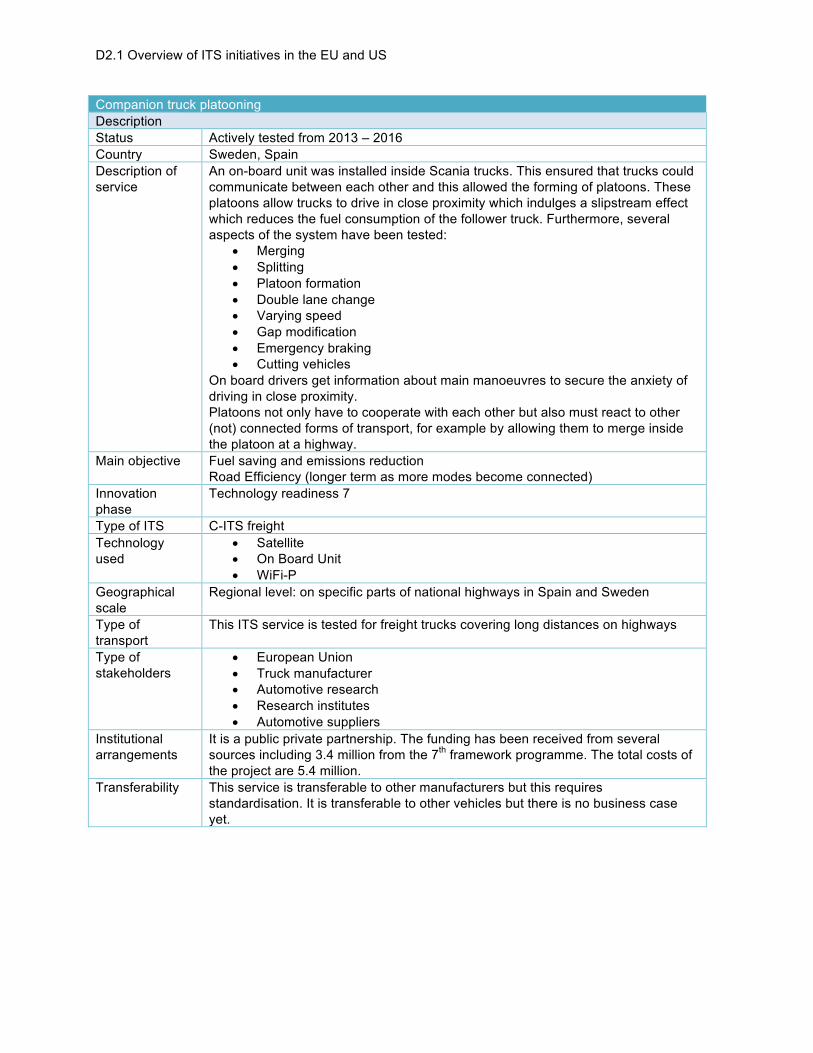
D2.1 Overview of ITS initiatives in the EU and US
Companion truck platooning
Description
Status Actively tested from 2013 – 2016
Country Sweden, Spain
Description of
service
An on-board unit was installed inside Scania trucks. This ensured that trucks could
communicate between each other and this allowed the forming of platoons. These
platoons allow trucks to drive in close proximity which indulges a slipstream effect
which reduces the fuel consumption of the follower truck. Furthermore, several
aspects of the system have been tested:
• Merging
• Splitting
• Platoon formation
• Double lane change
• Varying speed
• Gap modification
• Emergency braking
• Cutting vehicles
On board drivers get information about main manoeuvres to secure the anxiety of
driving in close proximity.
Platoons not only have to cooperate with each other but also must react to other
(not) connected forms of transport, for example by allowing them to merge inside
the platoon at a highway.
Main objective Fuel saving and emissions reduction
Road Efficiency (longer term as more modes become connected)
Innovation
phase
Technology readiness 7
Type of ITS C-ITS freight
Technology
used
• Satellite
• On Board Unit
• WiFi-P
Geographical
scale
Regional level: on specific parts of national highways in Spain and Sweden
Type of
transport
This ITS service is tested for freight trucks covering long distances on highways
Type of
stakeholders
• European Union
• Truck manufacturer
• Automotive research
• Research institutes
• Automotive suppliers
Institutional
arrangements
It is a public private partnership. The funding has been received from several
sources including 3.4 million from the 7th framework programme. The total costs of
the project are 5.4 million.
Transferability This service is transferable to other manufacturers but this requires
standardisation. It is transferable to other vehicles but there is no business case
yet.

D2.1 Overview of ITS initiatives in the EU and US
Connected cruise control
Description
Status Finished, active from 2009 until 2012
Country Netherlands
Description of
service
A built-in route indicator that efficiently guides drivers through busy traffic, reducing
congestion problems. Advised:
• Driving speed which takes congestion ahead into account
• Warnings for problems/incidents ahead
Main objective • 30% reduction of congestion
• 10% reduction in fuel consumption
Innovation
phase
Technology Readiness 6, tested on closed highway
Type of ITS C-ITS V2V routing
Technology
used
UMTS/HSDPA for collecting floating car data
Geographical
scale
Tested on regional highways
Type of
transport
Passenger cars
Type of
stakeholders
• Universities
• Research institutes
• Road operators
• Technological companies
Institutional
arrangements
Eu FP7 funded project. 4 Million € budget. Three types of partners
4 cities
3 fleet operators
5 technology suppliers
Transferability Transferable to other types of vehicles and roads. .

D2.1 Overview of ITS initiatives in the EU and US
DANTE - Development and Application of New Technologies for integrated improvement of road
safety and intersection design
Description
Status Finished (2009-2011)
Country Spain
Description of
service
DANTE aims to develop an innovative system to improve road safety at T-junctions
and crossroads on conventional two-lane motorways, where most fatal accidents
occur (e.g. the risks of front/side collisions, running into cars pulling out slowly in
front for the vehicle on the main road, and the vehicle on the secondary road
approaching the intersection too fast and failing to comply with the STOP sign).
Stereoscopic cameras detect the trajectory and speed of the vehicle on the main
road when it is 80–250 m. from the intersection.
A Lidar system detects any other vehicles within 80 m of the intersection, while a
Stop-control system detects the speed and trajectory of the vehicle on the
secondary road, determining whether it is going to stop.
These integrated systems detect what is happening at the intersection by means of
a centralized system that analyses data and, if a possible conflict is detected,
triggers an alarm to warn the drivers involved.
There are two ways of communicating with road users: with variable messages and
beacons of different types on the road itself, plus an I2V system on the vehicle,
presenting the information on a PDA device.
Main objective To improve road safety
Innovation
phase
6
Type of ITS C-ITS V2I
Technology
used
• Camera
• Lidar
• Beacon
• PDA
Geographical
scale
Motorways, urban
Type of
transport
Freight or passenger transport
Type of
stakeholders
• Research institutes
• Universities
• ITS/ICT solutions provider
• Geotechnical company
Institutional
arrangements
Public-private partnership. National R&D Plan and FEDER, Public-Private
Transport and Infrastructure Cooperation Projects Programme
Transferability This service is easily transferable to other road vehicles and to other types of
roads.

D2.1 Overview of ITS initiatives in the EU and US
EcoMove 6.3 Improve Lane Usage
Description
Status Finished, run from 2010-2013
Country European project
Description of
service
Vehicles broadcast information about their position, speed, heading, etc. while they
approach an (controlled) intersection, ramp metering installation or toll gate. Based
on the actual queues, the control scheme and the approaching vehicles, the best
distribution of vehicles over the available lanes is calculated.
Next, individual vehicles are allocated to specific lanes and vehicle drivers are
informed whether they should continue the same lane or not.
Main objective Make best use of available road capacity at intersections, onramps and toll gates
and so reduce congestion, unnecessary waiting time, number of stops, and so
smoother traffic flows.
Innovation
phase
7
Type of ITS C-ITS. Vehicles report their location to the infrastructure (V2I). Infrastructure could
inform advice back towards vehicles (I2V) if an on-board unit is equipped.
Otherwise matrix signs are a necessity.
Technology
used
• On-board units
• Roadside units
Geographical
scale
Roads with Toll boots, traffic lights, ramp metering installations or similar
infrastructure.
Type of
transport
All type of vehicles approaching a ramp, traffic light, toll gate or other infrastructure.
Type of
stakeholders
• Road users
• Service providers
• Traffic managers
• Vehicle users
• Toll collectors
• Road operators
Institutional
arrangements
EU fp7 program
Transferability Transferable to other cities and countries

D2.1 Overview of ITS initiatives in the EU and US
EcoMove 6.2 coordinate traffic controllers
Description
Status Finished, run from 2010-2013
Country European project
Description of
service
While approaching a sequence of traffic light, vehicles periodically broadcast
information about their position and speed. Together with detector and traffic light
data from traffic light controllers a roadside unit processes the information and
forwards it to a traffic control centre. The traffic control centre computes green
wave control parameters and distributes them to traffic light controllers to enable
coordination between controllers. Next, the road side unit computes speed advices
based on the current traffic light control and sends the advices to the drivers. When
following the speed advice, the vehicle drives smoothly through the green wave
section.
Main objective • Minimize fuel consumption and CO2-emission for a road section of
subsequent urban intersections by maintaining acceptable circumstances
for all road users.
• Use (microscopic) vehicle generated data to get a more detailed picture of
the traffic situation (e.g. the concrete shape of vehicle platoons and their
evolution in time).
• Enable new dynamic green wave control procedures that -besides waiting
times and number of stops - explicitly considering fuel minimising objective
functions.
• Use short range communication to inform and instruct approaching drivers
about green wave coordination speed in order to shape vehicle platoons
and to harmonise vehicle speeds with the current green wave strategy.
Innovation
phase
7
Type of ITS C-ITS. Vehicles report their location to the infrastructure (V2I). Infrastructure could
inform advice back towards vehicles (I2V) if an on-board unit is equipped.
Otherwise matrix signs are a necessity.
Technology
used
• On-board units
• Roadside units
Geographical
scale
Inner city roads with a sequence of traffic lights
Type of
transport
All type of vehicles
Type of
stakeholders
• Road users
• Service providers
• Traffic managers
• Vehicle users
Institutional
arrangements
EU fp7 program
Transferability Transferable to other cities and countries

D2.1 Overview of ITS initiatives in the EU and US
EcoMove 6.3.1 Improve intersection control
Description
Status Finished, run from 2010-2013
Country European project
Description of
service
Vehicles report to the intersection how they approach the intersection such that the
intersection can determine when they enter or exit conflict zones on the
intersection, when they pass the stop line, etc. Based on these the controller
determines an optimal distribution of green times and tighter, less conservative
green, yellow and red times. Information with respect to the estimated time at
which vehicles will be able to pass the stop line is sent to the vehicles.
Main objective Improve the efficiency of an intersection through use of information that can be
retrieved from both vehicles and intersections.
Innovation
phase
7
Type of ITS C-ITS. V2I
Technology
used
• On-board units
• Roadside units
Geographical
scale
Busy intersections
Type of
transport
All type of vehicles
Type of
stakeholders
• Road users
• Service providers
• Traffic managers
• Vehicle users
Institutional
arrangements
EU fp7 program
Transferability Transferable to other cities and Countries

D2.1 Overview of ITS initiatives in the EU and US
EcoMove 6.3 Balance intersection control objectives
Description
Status Finished, run from 2010-2013
Country European project
Description of
service
Vehicles report to the intersection controller about their approach of the
intersection such that the intersection can build a detailed representation of
demand. Starting from a basic intersection control plan (see use cases Improve
intersection control), the controller now integrates priority schemes for specific
vehicles and platoons and allows flexible sequences for traffic light control to find a
best balance between changing demands. As suggested by other use cases,
vehicles approaching the controlled intersection will be informed with speed and
time related information.
Main objective Provide a more CO2 efficient traffic intersection controller that is considered
acceptable given the prevailing traffic conditions.
Innovation
phase
7
Type of ITS C-ITS. Vehicles report their location to the infrastructure (V2I). Infrastructure could
inform advice back towards vehicles (I2V) if an on-board unit is equipped.
Otherwise matrix signs are a necessity.
Technology
used
• On-board units
• Roadside units
Geographical
scale
Busy intersections
Type of
transport
All type of vehicles
Type of
stakeholders
• Road users
• Service providers
• Traffic managers
• Vehicle users
Institutional
arrangements
EU fp7 program
Transferability Transferable to other cities and Countries

D2.1 Overview of ITS initiatives in the EU and US
EcoMove 6.3 Improve Ramp control
Description
Status Finished, run from 2010-2013
Country European project
Description of
service
Vehicle report to the ramp controller about their approach of the ramp metering
installation such that the ramp controller can build a detailed representation of the
traffic demand on the on-ramp. The conditions on the mainstream (i.e. motorway)
and upstream urban controlled intersections are monitored through infrastructure
sensors and other roadside units. Near saturation on the mainstream and based on
the mainstream, onramp and upstream conditions, the ramp controller determines
a strategy that best fits the design of the on-ramp and balances the current
demands and overall objectives. This may affect the control scheme, the queuing
process as well as the driving behaviour of approaching vehicles. The latter is
strongly related to information provisioning to drivers as discussed in other use
cases.
Main objective Widen the scope and extend the horizon of ramp control to better anticipate to
changes in the traffic situation and traffic demand, and so reduce fuel waste.
Innovation
phase
7
Type of ITS C-ITS. Vehicles report their location to the infrastructure (V2I). Infrastructure could
inform advice back towards vehicles (I2V) if an on-board unit is equipped.
Otherwise matrix signs are a necessity.
Technology
used
• On-board units
• Roadside units
Geographical
scale
Ramp control
Type of
transport
Mixed traffic
Type of
stakeholders
• Road users
• Service providers
• Traffic managers
• Vehicle users
Institutional
arrangements
EU fp7 program
Transferability Transferable to other cities and Countries

D2.1 Overview of ITS initiatives in the EU and US
eCoMove Support merging
Description
Status Finished, run from 2010-2013
Country European project
Description of
service
By using roadside sensors and collecting ecoFVD (floating vehicle data) an
infrastructure system monitors traffic flows at merging points on their traffic
volumes, density, relative speeds of vehicles and following distances. Using
vehicle trajectory data the number of lane changes at merging sections is
estimated. First the overall traffic flow performance in terms of flow, speed and
density is optimised which results in general speed and headway advices while
approaching the merging point. In this process, the importance of the different
traffic flows is carefully weighted. Next, near the merging point advices will be
adapted to the number of mergers at that time, while the mergers themselves
receive individualised recommendations for their speed and merging instant. Right
after the merging point drivers will receive an advice that stimulates them to
accelerate in order to best use the available road capacity
Main objective Increase driver anticipation at merging points and smoothen traffic behaviour to
improve traffic performance and reduce fuel waste.
Innovation
phase
7
Type of ITS C-ITS V2V
Technology
used
• On-board units
• Roadside units
Geographical
scale
Roads with merging points
Type of
transport
Both freight and passenger. Unscheduled.
Type of
stakeholders
• Road users
• Service providers
• Traffic managers
• Vehicle users
Institutional
arrangements
EU fp7 program
Transferability Transferable to other cities and Countries

D2.1 Overview of ITS initiatives in the EU and US
EcoMove 6.3.5 Improve approach velocity
Description
Status Finished, run from 2010-2013
Country European project
Description of
service
Vehicles broadcast information about their position, speed, heading, etc. while they
approach an (controlled) intersection, ramp metering installation or toll gate. Based
on the actual queues, the control scheme and the approaching vehicles, the best
distribution of vehicles over the available lanes is calculated. Next, individual
vehicles are allocated to specific lanes and vehicle drivers are informed whether
they should continue on the same lane or not. In the figure below this use case is
illustrated for a vehicle that approaches an intersection. The green vehicle is
directed to the best lane for it to follow, given its destination, the queue length and
the expected speed of outflow for each lane
Main objective Make best use of available road capacity at intersections, on ramps and toll gates
and so reduce congestion, unnecessary waiting time, number of stops, and so
smoother traffic flows.
Innovation
phase
7
Type of ITS C-ITS. Vehicles report their location to the infrastructure (V2I). Infrastructure could
inform advice back towards vehicles (I2V) if an on-board unit is equipped.
Otherwise matrix signs are a necessity.
Technology
used
• On-board units
• Roadside units
Geographical
scale
Busy intersections
Type of
transport
All type of vehicles approaching a ramp, traffic light, toll gate or other infrastructure.
Type of
stakeholders
• Road users
• Service providers
• Traffic managers
• Vehicle users
• Toll gates
Institutional
arrangements
EU fp7 program
Transferability Transferable to other cities and Countries

D2.1 Overview of ITS initiatives in the EU and US
eSEÑAL - Smart System for Traffic Signposting and Information
Description
Status Finished (2007-2010)
Country Spain
Description of
service
eSEÑAL is a subproject of CABINTEC that aims to prevent accidents through the
development of an intelligent signalling system.
The OBU collects both static and dynamic data from the infrastructure
Intelligently processes the data.
Gives drivers information in advance about traffic signals, traffic congestion, road
conditions as well as possible accidents, road work or delays via the OBU installed
in the vehicle.
The service has been tested in a lorry cab using a simulator.
Main objective To improve road safety by enhancing driver-vehicle-environment system
perception.
Innovation
phase
7
Type of ITS C-ITS, I2V
Technology
used
• Radio beacon
• OBU
• WSN (Wireless Sensor Network)
• RFID
Geographical
scale
Urban, motorways
Type of
transport
Freight transport
Type of
stakeholders
• Universities
• Research institutes
• ITS and ICT solution providers
• Automotive testing company
Institutional
arrangements
Public-private partnership. The project is funded by the Spanish Ministry of Science
and Innovation.
Transferability This application is easily transferable to other road vehicles and to other types of
roads.

D2.1 Overview of ITS initiatives in the EU and US
FlowPatrol : cooperative traffic information mobile app
Description
Status Testing in real environment. Active since 2013
Country Netherlands
Description of
service
FlowPatrol is a mobile application installed on smartphones that advices users
about speed and traffic warnings. Data is collected from (existing) road
infrastructure (loops), and through the application itself speed and location of the
vehicle are detected. This collecting is done either through 3g/4g or through
FlowRadar: an on board installed ITS station that sends and receives data through
WiFi-P. Flowradar is installed with a sucker inside the car, and uses one 12v hole.
It then connects with mobile phones via Bluetooth to send messages. Data
collection is thus possible via two methods:
3g/4g via mobile phone
Via the on-board unit and WiFi-p
The service offered to app users is the same. The on-board unit might have better
location services, and thus more accurate travel advice.
Main objective The main goal is to provide traffic information that is beneficial for efficiency and
safety. Additionally, this could reduce congestion and thus emissions.
Innovation
phase
8
Type of ITS C-ITS traffic management V2I
Technology
used
• 3g/4g cellular network
• ETSI G5 WiFi beacons
• Bluetooth is used inside the car
Geographical
scale
Regional level: on specific parts of national highways.
Type of
transport
This ITS service is tested for passenger cars and is relevant for both short- and
long distance trips.
Type of
stakeholders
• Road manager (Rijkswaterstaat): management and development
• Research institutes/consultancy agencies
• ITS companies
• Province: financing
• Service users
Institutional
arrangements
It is a public private partnership. The funding has been received from several
sources: Province Noord-Brabant, European Commission.
Transferability This service is easily transferable to other road vehicles and to other types of
roads.

D2.1 Overview of ITS initiatives in the EU and US
FOTsis 5 - Special Vehicle Tracking
Description
Status Finished (2011-2015)
Country 1 highway in Portugal, 1 highway in Spain
Description of
service
Monitoring and detecting vehicle considered special: Dangerous goods, heavy
vehicle for example. How effective the combination of in-vehicle information and
information provided by the infrastructure (pre-trip, traffic and weather conditions)
can be at minimizing the impact of special vehicles. Instead of continuously
locating these vehicles, the goal is to combine this with historical and real time
data. The service thus:
• Detects the entering/leaving of special vehicles on highway
• Monitors special vehicles on highway
• Warning informing other vehicles/infrastructure
Process: Transport operator asks for permission to use a road providing details
about its vehicle and route. This is taken into account and access to a certain route
is granted. Than other actions are taken to ensure a successful trip. Special
vehicles are equipped with an on-board unit to inform traffic centres about its
position. Road side beacons are used to receive and send information towards the
special vehicle.
Main objective Increase Efficiency and improving safety. Additionally, comfort and sustainability
increase.
Innovation
phase
7
Type of ITS V2I C-ITS
Technology
used
The following technologies are used:
• WiFi-P
• On Board unit
• Human Interface Machine (smartphone/navigation/etc.)
• Sensors on the vehicle
• Highway detection infrastructure: loops, cameras, etc.
Geographical
scale
Regional level: on specific parts of national highways.
Type of
transport
This ITS application is tested for special vehicles. It is possible to apply to other
roads but not to other types of transport.
Type of
stakeholders
• Road managers: management and development
• Research institutes
• ITS companies
• Drivers of special vehicles
• Other road users
• Policy makers
• traffic associations
• infrastructure companies
Institutional
arrangements
Partly EU funded under FP7. Consortium with 25 Partners from 9 European
Countries. Partners include Road operators, universities, telecom operators, maps
providers, technology integrators, research centres, users’ association, and
industry associations.
Transferability Useable for other types of roads. Not logical for other types of transport

D2.1 Overview of ITS initiatives in the EU and US
Freilot. Truck priority at intersections
Description
Status Successfully finished: active from 2009 until 2012
Country EU FP 7 project tested in: France, Netherlands, Poland, Spain
Description of
service
Freilot aims to reduce congestion and emissions in cities. Four measures have
been designed and implemented. Traffic light priority is highlighted here:
Energy efficiency optimised intersections (trucks and emergency vehicles get
priority from traffic controllers at intersections to increase fuel efficiency)
In total 177 vehicles have been equipped divided over 4 cities.
Main objective • Reduction of 25% fuel consumption/emissions after using Freilot services
• Ensure Freilot services after project life
• Expand Freilot services
• Safety reasons for emergency vehicles
Innovation
phase
TRL 7
Type of ITS C-ITS V2I Freight
Technology
used
Briefly discuss the technologies and message standards used. E.g.:
GPS for evaluation
Android based on board unit
GPRS
Geographical
scale
In city at intersections/urban roads. As well on interurban roads.
Type of
transport
Aimed towards freight transport as possible gains are the largest. During the test
emergency services (fire trucks, ambulance) have joined as well.
Type of
stakeholders
• Emergency services
• Fleet operators
• Cities
• Service users/drivers
• Other road users
Institutional
arrangements
EU FP7 funded project. 4 Million € budget. Three types of partners
4 cities
3 fleet operators
5 technology suppliers
Transferability Transferable to other fleet owners, vehicles and other roads. Certain limitations to
the maximum number of participants as you can not prioritize everyone.

D2.1 Overview of ITS initiatives in the EU and US
INTELVIA
Description
Status Finished (2009-2012)
Country Spain
Description of
service
INTELVIA is a system of control, signalling and communication to intelligently
manage road traffic through C-ITS systems and computer vision.
The computer vision solution increases intelligence in traffic management and in
decision making from the control centre, allowing the automatic analysis of
information and a faster detection of incidents and the management of the road
network.
Signalling information is stored in electronic road side units (RSU) distributed along
the road network. Vehicles interact with these nodes deployed along the roadside.
The electronic devices will transmit the signpost information to the nearby vehicles
via wireless, to be displayed on the OBU.
Different types of information could be transmitted: information about traffic
parameters (speed limit and other road signs), route tracking, incidents, tolls, and
weather alerts or warnings of approaching emergency vehicles.
Main objective To improve road safety and mobility by reducing the number of accidents caused
by low or no visibility of the signposts due to heavy rain, fog among others, and the
reduction of driver distraction by presenting the information directly to the driver in
the vehicle.
Innovation
phase
7
Type of ITS V2I C-ITS traffic
Technology
used
• Wireless sensors/actuators
• Control centre
• Surveillance cameras
• Electronic roadside communication nodes
• GPRS/Wi-MAX
• ITS G5
• BUS CAN
• OBU
Geographical
scale
Motorways
Type of
transport
Road – Freight, and passenger cars
Type of
stakeholders
• ITS solutions providers
• Road/Traffic authorities
• Research institutes
• Universities
• Wireless solutions provider
• Infrastructure and service operator
• Logistics and mobility association
• Automotive companies/testers
• ICT solutions provider
Institutional
arrangements
Public-private partnership. The project is co-funded by the Ministry of Industry,
Tourism and Commerce and the European Regional Development Fund ERDF.
Transferability This application is easily transferable to other types of roads.

D2.1 Overview of ITS initiatives in the EU and US
Roadart (Research On Alternative Diversity Aspects foR Trucks)
Description
Status Ongoing (2015 - 2018)
Country 4 partners from 3 countries: Germany, The Netherlands, Greece
Description of
the project
The ROADART project aims to demonstrate especially the road safety
applications for T2T and T2I systems under critical conditions in a real
environment, like tunnels and platooning of several trucks driving close behind
each other.
Main objective The main objective of ROADART is to investigate and optimise the integration of
ITS communication units into trucks. The ROADART project aims to
demonstrate especially the road safety applications for T2T and T2I systems
under critical conditions in a real environment, like tunnels and platooning of
several trucks driving close behind each other. Besides that, traffic flow
optimization and therefore reducing Greenhouse Gas emissions are positive
outcomes of the use cases demonstrated in this project.
Innovation
phase
Not applicable yet
Type of ITS C-ITS freight. V2V and V2I systems specified from the C2C Communication
Consortium are focussing on road safety applications.
Technology
used
Perform measurements for Truck-to-Truck, Truck-to-Infrastructure mobile radio
channel conditions.
Geographical
scale
Urban and extra-urban scale
Type of
transport
Freight transport
Type of
stakeholders
• SMEs
• Research institutes
• Vehicle manufacturers
Institutional
arrangements
The project has received public funding from the European Union‘s Horizon
2020 FP7-ICT - Information and Communication Technologies
Transferability This service is transferable

D2.1 Overview of ITS initiatives in the EU and US
SAFECROSS - Smart Pedestrian Crossing for People with Reduced Mobility
Description
Status Ongoing (XXXX-2016)
Country Spain (Madrid, Alcalá de Henares)
Description of
service
SAFECROSS aims to develop an intelligent crossing designed for people with
reduced mobility, as it provides real-time monitoring of pedestrians' movement.
If the traffic controller detects anyone still using the crossing when it is reaching the
end of the pedestrians’ green phase, the 'green' time is extended until the
pedestrian has crossed to the other side. If the crossing is empty when the time is
running out, vehicle traffic can proceed, thereby contributing towards streamlining
traffic flow.
Also, it incorporates the activation of green light demand from the pedestrians'
smartphones (Bluetooth) via two Android Apps allowing pedestrians and drivers
interact through the deployment of cooperative services I2VRU and I2V.
A C-ITS station provides the communication channel WiFi Mobile (802.11p) to
vehicles, alerting vehicle drivers of the presence of pedestrians on the crosswalk.
Main objective To improve road safety of crossing pedestrians that require more than average
time to cross the road thereby reducing the number of accidents of vulnerable
users
Innovation
phase
7
Type of ITS C-ITS V2I
Technology
used
• Artificial vision camera
• Bluetooth beacons
• Smart phone
• 3G communication
• Mobile WiFi
• OBU
• Radio beacons
• ITS-G5
Geographical
scale
Urban
Type of
transport
Road
Type of
stakeholders
• ITS solutions provider
• City administration
• Local city council
• Spanish Ministry of Industry, Energy and Tourism (Funding)
Institutional
arrangements
Private, then Public-private partnership.
Initially started with the private funding of an ITS solutions provider but was later
financed by the Spanish Ministry of Industry, Energy and Tourism.
Transferability The infrastructure is easily transferable to other road vehicles and to other types of
roads.

D2.1 Overview of ITS initiatives in the EU and US
Satre (safe road trains) project
Description
Status Finished (9/2009 – 11/2012)
Country Intra-European. Consortium with partners from UK, Germany, Sweden and Spain
Description of
service
Road train with truck as leading vehicle, followed by 1 truck and 3 different types of
cars.
Goal: develop strategies and technologies to allow vehicle platoons.
The lead vehicle is driven by a professional driver; several vehicles follow are
driven fully automatically by the system with little distance between the vehicles in
the road train. An off-board system allowed Sartre drivers to locate a suitable
platoon and navigate towards it. The project has analysed the following aspects:
safety, fuel consumption, demonstration on different roads, commercial viability
and policy advice.
Main objective • Environmental -> 2.8 ton C02eq reduction for trucks per year possible
• Safety
• Comfort as drivers can (in the future) perform other tasks while driving
• Reduced congestion
Innovation
phase
Tested on test sites and on operational highway. TRL level 7
Type of ITS C-ITS freight V2V. ITS stations are installed in vehicles which allows them to
communicate between each other.
Technology
used
The following technologies are used:
• GPS
• GSM/UMTS.
• On board units
Geographical
scale
Regional level: on specific parts of national highways and local test facilities.
Type of
transport
Briefly discuss the type of transport for which the application is used. This includes:
• Freight to reduce fuel cost
• Passenger cars could reduce fuel costs
• Transport type/motive: long distance, commuter travel, leisure travel etc.
Type of
stakeholders
• Service providers
• Research institutes
• OEMS
• Automotive suppliers
• Road operators
Institutional
arrangements
EU FP7 funded project with a consortium of Public and private parties. Total EU
funding: 3.8 million Euros.
Transferability Most suitable for long distance highway transport. Scalable to other highways and
countries.

This project has received funding from the European Union's Horizon 2020 research and innovation programme under the European Union's Horizon 2020 research and innovation programme under grant agreement No 723974
UK Autodrive
Description
Status 2013 -2018
Country United Kingdom
Description of
service
Automated driving project with special focus on cooperative driving. Platooning test
Main objective • Integrate autonomous and connected vehicles into real-world urban
environments;
• Show how autonomous and connected vehicles could solve everyday
challenges such as congestion;
• Demonstrate the commercial operation of electric-powered self-driving “pods”
at a city scale;
• Provide insight for key stakeholders and decision-makers, including legislators,
insurers and investors;
• Examine the potential benefits (in terms of safety, traffic flow and the
environment) of having cars that can “talk to each other
Innovation
phase
7
Type of ITS C-ITS V2V
Technology
used
• V2V communication
• LIDAR
• sensors
Geographical
scale
The roads and footpaths will be a mix of grid-based streets (in Milton Keynes) and
more traditional urban road layouts (in both Milton Keynes and Coventry).
Type of
transport
• Cars
Type of
stakeholders
• Industry
• Service providers
• Universities
• OEMs
• Insurance company
Institutional
arrangements
PPP
Transferability Could be transferred

D2.1 Overview of ITS initiatives in the EU and US
Appendix 6 Mapping of services Mapping of 94 services (short list) to Market by Type segmentation and to associated
subcategory.
Project Service
Acronym
Market
by Type Subcategory
Access control in Rome ACPV ATMS Demand and access management / enforcement system
ADS-B PCT CVS V2I/V2V
ASPI HNMA ATMS Highway systems
Austroads heavy vehicle platooning TP CVS V2V
Automatic passenger counting systems CPA ATMS Fleet management optimization
Belfast rapid transit NADPTB APTS Real time system status
C-ACC CACCT CVS V2V
CBTC CBTC APTS Real time system status information
CITI CWS CVS V2V
C-ITS corridor Netherlands VSD CVS V2I
C-ITS corridor Netherlands VWRW CVS V2I
Co-Cities ERTTI APTS Real time passenger information
Companion TP CVS V2V
Congestion charge london CSFTH ATPS Congestion pricing
Connected Boulevard Nice MOCA ATMS Parking management
Connected cruise control CCC CVS V2V
Dante ICW CVS V2I
Departure planning information RTDTA ATMS Traffic monitoring
eBrio+ (VIX) ISBTSP APTS Multi & Smart ticketing
EcoGem CRP ATIS IRANS
Ecomove EDA ATMS Traffic monitoring
Ecomove ERP CVS V2I
Ecomove ICVAP CVS V2I
Ecomove IIC CVS V2I
Ecomove INU CVS V2I
Ecomove IPG CVS V2I
Ecomove LA CVS V2V
Ecomove MS CVS V2I
Ecomove RC ATIS In-vehicle signing information systems
Ecomove RTRP ATIS In-vehicle routing and navigation systems
Ecomove SALA ATMS Parking management
Ecomove TLC ATIS IRANS
Enhanced wisetrip MMIJPS APTS Multimodal journey planners
ERMTS ETCT APTS Real time system status information

D2.1 Overview of ITS initiatives in the EU and US
Project Service
Acronym
Market
by Type Subcategory
eSENAL ISS CVS V2I
FAMS DRTSIRT APTS Real time system status information and schedule optimization
FAMS VAMS APTS All
Flitsmeister RTTA ATIS In-vehicle motorist service information systems
Flowpatrol CTIMA CVS V2I
Fotsis ARASA ATMS Enforcement systems
Fotsis DRP ATMS Demand and acces management
Fotsis EE ATMS Highway systems
Fotsis ETR ATMS Traffic monitoring
Fotsis ICC ATIS In-vehicle safety and warning systems
Fotsis SIM ATIS In-vehicle safety and warning systems
Fotsis TIP CVS V2I
Fotsis TOSV CVS V2I
Freilot TPAI CVS V2I
GUIADE PTIG ATMS Real time system status information/V2V
HeEro EP ATIS In vehicle safety and warning sytems
HOGIA STCBOT ATMS Traffic monitoring
I-5 smart truck parking STPP ATIS CVO
IFM IFMP APTS Multi & Smart ticketing
Intelvia IETSS CVS V2I/V2V
In-Time MRTTI ATIS IRANS/IMSIS
Lane management USA LM ATMS Demand and acces management
Madrid smart parking VPR ATMS Parking management
Maut TSFF ATPS VMTS
Milano Area C LEZCS ATPS Congestion pricing
Mobility 2.0 VO ATIS IMSIS
Multi use lane Barcelona VMS ATMS Demand and access
NY MiM NATSCS ATMS Signal control
Octo U MT ATIS CVO
On vehicle CCTV OBCS APTS Mobile video surveillance
Onschedule and Ontime POCAVA APTS Schedule optimization
Oyster Card LS APTS Multi & Smart ticketing
Parckr CTPA ATIS IMSIS
Piedmont regional traffic centre TSC ATMS Traffic monitoring
Praktijkproef Amsterdam Adam RTTA ATIS IRANS
Praktijkproef Amsterdam Eva RTPA ATMS Parking management

D2.1 Overview of ITS initiatives in the EU and US
Project Service
Acronym
Market
by Type Subcategory
Praktijkproef Amsterdam Superroute RTTA ATIS IRANS Praktijkproef Amsterdam Superroute P RTPA ATMS Parking management
ProbeIT foresight vehicle PTAALBA ATIS IRANS/IMSIS/ISIS/ISAWS
Q-Warn QW ATIS IMSIS
Roadart TPISS CVS V2V
RTPI RTPII APTS passenger information systesm
Safecross SPC CVS V2I
Sanef ATUL ATPS ETC
Satre Road train SRT CVS V2V
Scot Rail smartcard SS APTS Multi & Smart ticketing
Sensit Nedap APA ATMS Parking management
Smartfreight UFMOBS ATIS CVO
SmarTrAC IATCTD ATIS IRANS
Stockholm congestion pricing CPAMIS ATPS Demand and access management/ congestion pricing
Telepass ATR ATPS Electronic toll collection
TEXpress TEL ATPS Fee-based express lanes
TIMON ERTTA APTS Real time system status information
Traffic information system Romania NRGS ATMS Highway systems
Uk Autodrive AACCT CVS V2V
UTC london UTLC ATMS Demand and acces management
VSC -A DPP ATIS IVSAWS
Vx-TINFO WRTIS ATIS IMSIS
Waze RTTATA ATIS IMSIS
Zoof CTIMA ATIS IMSIS

D2.1 Overview of ITS initiatives in the EU and US
Appendix 7 Tree maps Appendix 7.1: Tree map of services by market segment by primary benefits.

D2.1 Overview of ITS initiatives in the EU and US
Appendix 7.2: Tree map of services by market segment by key enabling technology