d2.1 tuning model and ptf design
TRANSCRIPT

AutoTune Deliverable D2.1 8.04.2012
1
European Community Seventh Framework Programme
Theme FP7-ICT-2011-7
Computing Systems
Automatic Online Tuning (AutoTune)
D2.1
Tuning Model and PTF Design Michael Gerndt, Houssam Haitof
Date of preparation (latest version): April 12th, 2012
Copyright © 2012 The AutoTune Consortium
The opinions of the authors expressed in this document do not
necessarily reflect the official opinion of the European Commission.

AutoTune Deliverable D2.1 8.04.2012
2

AutoTune Deliverable D2.1 8.04.2012
3
PROJECT INFORMATION
Project acronym AutoTune
Project full title Automatic Online Tuning
Grant agreement no 288038
Call (part) identifier FP7-ICT-2011-7
Funding scheme Collaborative project
DOCUMENT INFORMATION
Deliverable Number D2.1
Deliverable Name Tuning Model and PTF Design
Authors Michael Gerndt (TUM), Houssam Haitof (TUM)
Responsible Author Michael Gerndt (TUM)
e-mail: [email protected]
phone: +49 89 289 17652
Keywords Periscope Tuning Framework, Tuning Plugins
WP/Task WP2 / Task 2.1, 2.2
DISSEMINATION LEVEL
PU Public X
PP Restricted to other programme participants (including the Commission Services)
RE Restricted to a group specified by the consortium (including the Commission Services)
CO Confidential, only for members of the consortium (including the Commission Services)
COPYRIGHT NOTICES
© 2012 AutoTune Consortium Partners. All rights reserved. This document is a project document of
the AutoTune project. All contents are reserved by default and may not be disclosed to third parties
without the written consent of the AutoTune partners, except as mandated by the European
Commission contract 288038 for reviewing and dissemination purposes. All trademarks and other
rights on third party products mentioned in this document are acknowledged as own by the respective
holders.

AutoTune Deliverable D2.1 8.04.2012
4

AutoTune Deliverable D2.1 8.04.2012
5
ABSTRACT
This document specifies the overall approach taken in the Periscope Tuning Framework (PTF) for
tuning applications. PTF is an extension of Periscope, an automatic performance analysis tool
currently under development at TUM, via multiple tuning plugins. First, we present a model of the
execution of tuning plugins. It specifies the steps taken in the plugin and the integration into the whole
workflow in Periscope. Then, we present the design of PTF with the individual components and their
interfaces. At the end of the document we present a list of steps required for the implementation of
PTF tuning plugins. The document closes with a glossary of important terms that will be used in the
future execution of the AutoTune project.

AutoTune Deliverable D2.1 8.04.2012
6
AutoTune Deliverable D2.1 8.04.2012
7
TABLE OF CONTENTS
1 Introduction .................................................................................................................... 9
1.1 Periscope ................................................................................................................ 9
1.2 Periscope Tuning Framework .................................................................................11
2 Terminology ..................................................................................................................13
3 Tuning Model ................................................................................................................14
3.1 Overall Tuning Process ..........................................................................................14
3.2 Tuning Strategy ......................................................................................................15
3.3 Plugin Strategy .......................................................................................................16
3.4 Scenario Execution ................................................................................................18
3.5 Phase Execution ....................................................................................................20
4 PTF Design ...................................................................................................................22
4.1 PTF Packages ........................................................................................................22
4.2 Global Architecture .................................................................................................24
4.3 Frontend Components ............................................................................................25
4.4 Application .............................................................................................................26
5 Plugin Development ......................................................................................................26
6 Glossary ........................................................................................................................28

AutoTune Deliverable D2.1 8.04.2012
8

AutoTune Deliverable D2.1 8.04.2012
9
1 Introduction
The goal of AutoTune is to combine performance analysis and tuning into a single tool and thus to
simplify development of efficient parallel programs on a wide range of architectures. The focus of this
project is on automatic tuning for multicore based parallel systems ranging from parallel desktop
systems with and without GPGPU accelerators to petascale and future exascale HPC architectures.
Especially in the context of large scale HPC architectures the aspect of performance tuning will and
has to be extended towards co-optimization of performance and energy efficiency.
AutoTune is unique since it first combines analysis and tuning of multiple aspects into an online
automatic tuning framework, called the Periscope Tuning Framework (PTF). PTF will be an
extension of the automatic online performance analysis tool Periscope. It will not only do the analysis
online but also the tuning. PTF will identify tuning alternatives based on codified expert knowledge
and evaluate the alternatives within the same run of the application (online), dramatically reducing the
overall search time for a tuned code version. The application will be executed under the control of the
framework either in interactive or batch mode. During the application’s execution, the analysis will be
done, the found performance and energy properties will be forwarded to tuning plugins that will then
determine code alternatives and evaluate different tuned versions. At the end of the application run,
detailed recommendations will be given to the code developer on how to improve the code with
respect to performance and energy consumption.
The following two subsections are taken from the technical annex of the project and introduce
Periscope (Section 1.1) and the planned tuning framework (Section 1.2).
1.1 Periscope
Periscope is an automatic performance analysis tool for highly parallel applications written in MPI
and/or OpenMP currently under development at Technische Universität München. It is a
representative for a class of automatic performance analysis tools automating the whole analysis
procedure. Unique to Periscope is that it is an online tool and it works in a distributed fashion. This
means that the analysis is done while the application is executing (online) and by a set of analysis
agents, each searching for performance problems in a subset of the application’s processes
(distributed). The properties found by Periscope point to code regions that might benefit from further
tuning.
Automation in Periscope is based on formalized performance properties, e.g., inefficient cache usage
or load imbalance. Based on a repository of performance properties the analysis agents can search for
those properties in the program execution under investigation. They automatically determine which
properties to search for, which measurements are required, which properties were found and which are
more specific properties to look for in the next step.
The overall search for performance problems is determined by search strategies. A search strategy
defines in which order an analysis agent investigates the multidimensional search space of properties,
program regions, and processes. Many of Periscope’s search strategies are multistep strategies, i.e.,
they consist of multiple search steps. A very important concept for multistep strategies is a program
phase which is determined by a certain repetitive program region. A good example for such a phase
region is the body of the time loop in scientific simulations where each iteration simulates one time
step. Thus, within each iteration a new step of the search strategy can be executed.

AutoTune Deliverable D2.1 8.04.2012
10
In a first search step, the strategy determines a set of candidate properties, e.g., load imbalance at a
barrier in a certain process. The agent then requests certain measurements from the monitor linked into
the application. Afterwards the application is released for one execution of the phase. At the end of the
phase the execution is stopped again and the measured performance data are returned to the agent.
Based on the measurements, the agent evaluates the candidate properties and determines the set of
found properties. If a refinement is possible, i.e., for the found properties more precise properties are
available, a next analysis step is started with a new candidate property set.
Periscope provides search strategies for single node performance, e.g., searching for inefficient use of
the memory hierarchy, MPI and OpenMP. It consists of an agent hierarchy as shown in Figure 1. The
leaves in the hierarchy are the analysis agents that perform the actual performance analysis. Each
analysis agent is responsible for a subset of the application’s processes. It communicates with the
monitor linked with the application processes. The MRI monitor serves two purposes: Firstly, to
perform the measurements of performance data requested by the analysis agent. Secondly, to control
the execution of the process which means, it takes commands from the agent to release or stop the
execution.
Figure 1: Architecture of Periscope
The root of the hierarchy is the master agent which takes commands from the frontend, propagates the
commands to the analysis agents, and provides the list of found performance properties to the
frontend. The agents in the middle of the hierarchy are responsible for forwarding information among
the analysis agents and the master agent.

AutoTune Deliverable D2.1 8.04.2012
11
The search is controlled by the frontend. It invokes the application and creates the agent hierarchy.
How many agents are created depends on the number of application processes and of additional
processors provided in the batch job. The processes and agents are mapped to the available processors
in a way that communication is local with respect to the physical interconnection network topology.
After the application and the agent hierarchy have been started, the frontend starts the search by
propagating a command to all the analysis agents. If an agent requests a new experiment, i.e., an
execution of the program phase with measurements to evaluate performance properties, the master
agent starts a next experiment via another command. The reason for the global synchronization is that
Periscope also supports automatic restart. If another experiment is requested but the application
terminated, the application can automatically be restarted by the frontend.
On top of the frontend, Periscope provides a graphical user interface based on Eclipse and the Parallel
Tools Platform (PTP). The GUI allows the programmer to define a project with all the source files,
start a performance analysis via the frontend and, most important, to investigate the performance
properties found by Periscope.
1.2 Periscope Tuning Framework
AutoTune will develop the Periscope Tuning Framework (PTF) as an extension of Periscope. It will
follow the main Periscope principles, i.e., use of formalized expert knowledge in form of properties
and strategies, automatic execution, online search based on program phases, and distributed
processing.
Periscope will be extended by a number of tuning plugins that fall into two categories: online and
semi-online plugins. An online tuning plugin will perform transformations to the application and/or
the execution environment without requiring a restart of the application. A semi-online tuning plugin
will be based on a restart of the application but without restarting the agent hierarchy.
Figure 2 illustrates the control flow in PTF. The tuning process is started with a preprocessing of the
application source files. This preprocessing performs instrumentation and static analysis. Periscope is
based on source level instrumentation for C/C++ and FORTRAN. The instrumenter also generates a
SIR file (Standard Intermediate Representation) that includes static information such as the
instrumented code regions and the nesting. The instrumentation and the static analysis will be
extended in the project to support HMPP, OpenCL, and parallel patterns.
The tuning is then started via the Periscope frontend either interactively or in a batch job. As done in
Periscope, the application will be started by the frontend before the agent hierarchy is created.
As presented in the previous section, Periscope uses an analysis strategy, e.g., for MPI, OpenMP and
single core analysis, to guide the search for performance properties. This overall control strategy will
now become part of a higher level tuning strategy. The tuning strategy will control the sequence of
analysis and tuning steps. Typically, the analysis will first determine application properties that will
guide the selection of a tuning plugin as well as the tuning actions performed by the plugin. After the
plugin finishes, the tuning strategy might restart the same or another analysis strategy to continue on
further tuning. We will start with developing single plugin tuning strategies, i.e., for each tuning
plugin a separate strategy. Similar to the analysis strategies in Periscope combined plugin tuning
strategies will be developed later to combine multiple tuning plugins to perform multi-aspect
application tuning.
Each of the tuning plugins will be controlled by a specific plugin strategy. This strategy will guide
the search for a tuned version. The search space will be restricted based on the properties resulting

AutoTune Deliverable D2.1 8.04.2012
12
from the previous analysis as well as by other plugin specific means, such as expert knowledge or
machine learning. Typically the tuning action selection ends with a number of possibilities that have to
be evaluated experimentally. Online tuning plugins will be able to execute the experiments without an
application restart, e.g. the energy efficiency tuning plugin, while semi-online plugin will require a
restart, e.g. to evaluate different compiler flags. The plugin strategy itself can of course also be
iterative. For the analysis of the experiments, Periscope’s performance analysis support will be
leveraged. The execution of experiments with and without application restart is already supported in
Periscope. In this project tuning plugins will be developed for HMPP tuning, single node performance
tuning, MPI tuning, and energy efficiency tuning.
Figure 2: Tuning Control Flow

AutoTune Deliverable D2.1 8.04.2012
13
Once the tuning process is finished, a tuning report will be generated that documents the remaining
properties as well as the tuning actions recommended by PTF. The tuning actions can then be
integrated into the application such that subsequent production runs will be more efficient.
2 Terminology
The tuning plugins will try to improve the application execution by influencing certain tuning points.
Tuning points TP = {v1, v2, …} are the features for influencing the execution of a region. Each
tuning point has a name and an enumeration type or an interval of integer values with stride. For
example, a tuning point is the clock frequency of the CPU which determines the overall energy
consumption. This tuning point has an enumeration type with the different possible clock
frequencies. Tuning points can also be given by the application, e.g. a set of different GPGPU code
variants provided by the application developer or an external tool.
All tuning points of a tuning plugin define a multidimensional tuning space.
Tuning space of a tuning plugin P is the cross product of the individual tuning points, i.e.,
TSP = TP1×TP2×…×TPk
For a program region the tuning plugin will select a set of variants that may lead to a potential
improvement and that need to be evaluated by experiments.
The variant space VSr of a program region r is a subset of the overall tuning space, i.e., VSrTSP.
A variant of a code region r is a concrete vector of values for the region’s tuning points
r = (v1, …, vk)
The variant space is explored by a search strategy to optimize certain objectives.
An objective is a function obj: REGappl×TSP where REGappl is the set of all regions in the
application. A single or multiple objectives are to be optimized by the tuning plugin for a given
program region over the regions variant space.
The tuning plugin creates a sequence of tuning scenarios that are executed by Periscope to determine
the values of one or more objectives.
A tuning scenario is a tuple scr=(r,r,{obj1, …, objn}) where r is the program region, rVSr is a
variant of the region’s variant space, and obj1 … objn are the objectives to be evaluated.
During the execution of a tuning scenario, tuning actions will be executed to select the individual
values of the tuning points.
A tuning action TAi is executed for each tuning point TPi with 1≤i≤k during the execution of a
tuning scenario. It enforces the value vi for the tuning point i given by the variant r = (v1, …, vk).
This document specifies in detail a model for the application of the tuning plugins (Section 2) and the
PTF design (Section 3). The tuning plugins will follow this tuning model and the details for each
plugin will be given in Deliverable 4.1.

AutoTune Deliverable D2.1 8.04.2012
14
3 Tuning Model
The PTF Tuning Model specifies the overall approach taken by the individual tuning plugins that will
be developed in AutoTune. It is presented in the form of UML activity diagrams modeling the steps
taken in the execution of the plugins. After the discussion of the steps taken in the activity diagrams,
the artifacts created by those steps are introduced. These artifacts and other terms are also summarized
in a glossary at the end of this document.
The Tuning Model is presented in a top down approach by the following activity diagrams:
Overall tuning process
Tuning strategy
Plugin strategy
Scenario execution
Phase execution
3.1 Overall Tuning Process
Figure 3: The overall tuning process consists of preparatory steps and the tuning itself.
The overall tuning process is presented in Figure 3. It starts with preparatory steps that lead to the
prepared application as well as to the SIR file (Standard Intermediate Representation) that specifies the
structure of the application code, e.g., the regions and their nesting. This information is required by the
analysis strategies and the tuning plugins, e.g. some analysis strategies follow the region nesting and
search for performance properties in nested regions only if the property was proven for the enclosing
region. The preparatory steps are plugin specific. They include the instrumentation of the application
either via the Periscope instrumenter or other instrumentation tools. The instrumenter inserts calls to
Periscope’s monitoring library and generates the SIR file.
In the second step, the application is analyzed and tuned. AutoTune will focus first on tuning for a
single input data set. For this input data set a number of tuning recommendations are created that can
be applied by the application developer to improve the production runs of the application. The plugin
developers in AutoTune will investigate whether the application of the tuning recommendation can be
automated.
We plan to support tuning for multiple input data sets as well. The recommendations for each input
data set will be combined into a decision tree that is either manually implemented by the application
developer before the production run with a given input data set or the decision tree can guide the
application execution at runtime. A general approach would require means to categorize input data,
e.g., to store meta-data about the input problems in a well-defined manner.
Overall tuning process
Tuning Strategy
SIR
Preparatory Steps
Recommendations
Select
Input
Application
Merge
Recommendations
More input data sets?
[yes]
AutoTune Deliverable D2.1 8.04.2012
15
3.2 Tuning Strategy
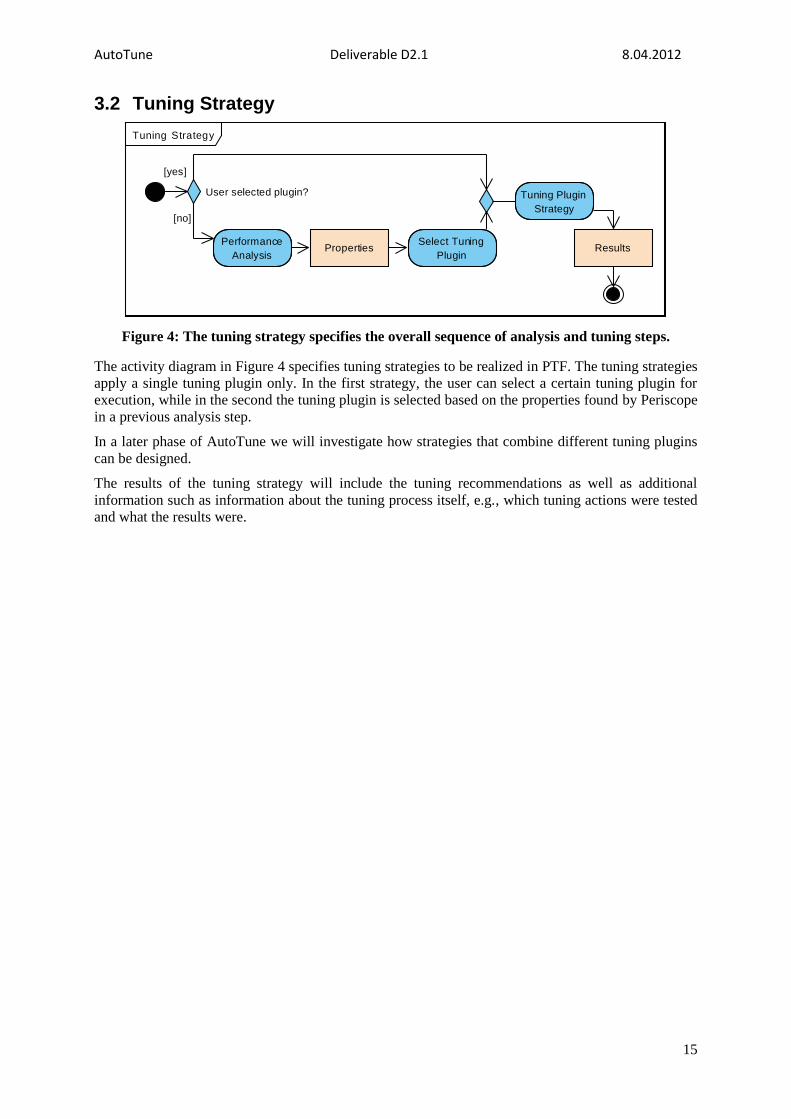
Figure 4: The tuning strategy specifies the overall sequence of analysis and tuning steps.
The activity diagram in Figure 4 specifies tuning strategies to be realized in PTF. The tuning strategies
apply a single tuning plugin only. In the first strategy, the user can select a certain tuning plugin for
execution, while in the second the tuning plugin is selected based on the properties found by Periscope
in a previous analysis step.
In a later phase of AutoTune we will investigate how strategies that combine different tuning plugins
can be designed.
The results of the tuning strategy will include the tuning recommendations as well as additional
information such as information about the tuning process itself, e.g., which tuning actions were tested
and what the results were.
Tuning Strategy
Performance
Analysis
Select Tuning
PluginProperties
Tuning Plugin
Strategy
Results
User selected plugin?
[yes]
[no]

AutoTune Deliverable D2.1 8.04.2012
16
3.3 Plugin Strategy
Figure 5: PTF tuning plugins go through variant selection and variant exploration to identify the
best variant.
A tuning plugin implements a subset of the steps shown in Figure 5. It first executes a plugin-specific
analysis. This creates some properties that are used to select the code regions to tune and the variants
to test.
First, the plugin will select a code region that is to be tuned. Then the variants are selected. The select
variants action can be used to implement a plugin-specific search strategy. It selects a subset of the
possible variants which are most promising. This selection will probably be guided by knowledge that
maps found properties to potential tuned variants. Ideally, the knowledge will identify only a single
variant to test. More realistic is that the knowledge allows for identifying a subset of the variants and
for evaluating all those variants through experiments.
The variants selected in the previous step are given to a search algorithm that explores the variant
space to find the best variant. The search algorithm creates tuning scenarios which are pushed into
Periscope's scenario execution engine. For each variant a single scenario is created.
Plugin Strategy
Plugin-specific analysis
Select Regions
Select Variants
Search Variants
Execute Scenarios
Select best variants
Properties
Regions
Variants
Tuning Scenarios
Tuning Objectives
Results
Tuning Points
Additional regions?
Additional variants?

AutoTune Deliverable D2.1 8.04.2012
17
Scenarios are then executed automatically and the result is reported back to the plugin. The result
consists of one or more objectives that are coded in form of application properties. Which objectives
are evaluated by the analysis agent is determined by the scenario.
For a selected region, the plugin strategy might go through multiple rounds of variant selection and
exploration. Once the search for that region or those regions ends, additional regions can be tuned.
As a result, the best variant for each region is reported.

AutoTune Deliverable D2.1 8.04.2012
18
3.4 Scenario Execution
Figure 6: Replicated execution of a variant in all application processes.
The tuning plugin pushed a set of scenarios into the scenario execution pipeline (see Figure 5). This
pipeline has a scenario scheduler which selects the scenarios for execution. The most straight forward
scheme is shown in Figure 6. The scheduler selects a single scenario which is to be executed in a
replicated fashion in all the processes of the application. More flexible schemes are discussed later.
A scenario might require recompilation, e.g., for the compiler switch selection plugin, and/or a restart
of the application, e.g., for extending the number of workers in a master/worker application. This
recompilation and/or restart would be executed automatically by the PTF frontend.
Scenario Execution (Serial)
Frontend HL Agent Analysis Agent MRI Monitor
Deliver Objectives to plugin
Clustering in HL Agents
Report Objectives to Plugin
Evaluate Objectives
Retrieve Metrics
Release Application
Communicate Tuning Action
to MRI Monitor
Configure Measurements for
Objective
Forward Scenario to ALL
Analysis Agents
Recompilation / Restart with
Tuning Action
Scenario fetched from scenario pipeline
Execute Tuning Action
Tuning action
Configure Tuning Action
Configure Measurements
Recompilation / Restart
required

AutoTune Deliverable D2.1 8.04.2012
19
The scenario is forwarded to all the analysis agents, as only a single scenario is checked in this
experiment. The analysis agent configures the experiment, i.e., it communicates the tuning action and
the requested metrics for the objectives to the MRI monitor. Then, the application is released for
another execution of the phase region. During execution of the phase region, the tuning action is
executed for each invocation of the tuned region.
After the execution of the phase region, the metrics for the required objectives are retrieved and the
objectives are evaluated. All the analysis agents will then forward the objectives to the frontend. On
their way up through the agent hierarchy, clustering of objectives can be done to reduce the data
volume. For some objectives special clustering algorithms might be required.
Besides the replicated execution of a scenario shown in Figure 6, scenarios might be executed in a
single arbitrary process only or in a specific process. For example, HMPP codelet variants, i.e. the
GPGPU code generated for a code region annotated with HMPP directives, need only be evaluated in
a single process, while the number of workers in a master/worker application needs to be set in the
master process. If scenarios are marked to be tested in an arbitrary process, multiple scenarios can be
run in a single experiment by assigning each scenario to a different process. In addition, instead of
using a process exclusively for a single scenario, multiple scenarios can be evaluated in a single
process if they test variants of different regions. Scenarios need to be marked on which MPI rank they
are to be evaluated and whether they can only run exclusively in a process. Thus, to ensure that only a
single scenario is tested in an experiment, the scenario needs to be marked as replicated and exclusive.

AutoTune Deliverable D2.1 8.04.2012
20
3.5 Phase Execution
Figure 7: The diagram details the execution of the experiment. It starts with the Start_Region
call entering the monitoring system before the start of the phase.
Phase Execution
MRI Monitor Application
Start_Region(Phase)
Configure Measurements
and Tun ing Action
Start Phase
Start_Region(Tuned Region)
Execute Tuning Action
Inform Monitor about Tuning
Point and Validation Function
Execute Region
End_Region(Tuned Region)
Store Measuremen ts
Validate Application
Results
Proceed with Phase
End_Region(Phase)
Receive and Process
Agent Requests

AutoTune Deliverable D2.1 8.04.2012
21
This diagram details the execution of an experiment. It shows the execution of the monitor functions
START_REGION and END_REGION that are inserted by the instrumenter before and after the code
regions. When the application process executes the START_REGION for the phase region, it enters
the MRI monitor and blocks until the analysis agent releases the process. The analysis agent
configures the monitor through the MRI interface. It configures the measurements for the objectives as
well as the tuning action. Then the process is released and the phase is started.
Before the execution of the tuned region the monitor is informed about the tuning point and, possibly,
about a validation function. The name of the tuning point and the pointer to a variable implementing
the tuning point are stored in the monitor. The tuning can be combined with a validation function that
checks the correctness of the tuned version after it was executed. The application has to transfer a
function pointer for the validation function so that the monitor can execute it.
At a certain point in time the tuned region is executed. This starts with executing the
START_REGION function. Within this function the monitor will not only configure the
measurements but also execute the tuning action. Based on the pointer to the tuning point obtained
before, the monitor will assign the specified value to that variable. Then the region is executed.
After the execution of the region, the END_REGION function is executed and the measurements are
taken in the monitor. At this point, the correctness of the computed values can be checked via the user
defined validation function if this is required in the tuning scenario.
When the phase terminates with the END_REGION function, the monitor will again wait for further
commands of the analysis agent. These commands will probably retrieve the measurements and might
configure a new experiment.
AutoTune Deliverable D2.1 8.04.2012
22
4 PTF Design
This section presents the overall design of PTF. It specifies the new components of Periscope as well
as their integration into the existing Periscope system. The section starts with the main packages of
PTF which cover external components for the plugins developed in AutoTune as well as Periscope
components. Then, the overall design of PTF is presented. It specifies the interfaces between the
components required for automatic tuning. The last two sections specify the extensions to the frontend
and the application with the monitoring system and the external runtime for automatic tuning.
4.1 PTF Packages
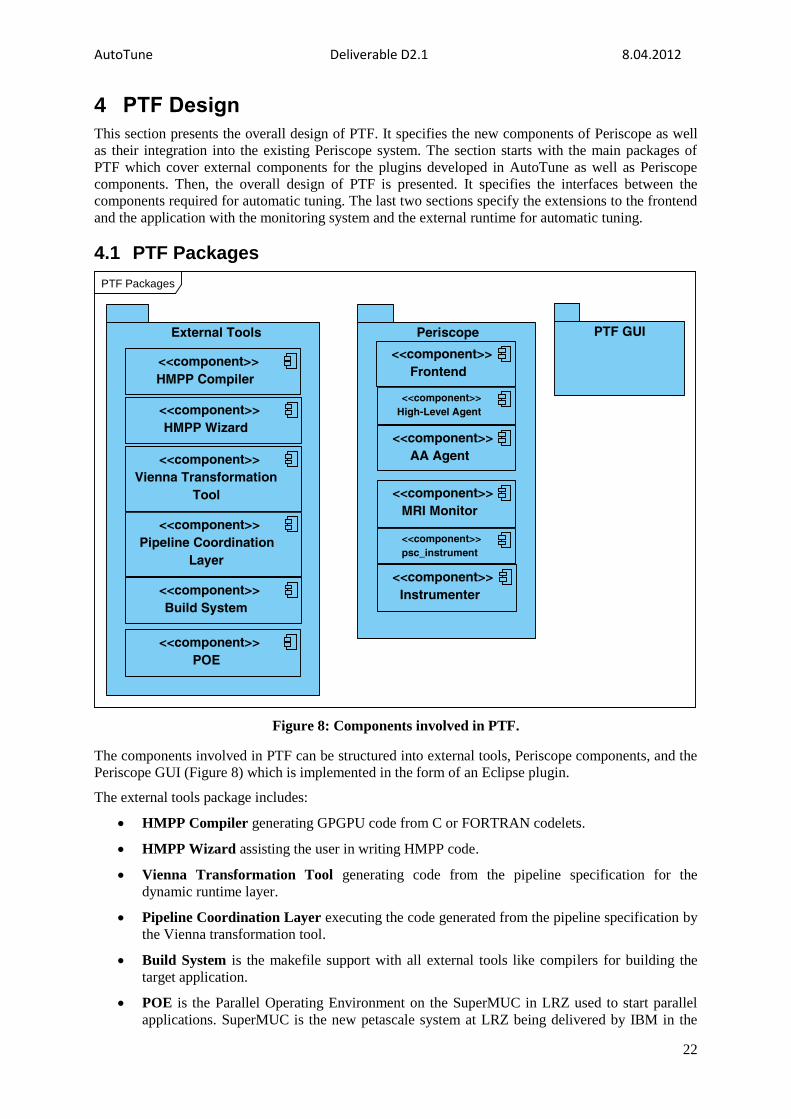
Figure 8: Components involved in PTF.
The components involved in PTF can be structured into external tools, Periscope components, and the
Periscope GUI (Figure 8) which is implemented in the form of an Eclipse plugin.
The external tools package includes:
HMPP Compiler generating GPGPU code from C or FORTRAN codelets.
HMPP Wizard assisting the user in writing HMPP code.
Vienna Transformation Tool generating code from the pipeline specification for the
dynamic runtime layer.
Pipeline Coordination Layer executing the code generated from the pipeline specification by
the Vienna transformation tool.
Build System is the makefile support with all external tools like compilers for building the
target application.
POE is the Parallel Operating Environment on the SuperMUC in LRZ used to start parallel
applications. SuperMUC is the new petascale system at LRZ being delivered by IBM in the
PTF Packages
PTF GUIPeriscopeExternal Tools
<<component>>
HMPP Compiler
<<component>>
HMPP Wizard
<<component>>
psc_instrument
<<component>>
Instrumenter
<<component>>
Pipeline Coordination
Layer
<<component>>
Vienna Transformation
Tool
<<component>>
Build System
<<component>>
POE
<<component>>
High-Level Agent
<<component>>
AA Agent
<<component>>
MRI Monitor
<<component>>
Frontend

AutoTune Deliverable D2.1 8.04.2012
23
first half of 2012. This system will be a main platform for the development of PTF and its
evaluation.
The Periscope package includes:
Frontend coordinating the overall analysis and tuning at runtime.
High-level Agents are the intermediate nodes of the agent hierarchy and propagate control
messages and properties downward and upward.
Analysis Agents perform the analysis search strategies and control the application processes
and the monitoring.
MRI Monitor is the monitoring system that is linked to the application and implements the
requests for measurements and tuning actions received from the analysis agent.
PSC_Instrument is a script that coordinates the preparatory steps before the analysis and
tuning run can be started.
Instrumenter is the component that inserts the monitor functions before and after the code
regions.
The Persicope GUI is not further detailed. It is an Eclipse plugin that facilitates the inspection of the
results of a tuning run and may control the overall tuning approach.

AutoTune Deliverable D2.1 8.04.2012
24
4.2 Global Architecture
Figure 9: Global architecture of PTF
Figure 9 presents the global architecture of PTF. The frontend controls the tuning process. It includes
the tuning plugins that generate the scenarios that are to be evaluated in an experiment. The frontend
can recompile the application and then starts the application. The recompilation is not shown in the
figure but the application start is represented as an example by the mpi_exec interface of the POE on
the SuperMUC system at LRZ.
The frontend’s scenario pipeline scheduler selects the scenarios to execute in an experiment and
forwards them to the analysis agents. The high-level agents will propagate the scenarios according to
the MPI rank specification.
The analysis agent will configure the controlled MPI processes with the required measurements for the
objectives and the tuning actions. The already existing MRI interface needs to be extended with a
command for the tuning actions and the optional validation.
After the experiment, i.e., the execution of the phase region with the appropriate tuning actions and
measurements, the measured metrics are retrieved via the MRI and the objectives are evaluated by the
analysis agent. The objectives which are standard Periscope properties are propagated upwards in the
agent hierarchy to the frontend and finally to the tuning plugin.
AutoTune Deliverable D2.1 8.04.2012
25
4.3 Frontend Components
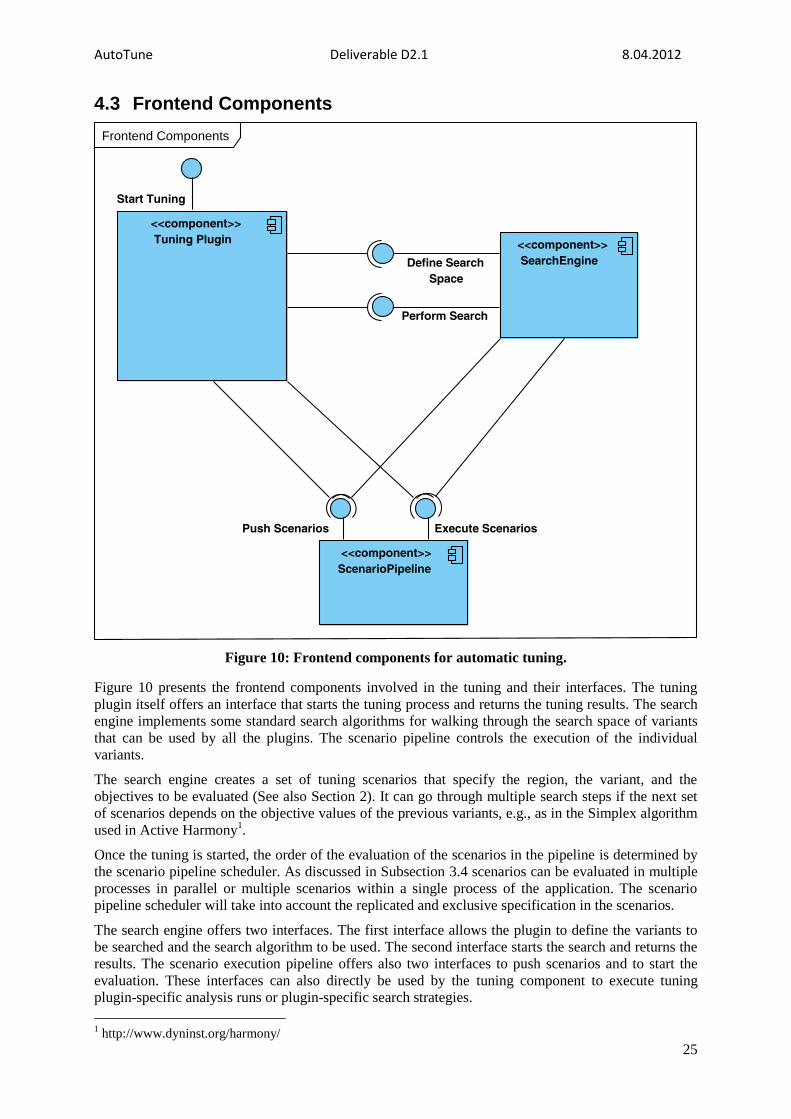
Figure 10: Frontend components for automatic tuning.
Figure 10 presents the frontend components involved in the tuning and their interfaces. The tuning
plugin itself offers an interface that starts the tuning process and returns the tuning results. The search
engine implements some standard search algorithms for walking through the search space of variants
that can be used by all the plugins. The scenario pipeline controls the execution of the individual
variants.
The search engine creates a set of tuning scenarios that specify the region, the variant, and the
objectives to be evaluated (See also Section 2). It can go through multiple search steps if the next set
of scenarios depends on the objective values of the previous variants, e.g., as in the Simplex algorithm
used in Active Harmony1.
Once the tuning is started, the order of the evaluation of the scenarios in the pipeline is determined by
the scenario pipeline scheduler. As discussed in Subsection 3.4 scenarios can be evaluated in multiple
processes in parallel or multiple scenarios within a single process of the application. The scenario
pipeline scheduler will take into account the replicated and exclusive specification in the scenarios.
The search engine offers two interfaces. The first interface allows the plugin to define the variants to
be searched and the search algorithm to be used. The second interface starts the search and returns the
results. The scenario execution pipeline offers also two interfaces to push scenarios and to start the
evaluation. These interfaces can also directly be used by the tuning component to execute tuning
plugin-specific analysis runs or plugin-specific search strategies.
1 http://www.dyninst.org/harmony/
Frontend Components
<<component>>
ScenarioPipeline
<<component>>
SearchEngine
<<component>>
Tuning Plugin
Start Tuning
Perform Search
Define Search
Space
Execute ScenariosPush Scenarios

AutoTune Deliverable D2.1 8.04.2012
26
4.4 Application
Figure 11: Application components for automatic tuning.
The application consists at runtime of the user-level code, Periscope’s monitoring system and, as
needed, an external runtime environment. An external runtime environment is for example needed for
the coordination layer of the pipeline pattern implementation and the execution of HMPP code.
The monitoring system implements the extended MRI interface that provides commands for the
measurement configuration, the configuration of tuning actions and validation requests, as well as for
controlling the applications execution.
It offers the interface routines (START_REGION/END_REGION) that are inserted by the
instrumenter for monitoring program regions. It will also offer a new interface that allows the
application and the external runtime to register addresses of variables for tuning points. These
variables will then be set appropriately before the execution of a region. This interface will also allow
the application to register a validation function that is executed after a tuned region to check a user-
defined correctness criterion.
The monitor will also use other interfaces of external tools that allow execution of certain tuning
actions. For example, the monitor will use an interface of SuperMUC to set the appropriate governor
for the power management and the desired processor frequency. These external components and
interfaces are not shown in Figure 11.
5 Plugin Development
The development of a tuning plugin for PTF thus requires the following actions:
1. Specification of the tuning points and the tuning actions.
2. Specification and implementation of the analysis properties that are required by the tuning
plugin to take tuning decisions.
3. Specification and implementation of the objectives to be evaluated in the analysis agents and
forwarded to the plugin to decide on the tuning recommendation. Specification of the
aggregation of objectives in high-level agents.
4. Implementation of the tuning actions.
Application
<<component>>
MRI Monitor
<<component>>
Application
Routines
<<component>>
External Runtime
Extended MRI
Register Tuning Point and�Validation Function
Get Performance Data
Start/End Region

AutoTune Deliverable D2.1 8.04.2012
27
5. Specification of the restrictions on the scenarios for the evaluation of variants, i.e., determine
if they can be run in parallel in different processes or if they can be explored in the same
process in a single experiment.
6. Implementation of the plugin itself including the selection of variants, forwarding of variants
to the search algorithm, and processing of the returned objectives.
7. Specification and generation of the recommendation returned to the programmer.

AutoTune Deliverable D2.1 8.04.2012
28
6 Glossary
Analysis agent An analysis agent analyzes a subset of the MPI processes. It has a
database of predefined performance properties and follows analysis
strategies. It reports found properties to the frontend via the agent
hierarchy.
Analysis strategy An analysis strategy guides the analysis agents in the search for
performance properties. It determines the order in which hypotheses
are created and evaluated.
Combined Plugin Tuning
Strategy
Overall tuning strategy that combines multiple tuning plugins.
Decision tree A decision tree can specify different tuning actions depending on
certain values of the input data set.
Experiment An experiment is the execution of the phase region under the control
of the MRI monitor to measure performance data and execute tuning
actions.
Frontend This is the process controlling the overall execution of PTF. It
decides in which order analysis and tuning steps are executed and
controls their execution.
High-level Agent The agent hierarchy consists of high-level agents in the intermediate
nodes and analysis agents as leave nodes. High-level agents forward
control messages to the analysis agents and receive and cluster
properties found by the analysis agents.
HMPP Hybrid Multicore Parallel Programming is a high-level
programming interface for offloading portions of the computation
on accelerators.
HMPP codelet An HMPP codelet is the program code of the original program that
is to be executed on the accelerator. The code is annotated with
HMPP directives so that the HMPP compiler can generate good
target code.
MRI Monitor This is the monitoring system of Periscope. MRI stands for
Monitoring Request Interface. This interface is used by the analysis
agent to configure the monitor and to control the application’s
execution.
Phase During execution a program goes through multiple phases. In each
phase an analysis or tuning experiment can be executed.
Phase region A certain program region is called phase region. Execution of a
phase region is a phase of the program. Typically the body of the
time loop of a simulation is selected as phase region or the main
routine of the application.
Plugin Strategy Strategy that determines the sequence of steps within a tuning
plugin.
Program region Program regions are code sections such as subroutines, loops, vector
statements, function calls and GPU codelet invocations.
Scenario pipeline The scenarios execution pipeline performs the experiments to
evaluate the different variants. The pipeline will allow for out-of-
order and parallel execution of scenarios.

AutoTune Deliverable D2.1 8.04.2012
29
Scenario scheduler The scenario scheduler will package the scenarios into experiments
that are then run under the control of the analysis agents.
Single Plugin Tuning Strategy Overall tuning strategy that applies only a single tuning plugin.
SIR The Standard Intermediate Representation is used to communicate
the application structure to PTF as well as to the PTF graphical user
interface implemented as an Eclipse plugin.
START_REGION,
END_REGION
These are functions of the monitor. Code regions are instrumented
with those functions. The functions implement the logic of the
monitoring system, e.g. configuring measurements for a region and
aggregating the measured data at the end of the region.
Tuning Action A tuning action assigns a predefined value to a tuning point.
Tuning Objective Tuning is about optimizing a single or multiple objective functions.
These objective functions are modeled by application properties
called objectives.
Tuning Points Tuning points are the features that define different versions of a
code region or its execution environment, e.g. processor frequency
or HMPP codelet number.
Tuning recommendation A tuning recommendation is the result of a tuning step in PTF. It
specifies, for example, the set of compiler switches to be used in the
compilation of a certain file.
Tuning scenario A tuning scenario specifies the variant, the processes, and additional
scenario execution properties. The additional execution properties
can influence the decision of the scenario scheduler in packaging
variants into experiments.
Validation Function Function provided by the application developer to check the
correctness of the computation. The function might be called by
MRI monitor to check the correctness of a variant.
Variant A variant of a code region is defined by the vector of values for the
region’s tuning points.