newaygo county regional educational … michigan audited financial statements. ... statement of...
TRANSCRIPT

EDUCATIONAL SERVICE AGENCYNEWAYGO COUNTY REGIONAL
JUNE 30, 2017
FREMONT, MICHIGANFREMONT, MICHIGAN
AUDITED FINANCIAL STATEMENTS

PageFINANCIAL SECTION
1 - 3
4 - 12
13
14
15
16
Statement of Revenues, Expenditures and Changes in Fund17
Reconciliation of Statement of Revenues, Expenditures and Changes in Fund18
Proprietary Fund Statements19
20
21
Fiduciary Funds22
23 - 45
REQUIRED SUPPLEMENTARY INFORMATION
46
47
48
TABLE OF CONTENTS
Reconciliation of the Balance Sheet - Governmental Funds
Independent Auditor's Report
Management’s Discussion and Analysis
BASIC FINANCIAL STATEMENTS
Government-Wide Financial StatementStatement of Net Position
Governmental Fund Financial Statements
Statement of Activities
The Statement of Net Position
Balance Sheet - All Governmental Funds
Notes to the Financial Statements
Balances of Governmental Funds to the Statement of Activities
Statement of Net Position
Statement of Net Position
Statement of Revenues, Expenses and Changes in Net Position
Fund Financial Statements
Balances - Governmental Funds
Budgetary Comparison Schedule for the Special Education Special Revenue Fund
Budgetary Comparison Schedule for the General Fund
Budgetary Comparison Schedule for the Career Tech Special Revenue Fund
i
Statement of Cash Flows

Table of Contents (Continued)
Schedule of Proportionate Share of Net Pension Liability 49
Schedule of Contributions 50
OTHER SUPPLEMENTAL INFORMATION
Combining and Individual Fund Statements and Schedules:
51
52
53 - 54
Special Revenue FundsSpecial Education Major Special Revenue Fund
Comparative Balance Sheet 55
Comparative Statement of Revenues 56
Comparative Statement of Expenditures 57
Career Tech Major Special Revenue FundComparative Balance Sheet 58
Comparative Statement of Revenues 59
Comparative Statement of Expenditures 60
Capital Projects Major FundComparative Balance Sheet 61
Comparative Statement of Revenues, Expenditures and Changes in Fund Balances 62
Non-Major Governmental Funds
Comparative Balance Sheet - Non-Major Debt Retirement Fund 63
Comparative Statement of Revenues, Expenditures and Changes in Fund Balances - 64Non-Major Debt Retirement Fund
Proprietary FundsNewaygo County Advanced Technology Services - Major Enterprise Fund Comparative Statement of Net Position 65
Comparative Statement of Revenues, Expenses and Changes in Net Position 66
Comparative Statement of Cash Flows 67
ii
General FundComparative Balance Sheet
Comparative Statement of Revenues
Comparative Statement of Expenditures

Table of Contents (Continued)
Internal Service FundOffice Services Fund
Statement of Net Position 68
Statement of Revenues, Expenses and Changes in Net Position 69
Statement of Cash Flows 70
Student Activities Fiduciary FundStudent Activity Fund
Comparative Balance Sheet 71
Statement of Changes in Assets and Liabilities 72
FEDERAL FINANCIAL ASSISTANCE
73 - 75
Schedule of Federal Financial Assistance Provided to Subrecipients 76
77
78 - 79
80 - 81
82
Performed in Accordance with Government Auditing Standards
Report on Compliance with Requirements Applicable to each Major Program and
Report on Compliance and on Internal Control Over Financial Reporting and on
iii
Schedule of Findings and Questioned Costs
Schedule of Expenditures of Federal Awards
Internal Control Compliance in Accordance with OMB Circular A-133
Compliance and Other Matters Based on an Audit of Financial Statements
Notes to Schedule of Expenditures of Federal Awards

H&S Companies 711 W. Main St. ● Fremont, MI 49412 ● (231) 924-6890
www.hscompanies.com
The Board of Education Newaygo County Regional Educational Service Agency (NC RESA) Fremont, MI
Independent Auditor’s Report Report on the Financial Statements We have audited the accompanying financial statements of the governmental activities, business-type activities, each major fund and the aggregate remaining fund information of NC RESA, as of and for the year ended June 30, 2017, and the related notes to the financial statements, which collectively comprise NC RESA's basic financial statements as listed in the table of contents. Management's Responsibility for the Financial Statements Management is responsible for the preparation and fair presentation of these financial statements in accordance with accounting principles generally accepted in the United States of America; this includes the design, implementation, and maintenance of internal control relevant to the preparation and fair presentation of financial statements that are free from material misstatement, whether due to fraud or error. Auditor's Responsibility Our responsibility is to express opinions on these financial statements based on our audit. We conducted our audit in accordance with auditing standards generally accepted in the United States of America and the standards applicable to financial audits contained in Government Auditing Standards, issued by the Comptroller General of the United States. Those standards require that we plan and perform the audit to obtain reasonable assurance about whether the financial statements are free from material misstatement. An audit involves performing procedures to obtain audit evidence about the amounts and disclosures in the financial statements. The procedures selected depend on the auditor's judgment, including the assessment of the risks of material misstatement of the financial statements, whether due to fraud or error. In making those risk assessments, the auditor considers internal control relevant to NC RESA's preparation and fair presentation of the financial statements in order to design audit procedures that are appropriate in the circumstances, but not for the purpose of expressing an opinion on the effectiveness of NC RESA's internal control. Accordingly, we express no such opinion. An audit also includes evaluating the appropriateness of accounting policies used and the reasonableness of significant accounting estimates made by management, as well as evaluating the overall presentation of the financial statements. We believe that the audit evidence we have obtained is sufficient and appropriate to provide a basis for our audit opinions.
1

Independent Auditor’s Report (continued) Opinions In our opinion, the financial statements referred to above present fairly, in all material respects, the respective financial position of the governmental activities, business-type activities, each major fund and the aggregate remaining fund information of NC RESA as of June 30, 2017, and the respective changes in financial position, and, where applicable, cash flows thereof for the year ended in accordance with accounting principles generally accepted in the United States of America. Other Matters Required Supplementary Information Accounting principles generally accepted in the United States of America require that the management's discussion and analysis and budgetary comparison information be presented to supplement the basic financial statements. Such information, although not a part of the basic financial statements, is required by the Governmental Accounting Standards Board who considers it to be an essential part of the financial reporting for placing the basic financial statements in an appropriate operation, economic, or historical context. We have applied certain limited procedures to the required supplementary information in accordance with the auditing standards generally accepted in the United States of America, which consisted of inquiries of management about the methods of preparing the information and comparing the information for consistency with management's responses to our inquiries, the basic financial statements, and other knowledge we obtained during the audit of the basic financial statements. We do not express an opinion or provide and assurance on the information because the limited procedures do not provide us with sufficient evidence to express an opinion or provide any assurance. Other Information Our audit was conducted for the purpose of forming opinions on the financial statements that collectively comprise NC RESA's basic financial statements. The combining and individual fund financial statements are presented for purposes of additional analysis and are not a required part of the basic financial statements. The schedule of expenditures of federal awards is presented for purposes of additional analysis as required by Title 2 U.S. Code of Federal Regulations (CFR) Part 200, Uniform Administrative Requirements, Cost Principles, and Audit Requirements for Federal Awards, and is also not a required part of the basic financial statements. The combining and individual fund financial statements and the schedule of expenditures of federal awards are the responsibility of management and were derived from and relate directly to the underlying accounting and other records used to prepare the basic financial statements. Such information has been subjected to the auditing procedures applied in the audit of the basic financial statements and certain additional procedures, including comparing and reconciling such information directly to the underlying accounting and other records used to prepare the basic financial statements or to the basic financial statements themselves, and other additional procedures in accordance with auditing standards generally accepted in the United States of America. In our opinion, the combining and individual fund financial statements and the schedule of expenditures of federal awards are fairly stated in all material respects in relation to the basic financial statements as a whole.
2

Independent Auditor's Report (continued) Other Reporting Required by Government Auditing Standards In accordance with Government Auditing Standards, we have also issued our report dated October 24, 2017 on our consideration of NC RESA's internal control over financial reporting and on our tests of its compliance with certain provisions of laws, regulations, contracts, and grant agreements and other matters. The purpose of that report is to describe the scope of our testing of internal control over financial reporting and compliance and the results of that testing, and not to provide an opinion on internal control over financial reporting or on compliance. That report is an integral part of the audit performed in accordance with Government Auditing Standards in considering NC RESA's internal control over financial reporting and compliance.
H&S Companies, P.C. H&S Companies, P.C. Fremont, MI October 24, 2017
3

FINANCIAL HIGHLIGHTS
•
•
•
•
•
•
•
NEWAYGO COUNTY REGIONAL EDUCATIONAL SERVICE AGENCY
Management's Discussion and AnalysisFor the Year Ended June 30, 2017
The Agency had over $21.4 million in expenses related to governmental activities; of which $11.0 million of these expenses were offset by program specific charges for services or grants and contributions. General revenues were adequate to provide for the remaining $10.4 million costs of these programs. Total expenses, including business-type activities, increased over $2.0 million from fiscal year 2016.
The Agency's total debt decreased by $195,510 during the current fiscal year.
As management of the Newaygo County Regional Educational Service Agency, we offer readers of the Agency's financial statements this narrative overview and analysis of the financial activities of the Agency for the fiscal year ended June 30, 2017. We encourage readers to consider the information presented here in conjunction with the Agency's financial statements, which immediately follow this section.
The Agency’s total Net Position of governmental activities decreased from $836,380 to $626,445.
The Career Tech Fund, another major fund, had over $5.4 million in revenue which primarily consisted of state aid and property taxes. Expenditures were nearly $4.4 million and transfers out were over $750,000 resulting in an increase in fund balance of $195,236.
General revenues accounted for about $10.2 million in revenue, or 43.4% of all fiscal year 2017 revenues. Program specific revenues in the form of charges for services and grants and contributions accounted for about $13.3 million or 56.6% of total fiscal year 2017 revenues. Total revenues increased over $1.3 million from fiscal year 2016.
As one of the major funds for the Agency, the General Fund had over $6.6 million in revenue which primarily consisted of state aid and property taxes, and over $7.2 million in expenditures. After taking into account net other financing sources and uses (including operating transfers in and out), the General Fund's fund balance increased by $15,853.
Another major fund for the Agency, the Special Education Fund, had over $9.1 million in revenue. This revenue primarily consisted of federal grants, state aid, and property taxes. These revenues were spent between expenditures of over $8.7 million and other financing uses (including transfers) of approximately $320,000. The Special Education's fund balance increased by $34,286 from 2016 to 2017.
This discussion and analysis is intended to serve as an introduction to the Agency's basic financial statements. The Agency's basic financial statements are comprised of three components: 1) government-wide financial statements, 2) fund financial statements, and 3) notes to the financial statements. This report also contains other supplementary information in addition to the basic financial statements themselves.
The statement of Net Position presents information on all of the Agency's assets and liabilities, with the difference between the two reported as Net Position. Over time, increases or decreases in Net Position may serve as a useful indicator of whether the financial position of the Agency is improving or deteriorating.
OVERVIEW OF FINANCIAL STATEMENTS
Government-wide financial statements. The government-wide financial statements are designed to provide readers with a broad overview of the Agency's finances, in a manner similar to a private-sector business.
4

Management's Discussion and Analysis (Continued)
The statement of activities presents information showing how the Agency's Net Position changed during the most recent fiscal year. All changes in Net Position are reported as soon as the underlying event giving rise to the change occurs, regardless of the timing of related cash flows. Thus, revenues and expenses are reported in this statement for some items that will only result in cash flows in future fiscal periods (e.g., uncollected taxes and earned but unused compensated absences).
The government-wide financial statements can be found on pages 13 - 14 of this report.
Governmental funds . Governmental funds are used to account for essentially the same functions reported as governmental activities in the government-wide financial statements. However, unlike the government-wide financial statements, governmental fund financial statements focus on near-term inflows of spendable resources, as well as on balances of spendable resources available at the end of the fiscal year. Such information may be useful in evaluating the Agency's near-term financing requirements.
Proprietary funds. Proprietary funds use the accrual basis of accounting, the same as on the government-wide statements, therefore the statements will essentially match the business-type activities portion of the government-wide statements.
The basic fiduciary fund financial statement can be found on page 22 of this report.
The basic governmental fund financial statements can be found on pages 15 and 17 of this report.
The government-wide financial statements outline functions of the Agency that are principally supported by property taxes and intergovernmental revenues (governmental activities ). The governmental activities of the Agency include instruction, support services, operation and maintenance of plant, and operation of non-instructional services.
Fund financial statements. A fund is a grouping of related accounts that is used to maintain control over resources that have been segregated for specific activities or objectives. The Agency uses fund accounting to ensure and demonstrate compliance with finance-related legal requirements. The fund statements are formatted to comply with the legal requirements of the Michigan Department of Education's "Accounting Manual". All of the funds of the Agency can be divided into three categories: governmental funds, proprietary funds, and fiduciary funds.
Because the focus of governmental funds is narrower than that of the government-wide financial statements, it is useful to compare the information presented for governmental funds with similar information presented for governmental activities in the government-wide financial statements. By doing so, readers may better understand the long-term impact of the Agency's near-term financing decisions. Both the governmental fund balance sheet and the governmental fund statement of revenues, expenditures, and changes in fund balances provide a reconciliation to facilitate this comparison between governmental funds and governmental activities. These reconciliations are on pages 16 and 18, respectively.
Fiduciary funds. Fiduciary funds are used to account for resources held for the benefit of parties outside the Agency. Fiduciary funds are not reflected in the government-wide financial statements because the resources of those funds are not available to support the Agency's own programs. The accrual basis of accounting is used for fiduciary funds.
5

Management's Discussion and Analysis (Continued)
Total2017 2016 2017 2016 2017
Assets9,468,403$ 9,801,924$ 1,434,400$ 1,255,511$ 10,902,803$
Accumulated Depreciation 15,604,270 15,099,027 115,729 89,947 15,719,999
25,072,673$ 24,900,951$ 1,550,129$ 1,345,458$ 26,622,802$
Deferred Outflows of Resources3,834,766$ 3,647,129$ 296,268$ 281,358$ 4,131,034$
Liabilities3,039,757$ 3,005,179$ 48,021$ 67,346$ 3,087,778$
24,440,792 24,006,473 1,818,453 1,791,203 26,259,245
Total Liabilities 27,480,549 27,011,652 1,866,474 1,858,549 29,347,023
Business-Type
Long-Term Liabilities
Activities
Current Liabilities
Total Assets
Related to Pensions
Activities
Current AssetsCapital Assets - Net of
Governmental
GOVERNMENT-WIDE FINANCIAL ANALYSIS
Notes to the financial statements. The notes provide additional information that is essential to a full understanding of the data provided in the government-wide and fund financial statements. The notes to the financial statements can be found on pages 23 - 45 of this report.
The comparative statements are presented immediately following the major budgetary comparisons. Individual comparative statements and schedules can be found on pages 51 - 72 of this report.
Other information. In addition to the basic financial statements and accompanying notes, this report also presents certain required supplementary information concerning the Agency's budget process. The Agency adopts an annual expenditure budget for all governmental funds. A budgetary comparison statement has been provided for all major funds as required supplementary information. The required supplementary information can be found on pages 46 - 48 of this report.
The largest portion of the Agency's Net Position reflects the investment in capital assets (e.g., land and improvements, buildings and improvements, vehicles, furniture and equipment and construction in progress), less any related debt used to acquire those assets that is still outstanding. The Agency uses these capital assets to provide services to its students; consequently, these assets are not available for future spending. Although the Agency's investment in its capital assets is reported net of related debt, it should be noted that the resources needed to repay this debt must be provided from other sources, since the capital assets themselves cannot be used to liquidate these liabilities.
The following summarizes the Net Position at fiscal years ended June 30, 2017 and 2016:
Net Position may serve over time as a useful indicator of a government's financial position. In the case of the Agency, assets exceeded liabilities by $544,385 as of June 30, 2017 compared to $550,642 as of June 30, 2016, and was $406,925 as of June 30, 2015.
6

Management's Discussion and Analysis (Continued)
Deferred Inflows of Resources800,445$ 700,051$ 61,983$ 54,005$ 862,428$
Net Position Net Investment in
Capital Assets 14,569,474$ 13,909,356$ 115,729$ 89,947$ 14,685,203$ 1 25,932 - - 1
Restricted for Fund Purposes 2,898,294 2,666,488 - - 2,898,294 (16,841,324) (15,765,399) (197,789) (375,685) (17,039,113)
626,445$ 836,377$ (82,060)$ (285,738)$ 544,385$
TotalRevenues: 2017 2016 2017 2016 2017Program Revenues:
Charges for Services 1,500,938$ 1,301,340$ 2,279,232$ 2,022,205$ 3,780,170$ Operating Grants/Contrib. 9,506,259 9,271,321 - - 9,506,259 Capital Grants/Contrib. - 125,000 - - -
General Revenues:Property Taxes 8,112,229 8,043,390 - - 8,112,229 Grants & State Aid 1,902,337 2,047,729 - - 1,902,337 Investment Income 22,789 7,530 2,347 665 25,136 Other 148,398 146,029 785 - 149,183
Total Revenue 21,192,950 20,942,339 2,282,364 2,022,870 23,475,314
Instruction 8,736,633 8,661,079 1,831 468 8,738,464 Support Services -
Student & Staff 6,913,007 6,435,243 - - 6,913,007 Support Services -
Administration 1,502,219 1,516,807 69,495 66,915 1,571,714 Operation & Maintenance
of Plant 1,737,240 1,712,307 98,387 103,529 1,835,627 Transportation & Central 1,102,139 965,373 1,898,799 1,746,805 3,000,938 Community Services 1,361,960 1,505,669 - - 1,361,960 Facilities Acquisition
(Non Capitalized Purchase) 20,535 67,019 - - 20,535 Interest on Long-Term Debt 29,152 33,128 - - 29,152
Total Expenses 21,402,885 20,896,625 2,068,512 1,917,717 23,471,397
GovernmentalActivities
Expenses
2) The addition of $1,050,123 in capital assets through the purchases of furniture, equipment, vehicles, building improvements and the new Vocational Education Building. In the prior year, $1,201,059 of capital assets were added.
Business-Type
Restricted for Debt Service
Related to Pensions
Total Net Position
The following are significant current year transactions that have had an impact on the Statement of Net Position:
1) The retirement of $24,876 of capital lease principal for equipment.
Activities
Unrestricted
7

Management's Discussion and Analysis (Continued)
(209,935)$ 45,714$ 213,852$ 105,153$ 3,917$ Depreciation Expense - - (10,174) (7,153) (10,174)
Increase (Decrease) inNet Position (209,935)$ 45,714$ 203,678$ 98,000$ (6,257)$
2017 2016 2017 2016
Instruction 8,738,464$ 8,661,547$ (473,841)$ (408,697)$ Support Services - Students & Staff 6,913,007 6,435,243 (6,623,371) (6,156,398) Support Services - Administration 1,581,888 1,590,875 (1,420,487) (1,365,037) Operation & Maintenance of Plant 1,835,627 1,815,836 (1,389,473) (1,487,481) Transportation & Central 3,000,938 2,712,178 (671,706) (639,973) Community Services 1,361,960 1,505,669 448,423 67,593 Facilities Acquisition 20,535 67,019 (20,535) (67,019) Interest on Long-Term Debt 29,152 33,128 (29,152) (33,128)
Total Expenses 23,481,571$ 22,821,495$ (10,180,142)$ (10,090,140)$
The cost of all governmental activities this year was $21,402,885 ($20,896,625 for 2016).
Expenses
For governmental activities, federal and state governments and charges for services subsidized certain programs with grants and contributions and other local revenues of $11,007,197 ($10,697,661 for 2016).
The following table presents the cost of the eight major Agency functional activities: instruction, support services - students and staff, support services - administration, operation and maintenance of plant services, student transportation services, community services, facilities acquisition and interest on long-term debt. The table also shows each function's net cost (total cost less charges for services generated by the activities and intergovernmental aid provided for specific programs). The net cost shows the financial burden that was placed on the State and Agency's taxpayers by each of these functions.
Total
Changes in Net Position. The Agency's total revenues including extraordinary items for the fiscal year ended June 30, 2017, were $23,475,314 compared with $22,965,209 for June 30, 2016. The total cost of all programs and services was $23,481,571 for 2016-17 and $22,821,495 for 2015-16. The above table presents a summary of the changes in Net Position for the fiscal years ended June 30, 2017 and 2016.
Excess before Extraordinary Items and Transfers
Net (Expense)
Governmental and Business-Type Activities. As reported in the Statement of Activities on page 14, the cost of all of our governmental and business-type activities this year was $23,481,571 ($22,821,495 for 2016). However, the amount that our taxpayers ultimately financed for these activities through Agency taxes was only $8,112,229 ($8,043,390 for 2016) because some of the cost was paid by those who benefited from the programs $3,780,170 ($3,323,545 for 2016) and by other governments and organizations who subsidized certain programs with grants and contributions $9,506,259 ($9,396,321 for 2016).
Revenue
8

Management's Discussion and Analysis (Continued)
MAJOR GOVERNMENTAL FUNDS BUDGETING AND OPERATING HIGHLIGHTS
General Fund. The general fund actual revenues were $6,634,728, which is less than the original budget estimate of $7,017,621 and less than the final amended budget of $7,713,575. The $695,954 variance between the original and final budget was largely due to additional grant funding not originally anticipated. Of this variance, $200,300 was for Kindergarten Readiness Assessment State Grant that was awarded after the original budget was adopted. Great Start Readiness Program (GSRP) grant funding was increased by $178,054 this year due to an increase in funds carried over from the prior year. The Fremont Area Community Foundation approved an additional $192,838 in WE CAN grant funds which were not in the original budget. The $1,078,847 variance between the final amended budget and the June 30, 2017 actual results was due to grants budgeted for the full grant year but not fully administered within the fiscal year. The most significant grants carried to 2017-2018 include $346,937 for the GSRP State Grant and $109,678 for the Fremont Area Community Foundation WE CAN grant awarded during the year, but available for funding into the next fiscal year. The balance of grants with amounts carried over to 2017-18 include the Fremont Area Community Foundation Grants for Student Interns, Parents as Teachers and Early Literacy totaling $158,720, Section 32p State Child Care and Development Fund Grant which carried $55,845, McKinney-Vento Homeless Assistance Grant which carried $43,030, Gerber Foundation grant for the Imagination Library which carried $40,622, and Drug Free Communities grant which carried $40,173.
The actual expenditures of the general fund were $7,218,823, which is less than the original budget estimate of $7,688,809 and below the final amended budget of $8,306,942. The $618,133 variance between the original and final budget was also due to additional grants which were not originally anticipated as referenced in the previous paragraph. The $1,088,119 variance between the final amended budget and the June 30, 2017 actual expenditures was a result of including full budgets for some grants which were not fully spent as of the end of the fiscal year, as indicated in the previous paragraph. The related grant revenue and expenditures will be reported in 2017-18.
Special Education Fund. The special education fund actual revenue was $9,127,885. That amount is less than the original budget of $9,413,966 and less than the final amended budget of $9,465,060. The $51,094 variance between the original budget and the final amended budget reflected a decrease in the Renaissance Zone State Aid original estimates by management ($159,304) offset by an increase in Section 51 State Aid for Special Education Categoricals. The $337,175 variance between the final amended budget and the June 30, 2017 actual results was due to including full budgets for some grants which were not fully spent as of the end of the fiscal year, most significantly the Special Education Flowthrough grant of $264,025. Also, collections of property taxes being lower than projected by approximately $75,250. This variance is partially due to property no longer taxed due to special districts and
The Agency's budgets are prepared according to Michigan Law. The most significant budgeted funds are the General Fund, the Special Education Fund, the Career-Technical Education Fund, and the Capital Projects Fund.
Operating Highlights:
The General Fund had total revenues of $6,634,728, total expenditures of $7,218,823 and $599,948 of other financing sources (transfers in) over other financing uses (transfers out) resulting in an ending fund balance of $1,028,026. This is an increase of $15,853 from the prior year ending fund balance.
Net cost of governmental activities of $10,395,688 ($10,198,964 for 2016), was financed by general revenues, which are made up of primarily property taxes of $8,112,229 ($8,043,390 for 2016) and state and federal aid of $1,902,337 ($2,047,729 for 2016). Investment earnings accounted for $25,136 ($8,195 for 2016) of funding.
9

Management's Discussion and Analysis (Continued)
CAPITAL ASSETS AND DEBT ADMINISTRATION
The actual expenditures of the special education fund were $8,773,293, which is below the original budget of $9,132,311 and below the final amended budget of $9,261,993. The $129,682 variance between the original and final amended budget was mostly due to larger than anticipated student services needed this year including an increase in payments to the local school districts of $94,268 for increased Act 18 flow through not previously budgeted. The $488,700 variance between the final amended budget and the June 30, 2017 actual results was due to budgeting for the anticipation of fully expending federal grant programs. The Special Education Flowthrough grant had $264,023 more budgeted expenditures than actual expenditures which will carryover to the next fiscal year. The 2016-17 budget also reflected higher anticipated costs than actual expenditures for expenses such as wages with related benefits mostly due to hourly staff whose actual schedule can vary from anticipated schedules.
Career-Technical Education Fund. The career-technical education fund actual revenues were $5,406,121 which was below the original budget estimate of $5,567,208 and below the final amended budget of $5,536,213. The $30,995 variance between the original budget and the final amended budget reflects a $159,304 decrease in the reimbursement from the State for the Renaissance Zone property taxes off-set by $56,603 received from the State for Section 61c Equipment Grant, $29,316 received from various grantors for multiple projects, and $17,000 for Local Stabilization funds replacing some of our reduction in Personal Property Taxes lost during the year. The $130,092 variance between the final amended budget and the June 30, 2017 actual results was due to collections of property taxes being lower than projected by $75,445 and $25,500 of grants carried over to the 2017-18 year.
The actual expenditures of the career-technical education fund were $4,460,414, which is below the original budget of $5,137,228 and below the final amended budget of $5,060,706. The $76,522 variance between the original budget and the final amended budget was due to a retirement resulting in a reduction in wages, benefits and contracted services of $149,755 off-set by an increase in the estimated cost of supplies and capital purchases of $44,520. The $600,292 variance between the final amended budget and the June 30, 2017 actual results was due to less instruction and maintenance costs than anticipated in the budget. Because of uncertain costs with the purchase of the new building, administration again limited other capital and supply purchases to a minimum which was $323,555 less than budgeted. These funds will now be available for any additional costs which might be necessary in the next budget year for the new building. The budget for various contracted services (such as substitute teachers and utility costs for the buildings) were budgeted $154,251 higher than actual. The balance of the variance was for the difference in anticipated and actual wages/benefits.
Capital Assets. As of June 30, 2017 the Agency had invested approximately $27.5 million in capital assets, including school buildings, vehicles, computers, and other equipment. This amount represents a net increase prior to depreciation of $940,172 from last year, primarily due to equipment purchases. Total depreciation expense for the year was $508,921 ($513,726 for 2016).
The Career Tech Fund had total revenues of $5,406,121, total expenditures of $4,460,414, and $750,471 other financing uses (transfers out) over other financing sources (transfers in) resulting in an ending fund balance of $1,776,214. This is an increase of $195,236 in fund balance from the previous year.
The special education fund had total revenues of $9,127,885, total expenditures of $8,773,293, and $320,306 of other financing uses (transfers out) over other financing sources (transfers in) resulting in an ending fund balance of $1,319,662. This is an increase of $34,286 in fund balance from the previous year.
10

Management's Discussion and Analysis (Continued)
Governmental Business-Type Activities Activities Total
Land & Improvements 791,575$ -$ 791,575$ Buildings & Improvements 14,283,976 - 14,283,976 Furniture & Equipment 451,318 115,729 567,047 Vehicles 77,402 - 77,402
Total 15,604,270$ 115,729$ 15,719,999$
Governmental Business-Type Business-Type Activities Activities Activities
Bonds Payable 995,000$ -$ 995,000$ Leases Payable - 39,796 39,796 Accrued Absences 48,888 3,122 52,010
Total 1,043,888$ 42,918$ 1,086,806$
ECONOMIC FACTORS AND NEXT YEAR'S BUDGET AND RATES
Additional information on the Agency's long-term debt can be found in Note H on pages 35 - 37 of this report.
The 2017-18 budget developed by the Agency's administration and elected officials includes estimates based upon the information available in June when it was originally developed and are described below.
Considerations at the time the budget was developed include:
The following schedule presents capital asset balances net of depreciation for the fiscal year ended June 30, 2017:
The State Aid Budget was adopted by the State in June. This year the Section 81 funds (used for general administration for Intermediate School Districts/Educational Service Agencies) was appropriated at the same amount as the 2016-17 allocation, leaving Section 81 funded at 2010-11 fiscal year allocation level. This remains almost 18% lower than 2009-10 fiscal year. The Agency is anticipating a freeze in the Special Education (Sec. 56) and Vocational Education (Sec. 62) Millage Equalizations. The State in the past has tried to make up for the varied property values in different districts in Michigan by distributing funds on an "equalized" basis. This was an attempt by the State of provide equitable education opportunities in property-poor districts to similar levels as land rich areas. The Agency has suffered over $1.8 million of losses since 2009-10 fiscal year in Sec. 56 and 62 millage equalization funding. There was no change in the total allocated to these funds for the 2017-2018 year. The calculation of the Millage Equalization funding sources is based upon a formula which will result the eventual phase out of these funding sources for NC RESA, unless it is funded by the State to the full amount necessary.
Additional information on the Agency's capital assets can be found in Note G on pages 34 - 35 of this report.
Debt Administration. At year-end, the Agency had $1,086,806 in long-term debt outstanding, of which $156,000 is due within one year. The following table presents a summary of the Agency's outstanding long-term debt for the fiscal year ended June 30, 2017:
11

Management's Discussion and Analysis (Continued)
Employee wages and related fringe benefits represent approximately 50 to 60 percent of NC RESA's General, Special and Career-Tech. Education Fund expenditures. Staffing levels will have a significant impact on the near-term future of the Agency.
Federal Grant estimates in the 2017-18 budget reflects a 2% reduction from the 2016-17 budgets. Most of the federal grants reflect no change from the 2016-17 budget. The reduction is mostly due to a reduction in the amount estimated to be carried over from 2016-17 to 2017-18 in Special Education Grants.
Property tax values for properties within the Agency's district are beginning to recover; however, the effects of Public Act (PA) 86 of 2014 reduces the collection of taxes on personal property. Therefore, the 2017-18 budget reflected a 1.6% increase from 2016-17 fiscal year budget. Also, property taxes collected are reduced by various Tax Increment Funding Authorities (TIFA) and Downtown Development Authorities (DDA) which results in not receiving all anticipated revenue as budgeted.
Budgeted expenditures (including transfers) in the General Fund decreased 7% to $7,849,265 for fiscal year 2017-18. The decrease was largely due to the elimination of several one-time grants received in 2016-17 including grants for Kindergarten Readiness Program and Educator Evaluation Grants. The Special Education Fund budgeted a 0.76% decrease in expenditures (including transfers) to $9,528,552 in fiscal year 2017-18. This decrease is mainly due to a reduction in the estimated allocations to the local districts (adjusted after removing a program previously run by one of the districts). The Career Technical Fund budget reflected $5,742,193 in expenditures (including transfers) for fiscal year 2017-18, a 1.49% decrease from the final 2016-17 budget of $5,828,999. This decrease is mostly due to anticipated staffing changes with changes in programs offered.
This financial report is designed to provide our citizens, taxpayers, investors and creditors with a general overview of the Agency’s finances and to demonstrate the Agency’s accountability for the resources it receives. If you have any questions about this report or need additional information, contact the Business Office, Newaygo County Regional Educational Service Agency, 4747 West 48th Street, Fremont, Michigan 49412.
CONTACTING THE AGENCY’S FINANCIAL MANAGEMENT
The MPSERS Retirement Reform continues to result in complications in estimating retirement, pension, and health contributions. The State Aid Act again tries to address an issue with the growing Unfunded Actuarial Accrued Liability (UAAL) in the MPSERS fund by including payments that would be allocated to the school districts to assist in paying the estimated UAAL costs. The amount included in the 2017-18 budget for the Agency was $1,039,665 or a 3.33% decrease from 2016-17 actual revenues of $1,075,471. Fiscal year 2016-17 was about an 11% increase over the amount received in 2015-16 of $968,094. Fiscal year 2015-16 was about a 34% increase over the amount received in 2014-15 of $697,894. Fiscal years 2014-15 and 2013-14 amounts were both almost doubled the amounts budgeted in the prior years. These amounts are budgeted as expenditures and off-setting revenue for a zero net-effect on the budgets.
12

Governmental Business-Type Activities Activities Total
AssetsCurrent Assets
Cash and Investments 7,057,999$ 1,388,171$ 8,446,170$ Accounts Receivable 169,177 23,832 193,009 Due from Other Governmental Units 1,934,735 - 1,934,735 Inventory 57,578 - 57,578 Prepaid Expenses 189,034 14,076 203,110 Other Assets 327 - 327 Cash-Restricted 59,553 8,321 67,874
Total Current Assets 9,468,403 1,434,400 10,902,803 Noncurrent Assets
Land 791,575 - 791,575 Buildings 9,868,932 - 9,868,932 Building Additions 10,295,202 - 10,295,202 Building Equipment - Permanent 82,354 - 82,354 Site Improvements 2,768,147 5,317 2,773,464 Furniture and Equipment 3,147,438 170,304 3,317,742 Vehicles Other than Buses 364,757 51,550 416,307
Total Noncurrent Assets 27,318,405 227,171 27,545,576 Less Accumulated Depreciation (11,714,135) (111,442) (11,825,577)
Total Net Noncurrent Assets 15,604,270 115,729 15,719,999 25,072,673 1,550,129 26,622,802
Deferred Outflows of ResourcesDeferred Outflows of Resources Related to Pensions 3,834,766 296,268 4,131,034
LiabilitiesCurrent Liabilities
Accounts Payable 454,946 28,410 483,356 Salaries Payable 717,858 463 718,321 Payroll Taxes Payable 49,309 36 49,345 Fringe Benefits Payable 713,984 19,112 733,096 Unearned Revenue 777,710 - 777,710 Due to Other School Districts 169,950 - 169,950 Current Portion of Long-Term Obligations 156,000 - 156,000 Total Current Liabilities 3,039,757 48,021 3,087,778
13,796 - 13,796 865,000 - 865,000
48,888 3,122 52,010 23,513,108 1,815,331 25,328,439
Total Noncurrent Liabilities 24,440,792 1,818,453 26,259,245 27,480,549 1,866,474 29,347,023
Deferred Inflows of ResourcesDeferred Inflows of Resources Related to Pensions 800,445 61,983 862,428
Net Position14,569,474 115,729 14,685,203
Restricted for Debt Service 1 - 1 Restricted for Fund Purposes 2,898,294 - 2,898,294
(16,841,324) (197,789) (17,039,113) Total Net Position 626,445$ (82,060)$ 544,385$
Accrued Compensated Absences
NEWAYGO COUNTY REGIONAL EDUCATIONAL SERVICE AGENCY
Statement of Net Position
June 30, 2017
Total Assets
Unrestricted
Noncurrent Liabilities (net of current portion):
Total Liabilities
Bonds Payable
Net Pension Liability
Capital Leases Payable
Net Investment in Capital Assets
See accompanying notes to the basic financial statements.13

Operating CapitalCharges for Grants and Grants and Government Business-Type
Functions/Programs Expenses Services Contributions Contributions Activities Activities TotalGovernmental Activities
Instruction:2,335,954$ 130,661$ 2,704,029$ -$ 498,736$ -$ 498,736$ 3,511,093 517,856 3,794,613 - 801,376 - 801,376 2,889,586 307,561 809,903 - (1,772,122) - (1,772,122)
8,736,633 956,078 7,308,545 - (472,010) - (472,010)
4,592,889 - 243,489 - (4,349,400) - (4,349,400) 2,320,118 - 46,147 - (2,273,971) - (2,273,971)
General Administration Services 451,842 - 4,975 - (446,867) - (446,867) School Administration Services 497,481 - 20,022 - (477,459) - (477,459)
552,896 - 121,404 - (431,492) - (431,492) 1,737,240 446,154 - - (1,291,086) - (1,291,086)
119,992 - - - (119,992) - (119,992) 916,152 - 50,000 - (866,152) - (866,152) 65,995 - - - (65,995) - (65,995)
11,254,605 446,154 486,037 - (10,322,414) - (10,322,414)
1,361,960 98,706 1,711,677 - 448,423 - 448,423 20,535 - - - (20,535) - (20,535) 29,152 - - - (29,152) - (29,152)
Total Governmental Activities 21,402,885 1,500,938 9,506,259 - (10,395,688) - (10,395,688)
Business-Type ActivitiesNewaygo County Advanced
2,078,686 2,279,232 - - - 200,546 200,546
2,078,686 2,279,232 - - - 200,546 200,546
23,481,571$ 3,780,170$ 9,506,259$ -$ (10,395,688)$ 200,546$ (10,195,142)$
Interest on Debt
Total Business-Type Activities
Community Services
Pupil Transportation ServicesCentral Services
Technology Services
Vocational Instruction
Other Support Services
Total Instruction
Facilities Acquisition
Operations and Maintenance
Total Support Services
NEWAYGO COUNTY REGIONAL EDUCATIONAL SERVICE AGENCY
Government Wide Statement of ActivitiesFor the Year Ended June 30, 2017
Changes in Net PositionNet (Expenses) Revenues and
Support Services:
Total School District
Regular InstructionSpecial Instruction
Program Revenues
Instructional Staff Services
Pupil Services
Business Services

General Revenues
Property Taxes 178,564$ -$ 178,564$ 3,966,932 - 3,966,932
Vocational Education 3,966,733 - 3,966,733 Specific Functions:
General 1,902,337 - 1,902,337 22,789 2,347 25,136
148,398 785 149,183
10,185,753 3,132 10,188,885
Change in Net Position (209,935) 203,678 (6,257)
Net Position - Beginning of Year 836,380 (285,738) 550,642
Net Position - Ending of Year 626,445$ (82,060)$ 544,385$
Special Education
State and Federal Aids Not Restricted To
General Purposes
14
Total General Revenues
Interest and Investment EarningsMiscellaneous
See accompanying notes to the basic financial statements

Non-Major Total General Special Career Capital Governmental Governmental
Fund Education Tech Projects Funds FundsAssets
Cash/Investments 1,301,813$ 1,302,207$ 1,791,980$ 2,315,614$ 1$ 6,711,615$ Accounts Receivable 117,099 - 52,078 - - 169,177 Due from Other Governmental Units 707,803 992,156 234,776 - - 1,934,735 Inventory 7,097 15,875 34,606 - - 57,578 Prepaid Expenses 97,827 63,562 27,646 - - 189,035 Other Assets 327 - - - - 327 Cash-Restricted 3,660 47,948 7,945 - - 59,553
Total Assets 2,235,626$ 2,421,748$ 2,149,031$ 2,315,614$ 1$ 9,122,020$
Liabilities and Fund Equity
Accounts Payable 140,496$ 89,963$ 23,233$ 201,257$ -$ 454,949$ Salaries Payable 137,514 419,769 160,575 - - 717,858 Payroll Taxes Payable 9,978 28,701 10,630 - - 49,309 Fringe Benefits Payable 179,773 381,332 152,879 - - 713,984 Unearned Revenue 739,839 12,371 25,500 - - 777,710 Due to Other School Districts - 169,950 - - - 169,950
Total Liabilities 1,207,600 1,102,086 372,817 201,257 - 2,883,760
Fund EquityFund Balance
Nonspendable Inventory 7,097 15,875 34,606 - - 57,578 Nonspendable Prepaid Expenses 97,827 63,562 27,646 - - 189,035 Restricted for Unemployment 3,660 47,948 7,945 - - 59,553 Restricted for Debt Service - - - - 1 1 Restricted for Fund Purposes - 1,192,277 1,706,017 - - 2,898,294 Committed for Career Tech Project - - - 1,000,000 - 1,000,000 Assigned for General Fund - - - 30,100 - 30,100 Assigned for Special Ed Fund - 443,737 - 443,737 Assigned for Career Tech Fund - - - (142,811) - (142,811) Assigned for NCATS Fund - - - 783,331 - 783,331
Unassigned 919,442 - - - - 919,442 Total Fund Equity 1,028,026 1,319,662 1,776,214 2,114,357 1 6,238,260
Total Liabilities and Fund Equity 2,235,626$ 2,421,748$ 2,149,031$ 2,315,614$ 1$ 9,122,020$
See accompanying notes to the basic financial statements15
NEWAYGO COUNTY REGIONAL EDUCATIONAL SERVICE AGENCY
Balance Sheet - All Governmental FundsJune 30, 2017
Liabilities

Total Governmental Fund Balances 6,238,260$
Total Net Position reported for governmental activities in the statement of Net Position are different from the amount reported as total governmental funds fund balance because:
An internal service fund is used by management to charge the cost of certain activities, such as administrative services, to individual funds. The assets and liabilities of the internal service fund are included in governmental activities.
Net Position of governmental activities accounted for in the internal service fund 306,593
Capital assets used in governmental activities are not financial resources and therefore are not reported in the fund statements. Amounts reported for governmental activities in the statement of Net Position:
Governmental capital assets 27,318,401$ Governmental accumulated depreciation (11,714,135) 15,604,266
Governmental funds report actual pension expenditures for the fiscal year, whereas the governmental activities will recognize the net pension liability as of the measurement date. Pension contributions subsequent to the measurement date will be deferred in the statement of net position. In addition, resources related to changes of assumptions, differences between expected and actual experience, and differences between projected and actual pension plan investment earnings will be deferred over time in the government-wide financial statements. These amounts consist of:
Deferred outflows of resources related to pensions 3,834,766 Deferred inflows of resources related to pensions (800,444) 3,034,322
Long-term liabilities, including notes payable, are not due in the current period and therefore are not reported in the fund statements. Long-term liabilities reported in the statement of Net Position that are not reported in the funds balance sheet are:
Compensated absences payable (48,888) Bonds payable (995,000) Net pension liability (23,513,108)
Total Net Position - Governmental Activities 626,445$
NEWAYGO COUNTY REGIONAL EDUCATIONAL SERVICE AGENCY
Reconciliation of the Balance Sheetof Governmental Funds to the Statement of Net Position
For the Year Ended June 30, 2017
See accompanying notes to the basic financial statements.16

Non-Major Total Special Career Capital Governmental Governmental
General Education Tech Projects Funds FundsRevenues
Local Sources 1,673,322$ 4,501,026$ 4,111,045$ 36,395$ 29$ 10,321,817$ State Sources 4,042,864 2,323,580 1,083,496 - - 7,449,940 Federal Sources 789,648 2,303,279 129,080 - - 3,222,007 Interdistrict Sources 128,894 - 82,500 - - 211,394
Total Revenues 6,634,728 9,127,885 5,406,121 36,395 29 21,205,158
ExpendituresInstruction 1,935,193 1,496,076 2,758,338 - - 6,189,607 Support Services:
163,127 4,094,703 177,223 - - 4,435,053 Instructional Staff Services 1,236,463 754,934 268,712 - - 2,260,109
516,826 12,222 12,091 - - 541,139 - - 410,020 - - 410,020
475,178 89,303 64,203 - - 628,684 612,642 239,207 483,538 - - 1,335,387 105,089 4,014 10,381 - - 119,484 511,680 123,187 188,842 - - 823,709
- - 65,885 - - 65,885 1,299,604 11,719 - - - 1,311,323
Facilities Acquisition 12,928 - 21,181 957,677 - 991,786 Debt Service - - - - 156,789 156,789 Transfers to Other School Districts 12,900 1,947,928 - - - 1,960,828 Transfers to Other Entities 337,193 - - - - 337,193
Total Expenditures 7,218,823 8,773,293 4,460,414 957,677 156,789 21,566,996
Excess Revenues Over (Under) Expenditures (584,095)$ 354,592$ 945,707$ (921,282)$ (156,760)$ (361,838)$
Business Services
Community Services
Pupil TransportationCentral ServicesOther Support Services
School Administration Services
Operations & Maintenance
NEWAYGO COUNTY REGIONAL EDUCATIONAL SERVICE AGENCY
Statement of Revenues, Expenditures and Changesin Fund Balance - Governmental Funds
For the Year Ended June 30, 2017
Pupil Services
General Administration Services
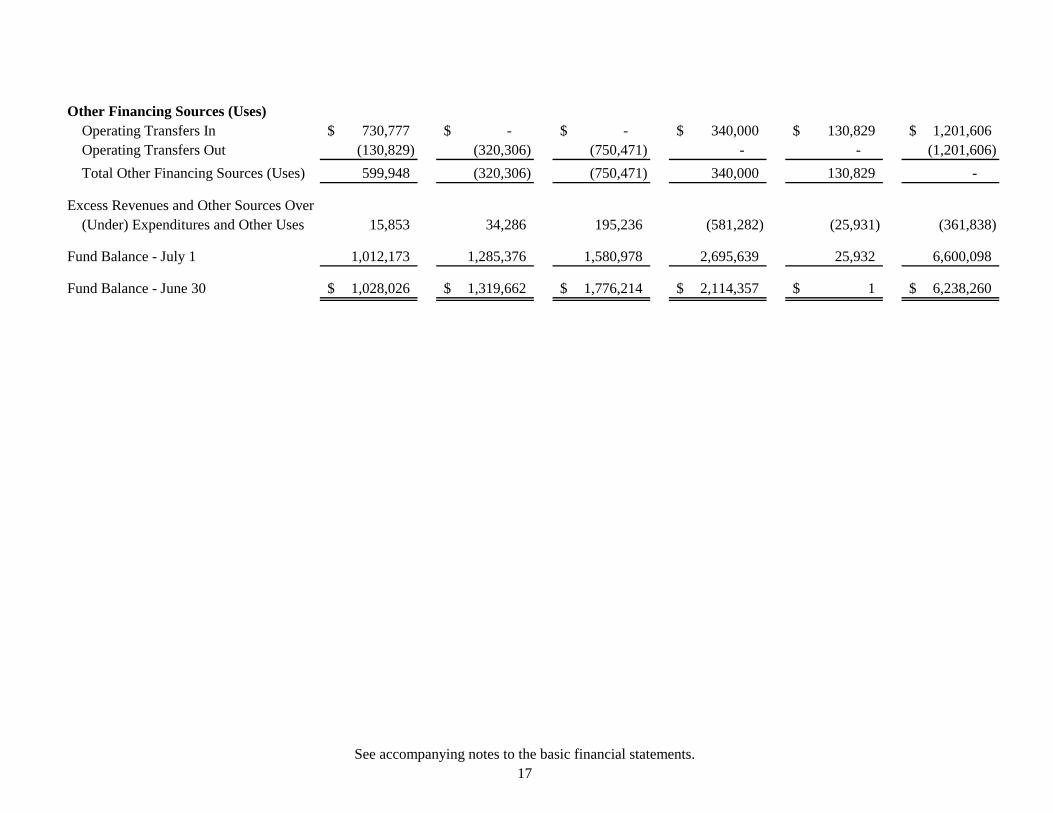
Other Financing Sources (Uses)Operating Transfers In 730,777$ -$ -$ 340,000$ 130,829$ 1,201,606$ Operating Transfers Out (130,829) (320,306) (750,471) - - (1,201,606)
Total Other Financing Sources (Uses) 599,948 (320,306) (750,471) 340,000 130,829 -
Excess Revenues and Other Sources Over15,853 34,286 195,236 (581,282) (25,931) (361,838)
Fund Balance - July 1 1,012,173 1,285,376 1,580,978 2,695,639 25,932 6,600,098
Fund Balance - June 30 1,028,026$ 1,319,662$ 1,776,214$ 2,114,357$ 1$ 6,238,260$
17See accompanying notes to the basic financial statements.
(Under) Expenditures and Other Uses

Net Change in Fund Balances - Total Governmental Funds (361,838)$
Net change in net position for internal service funds 5,437
Capital outlay reported in governmental fund statements 1,014,168$ Depreciation expense reported in the statement of activities (494,627)
519,541
19,431 187,637 (100,394) (609,749)
130,000
(209,935)$
The amount of debt principal payments in the current year is:
Some expenses reported in the Statement of Activities, such as compensated absences and voluntary separation, do not require the use of current financial resources and therefore are not reported as expenditures in governmental funds.
Change in Net Position - Governmental Activities
Amount by which capital outlays are greater (less) than depreciationin the current period:
Repayment of principal on long-term debt is reported in the governmental funds as an expenditure, but is reported as a reduction in long-term debt in the statement of Net Position and does not affect the statement of activities.
Decrease in compensated absences liabilityIncrease in deferred outflows of resources related to pensionsDecrease in deferred inflows of resources related to pensions
NEWAYGO COUNTY REGIONAL EDUCATIONAL SERVICE AGENCY
Reconciliation of Statement of Revenues, Expenditures and Changes inFund Balances of Governmental Funds to the Statement of Activities
For the Year Ended June 30, 2017
An internal service fund is used by management to charge the costs of certain administrative costs to individual funds. The net change in the net position of the internal service funds are reported with governmental activities.
(Increase) in net pension liability
Amounts reported for governmental activities in the statement of activities are different because:
The acquisition of capital assets are reported in the governmental funds as expenditures. However, for governmental activities those costs are shown in the statement of Net Position and allocated over their estimated useful lives as annual depreciation expense.
See accompanying notes to the basic financial statements.18

Business-Type Governmental
Activities ActivitiesNewaygo County
Advanced Technology Internal Services Service Funds
AssetsCurrent Assets
Cash and Investments 1,388,171$ 346,384$ Accounts Receivable 23,832 - Prepaid Expenses 14,076 - Cash-Restricted 8,321 -
Total Current Assets 1,434,400 346,384
Noncurrent AssetsFurniture and Equipment 170,304 118,864 Site Improvements 5,317 - Vehicles 51,550 - Less Accumulated Depreciation (111,442) (40,503)
Total Net Noncurrent Assets 115,729 78,361 1,550,129 424,745
Deferred Outflows of ResourcesDeferred Outflows of Resources Related to Pensions 296,268 -
LiabilitiesCurrent Liabilities
Accounts Payable 28,410 - Salaries Payable 463 - Payroll Taxes Payable 36 - Fringe Benefits Payable 19,112 - Current Portion Long-Term Debt - 26,000 Total Current Liabilities 48,021 26,000
3,122 - Long-Term Debt - 13,795 Net Pension Liability 1,815,331 -
Total Noncurrent Liabilities 1,818,453 13,795 1,866,474 39,795
Deferred Inflows of ResourcesDeferred Inflows of Resources Related to Pensions 61,983 -
Net Position115,729 -
(197,789) 384,950 Total Net Position (82,060)$ 384,950$ Unrestricted
Noncurrent LiabilitiesAccrued Compensated Absences
Total Liabilities
NEWAYGO COUNTY REGIONAL EDUCATIONAL SERVICE AGENCY
Statement of Net Position - Proprietary FundsJune 30, 2017
Total Assets
Net Investment in Capital Assets
See accompanying notes to the basic financial statements.19

Business-Type GovernmentalActivities Activities
Newaygo CountyAdvanced Technology Internal
Services Service FundsOperating Revenue
Local Revenues 2,279,232$ 180,391$
Total Revenues 2,279,232 180,391
Operating ExpensesInstruction 1,831 -
Support ServicesGeneral Administration 4,826 - Business Services 64,669 74,953 Operation & Maintenance 98,387 - Central Services 1,898,799 84,036
Total Support Services 2,066,681 158,989
2,068,512 158,989
Operating Income (Loss) 210,720 21,402
Non-Operating Revenues (Expenses)Depreciation Expense (10,174) (14,295) Interest and Dividends 2,347 694 Interest Expense - (2,364) Sale of Fixed Assets 785 -
Total Non-Operating Revenues (Expenses) (7,042) (15,965)
Change in Net Position 203,678 5,437 Net Position - July 1 (285,738) 379,514
Net Position - June 30 (82,060)$ 384,951$
Total Expenses
NEWAYGO COUNTY REGIONAL EDUCATIONAL SERVICE AGENCY
Statement of Revenues, Expenses and Changes
For the Year Ended June 30, 2017in Net Position - Proprietary Funds
See accompanying notes to the basic financial statements.20

Business-Type Governmental
Activities ActivitiesNewaygo County
Advanced Technology Internal Services Service Funds
Cash Flows from Operating ActivitiesCash Received from Customers 2,272,709$ 180,572$ Cash Paid to Employees (1,088,303) - Cash Paid to Suppliers (979,216) (158,989)
205,190 21,583
Cash Flows from Financing Activities
Principal Payments on Long-Term Debt - (24,876)
Interest Expense - (2,364) Cash Flows from Capital and Related Financing Activities
Net Cash Used by Financing Activities - (27,240)
Cash Flows from Investing ActivitiesPurchases of Equipment (35,955) - Interest and Dividends 2,347 694 Sale of Fixed Assets 784 -
(32,824) 694
Net Increase (Decrease) in Cash and CashEquivalents 172,366 (4,963)
Cash and Cash Equivalents - July 1 1,215,805 351,347
Cash and Cash Equivalents - June 30 1,388,171$ 346,384$
Reconciliation of Operating Income (Loss) to NetCash Provided (Used) by Operating Activities
Operating Income 200,546$ 21,402$
Adjustments to Reconcile Operating Income to NetCash Provided (Used) by Operating ActivitiesDepreciation 10,174 - (Increase) Decrease in Accounts Receivable (4,947) 181 (Increase) Decrease in Prepaid Expenses (1,454) - (Increase) Decrease in Restricted Cash (122) - (Increase) Decrease in Deferred Outflows (14,910) - Increase (Decrease) in Accounts Payable 9,226 -
Increase (Decrease) in Salaries Payables (29,077) - Increase (Decrease) in Other Payroll Payables 526 -
Increase (Decrease) in Accrued Comp. Absences (21,203) - Increase (Decrease) in Net Pension Liability 48,453 - Increase (Decrease) in Deferred Inflows 7,978 -
Net Cash Provided by Operating Activities 205,190$ 21,583$
NEWAYGO COUNTY REGIONAL EDUCATIONAL SERVICE AGENCY
Statement of Cash Flows - Proprietary Funds
For the Year Ended June 30, 2017
Net Cash Provided by Operating Activities
Net Cash Used by Investing Activities
See accompanying notes to the basic financial statements.21

Agency Funds
AssetsCash 49,354$
Total Assets 49,354$
Liabilities Liabilities
Due to Student Groups 49,354$
Total Liabilities 49,354$
NEWAYGO COUNTY REGIONAL EDUCATIONAL SERVICE AGENCY
Statement of Assets and Liabilities - Fiduciary FundsJune 30, 2017
See accompanying notes to the basic financial statements.22

NOTE A SUMMARY OF SIGNIFICANT ACCOUNTING POLICIES
1. Scope of Reporting Entity
2.
NEWAYGO COUNTY REGIONAL EDUCATIONAL SERVICE AGENCY
Notes to the Financial StatementsFor the Year Ended June 30, 2017
The financial statements of the Newaygo County Regional Educational Service Agency have been prepared in conformity with accounting principles generally accepted in the United States of America as applied to government units. The Governmental Accounting Standards Board (GASB) is the accepted standard-setting body for establishing governmental accounting and financial reporting principles.
Government-Wide and Fund Financial Statements
The more significant of the Agency’s accounting policies are described below.
The Newaygo County Regional Educational Service Agency (the Agency) was organized under the School Code of the State of Michigan and services a population of about 9,000 students. The Agency is governed by an elected Board of Education consisting of five members and administered by a Superintendent who is appointed by the aforementioned Board. The Agency provides a comprehensive range of educational services as specified by state statute and Board of Education policy. These services include special, vocational, and other cooperative educational programs to the six constituent school district's in the County of Newaygo. The accounting policies of the Newaygo County Regional Educational Service Agency conform to generally accepted accounting principles as applicable to school Agencies. The following is a summary of the more significant policies.
In accordance with the provisions of the Governmental Accounting Standard's Board (GASB) Statement #14, "The Financial Reporting Entity" as amended by GASB Statement #39, “Determining Whether Certain Organizations are Component Units”, the financial statements of the Newaygo County Regional Educational Service Agency contain all the funds that are controlled by, or dependent on, the Agency's Board of Education, including all activities considered by the Michigan Department of Education and state law to be a part of the operations of the Newaygo County Regional Educational Service Agency. Control by, or dependence on, the Agency was determined on the basis of appointment of governing authority, budget adoption, taxing authority, outstanding debt secured by revenues or general obligations of the Agency, obligation of the Agency to finance any deficits that may occur, receipt of significant subsidies from the Agency, disposition of surplus funds, and scope of public service.
The statement of activities demonstrates the degree to which the direct expenses of a given function or segment are offset by program revenues. Direct expenses are those that are clearly identifiable with a specific function or segment.
The government-wide financial statements (i.e., the statement of Net Position and the statement of activities) present financial information about the Agency as a whole. The reported information includes all of the nonfiduciary activities of the Agency. For the most part, the effect of interfund activity has been removed from these statements. These statements are to distinguish between the governmental and business-type activities of the Agency. Governmental activities normally are supported by taxes and intergovernmental revenues, and are reported separately from business-type activities, which rely to a significant extent on fees and charges for support.
23

3.
Fund Financial Statements - Governmental fund financial statements are reported using the current financial resources measurement focus and the modified accrual basis of accounting. Revenues are recognized as soon as they are both measurable and available. Revenues are considered to be available when they are collectible within the current period or soon enough thereafter to pay liabilities of the current period. For this purpose, the Agency considers revenues to be available if they are collected within 60 days of the end of the current fiscal period. Expenditures are generally recorded when a liability is incurred, as under accrual accounting. However, debt service resources are provided during the current year for payment of general long-term debt principal and interest due early in the following year and, therefore, the expenditures and related liabilities have been recognized. Compensated absences are recorded only when payment is due.
Notes to the Financial Statements (continued)
Measurement Focus, Basis of Accounting and Financial Statement Presentation
Proprietary funds distinguish operating revenues and expenses from nonoperating items. Operating revenues and expenses generally result from providing services and producing and delivering goods in connection with a proprietary fund's principal ongoing operations. The principal operating revenues of the Newaygo County Advanced Technology Services Fund, and the government's internal service fund are charges to customers for sales and services. The Agency also recognizes as operating revenue the grants related to these funds. Operating expenses for enterprise funds and internal service funds include the cost of sales and services, administrative expenses, and depreciation on capital assets. All revenues and expenses not meeting this definition are reported as nonoperating revenues and expenses.
Government-Wide Financial Statements - The government-wide financial statements are reported using the economic resources measurement focus and the accrual basis of accounting , as are the proprietary fund and fiduciary fund financial statements. Revenues are recorded when earned and expenses are recorded when a liability is incurred, regardless of the timing of related cash flows. Property taxes are recognized as revenues in the year for which they are levied. Grants and similar items are recognized as revenue as soon as all eligibility requirements imposed by the grantor or provider have been met. As a general rule, the effect of interfund activity has been eliminated from the government-wide financial statements.
Deferred inflows of resources- The statement of net position and governmental funds balance sheet include a separate section for deferred inflow of resources. This separate financial statement element reflects an increase in net position that applies to a future period. The related revenues will not be recognized until a future event occurs.
Separate financial statements are provided for governmental funds and fiduciary funds, even though the latter is excluded from the government-wide financial statements. Major individual governmental funds are reported as separate columns in the fund financial statements.
Program revenues include: 1) charges to customers or applicants who purchase, use, or directly benefit from goods, services, or privileges provided by a given function or segment and 2) grants and contributions that are restricted to meeting the operational or capital requirements of a particular function or segment. Taxes, State and County aid, and other items not included among program revenues are reported instead as general revenues.
24

General Fund - The General Fund accounts for all resources used to finance Agency maintenance and operation except those required to be accounted for in other funds.
Additionally, the Agency also reports the following fund types:
Enterprise Funds - Enterprise Funds are used to account for operations that (A) are financed and operated in a manner similar to private business enterprise - where the intent of the governing body is to recover costs (including depreciation) of providing goods or services to the general public primarily through user charges; or (B) where the governing body has decided that the periodic determination of revenues earned, expenses incurred, and/or net income is appropriate for capital maintenance, public policy, management control, accountability, or other purposes.
Newaygo County Advanced Technology Services Fund - The Newaygo County Advanced Technology Services Fund accounts for activities of the Newaygo County Advanced Technology Services Department. This department provides internet access to the Agency as well as local school districts and the general public.
Non-Major Fund - Debt Service Fund - The Debt Service Fund is used to account for all of the debt of the Agency.
Property taxes, State and County aid, and investment income associated with the current fiscal period are all considered to be susceptible to accrual and so have been recognized as revenues of the current fiscal period. Miscellaneous revenues are not susceptible to accrual because generally they are not measurable until received in cash. Grants and similar awards are recognized as revenue as soon as all eligibility requirements imposed by the grantor or provider have been met. Unearned revenues also arise when resources are received by the Agency before it has a legal claim to them, as when grant monies are received prior to meeting all eligibility requirements imposed by the provider.
Special Education Fund - The Special Education Fund is used to account for the proceeds of specific revenue sources that are restricted to expenditures for special education.
Capital Projects Fund - The Capital Projects Fund is used to account for all resources for the acquisition of capital facilities and equipment by the Agency.
The Agency reports the following major governmental funds:
Internal Service Fund - The Internal Service Fund accounts for office services provided to other departments on a cost reimbursement basis (Office Services Fund).
The Agency reports the following major proprietary fund:
Career Tech Fund - The Career Tech Fund is used to account for the proceeds of specific revenue sources that are restricted to expenditures for vocational education.
Notes to the Financial Statements (continued)
PROPRIETARY FUNDS
Proprietary funds use the economic resources measurement focus. The accounting objectives are determination of net income, financial position, and cash flows. All assets and liabilities associated with a proprietary fund's activities are included on its balance sheet.
25

4.
5.
6.
7.
When both restricted and unrestricted resources are available for use, it is the Agency’s policy to use restricted resources first, then unrestricted resources as they are needed.
Encumbrances
Fiduciary Fund - The Fiduciary Fund accounts for the assets held by the Agency on behalf of others and includes the Student Activities Fund. This fund accounts for monies raised by students to finance student clubs and organizations.
The Agency's cash and cash equivalents are considered to be cash on hand, demand deposits, and short-term investments with original maturities of three months or less from the date of acquisition.
Certain investments are valued at fair value as determined by quoted market prices, or by estimated fair values when quoted market prices are not available. Standards also provide that certain investments are valued at cost (or amortized cost) when they are of a short-term duration, the rate of return is fixed, and the Agency intends to hold the investment until maturity. Investment income is composed of interest and net changes in the fair value of applicable investments and is included in other local revenue in the fund financial statements.
Inventories are stated at cost using the first-in, first-out method. Career Tech Fund inventory consists of supplies held for resale by the instructional programs of the fund. Inventories are recorded as expenses when consumed in both the fund financial statements and the government-wide financial statements. Inventories are offset by a reserve of fund balance/Net Position.
Encumbrance accounting is used for the General Fund, Special Education Fund, Career Tech Fund, and Capital Projects Funds. Encumbrances are recorded when purchase orders are issued but are not considered expenditures until liabilities for payment are incurred. Encumbrances are reported as a reservation of fund balance on the balance sheet during the year. Encumbrances lapse at the close of the fiscal year and outstanding encumbrances at year-end are reappropriated in the next year. Accordingly, no differences exist between actual results and the applicable budgetary data presented in the accompanying financial statements.
Property tax levies are obtained by applying tax rates against the taxable valuation. Taxable valuation is based upon the property’s state equalized value (which approximates ½ actual value). However, the taxable valuation is limited to the lesser of a 5% increase or the rate of inflation as established by the State of Michigan from the previous year, while there is no limit to the increase in property values for state equalized valuation.
Receivables and Payables
Notes to the Financial Statements (continued)
The focus of governmental fund financial statements is on major funds rather than reporting funds by type. Each major fund is presented in a separate column. Non-major funds are aggregated and presented in a single column. Fiduciary funds are reported by fund type.
Allowances for doubtful accounts are not considered to be material for disclosure.
Deposits and Investments
Inventories
Activity between funds that are representative of lending/borrowing arrangements outstanding at the end of the fiscal year are referred to as either “due to/from other funds” (i.e., the current portion of interfund loans) or “advances to/from other funds” (i.e., the non-current portion of interfund loans). All other outstanding balances between funds are reported as “due to/from other funds.”
26
8.
9.
10.
11.
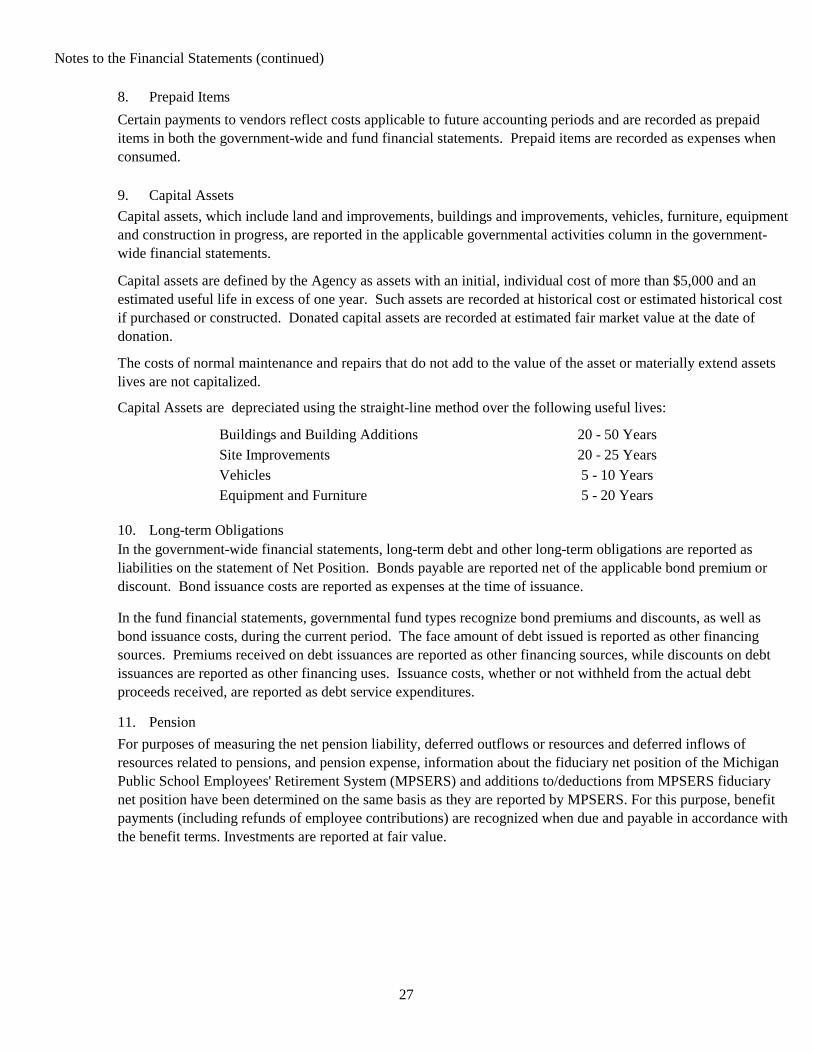
Capital assets, which include land and improvements, buildings and improvements, vehicles, furniture, equipment and construction in progress, are reported in the applicable governmental activities column in the government-wide financial statements.
Vehicles
Pension
Equipment and Furniture
Long-term ObligationsIn the government-wide financial statements, long-term debt and other long-term obligations are reported as liabilities on the statement of Net Position. Bonds payable are reported net of the applicable bond premium or discount. Bond issuance costs are reported as expenses at the time of issuance.
In the fund financial statements, governmental fund types recognize bond premiums and discounts, as well as bond issuance costs, during the current period. The face amount of debt issued is reported as other financing sources. Premiums received on debt issuances are reported as other financing sources, while discounts on debt issuances are reported as other financing uses. Issuance costs, whether or not withheld from the actual debt proceeds received, are reported as debt service expenditures.
5 - 20 Years
For purposes of measuring the net pension liability, deferred outflows or resources and deferred inflows of resources related to pensions, and pension expense, information about the fiduciary net position of the Michigan Public School Employees' Retirement System (MPSERS) and additions to/deductions from MPSERS fiduciary net position have been determined on the same basis as they are reported by MPSERS. For this purpose, benefit payments (including refunds of employee contributions) are recognized when due and payable in accordance with the benefit terms. Investments are reported at fair value.
Buildings and Building Additions
Notes to the Financial Statements (continued)
20 - 50 Years
The costs of normal maintenance and repairs that do not add to the value of the asset or materially extend assets lives are not capitalized.
Capital Assets are depreciated using the straight-line method over the following useful lives:
Certain payments to vendors reflect costs applicable to future accounting periods and are recorded as prepaid items in both the government-wide and fund financial statements. Prepaid items are recorded as expenses when consumed.
Prepaid Items
20 - 25 Years
Capital Assets
5 - 10 YearsSite Improvements
Capital assets are defined by the Agency as assets with an initial, individual cost of more than $5,000 and an estimated useful life in excess of one year. Such assets are recorded at historical cost or estimated historical cost if purchased or constructed. Donated capital assets are recorded at estimated fair market value at the date of donation.
27

12.
13.
14.
15.
Restricted sources are used first when an expense is incurred for which both restricted and unrestricted resources are available. When an expenditure is incurred for which committed, assigned, or unassigned fund balances are available, NC RESA considers amounts to have been spent first out of committed funds, then assigned funds, and finally unassigned funds, as needed, unless the Board has provided otherwise in its commitment or assignment actions.
The preparation of the financial statements in conformity with accounting principles generally accepted in the United States of America requires management to make estimates and assumptions that affect the amount reported in the financial statements and accompanying notes. Actual results may differ from those estimates.
In the fund financial statements, governmental funds report the following classifications of fund balance:
Net position represents the difference between assets and deferred outflows of resources, less liabilities and deferred inflows of resources. NC RESA reports three categories of net position, as follows: (1) Net investment in capital assets consists of net capital assets reduced by outstanding balances of any related debt obligations and deferred inflows of resources attributable to the acquisition, construction, or improvement of those assets, and increases by balances of deferred outflows of resources related to those assets; (2) Restricted net position is considered restricted if its use is constrained to a particular purpose. Restrictions are imposed by external organizations, such as federal or state laws or buyers of NC RESA's debt. Restricted net position is reduced by liabilities and deferred inflows of resources related to the restricted assets; (3) Unrestricted net position consists of all other net position that does not meet the definition of the above components and is available for general use by NC RESA.
Estimates
Restricted - Includes amounts restricted by external sources (creditors, laws of other governments, etc.) or by constitutional provision or enabling legislation.
Unassigned- Includes amounts that are available for any purpose. Positive amounts are only reported in the General Fund.
Net Position
Notes to the Financial Statements (continued)
Fund Equity
Assigned - Includes amount a government intends to use for a specific purpose. Intent can be expressed by the Board or by an official or body to which the Board delegates the authority.
Nonspendable - Includes amounts that cannot be spent because they are either not spendable in form or are legally or contractually required to be maintained intact.
The Agency has placed restrictions on a portion of their cash for the future payment of unemployment. These funds are not available for general operations.
Committed - Includes amounts that can only be used for specific purposes determined by a formal action by Board resolution. These amounts cannot be used for any other purpose unless the Board removes or changes the specified use by taking the same type of action (Board resolution) that was employed when the funds were initially committed.
Restricted Assets
28
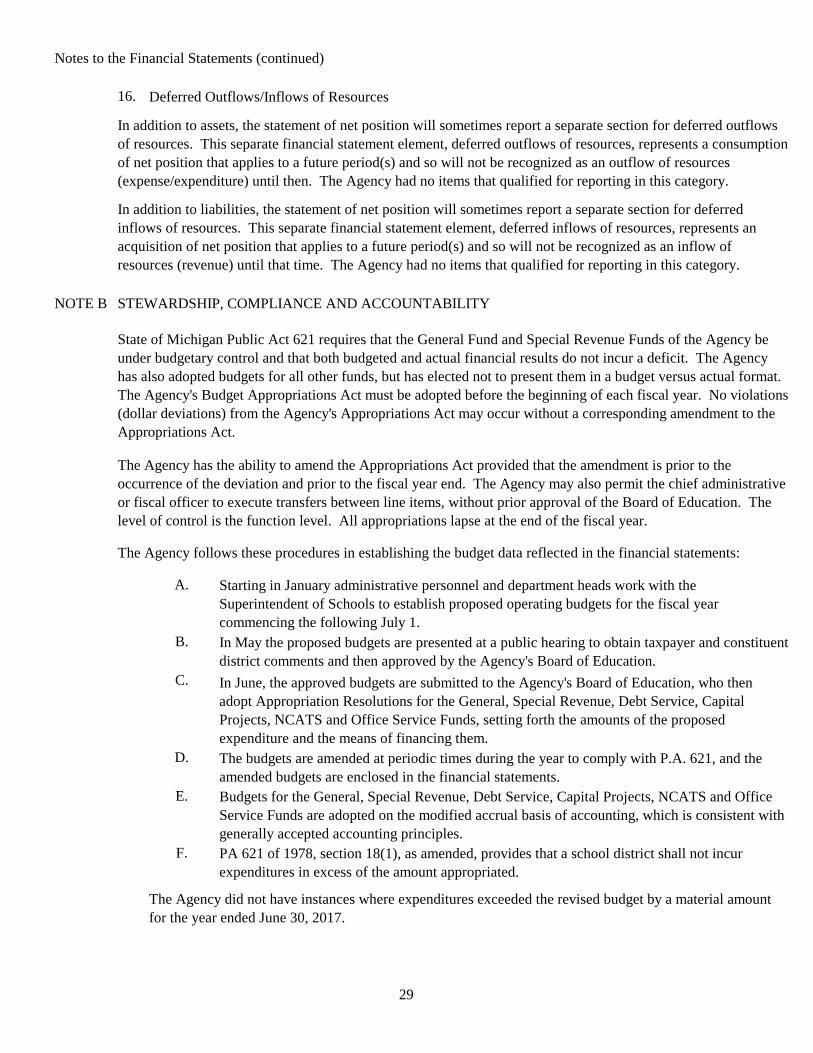
16.
NOTE B
A.
B.
C.
D.
E.
F.
PA 621 of 1978, section 18(1), as amended, provides that a school district shall not incur expenditures in excess of the amount appropriated.
In June, the approved budgets are submitted to the Agency's Board of Education, who then adopt Appropriation Resolutions for the General, Special Revenue, Debt Service, Capital Projects, NCATS and Office Service Funds, setting forth the amounts of the proposed expenditure and the means of financing them.
Notes to the Financial Statements (continued)
The Agency has the ability to amend the Appropriations Act provided that the amendment is prior to the occurrence of the deviation and prior to the fiscal year end. The Agency may also permit the chief administrative or fiscal officer to execute transfers between line items, without prior approval of the Board of Education. The level of control is the function level. All appropriations lapse at the end of the fiscal year.
Starting in January administrative personnel and department heads work with the Superintendent of Schools to establish proposed operating budgets for the fiscal year commencing the following July 1.
The Agency follows these procedures in establishing the budget data reflected in the financial statements:
In May the proposed budgets are presented at a public hearing to obtain taxpayer and constituent district comments and then approved by the Agency's Board of Education.
State of Michigan Public Act 621 requires that the General Fund and Special Revenue Funds of the Agency be under budgetary control and that both budgeted and actual financial results do not incur a deficit. The Agency has also adopted budgets for all other funds, but has elected not to present them in a budget versus actual format. The Agency's Budget Appropriations Act must be adopted before the beginning of each fiscal year. No violations (dollar deviations) from the Agency's Appropriations Act may occur without a corresponding amendment to the Appropriations Act.
In addition to assets, the statement of net position will sometimes report a separate section for deferred outflows of resources. This separate financial statement element, deferred outflows of resources, represents a consumption of net position that applies to a future period(s) and so will not be recognized as an outflow of resources (expense/expenditure) until then. The Agency had no items that qualified for reporting in this category.
In addition to liabilities, the statement of net position will sometimes report a separate section for deferred inflows of resources. This separate financial statement element, deferred inflows of resources, represents an acquisition of net position that applies to a future period(s) and so will not be recognized as an inflow of resources (revenue) until that time. The Agency had no items that qualified for reporting in this category.
Deferred Outflows/Inflows of Resources
Budgets for the General, Special Revenue, Debt Service, Capital Projects, NCATS and Office Service Funds are adopted on the modified accrual basis of accounting, which is consistent with generally accepted accounting principles.
The budgets are amended at periodic times during the year to comply with P.A. 621, and the amended budgets are enclosed in the financial statements.
The Agency did not have instances where expenditures exceeded the revised budget by a material amount for the year ended June 30, 2017.
STEWARDSHIP, COMPLIANCE AND ACCOUNTABILITY
29

NOTE C
As of June 30, 2017, the Agency had the following investments:
Investment Type Michigan Liquid Assets Fund * Michigan CLASS Pool Chemical Business Cash Mgmt
Total Fair Value
* Securities are valued at amortized cost rather than fair value
501,114 N/A AAAm
Another type of account the Agency is invested in is a Business Cash Management account with Chemical Bank. The funds held in this account are not deposits, are not insured by FDIC, and repayment to the Agency is not guaranteed by the United States government of agency thereof. The bank's obligation to repay the amount in the accounts will likely be met by the bank's general banking assets rather than by the proceeds from the underlying government security or securities; the securities are collateral only, and the market value thereof may depreciate prior to the maturity of the bank's obligation to repay the amount in the accounts. In the event of a bank failure, the Agency's interest in the government security or securities will constitute a secured claim for purposes of FDIC claims priority. The funds in the Business Cash Management account are recorded at amortized cost which approximates fair value. These funds are not subject to fair value disclosures.
Fair Value
The Agency voluntarily invests certain excess funds in external pooled investment funds which include money market funds. One of the pooled investment funds utilized by the Agency is the Michigan Investment Liquid Asset Fund (MILAF). MILAF is an external pooled investment fund of "qualified" investments for Michigan school districts. MILAF is not regulated nor is it registered with the SEC. MILAF reports as of June 30, 2017, the fair value of the Agency's investments is the same as the value of the pool shares. MILAF, as defined by the GASB, is recorded at amortized cost which approximates fair value. These funds are not subject to fair value disclosures.
The Agency also invests in the Michigan Cooperative Liquid Assets Securities System (Michigan CLASS) which is considered a local government investment pool of "qualified" investments for Michigan school districts. Michigan CLASS is not regulated nor is it registered with the SEC. Michigan CLASS reports as of June 30, 2017, the fair value of the Agency's investments is the same as the value of the pooled shares. Michigan CLASS does not meet all of the criteria to report investments at amortized cost, therefore, it is recorded at fair value and is subject to fair value measurement at level 2.
777,660
Maturities
N/AN/A
& Poor's
Fair Value Measurement - The Agency is required to disclose amounts within a framework established for measuring fair value. That framework provides a fair value hierarchy that prioritizes the inputs to valuation techniques used to measure fair value. The hierarchy gives the highest priority to unadjusted quoted prices in active markets for identical assets or liabilities (level 1 measurements) and the lowest priority to unobservable inputs (level 3 measurements). The three levels of fair value hierarchy are described as follows:
251,757$ AAAm
1,530,531$
AAAm
Rating
Notes to the Financial Statements (continued)
Standard
DEPOSITS AND INVESTMENTS
30

Quoted prices in active markets for identical securities.
1. 4.2. 5.3. 6.
6,520,194
Total Bank Balance
Independent Bank
Depositories actively used by the Agency during the year are detailed as follows:
Michigan CLASS
The Agency is authorized by Michigan law to invest surplus monies in U.S. bonds and notes, certain commercial paper, U.S. government repurchase agreements, bankers acceptances and mutual funds and investment pools that are composed of authorized investment vehicles.
ChoiceOne Bank
The Agency believes that due to the dollar amounts of cash deposits and the limits of FDIC insurance, it may be impractical to insure all bank deposits. As a result, the Agency evaluates each financial institution with which it deposits Agency funds and assesses the level of risk of each institution; only those institutions with an acceptable estimated risk level of risk level are used as depositories.
Huntington BankChemical Bank
Michigan Liquid Asset Fund
Credit Risk -Generally, credit risk is the risk that an issuer of a debt type investment will not fulfill its obligation to the holder of the investment. This is measured by assignment of a rating by a nationally recognized rating organization. U.S. Government securities or obligations explicitly guaranteed by the U.S. government are not considered to have credit risk exposure. The Agency's Michigan CLASS and Michigan Investment Liquid Asset Fund have ratings of AAAm from Standard & Poor's.
Uninsured and Uncollateralized
As of June 30, 2017, $7,549,611 of the Agency's bank balance of $9,218,320 was exposed to custodial credit risk as follows:
Custodial credit risk is the risk that, in the event of the failure of a financial institution, the Agency will not be able to recover its deposits. NC RESA's investment policy does not specifically address custodial credit risk for deposits.
Notes to the Financial Statements (continued)
The asset or liability's fair value measurement level within the fair value hierarchy is based on the lowest level of any input that is significant to the fair value measurement. Valuation techniques used need to maximize the use of observable inputs and minimize the use of unobservable inputs.
Uninsured and collateral held by pledging bank's trust department not in Agency's name.
$ 1,668,709 Insured or Collateralized
1,029,417
$ 9,218,320
Prices determined using significant unobservable inputs. In situations where quoted prices or observable inputs are unavailable or deemed less relevant, unobservable inputs may be used. Unobservable inputs reflect the Agency's own assumptions about the factors market participants would use in pricing an investment and would be based on the best information available.
Prices determined using other significant observable inputs. Observable inputs are inputs that other market participants may use in pricing a security. These may include prices for similar securities, interest rates, prepayment speeds, credit risk and others.
Level 1:
Level 2:
Level 3:
31

NOTE D INVENTORIES
NCATS Fund Total
Inventory 57,578$
NOTE E RECEIVABLES AND UNEARNED REVENUE
Receivables
NCATS Fund Total
Accounts Receivable 193,010$ Due from Other Govt's 1,934,735
Total Receivables 2,127,745$
Unearned Revenue
Grant draw downs prior to meeting all eligibility requirements
General FundSpecial EducationCareer Tech
Total
Special Career
7,097$
Fund Service
15,875$
Receivables, net of allowance for uncollectibles, as of year end for the Agency's individual major funds and non-major and internal service funds in the aggregate are as follows:
FundGeneral
Education Office
OfficeEducation
-$
Career
Fund
Tech
-$ 34,606$
Fund
117,099$ -$ 52,078$
Notes to the Financial Statements (continued)
Special
Service
23,832$
The method for valuing inventories is included as part of Note A - Summary of Significant Accounting Policies. Following is a schedule of the basic components in ending inventory:
Fund
-$
General
Tech
Fund
$ 777,710
Unearned
The grants included in the unearned category are local and state funding sources. Federal grants are drawn down on a reimbursement basis only.
Unavailable
$ -
Governmental funds report unearned revenue in connection with receivables for revenues that are not considered to be available to liquidate liabilities of the current period. Governmental funds also defer revenue recognition in connection with resources that have been received, but not yet earned. At the end of the current fiscal year, the various components of unearned revenue reported in the governmental funds were as follows:
25,500
707,803 -
992,156$
992,156
824,902$ -$ 23,832$
- 234,776
286,854$
$ 739,839 $ - - -
12,371
32
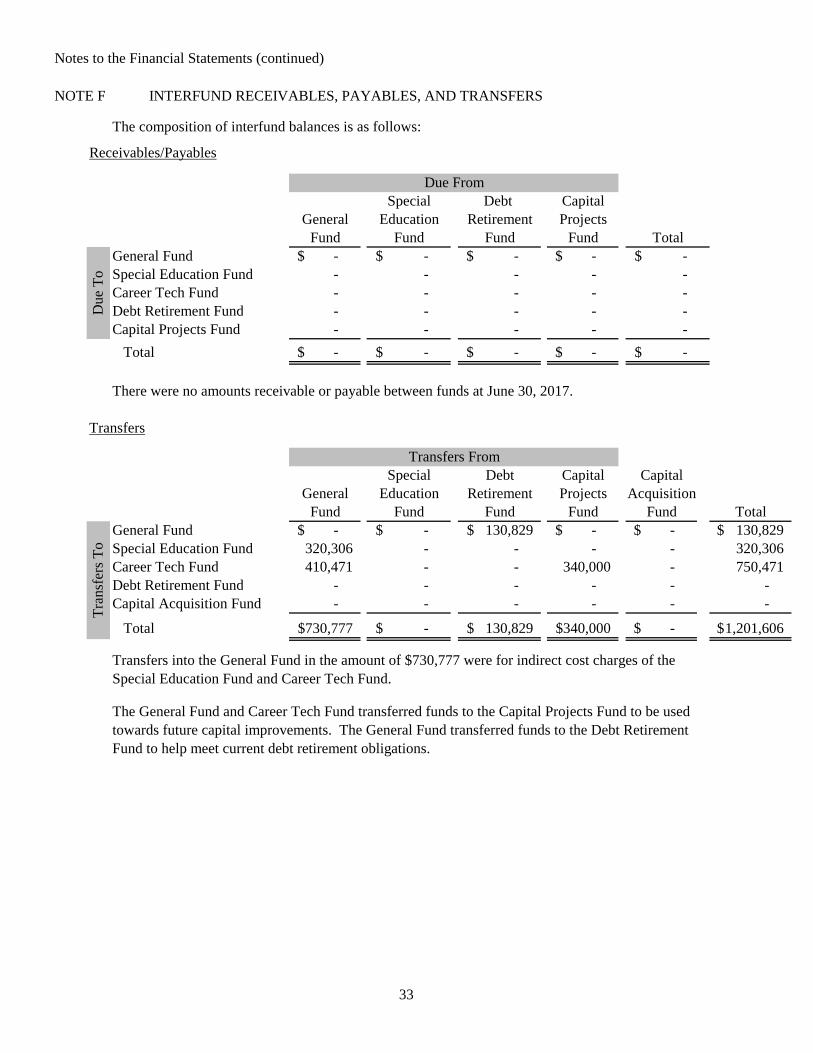
NOTE F INTERFUND RECEIVABLES, PAYABLES, AND TRANSFERS
Receivables/Payables
General Fund Special Education Fund Career Tech Fund Debt Retirement Fund Capital Projects Fund
Total
Transfers
Total
General Fund 130,829$ Special Education Fund 320,306 Career Tech Fund 750,471 Debt Retirement Fund - Capital Acquisition Fund -
Total 1,201,606$
-
-$
-
The composition of interfund balances is as follows:
Due From
-$
Special
Fund
- -$
Notes to the Financial Statements (continued)
-
TotalEducation
Transfers From
Projects
-$
-
-$
-$
Debt Capital
-
-$
There were no amounts receivable or payable between funds at June 30, 2017.
-$
-
ProjectsCapitalDebt
RetirementFund
-$ Fund
- -
-$ - -
-
GeneralSpecial
Education
Fund
-
-$
Due
To
Fund
-
-$
-$
-
340,000$
-
320,306 - - 410,471
-
Fund
- - - - 340,000
Acquisition
-
-
- - -
Capital
-$
Retirement
-
-$
-
-
General
- -
Fund
The General Fund and Career Tech Fund transferred funds to the Capital Projects Fund to be used towards future capital improvements. The General Fund transferred funds to the Debt Retirement Fund to help meet current debt retirement obligations.
Fund
-
730,777$ -$
-
130,829$
Transfers into the General Fund in the amount of $730,777 were for indirect cost charges of the Special Education Fund and Career Tech Fund.
Tra
nsfe
rs T
o
-
130,829$ Fund
-
33
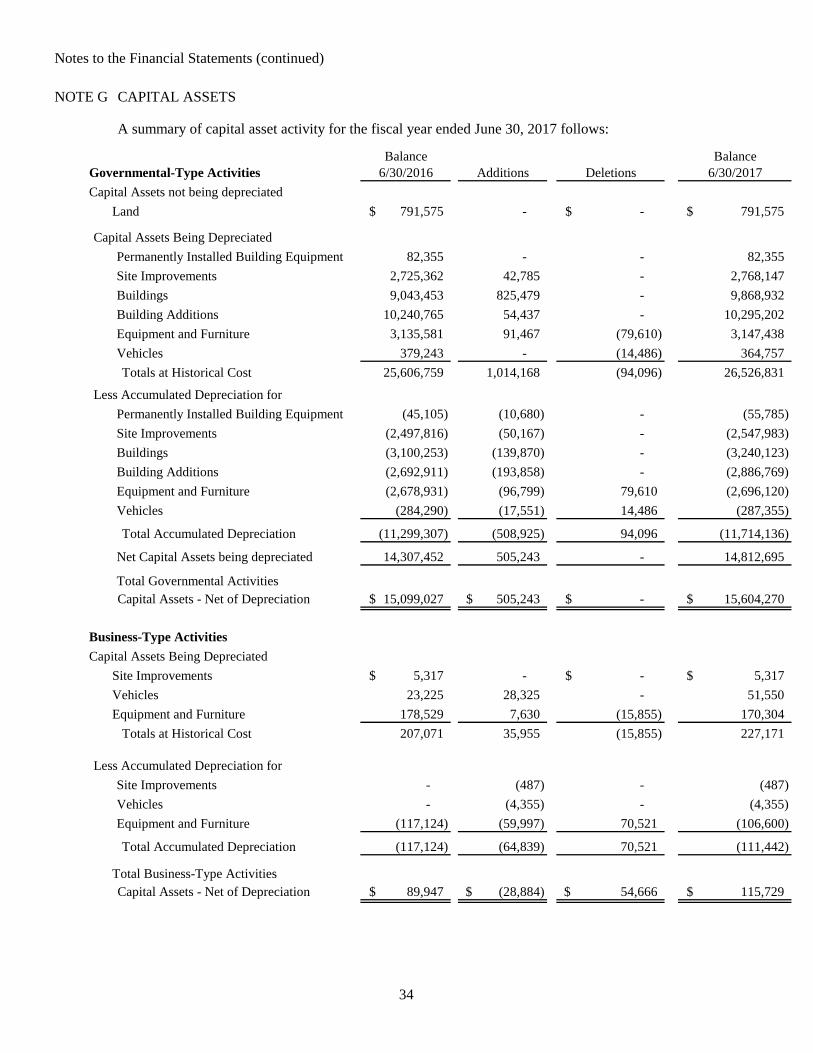
NOTE G
Governmental-Type Activities
Permanently Installed Building Equipment
Site Improvements
Buildings
Building Additions
Equipment and Furniture
Vehicles
Totals at Historical Cost
Less Accumulated Depreciation for
Permanently Installed Building Equipment
Site Improvements
Buildings
Building Additions
Equipment and Furniture
Vehicles
Total Accumulated Depreciation
Net Capital Assets being depreciated
Total Governmental ActivitiesCapital Assets - Net of Depreciation
Site Improvements
Vehicles
Equipment and Furniture
Totals at Historical Cost
Less Accumulated Depreciation for
Site Improvements
Vehicles
Equipment and Furniture
Total Accumulated Depreciation
Total Business-Type Activities Capital Assets - Net of Depreciation
170,304
Notes to the Financial Statements (continued)
-$
(11,299,307)
15,099,027$
14,307,452
178,529
-
35,955
(487)
(28,884)$ 89,947$
Business-Type Activities
7,630 (15,855)
(15,855)
Capital Assets Being Depreciated
5,317$ -
79,610 (96,799)
(55,785)
26,526,831
(2,547,983)
94,096
15,604,270$ 505,243$
(487)
(287,355)
-$
54,666$ 115,729$
(106,600) (117,124) (59,997)
70,521 (64,839) (117,124)
207,071
(2,696,120)
14,812,695
(11,714,136)
14,486
(2,692,911) (2,886,769)
(284,290)
(508,925)
- 505,243
(3,240,123)
-
10,295,202
82,355
(50,167)
(3,100,253)
(17,551)
(139,870) -
(193,858) -
(2,497,816)
25,606,759 1,014,168
Balance
3,135,581
379,243
91,467 3,147,438
(14,486) 364,757
(45,105) (10,680)
-
(94,096)
(2,678,931)
-
- -$ 791,575$
Additions Balance
6/30/2017
Land
Capital Assets not being depreciated
A summary of capital asset activity for the fiscal year ended June 30, 2017 follows:
6/30/2016
CAPITAL ASSETS
Capital Assets Being Depreciated
42,785
10,240,765
(79,610)
- 54,437
-
-
2,725,362
825,479
Deletions
-
791,575$
9,043,453
82,355 -
2,768,147
9,868,932
23,225 28,325 - 51,550
70,521
227,171
-
(111,442)
- (4,355) - (4,355)
5,317$
34

Governmental
Business-Type
Totals at Historical Cost
Less Accumulated Depreciation for
Governmental
Business-Type
Total Accumulated Depreciation
All Activities Capital Assets, Net
Instruction - Vocational Education/Special Education
Total Depreciation Expense - Governmental Activities
NOTE H
Bonds Payable were comprised of the following at June 30, 2017:
Notes to the Financial Statements (continued)
27,318,406$
(11,825,578)
227,171 35,955
1,050,123
94,096
98,807$
Compensated Absences - Accumulated unpaid vacation at June 30, 2017 has been computed and recorded in the financial statements of the Agency as part of the Non-current Liabilities as the liability is expected to be financed from future governmental funds' resources. At present the Agency Administration and Administration Support employees accumulate unused vacation days and are reimbursed, based upon years of administrative service, at their current hourly or salary rate upon retirement. At June 30, 2017, the accumulated liability for unpaid vacation pay was $52,010. This total was comprised of $48,888 for governmental funds and $3,122 for business type funds.
Vocational Education Building and Site Bonds - $1,250,000, 2014 Vocational Education Building and Site Bonds due in annual installments of $14,066 to $159,650 through 2024; interest payable annually at 2.09 percent. At June 30, 2017, the remaining principal balance was $995,000.
Operation and Maintenance
Governmental Activities
410,114
508,921$
GENERAL LONG-TERM OBLIGATIONS
The long-term debt includes Bonds Payable and Vacation & Termination Pay. Since none of this debt will be retired with current operating resources, they are appropriately included in the non-current Liabilities. All items will be recorded as an expenditure of the year in which they are paid.
Depreciation expense was charged to governmental functions as follows:
15,188,975$ 15,719,999$ 476,359$
(94,096)$
(508,925)
(573,764)
(117,124)
(11,299,307)
207,071
(11,416,430)
70,521 (111,442)
26,605,405
(15,855)
All Activities
(11,714,136)
27,545,577 (109,951)
54,666$
(64,839)
26,398,334$
164,617
1,014,168$
35

Debt Outstanding - July 1Debt Added During YearDebt Retired During Year
Debt Outstanding - June 30
Amounts Due Within One Year
21,076
Capital Lease Payable - The Newaygo County Regional Educational Service Agency (the "Agency") entered into agreements with US Bank on November 7, 2013 and August 24, 2015 for the lease of various printers and copiers. The equipment is located in various buildings owned by the Agency. The 2013 lease terms include 60 monthly payments of $2,090 to be applied to interest and principal in addition to a monthly payment of $660 for a maintenance agreement. The 2015 lease terms include 39 monthly payments of $180 to be applied to interest and principal. At the time of final payment on December 16, 2018 for the 2013 lease and February 24, 2019 for the 2015 lease, the Agency will own the equipment. At June 30, 2017, the remaining principal balance of the combined lease agreements was $39,795.
Interest
18,376
- 1,125,000$
1,047,010$
Total
Debt Service requirements at June 30, 2017 were as follows:
140,000
June 30,
(285,971)
Principal
105,280$
995,000$
2014 Vocational Education Bonds
Ended
995,000$
2023-2024 305,000 13,800
(155,971)
AbsencesBonds
(130,000)
Notes to the Financial Statements (continued)
Compensated
52,010$
92,644$ 115,337
115,337
Payable
Changes in Long-Term Liabilities - The following is a summary of governmental-type long-term liability activity of the Agency for the year ended June 30, 2017:
Total
The amount of total long-term liabilities related to business type activities is $3,122 of compensated absences.
Business Type Activities
-$
130,000$
Year
130,000$
130,000$
23,676$ 2018135,000
2021
1,217,644$
15,576 2022
2019
145,000
2020 140,000
12,776
36

Debt Outstanding - July 1
Debt Added During YearDebt Retired During Year
Debt Outstanding - June 30
Amounts Due Within One Year
NOTE I
NOTE J
Plan Description
EMPLOYEE RETIREMENT SYSTEM
Properties are assessed as of December 31, and the related taxes become a lien on December 1 of the following year. These taxes are due on September 10 and February 14 with the final collection date of February 28 before they are added to the County tax rolls. The taxes are collected and remitted to the Agency by the treasurers of the various governmental entities covered by the Agency. The Counties of Newaygo, Muskegon, Oceana and Kent through their Delinquent Tax Revolving Funds, advance all delinquent real property taxes to the Agency each year.
Interest
Year
64,672$
Capital
-
26,000$
Total
PROPERTY TAXES
Services
1,240$
39,796$
Principal
Leases
26,000$
June 30,
Office Services Capital Leases
184
13,796
Annual debt service requirements to maturity for long-term debt are as follows:
39,796$
2018
Ended
(24,876)
2019
The Michigan Public School Employees' Retirement System (MPSERS) is a cost-sharing, multiple employer, state-wide, defined benefit public employee retirement plan governed by the State of Michigan (State) originally created under Public Act 136 of 1945, recodified and currently operating under the provisions of Public Act 300 of 1980, as amended. Section 25 of this act establishes the board's authority to promulgate or amend the provisions of the System. The board consists of twelve members - eleven appointed by the Governor and the State Superintendent of Instruction, who serves as an ex-officio member.
1,424$
Office
Changes in Long-Term Liabilities - The following is a summary of business-type long-term liability activity of the Agency for the year ended June 30, 2017:
Notes to the Financial Statements (continued)
37

Benefits Provided
Contributions and Funded Status
BasicMember Investment PlanPension PlusDefined Contribution
Notes to the Financial Statements (continued)
3.00 - 6.40%3.00 - 7.00% 18.95%
17.73%
The System’s financial statements are available at www.michigan.gov/mpsers-cafr.
A DB member plan member who leaves Michigan public school employment may request a refund of his or her member contributions to the retirement system account if applicable. A refund cancels a former member's rights to future benefits. However, returning members who previously received a refund of their contributions may reinstate their service through repayment of the refund upon satisfaction of certain requirements.
Employers are required by Public Act 300 of 1980, as amended, to contribute amounts necessary to finance the coverage of active and retired members. Contribution provisions are specified by State statute and may be amended only by action of the State Legislature.
Benefit Structure
Benefit provisions of the defined benefit pension plan are established by State statute, which may be amended. Public Act 300 of 1980, as amended, establishes eligibility and benefit provisions for the defined benefit (DB) pension plan. Depending on the plan option selected, member retirement benefits are determined by final average compensation, years of service, and a pension factor ranging from 1.25 percent to 1.50 percent. DB members are eligible to receive a monthly benefit when they meet certain age and service requirements. The System also provides disability and survivor benefits to DB plan members.
Employer contributions to the System are determined on an actuarial basis using the entry age normal actuarial cost method. Under this method, the actuarial present value of the projected benefits of each individual included in the actuarial valuation is allocated on a level basis over the service of the individual between entry age and assumed exit age. The portion of this cost allocated to the current valuation year is called the normal cost. The remainder is called the actuarial accrued liability. Normal cost is funded on a current basis. The unfunded (overfunded) actuarial accrued liability as of the September 30, 2016 valuation will be amortized over a 20 year period for the 2016 fiscal year.
The schedule below summaries pension contribution rates in effect for the fiscal year 2016.
Member
0% 14.56%
Employer
The System is administered by the Office of Retirement Services within the Michigan Department of Technology, Management & Budget. The Department Director appoints the Office Director, with whom the general oversight of the System resides. The State Treasurer serves as the investment officer and custodian for the System.
Pension Contribution Rates
18.95%0.00 - 4.00%
Required contributions to the pension plan from Newaygo County Regional Educational Service Agency were $2,279,687 for the year ended September 30, 2016.
38

Pension Liabilities, Pension Expense, and Deferred Outflows of Resources and Deferred Inflows of Resources Related to Pensions
Total
Notes to the Financial Statements (continued)
Outflows of Inflows of
60,029$
DeferredDeferred
Agency section 147c revenue related to pension contributions subsequent to the measurement date
Asset Class
420,958
18,596
862,428$
-
315,659$
Resources
Changes of assumptions
Net difference between projected and actual earnings on pension plan investments
Changes in proportion and differences between Agency contributions and proportionate share of contributions
At June 30, 2017, Newaygo County Regional Educational Service Agency (the Agency) reported a liability of $25,328,439 for its proportionate share of the MPSERS net pension liability. The net pension liability was measured as of September 30, 2016, and the total pension liability used to calculate the net pension liability was determined by an actuarial valuation rolled forward from September 2015. The Agency’s proportion of the net pension liability was determined by dividing each employer’s statutorily required pension contributions to the system during the measurement period by the percent of pension contributions required from all applicable employers during the measurement period. At September 30, 2016, the Agency’s proportion was 0.10152012 percent, which was an increase of 0.00051619 percent from its proportion measured as of September 30, 2015.
Agency contributions subsequent to the measurement date
-
Resources
783,803
Contributions subsequent to the measurement date ($1,150,190) are reported as deferred outflows of resources related to pensions resulting from employer contributions subsequent to the measurement date will be recognized as a reduction of the net pension liability in the year ended June 30, 2018. Other amounts as deferred outflows of resources and deferred inflows of resources related to pensions will be recognized in pension expense as follows:
4,131,034$
395,990
Differences between expected and actual experience
1,933,993
1,064,434
For the year ended June 30, 2017, the Agency recognized pension expense of $2,792,069. At June 30, 2017, the Agency reported deferred outflows of resources and deferred inflows of resources related to pensions from the following sources:
-
-
39

Actuarial Assumptions
Additional information as of the latest actuarial valuation follows:
Summary of Actuarial AssumptionsActuarial Assumptions:
Valuation Date:Actuarial Cost Method:Wage Inflation Rate:Investment Rate of Return
-MIP and Basic Plans (Non-Hybrid):-Pension Plus Plan (Hybrid):
Projected Salary Increases:Cost-of-Living Pension Adjustments:Mortality
•
•
••
2020 110,897$
of the table rates were used for males and 70% of the
2019
Full actuarial assumptions are available in the 2016 MPSERS Comprehensive Annual Report.
Notes to the Financial Statements (continued)
3.5%
Mortality Tables, adjusted for mortality improvements
2018885,807$
3% Annual Non-Compounded for MIP Members
table rates were used for females.
RP-2000 Male and Female Combine Healthy Life
of the table rates were used. For active members, 80%
8.0%7.0%
Recognition period for assets in years is 5.0000
3.5% - 12.3%, including wage inflation at 3.5%
544,300$
to 2025 using projection scale BB. For retirees, 100%
June 30 Amount
September 30, 2015
Notes:
Recognition period for liabilities is the average of the expected remaining service lives of all employees in years: 4.6273
2017
Entry Age, Normal
577,412$
Assumption changes as a result of an experience study for the periods 2007 through 2012 have been adopted by the System for use in the annual pension valuations beginning with the September 30, 2014 valuation. The total pension liability as of September 30, 2016, is based on the results of an actuarial valuation date of September 30, 2015, and rolled forward using generally accepted actuarial procedures, including the experience study.
Projections of benefits for financial reporting purposes are based on the substantive plan (the plan as understood by the employer and plan members) and include the types of benefits provided at the time of each valuation and the historical pattern of sharing of benefit costs between the employer and plan members to that point. The actuarial methods and assumptions used include techniques that are designed to reduce the effects of short term volatility in actuarial accrued liabilities and the actuarial value of assets, consistent with the long-term perspective of the calculations.
Year Ending
Deferred (Inflows) and Deferred Outflows of Resources by Year (to Be Recognized in Future Pension Expenses)
40

Long-Term Expected Return on Plan Assets
Total
Discount Rate
Sensitivity of the Net Pension Liability to Changes in the Discount Rate
16.00%
(Non-Hybrid/Hybrid) *
Real Rate of Return *
Notes to the Financial Statements (continued)
18.00%
2.00%
4.30%
Short Term Investment Pools
Long-Term Expected
10.00%15.50%
% Alternative Investment Pools
6.00%
100.00%
Real Estate and Infrastructure Pools
(Non-Hybrid/Hybrid) *1% Decrease Rate Assumption 1% Decrease
Asset Class
As required by GASB Statement No. 68, the following presents the Agency’s proportionate share of the net pension liability, calculated using a discount rate of 8.0% (7.0% for the Pension Plus Plan), as well as what the Agency’s proportionate share of the net pension liability would be if it were calculated using a discount rate that is 1-percentage-point lower or 1-percentage-point higher:
8.0%/7.0% 9.0%/8.0%7.0%/6.0%
Absolute Return Pools
The long-term expected rate of return on pension plan investments was determined using a building-block method in which best-estimate ranges of expected future real rates of return (expected returns, net of pension plan investment expense and inflation) are developed for each major asset class. These ranges are combined to produce the long-term expected rate of return by weighting the expected future real rates of return by the target asset allocation percentage and by adding expected inflation. Best estimates of arithmetic real rates of return for each major asset class included in the pension plan’s target asset allocation as of September 30, 2015, are summarized in the following table:
0.90%
19,183,773$ 25,328,439$
(Non-Hybrid/Hybrid) *
*Long term rate of return does not include 2.1% inflation
5.90%Allocation
Current Single Discount
0.00%
A discount rate of 8.0% was used to measure the total pension liability (7.0% for the Pension Plus plan, a hybrid plan). This discount rate was based on the long term expected rate of return on pension plan investments of 8.0% (7.0% for the Pension Plus plan). The projection of cash flows used to determine this discount rate assumed that plan member contributions will be made at the current contribution rate and that employer contributions will be made at rates equal to the difference between actuarially determined contribution rates and the member rate. Based on these assumptions, the pension plan’s fiduciary net position was projected to be available to make all projected future benefit payments of current plan members. Therefore, the long-term expected rate of return on pension plan investments was applied to all periods of projected benefit payments to determine the total pension liability.
32,616,654$
28.00%
10.50%
* = The Basic plan and the Member Investment Plan (MIP) are non-hybrid plans. Pension Plus is a hybrid plan, with a defined benefit (pension) component and a defined contribution (DC) component.
Target
7.20%Fixed Income PoolsInternational Equity
9.20%Domestic Equity Pools
41

Michigan Public School Employees’ Retirement System (MPSERS) Fiduciary Net Position
Payables to the Pension Plan
NOTE K
Retiree Healthcare Reform of 2012Public Act 300 of 2012 granted all active members of the Michigan Public School Employees Retirement Systems, who earned service credit in the 12 months ending September 3, 2012, or were on an approved professional services or military leave of absence on September 3, 2012, a voluntary election regarding their retirement healthcare. Any changes to a member’s healthcare benefit are effective as of the member’s transition date, which is defined as the first day of the pay period that begins on or after December 1, 2012.
Under Public Act 300 of 2012, members were given the choice between continuing the 3% contribution to retiree healthcare and keeping the premium subsidy benefit described above, or choosing not to pay the 3% contribution and instead opting out of the subsidy benefit and becoming a participant in the Personal Healthcare Fund (PHF), a portable, tax-deferred fund that can be used to pay healthcare expenses in retirement. Participants in the PHF are automatically enrolled in a 2% employer match into a 401(k) account. Members who selected this option stop paying the 3% contribution to retiree healthcare as of the day before their transition date, and their prior contributions will be deposited into their 401(k) accounts.
OTHER POST-EMPLOYMENT BENEFITS
Benefit provisions of the postemployment healthcare plan are established by State statute, which may be amended. Public Act 300 of 1980, as amended, establishes eligibility and benefit provisions. Retirees have the option of health coverage. Beginning fiscal year 2013, it is funded on a prefunded basis. The System has contracted to provide the comprehensive group medical, hearing, dental and vision coverage for retirees and beneficiaries. A subsidized portion of the premium is paid by the System with the balance deducted from the monthly pension of each retiree health care recipient. For members who first worked before July 1, 2008, (Basic, MIP-Fixed, and MIP-Graded plan members), the subsidy is the maximum allowed by statute. To limit future liabilities of Other Postemployment Benefits, members who first worked on or after July 1, 2008, (MIP-Plus plan members), have a graded premium subsidy based on career length where they accrue credit towards their insurance premiums in retirement, not to exceed the maximum allowable by the statute. Public Act 300 of 2012 sets the maximum subsidy at 80% beginning January 1, 2013; 90% for those Medicare eligible and enrolled in the insurances as of that date.
Notes to the Financial Statements (continued)
Detailed information about the pension plan’s fiduciary net position is available in the separately issued MPSERS CAFR, available at www.michigan.gov/mpsers-cafr.
The amount of payables to a defined benefit pension plan outstanding at the end of the reporting period were $469,312. The payables were based upon the wages being paid over the period from July 1 through August 30, 2017 which were for services provided prior to June 30, 2017 and therefore legally required contributions to the pension plan.
Public Act 75 of 2010 requires each actively employed member of MPSERS after June 30, 2010 to annually contribute 3% of their compensation to offset employer contributions for health care benefits of current retirees.
42

NOTE L
NOTE M
2017 $ 455,144 $ 92,315
June 30,
Ground Lease
Pension Healthcare Fund
Employer
$ 32,288
17,092
Lease Agreement - The Arts Center for Newaygo County
Contributions
24,077
LEASE AGREEMENTS
22,630 22,630
The Agency has elected to finance its unemployment liability as a "reimbursing employer." Under this method, the Agency reimburses the Michigan Employment Security Commission for all benefits charged to the Agency's account during the previous calendar year. The Agency also elects to accumulate funds in a restricted cash account for the contingency of paying for these costs when incurred. This allocation is based upon actual payroll up to $9,000 per employee as a set rate of .01% for the 2016-2017 fiscal year.
Lease Agreement - Michigan WORKS! West Central
Contributions Contributions
63,046 $ 32,288
Contributions
2015 17,092
The Agency required and actual postemployment healthcare contributions to the various plans for the last three (3) fiscal years are as follows:
EndingFiscal Year
Employer EmployeeHealth
Defined Benefit Plan
Employer
Defined Contribution Plan
UNEMPLOYMENT COMPENSATION
Notes to the Financial Statements (continued)
On May 23, 2000, the Newaygo County Regional Educational Service Agency ("Lessor") and the Arts Center for Newaygo County ("Lessee") entered into a lease for approximately 1.94 acres of land for a term of 99 years for a sum of $1 for the term. The Lessee constructed a building on this land to be used for a performing arts center.
2016 426,092
On April 19, 1999, the Newaygo County Regional Educational Service Agency ("Lessor") and the County of Newaygo ("Lessee") entered into a lease for approximately 1.42 acres of land.
On September 1, 2015, the Newaygo County Regional Educational Service Agency ("Lessor") and Michigan WORKS! West Central ("Lessee") entered into a lease for 3,365 square feet of office space at $1 per square foot at the Regional Center for AgriScience and Career Advancement building. The monthly rent of $1 per square foot, $3,365 is due on the first of each month commencing on September 1, 2015. The initial term of the lease commences on September 1, 2015 and terminates October 31, 2019. Tenant shall have the option to renew lease for one additional five (5) year term.
274,977
43

NOTE N RISK MANAGEMENT
NOTE O TAX ABATEMENTS
The Agency received reduced property tax revenues from the City of Fremont and the City of White Cloud during the fiscal year as a result of industrial facilities tax exemptions (IFT's). The IFT's were entered into based upon the Plant Rehabilitation and Industrial Developments Disctricts Act (know as the Industrial Facilities Exemption), PA 198 of 1974, as amended. IFT's provide a tax incentive to manufacturers to enable renovation and expansion of aging facilities, assist in the building of new facilities, and to promote the establishment of high-tech facilities. Properties qualifying for IFT status are taxed at 50% of the millage rate applicable to other real and personal property in the county. The abatements amounted to approximately $20,000 in reduced taxes.
On April 7, 2015, the Newaygo County Regional Educational Service Agency ("Lessor") and the Gerber Foundation ("Lessee") entered into a lease for one office suite with two private offices for a term of ten (10) years beginning on January 1, 2016 for the sum of $1,500 per month. The primary term of this lease begins on January 1, 2016 through December 31, 2025 and shall continue from year to year thereafter unless proper notification of termination is served.
Lease Agreement - County of NewaygoOn September 1, 2015, the Newaygo County Regional Educational Service Agency ("Lessor") and the County of Newaygo ("Lessee") entered into a lease for two offices, one receptionist space, and up to 8 hours of classroom space at the Regional Center for AgriScience and Career Advancement building. A lease payment of $1,592 per month will be payable by the first day of each month. The monthly payment may be reduced by the cost of the part-time receptionist position which is costs $941. This agreement commences September 1, 2015 and continues through August 31, 2020 at which time it will be renewable annually.
On September 1, 2015, the Newaygo County Regional Educational Service Agency ("Lessor") and Baker College ("Lessee") entered into a lease for five (5) classrooms and two (2) labs in the instructional wings at the Regional Center for AgriScience and Career Advancement building. The facilities are used to deliver classes to the community in Newaygo County which will lead to an associated, baccalaureate or master's degree. A lease payment of $7,500 per month will be payable to the Lessor on a schedule that is mutually agreeable to the parties. The Lease terminates August 31, 2020. Tenant shall have the option to renew lease for an additional five (5) year term. Unless terminated pursuant to provisions within the agreement, the lease automatically renews for an additional year until either party gives written notice that they do not want to renew.
Notes to the Financial Statements (continued)
On November 1, 2015, the Newaygo County Regional Educational Service Agency ("Lessor") and Muskegon Community College ("Lessee") entered into a lease for office space. The initial term of the lease commences November 1, 2015 and terminates August 31, 2035. The lease for the year ended June 30, 2017 consisted of office space with rent due at $1,070 per month, classrooms with rent due at $15 per half day and labs at $25 per half day.
Lease Agreement - Baker College
Lease Agreement - Muskegon Community College
Lease Agreement - The Gerber Foundation
The Agency is exposed to various risks of loss related to torts; theft of, damage to and destruction of assets; errors and omissions; and natural disasters for which the School Agency carries commercial insurance. Liabilities in excess of insurance coverage, if any, are reported when it is probable that a loss has occurred and the amount of the loss can be reasonably estimated.
44

NOTE P
NOTE Q SUBSEQUENT EVENTS
NOTE R ECONOMIC DEPENDENCY
In preparing these financial statements, management has evaluated, for potential recognition or disclosure, significant events or transactions that occurred during the period subsequent to June 30, 2017, the most recent balance sheet presented herein, through October 24, 2017, the date these financial statements were available to be issued. Other than discussed below, no significant such events or transactions were identified.
Notes to the Financial Statements (continued)
In June 2015, the GASB issued Statement No. 75, Accounting and Financial Reporting for Postemployment Benefits Other Than Pensions . The statement replaces the requirements of GASB Statement No. 45, Accounting and Financial Reporting by Employers for Postemployment Benefits Other Than Pensions . The statement requires governments providing other postemployment benefits (OPEB) to recognize their unfunded OPEB obligation as a liability for the first time, and to more comprehensibly and comparably measure the annual costs of OPEB benefits. The statement also enhances accountability and transparency through revised note disclosures and required supplementary information (RSI). The Agency is currently evaluating the impact this standard will have on the financial statements when adopted during the Agency’s 2017-2018 fiscal year.
During the current fiscal year, the Agency entered into various agreements for projects that were not completed as of June 30, 2017. The projects are expected to be completed in the year ended June 30, 2018 and include: 1) an agreement for $115,132 with Automatic Equipment Sales & Service, Inc. for an electronic access control project, 2) an agreement for $121,250 with Muskegon Roofing & Sheet Metal for a Career-Tech roofing project, and 3) agreements with various contractors for $943,661 for the Regional Center for AgriScience & Career Advancement gym renovation project.
NOTE S
GASB Statement No. 77, Tax Abatement Disclosures , was implemented during the year. The statement requires disclosure of tax abatement information about 1) the Agency's own tax agreements and 2) those that are entered into by other governments and that reduce the Agency's tax revenues. This statement will improve the user's knowledge on how tax abatements affect the Agency's financial positions and results of operations, including their ability to raise resources in the future.
CASH FLOWS
ADOPTION OF NEW ACCOUNTING STANDARDS
Cash paid for interest by the Agency for the proprietary funds was $0, which equals the interest expense and the total interest incurred for the year.
NOTE T UPCOMING ACCOUNTING PRONOUNCEMENTS
The State of Michigan provides State Aid to the Agency. These revenues represent 31.7% of the total Agency revenues.
45
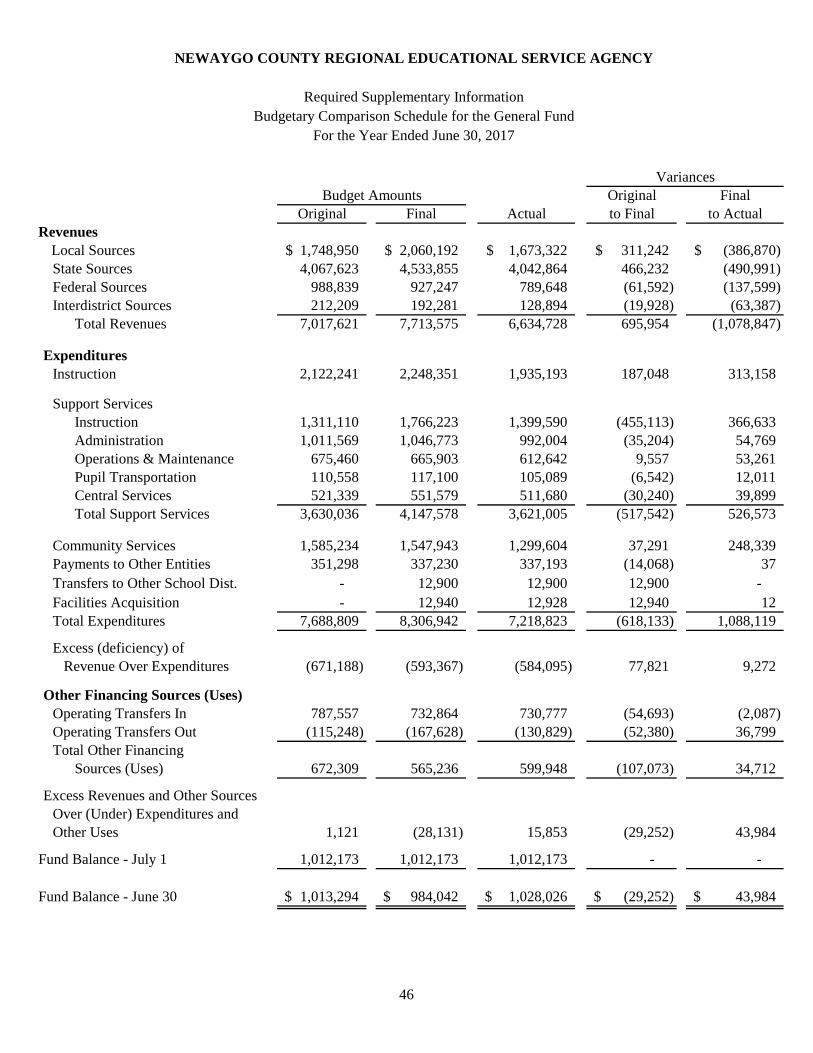
Original FinalOriginal Final Actual to Final to Actual
Revenues Local Sources 1,748,950$ 2,060,192$ 1,673,322$ 311,242$ (386,870)$ State Sources 4,067,623 4,533,855 4,042,864 466,232 (490,991) Federal Sources 988,839 927,247 789,648 (61,592) (137,599) Interdistrict Sources 212,209 192,281 128,894 (19,928) (63,387)
Total Revenues 7,017,621 7,713,575 6,634,728 695,954 (1,078,847)
ExpendituresInstruction 2,122,241 2,248,351 1,935,193 187,048 313,158
Support Services Instruction 1,311,110 1,766,223 1,399,590 (455,113) 366,633 Administration 1,011,569 1,046,773 992,004 (35,204) 54,769 Operations & Maintenance 675,460 665,903 612,642 9,557 53,261 Pupil Transportation 110,558 117,100 105,089 (6,542) 12,011 Central Services 521,339 551,579 511,680 (30,240) 39,899
Total Support Services 3,630,036 4,147,578 3,621,005 (517,542) 526,573
Community Services 1,585,234 1,547,943 1,299,604 37,291 248,339 Payments to Other Entities 351,298 337,230 337,193 (14,068) 37 Transfers to Other School Dist. - 12,900 12,900 12,900 - Facilities Acquisition - 12,940 12,928 12,940 12 Total Expenditures 7,688,809 8,306,942 7,218,823 (618,133) 1,088,119
Excess (deficiency) of Revenue Over Expenditures (671,188) (593,367) (584,095) 77,821 9,272
Other Financing Sources (Uses)Operating Transfers In 787,557 732,864 730,777 (54,693) (2,087) Operating Transfers Out (115,248) (167,628) (130,829) (52,380) 36,799 Total Other Financing
Sources (Uses) 672,309 565,236 599,948 (107,073) 34,712
Excess Revenues and Other SourcesOver (Under) Expenditures and Other Uses 1,121 (28,131) 15,853 (29,252) 43,984
Fund Balance - July 1 1,012,173 1,012,173 1,012,173 - -
Fund Balance - June 30 1,013,294$ 984,042$ 1,028,026$ (29,252)$ 43,984$
Budget AmountsVariances
NEWAYGO COUNTY REGIONAL EDUCATIONAL SERVICE AGENCY
Required Supplementary InformationBudgetary Comparison Schedule for the General Fund
For the Year Ended June 30, 2017
46

Original FinalOriginal Final Actual to Final to Actual
RevenuesLocal Sources 4,584,524$ 4,570,810$ 4,501,026$ (13,714)$ (69,784)$ State Sources 2,343,769 2,320,297 2,323,580 (23,472) 3,283 Federal Sources 2,483,173 2,571,453 2,303,279 88,280 (268,174) Interdistrict Sources 2,500 2,500 - - (2,500)
Total Revenues 9,413,966 9,465,060 9,127,885 51,094 (337,175)
ExpendituresInstruction 1,606,319 1,610,540 1,496,076 (4,221) 114,464
Support Services
Instruction 5,074,040 5,122,228 4,849,637 (48,188) 272,591 Administration 199,046 154,068 101,525 44,978 52,543 Operations & Maintenance 283,530 286,031 239,207 (2,501) 46,824 Pupil Transportation 5,600 5,700 4,014 (100) 1,686 Central Services 99,358 123,537 123,187 (24,179) 350
Total Support Services 5,661,574 5,691,564 5,317,570 (29,990) 373,994
Community Services 26,870 11,961 11,719 14,909 242 Transfers to Other School Dist. 1,837,548 1,947,928 1,947,928 110,380 -
Total Expenditures 9,132,311 9,261,993 8,773,293 (129,682) 488,700
Excess (deficiency) of Revenue Over Expenditures 281,655 203,067 354,592 (78,588) 151,525
Other Financing Sources (Uses)Operating Transfers Out (363,200) (339,885) (320,306) 23,315 19,579 Total Other Financing
Sources (Uses) (363,200) (339,885) (320,306) 23,315 19,579
Excess Revenues and Other SourcesOver (Under) Expenditures andOther Uses (81,545) (136,818) 34,286 (55,273) 171,104
Fund Balance - July 1 1,285,376 1,285,376 1,285,376 - -
Fund Balance - June 30 1,203,831$ 1,148,558$ 1,319,662$ (55,273)$ 171,104$
Budget AmountsVariances
NEWAYGO COUNTY REGIONAL EDUCATIONAL SERVICE AGENCY
Required Supplementary InformationBudgetary Comparison Schedule for the Special Education Special Revenue Fund
For the Year Ended June 30, 2017
47
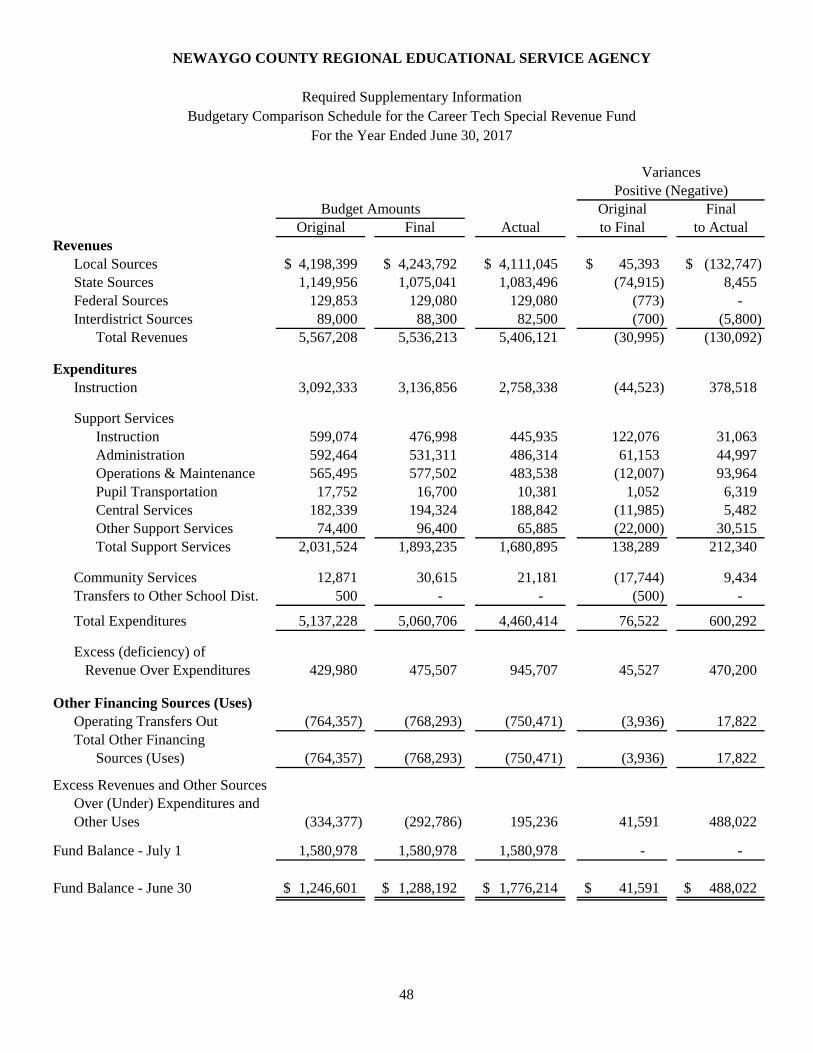
Original FinalOriginal Final Actual to Final to Actual
RevenuesLocal Sources 4,198,399$ 4,243,792$ 4,111,045$ 45,393$ (132,747)$ State Sources 1,149,956 1,075,041 1,083,496 (74,915) 8,455 Federal Sources 129,853 129,080 129,080 (773) - Interdistrict Sources 89,000 88,300 82,500 (700) (5,800)
Total Revenues 5,567,208 5,536,213 5,406,121 (30,995) (130,092)
ExpendituresInstruction 3,092,333 3,136,856 2,758,338 (44,523) 378,518
Support ServicesInstruction 599,074 476,998 445,935 122,076 31,063 Administration 592,464 531,311 486,314 61,153 44,997 Operations & Maintenance 565,495 577,502 483,538 (12,007) 93,964 Pupil Transportation 17,752 16,700 10,381 1,052 6,319 Central Services 182,339 194,324 188,842 (11,985) 5,482 Other Support Services 74,400 96,400 65,885 (22,000) 30,515
Total Support Services 2,031,524 1,893,235 1,680,895 138,289 212,340
Community Services 12,871 30,615 21,181 (17,744) 9,434 Transfers to Other School Dist. 500 - - (500) -
Total Expenditures 5,137,228 5,060,706 4,460,414 76,522 600,292
Excess (deficiency) of Revenue Over Expenditures 429,980 475,507 945,707 45,527 470,200
Other Financing Sources (Uses)(764,357) (768,293) (750,471) (3,936) 17,822
Total Other Financing Sources (Uses) (764,357) (768,293) (750,471) (3,936) 17,822
Excess Revenues and Other SourcesOver (Under) Expenditures andOther Uses (334,377) (292,786) 195,236 41,591 488,022
Fund Balance - July 1 1,580,978 1,580,978 1,580,978 - -
Fund Balance - June 30 1,246,601$ 1,288,192$ 1,776,214$ 41,591$ 488,022$
Operating Transfers Out
NEWAYGO COUNTY REGIONAL EDUCATIONAL SERVICE AGENCY
Required Supplementary InformationBudgetary Comparison Schedule for the Career Tech Special Revenue Fund
For the Year Ended June 30, 2017
Budget AmountsPositive (Negative)
Variances
48

2023 2022 2021 2020 2019 2018 2017 2016 2015 2014
A. Agency's proportion of net pension liability (%) ‐ ‐ ‐ ‐ ‐ ‐ ‐ .10152% .10100% 0.09390%
B. Agency's proportionate share of net pension liability ‐ ‐ ‐ ‐ ‐ ‐ ‐ 25,328,439$ 24,670,237$ 20,683,941$
C. Agency's covered-employee payroll ‐ ‐ ‐ ‐ ‐ ‐ ‐ 8,595,289$ 8,417,858$ 7,971,466$
D. Agency's proportionate share of net pension liability as a percentage of its covered-employee payroll (%) ‐ ‐ ‐ ‐ ‐ ‐ ‐ 294.67815% 293.07024% 259.47474%
E. Plan fiduciary net position as a percentage of total pension liability ‐ ‐ ‐ ‐ ‐ ‐ ‐ 63.27000% 63.17000% 66.20000%
Notes to the Required Supplementary Information
Changes of benefit terms: There were no changes of benefit terms.Changes of assumptions: There were no changes of benefit terms.
NEWAYGO COUNTY REGIONAL EDUCATIONAL SERVICE AGENCY
Required Supplementary Information
This schedule is to be built prospectively. Until a full 10-year trend is compiled, the schedule will show information for those years for which data is available, beginning with FYE June 30, 2015.
Schedule of Proportionate Share of the Net Pension LiabilityMichigan Public School Employees Retirement Plan
Last 10 Fiscal Years (Amounts were determined as of 9/30 of each fiscal year)
49

2024 2023 2022 2021 2020 2019 2018 2017 2016 2015
A. Statutorily required contributions -$ -$ -$ -$ -$ -$ -$ 1,562,616$ 1,676,489$ 1,824,855$
B. Contributions in relation to statutorily required contributions * - - - - - - - 1,562,616 1,676,489 1,824,855
C. Contribution deficiency (excess) -$ -$ -$ -$ -$ -$ -$ -$ -$ -$
D. Agency's covered-employee payroll -$ -$ -$ -$ -$ -$ -$ 8,972,498$ 8,492,496$ 8,385,350$
E. Contributions as a percentage of covered-employee payroll 17.41562% 19.74083% 21.76242%
This schedule is to be built prospectively. Until a full 10-year trend is compiled, the schedule will show information for those years for which data is available, beginning with FYE September 30, 2014.
* Contributions in relation to statutorily required contributions are the contributions the Agency actually made to MPSERS, which may differ from the statutorily required contributions.
NEWAYGO COUNTY REGIONAL EDUCATIONAL SERVICE AGENCY
Required Supplementary InformationSchedule of Contributions
Michigan Public School Employees Retirement PlanLast 10 Fiscal Years (Amounts determined as of 6/30 of each fiscal year)
50
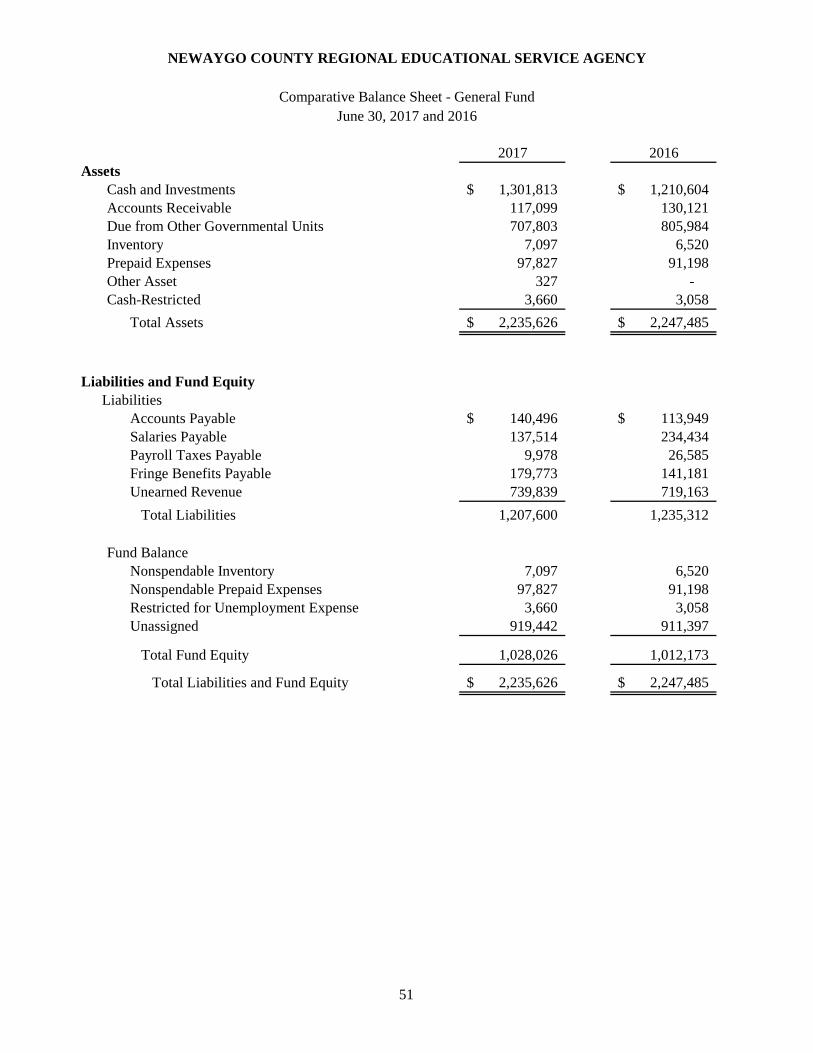
2017 2016Assets
1,301,813$ 1,210,604$ 117,099 130,121 707,803 805,984
Inventory 7,097 6,520 Prepaid Expenses 97,827 91,198 Other Asset 327 - Cash-Restricted 3,660 3,058
Total Assets 2,235,626$ 2,247,485$
Liabilities and Fund EquityLiabilities
Accounts Payable 140,496$ 113,949$ Salaries Payable 137,514 234,434 Payroll Taxes Payable 9,978 26,585 Fringe Benefits Payable 179,773 141,181 Unearned Revenue 739,839 719,163
Total Liabilities 1,207,600 1,235,312
Nonspendable Inventory 7,097 6,520 Nonspendable Prepaid Expenses 97,827 91,198 Restricted for Unemployment Expense 3,660 3,058
Unassigned 919,442 911,397
Total Fund Equity 1,028,026 1,012,173
Total Liabilities and Fund Equity 2,235,626$ 2,247,485$
NEWAYGO COUNTY REGIONAL EDUCATIONAL SERVICE AGENCY
Comparative Balance Sheet - General FundJune 30, 2017 and 2016
Fund Balance
Cash and InvestmentsAccounts ReceivableDue from Other Governmental Units
51

2017 2016
RevenuesLocal Sources
178,564$ 177,051$ 3,644 440
116,796 101,681 13,865 9,337
Community Service Activities 98,706 76,113 713,743 636,105 446,154 328,355 101,850 127,955
1,673,322 1,457,037
State Sources3,988,092 3,541,767
54,772 43,762
Total State Sources 4,042,864 3,585,529
Federal Sources130,186 141,996
33,142 30,691 25,828 24,841 65,866 95,853
113,358 80,000 Unemployment Insurance - 147,948 Race to the Top-Early Learning Challenge 15,300 -
340,839 305,163 65,129 81,491
Total Federal Sources 789,648 907,983
Interdistrict SourcesSaturday Detention 114,053 176,421 Professional Development Consortium 14,841 23,251
Total Interdistrict Sources 128,894 199,672
6,634,728$ 6,150,221$
For the Years Ended June 30, 2017 and 2016
Property Taxes - Current
Grants and Donations
WIA
Rental of Property
State Aid
Substance Use Disorder Prevention Services
Total Revenues
Small, Rural School Achievement
Employment Services
Drug Free Schools
Trade Act
Homeless Students
NEWAYGO COUNTY REGIONAL EDUCATIONAL SERVICE AGENCY
Comparative Statement of Revenues - General Fund
Interest on InvestmentsTuitionSales
Other State Grants
Miscellaneous
Total Local Sources
52
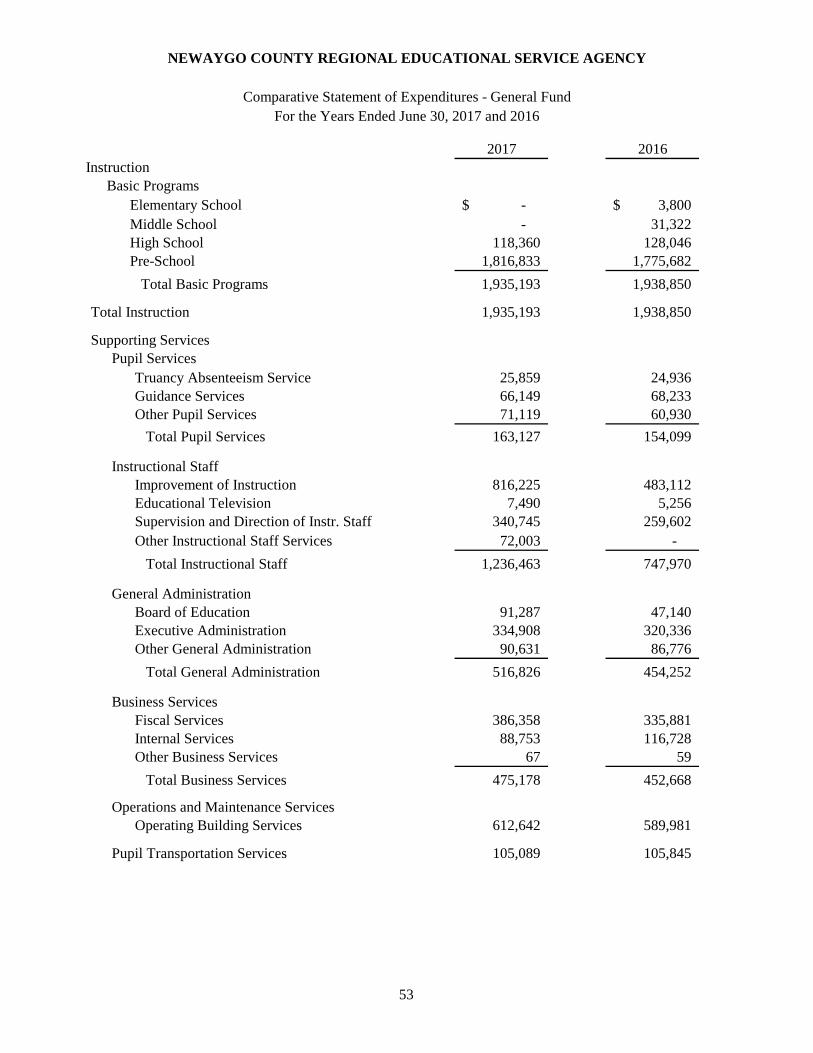
2017 2016Instruction
Basic ProgramsElementary School -$ 3,800$ Middle School - 31,322 High School 118,360 128,046 Pre-School 1,816,833 1,775,682
Total Basic Programs 1,935,193 1,938,850
1,935,193 1,938,850
Supporting ServicesPupil Services
Truancy Absenteeism Service 25,859 24,936 Guidance Services 66,149 68,233 Other Pupil Services 71,119 60,930
Total Pupil Services 163,127 154,099
Instructional StaffImprovement of Instruction 816,225 483,112 Educational Television 7,490 5,256 Supervision and Direction of Instr. Staff 340,745 259,602 Other Instructional Staff Services 72,003 -
Total Instructional Staff 1,236,463 747,970
General Administration Board of Education 91,287 47,140 Executive Administration 334,908 320,336 Other General Administration 90,631 86,776
Total General Administration 516,826 454,252
Business ServicesFiscal Services 386,358 335,881 Internal Services 88,753 116,728 Other Business Services 67 59
Total Business Services 475,178 452,668
Operations and Maintenance ServicesOperating Building Services 612,642 589,981
105,089 105,845 Pupil Transportation Services
NEWAYGO COUNTY REGIONAL EDUCATIONAL SERVICE AGENCY
Comparative Statement of Expenditures - General FundFor the Years Ended June 30, 2017 and 2016
Total Instruction
53

2017 2016Central Services
Planning, Research, Development and Evaluation 14,290$ 6,477$ Communication Services 21,233 24,037 Personnel Services 175,119 143,611 Information Management Services 242,085 202,196 Pupil Accounting 27,907 28,067 Other Central Services 31,046 -
Total Central 511,680 404,388
Total Support Services 3,621,005 2,909,203
Community ServicesCommunity Activities 720,169 796,408 Custody & Care of Children 185,836 175,497 Other Community Services 393,599 487,407
Total Community Services 1,299,604 1,459,312
Payments to Other Entities 337,193 358,989
Transfers to Other School Districts 12,900 358,989
Facilities AcquisitionBuilding Acquisition and Construction services 12,928 275,196
Total Facilities Acquisition 12,928 275,196
Total Expenditures 7,218,823$ 6,941,550$
Comparative Statement of Expenditures - General Fund (Continued)
54

2017 2016Assets
1,302,207$ 1,615,898$ - 1,493
992,156 669,658 Inventory 15,875 14,585
63,562 64,714 47,948 47,103
Total Assets 2,421,748$ 2,413,451$
Liabilities and Fund Equity
LiabilitiesAccounts Payable 89,963$ 33,116$ Salaries Payable 419,769 553,094 Payroll Taxes Payable 28,701 40,141 Fringe Benefits Payable 381,332 374,809 Unearned Revenue 12,371 2,684 Due to Other School Districts 169,950 124,231
Total Liabilities 1,102,086 1,128,075
Non-Spendable for Inventory 15,875 14,585 Non-Spendable for Prepaid Expenses 63,562 64,714 Restricted for Unemployment Expense 47,948 47,103
Restricted for Fund Purposes 1,192,277 1,158,974
Total Fund Equity 1,319,662 1,285,376
Total Liabilities and Fund Equity 2,421,748$ 2,413,451$
NEWAYGO COUNTY REGIONAL EDUCATIONAL SERVICE AGENCY
Comparative Balance Sheet - Special Education Major Special Revenue FundJune 30, 2017 and 2016
Fund Balance
Cash and InvestmentsAccounts Receivable
Cash-Restricted
Due from Other Governmental Units
Prepaid Expenses
55

2017 2016
RevenuesLocal Sources
3,966,932$ 3,933,169$ 3,970 1,185
517,856 467,964 696 -
10,228 26,144 1,344 7,793
4,501,026 4,436,255
State Sources 2,323,580 2,374,671
Federal Sources
1,989,373 1,990,670 100,032 95,051 100,000 100,000
P.L. 94-457 - Infant and Toddler Formula Grant 85,967 79,692 Medicaid Outreach 27,907 18,242
Total Federal Sources 2,303,279 2,283,655
Total Revenues 9,127,885$ 9,094,581$
Grants and Donations
Comparative Statement of Revenue - Special Education Major Special Revenue Fund
NEWAYGO COUNTY REGIONAL EDUCATIONAL SERVICE AGENCY
For the Years Ended June 30, 2017 and 2016
Property Taxes - Current
Merchandise Sales
P.L. 94-142 - State Initiative/TS
Interest on InvestmentsSchool Based Services
P.L. 94-142 - Preschool IncentiveP.L. 94-142 - IDEA Flow Through
State Aid
Miscellaneous
Total Local Sources
56

2017 2016Instruction
Added NeedsSpecial Education 1,496,076$ 1,479,565$
1,496,076 1,479,565 Supporting Services
Pupil ServicesGuidance Services 7,251 6,943 Health Services 593,450 576,532 Psychological Services 459,352 531,940 Speech Therapist 1,720,338 1,698,241 Social Work Services 245,654 233,959 Visual Aid Services 24,219 13,213 Teacher Consultant 992,807 1,041,931 Other Pupil Services 51,632 57,977
Total Pupil Services 4,094,703 4,160,736 Instructional Staff
Improvement of Instruction 55,637 59,155 Supervision and Direction of Instructional Staff 699,297 707,688
Total Instructional Staff 754,934 766,843
General AdministrationBoard of Education 12,222 49,041
Total General Administration 12,222 49,041
Business ServicesFiscal Services 360 584 Internal Services 62,190 92,109 Other Business Services 26,753 26,742
Total Business Services 89,303 119,435
Operations and Maintenance Services 239,207 273,703
4,014 2,871
Central ServicesPlanning, Research, Development and Evaluation 56,369 54,471 Information Management Services 66,818 60,825
Total Central 123,187 115,296 Community Services
Other Community Services 11,719 16,437
Total Community Services 11,719 16,437
Total Support Services 5,329,289 5,504,362
Total Expenditures 6,825,365$ 6,983,927$
Pupil Transportation Services
Total Instruction
NEWAYGO COUNTY REGIONAL EDUCATIONAL SERVICE AGENCY
Comparative Statement of Expenditures - Special Education Major Special Revenue FundFor the Years Ended June 30, 2017 and 2016
57

2017 2016Assets
1,791,980$ 1,662,002$ 52,078 38,386
234,776 293,441 34,606 32,823 27,646 32,996
7,945 7,643
Total Assets 2,149,031$ 2,067,291$
Liabilities and Fund EquityLiabilities
Accounts Payable 23,233$ 33,640$ Salaries Payable 160,575 267,878 Payroll Taxes Payable 10,630 19,058 Fringe Benefits Payable 152,879 162,921 Unearned Revenue 25,500 2,816
Total Liabilities 372,817 486,313
Non-Spendable for Inventory 34,606 32,823 Non-Spendable for Prepaid Expenses 27,646 32,996 Restricted for Unemployment Expense 7,945 7,643 Restricted for Fund Purposes 1,706,017 1,507,517
Total Fund Equity 1,776,214 1,580,978
Total Liabilities and Fund Equity 2,149,031$ 2,067,291$
NEWAYGO COUNTY REGIONAL EDUCATIONAL SERVICE AGENCY
Comparative Balance Sheet - Career Tech Major Special Revenue FundJune 30, 2017 and 2016
Fund Equity
Cash and Investments
Cash-Restricted
Due from Other Governmental UnitsAccounts Receivable
InventoryPrepaid Expenses
58

2017 2016
RevenuesLocal Sources
3,966,733$ 3,933,170$ 4,886 1,546
89,666 92,926 32,079 22,820 17,681 13,301
4,111,045 4,063,763
State Sources1,083,496 1,288,931
1,083,496 1,288,931
Federal Sources129,080 125,481
Total Federal Sources 129,080 125,481
Interdistrict Sources
Out of District Tuition 82,500 91,530
Total Interdistrict Sources 82,500 91,530
5,406,121$ 5,569,705$
NEWAYGO COUNTY REGIONAL EDUCATIONAL SERVICE AGENCY
Carl Perkins
State Aid
Miscellaneous
Total Local Sources
Interest on InvestmentsSales
Comparative Statement of Revenue - Career Tech Major Special Revenue FundFor the Years Ended June 30, 2017 and 2016
Property Taxes - Current
Total Revenues
Grants and Donations
59
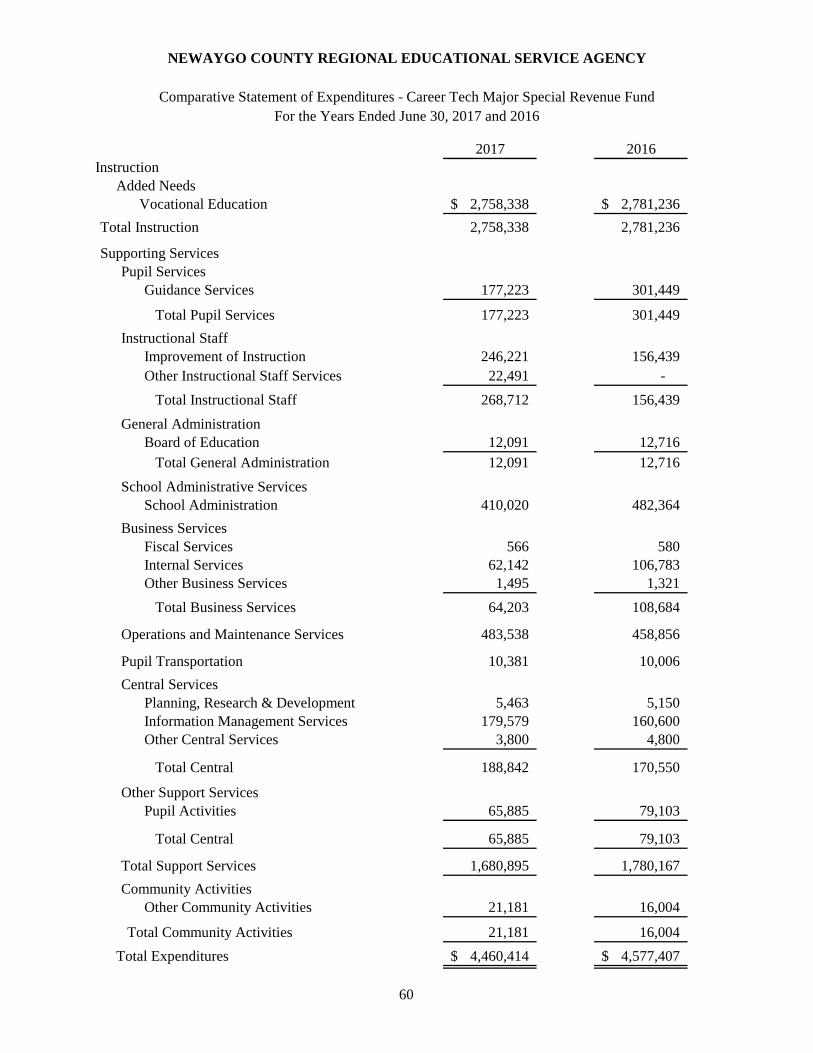
2017 2016Instruction
Added NeedsVocational Education 2,758,338$ 2,781,236$
2,758,338 2,781,236
Supporting ServicesPupil Services
Guidance Services 177,223 301,449
Total Pupil Services 177,223 301,449
Instructional StaffImprovement of Instruction 246,221 156,439 Other Instructional Staff Services 22,491 -
Total Instructional Staff 268,712 156,439
General AdministrationBoard of Education 12,091 12,716
Total General Administration 12,091 12,716
School Administrative ServicesSchool Administration 410,020 482,364
Business ServicesFiscal Services 566 580 Internal Services 62,142 106,783 Other Business Services 1,495 1,321
Total Business Services 64,203 108,684
Operations and Maintenance Services 483,538 458,856
Pupil Transportation 10,381 10,006
Central ServicesPlanning, Research & Development 5,463 5,150 Information Management Services 179,579 160,600 Other Central Services 3,800 4,800
Total Central 188,842 170,550
Other Support ServicesPupil Activities 65,885 79,103
Total Central 65,885 79,103
Total Support Services 1,680,895 1,780,167
Community ActivitiesOther Community Activities 21,181 16,004
Total Community Activities 21,181 16,004
Total Expenditures 4,460,414$ 4,577,407$
Total Instruction
NEWAYGO COUNTY REGIONAL EDUCATIONAL SERVICE AGENCY
Comparative Statement of Expenditures - Career Tech Major Special Revenue FundFor the Years Ended June 30, 2017 and 2016
60

2017 2016
Assets2,315,614$ 2,696,237$
Total Assets 2,315,614$ 2,696,237$
Liabilities and Fund EquityLiabilities
Accounts Payable 201,257$ 596$
Total Liabilities 201,257 596
Commited for Career Tech Project 1,000,000 1,000,000 Assigned for General Fund 30,100 30,000 Assigned for Special Ed Fund 443,737 495,072 Assigned for Career Tech Fund (142,811) 363,057 Assigned for NCATS Fund 783,331 807,511
Total Fund Equity 2,114,357 2,695,641
Total Liabilities and Fund Equity 2,315,614$ 2,696,237$
NEWAYGO COUNTY REGIONAL EDUCATIONAL SERVICE AGENCY
Comparative Balance Sheet - Capital Projects Major FundJune 30, 2017 and 2016
Fund Equity
Cash and Investments
61

2017 2016
RevenuesLocal Sources
9,566$ 4,143$ 26,829 125,000
36,395 129,143
ExpendituresSupporting Services
Facilities AcquisitionBuilding Improvement Services 836,407 785,535 Other Facility Acquisition Services 121,270 144,282
Total Expenditures 957,677 929,817
Excess Revenues Over (Under) Expenditures (921,282) (800,673)
Other Financing Sources (Uses)Transfers In 340,000 365,000
Total Other Financing Sources (Uses) 340,000 365,000
Excess Revenues and Other Financing SourcesOver (Under) Expenditures and OtherFinancing Uses (581,282) (435,673)
Fund Balance - July 1 2,695,639 3,131,313
Fund Balance - June 30 2,114,357$ 2,695,640$
Miscellaneous
NEWAYGO COUNTY REGIONAL EDUCATIONAL SERVICE AGENCY
Total Revenues
Comparative Statement of Revenues, Expenditures and Changesin Fund Balances - Major Capital Projects Fund
For the Years Ended June 30, 2017 and 2016
Interest on Investments
62

2017 2016
Assets1$ 25,932$
Total Assets 1$ 25,932$
Liabilities and Fund Equity
Restricted for Debt Service 1$ 25,932
Total Liabilities and Fund Equity 1$ 25,932$
NEWAYGO COUNTY REGIONAL EDUCATIONAL SERVICE AGENCY
Comparative Balance Sheet - Non-Major Debt Retirement FundJune 30, 2017 and 2016
Fund Equity
Cash and Investments
63

2017 2016
RevenuesLocal Sources
29$ 39$
29 39
ExpendituresDebt Service
Principal Retired 130,000 125,000 Interest Expense 26,775 29,775 Dues and Fees 14 50
Total Expenditures 156,789 154,825
Excess Revenues Over (Under) Expenditures (156,760) (154,786)
Other Financing Sources (Uses)Transfers In 130,829 87,000
Total Other Financing Sources (Uses) 130,829 87,000
Excess Revenues and Other Financing SourcesOver (Under) Expenditures and OtherFinancing Uses (25,931) (67,786)
Fund Balance - July 1 25,932 93,718
Fund Balance - June 30 1$ 25,932$
Total Revenues
NEWAYGO COUNTY REGIONAL EDUCATIONAL SERVICE AGENCY
Comparative Statement of Revenues, Expenditures and Changesin Fund Balances - Non-Major Debt Retirement Fund
For the Years Ended June 30, 2017 and 2016
Interest on Investments
64

2017 2016
AssetsCurrent Assets
Cash and Investments 1,388,171$ 1,215,805$ Accounts Receivable 23,832 18,885 Prepaid Expenses 14,076 12,622 Cash-Restricted 8,321 8,199
Total Current Assets 1,434,400 1,255,511
Noncurrent AssetsEquipment and Furniture 170,304 178,529 Site Improvements 5,317 5,317 Vehicles 51,550 23,225 Accumulated Depreciation (111,442) (117,124)
Total Noncurrent Assets 115,729 89,947 Total Assets 1,550,129 1,345,458
Deferred Outflows of ResourcesDeferred Outflows of Resources Related to Pensions 296,268 281,358
Liabilities and Net PositionLiabilities
Current LiabilitiesAccounts Payable 28,410 19,184 Salaries Payable 463 29,540 Payroll Taxes Payable 36 2,188 Fringe Benefits Payable 19,112 16,434
Total Current Liabilities 48,021 67,346
Noncurrent LiabilitiesAccrued Compensated Absences 3,122 24,325 Net Pension Liability 1,815,331 1,766,878
Total Noncurrent Liabilities 1,818,453 1,791,203
Total Liabilities 1,866,474 1,858,549
Deferred Inflows of ResourcesDeferred Inflows of Resources Related to Pensions 61,983 54,005
Net PositionInvested in Capital Assets, Net of Related Debt 115,729 89,947 Unrestricted Net Position (197,789) (375,685)
Total Net Position (82,060)$ (285,738)$
NEWAYGO COUNTY REGIONAL EDUCATIONAL SERVICE AGENCY
Advanced Technology Services FundJune 30, 2017 and 2016
Comparative Statement of Net Position - Newaygo County
65

2017 2016Operating Revenues
Local SourcesCharges for Services 2,279,232$ 2,022,205$
Total Local Sources 2,279,232 2,022,205
Operating ExpendituresAdult Education
Occupational Training 1,831 468 Total Instruction 1,831 468
Supporting ServicesGeneral Administration
Board of Education 4,826 4,336
Business ServicesFiscal Services 52,053 47,895 Other Business Services 12,616 14,684
Total Business Services 64,669 62,579 Operations and Maintenance Services
Depreciation 10,174 7,153 Operating Building Services 98,387 103,529
Total Operations and Maintenance 108,561 110,682
Central ServicesPersonnel Services 15,471 8,843 Technical Support 1,883,328 1,737,962
Total Central 1,898,799 1,746,805
Total Support Services 2,076,855 1,924,402
Total Operating Expenses 2,078,686 1,924,870
Operating Income (Loss) 200,546 97,335
Non-Operating Revenues (Expenses)Interest and Dividends 2,347 665 Sale of Capital Assets 785 -
Total Non-Operating Revenues (Expenses) 3,132 665
Change in Net Position 203,678 98,000
Net Position - July 1 (285,738) (383,738)
Net Position - June 30 (82,060)$ (285,738)$
NEWAYGO COUNTY REGIONAL EDUCATIONAL SERVICE AGENCY
Comparative Statement of Revenues, Expenses, and Changes in Net PositionNewaygo County Advanced Technology Services, Major Enterprise Fund
For the Years Ended June 30, 2017 and 2016
66
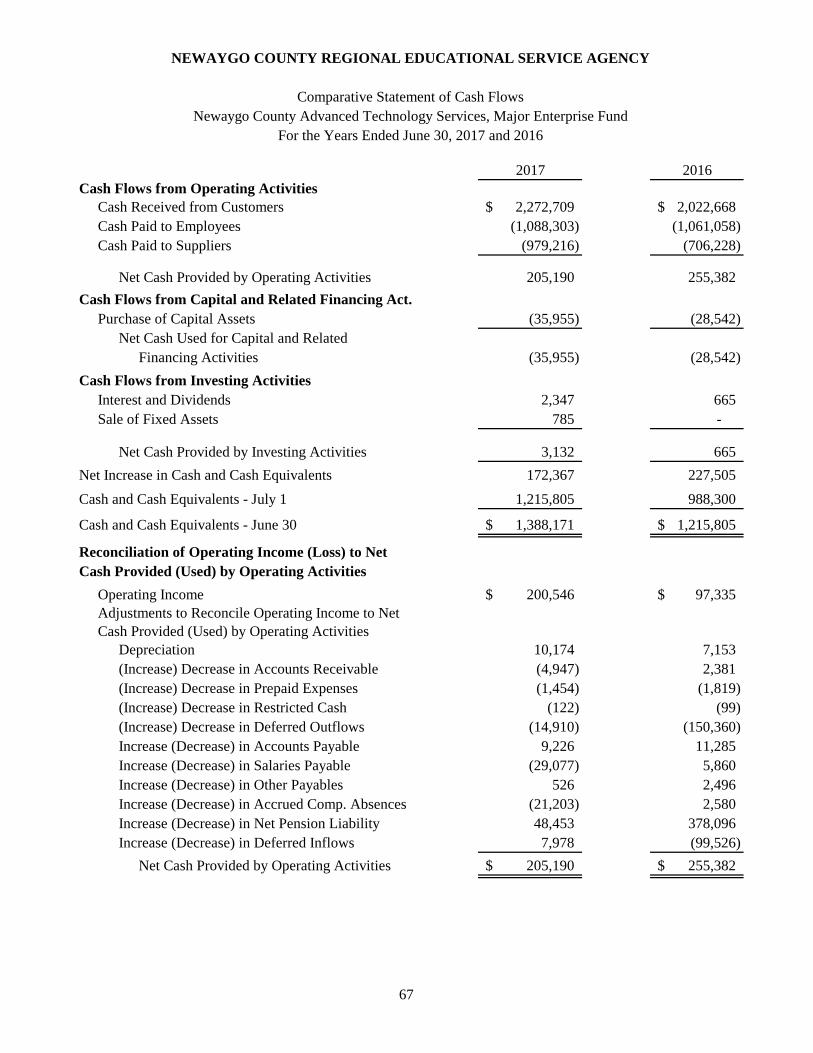
2017 2016Cash Flows from Operating Activities
Cash Received from Customers 2,272,709$ 2,022,668$ Cash Paid to Employees (1,088,303) (1,061,058) Cash Paid to Suppliers (979,216) (706,228)
205,190 255,382
Cash Flows from Capital and Related Financing Act. Purchase of Capital Assets (35,955) (28,542)
Net Cash Used for Capital and Related Financing Activities (35,955) (28,542)
Cash Flows from Investing ActivitiesInterest and Dividends 2,347 665 Sale of Fixed Assets 785 -
3,132 665
172,367 227,505
Cash and Cash Equivalents - July 1 1,215,805 988,300
Cash and Cash Equivalents - June 30 1,388,171$ 1,215,805$
Reconciliation of Operating Income (Loss) to Net Cash Provided (Used) by Operating Activities
Operating Income 200,546$ 97,335$ Adjustments to Reconcile Operating Income to NetCash Provided (Used) by Operating Activities
Depreciation 10,174 7,153 (Increase) Decrease in Accounts Receivable (4,947) 2,381 (Increase) Decrease in Prepaid Expenses (1,454) (1,819) (Increase) Decrease in Restricted Cash (122) (99) (Increase) Decrease in Deferred Outflows (14,910) (150,360) Increase (Decrease) in Accounts Payable 9,226 11,285
Increase (Decrease) in Salaries Payable (29,077) 5,860 Increase (Decrease) in Other Payables 526 2,496
Increase (Decrease) in Accrued Comp. Absences (21,203) 2,580 Increase (Decrease) in Net Pension Liability 48,453 378,096 Increase (Decrease) in Deferred Inflows 7,978 (99,526)
Net Cash Provided by Operating Activities 205,190$ 255,382$
NEWAYGO COUNTY REGIONAL EDUCATIONAL SERVICE AGENCY
Newaygo County Advanced Technology Services, Major Enterprise FundFor the Years Ended June 30, 2017 and 2016
Comparative Statement of Cash Flows
Net Increase in Cash and Cash Equivalents
Net Cash Provided by Operating Activities
Net Cash Provided by Investing Activities
67

2017 2016
AssetsCurrent Assets
Cash and Investments 346,384$ 351,347$ Accounts Receivable - 181
Total Current Assets 346,384 351,528
Non-Current AssetsEquipment and Furniture 118,864 118,864 Accumulated Depreciation (40,503) (26,208)
Total Non-Current Assets 78,361 92,656
Total Assets 424,745 444,184
Liabilities and Fund EquityCurrent Liabilities
Current Portion Long-Term Debt 26,000 24,876
Total Current Liabilities 26,000 24,876
Non-Current LiabilitiesLong-Term Debt 13,795 39,795
Total Liabilities 39,795 64,671
Net Position Unrestricted Net Position 384,950 379,513
Total Net Position 384,950$ 379,513$
NEWAYGO COUNTY REGIONAL EDUCATIONAL SERVICE AGENCY
Internal Service FundJune 30, 2017 and 2016
Statement of Net Position - Office Services
68
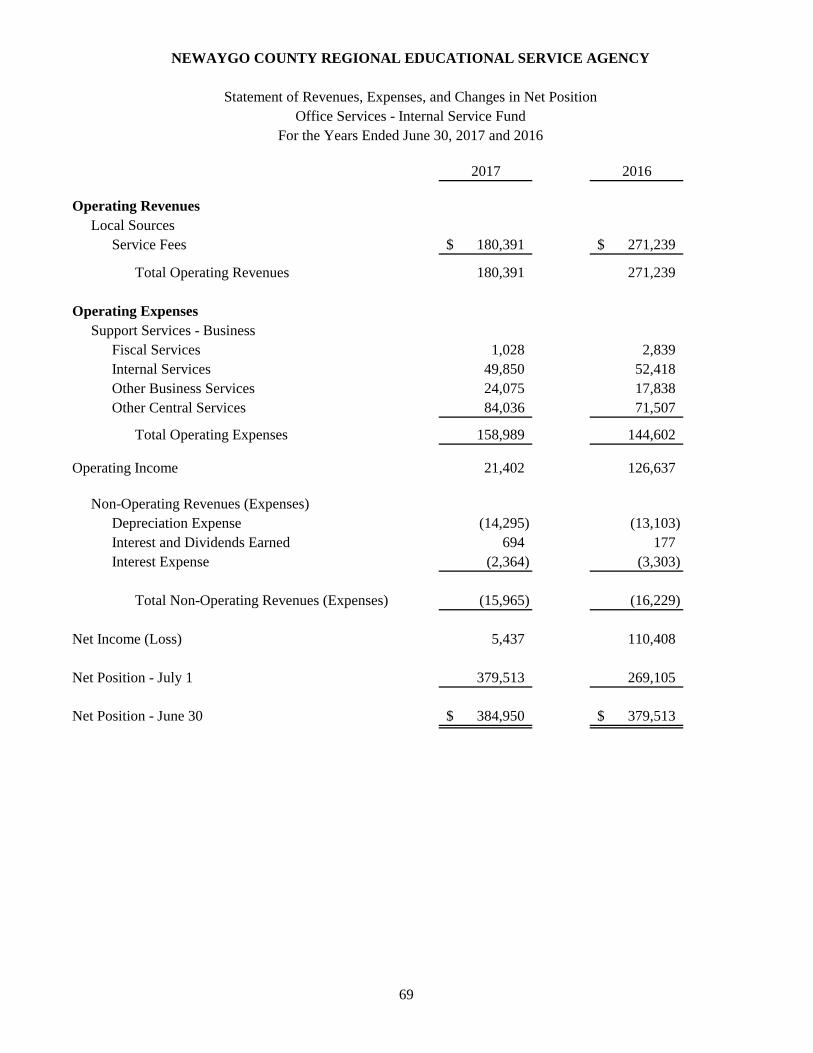
2017 2016
Operating RevenuesLocal Sources
Service Fees 180,391$ 271,239$
Total Operating Revenues 180,391 271,239
Operating ExpensesSupport Services - Business
Fiscal Services 1,028 2,839 Internal Services 49,850 52,418 Other Business Services 24,075 17,838 Other Central Services 84,036 71,507
Total Operating Expenses 158,989 144,602
Operating Income 21,402 126,637
Non-Operating Revenues (Expenses)Depreciation Expense (14,295) (13,103) Interest and Dividends Earned 694 177 Interest Expense (2,364) (3,303)
Total Non-Operating Revenues (Expenses) (15,965) (16,229)
Net Income (Loss) 5,437 110,408
Net Position - July 1 379,513 269,105
Net Position - June 30 384,950$ 379,513$
NEWAYGO COUNTY REGIONAL EDUCATIONAL SERVICE AGENCY
Office Services - Internal Service FundFor the Years Ended June 30, 2017 and 2016
Statement of Revenues, Expenses, and Changes in Net Position
69
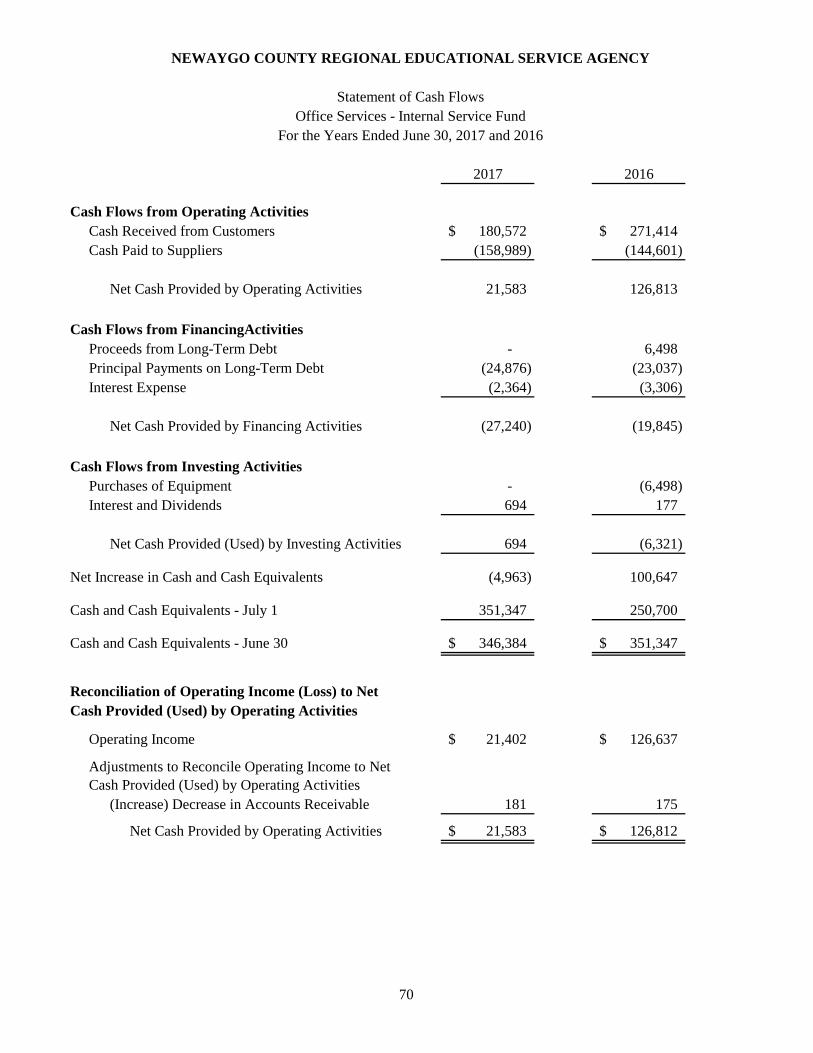
2017 2016
Cash Flows from Operating ActivitiesCash Received from Customers 180,572$ 271,414$ Cash Paid to Suppliers (158,989) (144,601)
Net Cash Provided by Operating Activities 21,583 126,813
Cash Flows from FinancingActivities
Proceeds from Long-Term Debt - 6,498 Principal Payments on Long-Term Debt (24,876) (23,037) Interest Expense (2,364) (3,306)
Net Cash Provided by Financing Activities (27,240) (19,845)
Cash Flows from Investing ActivitiesPurchases of Equipment - (6,498) Interest and Dividends 694 177
Net Cash Provided (Used) by Investing Activities 694 (6,321)
(4,963) 100,647
Cash and Cash Equivalents - July 1 351,347 250,700
Cash and Cash Equivalents - June 30 346,384$ 351,347$
Reconciliation of Operating Income (Loss) to Net Cash Provided (Used) by Operating Activities
Operating Income 21,402$ 126,637$
Adjustments to Reconcile Operating Income to NetCash Provided (Used) by Operating Activities
(Increase) Decrease in Accounts Receivable 181 175
Net Cash Provided by Operating Activities 21,583$ 126,812$
NEWAYGO COUNTY REGIONAL EDUCATIONAL SERVICE AGENCY
Office Services - Internal Service FundFor the Years Ended June 30, 2017 and 2016
Statement of Cash Flows
Net Increase in Cash and Cash Equivalents
70

2017 2016
AssetsCurrent Assets
Cash and Investments 49,354$ 44,432$
Total Assets 49,354$ 44,432$
Liabilities and Fund EquityCurrent Liabilities
Due to Student Group Cosmetology 7,558$ 7,558$
Graphic Arts 21 - Business 8,485 8,410 Scholarship 33,290 28,464
Total Liabilities 49,354$ 44,432$
NEWAYGO COUNTY REGIONAL EDUCATIONAL SERVICE AGENCY
Student Activities Fiduciary Fund - Agency FundJune 30, 2017 and 2016
Comparative Balance Sheet
71
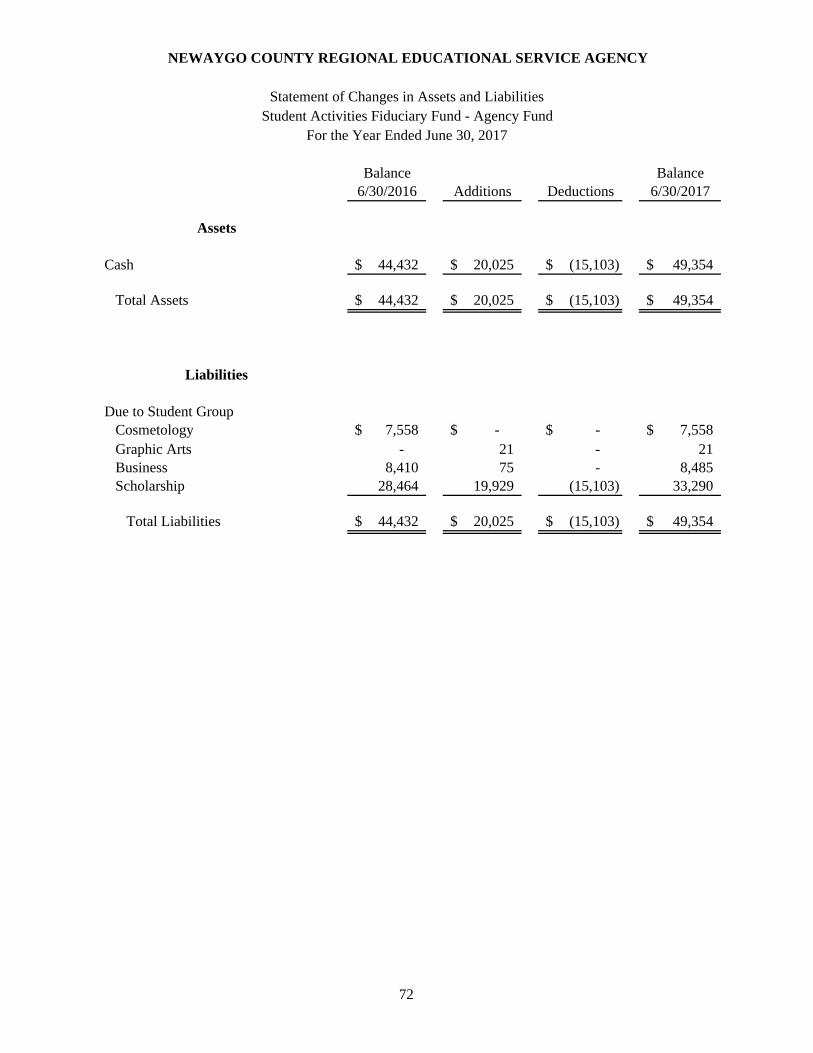
Balance Balance6/30/2016 Additions Deductions 6/30/2017
Assets
Cash 44,432$ 20,025$ (15,103)$ 49,354$
Total Assets 44,432$ 20,025$ (15,103)$ 49,354$
Liabilities
Due to Student Group Cosmetology 7,558$ -$ -$ 7,558$
Graphic Arts - 21 - 21 Business 8,410 75 - 8,485 Scholarship 28,464 19,929 (15,103) 33,290
Total Liabilities 44,432$ 20,025$ (15,103)$ 49,354$
NEWAYGO COUNTY REGIONAL EDUCATIONAL SERVICE AGENCY
Statement of Changes in Assets and Liabilities
For the Year Ended June 30, 2017Student Activities Fiduciary Fund - Agency Fund
72
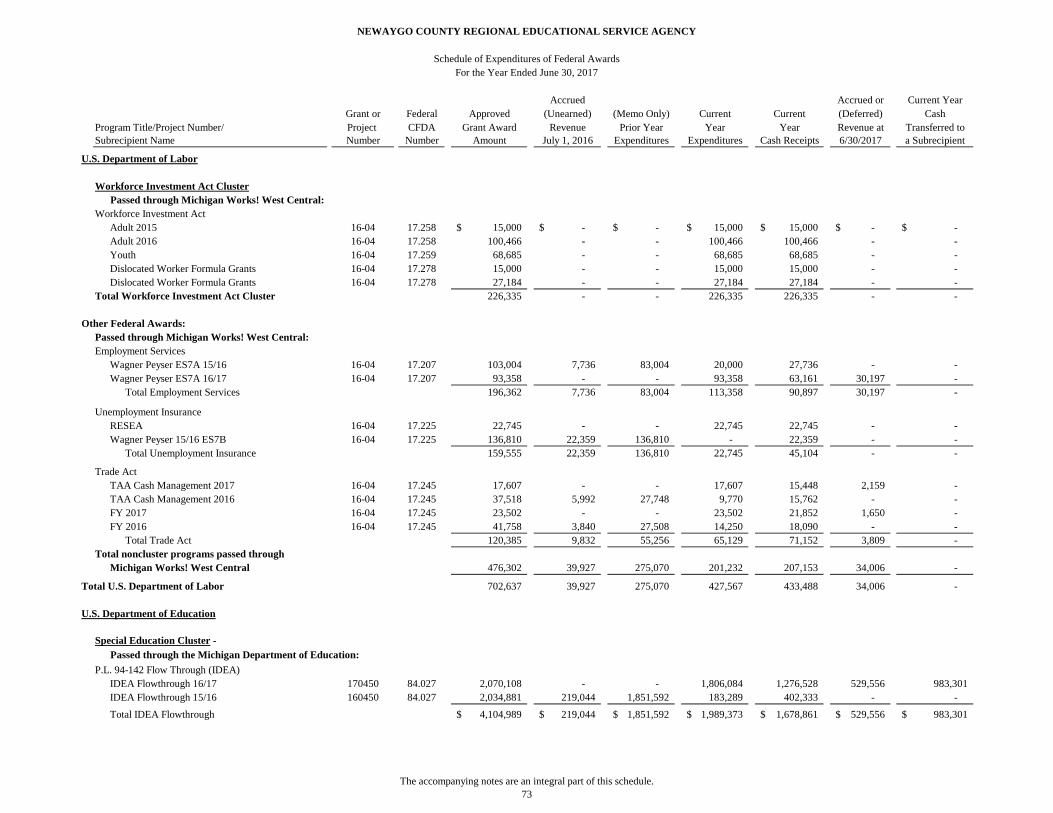
Accrued Accrued or Current YearGrant or Federal Approved (Unearned) (Memo Only) Current Current (Deferred) Cash
Program Title/Project Number/ Project CFDA Grant Award Revenue Prior Year Year Year Revenue at Transferred toSubrecipient Name Number Number Amount July 1, 2016 Expenditures Expenditures Cash Receipts 6/30/2017 a Subrecipient
U.S. Department of Labor
Workforce Investment Act ClusterPassed through Michigan Works! West Central:
Workforce Investment ActAdult 2015 16-04 17.258 15,000$ -$ -$ 15,000$ 15,000$ -$ -$ Adult 2016 16-04 17.258 100,466 - - 100,466 100,466 - - Youth 16-04 17.259 68,685 - - 68,685 68,685 - - Dislocated Worker Formula Grants 16-04 17.278 15,000 - - 15,000 15,000 - - Dislocated Worker Formula Grants 16-04 17.278 27,184 - - 27,184 27,184 - -
Total Workforce Investment Act Cluster 226,335 - - 226,335 226,335 - -
Other Federal Awards:Passed through Michigan Works! West Central:Employment Services
Wagner Peyser ES7A 15/16 16-04 17.207 103,004 7,736 83,004 20,000 27,736 - - Wagner Peyser ES7A 16/17 16-04 17.207 93,358 - - 93,358 63,161 30,197 -
Total Employment Services 196,362 7,736 83,004 113,358 90,897 30,197 -
Unemployment InsuranceRESEA 16-04 17.225 22,745 - - 22,745 22,745 - - Wagner Peyser 15/16 ES7B 16-04 17.225 136,810 22,359 136,810 - 22,359 - -
Total Unemployment Insurance 159,555 22,359 136,810 22,745 45,104 - -
Trade ActTAA Cash Management 2017 16-04 17.245 17,607 - - 17,607 15,448 2,159 - TAA Cash Management 2016 16-04 17.245 37,518 5,992 27,748 9,770 15,762 - - FY 2017 16-04 17.245 23,502 - - 23,502 21,852 1,650 - FY 2016 16-04 17.245 41,758 3,840 27,508 14,250 18,090 - -
Total Trade Act 120,385 9,832 55,256 65,129 71,152 3,809 - Total noncluster programs passed through
Michigan Works! West Central 476,302 39,927 275,070 201,232 207,153 34,006 -
Total U.S. Department of Labor 702,637 39,927 275,070 427,567 433,488 34,006 -
U.S. Department of Education
Special Education Cluster -
Passed through the Michigan Department of Education:
P.L. 94-142 Flow Through (IDEA)IDEA Flowthrough 16/17 170450 84.027 2,070,108 - - 1,806,084 1,276,528 529,556 983,301 IDEA Flowthrough 15/16 160450 84.027 2,034,881 219,044 1,851,592 183,289 402,333 - -
Total IDEA Flowthrough 4,104,989$ 219,044$ 1,851,592$ 1,989,373$ 1,678,861$ 529,556$ 983,301$
NEWAYGO COUNTY REGIONAL EDUCATIONAL SERVICE AGENCY
Schedule of Expenditures of Federal AwardsFor the Year Ended June 30, 2017
The accompanying notes are an integral part of this schedule.73

Accrued Accrued or Current YearGrant or Federal Approved (Unearned) (Memo Only) Current Current (Deferred) Cash
Program Title/Project Number/ Project CFDA Grant Award Revenue Prior Year Year Year Revenue at Transferred toSubrecipient Name Number Number Amount July 1, 2016 Expenditures Expenditures Cash Receipts 6/30/2017 a Subrecipient
Schedule of Expenditures of Federal Awards (Continued)
P.L. 94-142 Preschool IncentiveIDEA Preschool Incentive 14/15 150460 84.173 95,774$ 346$ 95,089$ 685$ 1,031$ -$ -$ IDEA Preschool Incentive 15/16 160460 84.173 95,741 - 94,234 1,507 1,507 - - IDEA Preschool Incentive 16/17 170460 84.173 97,840 - - 97,840 97,840 - -
Total IDEA Preschool Incentive 289,355 346 189,323 100,032 100,378 - -
State Initiated/DepartmentEOSD 16/17 170480 84.027 50,000 - - 50,000 48,299 1,701 - EOSD 15/16 160480 84.027 50,000 1,963 50,000 - 1,963 - - TS 16/17 170490 84.027 50,000 - - 50,000 46,710 3,290 - TS 15/16 160490 84.027 50,000 1,813 50,000 - 1,813 - - Total State Initiated/Department 200,000 3,776 100,000 100,000 98,785 4,991 -
Total Special Education Cluster 4,594,344 223,166 2,140,915 2,189,405 1,878,024 534,547 983,301
Direct FundingSmall, Rural School Achievement S358A 162821 84.358A 25,828 - - 25,828 25,828 - - Small, Rural School Achievement S358A 162821 84.358A 24,841 15,276 24,841 - 15,276 - -
Total Direct Funding - U.S. Department of Education 50,669 15,276 24,841 25,828 41,104 - -
Other Federal Awards:Passed through the Michigan Department of Education:
Education for Homeless Children & Youth 16/17 172320 84.196 63,922 - - 20,893 19,207 1,686 - Education for Homeless Children & Youth 15/16 162320 84.196 52,900 873 26,032 12,250 13,123 - -
Total Education for Homeless Children & Youth 116,822 873 26,032 33,143 32,330 1,686 -
P.L. 94-457 Infant and Toddler Formula (Early On)Infant & Toddler 16/17 171340 84.181 90,116 - - 85,966 81,572 4,394 - Infant & Toddler 15/16 161340 84.181 88,142 3,870 79,692 1 3,871 - -
Total Infant & Toddler 178,258 3,870 79,692 85,967 85,443 4,394 -
Total noncluster programs passed throughthe Michigan Department of Education 295,080 4,743 105,724 119,110 117,773 6,080 -
Passed through Calhoun ISD:Title IID
Data for Student Success 094260 84.318 8,000 (4,808) 3,192 - - (4,808) - Total noncluster programs passed through
Calhoun ISD 8,000 (4,808) 3,192 - - (4,808) -
Passed through MOISD:
Carl Perkins MOISD 093520-8016 84.048A 129,080 - - 129,080 129,080 - -
Total noncluster programs passed through MOISD 129,080$ -$ -$ 129,080$ 129,080$ -$ -$
The accompanying notes are an integral part of this schedule.74
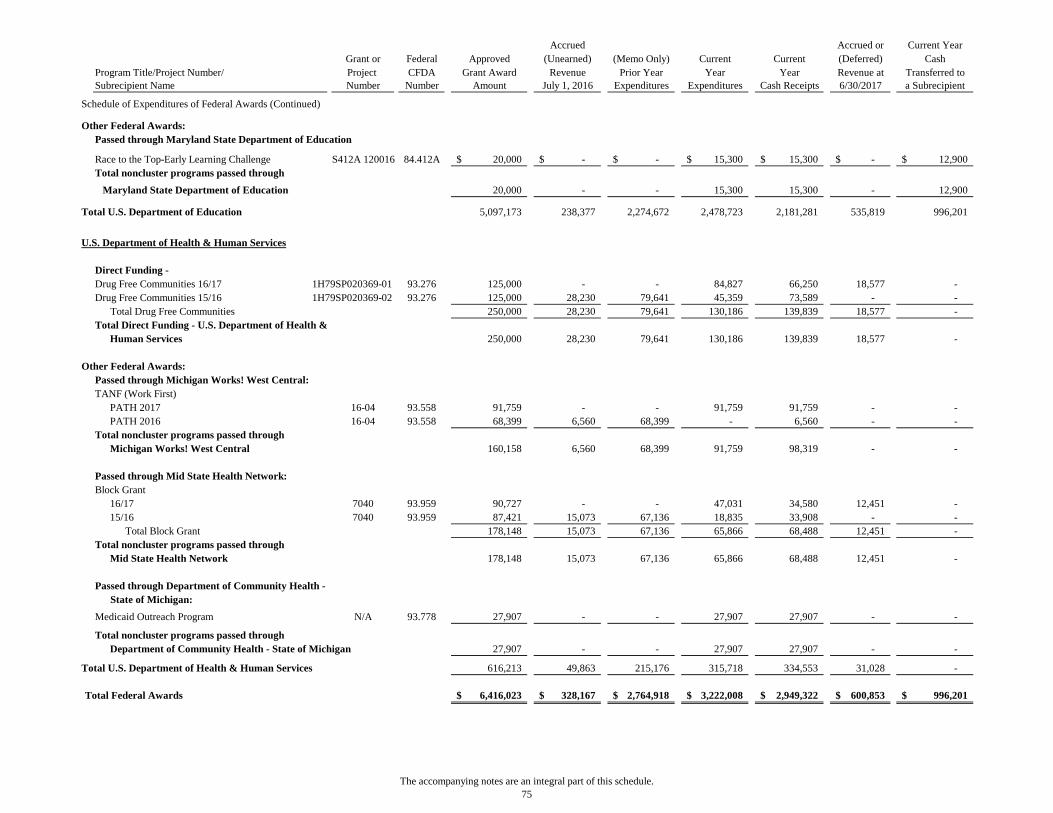
Accrued Accrued or Current YearGrant or Federal Approved (Unearned) (Memo Only) Current Current (Deferred) Cash
Program Title/Project Number/ Project CFDA Grant Award Revenue Prior Year Year Year Revenue at Transferred toSubrecipient Name Number Number Amount July 1, 2016 Expenditures Expenditures Cash Receipts 6/30/2017 a Subrecipient
Schedule of Expenditures of Federal Awards (Continued)
Other Federal Awards:Passed through Maryland State Department of Education
Race to the Top-Early Learning Challenge S412A 120016 84.412A 20,000$ -$ -$ 15,300$ 15,300$ -$ 12,900$ Total noncluster programs passed through
Maryland State Department of Education 20,000 - - 15,300 15,300 - 12,900
Total U.S. Department of Education 5,097,173 238,377 2,274,672 2,478,723 2,181,281 535,819 996,201
U.S. Department of Health & Human Services
Direct Funding -Drug Free Communities 16/17 1H79SP020369-01 93.276 125,000 - - 84,827 66,250 18,577 - Drug Free Communities 15/16 1H79SP020369-02 93.276 125,000 28,230 79,641 45,359 73,589 - -
Total Drug Free Communities 250,000 28,230 79,641 130,186 139,839 18,577 - Total Direct Funding - U.S. Department of Health &
Human Services 250,000 28,230 79,641 130,186 139,839 18,577 -
Other Federal Awards:Passed through Michigan Works! West Central:TANF (Work First)
PATH 2017 16-04 93.558 91,759 - - 91,759 91,759 - - PATH 2016 16-04 93.558 68,399 6,560 68,399 - 6,560 - -
Total noncluster programs passed throughMichigan Works! West Central 160,158 6,560 68,399 91,759 98,319 - -
Passed through Mid State Health Network:Block Grant
16/17 7040 93.959 90,727 - - 47,031 34,580 12,451 - 15/16 7040 93.959 87,421 15,073 67,136 18,835 33,908 - -
Total Block Grant 178,148 15,073 67,136 65,866 68,488 12,451 - Total noncluster programs passed through
Mid State Health Network 178,148 15,073 67,136 65,866 68,488 12,451 -
Passed through Department of Community Health - State of Michigan:
Medicaid Outreach Program N/A 93.778 27,907 - - 27,907 27,907 - -
Total noncluster programs passed throughDepartment of Community Health - State of Michigan 27,907 - - 27,907 27,907 - -
Total U.S. Department of Health & Human Services 616,213 49,863 215,176 315,718 334,553 31,028 -
Total Federal Awards 6,416,023$ 328,167$ 2,764,918$ 3,222,008$ 2,949,322$ 600,853$ 996,201$
The accompanying notes are an integral part of this schedule.75

Federal Due to (from) (Memo Only) Current Year Current Year Due to (from)CFDA Subrecipient Subrecipient Prior Year Federal Cash Subrecipient
Number Award July 1, 2016 Expenditures Expenditures Transferred June 30, 2017
Special Education ClusterFremont Public Schools
P.L. 94-142 Flow Through160450/1516 84.027A 263,785$ 63,455$ 263,785$ -$ 63,455$ -$ 170450/1617 84.027A 257,782 - - 257,782 232,562 25,220
Total Fremont Public Schools 521,567 63,455 263,785 257,782 296,017 25,220
Grant Public SchoolsP.L. 94-142 Flow Through
160450/1516 84.027A 228,372 40,519 187,853 - 40,519 - 170450/1617 84.027A 233,883 - - 233,883 188,053 45,830
Total Grant Public Schools 462,255 40,519 187,853 233,883 228,572 45,830
Hesperia Community SchoolsP.L. 94-142 Flow Through
160450/1516 84.027A 137,517 20,257 137,517 - 20,257 - 170450/1617 84.027A 134,012 - - 134,012 110,537 23,475
Total Hesperia Community Schools 271,529 20,257 137,517 134,012 130,794 23,475
Newaygo Public SchoolsP.L. 94-142 Flow Through
160450/1516 84.027A 206,054 - 206,054 - - - 170450/1617 84.027A 193,755 - - 216,033 193,755 22,278
Total Newaygo Public Schools 399,809 - 206,054 216,033 193,755 22,278
White Cloud Public SchoolsP.L. 94-142 Flow Through
160450/1516 84.027A 127,177 - 127,177 - - - 170450/1617 84.027A 141,591 - - 141,591 88,444 53,147
Total White Cloud Public Schools 268,768 - 127,177 141,591 88,444 53,147
Total Special Education Cluster 1,923,928 124,231 922,386 983,301 937,582 169,950
Race to the Top-Early Learning ChallengeBerrien RESA 84.412A 600 - - 600 600 - Ottawa Area ISD 84.412A 2,700 - - 2,700 2,700 - Saginaw ISD 84.412A 2,400 - - 2,400 2,400 - St. Clare County RESA 84.412A 1,200 - - 1,200 1,200 - Washtenaw Intermediate S/D 84.412A 4,200 - - 4,200 4,200 - West Shore Educational Service District 84.412A 1,800 - - 1,800 1,800 -
Total Race to the Top-Early Learning Challenge 12,900 - - 12,900 12,900 -
Total Subrecipients 1,936,828$ 124,231$ 922,386$ 996,201$ 950,482$ 169,950$
Recipient
NEWAYGO COUNTY REGIONAL EDUCATIONAL SERVICE AGENCY
For the Year Ended June 30, 2017Schedule of Federal Financial Assistance Provided to Subrecipients
See accompanying notes to the basic financial statements.
76

(1) Significant Accounting Policies Used in Preparing Schedule of Expenditures of Federal Awards
(2) Significant Accounting Policies Used in Preparing Schedule of Expenditures of Federal Awards:
(3) Reconciliation of Grant Auditor Report with Schedule of Expenditures of Federal AwardsCurrent cash payments per Cash Management System (CMS) 1,995,798$
Add items not on CMS ReportFunds received through Michigan Works! West Central U.S. Department of Labor 433,488 U.S. Department of Health & Human Services 98,319 Funds received through U.S. Department of Education Small, Rural School Achievement 41,104 Funds received through Mecosta Osceola Intermediate School District Carl Perkins 129,080 Funds received through Maryland State Department of Education Race to the Top 15,300 Funds received through U.S. Department of Health & Human Services Drug Free Communities 139,839 Funds received through Mid State Health Network Block Grant 68,488 Funds received through Department of Community Health, Michigan Medicaid Outreach Program 27,907 Rounding (1)
Current year receipts (cash basis)per Schedule of Expenditures of Federal Awards 2,949,322$
(4)
For the Year Ended June 30, 2017Notes to Schedule of Expenditures of Federal Awards
NEWAYGO COUNTY REGIONAL EDUCATIONAL SERVICE AGENCY
The Agency has not elected to use the 10% de minimus indirect cost rate as allowed under the Uniform Guidance.
The accompanying Schedule of Expenditures of Federal Awards (the "Schedule") includes the federal award activity of Newaygo County Regional Educational Service Agency under programs for the federal government for the year ended June 30, 2017. The information in this schedule is presented in accordance with the requirements of Title 2 U.S. Code of Federal Regulations Part 200 Uniform Administrative Requirements, Cost Principles and Audit Requirements for Federal Awards (Uniform Guidance). Because the schedule presents only a selected portion of the operations of NC RESA, it is not intended to and does not present the financial position or changes in net position of NC RESA.
Expenditures reported on the schedule are reported on the modified accrual basis of accounting and present transactions in the same manner as reflected in the basic financial statements of the Agency. The significant accounting policies used are described in footnote A to the June 30, 2017 basic financial statements. Such expenditures are recognized following the cost principles contained in the Uniform Guidance wherein certain types of expenditures are not allowable or are limited as to reimbursement. Negative amounts (if any) shown on the schedule represent adjustments or credits made in the normal course of business to amounts reported as expenditures in prior years. Pass-through entity identifying numbers are presented where available.
77

H&S Companies 711 W. Main St. ● Fremont, MI 49412 ● (231) 924-6890
www.hscompanies.com
Independent Auditor’s Report on Internal Control Over Financial Reporting and on Compliance and Other Matters Based on an Audit of Financial Statements
Performed in Accordance with Governmental Auditing Standards Board of Education Newaygo County Regional Educational Service Agency (NC RESA) Fremont, Michigan 49412 We have audited, in accordance with the auditing standards generally accepted in the United States of America and the standards applicable to financial audits contained in Government Auditing Standards issued by the Comptroller General of the United States, the financial statements of the governmental activities, the business-type activities, each major fund, and the aggregate remaining fund information of NC RESA, as of and for the year ended June 30, 2017, and the related notes to the financial statements, which collectively comprise NC RESA’s basic financial statements, and have issued our report thereon dated October 24, 2017. Internal Control Over Financial Reporting In planning and performing our audit of the financial statements, we considered NC RESA’s internal control over financial reporting (internal control) to determine the audit procedures that are appropriate in the circumstances for the purpose of expressing our opinions on the financial statements, but not for the purpose of expressing an opinion on the effectiveness of NC RESA’s internal control. Accordingly, we do not express an opinion on the effectiveness of NC RESA’s internal control. A deficiency in internal control exists when the design or operation of a control does not allow management or employees, in the normal course of performing their assigned functions, to prevent, or detect and correct misstatements on a timely basis. A material weakness is a deficiency, or a combination of deficiencies, in internal control such that there is a reasonable possibility that a material misstatement of the entity's financial statements will not be prevented, or detected and corrected on a timely basis. A significant deficiency is a deficiency, or a combination of deficiencies, in internal control that is less severe than a material weakness, yet important enough to merit attention by those charged with governance. Our consideration of internal control was for the limited purpose described in the first paragraph of this section and was not designed to identify all deficiencies in internal control that might be material weaknesses or, significant deficiencies. Given these limitations, during our audit we did not identify any deficiencies in internal control that we consider to be material weaknesses. However, material weaknesses may exist that have not been identified.
78

Newaygo County Regional Educational Service Agency Report on Internal Control (continued) Compliance and Other Matters As a part of obtaining reasonable assurance about whether NC RESA's financial statements are free of material misstatement, we performed tests of its compliance with certain provisions of laws, regulations, contracts and grant agreements, noncompliance with which could have a direct and material effect on the determination of financial statement amounts. However, providing an opinion on compliance with those provisions was not an objective of our audit and, accordingly, we do not express such an opinion. The results of our tests disclosed no instances of noncompliance or other matters that are required to be reported under Government Auditing Standards. Purpose of this Report The purpose of this report is solely to describe the scope of our testing of internal control and compliance and the results of that testing, and not to provide an opinion on the effectiveness of the entity’s internal control or on compliance. This report is an integral part of an audit performed in accordance with Government Auditing Standards in considering the entity’s internal control and compliance. Accordingly, this communication is not suitable for any other purpose.
H&S Companies, P.C. H&S Companies, P.C. Fremont, MI October 24, 2017
79
H&S Companies 711 W. Main St. ● Fremont, MI 49412 ● (231) 924-6890
www.hscompanies.com
Independent Auditor’s Report on Compliance for Each Major Program and on Internal Control Over Compliance Required by the Uniform Guidance
Board of Education Newaygo County Regional Educational Service Agency (NC RESA) Fremont, Michigan 49412 Report on Compliance for Each Major Federal Program We have audited NC RESA’s compliance with the types of compliance requirements described in the OMB Compliance Supplement that could have a direct and material effect on each of NC RESA’s major federal programs for the year ended June 30, 2017. NC RESA's major federal programs are identified in the summary of auditor’s results section of the accompanying schedule of findings and questioned costs. Management’s Responsibility Management is responsible for compliance with the requirements of laws, regulations, contracts, and grants applicable to its federal programs. Auditor’s Responsibility Our responsibility is to express an opinion on compliance for each of NC RESA’s major federal programs based on our audit of the types of compliance requirements referred to above. We conducted our audit of compliance in accordance with auditing standards generally accepted in the United States of America; the standards applicable to financial audits contained in Government Auditing Standards, issued by the Comptroller General of the United States; and the audit requirements of Title 2 U.S. Code of Federal Regulations Part 200, Uniform Administrative Requirements, Cost Principles, and Audit Requirements for Federal Awards (Uniform Guidance). Those standards and the Uniform Guidance require that we plan and perform the audit to obtain reasonable assurance about whether noncompliance with the types of compliance requirements referred to above that could have a direct and material effect on a major federal program occurred. An audit includes examining, on a test basis, evidence about NC RESA’s compliance with those requirements and performing such other procedures as we considered necessary in the circumstances. We believe that our audit provides a reasonable basis for our opinion on compliance for each major federal program. However, our audit does not provide a legal determination of NC RESA’s compliance.
80

Newaygo County Regional Educational Service Agency (NC RESA) Report on Compliance (continued) Opinion on Each Major Federal Program In our opinion, NC RESA, complied, in all material respects, with the types of compliance requirements referred to above that could have a direct and material effect on each of its major federal programs for the year ended June 30, 2017. Report on Internal Control Over Compliance Management of NC RESA, is responsible for establishing and maintaining effective internal control over compliance with the types of compliance requirements referred to above. In planning and performing our audit of compliance, we considered NC RESA’s internal control over compliance with the types of requirements that could have a direct and material effect on each major federal program to determine the auditing procedures that are appropriate in the circumstances for the purpose of expressing an opinion on compliance for each major federal program and to test and report on internal control over compliance in accordance with the Uniform Guidance, but not for the purpose of expressing an opinion on the effectiveness of internal control over compliance. Accordingly, we do not express an opinion on the effectiveness of NC RESA’s internal control over compliance. A deficiency in internal control over compliance exists when the design or operation of a control over compliance does not allow management or employees, in the normal course of performing their assigned functions, to prevent, or detect and correct, noncompliance with a type of compliance requirement of a federal program on a timely basis. A material weakness in internal control over compliance is a deficiency, or combination of deficiencies, in internal control over compliance, such that there is a reasonable possibility that material noncompliance with a type of compliance requirement of a federal program will not be prevented, or detected and corrected, on a timely basis. A significant deficiency in internal control over compliance is a deficiency, or a combination of deficiencies, in internal control over compliance with a type of compliance requirement of a federal program that is less severe than a material weakness in internal control over compliance, yet important enough to merit attention by those charged with governance. Our consideration of internal control over compliance was for the limited purpose described in the first paragraph of this section and was not designed to identify all deficiencies in internal control over compliance that might be material weaknesses or significant deficiencies. We did not identify any deficiencies in internal control over compliance that we consider to be material weaknesses. However, material weaknesses may exist that have not been identified. The purpose of this report on internal control over compliance is solely to describe the scope of our testing of internal control over compliance and the results of that testing based on the requirements of the Uniform Guidance. Accordingly, this report is not suitable for any other purpose.
H&S Companies, P.C. H&S Companies, P.C. Fremont, MI October 24, 2017
81

1.2.
a.b.
3.
1.a.b.
2.3.
4.U.S. Department of Education Special Education Cluster:
Special Ed Flowthrough CFDA #84.027Special Ed Preschool CFDA #84.173
5.6.
No Findings
Department of Education - Special Education Cluster No Findings
Section III - Findings and Questioned Costs - Major Federal Award Programs Audit
The program tested as a major program included:
risk auditee.
Section II - Findings - Financial Statement Audit
The threshold for distinguishing Types A and B programs was $750,000.Newaygo County Regional Educational Service Agency was determined to be a low
Type of auditor's report issued is unmodified
No noncompliance material to the financial statements noted.
Internal control over financial reporting.
Federal Awards
No material weaknesses were identified.
No significant deficiency(ies) were identified.
No audit findings were disclosed that are required to be reported in accordance with Uniform Guidance.
No material weaknesses were identified.Internal control over major programs:
No significant deficiency was identified that is not considered to be a material weakness.
The type of auditor's report issued on compliance for major programs is unmodified
NEWAYGO COUNTY REGIONAL EDUCATIONAL SERVICE AGENCY
Schedule of Findings and Questioned CostsFor the Year Ended June 30, 2017
Section I - Summary of Auditor's Results
Financial Statements
82

October 24, 2017
Board Members Newaygo County Regional Educational Service Agency Fremont, MI 49412
We have audited the financial statements of the governmental activities, business-type activities, each major fund, and the aggregate remaining fund information of the Newaygo County Regional Educational Service Agency for the year ended June 30, 2017, and have issued our report thereon dated October 24, 2017. Professional standards require that we provide you information about our responsibilities under generally accepted auditing standards and, if applicable, Government Auditing Standards and the Uniform Guidance, as well as certain information related to the planned scope and timing of our audit. We have communicated such information in our letter to you dated June 30, 2017. Professional standards also require that we communicate to you the following information related to our audit.
Significant Audit Findings
Qualitative Aspects ofAccounting Practices
Management is responsible for the selection and use of appropriate accounting policies. The significant accounting policies used by the Newaygo County Regional Educational Service Agency are described in Note A to the financial statements. During 2016-2017, the Agency implemented GASB Statement No. 77, Tax Abatement Disclosures. We noted no transactions entered into by the governmental unit during the year for which there is a lack of authoritative guidance or consensus. All significant transactions have been recognized in the financial statements in the proper period.
Accounting estimates are an integral part of the fmancial statements prepared by management and are based on management's knowledge and experience about past and current events and assumptions about future events. Certain accounting estimates are particularly sensitive because of their significance to the fmancial statements and because of the possibility that future events affecting them may differ significantly from those expected. The most sensitive estimates affecting the fmancial statements were:
Management's estimate of depreciation on fixed assets is based on the straight-line method of depreciation over the useful lives of the related asset.
Management's estimate of the defined benefit pension plan is based on member's years of credited service and final average compensation.
Management's estimate of the value of inventory is based on cost using the first in-first out method.
We evaluated the key factors and assumptions used to develop the estimates in determining that they are reasonable in relation to the financial statements taken as a whole.

Page 2
Difficulties Encountered in Performing the Audit
We encountered no significant difficulties in dealing with management in performing and completing our audit.
Corrected and Uncorrected Misstatements
Professional standards require us to accumulate all known and likely misstatements identified during the audit, other than those that are trivial, and communicate them to the appropriate level of management. Management has corrected all such misstatements. In addition, none of the misstatements detected as a result of audit procedures and corrected by management were material, either individually or in the aggregate, to each opinion unit's financial statements taken as a whole.
Disagreements with Management
For purposes of this letter, professional standards define a disagreement with management as a fmancial accounting, reporting, or auditing matter, whether or not resolved to our satisfaction, that could be significant to the fmancial statements or the auditor's report. We are pleased to report that no such disagreements arose during the course of our audit.
Management Representations
We have requested certain representations from management that are included in the management representation letter dated October 24, 2017.
Management Consultations with Other Independent Accountants
In some cases, management may decide to consult with other accountants about auditing and accounting matters, similar to obtaining a "second opinion" on certain situations. If a consultation involves application of an accounting principle to the governmental unit's financial statements or a determination of the type of auditor's opinion that may be expressed on those statements, our professional standards require the consulting accountant to check with us to determine that the consultant has all the relevant facts. To our knowledge, there were no such consultations with other accountants.
Other Audit Findings or Issues
We generally discuss a variety of matters, including the application of accounting principles and auditing standards, with management each year prior to retention as the governmental unit's auditors. However, these discussions occurred in the normal course of our professional relationship and our responses were not a condition to our retention.
Current Year Comments
As the Board is well aware, NC RESA does not collect a millage for major improvements such as building expansions and updates, so the Agency must internally fund or sell bonds to complete these projects. Over the years, the Capital Projects fund has received funds via transfers from the Agency's other funds. The Career Tech fund has consistently provided transfers to the Capital Projects fund, but the General fund and Special Education fund have not be able to provide similar funding in recent years. We have added new information to the graphical analysis to reflect the levels of transfers from each fund to the Capital Projects fund over the past 15 years. If the Board wishes to complete building improvement projects for the General or Special Education funds, we recommend you consider budgeting for and completing transfers of funds to the Capital Projects fund.
Page 3
Other Matters
We applied certain limited procedures to the required supplementary information (RSI) which arc required and supplement the basic financial statements. Our procedures consisted of inquiries of management regarding the methods of preparing the information and comparing the information for consistency with management's responses to our inquiries, the basic fmancial statements, and other knowledge we obtained during our audit of the basic fmancial statements. We did not audit the RSI and do not express an opinion or provide any assurance on the RSI.
We were engaged to report on the other supplementary information, which accompany the financial statements but arc not RSI. With respect to this other supplementary information, we made certain inquiries of management and evaluated the form, content, and methods of preparing the information to determine that the information complies with accounting principles generally accepted in the United States of America, the method of preparing it has not changed from the prior period, and the information is appropriate and complete in relation to our audit of the financial statements. We compared and reconciled the other supplementary information to the underlying accounting records used to prepare the financial statements or to the financial statements themselves.
Restrictions on Use
This information is intended solely for the use of board of directors and management of the Newaygo County Regional Educational Service Agency and is not intended to be and should not be used by anyone other than these specified parties.
Very truly yours,
H &$C , P.c.
H & S Companies, P.C. Certified Public Accountants