new zealand1 - oecd.org - oecd zealand1 key issues adults in new zealand score above the oecd...
TRANSCRIPT

NEW ZEALAND1
Key issues Adults in New Zealand score above the OECD average in literacy, numeracy and problem solving in
technology-rich environments.
New Zealand’s immigrant population is one of the most skilled across OECD countries. At the same time, native-born New Zealanders who speak English as a second language are over-represented among adults with low proficiency.
The differences in skills proficiency related to age, gender, education and social background are less pronounced in New Zealand than in other countries. However, sharp ethnic differences, particularly for Māori and Pacific peoples, exist in New Zealand.
In New Zealand, even more so than in other OECD countries, higher proficiency in literacy and numeracy have a positive impact on labour force participation and wages.
The relationship between literacy and levels of trust in others, political efficacy, participation in volunteer activities and self-reported health is positive and mostly in line with those observed in other OECD countries.
The Survey of Adult Skills
The Survey of Adult Skills, a product of the OECD Programme for the International Assessment of Adult Competencies (PIAAC), provides a picture of adults’ proficiency in three key information-processing skills: - literacy – the ability to understand and respond appropriately to written texts - numeracy – the ability to use numerical and mathematical concepts - problem solving in technology-rich environments – the capacity to access, interpret and analyse information found, transformed and communicated in digital environments. Proficiency is described on a scale of 500 points divided into levels. Each level summarises what a person with a particular score can do. Six proficiency levels are defined for literacy and numeracy (Levels 1 through 5 plus below Level 1) and four are defined for problem solving in technology-rich environments (Levels 1 through 3 plus below Level 1). The survey also provides a wide range of information about respondents’ use of skills at work and in everyday life, their education, their linguistic and social backgrounds, their participation in adult education and training programmes and in the labour market, and other aspects of their well-being.
The Survey of Adult Skills was conducted in New Zealand from 1 April 2014 to 31 March 2015. Some 6 177 adults aged 16-65 were surveyed.
1The statistical data for Israel are supplied by and are under the responsibility of the relevant Israeli authorities. The use of such data by
the OECD is without prejudice to the status of the Golan Heights, East Jerusalem and Israeli settlements in the West Bank under the terms of international law.
New Zealand – Country Note – Skills Matter: Further Results from the Survey of Adult Skills
2 © OECD 2016
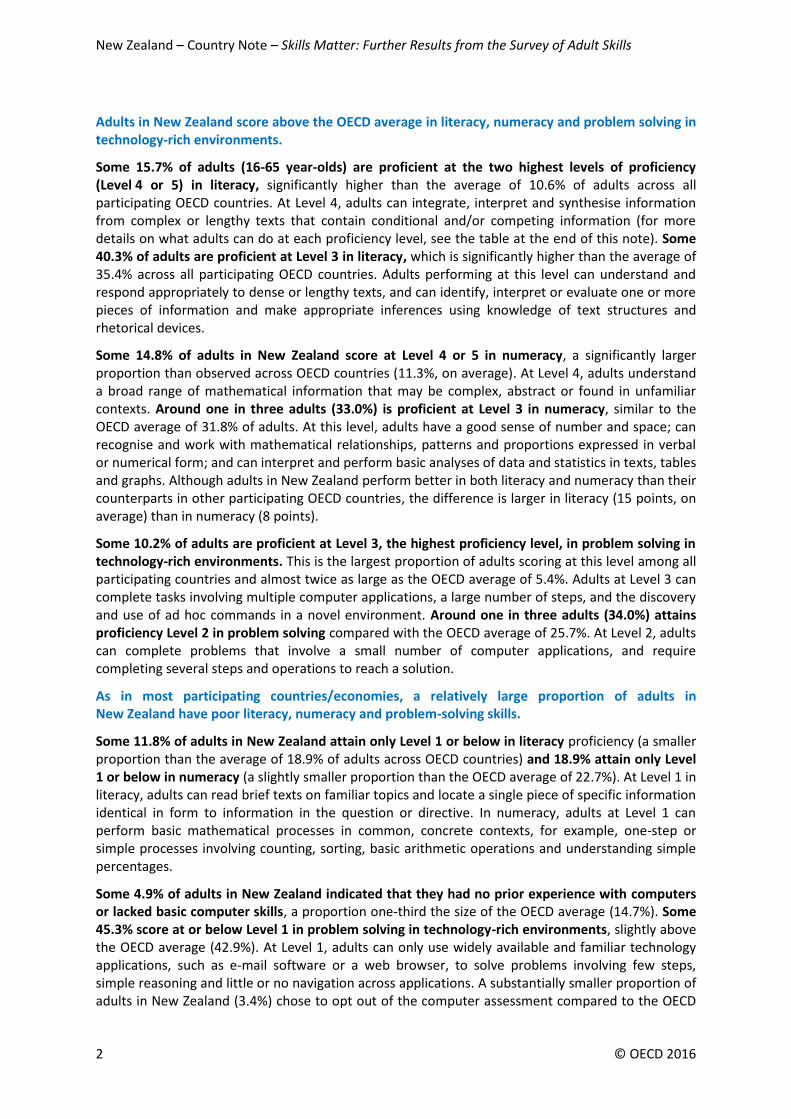
Adults in New Zealand score above the OECD average in literacy, numeracy and problem solving in technology-rich environments.
Some 15.7% of adults (16-65 year-olds) are proficient at the two highest levels of proficiency (Level 4 or 5) in literacy, significantly higher than the average of 10.6% of adults across all participating OECD countries. At Level 4, adults can integrate, interpret and synthesise information from complex or lengthy texts that contain conditional and/or competing information (for more details on what adults can do at each proficiency level, see the table at the end of this note). Some 40.3% of adults are proficient at Level 3 in literacy, which is significantly higher than the average of 35.4% across all participating OECD countries. Adults performing at this level can understand and respond appropriately to dense or lengthy texts, and can identify, interpret or evaluate one or more pieces of information and make appropriate inferences using knowledge of text structures and rhetorical devices.
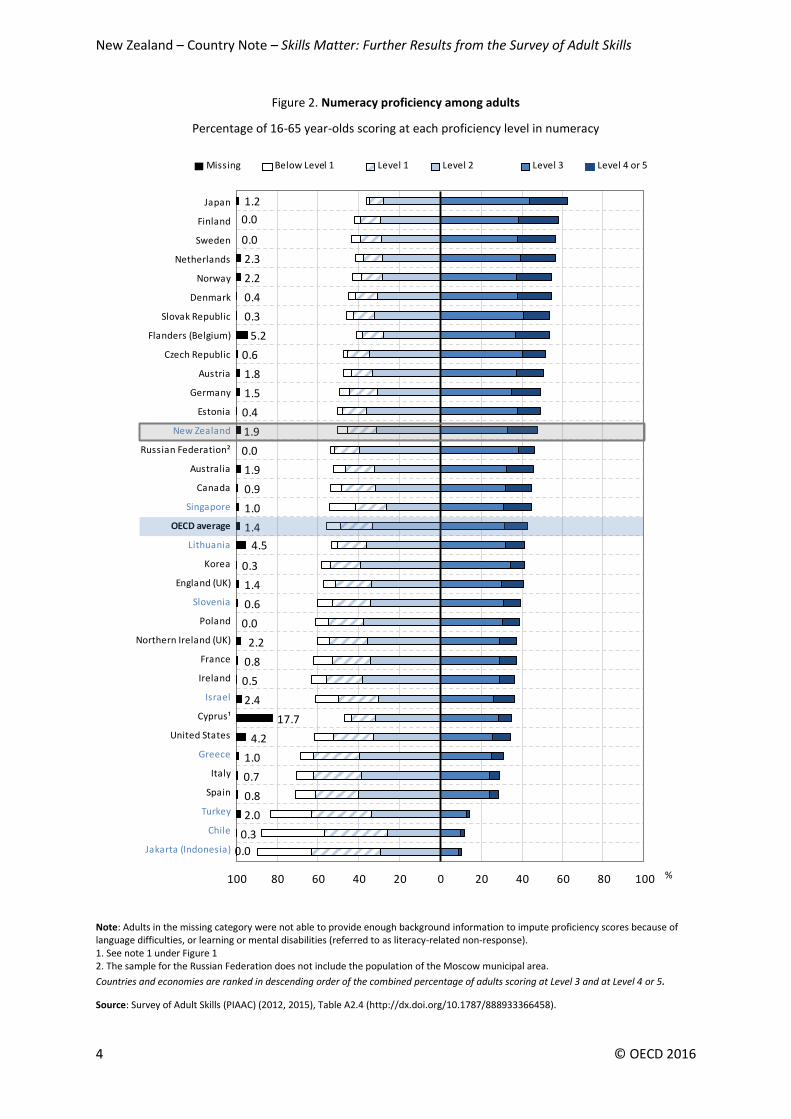
Some 14.8% of adults in New Zealand score at Level 4 or 5 in numeracy, a significantly larger proportion than observed across OECD countries (11.3%, on average). At Level 4, adults understand a broad range of mathematical information that may be complex, abstract or found in unfamiliar contexts. Around one in three adults (33.0%) is proficient at Level 3 in numeracy, similar to the OECD average of 31.8% of adults. At this level, adults have a good sense of number and space; can recognise and work with mathematical relationships, patterns and proportions expressed in verbal or numerical form; and can interpret and perform basic analyses of data and statistics in texts, tables and graphs. Although adults in New Zealand perform better in both literacy and numeracy than their counterparts in other participating OECD countries, the difference is larger in literacy (15 points, on average) than in numeracy (8 points).
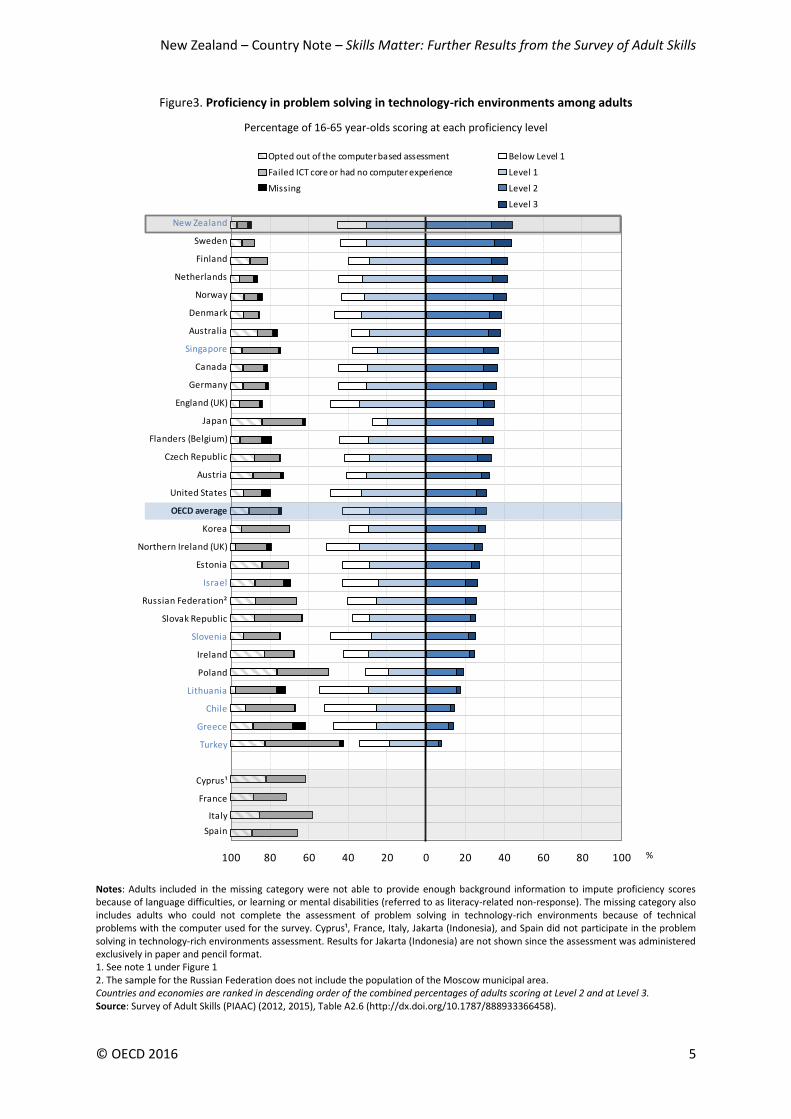
Some 10.2% of adults are proficient at Level 3, the highest proficiency level, in problem solving in technology-rich environments. This is the largest proportion of adults scoring at this level among all participating countries and almost twice as large as the OECD average of 5.4%. Adults at Level 3 can complete tasks involving multiple computer applications, a large number of steps, and the discovery and use of ad hoc commands in a novel environment. Around one in three adults (34.0%) attains proficiency Level 2 in problem solving compared with the OECD average of 25.7%. At Level 2, adults can complete problems that involve a small number of computer applications, and require completing several steps and operations to reach a solution.
As in most participating countries/economies, a relatively large proportion of adults in New Zealand have poor literacy, numeracy and problem-solving skills.
Some 11.8% of adults in New Zealand attain only Level 1 or below in literacy proficiency (a smaller proportion than the average of 18.9% of adults across OECD countries) and 18.9% attain only Level 1 or below in numeracy (a slightly smaller proportion than the OECD average of 22.7%). At Level 1 in literacy, adults can read brief texts on familiar topics and locate a single piece of specific information identical in form to information in the question or directive. In numeracy, adults at Level 1 can perform basic mathematical processes in common, concrete contexts, for example, one-step or simple processes involving counting, sorting, basic arithmetic operations and understanding simple percentages.
Some 4.9% of adults in New Zealand indicated that they had no prior experience with computers or lacked basic computer skills, a proportion one-third the size of the OECD average (14.7%). Some 45.3% score at or below Level 1 in problem solving in technology-rich environments, slightly above the OECD average (42.9%). At Level 1, adults can only use widely available and familiar technology applications, such as e-mail software or a web browser, to solve problems involving few steps, simple reasoning and little or no navigation across applications. A substantially smaller proportion of adults in New Zealand (3.4%) chose to opt out of the computer assessment compared to the OECD

New Zealand – Country Note – Skills Matter: Further Results from the Survey of Adult Skills
© OECD 2016 3
average (9.6%). The proportion of adults with limited ICT skills who took the computer-based assessment and were assessed in problem solving in technology-rich environments was larger in New Zealand than in any other participating country/economy.
Figure 1 Literacy proficiency among adults
Percentage of adults scoring at each proficiency level in literacy
Note: Adults in the missing category were not able to provide enough background information to impute proficiency scores because of language difficulties, or learning or mental disabilities (referred to as literacy-related non-response). 1. Note by Turkey: The information in this document with reference to “Cyprus” relates to the southern part of the Island. There is no single authority representing both Turkish and Greek Cypriot people on the Island. Turkey recognises the Turkish Republic of Northern Cyprus (TRNC). Until a lasting and equitable solution is found within the context of the United Nations, Turkey shall preserve its position concerning the “Cyprus issue”. Note by all the European Union Member States of the OECD and the European Union: The Republic of Cyprus is recognised by all members of the United Nations with the exception of Turkey. The information in this document relates to the area under the effective control of the Government of the Republic of Cyprus. 2. The sample for the Russian Federation does not include the population of the Moscow municipal area.
Countries and economies are ranked in descending order of the combined percentages of adults scoring at Level 3 and at Level 4 or 5. Source: Survey of Adult Skills (PIAAC) (2012, 2015), Table A2.1 (http://dx.doi.org/10.1787/888933366458).
Japan
Finland
Netherlands
Sweden
Australia
New Zealand
Norway
Estonia
Russian Federation²
Slovak Republic
Flanders (Belgium)
Canada
Czech Republic
Denmark
Korea
England (UK)
Germany
OECD average
United States
Austria
Poland
Ireland
Northern Ireland (UK)
Singapore
France
Lithuania
Cyprus¹
Israel
Slovenia
Spain
Greece
Italy
Chile
Turkey
Jakarta (Indonesia)
Percentage of adults scoring at each proficiency level in literacy
0.0
2.0
0.3
0.7
1.0
0.8
0.6
2.4
17.7
4.5
0.8
1.0
2.2
0.5
0.0
1.8
4.2
1.4
1.5
1.4
0.3
0.4
0.6
0.9
5.2
0.3
0.0
0.4
2.2
1.9
1.9
0.0
2.3
0.0
1.2
100 80 60 40 20 0 20 40 60 80 100
Missing Below Level 1 Level 1 Level 2 Level 3 Level 4 or 5
%
New Zealand – Country Note – Skills Matter: Further Results from the Survey of Adult Skills
4 © OECD 2016
Figure 2. Numeracy proficiency among adults
Percentage of 16-65 year-olds scoring at each proficiency level in numeracy
Note: Adults in the missing category were not able to provide enough background information to impute proficiency scores because of language difficulties, or learning or mental disabilities (referred to as literacy-related non-response). 1. See note 1 under Figure 1 2. The sample for the Russian Federation does not include the population of the Moscow municipal area.
Countries and economies are ranked in descending order of the combined percentage of adults scoring at Level 3 and at Level 4 or 5.
Source: Survey of Adult Skills (PIAAC) (2012, 2015), Table A2.4 (http://dx.doi.org/10.1787/888933366458).
Japan
Finland
Sweden
Netherlands
Norway
Denmark
Slovak Republic
Flanders (Belgium)
Czech Republic
Austria
Germany
Estonia
New Zealand
Russian Federation²
Australia
Canada
Singapore
OECD average
Lithuania
Korea
England (UK)
Slovenia
Poland
Northern Ireland (UK)
France
Ireland
Israel
Cyprus¹
United States
Greece
Italy
Spain
Turkey
Chile
Jakarta (Indonesia)
Percentage of 16-65 year-olds scoring at each proficiency level in numeracy
0.0
0.3
2.0
0.8
0.7
1.0
4.2
17.7
2.4
0.5
0.8
2.2
0.0
0.6
1.4
0.3
4.5
1.4
1.0
0.9
1.9
0.0
1.9
0.4
1.5
1.8
0.6
5.2
0.3
0.4
2.2
2.3
0.0
0.0
1.2
100 80 60 40 20 0 20 40 60 80 100
Missing Below Level 1 Level 1 Level 2 Level 3 Level 4 or 5
%
New Zealand – Country Note – Skills Matter: Further Results from the Survey of Adult Skills
© OECD 2016 5
Figure3. Proficiency in problem solving in technology-rich environments among adults
Percentage of 16-65 year-olds scoring at each proficiency level
Notes: Adults included in the missing category were not able to provide enough background information to impute proficiency scores because of language difficulties, or learning or mental disabilities (referred to as literacy-related non-response). The missing category also includes adults who could not complete the assessment of problem solving in technology-rich environments because of technical problems with the computer used for the survey. Cyprus¹, France, Italy, Jakarta (Indonesia), and Spain did not participate in the problem solving in technology-rich environments assessment. Results for Jakarta (Indonesia) are not shown since the assessment was administered exclusively in paper and pencil format. 1. See note 1 under Figure 1 2. The sample for the Russian Federation does not include the population of the Moscow municipal area. Countries and economies are ranked in descending order of the combined percentages of adults scoring at Level 2 and at Level 3. Source: Survey of Adult Skills (PIAAC) (2012, 2015), Table A2.6 (http://dx.doi.org/10.1787/888933366458).
New Zealand
Sweden
Finland
Netherlands
Norway
Denmark
Australia
Singapore
Canada
Germany
England (UK)
Japan
Flanders (Belgium)
Czech Republic
Austria
United States
OECD average
Korea
Northern Ireland (UK)
Estonia
Israel
Russian Federation²
Slovak Republic
Slovenia
Ireland
Poland
Lithuania
Chile
Greece
Turkey
Cyprus¹
France
Italy
Spain
100 80 60 40 20 0 20 40 60 80 100
Opted out of the computer based assessment
Failed ICT core or had no computer experience
Missing
Below Level 1
Level 1
Level 2
Level 3
%
New Zealand – Country Note – Skills Matter: Further Results from the Survey of Adult Skills
6 © OECD 2016
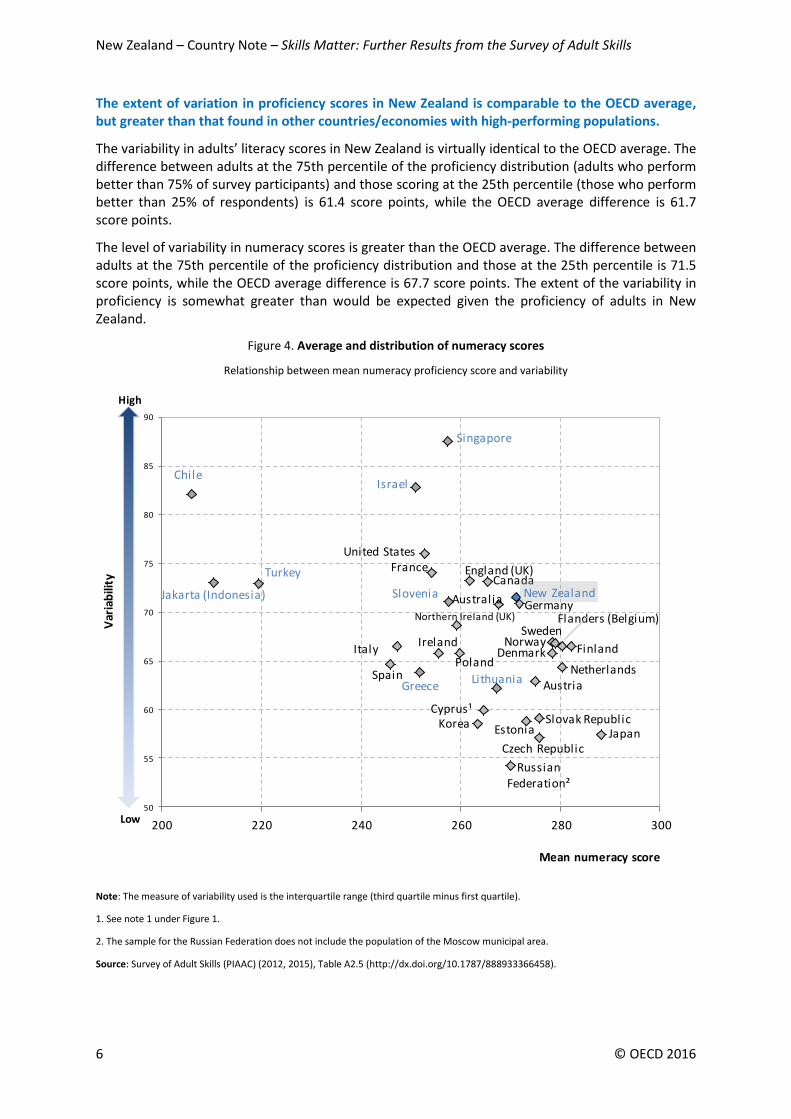
The extent of variation in proficiency scores in New Zealand is comparable to the OECD average, but greater than that found in other countries/economies with high-performing populations.
The variability in adults’ literacy scores in New Zealand is virtually identical to the OECD average. The difference between adults at the 75th percentile of the proficiency distribution (adults who perform better than 75% of survey participants) and those scoring at the 25th percentile (those who perform better than 25% of respondents) is 61.4 score points, while the OECD average difference is 61.7 score points.
The level of variability in numeracy scores is greater than the OECD average. The difference between adults at the 75th percentile of the proficiency distribution and those at the 25th percentile is 71.5 score points, while the OECD average difference is 67.7 score points. The extent of the variability in proficiency is somewhat greater than would be expected given the proficiency of adults in New Zealand.
Figure 4. Average and distribution of numeracy scores
Relationship between mean numeracy proficiency score and variability
Note: The measure of variability used is the interquartile range (third quartile minus first quartile).
1. See note 1 under Figure 1.
2. The sample for the Russian Federation does not include the population of the Moscow municipal area.
Source: Survey of Adult Skills (PIAAC) (2012, 2015), Table A2.5 (http://dx.doi.org/10.1787/888933366458).
Relationship between mean numeracy proficiency score and variability
Australia
Austria
Canada
Cyprus¹
Czech Republic
Denmark
England (UK)
Estonia
Finland
Flanders (Belgium)
France
Germany
IrelandItaly
JapanKorea
Netherlands
Northern Ireland (UK)
Norway
Poland
Russian Federation²
Slovak Republic
Spain
Sweden
United States
Chile
Greece
Israel
Jakarta (Indonesia)
Lithuania
New Zealand
Singapore
Slovenia
Turkey
50
55
60
65
70
75
80
85
90
200 220 240 260 280 300
Mean numeracy score
Var
iab
ility
High
Low

New Zealand – Country Note – Skills Matter: Further Results from the Survey of Adult Skills
© OECD 2016 7
Adults’ literacy scores have been slowly but steadily increasing over the past two decades.
Comparisons of the results of the International Adult Literacy Survey (IALS), the Adult Literacy and Life Skills Survey (ALL) and the Survey of Adults Skills suggest that the average literacy proficiency of New Zealand’s adults has increased by 14 score points between 1996 and 2014-15. Adults in New Zealand are now as proficient in literacy as their peers in Australia; in IALS (1996), they scored around 6 points lower than adults in Australia. Numeracy proficiency appears to have remained unchanged between 2006 and 2014-15. While the average numeracy proficiency of adults in New Zealand is similar to that of adults in Australia in both the ALL (2006) and PIAAC surveys, it is statistically significantly higher in PIAAC (3 score points).
Figure 5. Changes in the literacy scores in IALS, ALL and PIAAC surveys
Mean literacy proficiency in the International Adult Literacy Survey (IALS), the Adult Literacy and Lifeskills Survey (ALL) and the Survey of Adults Skills (PIAAC)
Countries are ranked in descending order of the mean score on the Survey of Adult Skills (PIAAC).
Source: Survey of Adult Skills (PIAAC) (2012, 2015), International Adult Literacy Survey (IALS) and Adult Literacy and Lifeskills Survey (ALL), see Table A2.10 (http://dx.doi.org/10.1787/888933366458).
Fin
lan
d
Ne
the
rlan
ds
Ne
w Z
eal
and
Au
stra
lia
Swe
de
n
No
rway
Flan
de
rs (
Be
lgiu
m)
Cze
ch R
ep
ub
lic
Can
ada
Engl
and
(U
K)
De
nm
ark
Ge
rman
y
Un
ite
d S
tate
s
OEC
D A
vera
ge
No
rth
ern
Ire
lan
d (
UK
)
Po
lan
d
Ire
lan
d
Slo
ven
ia
Ital
y
Ch
ile
Mean literacy proficiency in the International Adult Literacy Survey (IALS), the Adult Literacy and Lifeskills Survey
(ALL) and the Survey of Adults Skills (PIAAC)
200
220
240
260
280
300
320
PIAAC Score (2012-15) IALS score (1994-98) ALL score (2003-07)
Literacy score

New Zealand – Country Note – Skills Matter: Further Results from the Survey of Adult Skills
8 © OECD 2016
Figure 6. Changes in the numeracy scores in PIAAC and ALL surveys
Mean numeracy proficiency in the International Adult Literacy Survey (IALS), the Adult Literacy and Lifeskills Survey (ALL) and the Survey of Adults Skills (PIAAC)
Countries are ranked in descending order of the mean score on the Survey of Adult Skills (PIAAC)
Source: Survey of Adult Skills (PIAAC) (2012, 2015) and Adult Literacy and Lifeskills Survey (ALL), see Table A2.11 (http://dx.doi.org/10.1787/888933366458).
English-speaking, foreign-born immigrants in New Zealand score higher in literacy and numeracy than English-speaking, native-born New Zealanders and are among the most highly proficient immigrant populations across OECD countries.
In all countries and economies, foreign-language immigrants tend to have lower literacy skills than both native-born adults and immigrants who spoke the host country’s official language from birth. However, there are wide variations in their overall level of proficiency and their proficiency relative to native-born adults. These variations reflect the changing size and composition of immigrant flows into the countries concerned over the past 50 years, and the impact of language and integration policies.
Foreign-language immigrants in New Zealand are more proficient in literacy than foreign-language immigrants in many other countries. Native-born, native-language New Zealanders score an average of 22 points higher than foreign-language immigrants in New Zealand, but this difference is below the OECD average difference of 30 points. Foreign-born immigrants whose native language is English score higher in literacy than native-born English speakers (a difference of 6 points) and score much higher than native-born, foreign-language adults (a difference of 31 points). Similar results are observed in numeracy.
Ital
y
Un
ite
d S
tate
s
Can
ada
OEC
D A
vera
ge
Au
stra
lia
Ne
w Z
eal
and
No
rway
Ne
the
rlan
ds
200
210
220
230
240
250
260
270
280
290
300
PIAAC Score (2012-2015) ALL score (2003-2007)
Numeracy score

New Zealand – Country Note – Skills Matter: Further Results from the Survey of Adult Skills
© OECD 2016 9
Only 8.5% of English-speaking immigrants have low proficiency in literacy as compared to the OECD average of 22.3% among foreign-born, native-language adults; and 23.4% of foreign-language immigrants have low literacy proficiency, a significantly smaller proportion than the OECD average of 40.0%. These results confirm that the immigrant population in New Zealand is one of the best-skilled among immigrant populations across all participating countries and economies.
Native-born New Zealanders who learned English as a second language show poor proficiency in literacy and numeracy.
Native-born New Zealanders whose mother tongue is not English score comparably to foreign-language immigrants in literacy but score lower than foreign-language immigrants in numeracy. The proportion of adults with poor numeracy skills among the native-born adults whose mother tongue is not English (42.4%) is larger than the OECD average among native-born, foreign-language adults (35.9%).
These results indicate that while New Zealand attracts better-skilled immigrants than on average across OECD countries, the skills of the New Zealand born population with a non-English speaking background need to be improved. This population is over-represented among the least-skilled adults.
Figure 7. Mean literacy proficiency by immigrant and language background
Source: Survey of Adult Skills (PIAAC) (2012,2015), Tables A3.12(L) (http://dx.doi.org/10.1787/888933366463).
The differences in proficiency related to age, gender, education and social background are less pronounced in New Zealand than in many other countries. However, sharp ethnic differences exist within New Zealand.
In New Zealand, as in most other countries, there are differences in proficiency related to socio-demographic characteristics, such as age, gender, immigrant background, level of education and socio-economic status. However, these differences are smaller in New Zealand than in many other countries.
200
210
220
230
240
250
260
270
280
290
300
Native born and nativelanguage
Native born and foreignlanguage
Foreign born and nativelanguage
Foreign born and foreignlanguage
New Zealand OECD average

New Zealand – Country Note – Skills Matter: Further Results from the Survey of Adult Skills
10 © OECD 2016
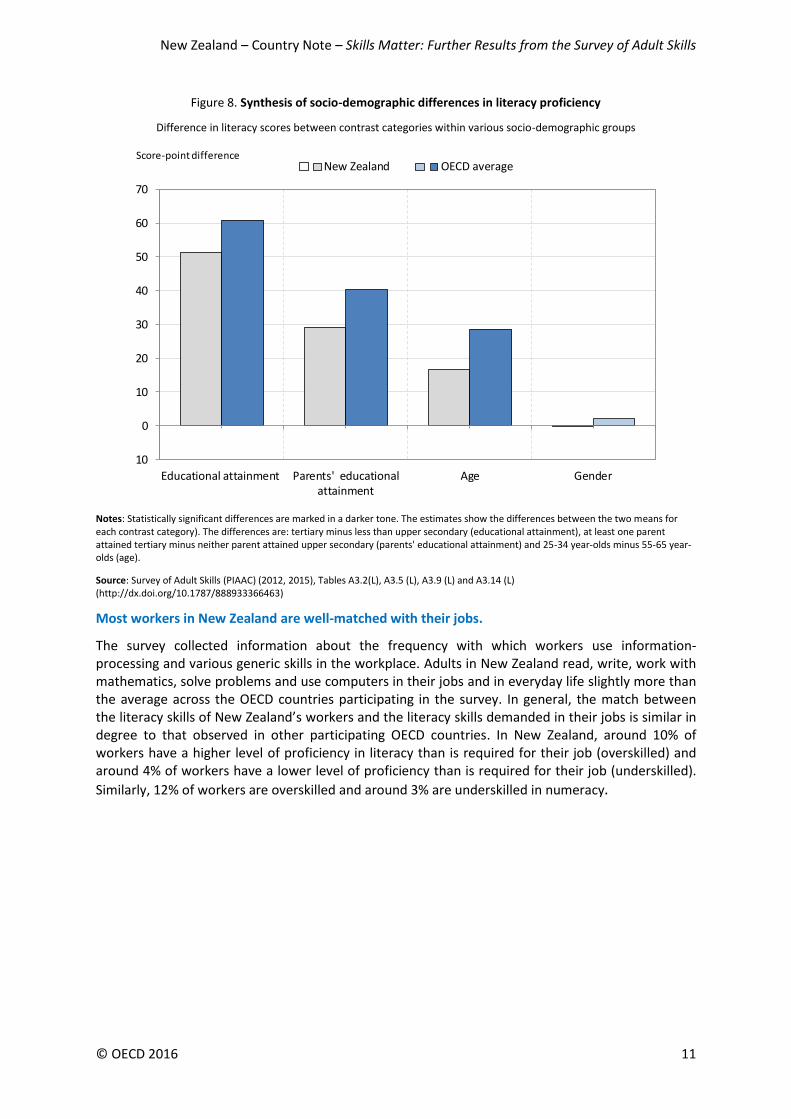
For example, among 25-65 year-olds, the difference in average literary scores between those with a tertiary degree and those who hadn’t attained an upper secondary degree is 51 points in literacy (the OECD average difference is 61 points) and 60 points in numeracy (the OECD average difference is 71 points).
Across the countries and economies that participated in the survey, proficiency peaks among 25-34 year-olds while the proficiency of 55-65 year-olds is generally the lowest of all age groups. New Zealand differs somewhat from this pattern in that 35-44 year-olds show the highest proficiency in literacy. In addition, older New Zealanders (55-65 year-olds) score considerably higher in literacy (269 score points) than the average for their age group across OECD countries (250 score points), while 16-24 year-olds perform close to the OECD average (278 points, compared to the OECD average of 275 points). The proficiency gap between the youngest and oldest age groups in the survey is thus much smaller (8 score points) than the OECD average (25 score points). Results in numeracy show a similar pattern.
In New Zealand, as on average across countries and economies, there is no significant gender difference in literacy proficiency, but men show somewhat higher proficiency than women in numeracy. The difference in numeracy scores between men and women in New Zealand is 13 points, similar to the OECD average of 12 points, in favour of men. The gender gap in numeracy is notable, however, at the highest proficiency levels: only 10.6% of women attain Level 4 or 5 in numeracy compared to 19.3% of men who do. Women and men score similarly across all proficiency levels in problem solving in technology-rich environments.
The strength of the association between parents’ education and proficiency is weaker in New Zealand than in many countries. There is a 29-point difference in literacy scores between adults with at least one parent who attained tertiary education and adults with neither parent having attained upper secondary education (the OECD average difference is 40 score points). A similar relationship is observed between parents’ education and proficiency in numeracy. An adult with highly educated parents scores 33 points higher in numeracy, on average, than an adult with low-educated parents (the OECD average difference is 43 score points).
New Zealand – Country Note – Skills Matter: Further Results from the Survey of Adult Skills
© OECD 2016 11
Figure 8. Synthesis of socio-demographic differences in literacy proficiency
Difference in literacy scores between contrast categories within various socio-demographic groups
Notes: Statistically significant differences are marked in a darker tone. The estimates show the differences between the two means for each contrast category). The differences are: tertiary minus less than upper secondary (educational attainment), at least one parent attained tertiary minus neither parent attained upper secondary (parents' educational attainment) and 25-34 year-olds minus 55-65 year-olds (age).
Source: Survey of Adult Skills (PIAAC) (2012, 2015), Tables A3.2(L), A3.5 (L), A3.9 (L) and A3.14 (L) (http://dx.doi.org/10.1787/888933366463)
Most workers in New Zealand are well-matched with their jobs.
The survey collected information about the frequency with which workers use information-processing and various generic skills in the workplace. Adults in New Zealand read, write, work with mathematics, solve problems and use computers in their jobs and in everyday life slightly more than the average across the OECD countries participating in the survey. In general, the match between the literacy skills of New Zealand’s workers and the literacy skills demanded in their jobs is similar in degree to that observed in other participating OECD countries. In New Zealand, around 10% of workers have a higher level of proficiency in literacy than is required for their job (overskilled) and around 4% of workers have a lower level of proficiency than is required for their job (underskilled).
Similarly, 12% of workers are overskilled and around 3% are underskilled in numeracy.
Difference in literacy scores between contrast categories within various socio-demographic groups
10
0
10
20
30
40
50
60
70
Educational attainment Parents' educationalattainment
Age Gender
New Zealand OECD averageScore-point difference

New Zealand – Country Note – Skills Matter: Further Results from the Survey of Adult Skills
12 © OECD 2016
Figure 9. Information-processing skills used at work
Average skills use, working population aged 16-65
Notes: For reading, writing, numeracy and ICT skills, skills use indicators are scales between 1 "Never" and 5 "Every day". Problem-solving skills use refers to respondents' answers to “How often are you usually confronted with more complex problems that take at least 30 minutes to find a good solution?”. The set of possible answers also ranges between 1 "Never" and 5 "Every day".
Source: Survey of Adult Skills (PIAAC) (2012, 2015), Table A4.1 (http://dx.doi.org/10.1787/888933366479).
In New Zealand, even more so than in other participating OECD countries, higher proficiency in literacy and numeracy have a positive impact on labour force participation and wages.
In all participating countries and economies, adults with higher proficiency in literacy, numeracy and problem solving in technology-rich environments are more likely to participate in the labour market and to be employed, and are less likely to be unemployed, than adults with lower proficiency, on average.
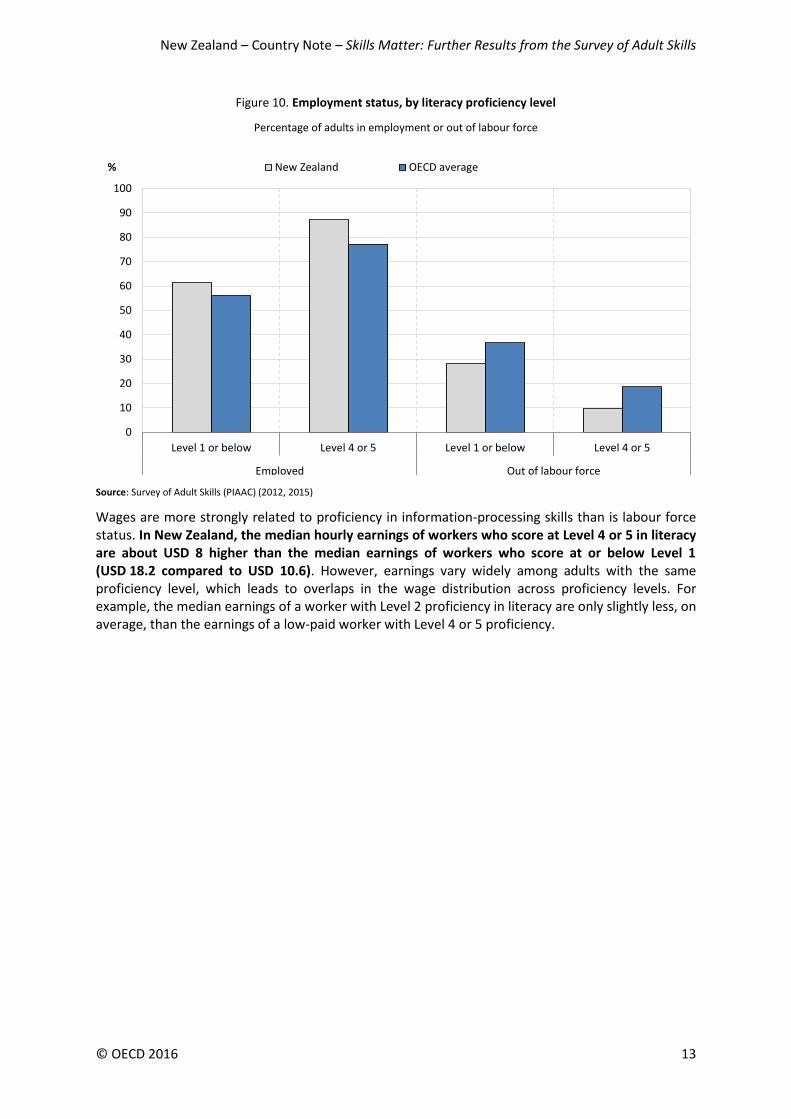
Some 87.3% of adults in New Zealand who score at Level 4 or 5 in literacy are employed, while only 61.5% of those who score at or below Level 1 are employed. This is somewhat larger difference than the one observed in other participating OECD countries where corresponding employment rates for adults with high and low proficiency in literacy are 77.1% and 56.1% respectively. Only 9.7% of New Zealand’s highly proficient adults are out of labour force compared to 28.4% of New Zealand’s least proficient adults.
1
1.5
2
2.5
3
3.5
Reading at work Writing at work Numeracy at work ICT at work Problem solving
New Zealand OECD averageMean use
New Zealand – Country Note – Skills Matter: Further Results from the Survey of Adult Skills
© OECD 2016 13
Figure 10. Employment status, by literacy proficiency level
Percentage of adults in employment or out of labour force
Source: Survey of Adult Skills (PIAAC) (2012, 2015)
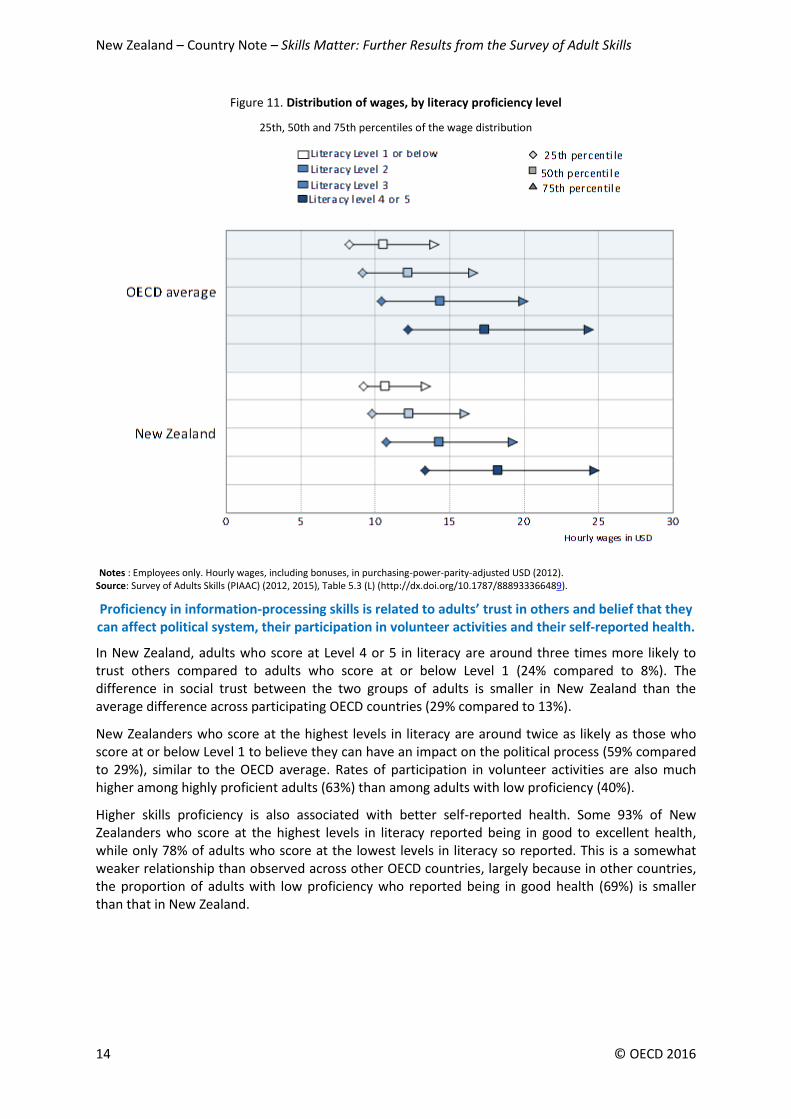
Wages are more strongly related to proficiency in information-processing skills than is labour force status. In New Zealand, the median hourly earnings of workers who score at Level 4 or 5 in literacy are about USD 8 higher than the median earnings of workers who score at or below Level 1 (USD 18.2 compared to USD 10.6). However, earnings vary widely among adults with the same proficiency level, which leads to overlaps in the wage distribution across proficiency levels. For example, the median earnings of a worker with Level 2 proficiency in literacy are only slightly less, on average, than the earnings of a low-paid worker with Level 4 or 5 proficiency.
0
10
20
30
40
50
60
70
80
90
100
Level 1 or below Level 4 or 5 Level 1 or below Level 4 or 5
Employed Out of labour force
% New Zealand OECD average
New Zealand – Country Note – Skills Matter: Further Results from the Survey of Adult Skills
14 © OECD 2016
Figure 11. Distribution of wages, by literacy proficiency level
25th, 50th and 75th percentiles of the wage distribution
Notes : Employees only. Hourly wages, including bonuses, in purchasing-power-parity-adjusted USD (2012). Source: Survey of Adults Skills (PIAAC) (2012, 2015), Table 5.3 (L) (http://dx.doi.org/10.1787/888933366489).
Proficiency in information-processing skills is related to adults’ trust in others and belief that they can affect political system, their participation in volunteer activities and their self-reported health.
In New Zealand, adults who score at Level 4 or 5 in literacy are around three times more likely to trust others compared to adults who score at or below Level 1 (24% compared to 8%). The difference in social trust between the two groups of adults is smaller in New Zealand than the average difference across participating OECD countries (29% compared to 13%).
New Zealanders who score at the highest levels in literacy are around twice as likely as those who score at or below Level 1 to believe they can have an impact on the political process (59% compared to 29%), similar to the OECD average. Rates of participation in volunteer activities are also much higher among highly proficient adults (63%) than among adults with low proficiency (40%).
Higher skills proficiency is also associated with better self-reported health. Some 93% of New Zealanders who score at the highest levels in literacy reported being in good to excellent health, while only 78% of adults who score at the lowest levels in literacy so reported. This is a somewhat weaker relationship than observed across other OECD countries, largely because in other countries, the proportion of adults with low proficiency who reported being in good health (69%) is smaller than that in New Zealand.

New Zealand – Country Note – Skills Matter: Further Results from the Survey of Adult Skills
© OECD 2016 15
Figure 12. Literacy proficiency and positive social outcomes
Difference between the percentage of adults with high proficiency (Level 4 or 5) and the percentage of adults with low proficiency (Level 1 or below) who reported high levels of trust and political efficacy, good to excellent health, or
participating in volunteer activities
Notes: All differences are statistically significant.
Source: Survey of Adult Skills (PIAAC) (2012, 2015), Table A5.14(L) (http://dx.doi.org/10.1787/888933366489).
0
5
10
15
20
25
30
35
High levels of politicalefficacy
Participation involunteer activities
High levels of health High levels of trust
New Zealand OECD AveragePercentage-point change

New Zealand – Country Note – Skills Matter: Further Results from the Survey of Adult Skills
16 © OECD 2016
Key facts about the Survey of Adult Skills (PIAAC)
What is assessed
The Survey of Adult Skills (PIAAC) assesses the proficiency of adults from age 16 in literacy, numeracy and problem solving in technology-rich environments. These skills are “key information-processing competencies” that are relevant to adults in many social contexts and work situations, and necessary for fully integrating and participating in the labour market, education and training, and social and civic life.
In addition, the survey collects a range of information on the reading- and numeracy-related activities of respondents, the use of information and communication technologies at work and in everyday life, and on a range of generic skills, such as collaborating with others and organising one’s time, that are required of individuals in their work. Respondents are also asked whether their skills and qualifications match their work requirements and whether they have autonomy over key aspects of their work.
Methods
The Survey of Adults Skills was conducted over two rounds of data collection.
In the first round, around 166 000 adults aged 16-65 years in 24 countries were surveyed – Australia, Austria, Belgium, Canada, Cyprus,* the Czech Republic, Denmark, Estonia, Finland, France, Germany, Ireland, Italy, Japan, Korea, the Netherlands, Norway, Poland, the Russian Federation, the Slovak Republic, Spain, Sweden, the United Kingdom and the United States. In all but three countries, data collection covered the entire national population. In Belgium, data were collected in Flanders; in the United Kingdom, data were collected in England and Northern Ireland (data are reported separately for England and Northern Ireland in the report). In the Russian Federation, the data do not cover the Moscow municipal area.
Data collection for Round 1 of the Survey of Adult Skills took place from 1 August 2011 to 31 March 2012 in most participating countries. In Canada, data were collected from November 2011 to June 2012; and France collected data from September to November 2012.
Nine countries took part in the second round of the assessment: Chile, Greece, Indonesia, Israel, Lithuania, New Zealand, Singapore, Slovenia and Turkey. A total of 50 250 adults were surveyed. In all countries except Indonesia the entire national population was covered. In Indonesia, data were collected in the Jakarta municipal area only.
Data collection for Round 2 of the Survey of Adult Skills took place from April 2014 to end-March 2015. The duration of fieldwork varied from around 100 to 330 days, depending on the country.
The language of assessment was the official language(s) of each participating country/economy. In some countries, the assessment was also conducted in widely spoken minority or regional languages.
The target population for the survey was the non-institutionalised population of 16-65 year-olds residing in the country or region at the time of the data collection, irrespective of nationality, citizenship or language status. The achieved national samples ranged from a minimum of approximately 4 000 persons to a maximum of nearly 27 300 persons.
The survey was conducted under the supervision of trained interviewers usually in the respondent’s home. The time taken to complete the questionnaire ranged between 30 and 45 minutes.

New Zealand – Country Note – Skills Matter: Further Results from the Survey of Adult Skills
© OECD 2016 17
After having answered the background questionnaire, the respondent completed the assessment either on a laptop computer or by completing a paper version using printed test booklets, depending on the respondent’s computer skills. Respondents could take as much or as little time as needed to complete the assessment. On average, respondents took 50 minutes to complete the cognitive assessment.
Identical instruments were used in Rounds 1 and 2 of the survey. The one exception was in Jakarta (Indonesia) where, since only paper-based instruments were used, additional test items were added to the paper-based instruments used in the other countries.
Comparing the results of countries/economies in Round 1 and Round 2
Identical data-collection instruments and methodology were used in Rounds 1 and 2 of the survey. The one difference is that data collection for Rounds 1 and 2 occurred some three years apart. The difference in reference dates for the two rounds of the study is unlikely to have an impact on the proficiency of the adult populations in Round 1 countries/economies compared to that of adults in Round 2 countries/economies. However, data were collected at different points in the economic cycle in the two rounds; this may have some effect on the relationships observed between proficiency and labour market outcomes and jobs characteristics, in particular, in the countries/economies in the two different rounds.
Notes
* See note under figure 1.
** The data from the Russian Federation are preliminary and may be subject to change. Readers should note that the sample for the Russian Federation does not include the population of the Moscow municipal area. The data published, therefore, do not represent the entire resident population aged 16-65 in Russia but rather the population of Russia excluding the population residing in the Moscow municipal area.
More detailed information regarding the data from the Russian Federation as well as that of other countries can be found in the Technical Report of the Survey of Adult Skills, Second Edition (OECD, forthcoming).
References and further reading
OECD (forthcoming), Technical Report of the Survey of Adult Skills, Second Edition.
OECD (2016a), Skills Matter: Further Results from the Survey of Adult Skills, OECD Skills Studies, OECD Publishing, Paris, http://dx.doi.org/10.1787/9789264258051-en.
OECD (2016b), The Survey of Adult Skills: Reader's Companion, Second Edition, OECD Skills Studies, OECD Publishing, Paris, http://dx.doi.org/10.1787/9789264258075-en.
OECD (2016c), Survey of Adult Skills (PIAAC) (Database 2012, 2015), www.oecd.org/site/piaac/public
dataandanalysis.htm.
This work is published under the responsibility of the Secretary-General of the OECD. The opinions expressed and
arguments employed herein do not necessarily reflect the official views of OECD member countries.
This document and any map included herein are without prejudice to the status of or sovereignty over any territory, to the
delimitation of international frontiers and boundaries and to the name of any territory, city or area.
You can copy, download or print OECD content for your own use, and you can include excerpts from OECD publications,
databases and multimedia products in your own documents, presentations, blogs, websites and teaching materials,
provided that suitable acknowledgment of OECD as source and copyright owner is given. All requests for public or
commercial use and translation rights should be submitted to [email protected]. Requests for permission to photocopy
portions of this material for public or commercial use shall be addressed directly to the Copyright Clearance Center (CCC) at
[email protected] or the Centre français d’exploitation du droit de copie (CFC) at [email protected].

New Zealand – Country Note – Skills Matter: Further Results from the Survey of Adult Skills
18 © OECD 2016
Description of proficiency levels in literacy and numeracy
Level Score range
Literacy Numeracy
Below Level
1
Below 176 points
Tasks at this level require the respondent to read brief texts on familiar topics and locate a single piece of specific information. There is seldom any competing information in the text. Only basic vocabulary knowledge is required, and the reader is not required to understand the structure of sentences or paragraphs or make use of other text features.
Tasks at this level require the respondent to carry out simple processes such as counting, sorting, performing basic arithmetic operations with whole numbers or money, or recognising common spatial representations.
1 176 to less than 226
points
Tasks at this level require the respondent to read relatively short digital or print texts to locate a single piece of information that is identical to or synonymous with the information given in the question or directive. Knowledge and skill in recognising basic vocabulary, determining the meaning of sentences, and reading paragraphs of text is expected.
Tasks at this level require the respondent to carry out basic mathematical processes in common, concrete contexts where the mathematical content is explicit. Tasks usually require one-step or simple processes involving counting; sorting; performing basic arithmetic operations; and identifying elements of simple or common graphical or spatial representations.
2 226 to less than 276
points
Tasks at this level require the respondent to make matches between the text, either digital or printed, and information, and may require paraphrasing or low-level inferences.
Tasks at this level require the application of two or more steps or processes involving calculation with whole numbers and common decimals, percents and fractions; simple measurement and spatial representation; estimation; and interpretation of relatively simple data and statistics in texts, tables and graphs.
3 276 to less than 326
points
Texts at this level are often dense or lengthy. Understanding text and rhetorical structures is often required, as is navigating complex digital texts.
Tasks at this level require the application of number sense and spatial sense; recognising and working with mathematical relationships, patterns, and proportions expressed in verbal or numerical form; and interpreting data and statistics in texts, tables and graphs.
4 326 to less than 376
points
Tasks at this level often require the respondent to perform multiple-step operations to integrate, interpret, or synthesise information from complex or lengthy texts. Many tasks require identifying and understanding one or more specific, non-central idea(s) in the text in order to interpret or evaluate subtle evidence-claim or persuasive discourse relationships.
Tasks at this level require analysis and more complex reasoning about quantities and data; statistics and chance; spatial relationships; and change, proportions and formulas. They may also require understanding arguments or communicating well-reasoned explanations for answers or choices.
5 Equal to or higher
than 376 points
Tasks at this level may require the respondent to search for and integrate information across multiple, dense texts; construct syntheses of similar and contrasting ideas or points of view; or evaluate evidence based arguments. They often require respondents to be aware of subtle, rhetorical cues and to make high-level inferences or use specialised background knowledge.
Tasks at this level may require the respondent to integrate multiple types of mathematical information where considerable translation or interpretation is required; draw inferences; develop or work with mathematical arguments or models; and critically reflect on solutions or choices.

New Zealand – Country Note – Skills Matter: Further Results from the Survey of Adult Skills
© OECD 2016 19
Description of proficiency levels in problem solving in technology-rich environments
Level Score range The types of tasks completed successfully at each level of proficiency
No computer experience
Not applicable
Adults in this category reported having no prior computer experience; therefore, they did not take part in the computer-based assessment but took the paper-based version of the assessment, which does not include the problem solving in technology-rich environment domain.
Failed ICT core Not applicable
Adults in this category had prior computer experience but failed the ICT core test, which assesses basic ICT skills, such as the capacity to use a mouse or scroll through a web page, needed to take the computer-based assessment. Therefore, they did not take part in the computer-based assessment, but took the paper-based version of the assessment, which does not include the problem solving in technology-rich environment domain.
“Opted out” of taking
computer-based
assessment
Not applicable
Adults in this category opted to take the paper-based assessment without first taking the ICT core assessment, even if they reported some prior experience with computers. They also did not take part in the computer-based assessment, but took the paper-based version of the assessment, which does not include the problem solving in technology-rich environment domain.
Below Level 1 Below 241 points
Tasks are based on well-defined problems involving the use of only one function within a generic interface to meet one explicit criterion without any categorical or inferential reasoning, or transforming of information. Few steps are required and no sub-goal has to be generated.
1 241 to less than 291
points
At this level, tasks typically require the use of widely available and familiar technology applications, such as e-mail software or a web browser. There is little or no navigation required to access the information or commands required to solve the problem. The tasks involve few steps and a minimal number of operators. Only simple forms of reasoning, such as assigning items to categories, are required; there is no need to contrast or integrate information.
2 291 to less than 341
points
At this level, tasks typically require the use of both generic and more specific technology applications. For instance, the respondent may have to make use of a novel online form. Some navigation across pages and applications is required to solve the problem. The task may involve multiple steps and operators. The goal of the problem may have to be defined by the respondent, though the criteria to be met are explicit.
3 Equal to or higher than 341 points
At this level, tasks typically require the use of both generic and more specific technology applications. Some navigation across pages and applications is required to solve the problem. The task may involve multiple steps and operators. The goal of the problem may have to be defined by the respondent, and the criteria to be met may or may not be explicit. Integration and inferential reasoning may be needed to a large extent.

New Zealand – Country Note – Skills Matter: Further Results from the Survey of Adult Skills
20 © OECD 2016
Contacts: Andreas Schleicher Director Directorate for Education and Skills Email: [email protected] Telephone: +33 6 07 38 54 64 Stefano Scarpetta Director Directorate for Employment Labour and Social Affairs Email: [email protected] Telephone: +33 1 45 24 19 88 Milos Kankaras Analyst, Skills Beyond School Division Directorate for Education and Skills Email: [email protected] Telephone: +33 1 45 24 79 60
For more information on the Survey of Adult Skills (PIAAC) visit:
www.oecd.org/site/piaac