oecd environmental performance review - new zealand 2017 - launch presentation
TRANSCRIPT

OECD Environmental Performance Reviews
New Zealand 2017Simon Upton
OECD Environment Director
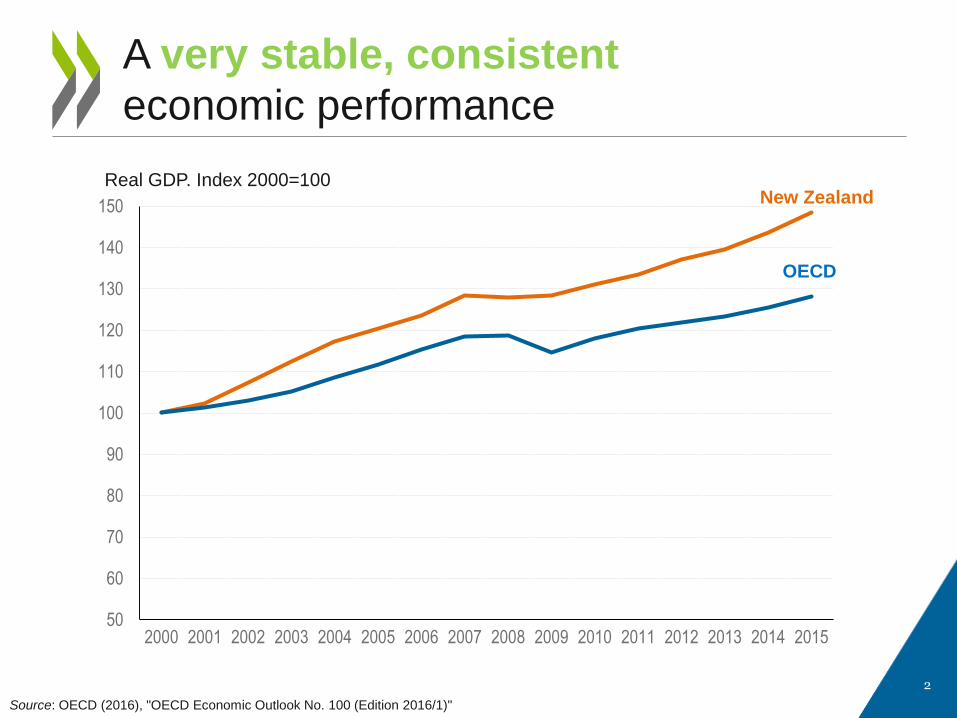
A very stable, consistent
economic performance
2
50
60
70
80
90
100
110
120
130
140
150
2000 2001 2002 2003 2004 2005 2006 2007 2008 2009 2010 2011 2012 2013 2014 2015
Real GDP. Index 2000=100New Zealand
OECD
Source: OECD (2016), "OECD Economic Outlook No. 100 (Edition 2016/1)"

But growth in GDP per capita is held back
by slow labour productivity growth
3
-1
0
1
2
3
4
5
Labour resource utilisation
Labour productivity
Breakdown of GDP per capita growth during 1995-2015
OECD: Population-weighted average.
Source: OECD (2017), National Accounts and Labour Market Statistics databases.

Broader assessment: a good score
on the OECD Better Life Index
4Source: OECD (2016), OECD Better Life Index, www.oecdbetterlifeindex.org.

New Zealand doing its share to achieve
Sustainable Development Goals
5
0
10
20
30
40
50
60
70
80
90
100
Scores New Zealand OECD
Source: Based on OECD (2016), Measuring Distance to the SDGs Targets

Economic growth in New Zealand is
lower when accounting for pollution
6
-1.4
-1.2
-1.0
-0.8
-0.6
-0.4
-0.2
0.0
0.2
0.4
0.6
0.8Percentage points
Pollution adjustment of GDP growth, top and bottom six OECD countries,percentage points of output growth, annual average 2000-13
Source “Environmentally adjusted multifactor productivity: Methodology and empirical results for OECD and G20 countries”, OECD Green Growth Papers, No. 2016/04
OECD top 6 OECD bottom 6

7
NZ has a low-carbon energy mix & the 4th
highest share of renewables in OECD
88%
46%45%
40%
32%
29%28%
27%
22%22%
18%17% 17%
16%
14%
12% 12%11%
10%9% 9% 9% 8% 8% 8% 8%
7% 7% 6%5% 5% 5% 5%
1%
% share of renewables in total primary energy supply, 2015
88%
n.a.
Source: IEA (2016), IEA World Energy Statistics and Balances (database).

8
Small GHG emitter but growing emissionsTop OECD emitters.

New Zealand is among the ten most
energy-intensive OECD countries
Source: IEA (2016), IEA World Energy Statistics and Balances (database).
0.00
0.05
0.10
0.15
0.20
0.25
Energy supply per unit of GDP, 2015Selected OECD countries
toe/USD 1 000 0.41
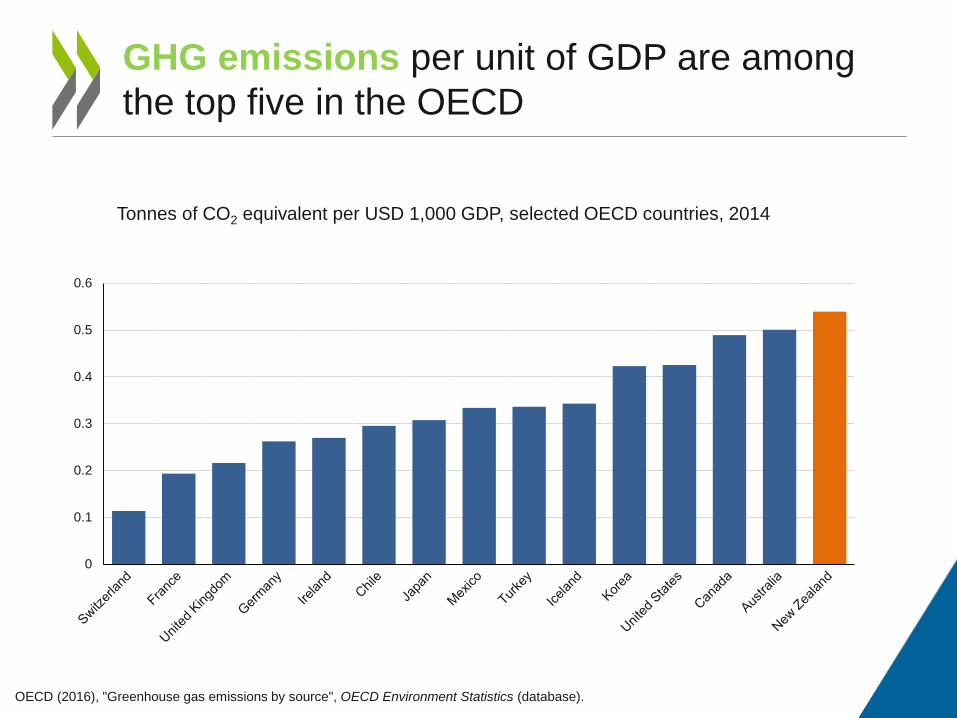
GHG emissions per unit of GDP are among
the top five in the OECD
0
0.1
0.2
0.3
0.4
0.5
0.6
Tonnes of CO2 equivalent per USD 1,000 GDP, selected OECD countries, 2014
OECD (2016), "Greenhouse gas emissions by source", OECD Environment Statistics (database).
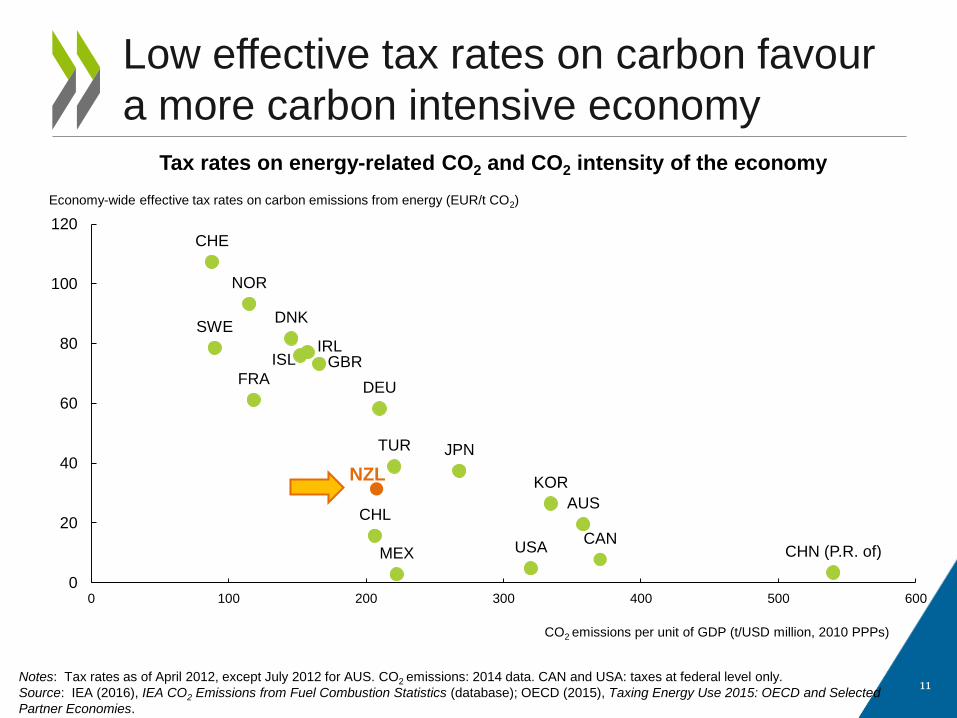
Low effective tax rates on carbon favour
a more carbon intensive economy
11
CHN (P.R. of)CAN
AUS
KOR
USA
JPN
MEX
TUR
DEU
NZL
CHL
GBRIRL
ISL
FRA
CHE
DNK
NOR
SWE
0
20
40
60
80
100
120
0 100 200 300 400 500 600
CO2 emissions per unit of GDP (t/USD million, 2010 PPPs)
Tax rates on energy-related CO2 and CO2 intensity of the economy
Notes: Tax rates as of April 2012, except July 2012 for AUS. CO2 emissions: 2014 data. CAN and USA: taxes at federal level only.
Source: IEA (2016), IEA CO2 Emissions from Fuel Combustion Statistics (database); OECD (2015), Taxing Energy Use 2015: OECD and Selected
Partner Economies.
Economy-wide effective tax rates on carbon emissions from energy (EUR/t CO2)
12
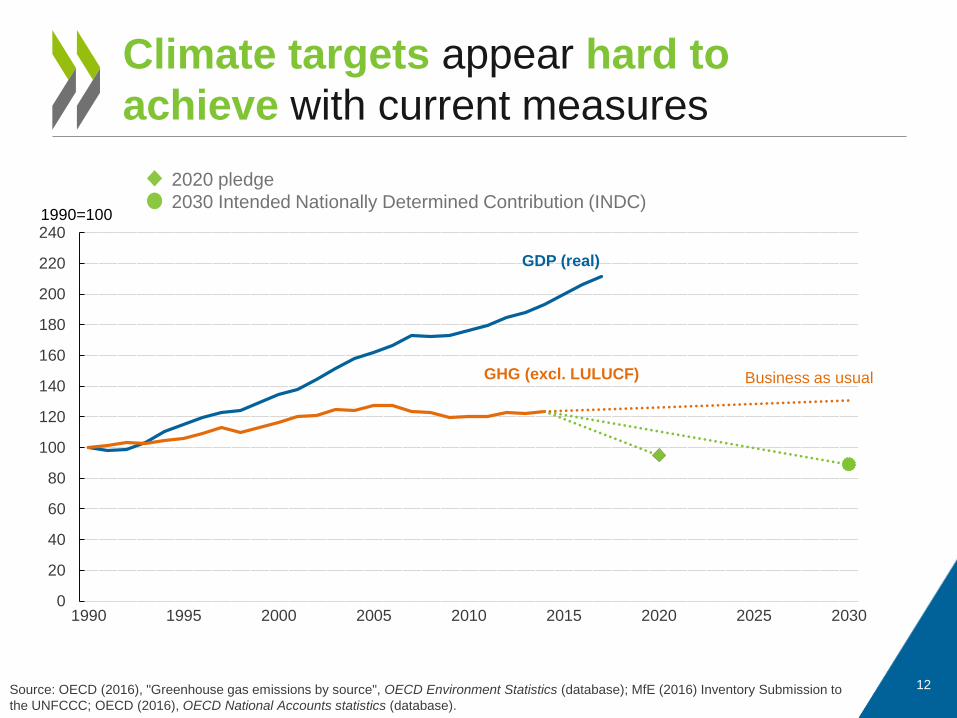
Climate targets appear hard to
achieve with current measures
Source: OECD (2016), "Greenhouse gas emissions by source", OECD Environment Statistics (database); MfE (2016) Inventory Submission to
the UNFCCC; OECD (2016), OECD National Accounts statistics (database).
2020 pledge
2030 Intended Nationally Determined Contribution (INDC)
0
20
40
60
80
100
120
140
160
180
200
220
240
1990 1995 2000 2005 2010 2015 2020 2025 2030
1990=100
GDP (real)
GHG (excl. LULUCF) Business as usual
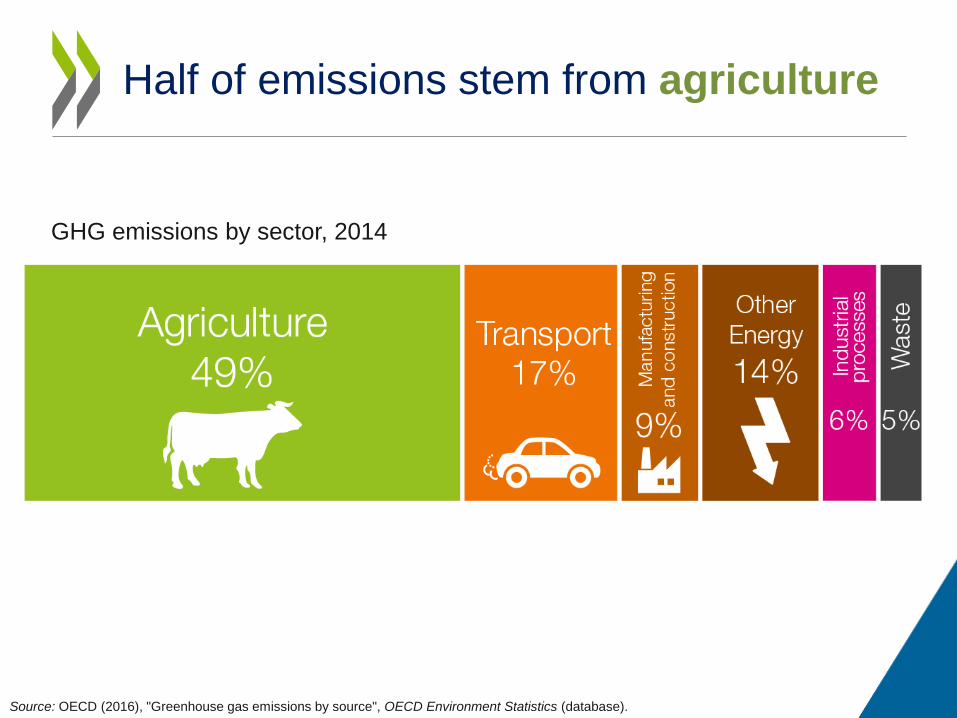
Half of emissions stem from agriculture
Source: OECD (2016), "Greenhouse gas emissions by source", OECD Environment Statistics (database).
GHG emissions by sector, 2014
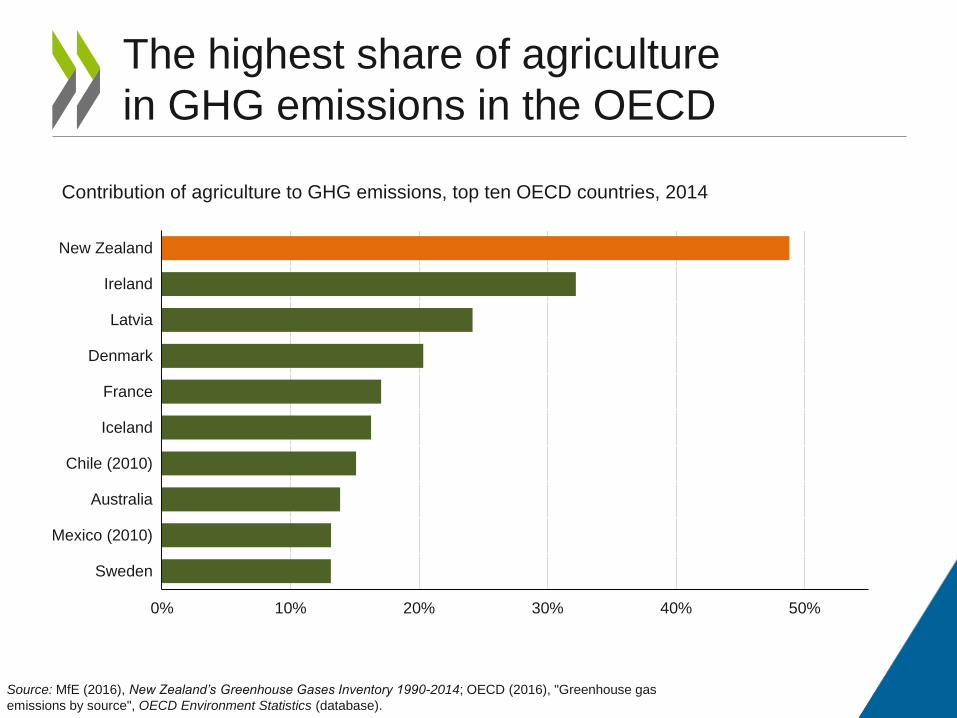
The highest share of agriculture
in GHG emissions in the OECD
0% 10% 20% 30% 40% 50%
New Zealand
Ireland
Latvia
Denmark
France
Iceland
Chile (2010)
Australia
Mexico (2010)
Sweden
Contribution of agriculture to GHG emissions, top ten OECD countries, 2014
Source: MfE (2016), New Zealand’s Greenhouse Gases Inventory 1990-2014; OECD (2016), "Greenhouse gas
emissions by source", OECD Environment Statistics (database).

Energy consumption - and associated
emissions - have increased in all sectors
60
70
80
90
100
110
120
130
140
2000 2002 2004 2006 2008 2010 2012 2014
Energy consumption, index 2000 = 100
Commercial
and services
Source: IEA (2016), IEA World Energy Statistics and Balances (database).
Industry and
construction
Residential
Agriculture
Transport
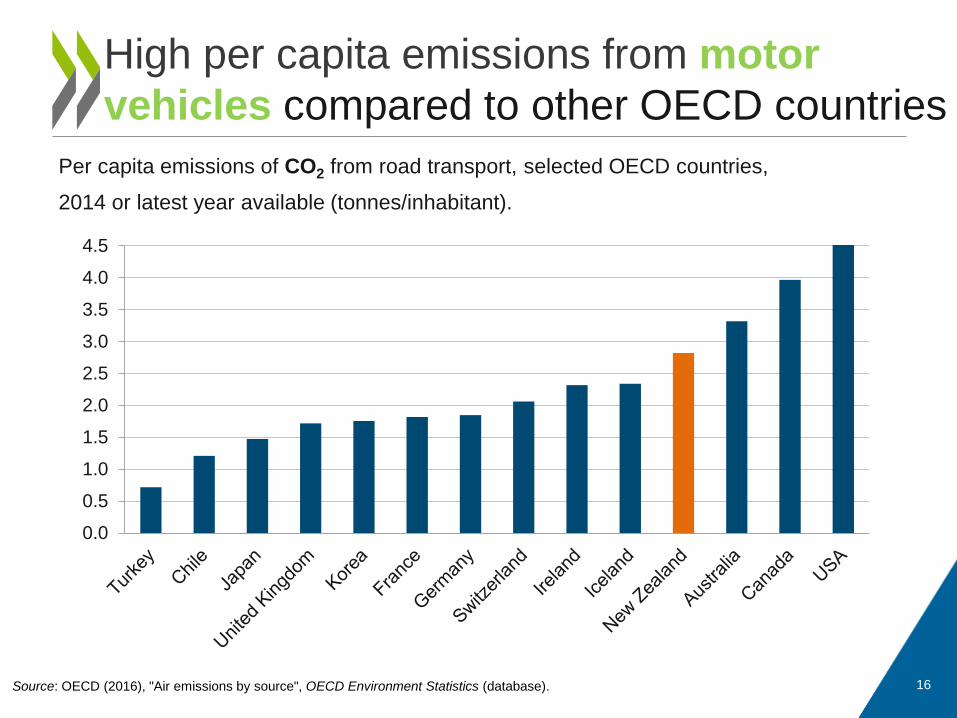
Per capita emissions of CO2 from road transport, selected OECD countries,
2014 or latest year available (tonnes/inhabitant).
High per capita emissions from motor
vehicles compared to other OECD countries
16Source: OECD (2016), "Air emissions by source", OECD Environment Statistics (database).
0.0
0.5
1.0
1.5
2.0
2.5
3.0
3.5
4.0
4.5

Per capita emissions of NOx from road transport, selected OECD countries,
2014 or latest year available (kg/inhabitant).
17Source: IEA (2016), IEA CO2 Emissions from Fuel Combustion Statistics (database);
0
2
4
6
8
10
12
14
16
18
High per capita emissions from motor
vehicles compared to other OECD countries
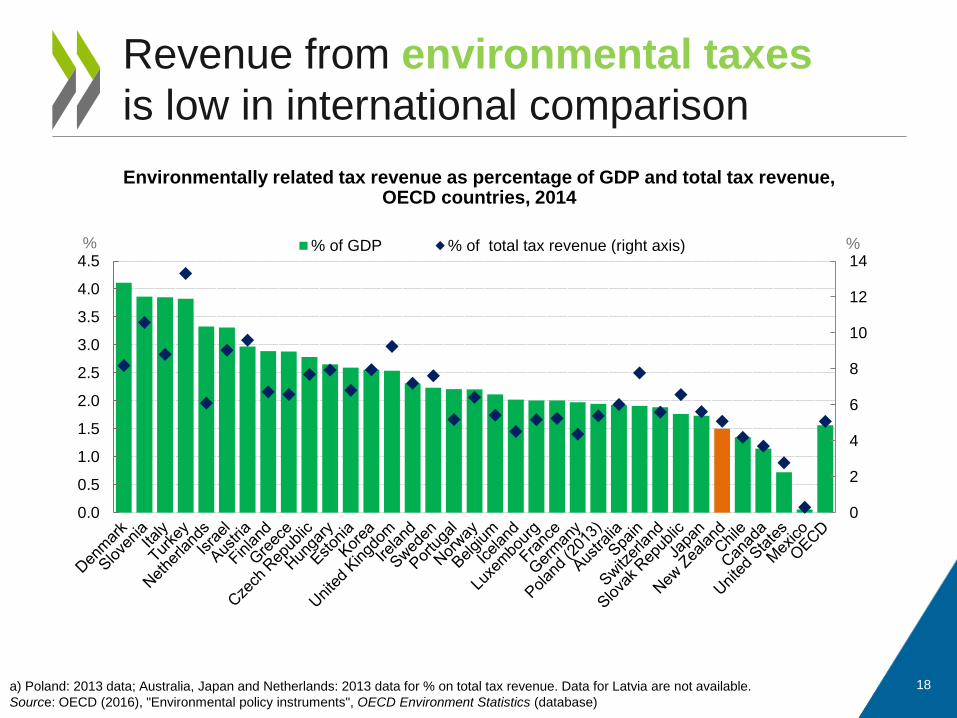
Environmentally related tax revenue as percentage of GDP and total tax revenue, OECD countries, 2014
Revenue from environmental taxes
is low in international comparison
18
0
2
4
6
8
10
12
14
0.0
0.5
1.0
1.5
2.0
2.5
3.0
3.5
4.0
4.5%% % of GDP % of total tax revenue (right axis)
a) Poland: 2013 data; Australia, Japan and Netherlands: 2013 data for % on total tax revenue. Data for Latvia are not available.
Source: OECD (2016), "Environmental policy instruments", OECD Environment Statistics (database)

Tax rates on road fuels are
among the lowest in the OECD
Tu
rke
y
Neth
erla
nd
s
Norw
ay
Ita
ly
Unite
d K
ingd
om
Gre
ece
Ge
rma
ny
Fin
lan
d
Sw
ed
en
Be
lgiu
m
Fra
nce
Sw
itze
rla
nd
Ire
lan
d
Den
ma
rk
Isra
el
Po
rtu
ga
l
Ja
pa
n
Au
str
ia
Slo
va
k R
ep
ub
lic
Cze
ch
Re
pu
blic
Ko
rea
Slo
ve
nia
Sp
ain
Lu
xe
mb
ou
rg
Esto
nia
Ice
lan
d
Hun
ga
ry
Po
lan
d
Ne
w Z
ea
lan
d
Chile
Au
str
alia
Can
ad
a
Un
ite
d S
tate
s
Me
xic
o
0
5
10
15
20
25
30
Tax rates on road fuels on an energy basis, 2012
Petrol (road use) Diesel (road use)
Tax rate (EUR per GJ)
Note: Tax rates are as of 1 April 2012, except 1 July 2012 for AUS. Figures for CAN and USA include only federal taxes. NZL applies a road-user
charge to diesel that is not included in the figure. Tax rates converted using standard carbon emission factors from the Intergovernmental Panel
on Climate Change and energy conversion factors from the IEA. Source: Adapted from OECD (2015),Taxing Energy Use.
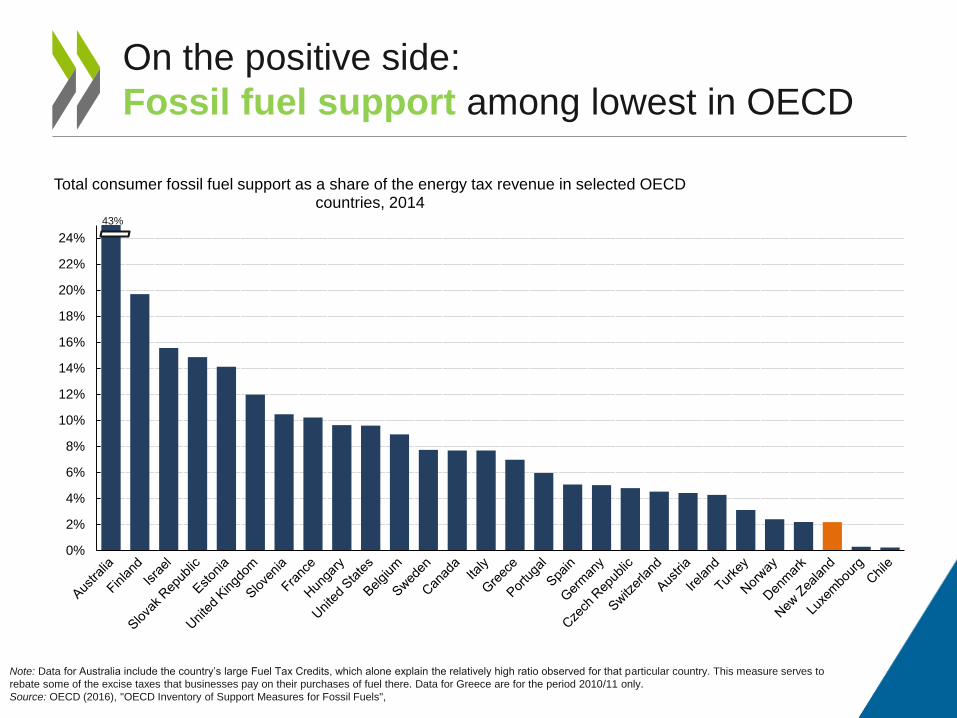
On the positive side:
Fossil fuel support among lowest in OECD
0%
2%
4%
6%
8%
10%
12%
14%
16%
18%
20%
22%
24%
Total consumer fossil fuel support as a share of the energy tax revenue in selected OECD countries, 2014
43%
Note: Data for Australia include the country’s large Fuel Tax Credits, which alone explain the relatively high ratio observed for that particular country. This measure serves to
rebate some of the excise taxes that businesses pay on their purchases of fuel there. Data for Greece are for the period 2010/11 only.
Source: OECD (2016), "OECD Inventory of Support Measures for Fossil Fuels",

Freshwater abstraction for agriculture
is high in international comparison
737
566563545
426
329
5846
NewZealand
UnitedStates
MexicoSpainJapanAustraliaCanadaFranceSwitzerlandUnitedKingdom
Per capita freshwater abstraction for agriculture, Selected OECD countries,
2014
2014 or latest available year. UK refers to England and Wales.
Source: OECD (2016), "Water: Freshwater Abstractions", OECD Environment Statistics (database).
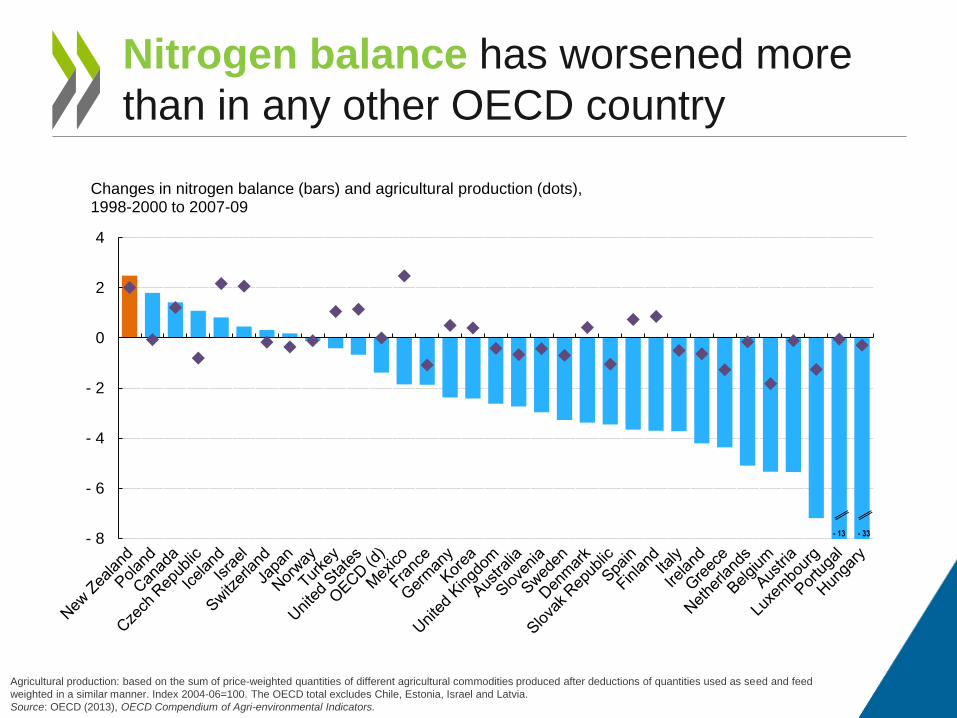
Nitrogen balance has worsened more
than in any other OECD country
- 8
- 6
- 4
- 2
0
2
4
Changes in nitrogen balance (bars) and agricultural production (dots), 1998-2000 to 2007-09
- 13 - 33
Agricultural production: based on the sum of price-weighted quantities of different agricultural commodities produced after deductions of quantities used as seed and feed
weighted in a similar manner. Index 2004-06=100. The OECD total excludes Chile, Estonia, Israel and Latvia.
Source: OECD (2013), OECD Compendium of Agri-environmental Indicators.

Northland
Auckland
Waikato
Bay of Plenty
Gisborne
Hawke's BayTaranakiManawatu-Wanganui
Wellington
Nelson and Tasman
Marlborough
West Coast
Canterbury
Otago
Southland
-10
0
10
20
30
40
50
-25 0 25 50 75 100 125 150 175 200 225 250
% increase in nitrogen pollution/year
Change in land area used for dairy farming (1 000 ha)
Predicted changes in nitrogen pollution of freshwater forecasted
with large-scale land-use change to dairy farming: 1996-2020
Land-use change to dairy farming
is predicted to increase nitrogen loads
Source: PCE (2013), Water quality in New Zealand: Land use and nutrient pollution

01020304050
National marine protected areas
Additional area
88%
0 10 20 30 40
Germany
Greece
New Zealand
UK
Spain
France
Chile
Japan
Iceland
Australia
Ireland
United States
Mexico
Canada
Korea
Strict natural reserves, wilderness areas or national parks
Natural monument, habitat/species management area
Protected landscape, protected area, or no category
Regional or international designation
Aichi target
A very high share of the territory is
protected areas
IUCN categories:
% terrestrial and marine area under protection, selected OECD countries, April 2016 data. Preliminary results.
Source: OECD calculations based on WDPA , April 2016

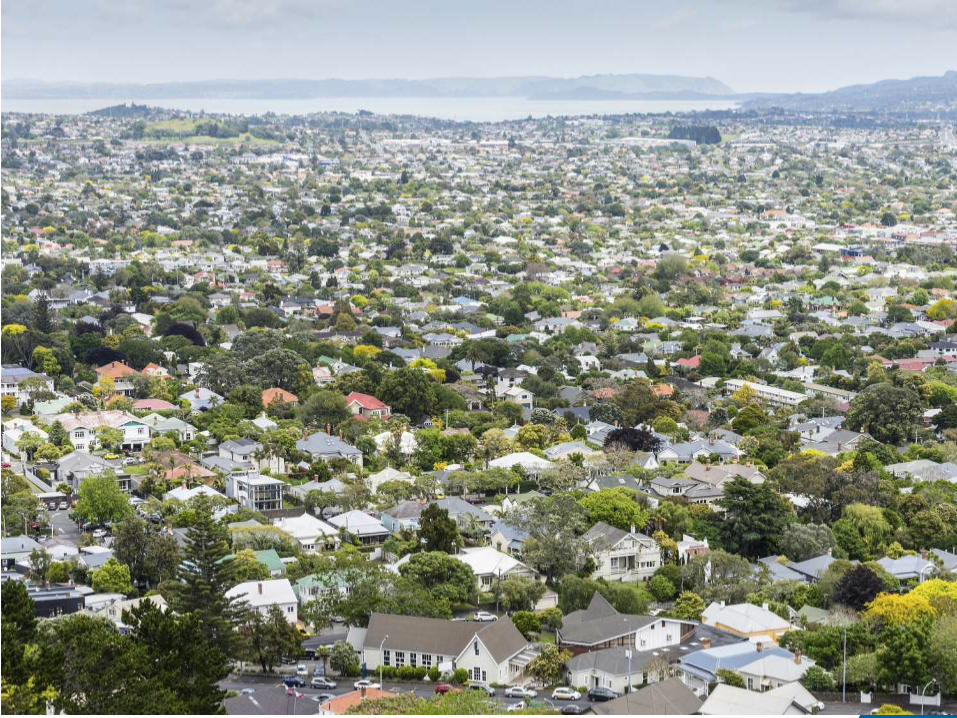
Population is growing
in largest cities and towns
Auckland + 30% since 2000
Hamilton + 31%
Tauranga + 36%
26

OECD Environmental Performance Reviews
New Zealand 2017Simon Upton
OECD Environment Director