new york state: fisheries study work plan
TRANSCRIPT

New York State: Fisheries Study
Work Plan
Case 18-T-0604
DRAFT April 2021

NEW YORK STATE: FISHERIES STUDY WORK PLAN
Table of Contents
ABBREVIATIONS ..................................................................................................................... II
1.0 OVERVIEW .................................................................................................................... 1
LIST OF ATTACHMENTS
Attachment A – Fisheries Working Group Member List Attachment B – Study 1: South Fork Wind Telemetry Project Attachment C – Study 2: South Fork Wind Trawl Survey

NEW YORK STATE: FISHERIES STUDY WORK PLAN
Abbreviations
CCE Cornell University Cooperative Extension
FSWG Fisheries Study Work Group
SFEC South Fork Export Cable
SME Subject Matter Expert
SBU Stony Brook University

NEW YORK STATE: FISHERIES STUDY WORK PLAN
OVERVIEW
1
1.0 OVERVIEW
South Fork Wind, LLC (SFW) is partnering with research institutions and universities in New York and New
Jersey to conduct two field studies to investigate the potential impacts of the installation and operation of
the South Fork Export Cable (SFEC) on marine fish and invertebrates. As set forth in Certificate Condition
137, this Fisheries Study Work Plan (Plan) includes a passive acoustic telemetry study and a trawl survey
that will be conducted for the portion of the SFEC located in New York State. These studies were developed
with consideration given to the Bureau of Ocean Management (BOEM) Guidance1 on fisheries monitoring,
as well as the emerging guidance from the Responsible Offshore Science Alliance (ROSA).
The Plan was developed over the course of several meetings held between March 2020 and April 2021
with various members of the Fisheries Studies Working Group (FSWG), which is comprised of
representatives from the New York State Department of Environmental Conservation (NYSDEC), New York
State Department of State (NYSDOS), New York State Department of Public Service (NYSDPS), the Town
of East Hampton, the Trustees of the Freeholders and Commonalty of the Town of East Hampton
(Trustees), the Long Island Commercial Fishing Association (LICFA); subject matter experts (SMEs) from
Stony Brook University (SBU), Cornell University Cooperative Extension (CCE), and Monmouth University;
and permitting specialists from SFW (see Attachment A).
The studies described below will be funded by SFW for five years, with field efforts commencing in 2021.
The timing is intended to collect information prior to, and during installation and operation of the SFEC. The
primary objective of the monitoring studies is to investigate changes in the abundance and species
composition of commercially, recreationally, and ecologically important fish and invertebrate species along
the SFEC route in New York state waters. In particular, the monitoring studies will collect data on the
seasonal abundance, migration patterns, and composition of the near shore fish and invertebrate
community on and around the SFEC route. The primary species of interest for monitoring, overall research
questions and goals were identified during FSWG meetings. Input from the SMEs was used to scope out
the methods and protocols that supported the FSWG discussions. This coordination amongst the FSWG
will continue during the spring and summer of 2021 as field protocols may be further refined.
The study methodologies described in the Plan were designed to be consistent with sampling techniques
and protocols used by regional marine science research institutions. A passive acoustic telemetry study
(Study 1-Attachment B) will be carried out in collaboration with SMEs from SBU, Monmouth University, and
the CCE Program. Dr. Michael Frisk at SBU will serve as the Primary Investigator for the acoustic telemetry
study. Dr. Frisk is a Professor at SBU with numerous peer-reviewed publications and is widely regarded as
an expert in population ecology, life history, and migratory behavior. Passive acoustic telemetry is an ideal
technology to not only collect pre-construction data on species presence within wind energy areas, but also
to monitor and evaluate short and long-term impacts of subsea transmission cables on species presence,
1 Bureau of Ocean Energy Management Fishery Guidelines

NEW YORK STATE: FISHERIES STUDY WORK PLAN
OVERVIEW
2
distribution, and persistence. Passive acoustic telemetry can monitor animal presence and movements
across a range of spatial and temporal scales. For instance, each passive acoustic receiver provides
information on the fine-scale (tens to hundreds of meters) residence and movement of marine organisms
and also offer continuous monitoring, for behavior, movements, and residence to be investigated at a fine
temporal scale (e.g., diel, tidal). By leveraging observations collected across individual receivers, and
receiver arrays, passive acoustic telemetry can also monitor animal presence and movement over a broad
spatial and temporal extent.
In support of various marine research efforts, hundreds to thousands of acoustic receivers are deployed
annually in the northwest Atlantic Ocean from the Gulf of St Lawrence to the Gulf of Mexico. Each of the
receivers is capable of detecting the thousands of active acoustic transmitters that are currently deployed
on at least 40 fish species and includes those described as pelagic, benthic, and highly migratory. The
telemetry study will provide high-resolution information on the behavior and seasonal movements of striped
bass, black sea bass, skates, summer flounder and winter flounder around the SFEC, and at other locations
along the southern coast of Long Island, New York. These commercially and recreationally important
species and were recognized by local stakeholders as a priority for research.
The trawl survey will be executed in collaboration with researchers from the CCE and SBU, with Dr. Scott
Curatolo-Wagemann from CCE serving as the Primary Investigator. Trawl surveys are commonly used to
understand changes in the distribution, abundance, and demographics of marine fish and invertebrates,
and there are several long-running fishery independent trawl surveys in the region, which are executed by
various state, federal, and academic research institutions. The trawl survey will be a seasonal trawl survey
and will utilize the same sampling small mesh trawl gear as the Northeast Area Assessment and Monitoring
Program (NEAMAP) trawl survey that is completed biannually by the Virginia Institute of Marine Science.
The use of small mesh trawl equipment will sample a wide range of size and age classes that will be
comparable with other which will other similar regional trawl monitoring efforts. Further, the use of a small
mesh trawl will allow for important forage species, such as menhaden, sand lance, bay anchovy, Atlantic
herring, and squid to be sampled effectively. The SFEC trawl survey will be executed using a Before-After-
Control-Impact study design, which is a common ecological sampling technique to assess whether changes
in biological populations are the result of an anthropogenic stressor, in this case installation and operation
of the SFEC. CCE will collaborate with local Long Island commercial fishermen and execute the trawl survey
from fishing vessels as feasible.
Further details on the objectives, hypotheses, survey designs and protocols, and planned data analysis
associated with the two studies are included as Attachment B and Attachment C. These Work Plans were
developed in consultation with the SMEs that participated in the FSWG.

1
ATTACHMENT A Fisheries Studies Working Group Members
2
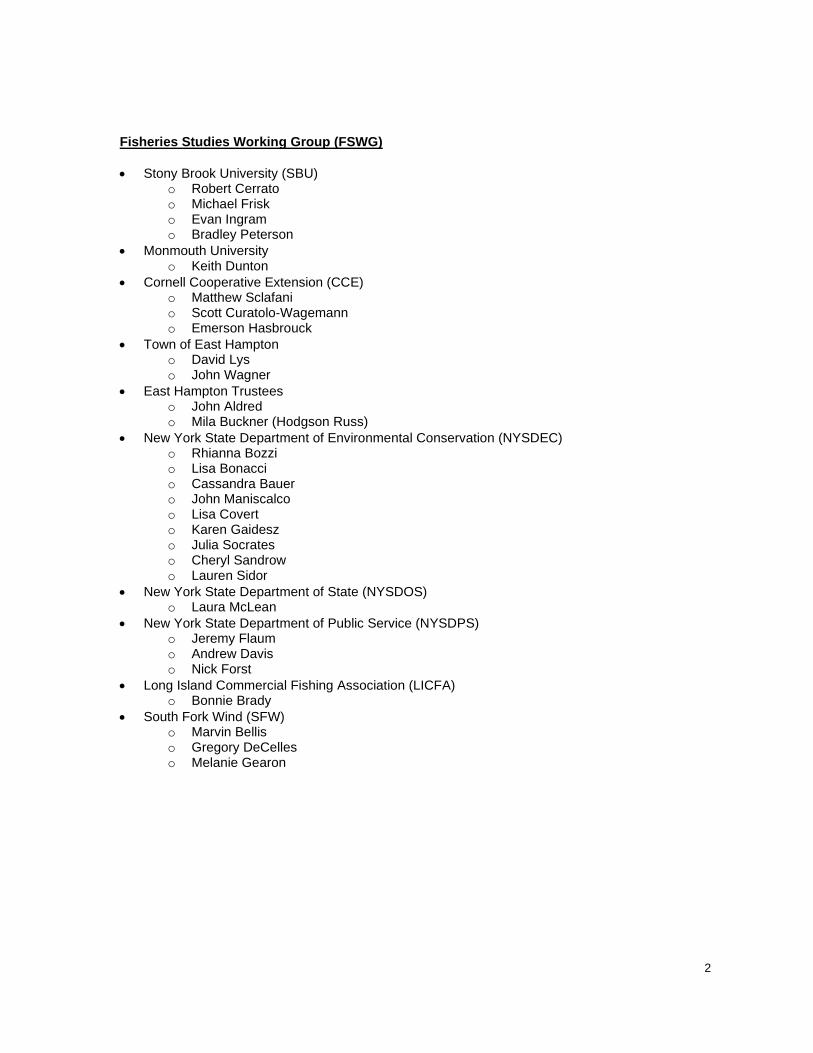
Fisheries Studies Working Group (FSWG)
• Stony Brook University (SBU) o Robert Cerrato o Michael Frisk o Evan Ingram o Bradley Peterson
• Monmouth University o Keith Dunton
• Cornell Cooperative Extension (CCE) o Matthew Sclafani o Scott Curatolo-Wagemann o Emerson Hasbrouck
• Town of East Hampton o David Lys o John Wagner
• East Hampton Trustees o John Aldred o Mila Buckner (Hodgson Russ)
• New York State Department of Environmental Conservation (NYSDEC) o Rhianna Bozzi o Lisa Bonacci o Cassandra Bauer o John Maniscalco o Lisa Covert o Karen Gaidesz o Julia Socrates o Cheryl Sandrow o Lauren Sidor
• New York State Department of State (NYSDOS) o Laura McLean
• New York State Department of Public Service (NYSDPS) o Jeremy Flaum o Andrew Davis o Nick Forst
• Long Island Commercial Fishing Association (LICFA) o Bonnie Brady
• South Fork Wind (SFW) o Marvin Bellis o Gregory DeCelles o Melanie Gearon
3
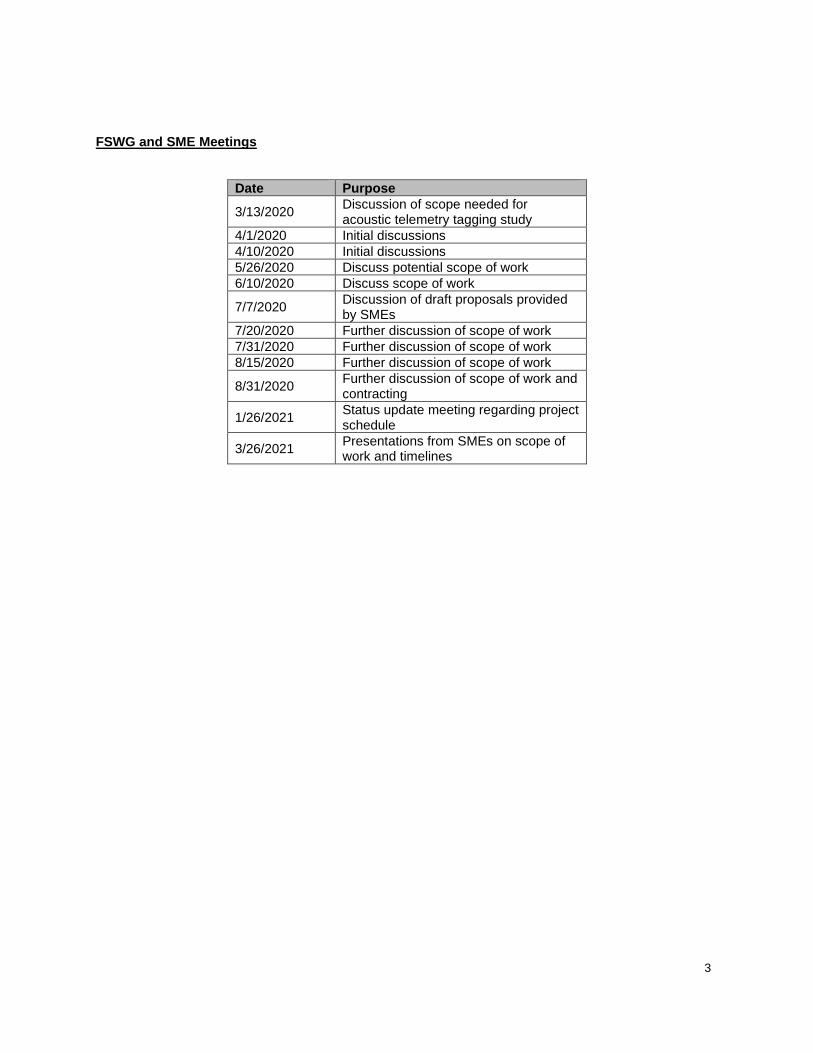
FSWG and SME Meetings
Date Purpose
3/13/2020 Discussion of scope needed for acoustic telemetry tagging study
4/1/2020 Initial discussions
4/10/2020 Initial discussions
5/26/2020 Discuss potential scope of work
6/10/2020 Discuss scope of work
7/7/2020 Discussion of draft proposals provided by SMEs
7/20/2020 Further discussion of scope of work
7/31/2020 Further discussion of scope of work
8/15/2020 Further discussion of scope of work
8/31/2020 Further discussion of scope of work and contracting
1/26/2021 Status update meeting regarding project schedule
3/26/2021 Presentations from SMEs on scope of work and timelines

4
ATTACHMENT B Study 1: South Fork Export Cable Telemetry Project

5
Study 1: South Fork Export Cable Telemetry Project
Study Plan Developed By:
Michael Frisk (Primary Investigator), Bradley Peterson, and Robert Cerrato
School of Marine and Atmospheric Sciences
Stony Brook University, Stony Brook, New York
Matthew Sclafani
Cornell University Cooperative Extension
Keith Dunton
Monmouth University
Hypothesis
H1: Movements and behavior of teleost and elasmobranch species will not be impacted
by the construction of the connecting cable or from the Electro-Magnetic Fields (EMFs)
produced by the SFEC.
The hypothesis will be evaluated by the estimation of movement metrics and the comparison of
movement and behavior in the near cable area vs. the greater New York region (see below).
Specifically, acceleration, depth, 3-d position, and residency will be compared between the
following: (1) west approach array, cable array, and east approach array; (2) SFEC vs.
Rockaway, Jones Beach, Fire Island, and Montauk arrays; and (3) pre- and post-construction
within the positional SFEC array.
Approach
Objectives:
(1) Implant individual teleost and elasmobranch species with acoustic positioning tags
(2) Deploy an acoustic array at SFEC that builds on existing arrays deployed at Rockaway,
Jones Beach, Fire Island, and Montauk, and is designed to capture both broad-scale
migratory behavior and local fish behaviors
(3) Evaluate effects of EMFs on behavior and movement on targeted species pre-, during
and post-construction
(4) Estimate movement metrics including the following: acceleration, depth, 2-d and 3-d
position and residency for telemetered individuals
(5) Maintain the SFEC array and collect data on the individuals tagged by SBU and
partnering organizations along the east coast.
Animal capture: Capture and tagging of fishes will occur from a variety of vessels and projects.
Ten days of dedicated funding per year (Years 1-4) has been budgeted for the 24 m R/V Seawolf
to capture and tag specimens. The R/V Seawolf is equipped with a 24 m otter trawl well
designed to capture the targeted species for this study. We plan to use the R/V Seawolf, but if
for unforeseen reasons (e.g., available vessel schedule, vessel repair, Covid -19 related issues…)

6
it is not available, we can use alternative vessels such as Monmouth University’s R/V Heidi
Lynn Sculthorpe (14.9 m) or other vessels in the region.
Long-term projects established between New York State Department of Environmental
Conservation (NYSDEC) and Stony Brook University (SBU) provide a platform for additional
tagging of fishes. The Nearshore Trawl Survey (NTS) and the Acoustic Gates (AG) projects
provide regular opportunities to capture specimens in the coastal ocean and estuaries in the New
York Bight. The NTS carries out 5 surveys per year along the coast of Long Island, New York,
conducting 25 stations per cruise. The AG deploys over 150 acoustic tags per year and provides
funding for vessel time and tagging in estuarine and coastal waters along the south shore of New
York.
Tagging: Individuals will be surgically implanted with various Innovasea (formally Vemco)
acoustic transmitters depending on the size of the fish. Larger individuals will be implanted with
a V16 ultrasonic transmitter (69 kHz, high-power output = 158 dB re 1 µPa at 1 m, random
transmitter delay = 120 s, life span = 2,435 d). Medium to small individuals will be tagged with
either a V13 (69 kHz, high-power output = 151 dB re 1 µPa at 1 m, random transmitter delay =
180 s life span = 648 d) or a V9 (69 kHz, high-power output = 152 dB re 1 µPa at 1m, random
transmitter delay = 120 s life span = 520 d) (Figure 1).
Surgical procedures will follow approved SBU Institutional Animal Care and Use Committee
approved protocols. Briefly, all individuals will be measured for total length to the nearest mm
and placed into a holding tank with flowing seawater. Transmitters will be surgically implanted
in the peritoneal cavity, with the incision sutured with 2-3 interrupted stitches, then placed back
into the holding tank to recover from anesthesia and released. Elasmobranchs follow a similar
surgical approach; however, anesthesia is not used because of harmful effects, and instead,
animals are placed in tonic immobility prior to surgery. In the case of large sharks, procedures
are performed along the side of the boat while the individual is secured.

7
Figure 1. SBU researchers tagging winter flounder (top left), a nurse shark (right) and V9
sensor transmitters and a VRSAR-X acoustic release receiver (bottom left). Tag and receiver
pictures are from www.innovasea.com.
Targeted Species:
Striped bass: A total of 100 individuals will be implanted with ultrasonic transmitters coded tags
with sensors for depth and temperature (V13TP) or acceleration and temperature (V13TA)
during year 1. These tags transmit data as they are detected by a receiver. The transmitters
provide temperature values with an accuracy of ± 0.5 °C, and depth is estimated via pressure
with an accuracy of ± 1.5 m at a depth of 17 m. Acceleration is measured in ms-1 and can be
programmed for activity or tailbeats by changing the axis of calculation. An additional 80
transmitters will be deployed in years 2, 3, and 4.
Winter flounder, black sea bass, summer flounder, and skates: Twenty-five individuals of each
species will be tagged with V9 or V13 transmitters during year one and 20 per year during years
2, 3, and 4. In general, V9s will be used on winter flounder and smaller individuals of black sea
bass and summer flounder. Skates and larger summer flounder and black sea bass will be
implanted with V13 transmitters.
Sharks, Atlantic sturgeon, and additional telemetered individuals: In order to have adequate
sample sizes for species targeted in this project, we decided not to tag additional sharks and
Atlantic sturgeon. Data for sharks and sturgeon will be obtained from SBU’s ongoing efforts,
including over 300+ telemetered sturgeon and 300+ elasmobranchs. A total of 337
elasmobranchs have been tagged by SBU and MU since 2016 including the following: 26
common thresher, 45 sandbar, 96 smooth dogfish, 39 spiny dogfish, 10 shortfin mako, 13 sand
tiger, 30 winter skate, and 21 bullnose sharks. These individuals along with future tagging
efforts will be included in analyses conducted in the proposed research for Study 1.

8
Figure 2. Proposed SFEC acoustic array. Red-dashed line represents the planned cable route.
Yellow stars represent the location of real-time acoustic receivers and black dots represent
VR2W
Acoustic arrays: The proposed SFEC array system consists of four components to represent
migratory and fine-scale movement in the approach field and cable regions. The design consists
of four arrays (east approach, west approach, cable, and fine-scale positional arrays) to capture
directional movement along the coast of Long Island and fine-scale movement around the cable.
The array will consist of 41 VR2AR-X acoustic release omnidirectional hydrophones (receivers)
that can detect a telemetered individual from a radius of 500 to 1000 m from the receiver
location depending on sea conditions and transmitter strength. The receivers will be placed 1.2
km apart, except in the fine-scaled positional array where they will be 550 m apart. VR2AR-X
are also equipped with a built-in transmitter to sync with adjacent receivers to provide 2-d VPS
fish positioning inside the fine-scale array. Additionally, telemetered individuals tagged with
depth tags can be 3-d positioned within the fine-scale positioning array. Temperature (mean,
min, max) will be recorded every three hours on all VR2AR-X receivers providing information
to evaluate drivers of the presence of fish in the study area.
The west and east approach arrays are designed to capture telemetered individual’s movement
toward the SFEC undersea cable prior to any potential impacts from EMFs, while the cable array
provides coverage near the cable and the ability to capture any alterations to movement behavior
due to EMFs. The design provides a quasi-controlled field-experiment system where the
approach arrays provide movement and behavior metrics independent of EMF impacts, while the
cable array is adjacent to the cable and can capture local effects. The SFEC array system will
provide the ability to track movement as telemetered individuals enter the approach field, pass
9
over the cable area, and exit the approach region. The design was developed to collect data that
will provide for robust statistical analysis of the potential impacts of the EMFs on movement
metrics including water column height and acceleration, among others.
The spatial acoustic arrangement includes a fine-scale positional array to tract 2-d and 3-d
movement with conventional and depth transmitters, respectively. The VR2AR-X built-in
transmitter allows all receivers in the fine-scale array to sync with neighboring receivers and
provide 2-d positioning of fish acoustically telemetered. The 2-d movement can be evaluated to
test for local effects of EMFs on fish behavior as they cross over the buried cable. Those
individuals telemetered with depth transmitters can be positioned in 3-d providing the ability to
track horizontal and vertical movements.
Receivers are equipped with acoustic release mechanisms that allow instrument retrieval without
the need for divers. Retrieval is performed with communication from a VR100 aboard the vessel
that triggers the release, using a push-off titanium pin and an attached floatation buoy to bring
the released receiver to the surface (Figure 3). SBU researchers have previously deployed 31
VR2AR-X in the New York Wind Energy Area between 2016-2018 (Ingram et al., 2019; Frisk et
al., 2019). The project was successful and only 4 receivers were lost over the duration of the
study period.
Real-time receivers: During 2020-21 SBU has begun the development and deployment of a real-
time receiver system to provide detection information in real-time to scientists and managers in
the New York Bight. The methods that follow were developed and written in the current MOU
between NYDEC and SBU (MOU: 900267). Three real-time receivers are planned to be located
along the beach in the first row of the fine-scale positioning system and the approach arrays
within ~0.5 km from the shore.
Real-time acoustic receiver stations will be remotely accessed using a software interface
provided through VEMCO, which allows for ten unique logins to be distributed between relevant
researchers and management bodies. Acoustic detections are reported in almost real-time; an
alert transmission is sent to a cellular device or via email approximately 2 minutes after an
animal has been detected and also displayed on password protected innovasea portal.
The design for the real-time array moorings will be based on our current arrays with VR2Ws and
VR2TXs along the South Shore of Long Island, but all components will be increased in thickness
and metal grades to withstand the elements for a much longer duration. The mooring will be a
226-273 kg concrete base made of Sakrete high strength concrete. This will be constructed by
pouring into a 0.5 m x 0.5 m x 0.5 m cardboard box as a mold. A 1.27 cm thick 316 Stainless
Steel Rebar will be inserted into the base of the mooring using a 20 cm diameter by 30.48 cm
high Sakrete cardboard tube (cut to fit) as an attachment point for the remainder of the gear. A
1.27 cm 316 Stainless Steel shackle will be attached to the rebar with the same size and grade
chain, which will extend about 2.13-3.0 m until another 1.27 cm 316SS shackle attaches. From
here, a 1.27 cm 316 Stainless steel swivel will be connected to another 1.27 cm 316 stainless
steel shackle that will then lead to the same thickness and grade wire rope to prevent metal to

10
metal corrosion. This rope will be attached via thimble and compression sleeve of the exact same
grade steel, which will lead to the surface and attached again via shackle, thimble, and
compression sleeve to the Vemco receiver and buoy on the surface (Figure 3). Each real-time
station will be serviced approximately every 6 months to check the physical and computational
integrity of the system. Potential malfunction of the system can also be reported through a
software interface that can be accessed remotely (see below).
Figure 3. The mooring setup for the VR2AR-X acoustic release omnidirectional
hydrophones (left) and a schematic of the real-time acoustic monitoring system. The
mooring setup for the VR2AR-X is from Vemco.com and is slightly different from SBU
mooring design depicted on the right.
Data collection: The entire array will be downloaded 3 times per year. The data will be
downloaded and the receivers will be replaced with a new mooring. RAW data will be
downloaded and stored in ACCESS and analyzed in the software R. Detection data will be
checked for false detections. A valid detection is considered three detections in the array during
a 24-hour period and spaced further apart than the minimum tag delay. The database will
contain detection histories including depth and acceleration and receiver-based temperature
measurements.
Hypothesis Evaluation
Part I: The effects of EMF on fish behavior will be evaluated by testing the hypothesis H1a.
Alternative hypotheses are formulated to address a wide range of potential behavioral changes
associated with the EMF (A1-5).
H1a: Movements and behavior of teleost and elasmobranch species will not be impacted
during wind farm operation by the EMF produced by the SFEC
Aa1: Rate of movement is different between the cable array and approach arrays.
Sea Floor
180-270kg Mooring
7-10ft 1.27cm 316 SS Chain
1.27cm 316 SS Shackle
2.54cm 316 SS Rebar
1.27cm 316 SS Swivel
1.27cm 316SS Cable to buoy1.27cm
316SS Thimble/Compression Sleeve

11
Aa2: Residency is different between the cable array and approach arrays.
Aa3: Depth preference is different between the cable array and approach arrays.
Aa4: Acceleration is different between the cable array and approach arrays.
Aa5: Counts of unique detections are different between the cable array and the approach
arrays
Statistical analysis: The field-experiment system design of the arrays allows for a traditional
test(s) of H1a with the approach arrays serving as controls. Generalized linear models (GLM)
will be utilized to evaluate the hypothesis for each species. GLMs provide a flexible approach
that allows for continuous and categorical predictors and can utilize any distribution in the
exponential family (Nelder and Wedderburn, 1972) for response variables, including count,
proportions, presence-absence, and continuous data. GLMs have been successfully applied to
acoustic telemetry data to analyze drivers of fish behavior (Ziegler, et al., 2019; Ingram et al.,
2019). The approach can be tailored to address Aa,1-5 utilizing various statistical distributions
suited for the variety of response variables and a mixture of categorical and continuous
predictors. In addition, covariates can be included such as temperature, season, photoperiod, etc.
to determine important drivers of behavior and improve model statistical fit and performance.
Part II. A similar analysis will be utilized to determine if fish behavior was altered during
construction. Specifically, GLMs will be used to evaluate whether construction activities alter
fish behavior utilizing the same BACI approach as outlined above. The following hypothesis will
be tested:
H1b: Movements and behavior of teleost and elasmobranch species will not be impacted
by the construction of the SFEC.
Ab1: Rate of movement is different between the cable array and approach arrays.
Ab2: Residency is different between the cable array and approach arrays.
Ab3: Depth preference is different between the cable array and approach arrays.
Ab4: Acceleration is different between the cable array and approach arrays.
Ab5: Count of unique detections is different between the cable array and the approach
array.
Part III: A before-after, control-impacted (BACI) approach will be utilized to specifically test
for changes in the metrics following a similar statistical approach as outline above. The
following hypotheses will be tested:
H1c: Movements and behavior of teleost and elasmobranch species will not be impacted
by the installation of the SFEC

12
Ac: Rate of movement is different after the installation of the connecting cable.
Ac2: Residency is different after the installation of the connecting cable.
Ac3: Depth preference is different after the installation of the connecting cable.
Ac4: Acceleration is different after the installation of the connecting cable.
Ac5: Count of unique detections is different after the installation of the connecting cable.
Part IV: Detailed temporal and spatial behavior will be estimated for the fine-scale array. The
fine-scale array provides 2-d and 3-d (via depth tags) positioning. Fine-scale positioning is
performed by Vemco utilizing the company’s software and analysts. The Vemco approach
focuses on three metrics: yield, precision, and accuracy to characterize spatial and temporal
behavior. To position a telemetered individual, it needs to be detected by three time-
synchronized receivers. The rate of valid detections can be influenced by weather conditions,
temperature, and other factors and is measured as the yield of transmissions successfully detected
in the array. The precision and accuracy of positions are estimated by Vemco and provided as
part of the positioning service. We have consulted with Vemco for receiver positioning designs
to produce robust results in constructing our array design. Processed data consist of tag
identification, detection time, latitude, longitude, depth, and an estimate of the horizontal
position error (HPE) for each relocation. The result can provide a highly resolved analysis of
spatial and temporal behavior showing specific fish tracts through the array (Figures 4 & 5).
Figure 4. An example of the VPS system being used to create spatial and temporal temperature
preference for brook trout, Salvelinus fontinalis, utilizing temperature and 3-d positioning data.
Full vid can be viewed: www.innovasea.com/fish-tracking/fine-scale-movement/.

13
In this project, all tagged fish will be positioned to determine if spatial and/or temporal trends
exist for individual species and the species assemblage. The positioning approach will provide
detailed movements and can indicate areas of high habitat use, trajectories (tortous or linear), and
rate of movement (ROM). The temporal and spatial analysis will address H1a&b by providing a
detailed view of behavior along the cable EMF field. In addition to positioning, the fine-scale
array produces metrics that can be used to evaluate the effects of the EMF. Unique counts,
residence, depth, and specific pathways for all species telemetered will be used to estimate
behavior and use of each receiver location within the cable array. These metrics will be
statistically compared to evaluate whether telemetered individuals at receivers close to the cable
EMF show different behavior than at receivers further away.
Finally, a network connectivity analysis will be conducted to determine areas of high habitat
connectivity and use. A network connectivity analysis provides estimates of the level of habitat
use of nodes (receivers) and connectivity to other nodes (movement path) in the network (Bopp
et al., in press). The approach estimates degree and eigenvector centrality to evaluate habitat use
and linkages throughout the array (Lookingbill et al. 2010; Jacoby et al. 2012; Ledee et al. 2015).
Degree centrality is a measure of the number of direct connections to a node and can be
calculated as the number of movement connections into a node, out of a receiver node, or as a
total for both directions. Degree centrality can be perceived as a proxy of important connection
centers within a network, or “hubs”. Eigenvector centrality quantifies the relative influence a
location (node) has on overall habitat connectivity in the network. It incorporates a node’s own
degree centrality and the degree centrality of each receiver connected to it. It is a proxy of
preferred space-use by animals.
Network analyses will include all species and covariates (temperature, season, etc.) to determine
environmental and seasonal trends and strengthen model fit and performance. Specifically, the
analysis will determine if habitat use along the cable EMF shows increased or decreased
connectivity and use by telemetered individuals. The network analysis will also determine if
connectivity and habitat use changed during pre-construction, construction, and post-
construction periods.

14
Figure 5. An example of Atlantic sturgeon movements created with a VPS positioning system
(From McLean et al., 2014).
Collaborative Networks
Throughout the eastern seaboard researchers are maintaining acoustic array networks and
tracking telemetered fishes. The Principal Investigators are involved in a wide range of acoustic
telemetry networks and maintain arrays in the coastal ocean and estuaries in the New York
Bight. We plan to include all telemetered fish that were tagged as part of ongoing efforts in the
proposed analyses. This will greatly increase the number and species of telemetered individuals
in the proposed study. For example, the New York Bight Acoustic Network run by PI’s Frisk’s
research group maintains an array network from Rockaways to Montauk, NY, acoustic “gates” to
all inlets to Great South Bay, NY, and tags over 150 fish per year (Figure 6). PI’s Cerrato and
Sclafani run a horseshoe crab array in Moriches Bay, NY, and PI Peterson runs an artificial reef
acoustic tagging and tracking network in the coastal ocean. These ongoing projects will
contribute to the proposed research and place the results in a broader context as individuals
migrate along the eastern seaboard.

15
Figure 6. The New York Bight Acoustic Network is maintained by PI Frisk’s lab group and
funded by NYSDEC.
Data Sharing
Downloaded acoustic data will be uploaded to the Mid-Atlantic Acoustic Telemetry Observation
System and Atlantic Cooperative Telemetry Network (ACT_MATOS). ACT_MATOS is a
secured data portal where archived acoustic telemetry data and matched transmitter detections
are shared and distributed between researchers. Data collected to address the objectives of the
proposal will be shared to a limited extent until two years after completion of the project. This is
to allow the students and PI’s to complete dissertations and publish research in peer-reviewed
publications. The ability of researchers to complete dissertations and research papers is
fundamental to the academic process. Detections of telemetered individuals that were tagged by
other researchers will be provided to MATOS. Telemetered individuals that were tagged as part
of this research project will be uploaded on MATOS with the tag identification and species;
additional metadata will not be uploaded until two years after completion of the project (e.g.,
length, weight, date of capture).

16
Timeline
The initiation of the project is planned for late fall of 2020 with field operations beginning during
the first two quarters of 2021 (Figure 7). This schedule is consistent with obtaining two years of
pre-construction data. The initial phase of the project will involve obtaining training
certifications, hiring a technician, students, and purchasing equipment. Deployment of arrays
and tagging will commence during the first two quarters of 2021 with the desire to have the
arrays in place for the spring migration period. Tagging will continue throughout the project
until 2023 and array downloading will continue for the entire Study. Annual progress reports
will be due during the 4th quarter of each year. The reports will consist of a description of field
operations, tagging progress, and problems encountered. A basic summary of species detections
for each of the arrays will be provided including the total number of detections, species, and
number of unique individuals. VPS results will be included as long as Innovasea completes
analyses prior to report due dates. The final report will include analyses and written evaluations
of all project objectives and hypotheses.
Figure 7. Project timeline.
References
Copping, A., N. Sather, L. Hanna, J. Whiting, G. Zydlewski, G. Staines, A. Gill, I. Hutchison, A.
O’Hagan, T. Simas, J. Bald, C. Sparling, J. Wood, and E. Masden. 2016. Annex IV 2016
State of the Science Report: Environmental Effects of Marine Renewable Energy
Development Around the World.
Frisk, M. G., O. N. Shipley, M. Fogg, E. C. Ingram, K. J. Dunton, A. Stigliano, and J. P.
Zacharias. 2020. Maintain Acoustic Gates.
Gill, A. B., M. Bartlett, and F. Thomsen. 2012. Potential interactions between diadromous fishes
of U.K. conservation importance and the electromagnetic fields and subsea noise from
marine renewable energy developments. Journal of Fish Biology 81:664-695.

17
Hutchison, Z., P. Sigray, H. He, A. B. Gill, J. King, and C. Gibson. 2018. Impacts on
Elasmobranch (shark, rays, and skates) and American Lobster Movement and Migration
from Direct Current Cables. OCS Study BOEM 2018-00. 2018.
doi:10.13140/RG.2.2.10830.97602.
Ingram, E. C., R. M. Cerrato, K. J. Dunton, and M. G. Frisk. 2019. Endangered Atlantic
Sturgeon in the NewYork Wind Energy Area: implications of future development in an
offshore wind energy site. Scientific Reports 9.
Jacoby, D. M. P., E. J. Brooks, D. P. Croft, and D. W. Sims. 2012. Developing a deeper
understanding of animal movements and spatial dynamics through novel application of
network analyses. Methods in Ecology and Evolution 3:574-583.
Kantserova, N. P., N. V. Ushakova, V. V. Krylov, L. A. Lysenko, and N. N. Nemova. 2013. The
effect of weak low-frequency magnetic fields on the intracellular calcium-dependent
proteinases of fish. Biology Bulletin 40:515-518.
Krylov, V. V., Y. G. Izyumov, E. I. Izvekov, and V. A. Nepomnyashchikh. 2014. Magnetic
fields and fish behavior. Biology Bulletin Reviews 4:222-231.
Ledee, E. J. I., M. R. Heupel, A. J. Tobin, D. M. Knip, and C. A. Simpfendorfer. 2015. A
comparison between traditional kernel-based methods and network analysis: an example
from two nearshore shark species. Animal Behaviour 103:17-28.
Lee, W., and K. L. Yang. 2014. Using medaka embryos as a model system to study biological
effects of the electromagnetic fields on development and behavior. Ecotoxicology and
Environmental Safety 108:187-194.
Li, Y., P. Zou, X. Liu, and H. Wu. 2016. Biological effects of extremely low frequency magnetic
fields. Gaodianya Jishu/High Voltage Engineering 42:2376-2386.
Loghmannia, J., B. Heidari, S. A. Rozati, and S. Kazemi. 2015. The physiological responses of
the Caspian kutum (Rutilus frisii kutum) fry to the static magnetic fields with different
intensities during acute and subacute exposures. Ecotoxicology and Environmental Safety
111:215-219.
Lookingbill, T. R., R. H. Gardner, J. R. Ferrari, and C. E. Keller. 2010. Combining a dispersal
model with network theory to assess habitat connectivity. Ecological Applications
20:427-441.
McLean, M. F., C. A. Simpfendorfer, M. R. Heupel, M. J. Dadswell, and M. J. W. Stokesbury.
2014. Diversity of behavioural patterns displayed by a summer feeding aggregation of
Atlantic sturgeon in the intertidal region of Minas Basin, Bay of Fundy, Canada. Marine
Ecology Progress Series 496:59-69.

18
Nelder, J. A., and R. W. M. Wedderburn. 1972. Generalized Linear Models. Journal of the Royal
Statistical Society, Series A 135:370-384.
Snyder, J., M. Slater, and A. Schultz. 2012. Assessing the rising needs for ongoing submarine
cable electromagnetic field studies. 44th International Conference on Large High Voltage
Electric Systems 2012, Paris, France.
Taormina, B., J. Bald, A. Want, G. Thouzeau, M. Lejart, N. Desroy, and A. Carlier. 2018. A
review of potential impacts of submarine power cables on the marine environment:
Knowledge gaps, recommendations and future directions. Renewable & Sustainable
Energy Reviews 96:380-391.
Ziegler, C. M., J. P. Zacharias, and M. G. Frisk. 2019. Migration diversity, spawning behavior,
and habitat utilization of winter flounder. Canadian Journal of Fisheries and Aquatic
Sciences 76:1503-1514.

19
ATTACHMENT C Study 2: South Fork Wind Trawl Survey

20
Study 2: South Fork Export Cable Trawl Survey
Study Plan Prepared By:
Scott Curatolo-Wagemann (Principal Investigator), Emerson Hasbrouck, Matthew Sclafani
Cornell University Cooperative Extension
423 Griffing Ave., Suite 100
Riverhead, NY 11901-3071
Robert Cerrato
School of Marine and Atmospheric Sciences
Stony Brook University, Stony Brook, New York
Approach
Objectives
The fisheries trawl survey design and approach will be done so by utilizing the sampling
techniques and protocols employed by the Northeast Area Monitoring and Assessment Program
(NEAMAP) near-shore survey, as well as the Responsible Offshore Science Alliance (ROSA)
fisheries monitoring guidance (see below) for regional monitoring. Application of these
approaches will allow for CCE to conduct a meaningful and successful trawl survey:
1. Evaluate available data describing fishery resources and stressors within the project area
2. Define concise and appropriate monitoring objectives and hypotheses
3. Identify focus species (or groups) to monitor
4. Set indicators and define thresholds that are appropriate and measurable
5. Design a plan to collect the appropriate data to address monitoring objectives
6. Analyze data collected to achieve monitoring objectives and test hypotheses
7. Adjust sampling design/methods as needed to continue to address monitoring objectives
(ROSA, 2020)
Utilizing a trawl survey design, CCE will gather data relative to migratory patterns of targeted
commercial and recreationally valuable fish within the areas of the SFEC in East Hampton over
a multi-year period. Data will be analyzed to identify if activity in and around the SFEC has had
any effect on fish migrations or community structure using a Before-After-Control Impact design
(BACI). Baseline data for the targeted fish species, both within a defined area of the SFEC and
within reference areas on either side of the SFEC, will take place over a 2-year period.
Subsequent data collection via the trawl survey will continue during construction and burial of
export cable in established survey areas, as well as post-construction within the survey areas.
Data analysis will help determine the effects, if any, of the SFEC on the identified fish species
and communities along the areas that are sampled from the trawl survey. Specifically, we test the
following hypotheses:

21
H1: The spatial distributions of fish species will not be impacted by the construction and
resulting EMFs of the SFEC connecting cable.
H2: The community structure of fish species will not be impacted by the construction and
resulting EMF’s of the SFEC connecting cable.
Methods
We will develop and implement a trawl survey to meet the stated objectives. The trawl survey
(survey) is modeled after the Northeast Area Monitoring and Assessment Program (NEAMAP)
near-shore survey to ensure compatibility with this long-term regional data set. We will use the
same net design, bridles, ground cables, and doors as detailed in the NEAMAP design. The
survey net will also be identical to the National Marine Fisheries Service (NMFS) Trawl Survey
net except for a modified sweep. Tows will be targeted for 20 minutes in length at 3 knots so
that this survey design will ensure additional data compatibility with both the NEAMAP and
NMFS trawl surveys as recommended by ROSA. However due to the smaller area that this trawl
survey will cover, it may be necessary to adjust tow times accordingly. We will also, to the
extent practical, have survey days that coincide with the days that the NEAMAP survey, and
possibly the SoMAS NYSDEC-funded Inshore Trawl Survey, that also occupy stations in the
vicinity of our survey. For 2021, NEAMAP has tentatively scheduled surveys in nearby waters to
occur between May 13-15, and then again during the first week of October.
NEAMAP Protocols
Trawl Design
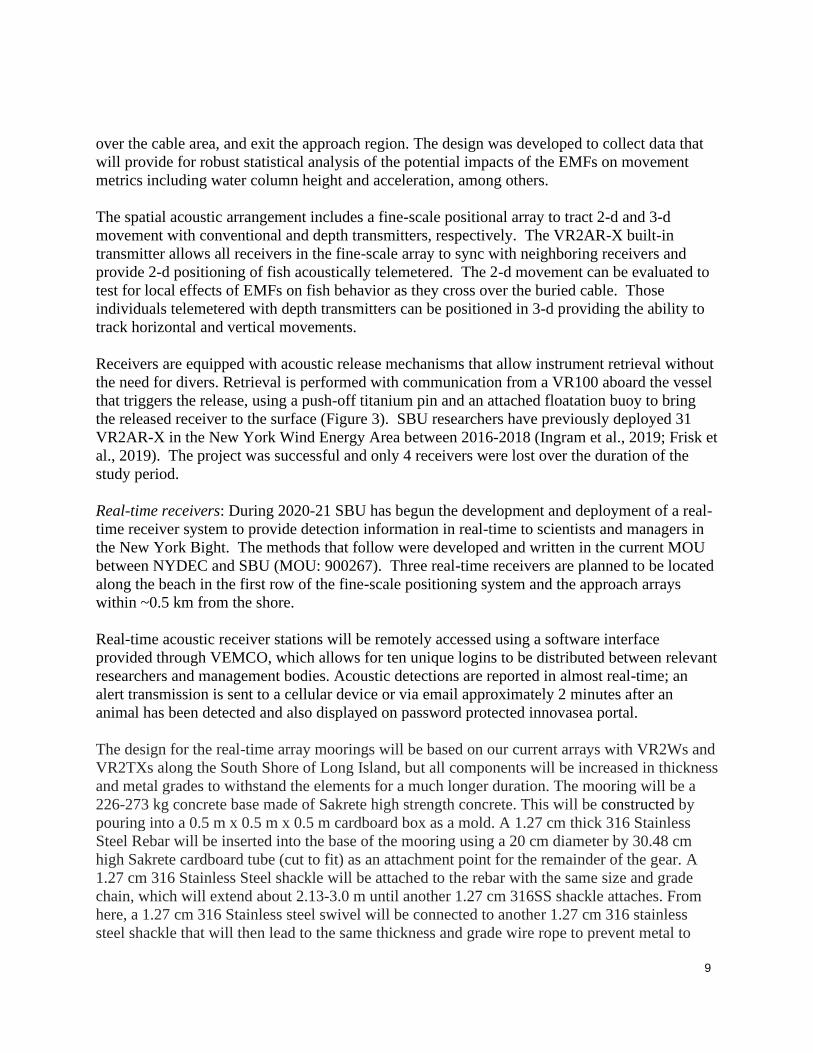
In accordance with the NEAMAP survey design, we will incorporate the same trawl survey
components so that data can easily be integrated with other trawl survey data (Figures 2 and 3).
The trawl to be used will be a 400 x 12cm, three-bridle four seam trawl, using a 12 cm codend
with a 2.54 cm (1 inch) knotless liner. 3 inch cookie sweeps will keep the net off the bottom, and
the net will be spread through the use of Thyboron Type IV 66” doors (VIMS, 2020).

22
Figure 2. NEAMAP Otter Trawl (VIMS, 2020)
23
Figure 3. Net schematic (Bonzek et al. 2008)
Initial conversations have taken place with Reidar’s Manufacturing in New Bedford, MA to
secure the necessary gear to duplicate those used in the NEAMAP trawl survey.
Trawl Monitoring
The trawl will be outfitted with trawl monitoring equipment. The monitoring equipment uses
sensor electronics to measure door spread, net height and width, and catch weight. Sensors can
be placed in each wing, each door, and within the codend to monitor critical performance metrics
of the gear during survey work. By providing real-time information to the captain of the vessel,
adjustments, such as tow speed and heading, can be made to ensure the net is performing
constantly and appropriately for the needs of the survey.
Trawl Vessel Operations
Currently, NEAMAP uses a 90’ commercial trawler, the F/V Darana R, homeported out of
Hampton, VA (VIMS, 2020). CCE has identified a partner with a commercial trawler within NY

24
with a similar vessel size. The F/V Bulldog will be retained for the duration of the 5-year project
so that trawls and data collected can be compared. Since the F/V Bulldog is a federally permitted
vessel, we will obtain a Letter of Authorization (LOA) to conduct the trawl survey.
Additionally, CCE will apply for a NY State License to Collect or Possess.
Trawls will take place during daylight hours, with daylight hours defined as 30 minutes after
sunrise and completed 30 minutes before sunset. Tows will be 20 minutes in duration, with the
start time of the tow coinciding when the trawl wire drums lock and ending when the haul back
operations are started. Tow speed will be maintained at a speed of 2.9-3.3 knots.
Environmental data to be collected for each tow includes:
• Start and End Time
• Start and End GPS Location
• Start and End Water Depth
• Tow Speed
• Tow Direction
• Surface and Bottom Water Temperature
• Cloud Cover
• Wind Speed and Direction
• Wave Height
• Air Temperature
• Wire out
• Net and gear condition
At each trawl location, CCE will deploy a Conductivity Temperature Depth (CTD) probe to
gather conductivity, salinity, and temperature for a vertical profile of the water column.
Survey Design
The survey area to be studied is located at the proposed export cable landing site along Beach
Lane in East Hampton, NY (Figure 4).

25
Figure 4. Proposed SFWF export cable landing site (Jacobs, 2020)
The area of potential impact from EMFs is the landing cable (i.e., SFEC), and therefore,
sampling will occur randomly inside established areas both before and after it is installed. We
will select a suitable control area which will be appropriately distanced from the landing cable,
and the impact area. Since we do not have reconnaissance data in this area, we are unable to
specify statistical power at this stage but instead, aim to use a practical approach that enables us
to determine if there are differences with respect to variables of interest along a spatial gradient
and also over time. However, we will examine the New York State Department of
Environmental Conservation’s annual trawl survey data as a possible source of information for
design planning. A significant change from the baseline variables that are measured can be tested
using statistical methods that evaluate changes in spatial relationships over time (DeCaceres et
al. 2019, Brandt et al. 2011)
CCE will conduct trawls within a defined area around the export cable (impact area), as well as
within a nearby area which will serve as a control (reference) area (Figure 5).
26
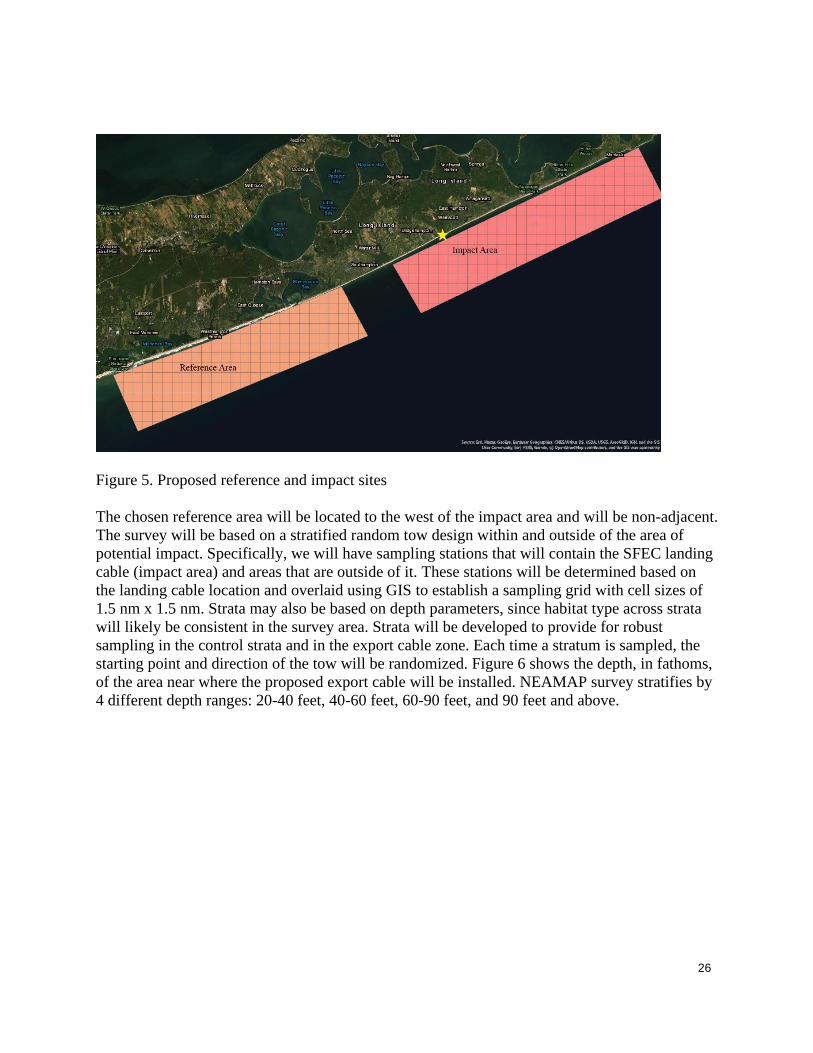
Figure 5. Proposed reference and impact sites
The chosen reference area will be located to the west of the impact area and will be non-adjacent.
The survey will be based on a stratified random tow design within and outside of the area of
potential impact. Specifically, we will have sampling stations that will contain the SFEC landing
cable (impact area) and areas that are outside of it. These stations will be determined based on
the landing cable location and overlaid using GIS to establish a sampling grid with cell sizes of
1.5 nm x 1.5 nm. Strata may also be based on depth parameters, since habitat type across strata
will likely be consistent in the survey area. Strata will be developed to provide for robust
sampling in the control strata and in the export cable zone. Each time a stratum is sampled, the
starting point and direction of the tow will be randomized. Figure 6 shows the depth, in fathoms,
of the area near where the proposed export cable will be installed. NEAMAP survey stratifies by
4 different depth ranges: 20-40 feet, 40-60 feet, 60-90 feet, and 90 feet and above.

27
Figure 6. Impact Area Bathymetry
Figure 7 shows the proposed cable route (purple and blue dashed line), with the yellow dashed
line representing the 3 nautical mile (nm) NY state water boundary.
Figure 7. Cable Route
The proposed survey areas will include cells beyond the 3 nm state boundary, along areas that
are parallel to the shoreline. This design will allow for the survey to observe the migratory
behavior of the fish once the export cable is installed and functional. It will allow the survey to
determine if the cable will cause fish migrations to travel offshore to avoid it, if they come back
inshore, or if there is no migratory effect of the cable.
Strata will be sampled seasonally (e.g. winter, spring, summer and fall). We anticipate 5 days of
survey each season with 30 to 40 tows per season. In order for a balanced design, sample size
will be equal in the impact and reference areas, thus there will be 15 -20 tows in each area.
Trawls will take place during daylight hours, with daylight hours defined as 30 minutes after

28
sunrise and completed 30 minutes before sunset. Conducting trawls within these parameters
limits the variability seen with animals who are more active during the twilight periods.
Adherence to these guidelines for what constitutes a day may result in fewer than the target of 8
tows per day being completed in the winter sampling season when the days are shorter. Counter
to this will be the ability to conduct more tows during the summer survey due to the longer day
length. With these estimated tow numbers in mind, the numbers of tows we anticipate
accomplishing in each season may be broken down to the following:
Season Tows (Low estimate) Tows (High estimate)
Winter 6 8
Spring 8 10
Summer 8 10
Fall 8 10
Total 30 38
The survey will use a BACI design, which is a Before-After-Control-Impact design. The BACI
design is well established in the ecological literature and would be a suitable method for this
application. While the BAG (Before-After-Gradient) design has recently been suggested to offer
advantages over the BACI design (Methratta 2020), we do not think this is a preferred design in
this study. One of the main reasons is that a BAG design is likely to be more relevant at
detecting changes along small spatial scales (e.g. < 100 m), and a 20 minute trawl sample may be
too coarse a technique and unable to sufficiently capture any change of fish abundance and
community structure along the expected gradient.
Catch Processing
The catch from each tow will be worked up separately. Fish will be sorted into species. Length
frequency distribution for each species will be measured either with all individuals for that
species or a random subsample depending on the size of the catch. The total weight of all
additional species in each tow will also be obtained either by direct weighing or by catch
estimations. Total weight for each species will be determined by utilizing a motion-compensated
scale, Marel, model m1100. Catch estimations will be based on basket or tote counts. Catch
estimations will be made by separating individual species into baskets or totes. An average
weight will be determined by weighing a minimum of 3 baskets or totes. Next, a count of the
number of baskets or totes will be made for the particular species, and this number will be
multiplied by the average weight. This number will then be recorded as the estimated total catch
weight. This procedure for catch estimations, based on basket or tote counts, follows the NMFS
At Sea Monitoring Program and the Observer Program Biological Sampling protocols, as
outlined in the NEFSC 2010 sampling manuals. To the extent of the permit involved, the vessel
will be permitted to land fish for sale as regulations allow.
Data and Statistical Analysis
Data will be manually QA/QC to check for errors prior to data analysis. In addition, data will be
plotted, and descriptive statistics used to identify any potential outliers and erroneous data
entries.

29
Multivariate Analysis of the Trawl Data
We will carry out a multivariate analysis of the trawl data to investigate spatial-temporal patterns
in the fish community to determine if there are any effects of the SFEC after it is installed and to
relate these patterns to environmental variables. The catch data will be analyzed to compare
control and impact areas (Figure 5) in a BACI design framework. Two multivariate techniques
will be utilized: community trajectory analysis (De Cáceres, et al. 2019) and redundancy analysis
(RDA) (Jongman et al., 1995). Comparing the community structure between the control and
impact area over time will be used to evaluate community differences between the control and
impact areas between years, to define geographic relationships and the spatial stability of the
assemblage. RDA will be used to identify important environmental drivers associated with
changes.
Methods
Survey catch data will be used to examine temporal-spatial patterns in community structure and
their associated changes in relation to the SEFC. In addition to catch data and survey
measurements of depth, salinity, and temperature, year as a categorical factor, and day length
will be included in the analysis. Day length values will be obtained from the R library geosphere
and will require providing the daylength function, the date and latitude of the sampling locations.
Catch data will be analyzed as control and impact areas by averaging the randomly located
samples collected within each area during each survey date. Average species-specific CPUEs for
each area will be used as the response variables in the analyses. Average values of the
environmental data will also be used as explanatory variables. An important motivation for this
averaging process was that it then allowed the analysis of location-based changes in community
structure over time. Another motivation was to reduce sample variability that might obscure
environmental relationships.
Two principal multivariate methods, community trajectory analysis (CTA) and redundancy
analysis (RDA), will be used to examine temporal-spatial patterns in community structure and
their relationship to environmental variates. The former makes use of principal components
analysis (PCA) and k-means clustering. Fundamental to all these methods is the choice of a data
transformation and a distance measure to quantify differences in community structure between
samples that yield intuitive and ecologically reasonable interpretations of the analysis results
(Legendre and Gallagher 2001). Because the data set will span multiple seasons and potentially
habitats, it is expected that large changes in species abundance and composition would occur,
with even common species being absent at various times and locations. This type of pattern has
been characterized as a unimodal species distribution, where individual species response curves
follow a nonlinear, Gaussian-like abundance pattern along a large gradient, with a maxima and
width of the curve specific to the species. ter Braak (1985) found chi-square distance to be an
appropriate measure of community differences along such large gradients. Legendre and
Gallagher (2001) have shown that with this data transformation, PCA (and also principal
coordinates analysis with Euclidean distance) leads to similar results as that of correspondence
analysis (CA) which assumes unimodal species patterns.

30
Community trajectory analysis is an approach to compare and contrast community structure
dynamics at two or more locations over time (De Cáceres, et al. 2019). It considers community
structure changes in time at a location as a trajectory in a multidimensional space and provides
tools for geometrically analyzing them based on tools developed for spatial analysis of
trajectories. Trajectories can be examined as a sequence of points plotted in a p dimensional
space where p is the number of taxa. Multiple trajectories can be analyzed by comparing the
geometric properties of the trajectories (e.g., segment lengths, speed, etc.), the convergence or
divergence of pairs of trajectories, the resemblance of the time sequence in the p dimensional
space, or the spatial variation in the community changes in time (De Cáceres, et al. 2019).
Community trajectory analysis (CTA) will be carried out using the R libraries vegclust (De
Cáceres, et al. 2010) and vegan (Oksanen et al. 2019). To evaluate regional control and impact
area trajectories, PCA will used to display a reduced space ordination of the chi-square
transformed CPUE data. PCA will also be used to visualize the average point to point derived
distances between pairs of trajectories. In addition, k-means cluster analysis (Legendre and
Legendre 1998) will be carried out on the average point to point distances between trajectories to
determine whether regional trajectories could be classified into groups with similar temporal
community characteristics. This type of cluster analysis is non-hierarchical and finds a range of
groups from 2 to (r-1) where r is the number of regions. The CH index (Calinski and Harabasz
1974), a multivariate F-statistic that compares the between-cluster sum-of-squares to the within-
cluster sum-of-squares, is then used to evaluate the number of groups. The solution, i.e., the best
number of clusters k is one that maximizes the CH index.
Redundancy analysis (RDA) is a multivariate direct gradient analysis technique that explicitly
combines ordination of sample sites based on species catch data with regression on the
environmental data (Jongman et al., 1995). It uses the environmental data to attempt to explain
the strongest patterns in community structure, rather than solely to illustrate those patterns as
PCA does. By examining the biological and environmental data simultaneously, this analysis
emphasizes those patterns in the biological data that are related to environmental variation.
Candidate environmental variables that will be considered in the current study are depth, bottom
salinity, bottom temperature, year as a categorical factor, and day length. Because of their
obvious linkage to season, temperature x day length interaction will also considered as an
explanatory variable.
A forward selection process will be used to identify environmental variables to include in the
regression model (Jongman et al., 1995). At each step in the process, the environmental variable
explaining the largest amount of biological variation will be selected and its effect removed
before the next best fitting variable is considered. This process of adding environmental variables
is continued until a small sample, bias-adjusted version of the Akaike Information Criterion
(AICc) is met (Burnham and Anderson 2002). Although not the correct interpretation (see
Burnham and Anderson 2002), AIC is often interpreted as a measure that evaluates the tradeoff
between fit and complexity among models. In practice, the model with the smallest AIC (or its
small sample, biased-adjusted version AICc) is chosen over the set of models considered (Hastie
et al. 2009). RDA will be conducted using the software Canoco 4.5 (Microcomputer Power,

31
Ithaca NY) (ter Braak et al. 2002). As an aid in interpreting the ordination plots, contours of
several quantitative explanatory variables will be created by fitting a local linear loess regression
between the data and the two-dimensional ordination scores.
Data Sharing
Scientific data collected during the course of this project includes catch (in pounds) per tow of
individual species, environmental data (location, water depth, weather, temperature, sea state),
and vessel/net information (tow speed, cable lengths, door spread). All non-confidential data,
observations and data analysis collected and created from this project will be made discoverable
by and accessible to the general public in hard copy upon request and/or electronically so that
data may be used by others in the scientific community. Data will be available within one year of
being collected and analyzed, and will be provided free of charge or at no more than the cost of
reproduction. Data will be available in a machine-readable, widely-used format. Specifics on
data collection methods, analysis, statistics and results will be available in the final report. The
final report will provide information to the public on how to request, access and utilize the non-
confidential data. CCE will protect all confidential and proprietary information collected.
Education/Outreach for Commercial Fishing Industry
Recently New York State Energy Research and Development Authority (NYSERDA) has
required that any wind energy leases for New York will require $5,000.00/megawatt for fisheries
monitoring. This project employs the use of a commercial fishing vessel to actively engage in a
research demonstration project. By engaging the commercial fishing industry, we are providing
an introductory platform for the local fishing industry to become involved and participate with a
wind energy company in fisheries related activities. This project can serve as a pilot training
program for fishermen to participate in wind energy fisheries programs that will be available to
them in the future.
Features of this program will include:
• Safety education and training as required by wind energy companies to participate
in wind energy fisheries programs, can be provided to participating fisherman.
• A fact sheet will be developed to outline how fisherman can participate in future
wind energy fisheries activities.
• A preliminary training manual will be produced to guide future fishing industry
participation in wind energy programs.
• Education and outreach will be provided to the fishing industry about why
fisheries surveys are important in wind energy areas, as well as on the details of
the current survey and the related surveys (conducted by others).

32
Timeline
References
Brandt, M. J., Diederichs, A., Betke, K., and Nehls, G. 2011. Responses of harbour porpoises to
pile driving at the Horns Rev II offshore wind farm in the Danish North Sea. Marine
Ecology Progress Series, 421: 205–216.
Burnham K.P., and Anderson D. R. 2002. Model Selection and Inference: A Practical
Information-Theoretic Approach: Springer.
Calinski, T., and Harabasz, J. 1974. A dendrite method for cluster analysis. Comm. Statistics 3,
1-27.
DeCaceres, M., L. Coll, P. Legendre, R. B. Allen, S. K. Wiser, M.-J. Fortin, R. Condit, and S.
Hubbell. 2019. Trajectory analysis in community ecology. Ecological Monographs.
89(2):e01350. 10.1002/ecm.1350.
Jongman R.H.G., ter Braak C.J.F., and Van Tongeren O.F.R. 1995. Data analysis in community
and landscape ecology. Cambridge University Press, New YorkMethratta, E.T. 2020.
Monitoring fisheries resources at offshore wind farms: BACI vs. BAG designs ICES
Journal of Marine Science (2020), 77(3), 890–900. doi:10.1093/icesjms/fsaa026 .
Legendre P. and Gallagher E.D. 2001. Ecologically meaningful transformations for ordination of
species data. Oecologia: 129: 271-280.
Oksanen J., Guillaume Blanchet, F., Friendly, M., Kindt, R., Legendre P, McGlinn, D., Minchin
P.R., O'Hara R.B., Simpson G.L., Solymos P., Henry M., Stevens H., Szoecs E. and

33
Wagner H. 2019. vegan: Community Ecology Package. R package version 2.5-5.
https://CRAN.R-project.org/package=vegan
ROSA, 2020. Responsible Offshore Science Alliance. ROSA Interim Fisheries Resources
Research, Survey, and Monitoring Guidelines. Retrieved from: https://4d715fff-7bce-
4957-b10b-
aead478f74f6.filesusr.com/ugd/99421e_69e8f0fea86546fc908e0c335f48fa5c.pdf
ter Braak C.J.F. and Smilauer P. 2002. Canoco Reference Manual. Microcomputer Power,
Ithaca, NY, 500 pp.
ter Braak, C.J.F. 1985. Correspondence analysis of incidence and abundance data: properties in
terms of a unimodal response model. Biometrics 41: 859-873.