new york city independent budget office - nyc ibo · that renewal included a requirement that the...
TRANSCRIPT
IBO
Fiscal Brief New York City Independent Budget Office
New York CityPublic School Indicators:Demographics, Resources, OutcomesMay 2013
Grade Number of Students Asian Hispanic Black White Mixed Race American Indian
Pr-K 58,805 14.6% 36.1% 24.1% 20.2% 3.8% 0.4%
K 78,229 16.0% 38.7% 24.5% 17.5% 2.2% 0.5%
1 81,045 15.0% 40.2% 25.9% 16.7% 1.0% 0.6%
2 81,186 14.8% 40.8% 27.7% 15.5% 0.4% 0.5%
3 71,544 14.8% 40.4% 28.4% 15.4% 0.5% 0.4%
4 72,320 15.8% 39.4% 28.8% 15.1% 0.5% 0.3%
5 69,591 15.2% 40.1% 29.3% 14.6% 0.4% 0.3%
6 69,519 15.0% 40.1% 30.3% 13.8% 0.3% 0.4%
7 70,526 15.4% 39.9% 30.7% 13.4% 0.3% 0.3%
8 73,058 15.3% 39.6% 30.9% 13.6% 0.2% 0.3%
9 106,559 13.2% 40.0% 32.7% 11.5% 0.3% 0.4%
10 110,397 13.7% 39.7% 34.5% 11.0% 0.3% 0.4%
11 71,473 16.0% 37.4% 32.6% 13.2% 0.2% 0.4%
12 78,899 14.8% 37.1% 34.7% 12.6% 0.2% 0.4%
TOTAL1,093,151
14.9% 39.3% 29.9% 14.3% 0.7%
0.4%
Table 2.3
Student Ethnicity by Grade, 2009-2010
Number of Years in Program Number
Cumulative Percentage Number
Cumulative Percentage Number
Cumulative Percentage Number
Cumulative Percentage
1 9,528 33.6% 1,788 30.7% 25,967 24.1% 1,829 17.9%2 5,883 54.4% 1,238 51.9% 19,719 42.5% 1,004 27.7%3 4,428 70.0% 992 69.0% 16,226 57.5% 1,265 40.1%4 2,972 80.5% 770 82.2% 13,361 70.0% 1,228 52.1%5 2,078 87.9% 497 90.7% 10,195 79.4% 1,165 63.5%6 1,158 92.0% 289 95.7% 6,937 85.9% 1,144 74.6%7 752 94.6% 122 97.8% 4,920 90.5% 834 82.8%8 489 96.3% 85 99.2% 3,469 93.7% 643 89.1%9 345 97.6% 27 99.7% 2,335 95.9% 480 93.8%10 237 98.4% 14 99.9% 1,717 97.4% 335 97.0%11 164 99.0% 4 100.0% 1,018 98.4% 183 98.8%12 129 99.4% 100.0% 853 99.2% 71 99.5%Over 12 159 100.0% 100.0% 875 100.0% 49 100.0%TOTAL 28,322 18.6% 5,826 3.8% 107,592 70.8% 10,230 6.7%
Bilingual Dual LanguageEnglish as a Second
Language Only
Special Education/Individualized
Educational Program
Table 2.6Program Placement of English Language Learner Students, 2009-2010
English60.6%
Spanish23.1%
Chinese
(Unknown/Other)2.5%
Bengali1.9%
Chinese (Mandarin)1.7%
Russian1.5%
Arabic1.2%
Chinese (Cantonese)1.1%
Urdu
1.0%
Korean0.6%
Polish
0.4%
Haitian Creole0.4%
Albanian0.4%
Punjabi0.4%
French0.3%
Table 2.4
Fifteen Languages Most
Commonly Spoken at Home,
Grades K-2, 2009-2010
Grade Number Percent Number PercentK 62,054 79.3% 16,176 20.7%1 63,566 78.4% 17,479 21.6%2 65,278 80.4% 15,908 19.6%3 58,432 81.7% 13,112 18.3%4 60,346 83.4% 11,974 16.6%5 59,612 85.7% 9,979 14.3%6 60,875 87.6% 8,644 12.4%7 61,888 87.8% 8,638 12.2%8 64,358 88.1% 8,700 11.9%9 92,330 86.6% 14,229 13.4%10 94,527 85.6% 15,870 14.4%11 62,619 87.6% 8,854 12.4%12 69,597 88.2% 9,302 11.8%TOTAL 875,482 84.6% 158,865
15.4%
Table 2.5English Language Learner Status by Grade, 2009-2010
Not ELLELL
New York CityIndependent Budget Offi ceRonnie Lowenstein, Director
110 William St., 14th fl oorNew York, NY 10038Tel. (212) 442-0632
Fax (212) [email protected] www.ibo.nyc.ny.us

NYC Independent Budget Office May 2013

NYC Independent Budget Office May 2013
Contents
1
2
3
4
Background and Introduction . . . . . . . . . 1
Who Are New York City’s Public School Students? . . . . . . . . . . 5
What Resources Are Made Available To Our Public Schools? . . . . . . . . . . 13
What Do Some Indicators of School Performance Show? . . . . . . 33
Appendix: List of Schools Opened And Closed Each Year Since 2005-2006 . . .39

NYC Independent Budget Office May 2013d

NYC Independent Budget Office May 2013 1
In 2009, the state law granting the Mayor control of the New York City public school system was renewed. That renewal included a requirement that the New York City Independent Budget Office “enhance official and public understanding” of educational matters of the school system. The law also requires the Chancellor of the school system to provide IBO with the data that we deem necessary to conduct our analyses. That data began to flow to IBO at the beginning of the 2010-2011 school year.
This report is our second annual summary of that data. Over the course of the last year, we have issued a number of detailed analyses of student achievement, graduation outcomes, the school system’s School Progress Report methodology and school funding, and we will continue to produce those types of reports. This current report is designed as a descriptive overview of the school system rather than as an in-depth look at particular issues. It is organized into three main sections. The first presents demographic information on the students who attend New York City’s public schools. The next section describes the resources—budgets, school staff, and buildings—that the school system utilizes. The final section describes the measurable outcomes of the school system’s efforts for particular subgroups of students.
While this report presents a great deal of information, it is not exhaustive. Some important questions cannot be answered in this type of purely descriptive format. IBO will address those issues in more detailed and analytically sophisticated reports. With the exception of the citywide budget information presented in section three, all data in this report refers to students and staff of the New York City public school system. This data does not include students or staff in public charter schools or in publicly financed private special education programs.
A Few Notes on Data Sources
With very few exceptions, the data presented herein represents IBO’s analysis of individual student or staff data obtained from the Department of Education (DOE).
Since the publication of our initial Education Indicators Report, in September 2011, we have experienced a number of issues with the student biographic data provided to us by the Department of Education. Students move in and out of the school system regularly throughout the year and there were inconsistencies in the selection of students included in the data files provided to us by DOE. Shortly after beginning work on the current volume, both IBO and DOE analysts identified this issue with the data that was being provided to us for the years 2001-2002 through 2010-2011. The inconsistencies were limited to the inclusion of individual students in the data files which affected the summarized results for various student cohorts; we did not find cases with inconsistent performance data for individual students. These data issues
The independent budget office of the city of New York shall be authorized to provide analysis and issue public reports regarding financial and educational matters of the city district, to enhance official and public understanding of such matters…
New York State Education Law § 2590-u.
Background andIntroduction1
NYC Independent Budget Office May 20132
were not fully resolved until very late in 2012. This has a number of implications for the Education Indicators Report, both past and present:
As the obstacles resulting from inconsistent DOE data files were overcome, we were able to obtain updated, consistent data for both 2010-2011 and 2011-2012, the school year that ended last June. We have chosen to present both years of student and staff data in this single volume. There have been fewer issues with budget and school building data, and this volume is current through school year 2011-2012 for those sources. We also present data from the city’s adopted budget for fiscal year 2013, which represents spending planned for the current school year.
The corrected data provided to us for 2009-2010 and earlier years has led IBO to update our findings on students and staff for those years; careful readers may note that some of our findings for 2009-2010 and earlier years differ from those published in last year’s volume.
Student Demographics and Outcomes are derived from individual student records maintained by the Department of Education and provided to IBO for each of the last 12 years. These records include basic biographical information; achievement test scores; attendance records; and information on students’ entry to, exit from, and movement within the school system.
Students move in and out of the school system throughout the school year. The files provided to us by the DOE include information on all students who were “active” on a school’s register at any point in a particular school year. For this reason, we are often reporting on a larger number of students than are reported on the school system’s official count of enrollment. That figure, called the audited register, is drawn by the school system on October 31st of each year, and represents the number of students enrolled on that day. The numbers of students reported in our tables will also vary depending upon missing data for a particular indicator. If, for example, we are reporting data on the ethnicity of students, we drop any students whose ethnicity was not identified in our data.
Because we report information on all students for whom we have data, our achievement numbers also differ from the official numbers maintained by the New York State Education Department. These differences are very small, often amounting to no more than a tenth of a percentage point. Official achievement statistics are readily available on both the DOE and New York State Education Department Web sites.
Budget data are derived from two sources. The Mayor’s Office of Management and Budget (OMB) provides information on the funding of the school system and on the broad allocations made to the system through the annual budget as proposed by the Mayor, and as amended and adopted by the City Council. Much of this data is available to the public in summarized form in periodic budget reports on OMB’s Web site. We have access to the same information in greater detail and in real time through the city’s Financial Management System. The second source of budget information is derived from data on the allocation of budgetary resources by individual school principals. The source of that data is an internal report provided by the DOE to IBO on a monthly basis called the School Leadership Team (SLT) View.
NYC Independent Budget Office May 2013 3
It provides a detailed accounting of the source and use of every dollar controlled by the principal of each public school in the city. We used the report from June 2012 to produce the summaries presented here.
Principal and Teacher data is derived from individual personnel records maintained by the DOE and provided to IBO for each of the last 11 years. In addition to demographic and assignment data, these files indicate the use of alternative pathways to employment (Teach for America, Teaching Fellows, the Leadership Academy, etc.) by individual staff.
Building and Class Size data has been taken from DOE reports that are available to the general public on the DOE’s Web site, particularly the “Blue Book” and the Class Size Report.
School Level data was taken from the DOE’s Web site to classify schools as either new or existing schools, and to categorize schools based upon the poverty level of their students. When we refer to “new” schools, we are referring to schools that have opened since the beginning of the Bloomberg Administration in the 2002-2003 school year. We highlight these schools in some of the data because of the importance of creating new schools to the Bloomberg Administration’s Children’s First initiatives. Student poverty level is derived from students’ eligibility for free or reduced-price meals, which is determined by their family income level. We have classified schools into three categories: high poverty includes schools in the top third of schools in a particular level (elementary, middle school, and high school) in terms of the percent of students eligible for free or reduced-price meals; medium poverty indicates that a school is in the middle third of schools in their level; and low poverty indicates that a school is in the lowest third. Given the demographics of the city’s public schools, schools in the lowest third of poverty levels may still have as many as 70 percent of their students classified as low income.

NYC Independent Budget Office May 20134

NYC Independent Budget Office May 2013 5
Who Are New York City’s Public School Students?2
Table 2.1 Birthplace of Students
2010-2011 2011-2012
Number Percent Number Percent
AmericasUnited States 894,468 82.6 898,354 82.9Carribean 58,298 5.4 58,160 5.4South America 22,632 2.1 21,242 2.0
Rest of North and Central America 25,024 2.3 23,347 2.2Asia 57,422 5.3 58,009 5.4Europe 12,048 1.1 11,224 1.0Africa 9,524 0.9 10,189 0.9Oceania 336 0.0 393 0.0Country Unknown 3,272 0.3 2,843 0.3NOTE: Rest of North and Central America includes U.S. Territories.
New York City Independent Budget Office
Table 2.2 Twenty-five Most Frequent Birthplaces Outside the 50 States
2010-2011 2011-2012
Country/Territory
Number of Students
Country/Territory
Number of Students
Dominican Republic 35,614
Dominican Republic 36,492
China 20,266 China 19,725Mexico 10,287 Bangladesh 10,439Guyana 9,620 Mexico 9,363Bangladesh 9,552 Jamaica 9,225Jamaica 9,468 Guyana 9,039Puerto Rico 8,163 Puerto Rico 7,613Ecuador 6,612 Haiti 6,464Haiti 6,573 Ecuador 6,206Pakistan 5,734 Pakistan 5,531India 3,905 India 3,772Trinidad & Tobago 3,317 Yemen 3,528Yemen 3,203 Uzbekistan 2,999
Colombia 2,965Trinidad & Tobago 2,843
Russia 2,535 Colombia 2,744Korea 2,512 Russia 2,281Uzbekistan 2,372 Philippines 2,185Philippines 2,143 Korea 2,171Honduras 1,760 Egypt 1,870Albania 1,652 Honduras 1,634Egypt 1,645 Ghana 1,586Ghana 1,532 Albania 1,530Poland 1,445 El Salvador 1,392El Salvador 1,406 Poland 1,248Ukraine 1,385 Ukraine 1,243
New York City Independent Budget Office
New York City’s public school system serves a tremendously diverse student body, reflecting the city’s standing as a port of entry for new Americans. Thus, the demographic picture of the city’s schools is not just about race, but also ethnicity and nativity. While 83 percent of New York’s public school students in 2011-2012 were born in the United States (Table 2.1), the remaining 17 percent hail from 197 other countries or territories (Table 2.2 lists the 25 most represented).
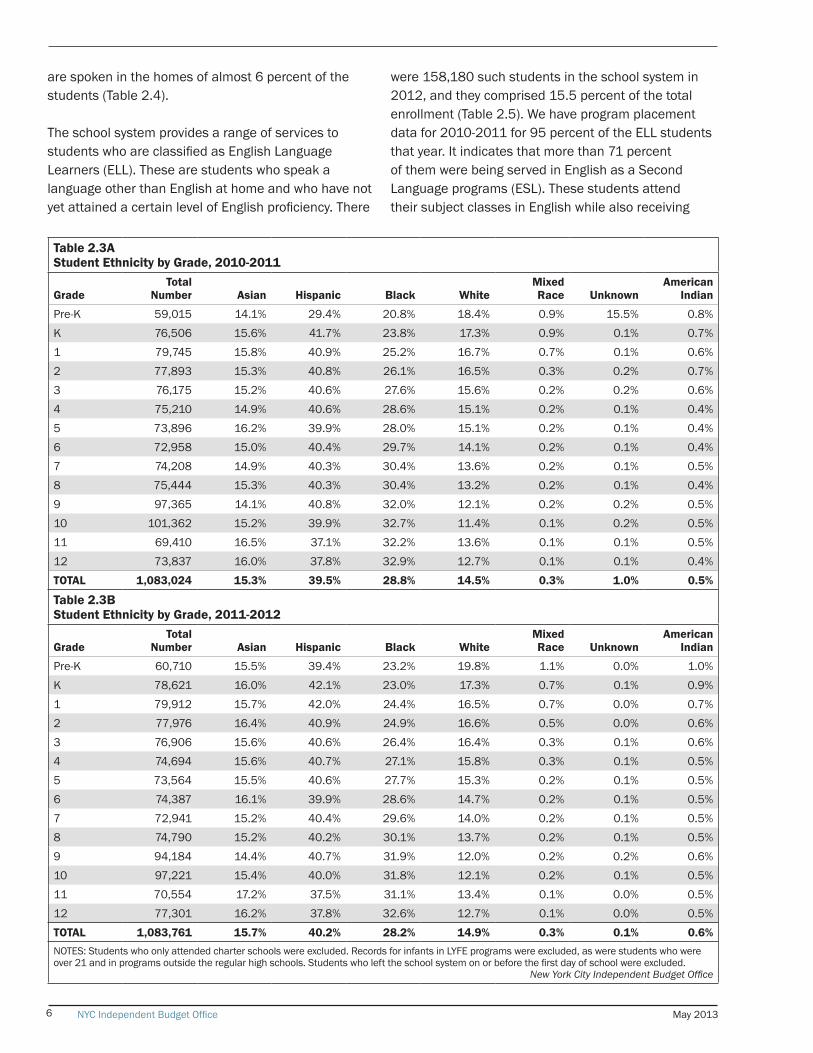
In racial and ethnic terms, Hispanics form the largest group in the school system, at slightly more than 40 percent. Black students account for about 28 percent. There are more Asians (16 percent) than whites (15 percent) in the school system and other groups account for the remaining 1 percent of students. While the share of students who are Hispanic or Asian is fairly constant across the grades, whites are more highly represented in the early grades than in the higher grades. The opposite is true for black students (Table 2.3), with their share of enrollment higher in the high school grades than in the early grades.
Reflecting this diversity, students in the city’s public schools come from homes where over 185 languages are spoken. More than 42 percent of the students come from homes where English is not the primary language. Spanish is spoken in 25 percent of student homes and various languages/dialects from China
NYC Independent Budget Office May 20136
Table 2.3A Student Ethnicity by Grade, 2010-2011
Grade Total
Number Asian Hispanic Black WhiteMixed Race Unknown
American Indian
Pre-K 59,015 14.1% 29.4% 20.8% 18.4% 0.9% 15.5% 0.8%K 76,506 15.6% 41.7% 23.8% 17.3% 0.9% 0.1% 0.7%1 79,745 15.8% 40.9% 25.2% 16.7% 0.7% 0.1% 0.6%2 77,893 15.3% 40.8% 26.1% 16.5% 0.3% 0.2% 0.7%3 76,175 15.2% 40.6% 27.6% 15.6% 0.2% 0.2% 0.6%4 75,210 14.9% 40.6% 28.6% 15.1% 0.2% 0.1% 0.4%5 73,896 16.2% 39.9% 28.0% 15.1% 0.2% 0.1% 0.4%6 72,958 15.0% 40.4% 29.7% 14.1% 0.2% 0.1% 0.4%7 74,208 14.9% 40.3% 30.4% 13.6% 0.2% 0.1% 0.5%8 75,444 15.3% 40.3% 30.4% 13.2% 0.2% 0.1% 0.4%9 97,365 14.1% 40.8% 32.0% 12.1% 0.2% 0.2% 0.5%10 101,362 15.2% 39.9% 32.7% 11.4% 0.1% 0.2% 0.5%11 69,410 16.5% 37.1% 32.2% 13.6% 0.1% 0.1% 0.5%12 73,837 16.0% 37.8% 32.9% 12.7% 0.1% 0.1% 0.4%TOTAL 1,083,024 15.3% 39.5% 28.8% 14.5% 0.3% 1.0% 0.5%
Table 2.3B Student Ethnicity by Grade, 2011-2012
Grade Total
Number Asian Hispanic Black WhiteMixed Race Unknown
American Indian
Pre-K 60,710 15.5% 39.4% 23.2% 19.8% 1.1% 0.0% 1.0%K 78,621 16.0% 42.1% 23.0% 17.3% 0.7% 0.1% 0.9%1 79,912 15.7% 42.0% 24.4% 16.5% 0.7% 0.0% 0.7%2 77,976 16.4% 40.9% 24.9% 16.6% 0.5% 0.0% 0.6%3 76,906 15.6% 40.6% 26.4% 16.4% 0.3% 0.1% 0.6%4 74,694 15.6% 40.7% 27.1% 15.8% 0.3% 0.1% 0.5%5 73,564 15.5% 40.6% 27.7% 15.3% 0.2% 0.1% 0.5%6 74,387 16.1% 39.9% 28.6% 14.7% 0.2% 0.1% 0.5%7 72,941 15.2% 40.4% 29.6% 14.0% 0.2% 0.1% 0.5%8 74,790 15.2% 40.2% 30.1% 13.7% 0.2% 0.1% 0.5%9 94,184 14.4% 40.7% 31.9% 12.0% 0.2% 0.2% 0.6%10 97,221 15.4% 40.0% 31.8% 12.1% 0.2% 0.1% 0.5%11 70,554 17.2% 37.5% 31.1% 13.4% 0.1% 0.0% 0.5%12 77,301 16.2% 37.8% 32.6% 12.7% 0.1% 0.0% 0.5%TOTAL 1,083,761 15.7% 40.2% 28.2% 14.9% 0.3% 0.1% 0.6%NOTES: Students who only attended charter schools were excluded. Records for infants in LYFE programs were excluded, as were students who were over 21 and in programs outside the regular high schools. Students who left the school system on or before the first day of school were excluded.
New York City Independent Budget Office
are spoken in the homes of almost 6 percent of the students (Table 2.4).
The school system provides a range of services to students who are classified as English Language Learners (ELL). These are students who speak a language other than English at home and who have not yet attained a certain level of English proficiency. There
were 158,180 such students in the school system in 2012, and they comprised 15.5 percent of the total enrollment (Table 2.5). We have program placement data for 2010-2011 for 95 percent of the ELL students that year. It indicates that more than 71 percent of them were being served in English as a Second Language programs (ESL). These students attend their subject classes in English while also receiving

NYC Independent Budget Office May 2013 7
special instruction meant to bring them to English language proficiency. A little more than 18 percent of ELL students were in bilingual classrooms, where subject classes are taught in their native language. The remaining 10.8 percent of ELL students were in either dual language programs, where the emphasis is on a mix of English and non-English speaking students learning each others’ language, or in programs determined by their Individualized Education Plan (IEP), which is set for each youngster in special education programs. (Table 2.6 presents these data.)
Nearly 73 percent of students in bilingual programs in 2010-2011 were in those programs for three years or less, while 59 percent of students in English as a Second Language programs were participating for three years or less. While this might suggest that students in bilingual programs move to English language proficiency quicker than those in ESL programs, data are also influenced by variation in the number of students entering a program each year. The higher percentage of students in bilingual programs for fewer than three years might simply be
due to more students entering that program in the most recent two years, and not be indicative of the rate at which students exit that program.
Seventeen percent of students are classified as having special education needs (Table 2.7). These students are in programs ranging from classrooms serving a mix of special education and general education youngsters to classrooms designed to serve a very small number of youngsters with specific needs.
Students in New York City public schools overwhelmingly come from lower-income households. More than 79 percent qualify for free or reduced cost school meals because they come from homes with income less than 185 percent of the poverty level or because they attend very high poverty schools where the federal government allows the city to simply qualify all students for subsidized meals (so-called universal feeding schools). The remaining 21 percent do not qualify for meal subsidies either because their family income is greater than the eligibility cut-off or they have failed to return valid eligibility forms. (In prior years, more detailed information available to IBO indicated that 60 percent of the students who were deemed ineligible for meal subsidies had been so identified because of the lack of a valid eligibility form.)
Students generally enter kindergarten at the age of 5 and complete high school at age 17 or 18, if they proceed through the grades at the expected pace and if their education is not interrupted. This pattern is far from universal in the city’s public schools, however. Some students transfer into city schools from other schools, districts, or countries, already behind their age–peers. Others are required to repeat a grade within the school system. Due to these and other factors, 20 percent of eighth graders in the system were over the standard age for that grade in 2011-2012, and that proportion grew to 39 percent in 10th grade. Because students begin to drop out in larger numbers after grade 10, there are fewer over-age students in grades 11 and 12. Much smaller numbers of students, 3 percent, accelerated their progress and reach 12th grade younger than the standard age. (Table 2.9 displays these data.)
Enrollment in the city school system is dynamic, with varying birth rates and residential patterns affecting
Table 2.4 Fifteen Languages Most Commonly Spoken at Home 2010-2011 and 2011-2012
2010-2011 2011-2012
LanguageShare of
Total LanguageShare of
Total
English 58.1% English 57.9%Spanish 24.6 Spanish 24.5Chinese (Other/Unknown) 2.2
Chinese (Other/Unknown) 2.3
Chinese (Cantonese) 1.8 Bengali 1.9
Bengali 1.8Chinese (Mandarin) 1.8
Chinese (Mandarin) 1.7
Chinese (Cantonese) 1.8
Russian 1.6 Russian 1.6Arabic 1.1 Arabic 1.2Urdu 1.0 Urdu 1.0Haitian Creole 0.7 Haitian Creole 0.7Korean 0.6 Korean 0.6Albanian 0.5 Polish 0.4Polish 0.4 Albanian 0.4Punjabi (aka Panjabi) 0.4 French 0.4
French 0.4Punjabi (aka Panjabi) 0.4
New York City Independent Budget Office

NYC Independent Budget Office May 20138
important issues such as building utilization and class sizes. In recent years, some neighborhoods have seen waiting lists form for individual elementary schools. After rising steadily beginning in 1995-1996, citywide enrollment peaked at 1.1 million students in 2000-
2001. It then declined for eight straight years by a cumulative 7 percent to reach 1.03 million in 2008-2009. In recent years, total enrollment has fluctuated slightly around the 1.04 million student mark. Since 2006-2007, enrollment has increased in Queens (up
Table 2.5 English Language Learner Status by Grade
2010-2011 2011-2012
Grade
Not English Language Learner
English Language Learner
Grade
Not English Language Learner
English Language Learner
Number Percent Number Percent Number Percent Number Percent
K 59,995 78.4% 16,511 21.6% K 62,231 79.2% 16,390 20.8%1 62,755 78.7% 16,990 21.3% 1 63,036 78.9% 16,876 21.1%2 63,799 81.9% 14,094 18.1% 2 63,784 81.8% 14,192 18.2%3 62,304 81.8% 13,871 18.2% 3 64,090 83.3% 12,816 16.7%4 62,332 82.9% 12,878 17.1% 4 62,304 83.4% 12,390 16.6%5 62,628 84.8% 11,268 15.2% 5 62,656 85.2% 10,908 14.8%6 62,734 86.0% 10,224 14.0% 6 64,837 87.2% 9,550 12.8%7 64,310 86.7% 9,898 13.3% 7 63,456 87.0% 9,485 13.0%8 65,140 86.3% 10,304 13.7% 8 64,944 86.8% 9,846 13.2%9 83,438 85.7% 13,927 14.3% 9 81,068 86.1% 13,116 13.9%10 85,953 84.8% 15,409 15.2% 10 82,481 84.8% 14,740 15.2%11 61,180 88.1% 8,230 11.9% 11 61,677 87.4% 8,877 12.6%12 65,014 88.1% 8,823 11.9% 12 68,307 88.4% 8,994 11.6%TOTAL 861,582 84.1% 162,427 15.9% TOTAL 864,871 84.5% 158,180 15.5%
New York City Independent Budget Office
Table 2.6 Program Placement of English Language Learner Students, 2010-2011
Number of Years in Program
Bilingual Dual LanguageEnglish as a Second
Language Only
Special Education/ Individualized Educational
Program
NumberCumulative Percentage Number
Cumulative Percentage Number
Cumulative Percentage Number
Cumulative Percentage
1 9,137 32.8% 1953 31.9% 26,770 24.5% 1723 16.6%2 7,222 58.7% 1512 56.6% 22,792 45.3% 1006 26.3%3 3,971 72.9% 875 70.9% 14,921 58.9% 1315 38.9%4 2,725 82.7% 718 82.6% 12,813 70.6% 1262 51.1%5 1,753 89.0% 477 90.4% 9,845 79.6% 1200 62.6%6 1,147 93.1% 293 95.2% 7,159 86.2% 1188 74.0%7 599 95.2% 167 97.9% 4,949 90.7% 901 82.7%8 438 96.8% 65 98.9% 3,468 93.9% 678 89.3%9 291 97.9% 54 99.8% 2,464 96.1% 517 94.2%10 222 98.7% 7 99.9% 1,568 97.5% 338 97.5%11 153 99.2% 4 100.0% 1,125 98.6% 158 99.0%12 94 99.5% 674 99.2% 64 99.6%Over 12 129 100.0% 893 100.0% 40 100.0%TOTAL 27,881 18.1% 6,125 4.0% 109,441 71.1% 10,390 6.8%
New York City Independent Budget Office

NYC Independent Budget Office May 2013 9
6.5 percent) and Staten Island (up 5.2 percent), while declining in Brooklyn (down 3.4 percent) and Manhattan (down 4.3 percent) and the Bronx (down 1.6 percent). (Table 2.10 and Figure 2.1 display these data.)
Table 2.7A Special Education Status of Public School Students, 2010-2011
General Education Special Education
Grade Number Percent Number Percent
Pre-K 53,503 90.7% 5,512 9.3%K 66,061 86.3% 10,445 13.7%1 67,233 84.3% 12,512 15.7%2 64,090 82.3% 13,803 17.7%3 61,740 81.1% 14,435 18.9%4 60,207 80.1% 15,003 19.9%5 59,272 80.2% 14,624 19.8%6 58,713 80.5% 14,245 19.5%7 59,981 80.8% 14,227 19.2%8 61,624 81.7% 13,820 18.3%9 78,549 80.7% 18,816 19.3%10 85,875 84.7% 15,487 15.3%11 60,277 86.8% 9,133 13.2%12 62,966 85.3% 10,871 14.7%TOTAL 900,091 83.1% 182,933 16.9%
Table 2.7B Special Education Status of Public School Students, 2011-2012
General Education Special Education
Grade Number Percent Number Percent
Pre-K 55,374 91.2% 5,336 8.8%K 68,181 86.7% 10,440 13.3%1 67,458 84.4% 12,454 15.6%2 64,465 82.7% 13,511 17.3%3 62,187 80.9% 14,719 19.1%4 59,780 80.0% 14,914 20.0%5 58,757 79.9% 14,807 20.1%6 59,897 80.5% 14,490 19.5%7 58,870 80.7% 14,071 19.3%8 60,741 81.2% 14,049 18.8%9 75,840 80.5% 18,344 19.5%10 81,574 83.9% 15,647 16.1%11 61,362 87.0% 9,192 13.0%12 65,444 84.7% 11,857 15.3%TOTAL 899,930 83.0% 183,831 17.0%
New York City Independent Budget Office
Table 2.8A Poverty Level of Public School Students by Grade, 2010-2011
Free or Reduced-Price Lunch Full-Price Lunch
Grade Number Percent Number Percent
Pre-K 28,517 48.3% 30,498 51.7%K 64,793 84.7% 11,713 15.3%1 68,227 85.6% 11,518 14.4%2 67,241 86.3% 10,652 13.7%3 66,235 87.0% 9,940 13.0%4 65,780 87.5% 9,430 12.5%5 64,546 87.3% 9,350 12.7%6 62,650 85.9% 10,308 14.1%7 63,608 85.7% 10,600 14.3%8 64,648 85.7% 10,796 14.3%9 75,990 78.0% 21,375 22.0%10 78,682 77.6% 22,680 22.4%11 51,337 74.0% 18,073 26.0%12 53,347 72.2% 20,490 27.8%TOTAL 875,601 80.8% 207,423 19.2%
Table 2.8B Poverty Level of Public School Students by Grade, 2011-2012
Free or Reduced-Price Lunch Full-Price Lunch
Grade Number Percent Number Percent
Pre-K 27,983 46.1% 32,727 53.9%K 64,912 82.6% 13,709 17.4%1 66,926 83.7% 12,986 16.3%2 65,434 83.9% 12,542 16.1%3 64,958 84.5% 11,948 15.5%4 63,452 84.9% 11,242 15.1%5 62,817 85.4% 10,747 14.6%6 62,496 84.0% 11,891 16.0%7 61,003 83.6% 11,938 16.4%8 62,362 83.4% 12,428 16.6%9 72,189 76.6% 21,995 23.4%10 73,846 76.0% 23,375 24.0%11 51,192 72.6% 19,362 27.4%12 53,583 69.3% 23,718 30.7%TOTAL 853,153 78.7% 230,608 21.3%NOTES: All students in “universal feeding schools are included in the “Free or Reduced-Price” category. In this table, students who did not return a completed school lunch eligibility form are counted in the Full- Price Lunch category. The data available to IBO does not allow us to count those students separately in all grades.
New York City Independent Budget Office

NYC Independent Budget Office May 201310
Table 2.9AStudent Age Relative to Grade, 2010-2011Grade Under Age Standard Age Over Age
K 0.4% 97.1% 2.5%1 0.2% 92.5% 7.3%2 0.3% 89.1% 10.6%3 0.4% 87.2% 12.4%4 0.5% 86.0% 13.5%5 0.6% 85.7% 13.7%6 1.0% 82.6% 16.3%7 1.1% 80.3% 18.5%8 1.0% 77.5% 21.5%9 1.0% 62.0% 37.0%10 1.3% 58.3% 40.4%11 2.1% 68.4% 29.5%12 3.7% 68.0% 28.3%
Table 2.9BStudent Age Relative to Grade, 2011-2012Grade Under Age Standard Age Over Age
K 0.1% 97.1% 2.8%1 0.2% 92.4% 7.3%2 0.2% 89.3% 10.5%3 0.4% 87.1% 12.6%4 0.5% 86.5% 13.0%5 0.5% 85.4% 14.1%6 0.8% 83.3% 16.0%7 0.9% 81.0% 18.1%8 1.1% 78.7% 20.2%9 1.0% 63.3% 35.7%10 1.3% 60.1% 38.6%11 1.6% 68.3% 30.1%12 3.3% 67.9% 28.8%NOTES: General Education population only. Excludes students in District 84 and 256 students whose age data was missing.
New York City Independent Budget Office
1,0201,0401,0601,0801,1001,1201,1401,1601,1801,200
Figure 2.1Enrollment in New York City Public SchoolsEnrollment in thousands
SOURCE: New York City Department of Education Annual Audited Register, October 31 each year
New York City Independent Budget Office
1999-2000
2001-2002
2003-2004
2005-2006
2007-2008
2009-2010
2011-2012

NYC Independent Budget Office May 2013 11
Table 2.10 Public School Enrollment Trends, 1999-2000 Through 2011-2012School Year Bronx Brooklyn Manhattan Queens Staten Island TOTAL
1999-2000 228,846 355,957 172,570 282,515 59,549 1,099,437
2000-2001 229,730 355,631 171,328 287,293 61,258 1,105,240
2001-2002 229,088 352,263 169,344 286,032 62,105 1,098,832
2002-2003 228,671 347,952 168,759 283,961 62,374 1,091,717
2003-2004 229,564 344,378 168,614 282,016 62,314 1,086,886
2004-2005 227,430 337,949 168,834 279,616 61,509 1,075,338
2005-2006 223,803 328,964 165,867 276,688 60,664 1,055,986
2006-2007 221,832 320,753 163,861 275,051 60,581 1,042,078
2007-2008 219,736 316,702 160,588 276,991 61,389 1,035,406
2008-2009 217,998 311,244 158,502 279,806 61,909 1,029,459
2009-2010 218,601 312,681 158,431 286,024 63,004 1,038,741
2010-2011 219,581 312,656 157,770 290,602 63,277 1,043,886
2011-2012 218,195 309,770 156,824 292,940 63,708 1,041,437
Five-Year Change Since 2006-2007 -1.6% -3.4% -4.3% 6.5% 5.2% -0.1%SOURCE: New York City Department of Education Annual Audited Register, October 31 of each year.
New York City Independent Budget Office

NYC Independent Budget Office May 201312
NYC Independent Budget Office May 2013 13
What Resources Are Made Available to Our Public Schools?
3
Budgetary Resources
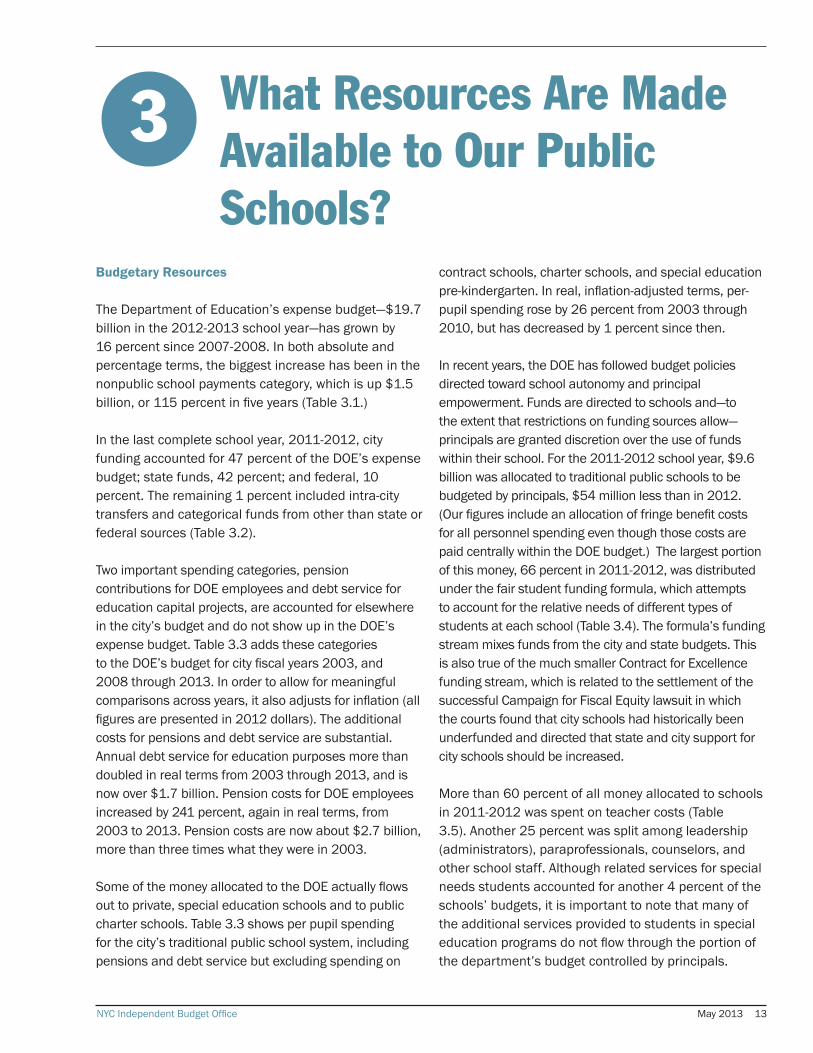
The Department of Education’s expense budget—$19.7 billion in the 2012-2013 school year—has grown by 16 percent since 2007-2008. In both absolute and percentage terms, the biggest increase has been in the nonpublic school payments category, which is up $1.5 billion, or 115 percent in five years (Table 3.1.)
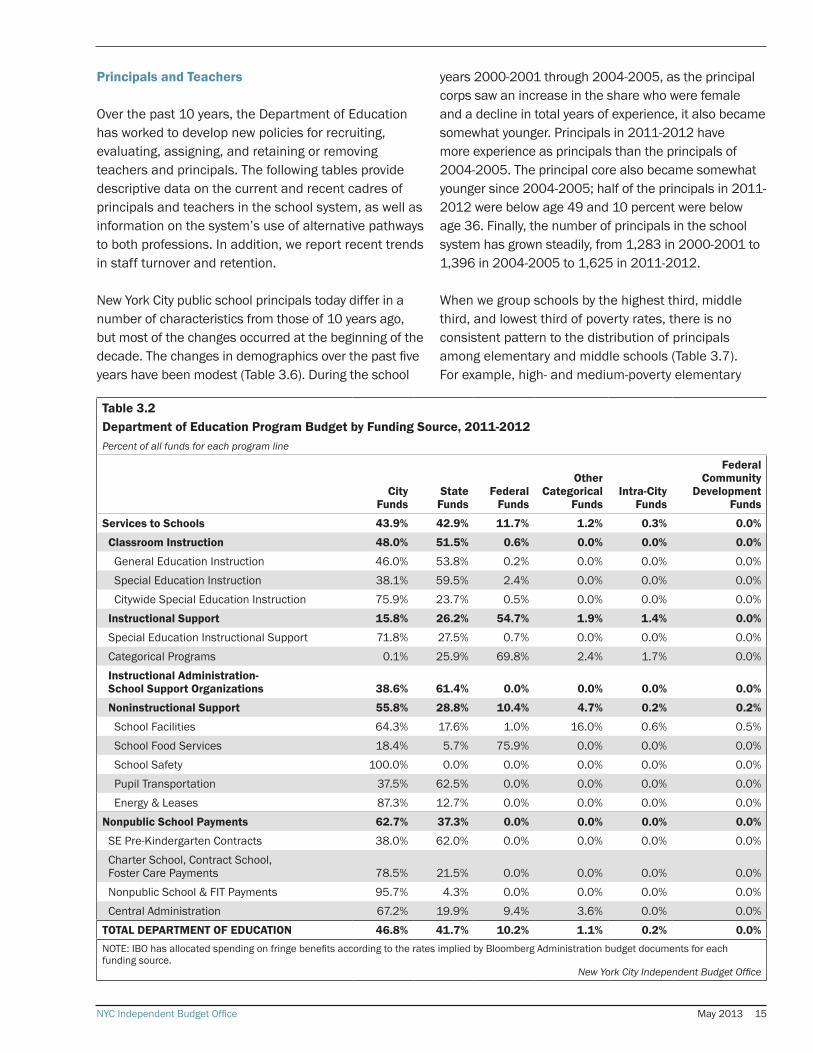
In the last complete school year, 2011-2012, city funding accounted for 47 percent of the DOE’s expense budget; state funds, 42 percent; and federal, 10 percent. The remaining 1 percent included intra-city transfers and categorical funds from other than state or federal sources (Table 3.2). Two important spending categories, pension contributions for DOE employees and debt service for education capital projects, are accounted for elsewhere in the city’s budget and do not show up in the DOE’s expense budget. Table 3.3 adds these categories to the DOE’s budget for city fiscal years 2003, and 2008 through 2013. In order to allow for meaningful comparisons across years, it also adjusts for inflation (all figures are presented in 2012 dollars). The additional costs for pensions and debt service are substantial. Annual debt service for education purposes more than doubled in real terms from 2003 through 2013, and is now over $1.7 billion. Pension costs for DOE employees increased by 241 percent, again in real terms, from 2003 to 2013. Pension costs are now about $2.7 billion, more than three times what they were in 2003.
Some of the money allocated to the DOE actually flows out to private, special education schools and to public charter schools. Table 3.3 shows per pupil spending for the city’s traditional public school system, including pensions and debt service but excluding spending on
contract schools, charter schools, and special education pre-kindergarten. In real, inflation-adjusted terms, per-pupil spending rose by 26 percent from 2003 through 2010, but has decreased by 1 percent since then.
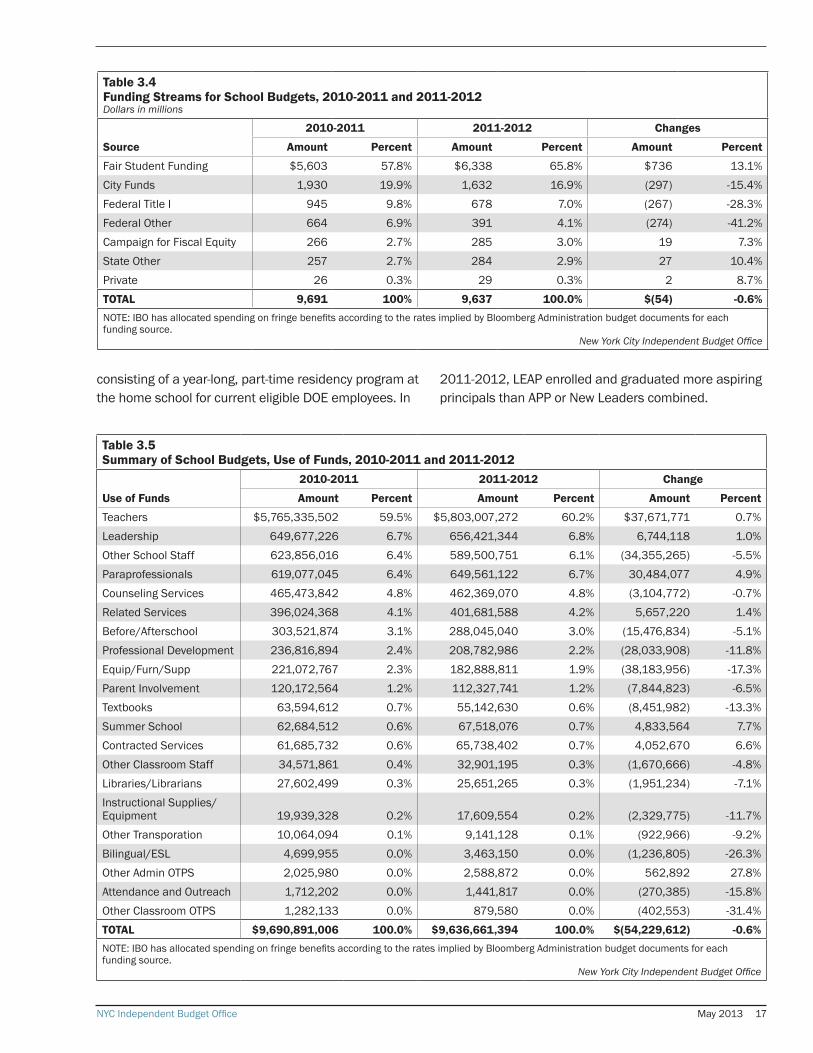
In recent years, the DOE has followed budget policies directed toward school autonomy and principal empowerment. Funds are directed to schools and—to the extent that restrictions on funding sources allow—principals are granted discretion over the use of funds within their school. For the 2011-2012 school year, $9.6 billion was allocated to traditional public schools to be budgeted by principals, $54 million less than in 2012. (Our figures include an allocation of fringe benefit costs for all personnel spending even though those costs are paid centrally within the DOE budget.) The largest portion of this money, 66 percent in 2011-2012, was distributed under the fair student funding formula, which attempts to account for the relative needs of different types of students at each school (Table 3.4). The formula’s funding stream mixes funds from the city and state budgets. This is also true of the much smaller Contract for Excellence funding stream, which is related to the settlement of the successful Campaign for Fiscal Equity lawsuit in which the courts found that city schools had historically been underfunded and directed that state and city support for city schools should be increased.
More than 60 percent of all money allocated to schools in 2011-2012 was spent on teacher costs (Table 3.5). Another 25 percent was split among leadership (administrators), paraprofessionals, counselors, and other school staff. Although related services for special needs students accounted for another 4 percent of the schools’ budgets, it is important to note that many of the additional services provided to students in special education programs do not flow through the portion of the department’s budget controlled by principals.

NYC Independent Budget Office May 201314
Tabl
e 3.
1D
epar
tmen
t of E
duca
tion
Prog
ram
Bud
get,
2008
-201
3 D
olla
rs in
thou
sand
s
Cha
nge
from
20
11-2
012
to
2012
-201
3
Cha
nge
from
20
07-2
008
to 2
012-
2013
2007
-200
820
08-2
009
2009
-201
020
10-2
011
201
1-20
12
201
2-20
13
Proj
ecte
d D
olla
rs
Perc
ent
Ser
vice
s to
Sch
ools
$1
5,10
2,67
9$1
5,85
4,65
1$1
6,09
6,56
3$1
6,32
1,04
5$1
6,41
3,20
3$1
6,51
0,81
3$9
7,61
0 $1
,408
,134
9.
3%
Clas
sroo
m In
stru
ctio
n $9
,358
,047
$9,9
81,6
85$9
,580
,522
$9,8
21,8
63$1
0,22
9,42
0$1
0,45
1,59
2$2
22,1
71
$1,0
93,5
44
11.7
%
Gen
eral
Edu
catio
n In
stru
ctio
n 6
,960
,412
7
,346
,096
7
,158
,064
7
,338
,267
7
,657
,833
7
,818
,464
16
0,63
1 85
8,05
2 12
.3%
Spec
ial E
duca
tion
Inst
ruct
ion
1,3
43,0
01
1,5
38,5
58
1,2
59,5
15
1,3
27,5
93
1,4
93,1
14
1,4
30,8
83
(62,
232)
87,8
82
6.5%
City
wid
e Sp
ecia
l Edu
catio
n In
stru
ctio
n 1
,054
,634
1
,097
,030
1
,162
,943
1
,156
,003
1
,078
,473
1
,202
,245
12
3,77
2 14
7,61
1 14
.0%
Inst
ruct
iona
l Sup
port
$2
,605
,295
$2,5
50,6
92$2
,935
,842
$3,0
50,0
48$2
,807
,269
$2,6
89,5
51($
117,
718)
$84,
257
3.2%
Spec
ial E
duca
tion
Inst
ruct
iona
l Sup
port
5
62,0
44
590
,630
6
07,6
77
618
,245
6
15,1
14
701
,172
86
,058
13
9,12
8 24
.8%
Cate
goric
al P
rogr
ams
2,0
43,2
50
1,9
60,0
62
2,3
28,1
65
2,4
31,8
03
2,1
92,1
55
1,9
88,3
79
(203
,776
)(5
4,87
1)-2
.7%
Inst
ruct
iona
l Adm
in-S
choo
l Su
ppor
t Org
aniz
atio
ns$2
77,4
98$2
85,7
48$2
77,7
53$1
72,2
52$1
91,1
34$1
79,6
21($
11,5
13)
($97
,878
)-3
5.3%
Non
inst
ruct
iona
l Sup
port
$2
,861
,839
$3,0
36,5
26$3
,302
,445
$3,2
76,8
82$3
,185
,380
$3,1
90,0
49$4
,670
$3
28,2
10
11.5
%
Scho
ol F
acili
ties
898
,925
1
,043
,866
1
,105
,610
1
,033
,358
9
31,6
03
812
,401
(1
19,2
02)
(86,
524)
-9.6
%Sc
hool
Foo
d Se
rvic
es
400
,270
4
13,3
58
483
,747
4
59,8
39
425
,007
4
32,6
93
7,68
5 32
,422
8.
1%Sc
hool
Saf
ety
204
,086
2
17,0
02
294
,679
2
97,9
00
298
,111
3
03,9
40
5,82
8 99
,854
48
.9%
Pupi
l Tra
nspo
rtat
ion
966
,878
9
68,4
60
995
,662
1
,017
,219
1
,073
,697
1
,132
,167
58
,470
16
5,28
9 17
.1%
Ener
gy &
Lea
ses
391
,680
3
93,8
40
422
,748
4
68,5
67
456
,961
5
08,8
50
51,8
89
117,
169
29.9
%Pr
ivat
e an
d O
ther
Non
-Pub
lic
Scho
ol P
aym
ents
$1
,333
,966
$1,5
65,0
41$1
,901
,515
$2,1
74,3
10$2
,501
,203
$2,8
64,8
43$3
63,6
40
$1,5
30,8
77
114.
8%
Spec
ial E
duca
tion
Pre-
Kind
erga
rten
Con
tract
s 6
37,8
48
739
,296
8
52,5
91
943
,426
1
,008
,570
1
,193
,402
18
4,83
2 55
5,55
3 87
.1%
Char
ter S
choo
l, Co
ntra
ct
Scho
ol, F
oste
r Car
e Pa
ymen
ts
635
,026
7
64,3
05
977
,903
1
,161
,576
1
,421
,509
1
,600
,295
17
8,78
6 96
5,26
9 15
2.0%
Non
publ
ic S
choo
l & F
IT
Paym
ents
6
1,09
2 6
1,44
0 7
1,02
1 6
9,30
8 7
1,12
4 7
1,14
6 22
10
,055
16
.5%
Cent
ral A
dmin
istr
atio
n $5
40,3
89$4
83,3
61$5
00,4
27$4
43,5
74$3
68,8
50$3
49,4
12($
19,4
38)
($19
0,97
7)-3
5.3%
TOTA
L D
OE
BU
DG
ET
$16,
977,
034
$17,
903,
053
$18,
498,
505
$18,
938,
929
$19,
283,
256
$19,
725,
068
$441
,812
$2
,748
,034
16
.2%
NOT
E: IB
O ha
s al
loca
ted
spen
ding
on
fring
e be
nefit
s ac
cord
ing
to th
e ra
tes
impl
ied
by th
e Bl
oom
berg
Adm
inis
tratio
n bu
dget
doc
umen
ts fo
r eac
h fu
ndin
g so
urce
. New
Yor
k Ci
ty In
depe
nden
t Bud
get O
ffice
NYC Independent Budget Office May 2013 15
Table 3.2Department of Education Program Budget by Funding Source, 2011-2012Percent of all funds for each program line
City Funds
State Funds
Federal Funds
Other Categorical
FundsIntra-City
Funds
Federal Community
Development Funds
Services to Schools 43.9% 42.9% 11.7% 1.2% 0.3% 0.0%
Classroom Instruction 48.0% 51.5% 0.6% 0.0% 0.0% 0.0%
General Education Instruction 46.0% 53.8% 0.2% 0.0% 0.0% 0.0%Special Education Instruction 38.1% 59.5% 2.4% 0.0% 0.0% 0.0%Citywide Special Education Instruction 75.9% 23.7% 0.5% 0.0% 0.0% 0.0%
Instructional Support 15.8% 26.2% 54.7% 1.9% 1.4% 0.0%
Special Education Instructional Support 71.8% 27.5% 0.7% 0.0% 0.0% 0.0%Categorical Programs 0.1% 25.9% 69.8% 2.4% 1.7% 0.0%Instructional Administration-School Support Organizations 38.6% 61.4% 0.0% 0.0% 0.0% 0.0%
Noninstructional Support 55.8% 28.8% 10.4% 4.7% 0.2% 0.2%
School Facilities 64.3% 17.6% 1.0% 16.0% 0.6% 0.5%School Food Services 18.4% 5.7% 75.9% 0.0% 0.0% 0.0%School Safety 100.0% 0.0% 0.0% 0.0% 0.0% 0.0%Pupil Transportation 37.5% 62.5% 0.0% 0.0% 0.0% 0.0%Energy & Leases 87.3% 12.7% 0.0% 0.0% 0.0% 0.0%
Nonpublic School Payments 62.7% 37.3% 0.0% 0.0% 0.0% 0.0%
SE Pre-Kindergarten Contracts 38.0% 62.0% 0.0% 0.0% 0.0% 0.0%Charter School, Contract School, Foster Care Payments 78.5% 21.5% 0.0% 0.0% 0.0% 0.0%Nonpublic School & FIT Payments 95.7% 4.3% 0.0% 0.0% 0.0% 0.0%Central Administration 67.2% 19.9% 9.4% 3.6% 0.0% 0.0%
TOTAL DEPARTMENT OF EDUCATION 46.8% 41.7% 10.2% 1.1% 0.2% 0.0%NOTE: IBO has allocated spending on fringe benefits according to the rates implied by Bloomberg Administration budget documents for each funding source.
New York City Independent Budget Office
Principals and Teachers
Over the past 10 years, the Department of Education has worked to develop new policies for recruiting, evaluating, assigning, and retaining or removing teachers and principals. The following tables provide descriptive data on the current and recent cadres of principals and teachers in the school system, as well as information on the system’s use of alternative pathways to both professions. In addition, we report recent trends in staff turnover and retention.
New York City public school principals today differ in a number of characteristics from those of 10 years ago, but most of the changes occurred at the beginning of the decade. The changes in demographics over the past five years have been modest (Table 3.6). During the school
years 2000-2001 through 2004-2005, as the principal corps saw an increase in the share who were female and a decline in total years of experience, it also became somewhat younger. Principals in 2011-2012 have more experience as principals than the principals of 2004-2005. The principal core also became somewhat younger since 2004-2005; half of the principals in 2011-2012 were below age 49 and 10 percent were below age 36. Finally, the number of principals in the school system has grown steadily, from 1,283 in 2000-2001 to 1,396 in 2004-2005 to 1,625 in 2011-2012.
When we group schools by the highest third, middle third, and lowest third of poverty rates, there is no consistent pattern to the distribution of principals among elementary and middle schools (Table 3.7). For example, high- and medium-poverty elementary

NYC Independent Budget Office May 201316
Table 3.3Per Pupil Spending, Adjusted for Inflation and Payments to Nonpublic and Charter Schools2012 dollars, in millions
2002-2003
2007-2008
2008-2009
2009-2010
2010-2011
2011-2012
2012-2013
DOE Expenditures
DOE Operations (all funds) $17,754 $19,062 $19,332 $19,392 $19,223 $19,283 $19,470 Other Expenditures (all funds)
Debt Service 764 1,448 1,450 1,646 1,678 1,726 1,783 Pension Contributions 795 2,127 2,363 2,571 2,493 2,672 2,707 Less Intra-city Sales/Interfund Agreements (13) (18) (15) (29) (35) (42) (14)
Total Funds Committed to DOE $19,300 $22,619 $23,130 $23,580 $23,359 $23,639 $23,946
City Funds $8,743 $11,455 $11,682 $11,733 $12,221 $13,419 $13,646 State Aid 8,146 9,055 9,342 8,462 8,245 8,040 8,323 Federal Aid 2,316 2,018 1,873 3,105 2,837 1,964 1,922 Private and Nongovernmental Aid 95 91 232 280 56 216 55
City Share of Total Funds Committed to DOE 45.3% 50.6% 50.5% 49.8% 52.3% 56.8% 57.0%Total Funds Committed to DOE $19,300 $22,619 $23,130 $23,580 $23,359 $23,639 $23,946
Less Passthroughs to Nonpublic and Charter Schools (1,372) (1,470) (1,670) (1,994) (2,207) (2,501) (2,608)
Total Funds Committed to NYC Public School System $17,928 $21,149 $21,460 $21,586 $21,152 $21,138 $21,338
Total Enrollment 1,112,279 1,081,831 1,080,787 1,098,535 1,112,430 1,119,064 1,130,646 Less Enrollment in Charters, Contract Schools, and Special Ed Pre-K (34,181) (56,066) (61,676) (66,882) (78,100) (86,721) (98,029)
Enrollment in Traditional NYC Public Schools 1,078,098 1,025,765 1,019,111
1,031,653
1,034,330 1,032,343 1,032,617
Per Pupil Spending
Real 2012 Dollars $16,629 $20,618 $21,058 $20,924 $20,450 $20,476 $20,664 Deflator 0.72 0.89 0.93 0.95 0.99 1.00 1.01 Nominal Amounts $11,971 $18,362 $19,501 $19,959 $20,147 $20,476 $20,931
New York City Independent Budget Office
and middle schools have principals that are slightly younger than low-poverty schools. Among high schools, medium-poverty schools have the youngest principals, followed by high- and low-poverty schools.
Three programs prepare aspiring principal candidates for school leader positions in the city’s public schools. The Aspiring Principals Program (APP) at the New York City Leadership Academy is a nonprofit that works collaboratively with the DOE to recruit, develop, and support school leaders. In addition to APP, the DOE partners with several other principal preparation programs including New Leaders Aspiring
Principals Program (New Leaders). New Leaders is a national independent nonprofit organization that DOE collaborates with to recruit, develop, and support school leaders. (Though New Leaders is a national program, we are only reporting data on its New York City project.) Both APP and New Leaders are year-long, full-time residency programs at a host school open to all interested eligible candidates.
The third pathway is the Leaders in Education Apprenticeship Program (LEAP), which began in 2009. Developed in collaboration with the Leadership Academy, LEAP is an internal DOE leadership program
NYC Independent Budget Office May 2013 17
Table 3.4Funding Streams for School Budgets, 2010-2011 and 2011-2012Dollars in millions
2010-2011 2011-2012 Changes
Source Amount Percent Amount Percent Amount Percent
Fair Student Funding $5,603 57.8% $6,338 65.8% $736 13.1%City Funds 1,930 19.9% 1,632 16.9% (297) -15.4%Federal Title I 945 9.8% 678 7.0% (267) -28.3%Federal Other 664 6.9% 391 4.1% (274) -41.2%Campaign for Fiscal Equity 266 2.7% 285 3.0% 19 7.3%State Other 257 2.7% 284 2.9% 27 10.4%Private 26 0.3% 29 0.3% 2 8.7%TOTAL 9,691 100% 9,637 100.0% $(54) -0.6%NOTE: IBO has allocated spending on fringe benefits according to the rates implied by Bloomberg Administration budget documents for each funding source.
New York City Independent Budget Office
consisting of a year-long, part-time residency program at the home school for current eligible DOE employees. In
2011-2012, LEAP enrolled and graduated more aspiring principals than APP or New Leaders combined.
Table 3.5Summary of School Budgets, Use of Funds, 2010-2011 and 2011-2012
2010-2011 2011-2012 Change
Use of Funds Amount Percent Amount Percent Amount Percent
Teachers $5,765,335,502 59.5% $5,803,007,272 60.2% $37,671,771 0.7%Leadership 649,677,226 6.7% 656,421,344 6.8% 6,744,118 1.0%Other School Staff 623,856,016 6.4% 589,500,751 6.1% (34,355,265) -5.5%Paraprofessionals 619,077,045 6.4% 649,561,122 6.7% 30,484,077 4.9%Counseling Services 465,473,842 4.8% 462,369,070 4.8% (3,104,772) -0.7%Related Services 396,024,368 4.1% 401,681,588 4.2% 5,657,220 1.4%Before/Afterschool 303,521,874 3.1% 288,045,040 3.0% (15,476,834) -5.1%Professional Development 236,816,894 2.4% 208,782,986 2.2% (28,033,908) -11.8%Equip/Furn/Supp 221,072,767 2.3% 182,888,811 1.9% (38,183,956) -17.3%Parent Involvement 120,172,564 1.2% 112,327,741 1.2% (7,844,823) -6.5%Textbooks 63,594,612 0.7% 55,142,630 0.6% (8,451,982) -13.3%Summer School 62,684,512 0.6% 67,518,076 0.7% 4,833,564 7.7%Contracted Services 61,685,732 0.6% 65,738,402 0.7% 4,052,670 6.6%Other Classroom Staff 34,571,861 0.4% 32,901,195 0.3% (1,670,666) -4.8%Libraries/Librarians 27,602,499 0.3% 25,651,265 0.3% (1,951,234) -7.1%Instructional Supplies/Equipment 19,939,328 0.2% 17,609,554 0.2% (2,329,775) -11.7%Other Transporation 10,064,094 0.1% 9,141,128 0.1% (922,966) -9.2%Bilingual/ESL 4,699,955 0.0% 3,463,150 0.0% (1,236,805) -26.3%Other Admin OTPS 2,025,980 0.0% 2,588,872 0.0% 562,892 27.8%Attendance and Outreach 1,712,202 0.0% 1,441,817 0.0% (270,385) -15.8%Other Classroom OTPS 1,282,133 0.0% 879,580 0.0% (402,553) -31.4%TOTAL $9,690,891,006 100.0% $9,636,661,394 100.0% $(54,229,612) -0.6%NOTE: IBO has allocated spending on fringe benefits according to the rates implied by Bloomberg Administration budget documents for each funding source.
New York City Independent Budget Office

NYC Independent Budget Office May 201318
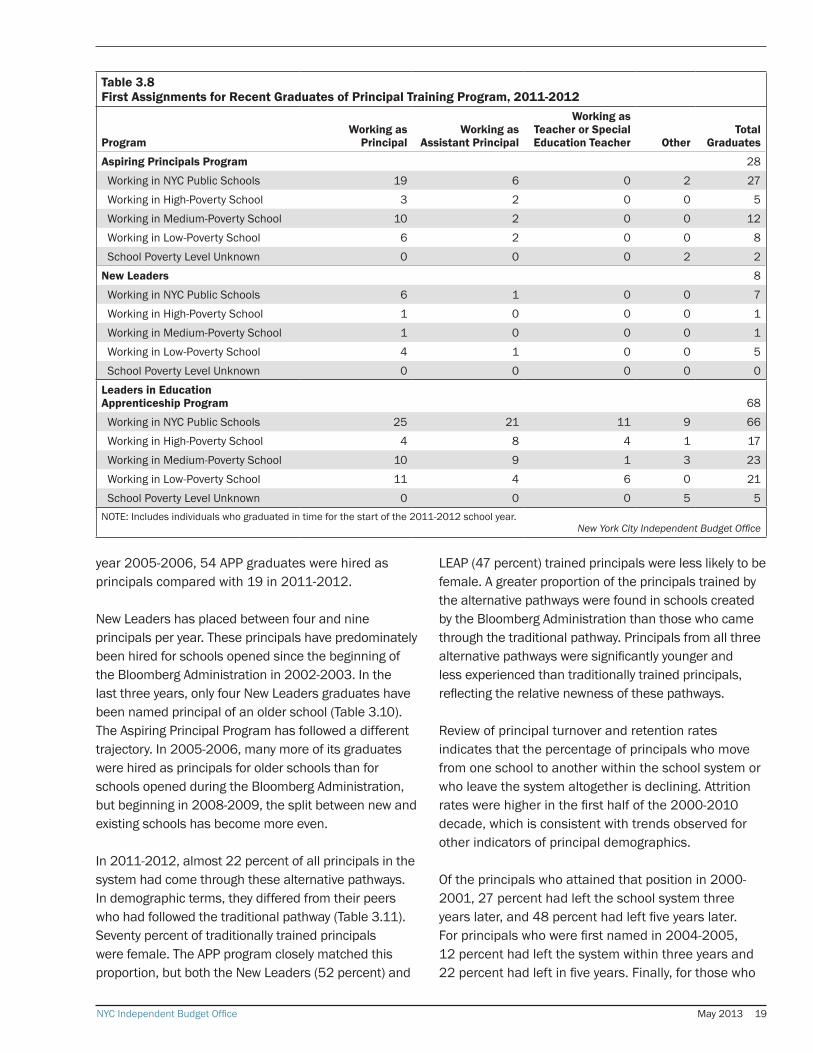
The Aspiring Principals Program graduated 28 candidates for principal posts in New York City immediately prior to the 2011-2012 school year. All but one of these APP graduates was hired for jobs inside the school system: 19 as principals, six as assistant principals and two in other positions (Table 3.8). Nearly a third (six) of these principals were hired for low-poverty schools and just over half (10) for medium-poverty schools. New Leaders prepared eight graduates for the city’s public schools and seven were hired by the school system, six as principals. Only one of those principals was hired for a high-poverty school.
The Leaders in Education Apprenticeship Program prepared 68 candidates for 2011-2012. All but two LEAP graduates were hired by the school system, 25 as principals, 21 as assistant principals, 11 as teachers and nine in other positions. Eleven out of 25 of the principals were working in low-poverty schools and 10 more were in medium-poverty schools.
Over the last six years, as the number of graduates from the Aspiring Principals Program has declined, the number actually hired as principals in the city’s public schools has also dropped steadily (Table 3.9). In school
Table 3.6Some Basic Characteristics of Principals: Demographics & Work History
2000-2001
2002-2003
2004-2005
2005-2006
2006-2007
2007-2008
2008-2009
2009-2010
2010-2011
2011-2012
Number of Principals 1,283 1,284 1,396 1,443 1,463 1,504 1,553 1,587 1,608 1,625Percentage Female 57.6% 63.9% 67.9% 67.5% 67.3% 67.6% 68.0% 67.6% 68.5% 68.3%Median Age 52 52 51 50 50 50 49 49 49 4910th Percentile of Age Distribution 44 42 37 36 36 35 35 35 35 36Years as a Principal 5.7 5.0 3.9 3.9 4.1 4.5 4.7 5.1 5.3 5.6Years as a Teacher 14.0 13.5 12.1 11.3 10.8 10.4 10.0 9.7 9.5 9.3Total Years Work Experience in NYC Public Schools 25.2 23.8 20.8 19.8 19.2 19.2 19.0 19.0 19.0 19.2
New York City Independent Budget Office
Table 3.7Different Types of Schools and Some Characteristics of Their Principals, 2011-2012
All Schools High-Poverty SchoolsMedium-Poverty
Schools Low-Poverty Schools
Principal Demographics
Elementary & Middle
SchoolsHigh
Schools
Elementary & Middle
SchoolsHigh
Schools
Elementary & Middle
SchoolsHigh
Schools
Elementary & Middle
SchoolsHigh
Schools
Number of Principals 1,042 472 349 157 347 159 346 156
Percentage Female 75.4 52.3 80.2 55.4 70.6 47.8 75.4 53.9Median Age 50 45 49 46 49 44 51 4810th Percentile (Age distribution) 36 35 37 36 35 34 36 35
Work Experience in NYC Public Schools
Years as a Principal 5.9 4.7 6.1 4.5 5.5 4.5 6.2 5.2Years as a Teacher 9.9 8.0 9.9 8.1 9.6 7.2 10.2 8.6Total Years inSchool System 20.0 16.8 20.1 16.6 19.6 16.0 20.4 17.8
Student Demographics at School
Average Share of Students in Poverty 70.9% 66.5% 90.4% 81.3% 76.7% 69.1% 45.3% 48.9%
New York City Independent Budget Office
NYC Independent Budget Office May 2013 19
year 2005-2006, 54 APP graduates were hired as principals compared with 19 in 2011-2012.
New Leaders has placed between four and nine principals per year. These principals have predominately been hired for schools opened since the beginning of the Bloomberg Administration in 2002-2003. In the last three years, only four New Leaders graduates have been named principal of an older school (Table 3.10). The Aspiring Principal Program has followed a different trajectory. In 2005-2006, many more of its graduates were hired as principals for older schools than for schools opened during the Bloomberg Administration, but beginning in 2008-2009, the split between new and existing schools has become more even.
In 2011-2012, almost 22 percent of all principals in the system had come through these alternative pathways. In demographic terms, they differed from their peers who had followed the traditional pathway (Table 3.11). Seventy percent of traditionally trained principals were female. The APP program closely matched this proportion, but both the New Leaders (52 percent) and
LEAP (47 percent) trained principals were less likely to be female. A greater proportion of the principals trained by the alternative pathways were found in schools created by the Bloomberg Administration than those who came through the traditional pathway. Principals from all three alternative pathways were significantly younger and less experienced than traditionally trained principals, reflecting the relative newness of these pathways.
Review of principal turnover and retention rates indicates that the percentage of principals who move from one school to another within the school system or who leave the system altogether is declining. Attrition rates were higher in the first half of the 2000-2010 decade, which is consistent with trends observed for other indicators of principal demographics.
Of the principals who attained that position in 2000-2001, 27 percent had left the school system three years later, and 48 percent had left five years later. For principals who were first named in 2004-2005, 12 percent had left the system within three years and 22 percent had left in five years. Finally, for those who
Table 3.8First Assignments for Recent Graduates of Principal Training Program, 2011-2012
ProgramWorking as
PrincipalWorking as
Assistant Principal
Working as Teacher or Special Education Teacher Other
Total Graduates
Aspiring Principals Program 28Working in NYC Public Schools 19 6 0 2 27Working in High-Poverty School 3 2 0 0 5Working in Medium-Poverty School 10 2 0 0 12Working in Low-Poverty School 6 2 0 0 8School Poverty Level Unknown 0 0 0 2 2
New Leaders 8Working in NYC Public Schools 6 1 0 0 7Working in High-Poverty School 1 0 0 0 1Working in Medium-Poverty School 1 0 0 0 1Working in Low-Poverty School 4 1 0 0 5School Poverty Level Unknown 0 0 0 0 0
Leaders in Education Apprenticeship Program 68Working in NYC Public Schools 25 21 11 9 66Working in High-Poverty School 4 8 4 1 17Working in Medium-Poverty School 10 9 1 3 23Working in Low-Poverty School 11 4 6 0 21School Poverty Level Unknown 0 0 0 5 5
NOTE: Includes individuals who graduated in time for the start of the 2011-2012 school year.New York City Independent Budget Office

NYC Independent Budget Office May 201320
began in 2008-2009, 8 percent had left within three years. A very similar pattern of decreasing turnover exists for the share of principals who move from one school to another. (Table 3.12 presents these data.)
The basic demographics of the school system’s teaching force have remained relatively constant over the last seven years. About three quarters of the city’s public school teachers are female, and roughly half are under the age of 40 (Table 3.13). The city’s teachers in 2011-2012 were slightly more experienced than the teaching force in 2005-2006; this may reflect the slowdown in hiring of new teachers in recent years. There were 7,321 fewer general education teachers in 2011-2012 than in 2005-2006, and 3,773 more special education teachers. Overall, there were 3,548 fewer teachers in 2011-2012 than in 2005-2006.
While the demographic characteristics of teachers did not vary much across elementary and middle schools
in the high-, middle-, and low-poverty groups, there was more variation at the high school level. In low-poverty high schools, teachers were more likely to be older and more experienced than the teachers in high- and medium-poverty high schools. (Table 3.14 presents these data.)
There are two major alternative pathway programs for teachers in the city’s public school system. The most well-known is Teach for America, a national nonprofit dedicated to placing high achieving college graduates in high-needs schools. The most commonly used alternative pathway in the city is the New York City Teaching Fellows, which also targets high achieving college graduates as well as career-shifters and which provides participants with support toward the graduate schooling necessary to obtain teacher certification. Though it is not an alternative pathway to teacher certification, we also report data on the TeachNYC Select Recruits program, a DOE program to recruit highly rated, traditionally certified teachers in high-need
Table 3.9 First Assignments After Graduating From Principal Training Programs, by School Poverty Levels
2005-2006
2006-2007
2007-2008
2008-2009
2009-2010
2010-2011
2011-2012
Aspiring Principals Program
Total Graduates 70 75 55 59 56 31 28 Working as Principal 54 55 36 41 33 30 19
Principal in High-Poverty School 12 18 4 11 5 7 3Principal in Medium-Poverty School 21 9 16 9 11 8 10Principal in Low-Poverty School 17 26 15 20 17 13 6School Poverty Level Unknown 4 2 1 1 0 2 0
New Leaders
Total Graduates 14 15 12 19 28 12 8 Working as Principal 8 7 5 8 9 4 6
Principal in High-Poverty School 1 1 0 1 2 1 1Principal in Medium-Poverty School 1 0 0 1 1 0 1Principal in Low-Poverty School 6 5 5 6 6 3 4School Poverty Level Unknown 0 1 0 0 0 0 0
Leaders in Education Apprenticeship Program
Total Graduates 26 68 Working as Principal 3 25 Principal in High-Poverty School 2 4 Principal in Medium-Poverty School 1 10 Principal in Low-Poverty School - 11 School Poverty Level Unknown - -
NOTE: Includes individuals who graduated in time for the start of the 2011-2012 school year.New York City Independent Budget Office

NYC Independent Budget Office May 2013 21
subject areas. They are drawn from the top 1 percent of the DOE’s applicant pool. Individuals applying for teaching positions are invited to interview for the Select Recruit program based on a review of their qualifications and potential.
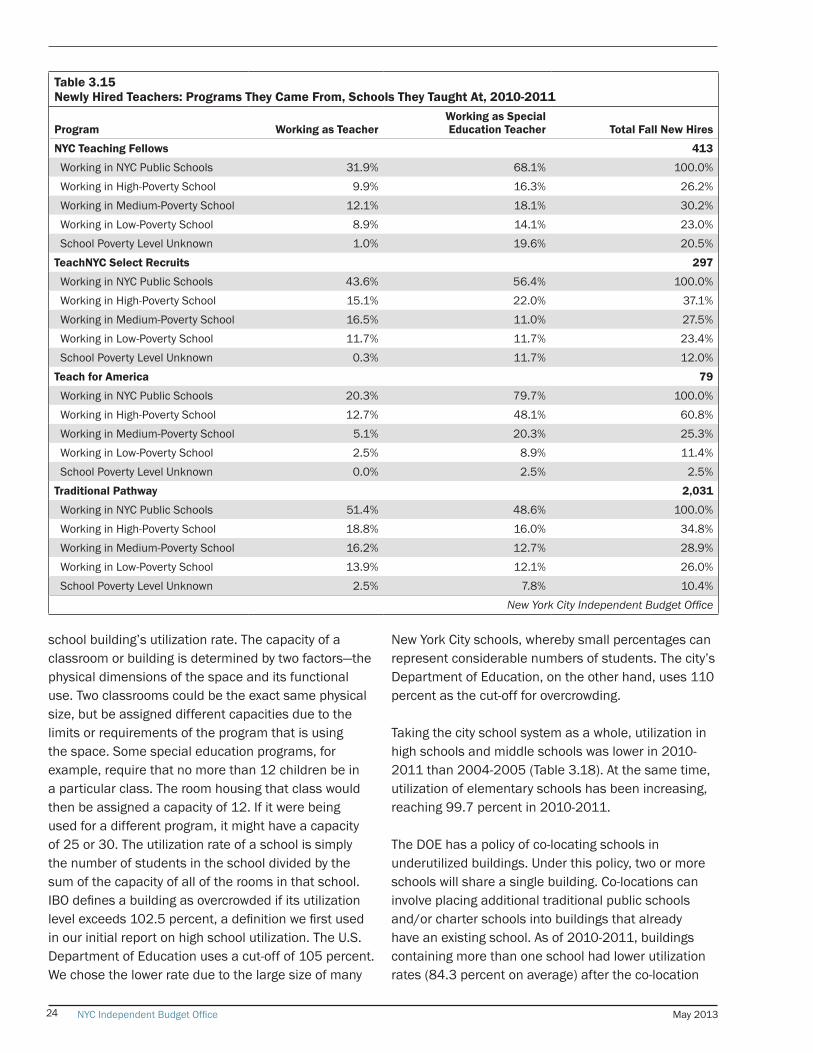
In 2010-2011, 2,031 new teachers were placed through the traditional pathway; 413 came through the NYC Teaching Fellows program; 297 came through the TeachNYC Select Recruits program; and 79 were from Teach for America (Table 3.15). (Teacher pathway
Table 3.10First Assignment After Graduating From Principal Training Program, New or Existing Schools
2005-2006
2006-2007
2007-2008
2008-2009
2009-2010
2010-2011
2011-2012
Aspiring Principals Program
Total Graduates 70 75 55 59 56 31 28 Working as Principal 54 55 36 41 33 30 19Principal in New School 13 16 12 21 17 13 8Principal in Existing School 41 39 24 20 16 17 11
New Leaders
Total Graduates 14 15 12 19 28 12 8 Working as Principal 8 7 5 8 9 4 6Principal in New School 7 5 5 8 8 2 5Principal in Existing School 1 2 0 0 1 2 1
Leaders in Education Apprenticeship Program
Total Graduates 26 68 Working as Principal 3 25Principal in New School 0 11Principal in Existing School 3 14
NOTE: “New” schools are those opened since the onset of the Bloomberg Administration. “Existing” schools are those that pre-date the Bloomberg Administration.
New York City Independent Budget Office
Table 3.11Different Paths to Becoming a Principal: Characteristics of Principals and Their Schools, 2011-2012
Aspiring Principals Program New Leaders
Leaders in Education Apprenticeship Program
Others (Traditional Pathway)
Principal Demographics
Number of Principals 268 56 32 1,268Female 66.8% 51.8% 46.9% 69.7%Median Age 43 36 40 5010th Percentile of Age Distribution 33 32 33 38
Work Experience in NYC Public Schools
Years as a Principal 3.9 3.2 0.4 6.2Years as a Teacher 7.1 5.2 7.6 10.0Total Years in School System 13.4 10.2 13.3 21.0Student Demographics at School
Average Poverty (Pct) 72.1 74.3 71.7 68.7Characteristics of School
Percent in High Schools 30.7 38.2 28.1 30.8Percent in New Schools 39.2 85.7 40.6 18.5
New York City Independent Budget Office
NYC Independent Budget Office May 201322
data for 2011-2012 is not yet available.) Of the new placements from Teach for America, 61 percent were employed in high-poverty schools compared with 37 percent of the placements from the TeachNYC Select Recruits program, 35 percent of the traditionally trained teachers, and 26 percent of the Teaching Fellows. Close to 80 percent of the Teach for America graduates were placed in special education classrooms, as were 68 percent of the NYC Teaching Fellows, 56 percent of the TeachNYC Select Recruits participants, and 49 percent of the traditionally trained.
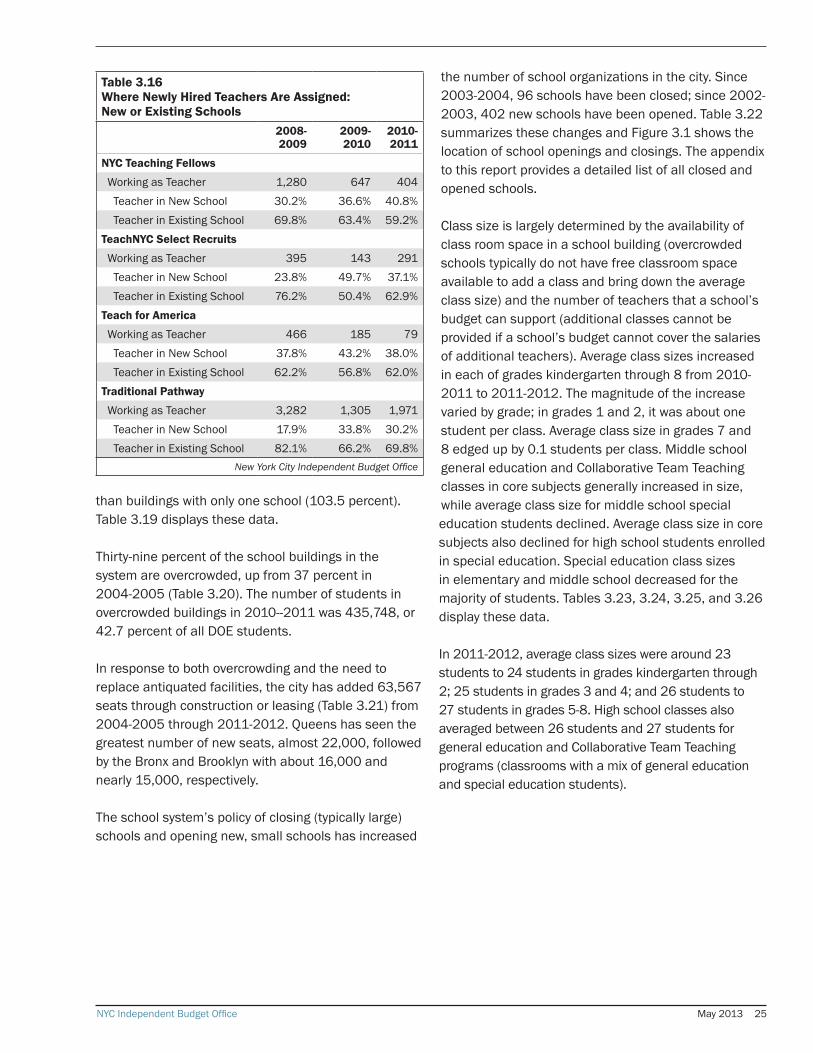
In 2008-2009, 2009-2010, and 2010-2011, all of the pathways had more than half of their new teachers placed in older schools that pre-date the Bloomberg Administration. Overall, 28 percent of new teachers
were placed in newer schools in these three years. (Table 3.16 presents these data.)
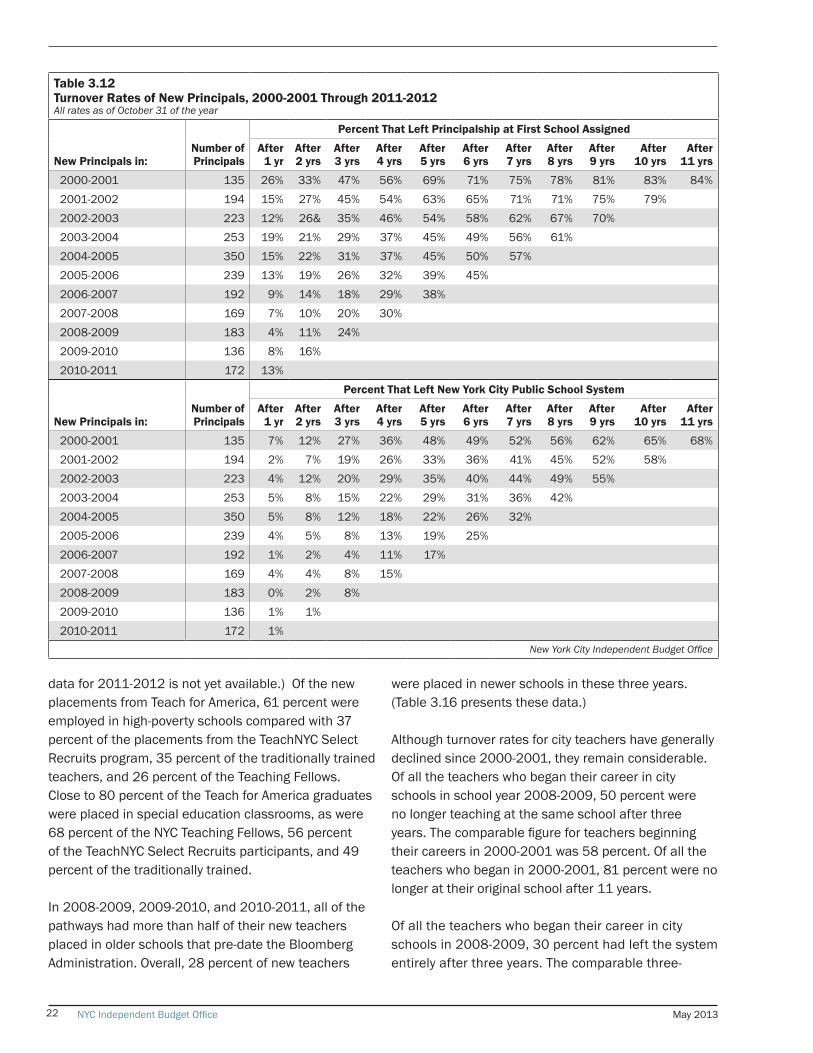
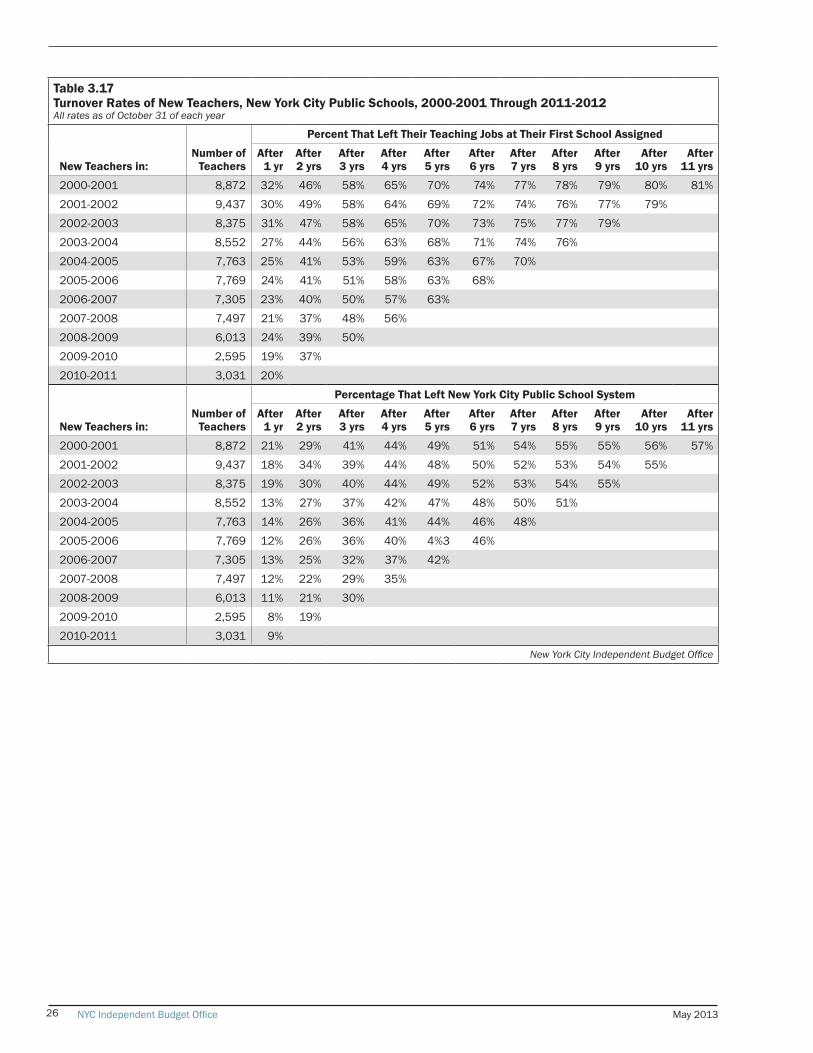
Although turnover rates for city teachers have generally declined since 2000-2001, they remain considerable. Of all the teachers who began their career in city schools in school year 2008-2009, 50 percent were no longer teaching at the same school after three years. The comparable figure for teachers beginning their careers in 2000-2001 was 58 percent. Of all the teachers who began in 2000-2001, 81 percent were no longer at their original school after 11 years.
Of all the teachers who began their career in city schools in 2008-2009, 30 percent had left the system entirely after three years. The comparable three-
Table 3.12Turnover Rates of New Principals, 2000-2001 Through 2011-2012All rates as of October 31 of the year
New Principals in:Number of Principals
Percent That Left Principalship at First School Assigned
After 1 yr
After 2 yrs
After 3 yrs
After 4 yrs
After 5 yrs
After 6 yrs
After 7 yrs
After 8 yrs
After 9 yrs
After 10 yrs
After 11 yrs
2000-2001 135 26% 33% 47% 56% 69% 71% 75% 78% 81% 83% 84%2001-2002 194 15% 27% 45% 54% 63% 65% 71% 71% 75% 79%2002-2003 223 12% 26& 35% 46% 54% 58% 62% 67% 70%2003-2004 253 19% 21% 29% 37% 45% 49% 56% 61%2004-2005 350 15% 22% 31% 37% 45% 50% 57%2005-2006 239 13% 19% 26% 32% 39% 45%2006-2007 192 9% 14% 18% 29% 38%2007-2008 169 7% 10% 20% 30%2008-2009 183 4% 11% 24%2009-2010 136 8% 16%2010-2011 172 13%
New Principals in:Number of Principals
Percent That Left New York City Public School System
After 1 yr
After 2 yrs
After 3 yrs
After 4 yrs
After 5 yrs
After 6 yrs
After 7 yrs
After 8 yrs
After 9 yrs
After 10 yrs
After 11 yrs
2000-2001 135 7% 12% 27% 36% 48% 49% 52% 56% 62% 65% 68%2001-2002 194 2% 7% 19% 26% 33% 36% 41% 45% 52% 58%2002-2003 223 4% 12% 20% 29% 35% 40% 44% 49% 55%2003-2004 253 5% 8% 15% 22% 29% 31% 36% 42%2004-2005 350 5% 8% 12% 18% 22% 26% 32%2005-2006 239 4% 5% 8% 13% 19% 25%2006-2007 192 1% 2% 4% 11% 17%2007-2008 169 4% 4% 8% 15%2008-2009 183 0% 2% 8%2009-2010 136 1% 1%2010-2011 172 1%
New York City Independent Budget Office

NYC Independent Budget Office May 2013 23
year figure for teachers beginning in 2000-2001 was 41 percent. Of this earlier cohort, after 11 years of service 57 percent were no longer in the system and 43 percent remained in service. (Table 3.17)
There is evidence that the attrition rate is decreasing and that the share of teachers who are remaining in the same school is increasing. For teachers who began in 2005-2006, 49 percent were in the same school three years later, and 37 percent were in the same school five years later. Thirty-six percent had left the system within three years, and 43 percent had left by five years later. The three year attrition rate for teachers who began in 2008-2009 was 30 percent and 50 percent of the teachers in this cohort were still in the same school after three years.
Capacity and Utilization
School overcrowding is an issue of great concern in New York City. Many neighborhoods have experienced overcrowded schools and resultant wait-lists for new entrants. A number of factors combine to either alleviate or exacerbate overcrowding. Demographic shifts increase the number of households with school-age children in some communities and decrease it in others. The school construction program adds new capacity to the system. Policies regarding co-location of schools in buildings, school closures, and new school start-ups shift students within the school system.
The basic measure of school overcrowding is the
Table 3.13Some Basic Characteristics of Teachers: Demographics & Work History
2005-2006
2006-2007
2007-2008
2008-2009
2009-2010
2010-2011
2011-2012
Percentage Female 74.8 75.0 75.2 75.5 75.8 75.9 76.0Median Age 40 40 39 39 40 40 4010th Percentile (age distribution) 25 25 25 26 26 27 28Time as a Teacher 9.0 9.1 9.2 9.4 10.1 10.4 10.6Years in School System 9.1 9.2 9.3 9.5 10.0 10.5 10.7Total Number of Teachers 76,934 77,886 78,816 78,882 76,543 74,680 73,386General Education Teachers 62,111 62,522 62,867 62,374 59,402 56,825 54,790Special Education Teachers 14,823 15,364 15,949 16,508 17,141 17,855 18,596
New York City Independent Budget Office
Table 3.14Different Types of Schools and Some Basic Characteristics of Their Teachers, 2011-2012
All Schools High-Poverty SchoolsMedium-Poverty
Schools Low-Poverty Schools
Teacher Demographics
Elementary & Middle
SchoolsHigh
Schools
Elementary & Middle
SchoolsHigh
Schools
Elementary & Middle
SchoolsHigh
Schools
Elementary & Middle
SchoolsHigh
Schools
Number of Teachers 46,359 19,198 15,032 4,987 16,359 5,976 14,968 8,235
Percentage Female 84.5 57.6 83.8 57.8 83.5 57.7 86.3 57.3Median Age 40 39 41 37 40 39 39 4110th Percentile (Age distribution) 28 27 28 26 28 27 28 28Total Work Experience in New York City Public Schools
Years as a Teacher 10.8 9.7 10.5 8.3 10.9 9.3 10.9 10.7Total Years in School System 10.8 9.8 10.6 8.5 10.9 9.4 10.9 10.8
Student Demographics
Average Share of Students in Poverty 71.2 62.2 90.3 80.6 76.5 69.0 46.4 46.1
New York City Independent Budget Office
NYC Independent Budget Office May 201324
school building’s utilization rate. The capacity of a classroom or building is determined by two factors—the physical dimensions of the space and its functional use. Two classrooms could be the exact same physical size, but be assigned different capacities due to the limits or requirements of the program that is using the space. Some special education programs, for example, require that no more than 12 children be in a particular class. The room housing that class would then be assigned a capacity of 12. If it were being used for a different program, it might have a capacity of 25 or 30. The utilization rate of a school is simply the number of students in the school divided by the sum of the capacity of all of the rooms in that school. IBO defines a building as overcrowded if its utilization level exceeds 102.5 percent, a definition we first used in our initial report on high school utilization. The U.S. Department of Education uses a cut-off of 105 percent. We chose the lower rate due to the large size of many
New York City schools, whereby small percentages can represent considerable numbers of students. The city’s Department of Education, on the other hand, uses 110 percent as the cut-off for overcrowding.
Taking the city school system as a whole, utilization in high schools and middle schools was lower in 2010-2011 than 2004-2005 (Table 3.18). At the same time, utilization of elementary schools has been increasing, reaching 99.7 percent in 2010-2011.
The DOE has a policy of co-locating schools in underutilized buildings. Under this policy, two or more schools will share a single building. Co-locations can involve placing additional traditional public schools and/or charter schools into buildings that already have an existing school. As of 2010-2011, buildings containing more than one school had lower utilization rates (84.3 percent on average) after the co-location
Table 3.15Newly Hired Teachers: Programs They Came From, Schools They Taught At, 2010-2011
Program Working as TeacherWorking as Special Education Teacher Total Fall New Hires
NYC Teaching Fellows 413
Working in NYC Public Schools 31.9% 68.1% 100.0%Working in High-Poverty School 9.9% 16.3% 26.2%Working in Medium-Poverty School 12.1% 18.1% 30.2%Working in Low-Poverty School 8.9% 14.1% 23.0%School Poverty Level Unknown 1.0% 19.6% 20.5%
TeachNYC Select Recruits 297
Working in NYC Public Schools 43.6% 56.4% 100.0%Working in High-Poverty School 15.1% 22.0% 37.1%Working in Medium-Poverty School 16.5% 11.0% 27.5%Working in Low-Poverty School 11.7% 11.7% 23.4%School Poverty Level Unknown 0.3% 11.7% 12.0%
Teach for America 79
Working in NYC Public Schools 20.3% 79.7% 100.0%Working in High-Poverty School 12.7% 48.1% 60.8%Working in Medium-Poverty School 5.1% 20.3% 25.3%Working in Low-Poverty School 2.5% 8.9% 11.4%School Poverty Level Unknown 0.0% 2.5% 2.5%
Traditional Pathway 2,031
Working in NYC Public Schools 51.4% 48.6% 100.0%Working in High-Poverty School 18.8% 16.0% 34.8%Working in Medium-Poverty School 16.2% 12.7% 28.9%Working in Low-Poverty School 13.9% 12.1% 26.0%School Poverty Level Unknown 2.5% 7.8% 10.4%
New York City Independent Budget Office
NYC Independent Budget Office May 2013 25
than buildings with only one school (103.5 percent). Table 3.19 displays these data.
Thirty-nine percent of the school buildings in the system are overcrowded, up from 37 percent in 2004-2005 (Table 3.20). The number of students in overcrowded buildings in 2010--2011 was 435,748, or 42.7 percent of all DOE students.
In response to both overcrowding and the need to replace antiquated facilities, the city has added 63,567 seats through construction or leasing (Table 3.21) from 2004-2005 through 2011-2012. Queens has seen the greatest number of new seats, almost 22,000, followed by the Bronx and Brooklyn with about 16,000 and nearly 15,000, respectively.
The school system’s policy of closing (typically large) schools and opening new, small schools has increased
the number of school organizations in the city. Since 2003-2004, 96 schools have been closed; since 2002-2003, 402 new schools have been opened. Table 3.22 summarizes these changes and Figure 3.1 shows the location of school openings and closings. The appendix to this report provides a detailed list of all closed and opened schools.
Class size is largely determined by the availability of class room space in a school building (overcrowded schools typically do not have free classroom space available to add a class and bring down the average class size) and the number of teachers that a school’s budget can support (additional classes cannot be provided if a school’s budget cannot cover the salaries of additional teachers). Average class sizes increased in each of grades kindergarten through 8 from 2010-2011 to 2011-2012. The magnitude of the increase varied by grade; in grades 1 and 2, it was about one student per class. Average class size in grades 7 and 8 edged up by 0.1 students per class. Middle school general education and Collaborative Team Teaching classes in core subjects generally increased in size, while average class size for middle school special education students declined. Average class size in core subjects also declined for high school students enrolled in special education. Special education class sizes in elementary and middle school decreased for the majority of students. Tables 3.23, 3.24, 3.25, and 3.26 display these data.
In 2011-2012, average class sizes were around 23 students to 24 students in grades kindergarten through 2; 25 students in grades 3 and 4; and 26 students to 27 students in grades 5-8. High school classes also averaged between 26 students and 27 students for general education and Collaborative Team Teaching programs (classrooms with a mix of general education and special education students).
Table 3.16Where Newly Hired Teachers Are Assigned: New or Existing Schools
2008-2009
2009-2010
2010-2011
NYC Teaching Fellows
Working as Teacher 1,280 647 404Teacher in New School 30.2% 36.6% 40.8%Teacher in Existing School 69.8% 63.4% 59.2%
TeachNYC Select Recruits
Working as Teacher 395 143 291Teacher in New School 23.8% 49.7% 37.1%Teacher in Existing School 76.2% 50.4% 62.9%
Teach for America
Working as Teacher 466 185 79Teacher in New School 37.8% 43.2% 38.0%Teacher in Existing School 62.2% 56.8% 62.0%
Traditional Pathway
Working as Teacher 3,282 1,305 1,971Teacher in New School 17.9% 33.8% 30.2%Teacher in Existing School 82.1% 66.2% 69.8%
New York City Independent Budget Office
NYC Independent Budget Office May 201326
Table 3.17 Turnover Rates of New Teachers, New York City Public Schools, 2000-2001 Through 2011-2012All rates as of October 31 of each year
New Teachers in: Number of
Teachers
Percent That Left Their Teaching Jobs at Their First School Assigned
After 1 yr
After 2 yrs
After 3 yrs
After 4 yrs
After 5 yrs
After 6 yrs
After 7 yrs
After 8 yrs
After 9 yrs
After 10 yrs
After 11 yrs
2000-2001 8,872 32% 46% 58% 65% 70% 74% 77% 78% 79% 80% 81%2001-2002 9,437 30% 49% 58% 64% 69% 72% 74% 76% 77% 79%2002-2003 8,375 31% 47% 58% 65% 70% 73% 75% 77% 79%2003-2004 8,552 27% 44% 56% 63% 68% 71% 74% 76%2004-2005 7,763 25% 41% 53% 59% 63% 67% 70%2005-2006 7,769 24% 41% 51% 58% 63% 68%2006-2007 7,305 23% 40% 50% 57% 63%2007-2008 7,497 21% 37% 48% 56%2008-2009 6,013 24% 39% 50%2009-2010 2,595 19% 37%2010-2011 3,031 20%
New Teachers in: Number of
Teachers
Percentage That Left New York City Public School System
After 1 yr
After 2 yrs
After 3 yrs
After 4 yrs
After 5 yrs
After 6 yrs
After 7 yrs
After 8 yrs
After 9 yrs
After 10 yrs
After 11 yrs
2000-2001 8,872 21% 29% 41% 44% 49% 51% 54% 55% 55% 56% 57%2001-2002 9,437 18% 34% 39% 44% 48% 50% 52% 53% 54% 55%2002-2003 8,375 19% 30% 40% 44% 49% 52% 53% 54% 55%2003-2004 8,552 13% 27% 37% 42% 47% 48% 50% 51%2004-2005 7,763 14% 26% 36% 41% 44% 46% 48%2005-2006 7,769 12% 26% 36% 40% 4%3 46%2006-2007 7,305 13% 25% 32% 37% 42%2007-2008 7,497 12% 22% 29% 35%2008-2009 6,013 11% 21% 30%2009-2010 2,595 8% 19%2010-2011 3,031 9%
New York City Independent Budget Office

NYC Independent Budget Office May 2013 27
Table 3.18Building Utilization: Percent of Capacity 2004-2005 through 2010-2011
Building TypeNumber of Buildings Median
95th Percentile
High School
2004-2005 203 96.4% 169.3%2005-2006 207 99.5% 152.3%2006-2007 208 92.6% 146.6%2007-2008 213 97.2% 151.8%2008-2009 211 92.3% 147.3%2009-2010 217 92.5% 145.4%2010-2011 226 91.4% 150.5%
Middle School
2004-2005 205 83.9% 118.4%2005-2006 204 80.7% 120.8%2006-2007 205 75.8% 117.6%2007-2008 205 77.1% 113.3%2008-2009 204 76.8% 113.6%2009-2010 203 80.9% 113.1%2010-2011 205 79.6% 111.8%
Elementary School
2004-2005 964 97.2% 137.4%2005-2006 961 97.0% 164.1%2006-2007 957 97.4% 155.6%2007-2008 955 98.4% 155.6%2008-2009 957 97.8% 160.7%2009-2010 959 99.0% 155.8%2010-2011 967 99.7% 158.0%
New York City Independent Budget Office
Table 3.19Average Utilization Rate of Buildings, 2010-2011
Buildings With One School
Buildings With Co-located Schools
Utilization Rate 103.5% 84.3%Number of Buildings 998 401Median Utilization Rate of Buildings, 2010-2011
Buildings With One School
Buildings With Co-located Schools
Utilization Rate 100.9% 82.2%Number of Buildings 998 401
New York City Independent Budget Office
Table 3.20Overcrowding in New York City School Buildings, 2004-2005 Through 2010-2011
Students Buildings
NumberShare of
Total NumberShare of
Total
2004-2005 447,471 43.1% 512 37.2%2005-2006 419,457 41.1% 515 37.5%2006-2007 373,787 37.2% 507 37.0%2007-2008 403,403 40.3% 527 38.4%2008-2009 404,044 40.6% 526 38.3%2009-2010 426,474 42.3% 541 39.2%2010-2011 435,748 42.7% 550 39.3%NOTE: IBO defines a building as overcrowded if its utilization level exceeds 102.5 percent.
New York City Independent Budget Office
Table 3.21Number of New Buildings and Seats by Borough, 2004-2005 Through 2011-2012
Number of New Buildings
2004-2005 2005-2006 2006-2007 2007-2008 2008-2009 2009-2010 2010-2011 2011-2012
Brooklyn 4 3 5 0 2 6 6 1Bronx 4 2 3 1 3 4 6 1Manhattan 2 0 0 3 1 2 8 1Queens 5 7 2 4 5 8 6 4Staten Island 0 3 0 0 2 1 0 0TOTAL 15 15 10 8 13 21 26 7
Number of New Seats
2004-2005 2005-2006 2006-2007 2007-2008 2008-2009 2009-2010 2010-2011 2011-2012
Brooklyn 1,993 860 1,324 0 806 5,102 4,368 172Bronx 2,765 953 2,009 231 1,930 2,450 5,642 461Manhattan 1,415 0 0 901 492 599 3,505 630Queens 2,652 2,495 1,092 1,730 3,978 3,903 4,141 1,770Staten Island 0 272 0 0 2,104 822 0 0TOTAL 8,825 4,580 4,425 2,862 9,310 12,876 17,656 3,033
New York City Independent Budget Office

NYC Independent Budget Office May 201328
Figure 3.1Schools That Opened or Closed Since 2005-2006
#
#
####
#
##
##
# ##
# ##
##
##
###
##
##
# ##
#
#
#
#
#
##
##
#
#
##
# ####
#
# #
#
##
#
#
#
"
"
"""""
"
"""
""
""
"
"
""
"
"#
"
"
"
"
#
##
#
#
#
##
# #
##
#
#
#
#
#
##
#
#
#
"
#
#
#
##
###
##
"
#
##
# ###
####
######
"#
##
#
"
#
# #
"#
## #
#
"
##
#
#
#
#
#
#
#
"
"#"
"
" "
"#
""##
"#
#
"#
"
" ##
##
#
###
#
#"
#
"
""
#
#"##
#
#
""
##
#
# #
#
#"
"#
"
###
#
"##
##
###
##
"#
"
#"#"
#"
"" #
##
#
##
####"
#
##
#
#
"
#
#
""
"
"
"
"
"
##
#
####
""##
"#
##
#"
""
##
#
#
##
""###
##
###
#
###
""
"
###
##
#
###
#
#
#
#
##
#
#
#
#
##
##
####
#"#
#
""#" #
"
####
##"
#
#
##
""
#"
##
""##
###
##
#
#
#
#
#
##
###
####
# #
#
#
#
#
#
#31
2
27
2526
29
11
22
24
30
10
8
28
20
8
3
2721
15
6
19
9
18
14
7
17
5
13
1
12
4
322
27
2316
4 7
1919
18
18
10
# New
" Closed
TextText
Note: Data through 2011-2012 school year.
Schools That Opened or Closed Since 2005-2006Figure 3.1
New School
Closed School
NOTE: Data through 2011-2012 school year.

NYC Independent Budget Office May 2013 29
Table 3.22Changes in the Number of Public Schools, 2002-2003 Through 2011-2012
Schools Opened
Schools Closed
Total Number of Schools
2002-2003 13 N/A 1,2752003-2004 26 1 1,3002004-2005 70 3 1,3672005-2006 56 6 1,4172006-2007 39 22 1,4342007-2008 39 17 1,4562008-2009 54 12 1,4982009-2010 45 10 1,5332010-2011 33 10 1,5562011-2012 27 15 1,568TOTAL 402 96NOTE: The total for schools opened begins in 2002-2003 whereas the total for schools closed begins in 2003-2004.
New York City Independent Budget Office
Table 3.23Class Sizes for General Education, Gifted & Talented, and Collaborative Team Teaching Students: Elementary and Middle School Grades
2009-2010 2010-2011 2011-2012
GradeNumber
of ClassesNumber of
StudentsAverage
Class SizeNumber of
ClassesNumber of
StudentsAverage
Class SizeNumber of
ClassesNumber of
StudentsAverage
Class Size
Kindergarten 3,194 69,353 21.7 3,148 69,358 22.0 3,129 71,215 22.8First 3,238 71,391 22.0 3,137 71,840 22.9 2,988 71,504 23.9Second 3,083 68,502 22.2 2,986 69,320 23.2 2,848 69,190 24.3Third 2,936 66,077 22.5 2,838 67,360 23.7 2,769 67,989 24.6Fourth 2,717 66,364 24.4 2,653 66,202 25.0 2,590 65,453 25.3Fifth 2,559 63,551 24.8 2,570 65,259 25.4 2,511 64,716 25.8Sixth 2,465 64,231 26.1 2,426 63,920 26.3 2,418 65,410 27.1Seventh 2,423 64,886 26.8 2,382 64,770 27.2 2,326 63,529 27.3Eighth 2,450 67,418 27.5 2,413 66,157 27.4 2,369 65,265 27.5TOTAL 25,065 601,773 24.0 24,553 604,186 24.6 23,948 604,271 25.2
New York City Independent Budget Office

NYC Independent Budget Office May 201330
Table 3.24Class Sizes: Middle School Core Subjects
2009-2010 2010-2011 2011-2012
English English English
Instruction Type
Number of Classes
Number of Students
Average Class Size
Number of Classes
Number of Students
Average Class Size
Number of Classes
Number of Students
Average Class Size
CTT 1,038 25,187 24.3 1,125 28,668 25.5 1,281 33,289 26.0General Education 6,342 166,336 26.2 6,207 164,919 26.6 6,269 168,505 26.9Special Education 804 8,961 11.1 834 8,909 10.7 1,051 10,738 10.2TOTAL 8,184 200,484 24.5 8,166 202,496 24.8 8,601 212,532 24.7
Math Math Math
Number of Classes
Number of Students
Average Class Size
Number of Classes
Number of Students
Average Class Size
Number of Classes
Number of Students
Average Class Size
CTT 788 19,051 24.2 988 25,354 25.7 1,166 30,326 26.0General Education 4,554 119,288 26.2 5,778 155,339 26.9 6,044 162,606 26.9Special Education 534 6,015 11.3 788 8,346 10.6 954 9,754 10.2TOTAL 5,876 144,354 24.6 7,554 189,039 25.0 8,164 202,686 24.8
Science Science Science
Number of Classes
Number of Students
Average Class Size
Number of Classes
Number of Students
Average Class Size
Number of Classes
Number of Students
Average Class Size
CTT 794 19,446 24.5 1,040 26,879 25.8 1,199 31,281 26.1General Education 4,585 122,257 26.7 5,909 160,011 27.1 6,022 163,937 27.2Special Education 506 5,693 11.3 791 8,391 10.6 948 9,706 10.2TOTAL 5,885 147,396 25.0 7,740 195,281 25.2 8,169 204,924 25.1
Social Studies Social Studies Social Studies
Number of Classes
Number of Students
Average Class Size
Number of Classes
Number of Students
Average Class Size
Number of Classes
Number of Students
Average Class Size
CTT 822 20,046 24.4 990 25,452 25.7 1,121 29,381 26.2General Education 5,197 139,317 26.8 5,779 156,332 27.1 5,810 158,768 27.3Special Education 585 6,570 11.2 803 8,492 10.6 931 9,495 10.2TOTAL 6,604 165,933 25.1 7,572 190,276 25.1 7,862 197,644 25.1NOTE: CTT is Collaborative Team Teaching.
New York City Independent Budget Office

NYC Independent Budget Office May 2013 31
Table 3.25Class Sizes: High School Core Subjects
2009-2010 2010-2011 2011-2012
English English English
Instruction Type
Number of Classes
Number of Students
Average Class Size
Number of Classes
Number of Students
Average Class Size
Number of Classes
Number of Students
Average Class Size
CTT 1,407 35,788 25.4 1,715 44,114 25.7 1,895 48,550 25.6General Education 9,540 250,300 26.2 11,429 296,545 25.9 10,848 283,978 26.2Special Education 631 7,857 12.5 929 10,942 11.8 732 8,878 12.1TOTAL 11,578 293,945 25.4 14,073 351,601 25.0 13,475 341,406 25.3
Math Math Math
Number of Classes
Number of Students
Average Class Size
Number of Classes
Number of Students
Average Class Size
Number of Classes
Number of Students
Average Class Size
CTT 1,245 31,814 25.6 1,194 30,550 25.6 1,300 33,367 25.7General Education 8,916 231,827 26.0 8,736 227,737 26.1 8,020 207,387 25.9Special Education 478 6,187 12.9 523 6,473 12.4 439 5,751 13.1TOTAL 10,639 269,828 25.4 10,453 264,760 25.3 9,759 246,505 25.3
Science Science Science
Number of Classes
Number of Students
Average Class Size
Number of Classes
Number of Students
Average Class Size
Number of Classes
Number of Students
Average Class Size
CTT 1,612 43,475 27.0 1,818 49,347 27.1 2,046 55,009 26.9General Education 11,332 307,827 27.2 12,733 343,174 27.0 11,929 320,399 26.9Special Education 547 7,202 13.2 692 8,809 12.7 581 7,745 13.3TOTAL 13,491 358,504 26.6 15,243 401,330 26.3 14,556 383,153 26.3
Social Studies Social Studies Social Studies
Number of Classes
Number of Students
Average Class Size
Number of Classes
Number of Students
Average Class Size
Number of Classes
Number of Students
Average Class Size
CTT 1,471 39,594 26.9 1,542 41,837 27.1 1,705 45,486 26.7General Education 9,646 262,055 27.2 10,627 285,643 26.9 9,882 265,210 26.8Special Education 563 7,356 13.1 697 8,676 12.4 574 7,328 12.8TOTAL 11,680 309,005 26.5 12,866 336,156 26.1 12,161 318,024 26.2NOTE: CTT is Collaborative Team Teaching.
New York City Independent Budget Office
Table 3.26Class Sizes: Elementary and Middle School Special Education Students
2009-2010 2010-2011 2011-2012
Service Category
Number of Classes
Number of Students
Average Class Size
Number of Classes
Number of Students
Average Class Size
Number of Classes
Number of Students
Average Class Size
6:1:1 3 18 6.0 5 25 5.0 9 54 6.08:1:1 5 36 7.2 7 56 8.0 8 62 7.812:1 1,119 11,740 10.5 1,082 11,034 10.2 1,003 10,229 10.212:1:1 2,356 23,758 10.1 2,496 24,799 9.9 2,839 27,267 9.615:1 1 4 4.0 2 16 8.0 1,163 8,356 7.2
New York City Independent Budget Office

NYC Independent Budget Office May 201332
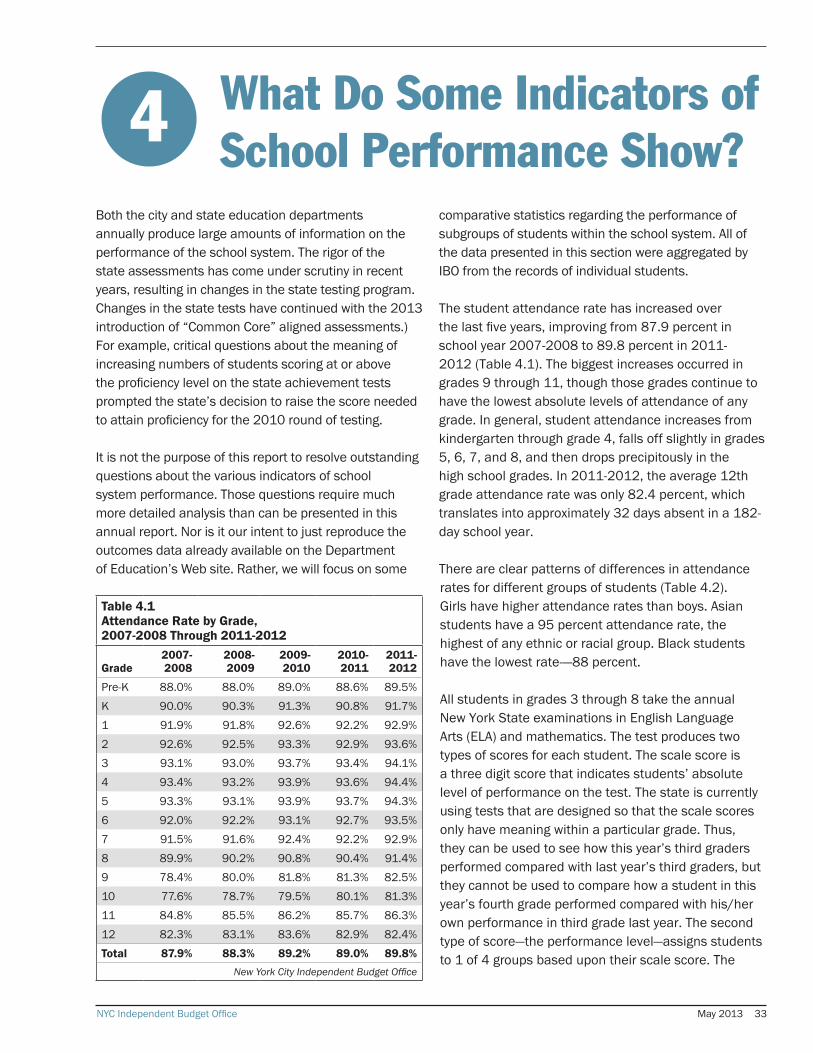
NYC Independent Budget Office May 2013 33
What Do Some Indicators of School Performance Show?4
Both the city and state education departments annually produce large amounts of information on the performance of the school system. The rigor of the state assessments has come under scrutiny in recent years, resulting in changes in the state testing program. Changes in the state tests have continued with the 2013 introduction of “Common Core” aligned assessments.) For example, critical questions about the meaning of increasing numbers of students scoring at or above the proficiency level on the state achievement tests prompted the state’s decision to raise the score needed to attain proficiency for the 2010 round of testing.
It is not the purpose of this report to resolve outstanding questions about the various indicators of school system performance. Those questions require much more detailed analysis than can be presented in this annual report. Nor is it our intent to just reproduce the outcomes data already available on the Department of Education’s Web site. Rather, we will focus on some
comparative statistics regarding the performance of subgroups of students within the school system. All of the data presented in this section were aggregated by IBO from the records of individual students.
The student attendance rate has increased over the last five years, improving from 87.9 percent in school year 2007-2008 to 89.8 percent in 2011-2012 (Table 4.1). The biggest increases occurred in grades 9 through 11, though those grades continue to have the lowest absolute levels of attendance of any grade. In general, student attendance increases from kindergarten through grade 4, falls off slightly in grades 5, 6, 7, and 8, and then drops precipitously in the high school grades. In 2011-2012, the average 12th grade attendance rate was only 82.4 percent, which translates into approximately 32 days absent in a 182-day school year.
There are clear patterns of differences in attendance rates for different groups of students (Table 4.2). Girls have higher attendance rates than boys. Asian students have a 95 percent attendance rate, the highest of any ethnic or racial group. Black students have the lowest rate-—88 percent.
All students in grades 3 through 8 take the annual New York State examinations in English Language Arts (ELA) and mathematics. The test produces two types of scores for each student. The scale score is a three digit score that indicates students’ absolute level of performance on the test. The state is currently using tests that are designed so that the scale scores only have meaning within a particular grade. Thus, they can be used to see how this year’s third graders performed compared with last year’s third graders, but they cannot be used to compare how a student in this year’s fourth grade performed compared with his/her own performance in third grade last year. The second type of score—the performance level—assigns students to 1 of 4 groups based upon their scale score. The
Table 4.1 Attendance Rate by Grade, 2007-2008 Through 2011-2012
Grade2007-2008
2008-2009
2009-2010
2010-2011
2011-2012
Pre-K 88.0% 88.0% 89.0% 88.6% 89.5%K 90.0% 90.3% 91.3% 90.8% 91.7%1 91.9% 91.8% 92.6% 92.2% 92.9%2 92.6% 92.5% 93.3% 92.9% 93.6%3 93.1% 93.0% 93.7% 93.4% 94.1%4 93.4% 93.2% 93.9% 93.6% 94.4%5 93.3% 93.1% 93.9% 93.7% 94.3%6 92.0% 92.2% 93.1% 92.7% 93.5%7 91.5% 91.6% 92.4% 92.2% 92.9%8 89.9% 90.2% 90.8% 90.4% 91.4%9 78.4% 80.0% 81.8% 81.3% 82.5%10 77.6% 78.7% 79.5% 80.1% 81.3%11 84.8% 85.5% 86.2% 85.7% 86.3%12 82.3% 83.1% 83.6% 82.9% 82.4%Total 87.9% 88.3% 89.2% 89.0% 89.8%
New York City Independent Budget Office
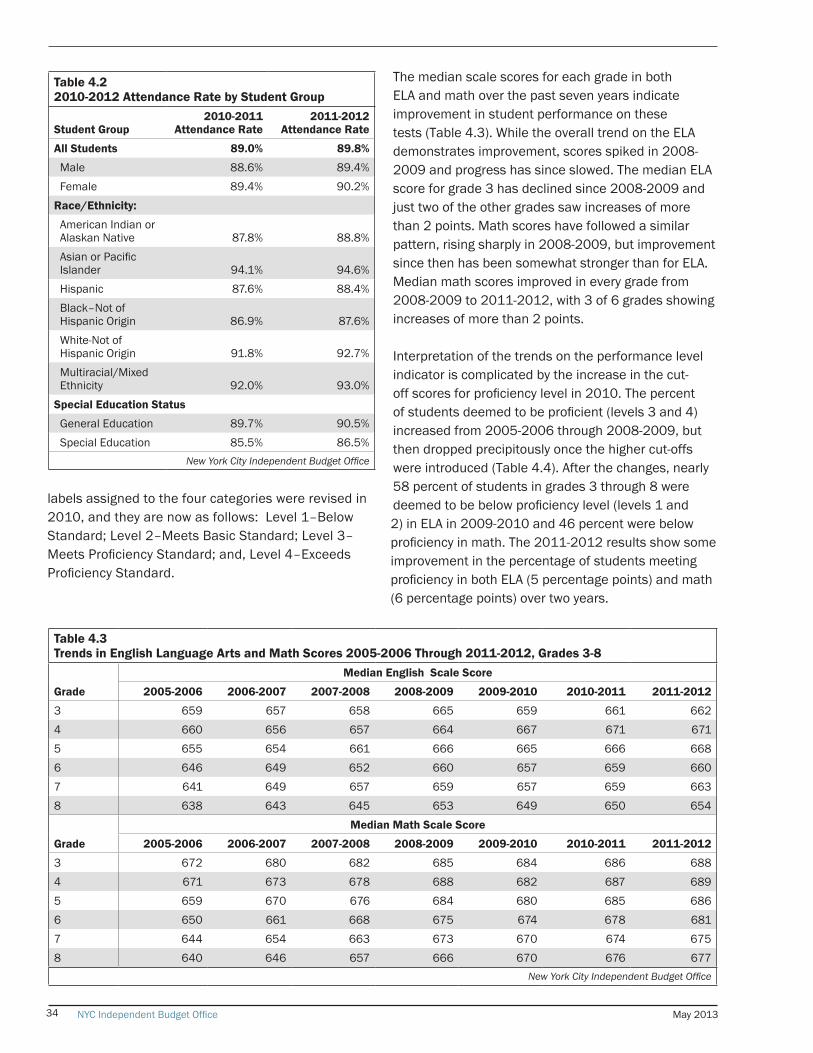
NYC Independent Budget Office May 201334
labels assigned to the four categories were revised in 2010, and they are now as follows: Level 1–Below Standard; Level 2–Meets Basic Standard; Level 3–Meets Proficiency Standard; and, Level 4–Exceeds Proficiency Standard.
The median scale scores for each grade in both ELA and math over the past seven years indicate improvement in student performance on these tests (Table 4.3). While the overall trend on the ELA demonstrates improvement, scores spiked in 2008-2009 and progress has since slowed. The median ELA score for grade 3 has declined since 2008-2009 and just two of the other grades saw increases of more than 2 points. Math scores have followed a similar pattern, rising sharply in 2008-2009, but improvement since then has been somewhat stronger than for ELA. Median math scores improved in every grade from 2008-2009 to 2011-2012, with 3 of 6 grades showing increases of more than 2 points.
Interpretation of the trends on the performance level indicator is complicated by the increase in the cut-off scores for proficiency level in 2010. The percent of students deemed to be proficient (levels 3 and 4) increased from 2005-2006 through 2008-2009, but then dropped precipitously once the higher cut-offs were introduced (Table 4.4). After the changes, nearly 58 percent of students in grades 3 through 8 were deemed to be below proficiency level (levels 1 and 2) in ELA in 2009-2010 and 46 percent were below proficiency in math. The 2011-2012 results show some improvement in the percentage of students meeting proficiency in both ELA (5 percentage points) and math (6 percentage points) over two years.
Table 4.22010-2012 Attendance Rate by Student Group
Student Group2010-2011
Attendance Rate2011-2012
Attendance Rate
All Students 89.0% 89.8%
Male 88.6% 89.4%Female 89.4% 90.2%
Race/Ethnicity:
American Indian or Alaskan Native 87.8% 88.8%Asian or Pacific Islander 94.1% 94.6%Hispanic 87.6% 88.4%Black–Not of Hispanic Origin 86.9% 87.6%White-Not of Hispanic Origin 91.8% 92.7%Multiracial/Mixed Ethnicity 92.0% 93.0%
Special Education Status
General Education 89.7% 90.5%Special Education 85.5% 86.5%
New York City Independent Budget Office
Table 4.3Trends in English Language Arts and Math Scores 2005-2006 Through 2011-2012, Grades 3-8
Median English Scale Score
Grade 2005-2006 2006-2007 2007-2008 2008-2009 2009-2010 2010-2011 2011-2012
3 659 657 658 665 659 661 6624 660 656 657 664 667 671 6715 655 654 661 666 665 666 6686 646 649 652 660 657 659 6607 641 649 657 659 657 659 6638 638 643 645 653 649 650 654
Median Math Scale Score
Grade 2005-2006 2006-2007 2007-2008 2008-2009 2009-2010 2010-2011 2011-2012
3 672 680 682 685 684 686 6884 671 673 678 688 682 687 6895 659 670 676 684 680 685 6866 650 661 668 675 674 678 6817 644 654 663 673 670 674 6758 640 646 657 666 670 676 677
New York City Independent Budget Office

NYC Independent Budget Office May 2013 35
The most widely respected assessment of the school system’s progress over time is the National Assessment of Educational Progress (NAEP). This exam has been given to a representative sample of students in grades 4 and 8 every two years since 2002-2003; the most recent administration of the test was in 2010-2011. NAEP results indicate that New York City’s public schools showed improvement in 2003 through 2011 in the results for grade 4 reading and for grade 4 and grade 8 math. There was no change in achievement in grade 8 reading in 200-2003 through 2010-2011. The same results indicate no improvement in either grade or subject since 2008-2009.
Student achievement in ELA and math is clearly related to student attendance. Simply put, the students who do better on these tests are those who attend school more frequently. Students with attendance rates of 98 percent or above in 2011-2012 were more likely to be proficient in ELA (59 percent) and math (76 percent). Those whose attendance rate was 75 percent or less had much lower proficiency rates: 16 percent in ELA and 15 percent in math. (Table 4.5 presents these data.)
Student test scores in grades 3 through 8 are also clearly related to poverty. The poorest students, those who returned a valid form indicating that their family income entitles them to free or reduced price school meals, attained proficiency at much lower rates in 2011-2012 (42 percent in ELA and 57 percent in math) than those
who are ineligible for subsidized meals (76 percent proficient in ELA and 84 percent in math). (Table 4.6)
Students in both English Language Learner and special education programs tend to have much lower performance level scores than other youngsters. Slightly more than 88 percent of ELL students scored below proficiency in ELA in 2011-2012 (Table 4.7). Poor performance for this group on the ELA test is all but certain because once students pass the New York State English as a Second Language Achievement Test, they are no longer designated as English Language Learners. In math, 63 percent of ELL students scored below proficiency level. Some 85 percent of students with special needs scored below proficiency in ELA (Table 4.8) and 70 percent did so in math.
Generally, female students score higher on these tests than do males. On the 2011-2012 ELA, 52 percent of females were scored as proficient, compared with 42 percent for males. In math the difference was smaller, with 62 percent of females scoring at proficiency level or above while 60 percent of males did so (Table 4.9). Multiracial, Asian, and white students outscore other students from other ethnic/racial groups on both exams. Their proficiency rates in ELA are nearly double that of black and Hispanic students
Student achievement levels can be shaped not only by the characteristics of the students themselves and
Table 4.4 Percent of Students at Each Performance Level, Grades 3-8
Performance Level
English Language Arts
2005-2006 2006-2007 2007-2008 2008-2009 2009-2010 2010-2011 2011-2012
1 11.5% 9.1% 5.8% 2.8% 15.2% 13.2% 12.2%2 37.9% 40.0% 36.6% 28.3% 42.4% 42.8% 40.8%3 44.9% 46.3% 53.5% 62.8% 35.1% 41.3% 43.8%4 5.7% 4.6% 4.1% 6.1% 7.3% 2.7% 3.3%Number Tested 406,729 428,061 417,327 415,365 414,575 416,552 415,342
Performance Level
Math
2005-2006 2006-2007 2007-2008 2008-2009 2009-2010 2010-2011 2011-2012
1 15.8% 10.6% 6.3% 3.3% 10.5% 9.5% 9.0%2 27.4% 24.3% 19.4% 14.8% 35.4% 33.0% 30.8%3 42.0% 46.1% 52.8% 55.9% 31.9% 36.5% 36.3%4 14.9% 19.1% 21.6% 25.9% 22.2% 21.0% 23.8%Number Tested 446, 477 435,068 424,557 423,323 425,265 425,228 423,463
New York City Independent Budget Office

NYC Independent Budget Office May 201336
Table 4.5A English Language Arts and Math Performance by Attendance Rate, 2010-2011
Attendance Rate
English Language Arts Performance Level
TOTALAttendance Rate
MathPerformance Level
TOTAL1 2 3 4 1 2 3 4
75% or less 33.0% 53.5% 13.4% 0.2% 10,250 75% or less 37.7% 47.5% 13.1% 1.7% 10,140 75% to 85% 23.4% 53.7% 22.5% 0.4% 27,965 75% to 85% 22.0% 48.6% 25.0% 4.3% 28,326 85% to 90% 18.2% 51.6% 29.3% 0.8% 43,014 85% to 90% 15.2% 45.3% 31.6% 8.0% 43,818 90% to 95% 14.1% 46.2% 37.9% 1.8% 104,133 90% to 95% 10.1% 37.8% 37.5% 14.5% 106,330 95% to 98% 11.0% 40.8% 45.2% 3.1% 128,602 95% to 98% 6.6% 29.9% 40.0% 23.5% 131,525 98% or more 8.0% 34.2% 53.0% 4.7% 101,833 98% or more 3.9% 21.2% 38.6% 36.3% 104,358 TOTAL 13.2% 42.8% 41.3% 2.7% 415,797 TOTAL 9.5% 33.0% 36.5% 21.0% 424,497
Table 4.5B English Language Arts and Math Performance by Attendance Rate, 2011-2012
Attendance Rate
English Language Arts Performance Level
TOTALAttendance Rate
MathPerformance Level
TOTAL1 2 3 4 1 2 3 4
75% or less 30.3% 54.0% 15.5% 0.2% 7,981 75% or less 37.3% 47.8% 13.3% 1.6% 8,397 75% to 85% 22.8% 53.0% 23.7% 0.5% 22,987 75% to 85% 22.5% 47.7% 24.8% 5.1% 23,426 85% to 90% 18.4% 49.7% 30.9% 1.0% 36,291 85% to 90% 15.8% 43.9% 31.6% 8.7% 36,926 90% to 95% 13.6% 45.6% 38.9% 1.9% 91,416 90% to 95% 10.6% 37.2% 37.1% 15.2% 93,199 95% to 98% 10.8% 39.6% 46.3% 3.4% 127,756 95% to 98% 6.9% 29.1% 39.6% 24.4% 130,098 98% or more 7.8% 32.9% 53.9% 5.3% 128,326 98% or more 3.8% 20.2% 37.5% 38.5% 130,801 TOTAL 12.2% 40.8% 43.8% 3.3% 414,757 TOTAL 9.0% 30.8% 36.4% 23.8% 422,847 NOTE: Does not include students for whom information on attendance was missing.
New York City Independent Budget Office
their families, but also the achievement levels of the students around them and of the schools they attend. In order to begin to tease out the possible effects of school and peer characteristics, we characterized all schools with data on the third through eighth grade tests into three equal groups based on the share of low-income students in each school.
Table 4.10 displays the 2010-2011 and 2011-2012 performance of students in the various meal subsidy categories within each type of school. In 2011-2012, students known to be at the lowest income level—those who returned a valid form indicating their eligibility for free or reduced price school meals—had higher ELA scores in low-poverty schools (58 percent proficiency) than eligible students in high-poverty schools (33 percent proficiency). Similarly, the students whose family income levels make them ineligible for meal subsidies in low-poverty schools did much better in ELA (81 percent proficiency) than the ineligible students in high-poverty schools (50 percent proficiency). Notably, students at the lowest income level who were in low-poverty schools scored better (58 percent ELA proficiency) than did students at the higher-income
levels (full price) who were in high-poverty schools (50 percent). While these findings suggest the possibility of a relationship between the concentration of poverty in schools and the achievement of students, our data does not allow us to determine if low-income students in high-poverty schools are systematically different than low-income students in low-poverty schools.
High school students in New York City (and state) participate in the Regents testing program. Regents exams are subject based (earth science, English, global studies, etc.). Beginning in the 2011-2012 school year, and except for students in a few schools with so-called portfolio programs, no public school student may earn a standard high school diploma in New York State without first passing five Regents exams—Comprehensive English, (any) math, Global History and Geography, U.S. History and Government, and any of the sciences. Students who pass an additional three Regents exams (in another math, another science, and a foreign language) are awarded an Advanced Regents Diploma.
Students sit for these exams at various points in their high school career, and there is no standard pattern

NYC Independent Budget Office May 2013 37
to their test taking. Some high schools offer the math exam at the end of grade 9; others delay until the end of grade 10. Generally, the Comprehensive English exam is taken after at least three years of high school. Further, students may retake exams they have attempted and failed until they attain a passing score. Thus, any single administration of a Regents exam includes both first-time test takers and those students who have previously failed and who are taking the test for the second or third time. Therefore care must be taken in interpreting the absolute passing rates for an individual administration of an exam.
In this report, we are less concerned with the absolute passing rates than with the relative passing rates of different groups of students. In making those comparisons, we have developed the following indicator—Regents pass rates for English and math represent the proportion of students who took each test in 2010-2011 (and 2011-2012) that scored at each proficiency level. If a student took an exam multiple
times in a single year, or took more than one math test in that year, only the highest score was counted.
A passing score for all Regents exams is a 65. In 2010, the State Education Department commissioned a team of researchers led by testing expert Daniel Koretz to define college readiness. Students with Regents scores high enough to strongly predict a grade of “C” or higher in a college-level course are considered college ready. This threshold was estimated to be 75 for English and 80 for math. For both English and math, we report the percent of students who failed, the percent who passed, and the percent who scored at or above the college-ready level. (The DOE has a different measure of college readiness, which includes a number of factors; here we are referring only to the Regents Exam score.)
In examining the Regents results, we once again see the strong relationship that school attendance has with success. High school students whose attendance rate was 98 percent or greater had a total passing rate of
Table 4.6A English Language Arts and Math Performance by Eligibility for Meal Subsidies, 2010-2011Grades 3-8
Meal Eligibility
English Language Arts Performance Level
TOTAL Meal Eligibility
MathPerformance Level
TOTAL 1 2 3 4 1 2 3 4
Free Lunch 14.9% 45.6% 37.8% 1.8% 341,372 Free Lunch 10.6% 35.7% 36.1% 17.6% 349,431 Reduced-Price Lunch 7.6% 39.4% 49.8% 3.2% 18,132
Reduced-Price Lunch 5.5% 27.3% 40.1% 27.2% 18,337
Full Price, Based on Form 3.7% 24.8% 63.1% 8.4% 50,924
Full Price, Based on Form 2.5% 16.0% 38.6% 42.9% 51,171
Full Price, Missing / Incomplete Form 14.3% 50.0% 33.9% 1.8% 6,124
Full Price, Missing / Incomplete Form 14.7% 42.2% 30.6% 12.6% 6,289
TOTAL 13.2% 42.8% 41.3% 2.7% 416,552 TOTAL 9.5% 33.0% 36.5% 21.0% 425,228
Table 4.6B English Language Arts and Math Performance by Eligibility for Meal Subsidies, 2011-2012
English Language Arts Performance Level
Meal Eligibility
MathPerformance Level
Total Meal Eligibility 1 2 3 4 Total 1 2 3 4
Free Lunch 13.8% 43.8% 40.1% 2.3% 334,582 Free Lunch 10.1% 33.4% 36.3% 20.2% 341,852 Reduced-Price Lunch 6.3% 36.5% 53.6% 3.6% 17,780
Reduced-Price Lunch 4.8% 24.9% 39.8% 30.6% 17,983
Full Price, Based on Form 3.0% 20.8% 66.0% 10.3% 47,755
Full Price, Based on Form 2.2% 14.0% 36.6% 47.3% 48,038
Full Price, Missing / Incomplete Form 12.4% 42.1% 43.4% 2.2% 15,225
Full Price, Missing / Incomplete Form 10.4% 33.1% 32.7% 23.8% 15,590
TOTAL 12.2% 40.8% 43.8% 3.3% 415,342 TOTAL 9.0% 30.8% 36.3% 23.8% 423,463 New York City Independent Budget Office

NYC Independent Budget Office May 201338
87 percent in English and 78 percent in math in 2011-2012. While 65 percent of these high-attendance students attained an English score signifying college readiness, only 39 percent attained college readiness in math. Table 4.11 presents these data. Twelve percent of all English Regents takers and 8 percent of math Regents takers had attendance rates below 75 percent. The performance of these students was
woefully low—49 percent passing in English and 31 percent in math.
Students from low-income families fared much better than the high absentee students (Table 4.12). Those students eligible for free or reduced-price meals (including all students in universal feeding schools) had total passing rates of 73 percent in English and 60
Table 4.7AEnglish Language Arts and Math Performance by English Language Learner Status, 2010-2011Grades 3-8
English Language Learner Status
English Language Arts Performance Level Number
Tested
Math Performance Level Number
Tested 1 2 3 4 1 2 3 4
English Language Learner 38.5% 49.1% 12.4% 0.1% 56,064 20.8% 44.6% 27.9% 6.7% 64,031 English Proficient 9.2% 41.9% 45.8% 3.1% 360,468 7.5% 31.0% 38.0% 23.5% 361,197 TOTAL 13.2% 42.8% 41.3% 2.7% 416,552 9.5% 33.0% 36.5% 21.0% 425,228
Table 4.7BEnglish Language Arts and Math Performance by ELL Status, 2011-2012Grades 3-8
English Language Learner Status
English Language Arts Performance Level Number
Tested
Math Performance Level Number
Tested 1 2 3 4 1 2 3 4
English Language Learner 38.8% 49.6% 11.5% 0.1% 53,811 20.6% 42.4% 29.0% 8.1% 60,544 English Proficient 8.2% 39.4% 48.6% 3.7% 361,531 7.1% 28.9% 37.6% 26.4% 362,919 TOTAL 12.2% 40.8% 43.8% 3.3% 415,342 9.0% 30.8% 36.3% 23.8% 423,463
New York City Independent Budget Office
Table 4.8A English Language Arts and Math Performance by Special Education Status, 2010-2011Grades 3-8
Special Education Status
English Language Arts Performance Level
Number Tested
Special Education Status
Math Performance Level Number
Tested1 2 3 4 1 2 3 4
Special Education 37.5% 48.6% 13.6% 0.3% 75,698
Special Education 26.6% 46.3% 22.6% 4.5% 75,684
General Education 7.8% 41.5% 47.5% 3.2% 340,854
General Education 5.8% 30.2% 39.5% 24.6% 349,544
TOTAL 13.2% 42.8% 41.3% 2.67 416,552 TOTAL 9.5% 33.0% 36.5% 20.9% 425,228
Table 4.8B English Language Arts and Math Performance by Special Education Status, 2011-2012Grades 3-8
Special Education Status
English Language Arts Performance Level Number
Tested
Special Education Status
Math Performance Level
Number Tested1 2 3 4 1 2 3 4
Special Education 35.5% 49.4% 14.8% 0.3% 75,524
Special Education 25.8% 44.4% 24.0% 5.8% 76,028
General Education 7.0% 38.8% 50.3% 3.9% 339,818
General Education 5.3% 27.9% 39.0% 27.8% 347,435
TOTAL 12.2% 40.8% 43.8% 3.3% 415,342 TOTAL 9.0% 30.8% 36.3% 23.8% 423,463New York City Independent Budget Office

NYC Independent Budget Office May 2013 39
percent in math. They did, however, score well below the levels of students whose family income made them ineligible for subsidized meals—80 percent in English and 67 percent in math in 2011-2012.
High school students with English Language Learner and special education status have much lower Regents pass rates than other students. In 2011-2012, just about half the ELL students failed these exams—54 percent failing in English and 47 percent in math. High school students with special needs have failure rates of
57 percent in English and 70 percent in math. Tables 4.13 and 4.14 display these data.
As in the earlier grades, females perform better on these tests, but the difference is smaller in math, where 37 percent of females fail, compared with 40 percent of the males. In English, the failure rates were 22 percent for females and 29 percent for males (Table 4.15). On both the English and math Regents, multiracial, Asian and white students were less likely to fail than students from other racial and ethnic groups.
Table 4.9A English Language Arts and Math Performance, by Race/Ethnicity and Gender, 2010-2011Grades 3 - 8
English Language Arts Performanceby Race/Ethnicity and Gender
Math Performanceby Race/Ethnicity and Gender
Race/Ethnicity
Performance Level Number Tested Race/Ethnicity
Performance Level Number Tested 1 2 3 4 1 2 3 4
American Indianor Alaskan Native 15.0% 43.2% 39.9% 1.9% 1,851
American Indian or Alaskan Native 12.6% 33.5% 36.4% 17.5% 1,899
Males 17.4% 45.2% 36.4% 1.0% 944 Males 13.5% 35.1% 35.3% 16.1% 975 Females 12.5% 41.1% 43.4% 3.0% 907 Females 11.7% 31.8% 37.6% 18.9% 924
Asian orPacific Islander 8.0% 27.8% 58.2% 6.0% 63,531
Asian orPacific Islander 2.8% 13.6% 35.9% 47.8% 66,047
Males 9.8% 30.5% 55.2% 4.5% 32,803 Males 3.0% 14.2% 35.8% 47.0% 34,178 Females 6.0% 24.9% 61.4% 7.6% 30,728 Females 2.5% 12.9% 36.0% 48.6% 31,869
Hispanic 16.5% 48.8% 33.7% 1.0% 167,308 Hispanic 11.5% 39.2% 36.9% 12.3% 171,872 Males 19.6% 49.6% 29.9% 0.8% 85,604 Males 12.5% 38.8% 36.2% 12.6% 87,947 Females 13.2% 47.9% 37.7% 1.3% 81,704 Females 10.5% 39.6% 37.7% 12.1% 83,925
Black—Not of Hispanic Origin 15.3% 49.9% 33.8% 1.1% 122,061
Black—Not of Hispanic Origin 13.2% 42.5% 34.1% 10.2%
122,698
Males 19.5% 51.5% 28.2% 0.7% 61,796 Males 15.5% 43.1% 32.2% 9.3% 62,087 Females 10.9% 48.2% 39.4% 1.5% 60,265 Females 10.8% 41.9% 36.1% 11.2% 60,611
White—Not of Hispanic Origin 5.3% 28.3% 59.6% 6.8% 60,908
White—Not of Hispanic Origin 3.6% 18.1% 40.7% 37.6% 61,797
Males 6.8% 31.5% 56.5% 5.1% 31,701 Males 4.1% 18.5% 40.0% 37.4% 32,179 Females 3.8% 24.7% 62.9% 8.7% 29,207 Females 3.1% 17.6% 41.4% 37.9% 29,618
Multiracial/Mixed Ethnicity 4.0% 21.2% 64.8% 10.1% 860
Multiracial/Mixed Ethnicity 3.9% 15.3% 37.9% 43.0% 882
Males 5.0% 22.0% 67.8% 5.2% 404 Males 4.5% 14.6% 39.2% 41.6% 418 Females 3.1% 20.4% 62.1% 14.5% 456 Females 3.2% 15.9% 36.6% 44.2% 464
TOTAL 13.2% 42.8% 41.3% 2.7% 416,519 TOTAL 9.5% 33.0% 36.5% 21.0% 425,195
Males 16.2% 44.5% 37.4% 2.0% 213,252 Males 10.6% 33.1% 35.5% 20.8% 217,784
Females 10.0% 41.1% 45.5% 3.4% 203,267 Females 8.3% 33.0% 37.5% 21.2% 207,411

NYC Independent Budget Office May 201340
Table 4.9BEnglish Language Arts and Math Performance, by Race/Ethnicity and Gender, 2011-2012Grades 3 - 8
English Language Arts Performanceby Race/Ethnicity and Gender
Math Performanceby Race/Ethnicity and Gender
Race/Ethnicity
Performance Level Number Tested Race/Ethnicity
Performance Level Number Tested 1 2 3 4 1 2 3 4
American Indian or Alaskan Native 12.8% 43.1% 41.3% 2.8% 2,129
American Indian or Alaskan Native 10.5% 33.4% 34.3% 21.8% 2,187
Males 15.9% 44.8% 36.8% 2.5% 1,082 Males 12.1% 32.3% 34.2% 21.5% 1,109 Females 9.6% 41.4% 45.9% 3.2% 1,047 Females 8.9% 34.6% 34.4% 22.1% 1,078
Asian orPacific Islander 7.1% 25.7% 59.8% 7.4% 65,070
Asian or Pacific Islander 2.3% 12.0% 34.0% 51.7% 67,024
Males 8.8% 28.5% 57.1% 5.7% 33,566 Males 2.6% 12.6% 33.9% 50.9% 34,617 Females 5.3% 22.8% 62.6% 9.3% 31,504 Females 1.9% 11.4% 34.1% 52.5% 32,407
Hispanic 15.5% 46.9% 36.4% 1.2% 167,349 Hispanic 11.1% 36.5% 37.6% 14.8% 171,419 Males 18.6% 47.9% 32.6% 0.9% 85,429 Males 12.1% 36.2% 37.0% 14.8% 87,600 Females 12.2% 45.8% 40.4% 1.6% 81,920 Females 10.0% 36.8% 38.2% 14.9% 83,819
Black—Not of Hispanic Origin 14.2% 48.7% 35.8% 1.3% 117,103
Black—Not of Hispanic Origin 12.8% 40.9% 34.3% 12.0% 118,131
Males 18.5% 50.5% 30.1% 0.9% 59,225 Males 14.8% 41.8% 32.6% 10.8% 59,778 Females 9.9% 46.9% 41.7% 1.6% 57,878 Females 10.8% 40.0% 36.0% 13.2% 58,353
White—Not of Hispanic Origin 5.1% 25.3% 61.6% 8.0% 62,781
White—Not of Hispanic Origin 3.3% 16.9% 39.3% 40.4% 63,780
Males 6.6% 28.6% 59.0% 5.9% 32,724 Males 3.8% 17.4% 38.9% 39.9% 33,274 Females 3.5% 21.7% 64.5% 10.3% 30,057 Females 2.8% 16.4% 39.8% 41.0% 30,506
Multiracial/Mixed Ethnicity 3.6% 23.5% 63.1% 9.8% 889
Multiracial/Mixed Ethnicity 3.9% 15.2% 39.4% 41.5% 901
Males 4.2% 24.8% 63.6% 7.5% 456 Males 3.3% 15.2% 38.2% 43.4% 461 Females 3.0% 22.2% 62.6% 12.2% 433 Females 4.5% 15.2% 40.7% 39.5% 440
TOTAL 12.2% 40.8% 43.8% 3.3% 415,321 TOTAL 9.0% 30.8% 36.3% 23.8% 423,442
Males 15.1% 42.5% 39.9% 2.4% 212,482 Males 10.1% 31.0% 35.5% 23.4% 216,839 Females 9.1% 38.9% 47.9% 4.1% 202,839 Females 7.9% 30.7% 37.2% 24.3% 206,603
NOTE: Does not include students for whom information on race/ethnicity was missing.New York City Independent Budget Office

NYC Independent Budget Office May 2013 41
Table 4.10AEnglish Language Arts and Math Performance by Meal Subsidy Status of Students Within Poverty Level of School, 2010-2011Grades 3 - 8
Meal Status of Students / Poverty Level of School
English Language Arts Performance Level
Number Tested
Meal Status of Students / Poverty Level of School
Math Performance Level
Number Tested 1 2 3 4 1 2 3 4
Free 14.4% 45.7% 38.1% 1.8% 337,858 Free 10.2% 35.7% 36.4% 17.8% 345,940
Low Poverty 8.9% 38.4% 49.1% 3.6% 73,078 Low Poverty 6.4% 27.5% 37.7% 28.4% 74,016Middle Poverty 13.0% 46.4% 38.8% 1.7% 124,964 Middle Poverty 9.7% 35.3% 36.9% 18.1% 127,491High Poverty 18.4% 48.9% 31.7% 1.0% 139,816 High Poverty 12.5% 40.2% 35.3% 12.0% 144,433
Reduced Price 7.6% 39.4% 49.8% 3.2% 18,093 Reduced Price 5.4% 27.3% 40.1% 27.2% 18,299
Low Poverty 4.8% 33.0% 57.6% 4.5% 8,788 Low Poverty 3.2% 21.0% 40.1% 35.7% 8,847Middle Poverty 8.7% 43.7% 45.4% 2.2% 5,111 Middle Poverty 7.0% 31.0% 40.1% 21.9% 5,176High Poverty 12.0% 47.6% 39.0% 1.5% 4,194 High Poverty 8.1% 35.7% 40.1% 16.2% 4,276
Full Price, Complete Form 3.6% 24.8% 63.2% 8.4% 50,815
Full Price, Complete Form 2.5% 16.0% 38.6% 43.0% 51,062
Low Poverty 2.3% 20.1% 67.5% 10.2% 39,195 Low Poverty 1.4% 11.9% 38.1% 48.5% 39,325Middle Poverty 7.0% 39.0% 50.9% 3.1% 7,569 Middle Poverty 5.6% 27.0% 40.4% 27.0% 7,626High Poverty 9.9% 43.7% 44.6% 1.8% 4,051 High Poverty 6.8% 33.9% 39.9% 19.4% 4,111
Full Price, Missing/Incomplete Form 14.0% 50.7% 33.6% 1.7% 5,853
Full Price, Missing/Incomplete Form 14.3% 42.5% 30.7% 12.5% 6,028
Low Poverty 9.3% 46.3% 41.6% 2.7% 2,987 Low Poverty 9.7% 37.4% 34.7% 18.2% 3,023Middle Poverty 16.5% 55.4% 27.2% 0.9% 1,779 Middle Poverty 17.2% 47.7% 27.8% 7.3% 1,839High Poverty 23.0% 54.9% 21.7% 0.4% 1,087 High Poverty 22.0% 47.6% 24.6% 5.8% 1,166
TOTAL 12.7% 42.9% 41.6% 2.7% 412,619 TOTAL 9.1% 33.0% 36.7% 21.2% 421,329

NYC Independent Budget Office May 201342
Table 4.10BEnglish Language Arts and Math Performance by Meal Subsidy Status of Students Within Poverty Level of School, 2011-2012Grades 3 - 8
Meal Status of Students / Poverty Level of School
English Language Arts Performance Level
Number Tested
Meal Status of Students / Poverty Level of School
Math Performance Level
Number Tested 1 2 3 4 1 2 3 4
Free 13.3% 43.9% 40.5% 2.3% 331,365 Free 9.7% 33.4% 36.5% 20.3% 338,548
Low Poverty 7.1% 34.8% 53.6% 4.5% 83,986 Low Poverty 5.4% 24.4% 38.1% 32.2% 85,063Middle Poverty 12.1% 45.4% 40.3% 2.1% 114,811 Middle Poverty 9.2% 33.5% 37.4% 19.9% 117,062High Poverty 18.3% 48.3% 32.3% 1.1% 132,568 High Poverty 12.9% 38.9% 34.8% 13.3% 136,423
Reduced Price 6.2% 36.5% 53.7% 3.6% 17,736 Reduced Price 4.7% 24.8% 39.8% 30.7% 17,939
Low Poverty 3.6% 29.8% 61.4% 5.2% 8,906 Low Poverty 2.8% 18.8% 40.1% 38.3% 8,962Middle Poverty 7.4% 41.2% 49.2% 2.2% 4,734 Middle Poverty 5.3% 28.6% 39.6% 26.6% 4,798High Poverty 10.4% 45.7% 42.3% 1.6% 4,096 High Poverty 8.2% 33.4% 39.5% 18.9% 4,179
Full Price, Complete Form 2.9% 20.7% 66.0% 10.3% 47,647
Full Price, Complete Form 2.1% 14.0% 36.6% 47.4% 47,930
Low Poverty 1.8% 17.1% 69.4% 11.7% 38,278 Low Poverty 1.2% 10.8% 36.1% 52.0% 38,446Middle Poverty 6.2% 33.4% 55.1% 5.4% 5,859 Middle Poverty 4.8% 24.3% 38.0% 33.0% 5,915High Poverty 9.8% 39.9% 47.3% 3.1% 3,510 High Poverty 7.6% 31.2% 39.7% 21.5% 3,569
Full Price, Missing/ Incomplete Form 12.0% 42.2% 43.6% 2.2% 14,940
Full Price, Missing/ Incomplete Form 10.0% 33.1% 32.9% 24.0% 15,295
Low Poverty 6.0% 34.3% 55.6% 4.1% 5,951 Low Poverty 5.5% 27.3% 33.9% 33.2% 6,004 Middle Poverty 12.9% 47.1% 39.2% 0.9% 4,824 Middle Poverty 10.9% 34.4% 33.1% 21.6% 4,921 High Poverty 19.7% 47.9% 31.5% 0.8% 4,165 High Poverty 15.2% 39.5% 31.2% 14.1% 4,370TOTAL 11.8% 40.8% 44.1% 3.3% 411,688 TOTAL 8.6% 30.8% 36.6% 24.0% 419,712
New York City Independent Budget Office

NYC Independent Budget Office May 2013 43
Table 4.11AEnglish and Math Regents Performance by Attendance Rate, 2010-2011
Attendance Rate
English Performance
Attendance Rate
Math Performance
FailTotal
PassingCollege
ReadyTotal
Tested FailTotal
PassingCollege
ReadyTotal
Tested
75% or less 48.6% 51.4% 21.7% 12,956 75% or less 69.2% 30.8% 2.0% 13,07175% to 85% 32.9% 67.1% 31.9% 10,978 75% to 85% 57.5% 42.5% 4.0% 14,76085% to 90% 25.6% 74.4% 39.9% 11,406 85% to 90% 50.8% 49.2% 6.5% 17,99790% to 95% 19.1% 80.9% 50.2% 20,048 90% to 95% 42.7% 57.3% 12.0% 35,95495% to 98% 14.4% 85.6% 59.1% 21,194 95% to 98% 32.9% 67.1% 21.1% 42,75498% or more 9.4% 90.6% 69.5% 20,228 98% or more 21.7% 78.3% 37.9% 45,450TOTAL 22.3% 77.7% 49.1% 96,810 TOTAL 38.8% 61.2% 19.1% 169,986
Table 4.11BEnglish and Math Regents Performance by Attendance Rate, 2011-2012
Attendance Rate
English Performance
Attendance Rate
Math Performance
FailTotal
PassingCollege
ReadyTotal
Tested FailTotal
PassingCollege
ReadyTotal
Tested
75% or less 51.5% 48.5% 20.4% 10,993 75% or less 69.3% 30.7% 1.8% 13,35275% to 85% 38.8% 61.2% 29.7% 9,307 75% to 85% 59.4% 40.6% 3.7% 13,63485% to 90% 30.8% 69.2% 37.7% 10,175 85% to 90% 52.4% 47.6% 6.2% 16,43490% to 95% 24.0% 76.0% 46.1% 17,489 90% to 95% 44.1% 55.9% 12.0% 32,34295% to 98% 19.0% 81.0% 54.5% 20,840 95% to 98% 34.7% 65.3% 20.6% 41,78898% or more 12.8% 87.2% 64.9% 24,064 98% or more 22.1% 77.9% 38.8% 54,777TOTAL 25.5% 74.5% 47.3% 92,868 TOTAL 38.8% 61.2% 20.6% 172,327
New York City Independent Budget Office
Table 4.12AEnglish and Math Regents Performance by Eligibility for Meal Subsidies, 2010-2011
Meal Eligibility
English Performance
Meal Eligibility
Math Performance
FailTotal
PassingCollege
ReadyTotal
Tested FailTotal
PassingCollege
ReadyTotal
Tested
Free or Reduced-Price Lunch 24.0% 76.0% 46.2% 74,209
Free or Reduced-Price Lunch 40.2% 59.8% 17.3% 131,289
Full-Price Lunch 17.0% 83.0% 58.5% 22,771
Full-Price Lunch 34.2% 65.8% 25.2% 38,899
TOTAL 22.3% 77.7% 49.1% 96,980 TOTAL 38.8% 61.2% 19.1% 170,188
Table 4.12BEnglish and Math Regents Performance by Eligibility for Meal Subsidies, 2011-2012
Meal Eligibility
English Performance
Meal Eligibility
Math Performance
FailTotal
PassingCollege
ReadyTotal
Tested FailTotal
PassingCollege
ReadyTotal
Tested
Free or Reduced-Price Lunch 27.4% 72.6% 44.0% 69,908
Free or Reduced-Price Lunch 40.5% 59.5% 18.5% 130,556
Full-Price Lunch 19.6% 80.4% 57.0% 23,128
Full-Price Lunch 33.5% 66.5% 27.0% 42,026
TOTAL 25.5% 74.5% 47.2% 93,036 TOTAL 38.8% 61.2% 20.6% 172,582NOTES: In this table, students who did not return a completed school lunch eligibility form are counted in the Full Price Lunch category. The data available to IBO does not allow us to count those students separately in the high school grades. In past years, we found that about a quarter of the students tested with regents exams did not have a valid lunch form on file.
New York City Independent Budget Office

NYC Independent Budget Office May 201344
Table 4.14AEnglish and Math Regents Performance by Special Education Status, 2010-2011
Special Education Status
English Performance Math Performance
FailTotal
PassingCollege
ReadyTotal
Tested FailTotal
PassingCollege
ReadyTotal
Tested
Special Education 52.1% 47.9% 18.5% 11,658 69.3% 30.7% 3.2% 18,533General Education 18.3% 81.7% 53.2% 85,322 35.1% 64.9% 21.1% 151,655TOTAL 22.3% 77.7% 49.1% 96,980 38.8% 61.2% 19.1% 170,188
Table 4.14BEnglish and Math Regents Performance by Special Education Status, 2011-2012
Special Education Status
English Performance Math Performance
FailTotal
PassingCollege
ReadyTotal
Tested FailTotal
PassingCollege
ReadyTotal
Tested
Special Education 56.9% 43.1% 17.2% 11,441 69.7% 30.3% 3.9% 19,851General Education 21.1% 78.9% 51.5% 81,593 34.8% 65.2% 22.8% 152,731TOTAL 25.5% 74.5% 47.2% 93,034 38.8% 61.2% 20.6% 172,582
New York City Independent Budget Office
Table 4.13English and Math Regents Performance by English Language Learner Status, 2010-2011
English Language Learner Status
English Performance Math Performance
FailTotal
PassingCollege
ReadyTotal
Tested FailTotal
PassingCollege
ReadyTotal
Tested
English Language Learner 50.4% 49.6% 19.2% 14,226 47.3% 52.7% 15.1% 22,148English Proficient 17.5% 82.5% 54.2% 82,754 37.5% 62.5% 19.7% 148,040TOTAL 22.3% 77.7% 49.1% 96,980 38.8% 61.2% 19.1% 170,188
Table 4.13BEnglish and Math Regents Performance by English Language Learner Status, 2011-2012
English Language Learner Status
English Performance Math Performance
FailTotal
PassingCollege
ReadyTotal
Tested FailTotal
PassingCollege
ReadyTotal
Tested
English Language Learner 54.1% 45.9% 17.4% 14,118 47.2% 52.8% 15.1% 22,443English Proficient 20.4% 79.6% 52.6% 78,916 37.5% 62.5% 21.4% 150,139TOTAL 25.5% 74.5% 47.2% 93,034 38.8% 61.2% 20.6% 172,582
New York City Independent Budget Office

NYC Independent Budget Office May 2013 45
Table 4.15A English and Math Regents Performance, by Race/Ethnicity and Gender, 2010-2011
Race/Ethnicity
English Performance
Total Tested Race/Ethnicity
Math Performance
Total Tested Fail Pass
College Ready Fail Pass
College Ready
American Indian or Alaskan Native 25.7% 74.3% 41.7% 417
American Indian or Alaskan Native 41.5% 58.5% 16.3% 737
Males 30.6% 69.4% 33.3% 216 Males 43.8% 56.2% 16.1% 379 Females 20.4% 79.6% 50.7% 201 Females 39.1% 60.9% 16.5% 358
Asian or Pacific Islander 14.1% 85.9% 65.7% 15,753
Asian or Pacific Islander 17.8% 82.2% 47.6% 30,715
Males 17.1% 82.9% 60.9% 8,296 Males 19.0% 81.0% 45.6% 15,819 Females 10.8% 89.2% 71.0% 7,457 Females 16.5% 83.5% 49.7% 14,896
Hispanic 26.9% 73.1% 41.7% 37,826 Hispanic 45.8% 54.2% 10.0% 64,083 Males 30.6% 69.4% 37.2% 19,024 Males 46.9% 53.1% 9.5% 31,325 Females 23.2% 76.8% 46.2% 18,802 Females 44.7% 55.3% 10.5% 32,758
Black—Not of Hispanic Origin 25.3% 74.7% 41.8% 31,541
Black—Not of Hispanic Origin 48.1% 51.9% 8.4% 52,132
Males 30.6% 69.4% 35.8% 15,601 Males 51.0% 49.0% 7.0% 24,807 Females 20.2% 79.8% 47.6% 15,940 Females 45.4% 54.6% 9.6% 27,325
White—Not of Hispanic Origin 9.9% 90.1% 71.1% 11,330
White—Not of Hispanic Origin 26.0% 74.0% 31.4% 22,255
Males 12.8% 87.2% 66.1% 6,012 Males 27.0% 73.0% 30.3% 11,512 Females 6.6% 93.4% 76.7% 5,318 Females 24.9% 75.1% 32.7% 10,743
Multiracial/Mixed Ethnicity 12.6% 87.4% 68.4% 95
Multiracial/Mixed Ethnicity 21.4% 78.6% 33.6% 229
Males 8.5% 91.5% 66.0% 47 Males 25.8% 74.2% 27.8% 97 Females 16.7% 83.3% 70.8% 48 Females 18.2% 81.8% 37.9% 132
TOTAL 22.3% 77.7% 49.1% 96,962 TOTAL 38.8% 61.2% 19.1% 170,151
Males 26.1% 73.9% 44.3% 49,196 Males 40.1% 59.9% 18.5% 83,939 Females 18.4% 81.6% 54.0% 47,766 Females 37.5% 62.5% 19.8% 86,212
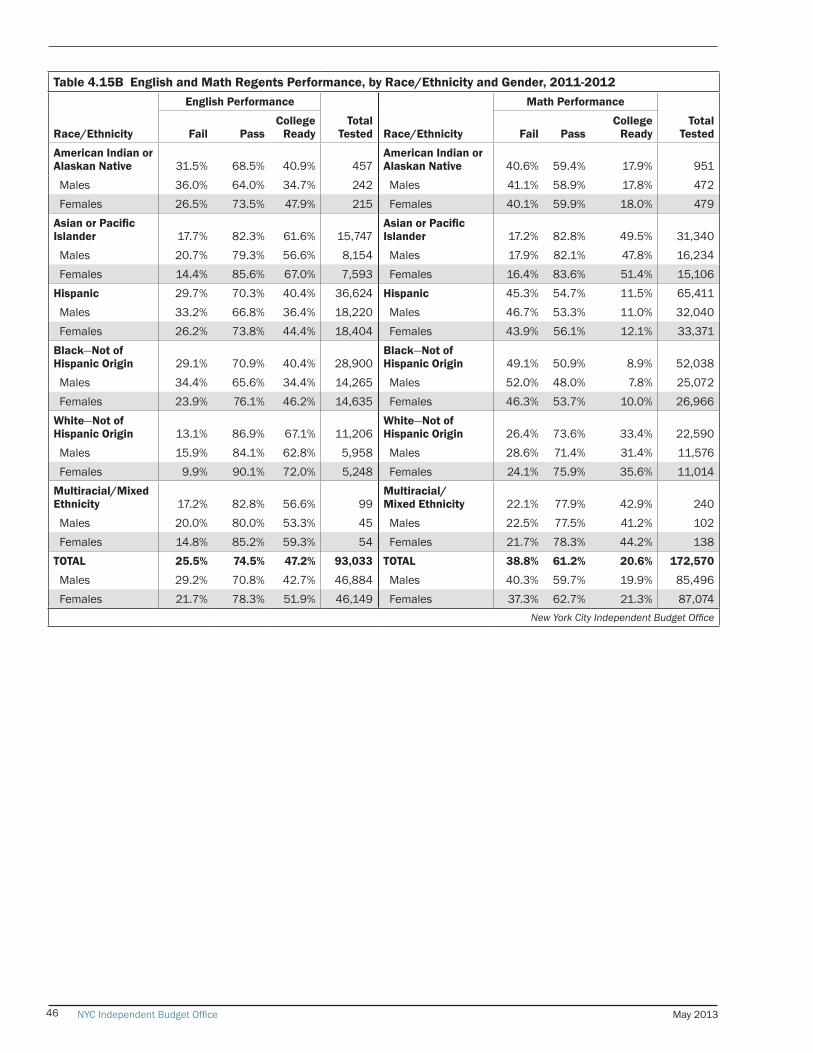
NYC Independent Budget Office May 201346
Table 4.15B English and Math Regents Performance, by Race/Ethnicity and Gender, 2011-2012
Race/Ethnicity
English Performance
Total Tested Race/Ethnicity
Math Performance
Total Tested Fail Pass
College Ready Fail Pass
College Ready
American Indian or Alaskan Native 31.5% 68.5% 40.9% 457
American Indian or Alaskan Native 40.6% 59.4% 17.9% 951
Males 36.0% 64.0% 34.7% 242 Males 41.1% 58.9% 17.8% 472 Females 26.5% 73.5% 47.9% 215 Females 40.1% 59.9% 18.0% 479
Asian or Pacific Islander 17.7% 82.3% 61.6% 15,747
Asian or Pacific Islander 17.2% 82.8% 49.5% 31,340
Males 20.7% 79.3% 56.6% 8,154 Males 17.9% 82.1% 47.8% 16,234 Females 14.4% 85.6% 67.0% 7,593 Females 16.4% 83.6% 51.4% 15,106
Hispanic 29.7% 70.3% 40.4% 36,624 Hispanic 45.3% 54.7% 11.5% 65,411 Males 33.2% 66.8% 36.4% 18,220 Males 46.7% 53.3% 11.0% 32,040 Females 26.2% 73.8% 44.4% 18,404 Females 43.9% 56.1% 12.1% 33,371
Black—Not of Hispanic Origin 29.1% 70.9% 40.4% 28,900
Black—Not of Hispanic Origin 49.1% 50.9% 8.9% 52,038
Males 34.4% 65.6% 34.4% 14,265 Males 52.0% 48.0% 7.8% 25,072 Females 23.9% 76.1% 46.2% 14,635 Females 46.3% 53.7% 10.0% 26,966
White—Not of Hispanic Origin 13.1% 86.9% 67.1% 11,206
White—Not of Hispanic Origin 26.4% 73.6% 33.4% 22,590
Males 15.9% 84.1% 62.8% 5,958 Males 28.6% 71.4% 31.4% 11,576 Females 9.9% 90.1% 72.0% 5,248 Females 24.1% 75.9% 35.6% 11,014
Multiracial/Mixed Ethnicity 17.2% 82.8% 56.6% 99
Multiracial/Mixed Ethnicity 22.1% 77.9% 42.9% 240
Males 20.0% 80.0% 53.3% 45 Males 22.5% 77.5% 41.2% 102 Females 14.8% 85.2% 59.3% 54 Females 21.7% 78.3% 44.2% 138
TOTAL 25.5% 74.5% 47.2% 93,033 TOTAL 38.8% 61.2% 20.6% 172,570
Males 29.2% 70.8% 42.7% 46,884 Males 40.3% 59.7% 19.9% 85,496 Females 21.7% 78.3% 51.9% 46,149 Females 37.3% 62.7% 21.3% 87,074
New York City Independent Budget Office
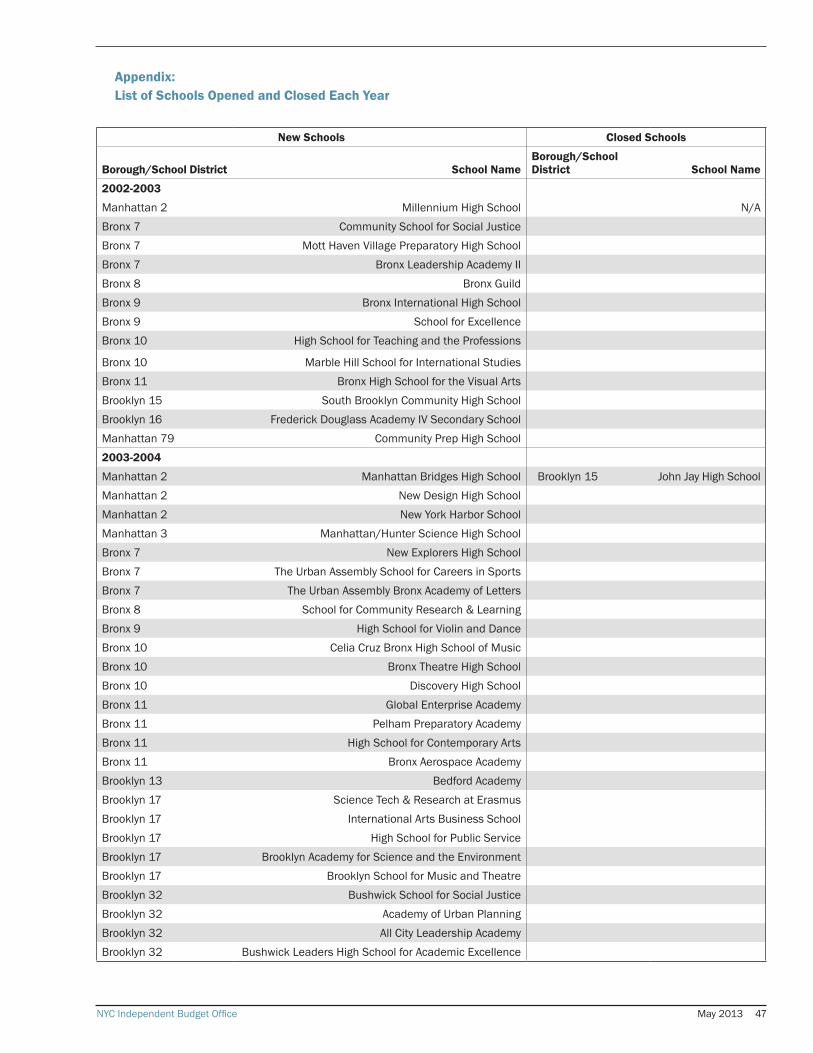
NYC Independent Budget Office May 2013 47
Appendix: List of Schools Opened and Closed Each Year
New Schools Closed Schools
Borough/School District School NameBorough/School District School Name
2002-2003
Manhattan 2 Millennium High School N/ABronx 7 Community School for Social JusticeBronx 7 Mott Haven Village Preparatory High SchoolBronx 7 Bronx Leadership Academy IIBronx 8 Bronx GuildBronx 9 Bronx International High SchoolBronx 9 School for ExcellenceBronx 10 High School for Teaching and the Professions
Bronx 10 Marble Hill School for International StudiesBronx 11 Bronx High School for the Visual ArtsBrooklyn 15 South Brooklyn Community High SchoolBrooklyn 16 Frederick Douglass Academy IV Secondary SchoolManhattan 79 Community Prep High School2003-2004
Manhattan 2 Manhattan Bridges High School Brooklyn 15 John Jay High SchoolManhattan 2 New Design High SchoolManhattan 2 New York Harbor SchoolManhattan 3 Manhattan/Hunter Science High SchoolBronx 7 New Explorers High SchoolBronx 7 The Urban Assembly School for Careers in SportsBronx 7 The Urban Assembly Bronx Academy of LettersBronx 8 School for Community Research & LearningBronx 9 High School for Violin and DanceBronx 10 Celia Cruz Bronx High School of MusicBronx 10 Bronx Theatre High SchoolBronx 10 Discovery High SchoolBronx 11 Global Enterprise AcademyBronx 11 Pelham Preparatory AcademyBronx 11 High School for Contemporary ArtsBronx 11 Bronx Aerospace AcademyBrooklyn 13 Bedford AcademyBrooklyn 17 Science Tech & Research at ErasmusBrooklyn 17 International Arts Business SchoolBrooklyn 17 High School for Public ServiceBrooklyn 17 Brooklyn Academy for Science and the EnvironmentBrooklyn 17 Brooklyn School for Music and TheatreBrooklyn 32 Bushwick School for Social JusticeBrooklyn 32 Academy of Urban PlanningBrooklyn 32 All City Leadership AcademyBrooklyn 32 Bushwick Leaders High School for Academic Excellence

NYC Independent Budget Office May 201348
2004-2005
New Schools Closed Schools
Manhattan 1 Henry Street School for International Studies Bronx 7 Elijah D. Clark SchoolManhattan 2 Food and Finance High School Bronx 7 South Bronx High SchoolManhattan 2 Essex Street Academy Bronx 8 George L. Gallego SchoolManhattan 2 High School of Hospitality ManagementManhattan 2 Pace High SchoolManhattan 2 The Urban Assembly School of Design and ConstructionManhattan 3 Manhattan Theatre Lab SchoolManhattan 3 The Urban Assembly School for Media StudiesManhattan 3 Frederick Douglass Academy II Secondary SchoolManhattan 3 Mott Hall IIManhattan 5 Harlem Renaissance High SchoolManhattan 5 Knowledge and Power Preparatory Academy IV Middle School (KAPPA IV)Manhattan 5 Mott Hall High SchoolManhattan 5 Knowledge and Power Preparatory Academy II Middle School (KAPPA II)Bronx 7 South Bronx Preparatory: A College Board SchoolBronx 7 Crotona Academy High SchoolBronx 8 Bronx Studio School for Writers and ArtistsBronx 8 Women’s Academy for Excellence (WAE)Bronx 8 Renaissance High School for Musical Theater and TechnologyBronx 8 Gateway School for Environmental Research and TechnologyBronx 8 Pablo Neruda Academy for Architecture and World StudiesBronx 8 Millenium Art AcademyBronx 9 Mott Hall IIIBronx 9 Bronx School of Expeditionary LearningBronx 9 Eagle Academy for Young MenBronx 9 The Urban Assembly Academy for History and Citizenship for Young MenBronx 9 The Urban Assembly School for Applied Math and ScienceBronx 9 Morris Academy for Collaborative StudiesBronx 9 Frederick Douglass Academy III Secondary SchoolBronx 10 Bronx Engineering and Technology Academy (BETA)
Bronx 10Marie Curie High School for Nursing, Medicine, and the Allied Health
ProfessionsBronx 10 West Bronx Academy for the FutureBronx 10 Bronx School of Law and FinanceBronx 10 PULSE High School (Providing Urban Learners Success in Education)Bronx 11 Bronx Health Sciences High SchoolBronx 11 Bronx High School for Writing and Communication ArtsBronx 11 Bronx Lab SchoolBronx 11 High School of Computers and TechnologyBronx 11 Collegiate Institute for Math and ScienceBronx 11 Bronx Academy of Health CareersBronx 11 Astor Collegiate High School
Bronx 12Bronx High School of Performance and Stagecraft
(Performance Conservatory High School)Bronx 12 Bronx Latin

NYC Independent Budget Office May 2013 49
New Schools Closed Schools
Bronx 12 East Bronx Academy for the FutureBronx 12 Frederick Douglass Academy V Middle SchoolBronx 12 Peace and Diversity AcademyBronx 12 Knowledge and Power Preparatory Academy III (KAPPA III)Brooklyn 13 The Urban Assembly School for Law and JusticeBrooklyn 14 Brooklyn Preparatory High SchoolBrooklyn 14 Williamsburg High School for Architecture and DesignBrooklyn 14 Williamsburg Preparatory SchoolBrooklyn 17 International High School @ Prospect HeightsBrooklyn 17 High School for Global CitizenshipBrooklyn 17 School for Human RightsBrooklyn 17 School for Democracy and LeadershipBrooklyn 17 High School for Youth and Community Development at ErasmusBrooklyn 17 High School for Service and Learning at ErasmusBrooklyn 17 Brownsville Diploma Plus High SchoolBrooklyn 19 FDNY High School for Fire and Life SafetyBrooklyn 19 High School for Civil RightsBrooklyn 19 Performing Arts and Technology High School (PATHS)Brooklyn 19 WATCH High School (World Academy for Total Community Health)Brooklyn 23 Brooklyn Collegiate: A College Board SchoolBrooklyn 23 Frederick Douglass Academy VII High SchoolBrooklyn 23 Knowledge and Power Preparatory Academy V (KAPPA V)Brooklyn 23 Mott Hall IVQueens 25 Flushing International High SchoolQueens 27 Frederick Douglass Academy VI High SchoolQueens 29 Excelsior Preparatory High SchoolBrooklyn 32 Bushwick Community High School

NYC Independent Budget Office May 201350
2005-2006New Schools Closed Schools
Manhattan 1 Technology, Arts, and Sciences Studio Manhattan 3Martin Luther King
High SchoolManhattan 2 The Facing History School Bronx 12 I.S. 191Manhattan 2 The Urban Assembly Academy of Government and Law Bronx 12 Morris High SchoolManhattan 2 Lower Manhattan Arts Academy Bronx 15 M.S. 378 Carroll Gardens C.S.Manhattan 2 The James Baldwin School: A School for Expeditionary Learning Brooklyn 23 I.S. 275 Thelma J. HamiltonManhattan 2 The Urban Assembly School of Business for Young Women Brooklyn 79 High School of RedirectionManhattan 2 The 47 American Sign Language & English Lower SchoolManhattan 3 High School for Arts, Imagination and InquiryManhattan 3 The Anderson SchoolManhattan 5 Thurgood Marshall Academy Lower SchoolManhattan 6 City College Academy of the ArtsManhattan 6 Middle School 322Manhattan 6 P.S. 325Bronx 7 South Bronx Academy for Applied MediaBronx 7 Academy of Public RelationsBronx 8 Felisa Rincon de Gautier Institute for Law and Public PolicyBronx 9 Eximius College Preparatory Academy: A College Board SchoolBronx 9 Mott Hall Bronx High SchoolBronx 9 Bronx Center for Science and MathematicsBronx 9 Validus Preparatory Academy: An Expeditionary Learning SchoolBronx 9 Leadership InstituteBronx 10 The New School for Leadership and JournalismBronx 10 Kingsbridge International High SchoolBronx 10 International School for Liberal Arts
Bronx 11Academy for Scholarship and Entrepreneurship:
A College Board SchoolBronx 11 Globe School for Environmental ResearchBronx 11 The Forward SchoolBronx 11 The Young Scholars Academy of The BronxBronx 11 New World High SchoolBronx 11 Sports Professions High SchoolBronx 12 Mott Hall VBronx 12 New Day AcademyBronx 12 The Metropolitan High SchoolBronx 12 Explorations AcademyBronx 12 Fannie Lou Hamer Middle SchoolBronx 12 The School of Science and Applied Learning
Brooklyn 13Urban Assembly Academy of Business and
Community DevelopmentBrooklyn 13 Urban Assembly High School of Music and Art at Water’s EdgeBrooklyn 14 Foundations AcademyBrooklyn 14 The Urban Assembly School for the Urban EnvironmentBrooklyn 17 Middle School for Academic and Social ExcellenceBrooklyn 17 Ebbets Field Middle SchoolBrooklyn 17 Elijah Stroud Middle School
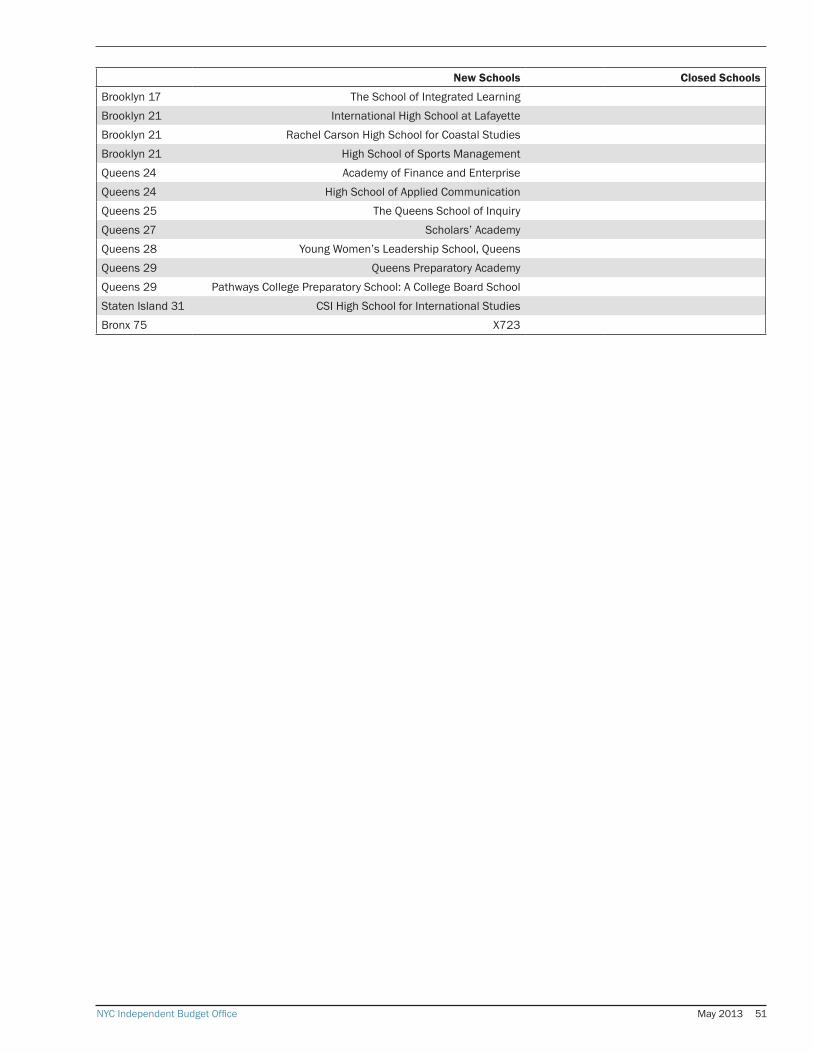
NYC Independent Budget Office May 2013 51
New Schools Closed Schools
Brooklyn 17 The School of Integrated LearningBrooklyn 21 International High School at LafayetteBrooklyn 21 Rachel Carson High School for Coastal StudiesBrooklyn 21 High School of Sports ManagementQueens 24 Academy of Finance and EnterpriseQueens 24 High School of Applied CommunicationQueens 25 The Queens School of InquiryQueens 27 Scholars’ AcademyQueens 28 Young Women’s Leadership School, QueensQueens 29 Queens Preparatory AcademyQueens 29 Pathways College Preparatory School: A College Board SchoolStaten Island 31 CSI High School for International StudiesBronx 75 X723
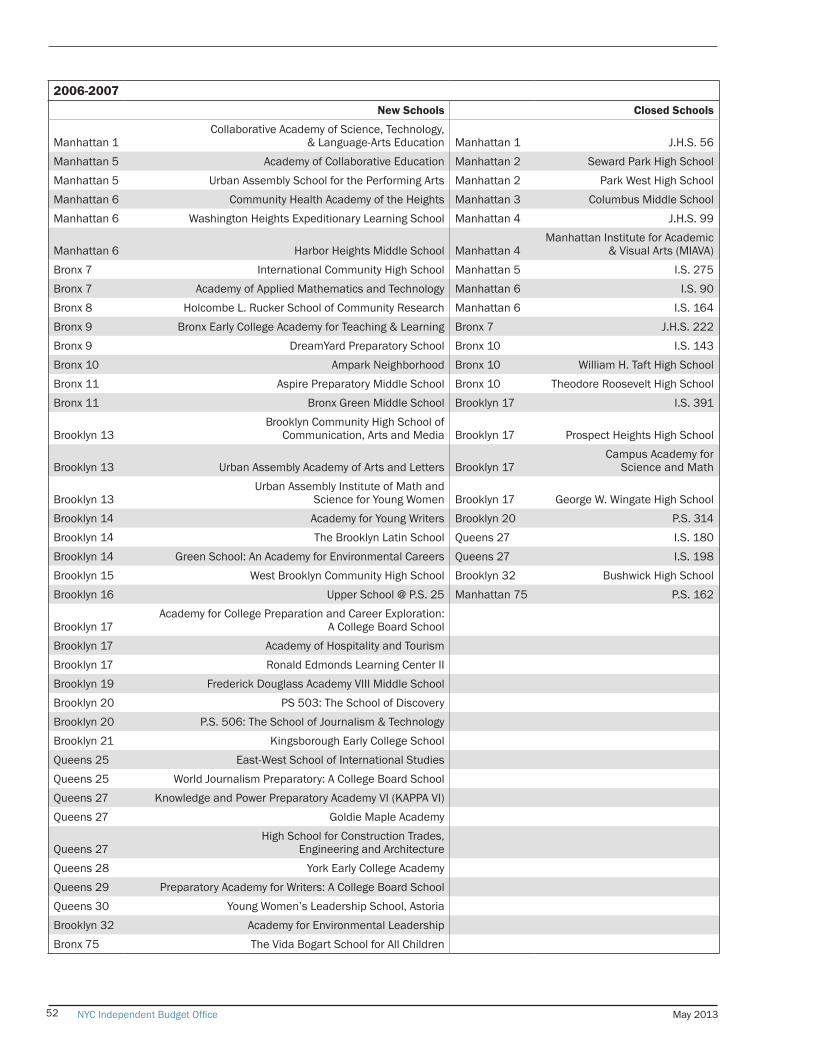
NYC Independent Budget Office May 201352
2006-2007New Schools Closed Schools
Manhattan 1Collaborative Academy of Science, Technology,
& Language-Arts Education Manhattan 1 J.H.S. 56Manhattan 5 Academy of Collaborative Education Manhattan 2 Seward Park High SchoolManhattan 5 Urban Assembly School for the Performing Arts Manhattan 2 Park West High SchoolManhattan 6 Community Health Academy of the Heights Manhattan 3 Columbus Middle SchoolManhattan 6 Washington Heights Expeditionary Learning School Manhattan 4 J.H.S. 99
Manhattan 6 Harbor Heights Middle School Manhattan 4Manhattan Institute for Academic
& Visual Arts (MIAVA)Bronx 7 International Community High School Manhattan 5 I.S. 275Bronx 7 Academy of Applied Mathematics and Technology Manhattan 6 I.S. 90Bronx 8 Holcombe L. Rucker School of Community Research Manhattan 6 I.S. 164Bronx 9 Bronx Early College Academy for Teaching & Learning Bronx 7 J.H.S. 222Bronx 9 DreamYard Preparatory School Bronx 10 I.S. 143Bronx 10 Ampark Neighborhood Bronx 10 William H. Taft High SchoolBronx 11 Aspire Preparatory Middle School Bronx 10 Theodore Roosevelt High SchoolBronx 11 Bronx Green Middle School Brooklyn 17 I.S. 391
Brooklyn 13Brooklyn Community High School of
Communication, Arts and Media Brooklyn 17 Prospect Heights High School
Brooklyn 13 Urban Assembly Academy of Arts and Letters Brooklyn 17Campus Academy for
Science and Math
Brooklyn 13Urban Assembly Institute of Math and
Science for Young Women Brooklyn 17 George W. Wingate High SchoolBrooklyn 14 Academy for Young Writers Brooklyn 20 P.S. 314Brooklyn 14 The Brooklyn Latin School Queens 27 I.S. 180Brooklyn 14 Green School: An Academy for Environmental Careers Queens 27 I.S. 198Brooklyn 15 West Brooklyn Community High School Brooklyn 32 Bushwick High SchoolBrooklyn 16 Upper School @ P.S. 25 Manhattan 75 P.S. 162
Brooklyn 17Academy for College Preparation and Career Exploration:
A College Board SchoolBrooklyn 17 Academy of Hospitality and TourismBrooklyn 17 Ronald Edmonds Learning Center IIBrooklyn 19 Frederick Douglass Academy VIII Middle SchoolBrooklyn 20 PS 503: The School of DiscoveryBrooklyn 20 P.S. 506: The School of Journalism & TechnologyBrooklyn 21 Kingsborough Early College SchoolQueens 25 East-West School of International StudiesQueens 25 World Journalism Preparatory: A College Board SchoolQueens 27 Knowledge and Power Preparatory Academy VI (KAPPA VI)Queens 27 Goldie Maple Academy
Queens 27High School for Construction Trades,
Engineering and ArchitectureQueens 28 York Early College AcademyQueens 29 Preparatory Academy for Writers: A College Board SchoolQueens 30 Young Women’s Leadership School, AstoriaBrooklyn 32 Academy for Environmental LeadershipBronx 75 The Vida Bogart School for All Children

NYC Independent Budget Office May 2013 53
2007-2008New Schools Closed Schools
Manhattan 5 Columbia Secondary School Manhattan 4 MIAVAManhattan 5 Academy for Social Action: A College Board School Bronx 7 I.S. 184 Rafael C. Y. MolinaManhattan 6 Washington Heights Academy Bronx 11 J.H.S. 113 Richard R. GreenManhattan 6 Hamilton Heights School Bronx 12 I.S. 158 Theodore GathingsBronx 7 Jill Chaifetz Transfer High School Brooklyn 14 J.H.S. 33 Mark HopkinsBronx 8 Urban Assembly Academy of Civic Engagement Brooklyn 14 Harry Van Arsdale High School
Bronx 8Archimedes Academy for Math,
Science and Technology Applications Brooklyn 17 M.S. 390 Maggie L. WalkerBronx 8 Urban Institute of Mathematics Brooklyn 17 Erasmus Campus-Humanities
Bronx 8 The Bronx Mathematics Preparatory School Brooklyn 17Erasmus Campus-
Business/TechnologyBronx 8 Antonia Pantoja Preparatory Academy: A College Board School Brooklyn 19 Thomas Jefferson High SchoolBronx 8 Bronx Community High School Queens 25 J.H.S. 168 The ParsonsBronx 9 Academy for Language and Technology Queens 29 Springfield Gardens High School
Bronx 10Knowledge and Power Preparatory Academy
International High School (KAPPA) Brooklyn 79 NYC Vocational Training CenterBronx 11 Cornerstone Academy for Social Action Manhattan 79 Auxiliary ServicesBronx 11 School of Diplomacy Manhattan 79 Career Education CenterBronx 12 Urban Assembly School for Wildlife Conservation Queens 79 Offsite Educational Service
Brooklyn 13 Khalil Gibran International Academy Manhattan 79The Program for Pregnant and
Parenting Students
Brooklyn 13Knowledge and Power Preparatory Academy VII Middle School
(KAPPA VII) Bronx 79 Second Opportunity SchoolsBrooklyn 14 Lyons Community SchoolBrooklyn 16 Gotham Professional Arts AcademyBrooklyn 18 It Takes a Village AcademyBrooklyn 18 Brooklyn Generation SchoolBrooklyn 18 Brooklyn Theatre Arts High SchoolBrooklyn 18 Kurt Hahn Expeditionary Learning SchoolBrooklyn 18 Victory Collegiate High SchoolBrooklyn 18 Brooklyn Bridge AcademyBrooklyn 18 East Flatbush Community Research SchoolBrooklyn 18 Middle School for Art and PhilosophyBrooklyn 18 Arts & Media Preparatory AcademyBrooklyn 18 Middle School of Marketing and Legal StudiesBrooklyn 19 Multicultural High SchoolBrooklyn 20 Urban Assembly School for Criminal JusticeBrooklyn 21 Life Academy High School for Film and MusicBrooklyn 21 Expeditionary Learning School for Community LeadersBrooklyn 21 Liberation Diploma PlusQueeens 24 Pan American International High SchoolQueens 25 BELL AcademyQueens 25 North Queens Community High SchoolQueens 29 P.S./I.S. 295
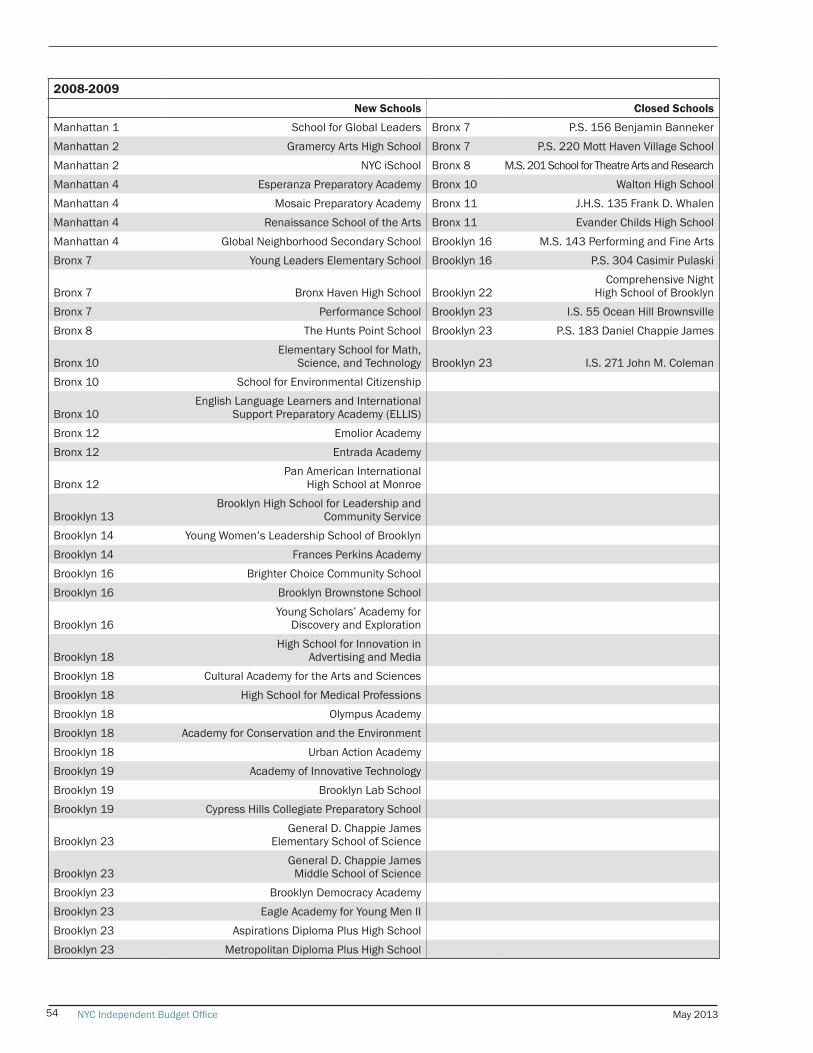
NYC Independent Budget Office May 201354
2008-2009New Schools Closed Schools
Manhattan 1 School for Global Leaders Bronx 7 P.S. 156 Benjamin BannekerManhattan 2 Gramercy Arts High School Bronx 7 P.S. 220 Mott Haven Village SchoolManhattan 2 NYC iSchool Bronx 8 M.S. 201 School for Theatre Arts and ResearchManhattan 4 Esperanza Preparatory Academy Bronx 10 Walton High SchoolManhattan 4 Mosaic Preparatory Academy Bronx 11 J.H.S. 135 Frank D. WhalenManhattan 4 Renaissance School of the Arts Bronx 11 Evander Childs High SchoolManhattan 4 Global Neighborhood Secondary School Brooklyn 16 M.S. 143 Performing and Fine ArtsBronx 7 Young Leaders Elementary School Brooklyn 16 P.S. 304 Casimir Pulaski
Bronx 7 Bronx Haven High School Brooklyn 22Comprehensive Night
High School of BrooklynBronx 7 Performance School Brooklyn 23 I.S. 55 Ocean Hill BrownsvilleBronx 8 The Hunts Point School Brooklyn 23 P.S. 183 Daniel Chappie James
Bronx 10Elementary School for Math,
Science, and Technology Brooklyn 23 I.S. 271 John M. ColemanBronx 10 School for Environmental Citizenship
Bronx 10English Language Learners and International
Support Preparatory Academy (ELLIS)Bronx 12 Emolior AcademyBronx 12 Entrada Academy
Bronx 12Pan American International
High School at Monroe
Brooklyn 13Brooklyn High School for Leadership and
Community ServiceBrooklyn 14 Young Women’s Leadership School of BrooklynBrooklyn 14 Frances Perkins AcademyBrooklyn 16 Brighter Choice Community SchoolBrooklyn 16 Brooklyn Brownstone School
Brooklyn 16Young Scholars’ Academy for
Discovery and Exploration
Brooklyn 18High School for Innovation in
Advertising and MediaBrooklyn 18 Cultural Academy for the Arts and SciencesBrooklyn 18 High School for Medical ProfessionsBrooklyn 18 Olympus AcademyBrooklyn 18 Academy for Conservation and the EnvironmentBrooklyn 18 Urban Action AcademyBrooklyn 19 Academy of Innovative TechnologyBrooklyn 19 Brooklyn Lab SchoolBrooklyn 19 Cypress Hills Collegiate Preparatory School
Brooklyn 23General D. Chappie James
Elementary School of Science
Brooklyn 23General D. Chappie James
Middle School of ScienceBrooklyn 23 Brooklyn Democracy AcademyBrooklyn 23 Eagle Academy for Young Men IIBrooklyn 23 Aspirations Diploma Plus High SchoolBrooklyn 23 Metropolitan Diploma Plus High School

NYC Independent Budget Office May 2013 55
New Schools Closed Schools
Queens 24 Civic Leadership AcademyQueens 24 Bard High School Early College IIQueens 24 Learners and LeadersQueens 24 Pioneer AcademyQueens 24 VOYAGES PreparatoryQueens 25 The Active Learning Elementary SchoolQueens 27 Queens High School for
Information, Research, and TechnologyQueens 27 New York City Academy for Discovery
Queens 27Robert H. Goddard High School of
Communication Arts and Technology
Queens 27Academy of Medical Technology:
A College Board SchoolQueens 28 The Academy for Excellence Through the ArtsQueens 28 Queens Collegiate: A College Board SchoolQueens 30 Academy for Careers in Television and FilmStaten Island 31 Marsh Avenue School for Expeditionary LearningStaten Island 31 Gaynor McCown Expeditionary Learning SchoolStaten Island 31 P.S. 65 The Academy of Innovative Learning

NYC Independent Budget Office May 201356
2009-2010New Schools Closed Schools
Manhattan 2 Yorkville Community School Manhattan 5Powell Middle School for Law &
Social JusticeManhattan 2 Battery Park City School Bronx 8 I.S. 174 Eugene T. MaleskaManhattan 2 Manhattan Business Academy Bronx 8 I.S. 192 Piagentini-JonesManhattan 2 Business of Sports School Bronx 8 Adlai E. Stevenson High SchoolManhattan 2 Emma Lazarus High School Bronx 8 New School for Arts and ScienceManhattan 2 Spruce Street School Brooklyn 13 J.H.S. 117 Francis Scott KeyManhattan 2 The High School for Language and Diplomacy Brooklyn 13 J.H.S. 258 David RugglesManhattan 2 Quest to Learn Brooklyn 14 J.H.S. 49 William J. GaynorManhattan 3 The Urban Assembly School for Green Careers Brooklyn 18 I.S. 232 The WinthropManhattan 3 The Global Learning Collaborative Brooklyn 18 I.S. 252 Arthur S. SommersManhattan 3 Innovation Diploma PlusManhattan 3 West Prep AcademyManhattan 3 Special Music SchoolMahnattan 4 Global Technology PreparatoryManhattan 5 The Urban Assembly Institute for New TechnologiesManhatttan 6 High School for Excellence and InnovationBronx 8 Soundview Academy for Culture and ScholarshipBronx 8 Mott Hall Community SchoolBronx 9 The Family SchoolBronx 9 Grant Avenue Elementary SchoolBronx 9 Science and Technology Academy: A Mott Hall SchoolBronx 9 Sheridan Academy for Young LeadersBronx 10 Creston AcademyBronx 10 East Fordham Academy for the ArtsBronx 11 Baychester AcademyBronx 11 Cornerstone Academy for Social Action Middle School (CASA)Bronx 11 Pelham Academy of Academics and Community EngagementBronx 12 Urban Scholars Community SchoolBronx 12 The Cinema SchoolBronx 12 Bronx Career and College Preparatory High School
Brooklyn 13City Polytechnic High School of
Engineering, Architecture, and TechnologyBrooklyn 15 Sunset Park High SchoolBrooklyn 15 Red Hook Neighborhood SchoolBrooklyn 16 The Brooklyn Academy of Global FinanceBrooklyn 18 The Science and Medicine Middle SchoolBrooklyn 18 East Brooklyn Community High SchoolBrooklyn 19 East New York Elementary School of ExcellenceBrooklyn 19 East New York Middle School of Excellence
Brooklyn 19The School for Classics: An Academy of
Thinkers, Writers, and PerformersBrooklyn 20 The Academy of Talented ScholarsBrooklyn 20 Brooklyn School of InquiryQueens 27 Waterside Children’s Studio SchoolQueens 27 Waterside School for LeadershipQueens 27 Village AcademyStaten Island 31 Staten Island School of Civic Leadership
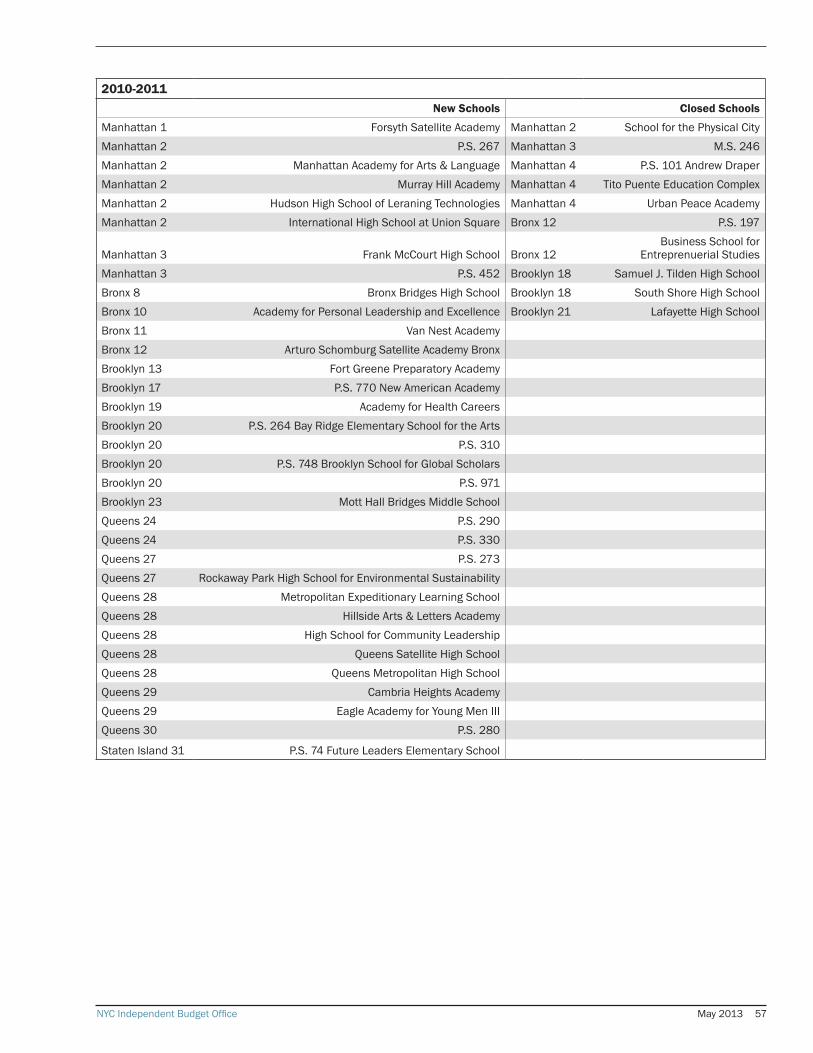
NYC Independent Budget Office May 2013 57
2010-2011New Schools Closed Schools
Manhattan 1 Forsyth Satellite Academy Manhattan 2 School for the Physical City Manhattan 2 P.S. 267 Manhattan 3 M.S. 246Manhattan 2 Manhattan Academy for Arts & Language Manhattan 4 P.S. 101 Andrew DraperManhattan 2 Murray Hill Academy Manhattan 4 Tito Puente Education ComplexManhattan 2 Hudson High School of Leraning Technologies Manhattan 4 Urban Peace Academy Manhattan 2 International High School at Union Square Bronx 12 P.S. 197
Manhattan 3 Frank McCourt High School Bronx 12Business School for
Entreprenuerial StudiesManhattan 3 P.S. 452 Brooklyn 18 Samuel J. Tilden High SchoolBronx 8 Bronx Bridges High School Brooklyn 18 South Shore High SchoolBronx 10 Academy for Personal Leadership and Excellence Brooklyn 21 Lafayette High SchoolBronx 11 Van Nest AcademyBronx 12 Arturo Schomburg Satellite Academy BronxBrooklyn 13 Fort Greene Preparatory AcademyBrooklyn 17 P.S. 770 New American AcademyBrooklyn 19 Academy for Health CareersBrooklyn 20 P.S. 264 Bay Ridge Elementary School for the ArtsBrooklyn 20 P.S. 310Brooklyn 20 P.S. 748 Brooklyn School for Global ScholarsBrooklyn 20 P.S. 971Brooklyn 23 Mott Hall Bridges Middle SchoolQueens 24 P.S. 290Queens 24 P.S. 330Queens 27 P.S. 273Queens 27 Rockaway Park High School for Environmental SustainabilityQueens 28 Metropolitan Expeditionary Learning SchoolQueens 28 Hillside Arts & Letters AcademyQueens 28 High School for Community LeadershipQueens 28 Queens Satellite High SchoolQueens 28 Queens Metropolitan High SchoolQueens 29 Cambria Heights AcademyQueens 29 Eagle Academy for Young Men IIIQueens 30 P.S. 280
Staten Island 31 P.S. 74 Future Leaders Elementary School

NYC Independent Budget Office May 201358
2011-2012New Schools Closed Schools
Manhattan 2 Urban Assembly Gateway School for Technology Manhattan 3 J.H.S. 44 William J O’Shea
Manhattan 5 New Design Middle School Manhattan 5Knowledge and Power Preparatory
Academy II (KAPPA II)Manhattan 5 Teachers College Community School Manhattan 5 Academy of Collaborative EducationBronx 7 Bronx Design and Construction Academy Manhattan 6 M.S. 321 MinervaBronx 8 Bronx Arena High School Bronx 9 P.S. 90 George Meany Bronx 10 Crotona International High School Bronx 9 J.H.S. 166 Roberto ClementeBronx 11 Bronxdale High School Bronx 10 P.S. 79 CrestonBronx 11 High School for Language and Innovation Bronx 10 M.S. 399Bronx 11 One World Middle School at Edenwald Bronx 12 Bronx Coalition Community School
Bronx 11 Baychester Middle School Brooklyn 15Agnes Y. Humphrey School
for LeadershipBronx 12 Bronx Envision Academy Brooklyn 18 Canarsie High SchoolBronx 12 The Metropolitan Soundview High School Brooklyn 19 P.S. 72 Annette P. Goldman
Bronx 12 Archer Elementary School Brooklyn 23EBC/ENY High School for
Public Safety & LawBronx 12 P.S. 536 Queens 27 P.S. 225 SeasideBrooklyn 15 Brooklyn Frontiers High School Queens 27 Far Rockaway High SchoolBrooklyn 15 Millenium Brooklyn
Brooklyn 17Pathways in Technology
Early College High School (P-Tech)Brooklyn 19 The Fresh Creek SchoolBrooklyn 23 Christopher Avenue Community SchoolQueens 24 Maspeth High SchoolQueens 27 Rockaway Collegiate High SchoolQueens 28 Jamaica Gateway to the SciencesQueens 28 P.S. 354Queens 29 Collaborative Arts Middle SchoolQueens 29 Community Voices Middle SchoolBrooklyn 32 Brooklyn School for Math and ResearchQueens 79 GED PlusSOURCE: Analysis of Department of Education data
New York City Independent Budget Offce

This report has been prepared by:Mahbuba Chowdhury
Gretchen JohnsonJoydeep Roy
Yolanda SmithSarita Subramanian
Asa WilksRaymond Domanico, Director of Education Research

IBONew York City
Independent Budget Office
Ronnie Lowenstein, Director110 William St., 14th Floor • New York, NY 10038Tel. (212) 442-0632 • Fax (212) [email protected] • www.ibo.nyc.ny.usTwitter RSS Facebook [email protected]