new value-creating solutions starting from iotcover photo: a quote from the catalog“ fuji electric...
TRANSCRIPT

New Value-Creating Solutions Starting From IoT
Printed on recycled paper
Whole Number 262, ISSN 0429-8284
2018Vol.64 No. 3
FU
JI EL
EC
TR
IC R
EV
IEW
New
Valu
e-Creatin
g S
olu
tion
s Startin
g F
rom
IoT
Vol.64 No.3 2018

Cover Photo:A quote from the catalog “Fuji Electric System Solutions”
32018Vol.64 No. New Value-Creating Solutions Starting From IoT
The fundamental value of the IoT is in connecting everything to the Internet, gathering data to create new value. Today, a variety of IoT solutions have been launched as key technologies to address vari-ous challenges in society, such as enhancing product quality, improving productivity and reforming work style. These are expected to further spread in the future.
Fuji Electric has off ered solutions to optimize energy management and operation of facilities and equipment, and it is accelerating its eff orts to create higher customer value while putting the IoT into practical use.
In this Issue, we present our new value-creating solutions using the IoT. We also introduce the IoT platforms to effi ciently implement them, together with the data analytics that perform analysis, prediction and optimization.
FUJI ELECTRIC REVIEW vol.64 no.3 2018date of issue: September 30, 2018
editor-in-chief and publisher KONDO ShiroCorporate R & D HeadquartersFuji Electric Co., Ltd.Gate City Ohsaki, East Tower, 11-2, Osaki 1-chome, Shinagawa-ku,Tokyo 141-0032, Japanhttp://www.fujielectric.co.jp
editorial offi ce Fuji Electric Journal Editorial Offi cec/o Fuji Offi ce & Life Service Co., Ltd.1, Fujimachi, Hino-shi, Tokyo 191-8502, Japan
Fuji Electric Co., Ltd. reserves all rights concerning the republication and publication after translation into other languages of articles appearing herein.All brand names and product names in this journal might be trademarks or registered trademarks of their respective companies.The original Japanese version of this journal is “FUJI ELECTRIC JOURNAL” vol.91 no.3.
AmericaFuji Electric Corp. of America
Sales of electrical machinery and equipment, semiconductor devices, drive control equipment, and devices
Tel +1-732-560-9410URL https://americas.fujielectric.com/
Reliable Turbine Services LLCRepair and maintenance of steam turbines, generators, and peripheral equipment
Tel +1-573-468-4045 Fuji SEMEC Inc.
Manufacture and sales of door opening and closing systemsTel +1-450-641-4811
AsiaFuji Electric Asia Pacifi c Pte. Ltd.
Sales of electrical distribution and control equipment, drive control equipment, and semiconductor devices
Tel +65-6533-0014URL http://www.sg.fujielectric.com/
Fuji SMBE Pte. Ltd.Manufacture, sales, and services relating to low-voltage power distribu-tion board(switchgear, control equipment)
Tel +65-6756-0988 URL http://smbe.fujielectric.com/
Fuji Electric (Thailand) Co., Ltd.Sales and engineering of electric substation equipment, control panels, and other electric equipment
Tel +66-2-210-0615 URL http://www.th.fujielectric.com/en/
Fuji Electric Manufacturing (Thailand) Co., Ltd.Manufacture and sales of inverters (LV/MV), power systems (UPS, PCS, switching power supply systems), electric substation equipment (GIS) and vending machines
Tel +66-2-5292178 Fuji Tusco Co., Ltd.
Manufacture and sales of Power Transformers, Distribution Transformers and Cast Resin Transformers
Tel +66-2324-0100 URL http://www.ftu.fujielectric.com/
Fuji Electric Vietnam Co.,Ltd. *Sales of electrical distribution and control equipment and drive control equipment
Tel +84-24-3935-1593 URL http://www.vn.fujielectric.com/en/
Fuji Furukawa E&C (Vietnam) Co., Ltd. *Engineering and construction of mechanics and electrical works
Tel +84-4-3755-5067 Fuji CAC Joint Stock Company
Provide the Solution for Electrical and Process Control SystemTel +84-28-3742-0959 URL www.fujicac.com
PT. Fuji Electric IndonesiaSales of inverters, servos, UPS, tools, and other component products
Tel +62 21 574-4571 URL http://www.id.fujielectric.com/
Fuji Electric India Pvt. Ltd.Sales of drive control equipment and semiconductor devices
Tel +91-22-4010 4870 URL http://www.fujielectric.co.in
Fuji Electric Philippines, Inc.Manufacture of semiconductor devices
Tel +63-2-844-6183 Fuji Electric (Malaysia) Sdn. Bhd.
Manufacture of magnetic disk and aluminum substrate for magnetic disk Tel +60-4-403-1111 URL http://www.fujielectric.com.my/
Fuji Furukawa E&C (Malaysia) Sdn. Bhd. *Engineering and construction of mechanics and electrical works
Tel +60-3-4297-5322
Fuji Electric Taiwan Co., Ltd.Sales of semiconductor devices, electrical distribution and control equipment, and drive control equipment
Tel +886-2-2511-1820 Fuji Electric Korea Co., Ltd.
Sales of power distribution and control equipment, drive control equip-ment, rotators, high-voltage inverters, electronic control panels, medium- and large-sized UPS, and measurement equipment
Tel +82-2-780-5011 URL http://www.fujielectric.co.kr/
Fuji Electric Co.,Ltd. (Middle East Branch Offi ce)Promotion of electrical products for the electrical utilities and the indus-trial plants
Tel +973-17 564 569
Fuji Electric Co., Ltd. (Myanmar Branch Offi ce)Providing research, feasibility studies, Liaison services
Tel +95-1-382714
Representative offi ce of Fujielectric Co., Ltd. (Cambodia)Providing research, feasibility studies, Liaison services
Tel +855-(0)23-964-070
EuropeFuji Electric Europe GmbH
Sales of electrical/electronic machinery and components Tel +49-69-6690290 URL https://www.fujielectric-europe.com/
Fuji Electric France S.A.SManufacture and sales of measurement and control devices
Tel +33-4-73-98-26-98 URL https://www.fujielectric.fr/en
Fuji N2telligence GmbH *Sales and engineering of fuel cells and peripheral equipment
Tel +49 (0) 3841 758 4500
ChinaFuji Electric (China) Co., Ltd.
Sales of locally manufactured or imported products in China, and export of locally manufactured products
Tel +86-21-5496-1177 URL http://www.fujielectric.com.cn/
Shanghai Electric Fuji Electric Power Technology (Wuxi) Co., Ltd.
Research and development for, design and manufacture of , and provi-sion of consulting and services for electric drive products, equipment for industrial automation control systems, control facilities for wind power generation and photovoltaic power generation, uninterruptible power systems, and power electronics products
Tel +86-510-8815-9229
Wuxi Fuji Electric FA Co., Ltd.Manufacture and sales of low/high-voltage inverters, temperature controllers, gas analyzers, and UPS
Tel +86-510-8815-2088
Fuji Electric (Changshu) Co., Ltd.Manufacture and sales of electromagnetic contactors and thermal relays
Tel +86-512-5284-5642 URL http://www.fujielectric.com.cn/csfe/
Fuji Electric (Zhuhai) Co., Ltd.Manufacture and sales of industrial electric heating devices
Tel +86-756-7267-861 URL http://www.fujielectric.com.cn/fez/
Fuji Electric (Shenzhen) Co., Ltd.Manufacture and sales of photoconductors, semiconductor devices and currency handling equipment
Tel +86-755-2734-2910 URL http://www.szfujielectric.com.cn/
Fuji Electric Dalian Co., Ltd.Manufacture of low-voltage circuit breakers
Tel +86-411-8762-2000
Fuji Electric Motor (Dalian) Co., Ltd.Manufacture of industrial motors
Tel +86-411-8763-6555
Dailan Fuji Bingshan Vending Machine Co.,Ltd. Development, manufacture, sales, servicing, overhauling, and installa-tion of vending machines, and related consulting
Tel +86-411-8754-5798
Fuji Electric (Hangzhou) Software Co., Ltd.Development of vending machine-related control software and develop-ment of management software
Tel +86-571-8821-1661 URL http://www.fujielectric.com.cn/fhs/
Fuji Electric FA (Asia) Co., Ltd.Sales of electrical distribution and control equipment
Tel +852-2311-8282
Fuji Electric Hong Kong Co., Ltd.Sales of semiconductor devices and photoconductors
Tel +852-2664-8699 URL http://www.hk.fujielectric.com/en/
Hoei Hong Kong Co., Ltd.Sales of electrical/electronic components
Tel +852-2369-8186 URL http://www.hoei.com.hk/
Overseas Subsidiaries* Non-consolidated subsidiaries

Contents
FUJI ELECTRIC REVIEW vol.64 no.3 2018
[Preface] In the Era When Everything Is Connected 102KANO, Manabu
New Value-Creating Solutions Starting From IoT
New Value-Creating Solutions Starting From IoT: 103Current Status and Future OutlookYASUKAWA, Yukio YASUKAWA, Kazuyuki FUKUZUMI, Mitsunori
“EMS-Package LITE” Energy Optimization Package for 114Power Generation FacilitiesNARUMI, Katsunori TANGE, Yoshio SANAGI, Kenta
Creating Value in Data with “OnePackEdge System” 118HOSHINO, Jun FUJIKAWA, Yasutaka TOYODA, Kenro
New Information Service Solutions Utilizing Vending Machines 127TAKAMATSU, Eiji MORITA, Masahiro TOKUMASU, Takumi
Smart Showcase That Contributes to Labor-Saving of Store Work 132MATSUI, Atsushi FURUI, Tatsuya TANAKA, Yoshikazu
Manufacturing Reform Utilizing IoT Technology 122ONO, Masabumi YAMADA, Takanori NARUSE, Mitsuhiro
“F-COOL NEO” Energy-Saving Hybrid Air-Conditioning Unit 159Indirectly Using Outside Air (Cooling Capacity 56 kW)
“MONITOUCH TS1000 Smart Series” Programmable Operator 162Interface, Enhancing Usability and Visibility
New Products
Server Systems Utilizing General-Purpose Cloud Service 140MIYAZAKI, Tsuyoshi KITAMURA, Takashi TAKEUCHI, Osamu
Edge Controllers Connecting Field Devices and Cyberspace 144UEDA, Motoyuki SATO, Yoshikuni KADOSAKI, Toyofumi
Data Analytics as Core of Value Creation 148IIZAKA, Tatsuya DAITO, Takeshi MATSUI, Tetsuro
IoT System Security 154UMEZAKI, Kazuya
Neural Network, Deep Learning 158
Supplemental Explanation
Improvement of Energy Efficiency According to International 109Standards–EMS Add-On Functions Using Data AnalyticsTATTA, Naoto SUZUKI, Satoshi MATSUMOTO, Haruyuki
Value-Creating Solutions
Overview of Fuji Electric IoT Platform 136YAMADA, Takao FUKUZUMI, Mitsunori
IoT Platform Supporting Value Creation
102 FUJI ELECTRIC REVIEW vol.64 no.3 2018
In the Era When Everything Is Connected
The word “Internet” takes me back to when I was still a graduate student. It was the early 1990s, and not many people, even in the university, were aware of emails or the worldwide web (WWW). I with my seniors installed yellow cables (10BASE5) in the univer-sity building to connect laboratory work stations to the network and browse only a few websites that were avail-able using NCSA MOSAIC (a web browser developed at the University of Illinois). Those days, almost nothing was connected to the Internet, except for those expen-sive workstations. The current digital native genera-tion may not even be able to imagine such a ridiculously inconvenient world. Certainly, it was hard task to orga-nize work; papers for international conferences arrived by airmail, and we would have to organize them manu-ally. Conversely, if I went on an overseas business trip, I would be free from work-related requests. It was such a slow-paced era.
More than 20 years have passed since then, and various things are connected to the Internet. Not only that, cloud computing has enabled us to analyze big data on the Internet. These systems are today known as the Internet of Things (IoT). It is attracting much attention as potential technology for social revolution and business opportunities. According to the Gartner Hype Cycle 2018, IoT platforms have passed the period of Peak of Inflated Expectations and entered the Trough of Disillusionment stage.
The smart watch, the latest popular item, is a good example of the personal IoT. It gathers and analyzes various data with various sensors such as acceleration, gyro, pulse and GPS, and gives us advice for optimal feedback on exercise. More recently, we also hear more often about human microchip implants. Sweden, where the population is approximately 10 million, is keenly pursuing this new technology, with several thousand people already having a microchip implanted. In 2017, the Swedish State-owned Railway Company introduced a system that allows you to get on a train with an im-planted microchip. This implanted device can gather biometric data more accurately than wearable devices such as a smart watch. The microchip can store all the smart cards inside your body, and it also serves as highly
valuable sensors to monitor the state of your health. When information about humans is connected to the net-work, it will evolve into the Internet of Humans (IoH). While there are security and ethical issues still to be dis-cussed, the technology is advancing steadily, backed by human curiosity. The era of the Internet of Everything (IoE) will be coming where not only objects, but humans, and everything else are connected to the network. New innovative services will be provided and change our life-styles significantly. It seems a completely different age for me compared to when I installed yellow cables.
This conjures up a picture full of hopes and expec-tations, but I fear that some of us may struggle to catch these giant waves of change in the fields of manufactur-ing and medical care in Japan. For example, it is said that explosion-proof regulations are preventing the in-troduction of IoT devices at manufacturing sites. Even if the government encourages smartification, Japan-specific regulations are hindering such an initiative. Thus, these kinds of structural issues should be addressed promptly and wisely, along with technological issues.
The vast amount of data taken from humans and things would serve for nothing if it was merely stored at a massive data center. It is thus necessary to develop a system that extracts valuable information from the data and prompts appropriate actions. While I do not agree with the latest loose trend to consider multiple regres-sion analysis as a part of artificial intelligence, it is true that machine learning technology, including deep learn-ing, is making remarkable progress so that extremely complex data analysis can be done by computers. How-ever, useful tools are not so useful if there is no one who can leverage them. It will not be easy to change the pol-icy of organizations that had been rather indifferent to data analyses until recently. Fostering talented people is one of the major challenges to be addressed.
Facing the world that is oriented to the Analytics of Everything (AoE), there is something we cannot leave to computers yet; it is to determine the visions to be aimed at. In the world where things and humans are connected to the network, how do we want society to be, and what should we do to realize that society? At this time of transformation, we will be asked to have determination and act, to provide value to society, and to think about what value is to be created, with wide perspectives, rather than settling for a local optimization.
KANO, Manabu *
* Dr. Eng., Professor, Department of Systems Science, Graduate School of Informatics, Kyoto University
Preface

103
issu
e: N
ew V
alue
-Cre
atin
g So
lutio
ns S
tarti
ng F
rom
IoT
CurrentStatus and
Future Outlook
1. Introduction
The general meaning of the Internet of Things (IoT)*1 is that anything is connected to the Internet and data are shared and visualized. Its essence is to generate new customer values from the collected data and contribute to society with the values. Currently, various solutions have been disclosed as key technology not only for quality improvement and optimization but also for solutions to social is-sues such as work style reform, and greater usage of IoT is expected in the future.
Fuji Electric has been providing solutions for over 40 years that contribute to power stability and optimization, factory productivity improvement and energy savings, clean energy supply, food safety and security, etc. It has done this by continuing to innovate in the fields of energy and environmental technology and using competitive components and sophisticated control technology. Today we are more quickly implementing efforts to create higher customer value*2 by practically applying IoT.
This paper describes the current status and fu-ture outlook for efforts for new value-creating solu-tions with the use of such IoT by Fuji Electric.
2. World Trend in Customer Value-Creating Technology with Use of IoT
IoT and value creation utilizing IoT has been studied actively on a global scale.
This chapter describes the trends in Germany, the United States and Japan.
2.1 GermanyIndustrie 4.0, an issue tackled since 2013 in
Germany, has changed its direction toward expan-sion from the viewpoint of value creation. It has gone from searching for a place to apply the concept to value creation and value improvement by cooper-ation and linkage with other fields. Hence, its con-cept has matured and proliferated steadily.
Linkage not only within Germany but also with the United States and China has been developed from the viewpoint of cooperation and linkage. A cooperation agreement with Japan was made in March 2015, and it has led to specific activities such issuing a joint statement.
In addition, a study on standardizing technol-ogy is also underway. It is remarkable that pro-posals for using the existing and specific standard-izing technology, represented by the information model, OPC-UA and AutomationML, are progress-ing steadily.
2.2 United StatesThe Industrial Internet Consortium (IIC) es-
tablished in 2014 under a civilian initiative has steadily increased its members. More than 260 companies including Fuji Electric and other Japanese companies have joined the consortium.
The 2 main activities in IIC and their statuses are as follows:(1) Study on technology and security architecture
Discussions about Reference Architecture, dis-closed also to non-members, are held continuously. Its own level of maturity has been developed and peripheral detailed technology arrangements are making progress. Security-related discussions have been active and other organizations are paying at-tention to the situation.
YASUKAWA, Yukio * YASUKAWA, Kazuyuki * FUKUZUMI, Mitsunori *
New Value-Creating Solutions Starting From IoT: Current Status and Future Outlook
* Corporate R&D Headquarters, Fuji Electric Co., Ltd.
*1: IoTAbbreviation of the Internet of Things.
In a narrow sense, it refers to a system where anything is connected to the Inter-net and information exchange is mutually executed. Currently it refers to the whole
service realized with the system that gener-ates new values. This concept comes from the fact that we now have Internet connec-tion and data distribution and control at low cost along with information communication technology innovation.
*2: Customer valuesIt refers to values recognized by cus-
tomers to be appropriate for products, ser-vices, human resources and images.

104 FUJI ELECTRIC REVIEW vol.64 no.3 2018
(2) Field verification (test bed)The ecosystem*3, centered on IIC members, is
formed and architectures and concepts are dem-onstrated and verified. More than 80 companies participate and test beds are proposed actively, and 29 cases have been proposed and approved as of May 2018. Some cases indicated efforts beyond the frame of simple demonstration and verification. One example is “Intelligent Urban Water Supply” test bed, which aimed for water-supply operation optimization and improvement, where the demon-stration target has been commercialized and many providers have actually verified the possibility of its introduction. In addition, a liaison conclusion has been completed with 38 organizations who partici-pate in Industrie 4.0 as of May 2018, expanding the connection with other organizations.
2.3 JapanIn March 2017 in Japan, the Ministry
of Economy, Trade and Industry proposed the Connected Industries concept as the direction for industries to head in. Each organization continues activities to realize this concept, and some organiza-tions such as the Robot Revolution & Industrial IoT Initiative and the Industrial Value Chain Initiative disclose their activity results.
In addition, to use results and experiences in field systems that are a Japanese advantage, a study on “Edge Computing” that creates values in
high-speed near equipment or machines without the Internet and LAN is underway. Ecosystems such as the “Field System” and the “Edgecross Consortium” have been formed since 2017.
3. Fuji Electric’s IoT and Efforts for Customer Value Creation
3.1 Position of IoT in Fuji ElectricFuji Electric positions power semiconductors
and sensors as key devices and has a line-up of high-performance and high-functionality compo-nents that use the key devices. Furthermore, we contribute to the creation of responsible and sus-tainable societies through power generation, energy solutions, industry solutions, food distribution and other fields with these components, engineering technology, service technology, advanced optimal control technology and various solution technolo-gies. We position the IoT system, which is a frame-work to digitalize any information of customer fields and create new customer values in cyberspace, at the core of the system solutions as shown in Fig. 1.
3.2 Customer value and creating technologyFuji Electric classifies customer values in indi-
vidual manufacturing industries into 4 categories: energy use optimization, facility operation optimi-zation, operation optimization and human resource utilization optimization (see Fig. 2).
*3: EcosystemOriginally it meant an “ecological
system” in biology. In management and IT fields, it is a system where multiple compa-
nies establish a partnership in product de-velopment and business activities for coexis-tence and co-prosperity beyond the industry frame and boundary utilizing each other’s
technologies and capital, involving develop-ers, agencies, sales shops, advertising me-dia, consumers and societies.
Power Generation
Clean energy
Power generation,New energy
Food and Beverage Distribution
Labor saving and energy savingLife convenience improvement
Vending machines, Store facilities
Energy Solutions
Engineering services
Components
IoT systems
Energy stable supply and optimization
Energy management
Rolling stock, EV, Distribution,
Radiation control
Facilities,Power supply
Controllers
Key devices
Power semiconductors Sensors
Power electronics equipment
Measuring equipmentDevices
Industry Solutions
Automation and energy saving
Factory automation, Process automation
Optimization control
System solutions
IoT system by Fuji Electric
Optimization
Feedback
Data collection
Facility, line, infrastructure, etc.
Visualization
Data Analytics (Analysis)
Big data
Value creation
Cyberspace
FieldReal++
Real
Digital
Intelligence
Fig.1 Fuji Electric system solution and IoT positioning

105New Value-Creating Solutions Starting From IoT: Current Status and Future Outlook
issu
e: N
ew V
alue
-Cre
atin
g So
lutio
ns S
tarti
ng F
rom
IoT
The technology to create these values is called data analytics and it consists of 4 technologies: Recognition technology, diagnosis technology, pre-diction technology and optimization technology. We provide a one-stop service from field data collection to customer value creation using data analytics and call the service a vertically integrated service.
Furthermore, the ecosystem, where compa-nies of different industries cooperate with their strengths, generates new values.
3.3 Customer value creation solutionsThis section describes the development cases for
the customer value creation solutions described in Section 3.2.(1) Energy optimization solutions
Reinforcement of energy regulations and stan-
dards has been progressing globally to reduce CO2 emissions as global warming countermeasures. The target value for energy operation efficiency for com-panies has become severer as part of this effort. To achieve the high target, a company must make efforts integrally under a unified control method. ISO 50006, the energy management international standard, specifies that various energy optimiza-tions (energy intensity reduction, energy conversion efficiency improvement, etc.) are managed by a uni-fied method. This is accomplished by defining the energy management unit (EMU) for each building and device which are energy management targets, and then defining the energy intensity*4, operation efficiency and other energy performance indicators (EnPI*5) for each EMU. Fuji Electric has developed an energy management system which conforms to this standard. When the energy intensity worsens, the degree of deviation from the target, etc. can be monitored and energy loss factor analysis, which conventionally has been dependent on experienced engineers, is executed by automatic diagnosis with data-analytic system using result data (refer to “Improvement of Energy Efficiency According to International Standards-EMS Add-On Functions Using Data Analytics” on page 109).
Energy used at steelworks is classified into purchased energy and by product energy generated in production. The most important challenge for energy management in a steelworks is to balance the demand and supply of these energies accord-ing to the production situation and reduce wasted energies. For overseas steelworks, we have devel-oped the “EMS-Package LITE” energy optimization package for power generation facilities that can be introduced and operated at low cost to settle this is-sue. This system automates the act of preparing a demand prediction model and plant model that con-ventionally required trial and error by an expert for several months. Energy management operators in a customer company enter power generation facil-ity information (the number of boilers and turbines, facility characteristics information, etc.) and the past operation result data in the steelworks into an Excel sheet with the specified format. When this Excel sheet is uploaded to the system, data-analytic system automatically generates 6 models (pur-chased power cost, power receiving cost, dissipation
*4: Energy intensityTotal consumption amount of power,
gas, oil and other energies required to pro-duce products of the unit amount. It is used as an index to see the energy saving prog-ress status because it indicates the energy efficiency.
*5: Energy performance indicator (EnPI)Measureable results related to energy
use amount, energy use purpose, and energy efficiency are together called energy perfor-mance. Specifically, they are energy use amount, peak power, energy consumption amount by purpose and various energy ef-
ficiency items. Their quantitative values (or scale) specified by an organization are called energy performance indicators (EnPI). They correspond to a ruler to measure en-ergy performance and any indicators can be used for each purpose at the judgment of the organization.
Vertically Integrated Service
Ecosystem
Customer Values
Bank
Vending Machines
UPS
Data analytics
Optimization of usage of
human resources
Operation optimization
PredictionDiagnosis
New Business
Customer Values
Recognition Optimization
Facility operation
optimizationEnergy use optimization
○Labor time reduction○Taking over
skilled manufactur-ing techniques○Taking over
mainte-nance techniques
○Produc-tivity improve-ment○Yield
improve-ment○Quality
improve-ment
○Having zero unexpected downtime
○Maintenance cost reduction
○Improvement in efficiency of manufactur-ing facility development
○Energy cost reduction○Energy
intensity reduction○Environmen-
tal burden reduction
What will happen?What is the future value?
What is happening?What is the cause?
The property is understood with non-structural data.
What is the optimum state?How is it obtained?
Fig.2 Customer value and creating technology

106 FUJI ELECTRIC REVIEW vol.64 no.3 2018
amount, boiler fuel distribution, turbine steam dis-tribution and turbine bleeding distribution) by im-provement purpose and visualizes the scope for im-provement to display it on a monitor. Furthermore, data-analytic system automatically generates an optimal operation plan for a power generation fa-cility that is required for improvement. When the operator of the power generation facility executes the optimal operation according to this plan, the en-ergy operation efficiency target value can be reached (refer to “‘EMS-Package LITE’ Energy Optimization Package for Power Generation Facilities” on page 114).(2) Labor time reduction solutions
Labor shortages and an increase in person-nel costs are growing in domestic convenience stores with an aging population and lower birth-rate in Japan. It is difficult to immediately make convenience stores unmanned like ones overseas because they mainly have characteristics as a so-cial infrastructure and provide various services; however, labor saving by improving the current work is required. Fuji Electric has been develop-ing element technologies for smart showcases to achieve unmanned stores for labor saving in the future. In convenience stores, generally goods such as rice balls, sandwiches and lunch boxes are displayed while arranged in columns. There are many operations to be executed by a clerk, such as constantly monitoring the state of goods displayed, moving items to the front side when the head item is purchased, refilling and checking the freshness of goods. Smart showcases automatically detect the names, quantity and states of the displayed goods to reduce the work. This system consists of the prod-uct identification technology that uses image rec-ognition technology with a camera and the product position recognition technology that uses the panel sensors using projected capacitive touch panels allo-cated in matrix state on a shelf surface. Especially the quantity and position of goods are recognized while the bottom surface shape of goods is detected with the panel sensor. For rice balls, sandwiches and others whose bottom surface shape differ indi-vidually, data analytics technology removes noise elements for higher recognition accuracy (refer to “Smart Showcase That Contributes to Labor-Saving of Store Work” on page 132).(3) Ecosystem solutions
Fuji Electric has a line-up of digital signage vending machines which display product images on a large display. This digital signage vending machine has a system to download image informa-tion of products to be sold and backgrounds via the Internet. If the vending machine is assumed to be an image display terminal installed inside a build-ing or on a street, it can be applied to various busi-nesses. Accordingly, we have developed the adver-tisement distribution function and demonstrated
the possibility of using it as the advertisement dis-tribution business. This business is the ecosystem that consists of Fuji Electric which provides the dig-ital signage vending machine and the advertisement distribution system, advertising agency, advertise-ment owner, vending machine operator, location owner (railway company, supermarket, hospital, etc.) and consumers. We have mounted a camera to the digital signage vending machine and imple-mented a function to collect market information such as the number, age, gender and visual line of consumers and time in addition to distributing and displaying advertisements. The demonstration test result indicated that this market information was valid for an advertising agency in recruiting adver-tising owners because response of advertising tar-gets could be estimated. In addition, it was found that for a vending machine operator, the informa-tion was valid for predicting sales based on the data and making an appropriate product allocation plan. New values are created with the ecosystem whose core is the vending machine (refer to “New Information Service Solutions Utilizing Vending Machines” on page 127).(4) Manufacturing solutions
Fuji Electric has been tackling quality improve-ment and cost reduction with digitalization and uti-lizing IoT systems for in-house manufacturing (refer to “Manufacturing Reform Utilizing IoT Technology” on page 122).
(a) Digitalization of production preparationDigitalizing product design information al-
lows 3D-CAD and other simulations. Therefore, simulations on a computer are available for manufacturability verification for process design, production line optimal layout design and auto-mation facility software verification, for which ac-tual machine verification was prerequisite. This drastically shortens the time needed to launch a manufacturing line.(b) Quality improvement and labor saving with
data analyticsFor the semiconductor sensor manufactur-
ing process, analyzing the past manufacturing result data with a diagnosis function using data analytics makes it possible to specify the factor of low production yield. For the press process, constantly monitoring various data of a press machine and detecting signs of defects (slug float) with the diagnosis function in the same way al-lows for higher quality and fewer monitoring per-sonnel.(c) Taking over skillful techniques
Welding work often depends on the high skill of experienced engineers. Therefore, welding work is digitalized with various sensing technolo-gies and the data are used for skill education. In addition, a robot for difficult welding work has

107New Value-Creating Solutions Starting From IoT: Current Status and Future Outlook
issu
e: N
ew V
alue
-Cre
atin
g So
lutio
ns S
tarti
ng F
rom
IoT
been developed that uses sensing technology with image recognition to try to improve quality.
(5) IoT platformTo apply IoT systems to various solutions, it is
essential to have a technology base that integrates field data collection technology, data analysis tech-nology and advanced security technology to handle data safely. We have developed an IoT platform as such technology base. Figure 3 shows the IoT plat-form range, with its structure indicated by broken lines. A shortened development period, application portability and differentiation were realized with a combination of open technology such as an open source service and Fuji Electric-unique technologies (refer to “Overview of Fuji Electric IoT Platform” on page 136).
4. Future Outlook
4.1 Data analytics technology expansionThe machine learning-based analysis and rea-
soning technologies can be classified as shown in Fig. 4 with axes of data quality and quantity and analysis result basis. Especially for industrial use purposes, data quality and clearly indicating reason-ing are regarded as important from the viewpoint of safety and reliability. Fuji Electric has focused on this area previously and continues to develop dis-tinctive technologies and tools that can be mastered even by users who are not dedicated data scientists.
4.2 Field side value creationThe main purpose of edge controllers is to se-
curely connect field equipment and other things to
cyberspaces. Furthermore, it is necessary to en-hance data values at the field side (called context data creation) such as by carrying out primary processing of collected data and synchronizing with image data so as to reduce IP network traffic. Fuji Electric has developed “OnePackEdge System” to respond to these requirements (refer to “Creating Value in Data with ‘OnePackEdge System’” on page 118). In the industry and power generation fields, value creation such as diagnosis and analy-sis requires a response performance in milliseconds in many cases. It is impossible to satisfy these requirements via an IP network and cyberspace. Therefore, we satisfy the requirement to create val-ues at the field side by mounting data analytic func-tion to the OnePackEdge System.
4.3 Beyond IoTIoT technologies, which connect things to cy-
berspaces, will develop to the form where things autonomously connect with each other in the future. The definition of things will include activities such as human resources and operations, and will be ex-panded to service*6. For services to be connected with each other, a network as a route, interface to the network (OPC-UA, etc.), information model as a common language between services and the de-scription method (AutomationML, etc.) must be standardized. The IEC and ISO already have been jointly working on Smart Manufacturing-related standardization work. Standardizing interfaces be-tween services allows a manufacturer to select the optimal manufacturing facility of another company
*6: ServiceA method where components are cre-
ated with various operation applications or part of the functions of the applications and a new application system is designed by
selecting and combining the components as needed is called service oriented architec-ture (SOA). The unit of the components is called Service. Although the object concept in the object orientation is included, the
characteristic is that Service has a looser coupling than object so that Service can be coordinated on a network.
Service application
Service application ・ ・ ・ Service
application
IP network
Field equipment, sensors, etc.
Edge controllers
Data analytics
Public cloud service
Service interface
Unique technology
Unique technology
Open technology
Unique technology
Sec
uri
ty (
Inte
rnat
ion
al s
tan
dard
com
plia
nt)
Fig.3 Structure of IoT platform
UnclearReason of
analysis cannot be explained
ClearReason of
analysis can be explained
Quality is importantRelated data are
selected and used
Quantity is importantDirectly using
extremely large data
Rea
son
of a
naly
sis
Applies to faster decision-making
Deep learningVoice recognitionImage recognition
Neural network Support vector
machine
Black box method
Applicable for industrial uses
Several hundred kilobytes Several hundred tera to petabytes
Data quality and quantity
Structuring neural networkMultivariate analysis
Decision treeJIT prediction
White box method
Fig.4 Classification of machine learning
108 FUJI ELECTRIC REVIEW vol.64 no.3 2018
any time and entrust manufacturing according to the order received, for example. Simultaneously, various services can be shared by companies. This means that a company will be able to procure from the outside the innovation that is currently required and easily embed it into a system of its own.
There is an open innovation beyond IoT.
5. Postscript
This paper describes the current status and fu-ture outlook for solutions for new value creation and technical aspects of Fuji Electric while summarizing value creation with IoT which is being developed on a global level.
Fuji Electric will continue to make efforts for customer value creation paying attention to the world standardization trends and concentrating on our unique technology development.
Preferences(1) Kondo, S; Fukuzumi, M. Instrumentation and
Control Solutions in the New Age of the IoT: Current Status and Future Outlook. FUJI ELECTRIC REVIEW. 2016, vol.62, no.3, p.132-140.
(2) “Current Standards Landscape for Smart Manufacturing Systems”. National Institute of Standards and Technology U.S. Department of Commerce. https://dx.doi.org/10.6028/NIST.IR.8107, (accessed 2018-07-20).
(3) “PLATFORM INDUSTRIE 4.0 working paper Aspects of Research Roadmap in Application Scenarios”. Federal Ministry for Economic Affairs and Energy (BMWi), https: / /www.plattform-i40.de / I40 / Redaktion / EN / Downloads / Publikation /aspects-of-the-research-roadmap.pdf?__blob= publicationFile&v=10, (accessed 2018-07-20).

issu
e: N
ew V
alue
-Cre
atin
g So
lutio
ns S
tarti
ng F
rom
IoT
A B S T R A C T
* Power Electronics Systems Business Group, Fuji Electric Co., Ltd.
⁑Corporate R&D Headquarters, Fuji Electric Co., Ltd.
109
1. Introduction
Japan agreed to reduce the greenhouse gases emis-sion by 26% compared to FY2013 by 2030 as the inter-national public promise under “Paris Agreement” in December 2015. Ministry of Economy, Trade and In-dustry decided the energy innovation strategy in April 2016 to achieve the target. They set 35% energy effi-ciency improvement by FY2030, whose level is almost same as post-oil crisis, as the target, with “thorough energy savings” as one pillar of the strategy.
It is predicted that energy demand will increase and energy costs will continue increasing during me-dium and long term globally with the background of expansion in energy usage in developing countries. To support such world circumstances, the international standard ISO 50001 on energy management system (EMS) has been issued and actively introduced by overseas companies in Germany, the United States, China and other countries.
While regulations and standards are strengthened globally, in addition to the energy saving measures for each facility, finer and efficient operation of facilities according to energy demand is being required recently. Company measures of energy efficiency improvement locally or by departments has reached the limitation. Positioning the energy efficiency improvement as com-pany management task and establishing the energy management base to proceed on improvement daily and continuously are required.
This paper presents the current operation tasks by focusing on the energy efficiency improvement with the current EMS and energy saving analysis approach.
TATTA, Naoto * SUZUKI, Satoshi⁑ MATSUMOTO, Haruyuki *
Improvement of Energy Efficiency According to International Standards–EMS Add-On Functions Using Data Analytics
As international regulations and standards become increasingly stringent, Japanese companies are being com-pelled to enhance energy efficiency by the environment situation surrounding them. Fuji Electric has reviewed cur-rent operating and developed new features for our energy management system, leveraging data analytics to improve energy efficiency in compliance with international standards. These features will facilitate the development of the framework of the SDCA cycle to maintain and manage energy-saving activities and will in turn speed up improve-ment, innovating activity and policy management through the PDCA cycle.
Moreover, it describes new functions of EMS that use data analytics, which contribute to the energy opera-tion efficiency improvement according to international standards to settle these issues.
2. Issues in Current Energy Analysis Management System
Fuji Electric has provided the energy analysis management system that uses “MainGATE/PPA” manufacturing result analysis support package (see Fig. 1) to efficiently analyze energy(1).
This package can be used to build a factory energy management system (FEMS) to analyze and manage factory energy by organically combining not only en-ergy measurement data but also operating data of util-ity and production equipment, production output, and other production data. In addition, a building and en-ergy management system (BEMS) can also be built to manage office and office building energy, namely, heat source, transport power, lighting, socket outlets, air conditioning, and other power sources. We have pro-
Power ratio transition screen
Fig.1 “MainGATE/PPA” analysis display example

110 FUJI ELECTRIC REVIEW vol.64 no.3 2018
vided energy analysis templates based on the knowl-edge obtained from long time EMS construction experi-ence to easily build BEMS systems.
Fuji Electric provides an EMS package solution for each of 3 areas below (see Fig. 2).
(a) STEP 1: VisualizationEnergy data collection and visualization
(b) STEP 2: ComprehensionMultiangular analysis of collected result data
(c) STEP 3: OptimizationWhole plant optimization with usage of renew-
able energy, cogeneration and storage batteriesFuji Electric has provided “comprehension” solu-
tions to support improvement of the energy saving ac-tivities cycle (issue extraction from analysis and man-agement and individual measures) by a customer with MainGATE/PPA. However, in many cases, the energy savings activities have not been established and can-not be executed continuously because there are 2 main issues in the operation aspect.(1) Operation issue 1: Analysis operation process of
energy saving activitiesPDCA rules and judgment standards of issue ex-
traction approach for energy efficiency improvement do not take root in the customer.
Furthermore, the human and time resources that can be allocated to analysis operation are limited and knowledge of individuals varies. Therefore, establish-ing and operating the series of energy saving activities analysis and operation process cannot be fixed, such as who sees what information and how the result is evaluated and operated for improvement, even if large amount of data can be collected with a lot of efforts.(2) Operation issue 2: Crossing departments and in-
tegrated energy saving improvement activitiesThe energy saving activities are responsibilities of
energy utility equipment departments related to the energy supply side and activities integrated with the manufacturing departments and operation depart-ments at the energy demand side are not executed.
The energy utility equipment departments would like the energy saving awareness and activities to take root in the manufacturing departments and administra-tion departments; however, a valid measure cannot be found.
In addition, each layer-independent energy sav-ing activities at the site are disturbed because energy management efforts have become one-way forced man-agement requirement. However, user capability and operation system must be depended on when to use the current functions of MainGATE/PPA by Fuji Electric. Therefore, the energy saving issue settlement process (daily management, issue extraction and individual measures) cannot be established in many cases of im-provement activities.
3. “MainGATE/PPA with DD” Energy Operation Efficiency Improvement Package
3.1 Development conceptFuji Electric has developed the new functions for
EMS according to ISO 50006 (energy performance measurement), standard cited from international stan-dard ISO 50001 (EMS) to settle the issues in energy saving activities described in Chapter 2.
For the operation issue 1, we have developed the analysis function for energy loss factors of each en-ergy management unit (organizations, lines, facilities, etc.) specified according to the management frame of ISO 50006 and the automatic diagnosis function. For the operation task 2, we have developed the general- purpose dashboard function where the energy effi-ciency achievement rate (results/targets), loss factors (control threshold values), etc. are displayed and op-eration is managed in real-time.
Using these functions allows constructing the op-eration environment for SDCA cycle to promote the maintenance and management activities for the en-ergy saving activities. Furthermore, reducing loads of analysis operations by a customer allows higher speed improvement and innovation activities and policy man-agement in PDCA cycle (see Fig. 3).
Total optimization(Macro optimization)
Partial optimization: Individual measures (micro piling and expansion)* Measure commodity introduction, control
improvement and operation reconsideration
Daily management and task extraction* Energy saving spot diagnosis and daily analysis
management operation
Analysis management* Providing integrated DB and analysis template
Monitoring
Data collection Fuji Electric’s measuring equipment solutions
FeTOP
Optimization
STEP3
Comprehension
STEP2
Visualization
STEP1
Fig.2 EMS structure by Fuji Electric
[Improvement and renovation activities: policy management]Constructing high-speed PDCA cycle with reduction in load of customer analysis operation (energy loss factor analysis and automatic diagnosis)
[Maintenance and improvement activities: daily management]Constructing SDCA cycle to promote maintenance management activities of energy saving activities (result/target and loss factor real-time management)
PDCA:Plan-Do-Check-Act
SDCA: Standardize-Do-Check-Act
Diagnosis utilizing AI technology: Automatic Diagnosis Function
PDCAcycle
SDCAcycle
Dashboard utilizing IoT technology: Dashboard
Fig.3 High-speed PDCA cycle and SDCA cycle

111Improvement of Energy Efficiency According to International Standards–EMS Add-On Functions Using Data Analytics
issu
e: N
ew V
alue
-Cre
atin
g So
lutio
ns S
tarti
ng F
rom
IoT
3.2 ISO 50006 management frame applicationFor the energy management, it is important to
specify targets to evaluate the energy efficiency change (improvement/drop). In ISO 50006 management frame, the unit to manage some energy performance indicator*1 (EnPI) is called energy managed unit (EMU). We attach importance to daily management of energy efficiency and identifying the related variable (impact factors) that affects the energy efficiency. It is important to specify the management target standard from the past efficiency result data to manage the en-ergy efficiency (energy consumption rate, equipment efficiency, etc.) and to manage the related variable that deeply affects the efficiency (see Fig. 4).
The energy operation efficiency improvement func-tion is configured with EMU as the core. This system structure provides the function that organize the func-tions group (automatic diagnosis, real-time manage-ment function, etc.), which leads various energy opera-tion efficiency improvement, as long as the user only defines data to be collected and their related factors on EMU (see Fig. 5).
For example, in the unit consumption management in some manufacturing process, the user assigns the consumption energy of a process for the EMU input, the production outputs of the process to the EMU out-put, and unit consumption-related impact factors (fa-cility running information, operation information, etc.) to the EMU control function. After these settings, this product can analyze and automatically diagnose the unit consumption worsened period and impact factors (facility running state, etc. most contributing to unit consumption). Furthermore, deviation from the unit consumption target value can be monitored regularly with the monitoring function. The real-time manage-ment function can obtain an energy efficiency target, result separation and related factors that affect effi-ciency every day, providing an appropriate energy con-sumption-related operation suggestion on the manu-facturing site. In addition, reproducing a model based on the defined EMU for the similar process and facility allows horizontal development and a new energy sav-ing activity can be started quickly.
3.3 Energy operation efficiency improvement function (with DD)The energy operation efficiency improvement func-
tion is an add-on function of MainGATE/PPA, devel-oped on the basis of the development concept described in Section 3.1. It has the following major functions.(1) Energy management unit (EMU) and energy base-
line (EnB) definition function(a) EMU definition function
EMU can be defined according to the tree lay-ers of the units of facilities, lines, organizations and factories. Internal tags for input and output signals
*1: Energy Performance Indicator (EnPI): Measurable re-sult related to energy use amount, energy use purpose, energy efficiency is totally called energy performance. Specifically, they are energy use amount, peak power, energy consumption amount by purposes and various en-ergy efficiency items. Their quantitative values (or scale) specified by an organization are called energy perfor-mance indicators (EnPI). They correspond to a ruler to measure energy performance and any indicators can be used for each purpose with judgment of the organization.
ISO 50006 management concept: Maintaining and managing efficiency target from energy management unit
Energy management unit
Energy efficiency management and related variables specification
EMU managementInput Output
Related variable (effect factor)
* Organizations, system lines, facilities, etc.
Input of EMU
EnPI (Measuring efficiency indicator) → Defining efficiency target
Identifying related variables that mostly affect energy efficiency
WeakWeak
Efficiencydegradation point
extraction
Efficiencydegradation point
extraction
MediumMedium
MediumMedium StrongStrong
Ou
tpu
t of
EM
U
Fig.4 ISO 50006 management frame conceptual diagram
Analysis function EnPI period analysis, etc.
Automatic diagnosis function EnPI impact factorAutomatic diagnosis
Monitoring function Monitoring EnPI
Real-time management function Real-time management of EnPI, related variables, etc.
Automatic control function EnPI automatic control (future implementation)
Common function linked to EMU definition
EMU
Related variable definition
Energy management unit setting
Input definition Output definition
Energy management unit (EMU) model definition body
Common tool function group for EMS advancement
Fig.5 Modeling example based on EMU
112 FUJI ELECTRIC REVIEW vol.64 no.3 2018
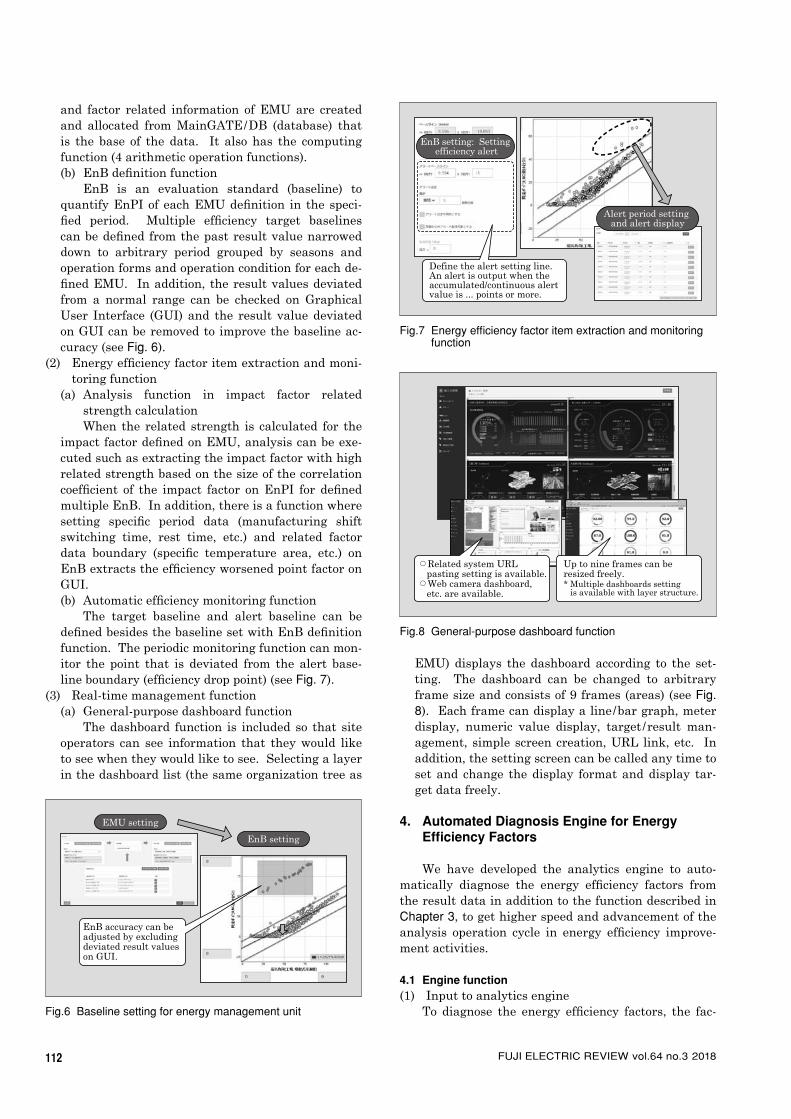
EMU) displays the dashboard according to the set-ting. The dashboard can be changed to arbitrary frame size and consists of 9 frames (areas) (see Fig. 8). Each frame can display a line/bar graph, meter display, numeric value display, target/result man-agement, simple screen creation, URL link, etc. In addition, the setting screen can be called any time to set and change the display format and display tar-get data freely.
4. Automated Diagnosis Engine for Energy Efficiency Factors
We have developed the analytics engine to auto-matically diagnose the energy efficiency factors from the result data in addition to the function described in Chapter 3, to get higher speed and advancement of the analysis operation cycle in energy efficiency improve-ment activities.
4.1 Engine function(1) Input to analytics engine
To diagnose the energy efficiency factors, the fac-
and factor related information of EMU are created and allocated from MainGATE/DB (database) that is the base of the data. It also has the computing function (4 arithmetic operation functions).(b) EnB definition function
EnB is an evaluation standard (baseline) to quantify EnPI of each EMU definition in the speci-fied period. Multiple efficiency target baselines can be defined from the past result value narrowed down to arbitrary period grouped by seasons and operation forms and operation condition for each de-fined EMU. In addition, the result values deviated from a normal range can be checked on Graphical User Interface (GUI) and the result value deviated on GUI can be removed to improve the baseline ac-curacy (see Fig. 6).
(2) Energy efficiency factor item extraction and moni-toring function
(a) Analysis function in impact factor related strength calculationWhen the related strength is calculated for the
impact factor defined on EMU, analysis can be exe-cuted such as extracting the impact factor with high related strength based on the size of the correlation coefficient of the impact factor on EnPI for defined multiple EnB. In addition, there is a function where setting specific period data (manufacturing shift switching time, rest time, etc.) and related factor data boundary (specific temperature area, etc.) on EnB extracts the efficiency worsened point factor on GUI.(b) Automatic efficiency monitoring function
The target baseline and alert baseline can be defined besides the baseline set with EnB definition function. The periodic monitoring function can mon-itor the point that is deviated from the alert base-line boundary (efficiency drop point) (see Fig. 7).
(3) Real-time management function(a) General-purpose dashboard function
The dashboard function is included so that site operators can see information that they would like to see when they would like to see. Selecting a layer in the dashboard list (the same organization tree as
EnB accuracy can be adjusted by excluding deviated result values on GUI.
EMU setting
EnB setting
Fig.6 Baseline setting for energy management unit
Define the alert setting line.An alert is output when the accumulated/continuous alert value is ... points or more.
Alert period setting and alert display
EnB setting: Setting efficiency alert
Fig.7 Energy efficiency factor item extraction and monitoring function
○Related system URL pasting setting is available.○Web camera dashboard,
etc. are available.
Up to nine frames can be resized freely.* Multiple dashboards setting
is available with layer structure.
Fig.8 General-purpose dashboard function

113Improvement of Energy Efficiency According to International Standards–EMS Add-On Functions Using Data Analytics
issu
e: N
ew V
alue
-Cre
atin
g So
lutio
ns S
tarti
ng F
rom
IoT
(4) Result evaluationThe result that the steam differential pressure af-
fects the energy efficiency of boiler operation was ob-tained through the analytics engine. This result was the same as the result of analysis executed by an expe-rienced operator with a lot of manpower and time. In addition, for the boundary value of the impact of steam differential pressure on the energy efficiency, the re-sult with the analytics engine was almost the same as the result with manpower.
5. Postscript
EMS add-on functions that use data analytics which contributes to the energy operation efficiency improvement according to international standards were described.
The necessity of energy customers to solve their own energy and environmental problems as manage-ment tasks has been increasing with the viewpoints of various laws and regulations, international standards and CSR, and impact of energy unit price jump.
Fuji Electric will take advantage of the current energy management solutions (visualization, compre-hension and optimization) and the newly developed efficiency improvement function for energy operation. We will then organically combine the information on energy storage equipment, utility equipment and pro-duction equipment, and new energies including re-newable energies whose future demand is expected to increase. In this way, we intend to aim establishing the automatic diagnosis technology and automating control that allows constant highly-efficient operation.
We will support customer activities to save energy and contribute to settle customer issues more than ever.
References(1) Azumaya, N. et al. Energy Management Solutions
to Support Energy Conservation Activities. FUJI ELECTRIC REVIEW. 2012, vol.58, no.1, p.9-13.
tors that generate differences between when the en-ergy efficiency is good and when it is not good, must be extracted. Data groups with labels of good efficiency and no good efficiency each shall be input to the engine to extract the factors. These labels shall be attached based on EnB described in Section 3.2. The labels may be attached to the data groups specified by a user on GUI.(2) Functions of analytics engine
The analytics engine learns the labeled data as teacher data and automatically creates a model to ex-plain (predict) the label. Extracting explanation fac-tors from the model, the user can determine the fac-tors that significantly affect the label (good/not good of energy efficiency). In addition, values of what related variables and what period affects the energy efficiency can be analyzed because the label prediction boundary values (related variable boundary and time boundary) can be extracted (see Fig. 9).
4.2 Analysis case and evaluationTo evaluate the analytics engine functions, analy-
sis was executed with result data of a plant (see Fig. 10).(1) Target case
Plant utility steam supply boiler(2) EMU definition
(a) Input to EMU: Boiler fuel(b) Output from EMU: Steam supply amount(c) Related variables: Boiler operation-related vari-
ous measured values (3) Analysis result
The result that steam differential pressure largely affects the energy efficiency was obtained as the fac-tor that affects the energy efficiency of EMU defined above.
Energy inrush amount
Pro
duct
ion
ou
tpu
ts, e
tc. Good energy
efficiency group
Analytics engine
Factor ①
Factors and boundary values that affect energy efficiency
Less than X1* X1 or higher
Factor ② Factor ③
Goodefficiency
Poorefficiency
Goodefficiency
Less than X2* X2 or higher
Poor energyefficiency group
* Boundary value
Fig.9 Analytics engine conceptual diagram
Analysis
Input
Once-through boiler LNG amount
Steam load○Factory load○Absorption type
refrigerator
Output
Related signal
Steam supply modelEMU
Steam differentialpressure
Less than 0.3 0.3 or higher
Poor efficiency Good efficiency
Fig.10 Analytics engine analysis case
A B S T R A C T
* Power Electronics Systems Business Group, Fuji Electric Co., Ltd.
⁑Corporate R&D Headquarters, Fuji Electric Co., Ltd.
114
1. Introduction
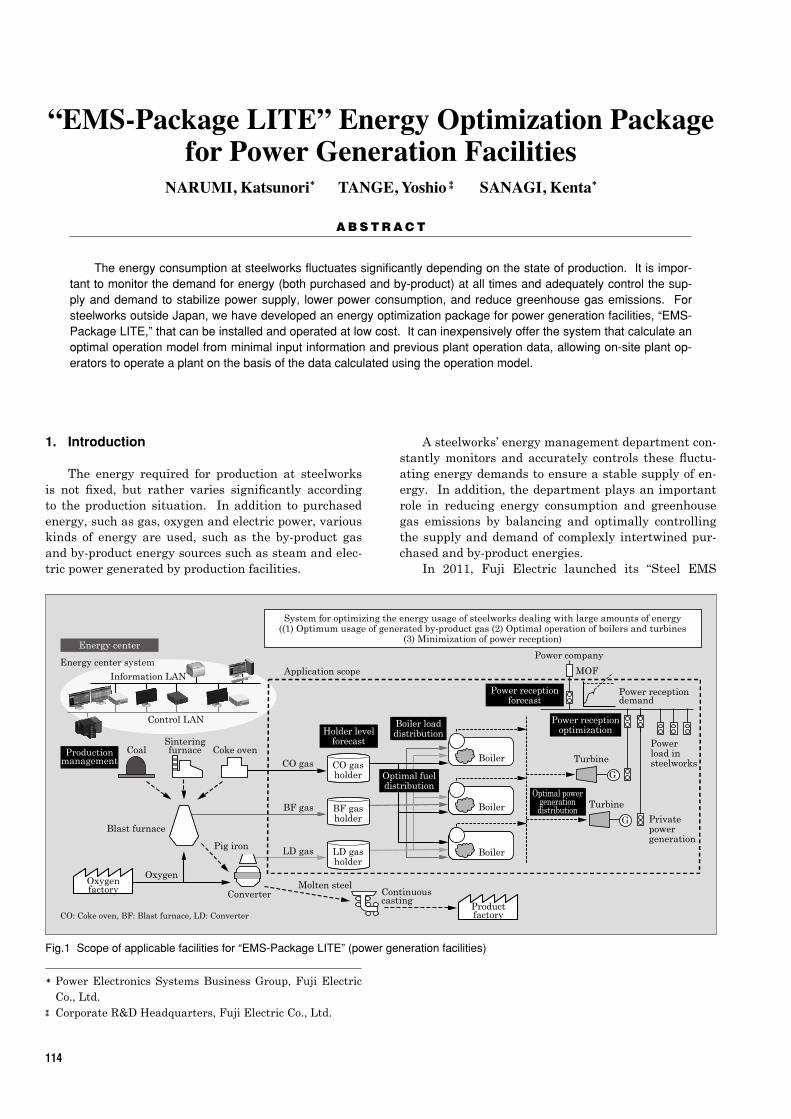
The energy required for production at steelworks is not fixed, but rather varies significantly according to the production situation. In addition to purchased energy, such as gas, oxygen and electric power, various kinds of energy are used, such as the by-product gas and by-product energy sources such as steam and elec-tric power generated by production facilities.
NARUMI, Katsunori * TANGE, Yoshio⁑ SANAGI, Kenta *
“EMS-Package LITE” Energy Optimization Package for Power Generation Facilities
The energy consumption at steelworks fluctuates significantly depending on the state of production. It is impor-tant to monitor the demand for energy (both purchased and by-product) at all times and adequately control the sup-ply and demand to stabilize power supply, lower power consumption, and reduce greenhouse gas emissions. For steelworks outside Japan, we have developed an energy optimization package for power generation facilities, “EMS-Package LITE,” that can be installed and operated at low cost. It can inexpensively offer the system that calculate an optimal operation model from minimal input information and previous plant operation data, allowing on-site plant op-erators to operate a plant on the basis of the data calculated using the operation model.
A steelworks’ energy management department con-stantly monitors and accurately controls these fluctu-ating energy demands to ensure a stable supply of en-ergy. In addition, the department plays an important role in reducing energy consumption and greenhouse gas emissions by balancing and optimally controlling the supply and demand of complexly intertwined pur-chased and by-product energies.
In 2011, Fuji Electric launched its “Steel EMS
Oxygenfactory
Productfactory
Blast furnace
Continuouscasting
Oxygen
Sinteringfurnace Coke oven
CO gas
BF gas
LD gas
CO gasholder
BF gasholder
LD gasholder
Pig iron
Molten steel
Coal
Energy center
Productionmanagement
Power receptionforecast
Energy center systemInformation LAN
Control LAN
System for optimizing the energy usage of steelworks dealing with large amounts of energy((1) Optimum usage of generated by-product gas (2) Optimal operation of boilers and turbines
(3) Minimization of power reception)
Converter
Holder levelforecast
Boiler loaddistribution
Optimal fueldistribution
Optimal powergenerationdistribution
Power receptionoptimization
Boiler Turbine
Private power generation
Power load in steelworks
MOF
Power reception demand
Power company
Application scope
Turbine
G
GBoiler
Boiler
CO: Coke oven, BF: Blast furnace, LD: Converter
Fig.1 Scope of applicable facilities for “EMS-Package LITE” (power generation facilities)
115“EMS-Package LITE” Energy Optimization Package for Power Generation Facilities
issu
e: N
ew V
alue
-Cre
atin
g So
lutio
ns S
tarti
ng F
rom
IoT
Package”(1). It has captured an overwhelming 90% or more of the market share at Japanese steelworks. It uses elaborate forecasting models and plant models to forecast the demand of multiple types of energy, create optimal operation plans and perform automatic control based on such plans.
Especially for overseas steelworks, we have re-cently developed “EMS-Package LITE” as an energy optimization package for power generation facilities that can be installed and operated at low cost.
2. Overview of “EMS-Package LITE”
Electric power is essential for operating the facili-ties of steelworks. In addition to purchasing electricity from a power company, there are cases where power is supplied by power generation facilities using by-product gas (blast furnace gas, converter gas, coke oven gas) in the steelworks.
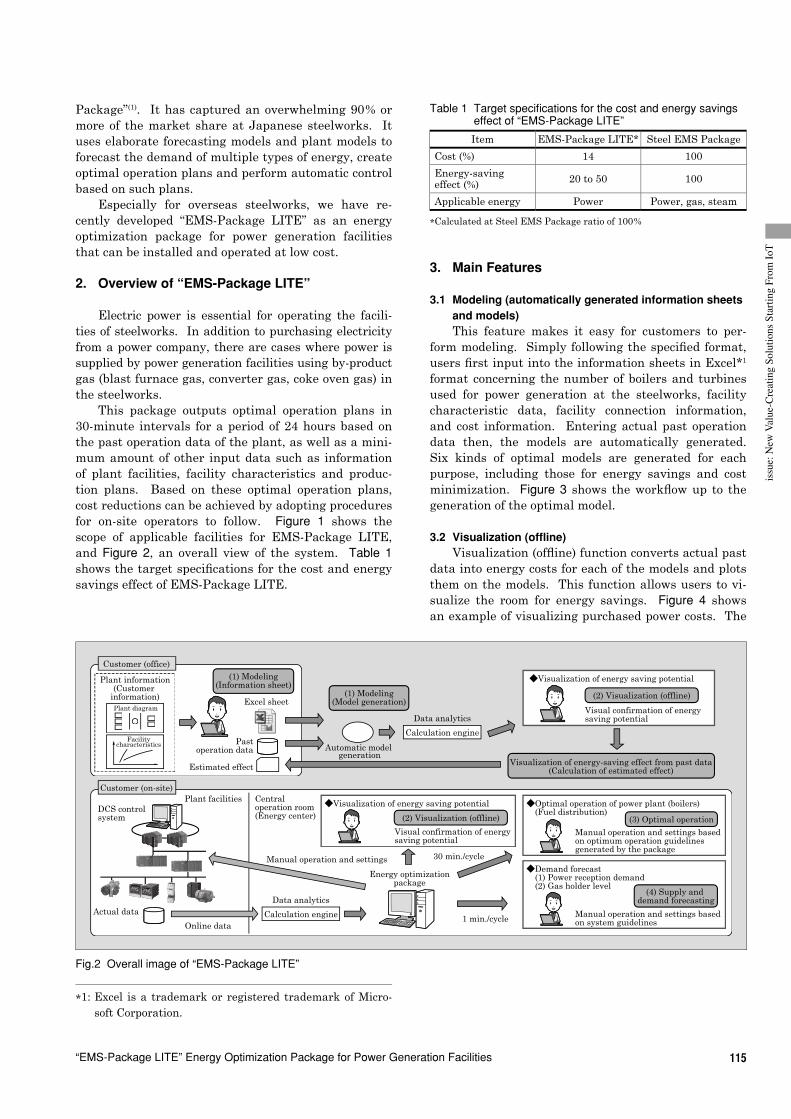
This package outputs optimal operation plans in 30-minute intervals for a period of 24 hours based on the past operation data of the plant, as well as a mini-mum amount of other input data such as information of plant facilities, facility characteristics and produc-tion plans. Based on these optimal operation plans, cost reductions can be achieved by adopting procedures for on-site operators to follow. Figure 1 shows the scope of applicable facilities for EMS-Package LITE, and Figure 2, an overall view of the system. Table 1 shows the target specifi cations for the cost and energy savings effect of EMS-Package LITE.
3. Main Features
3.1 Modeling (automatically generated information sheets and models)This feature makes it easy for customers to per-
form modeling. Simply following the specifi ed format, users fi rst input into the information sheets in Excel*1 format concerning the number of boilers and turbines used for power generation at the steelworks, facility characteristic data, facility connection information, and cost information. Entering actual past operation data then, the models are automatically generated. Six kinds of optimal models are generated for each purpose, including those for energy savings and cost minimization. Figure 3 shows the workfl ow up to the generation of the optimal model.
3.2 Visualization (offl ine)Visualization (offl ine) function converts actual past
data into energy costs for each of the models and plots them on the models. This function allows users to vi-sualize the room for energy savings. Figure 4 shows an example of visualizing purchased power costs. The
*1: Excel is a trademark or registered trademark of Micro-soft Corporation.
Customer (office)
Central operation room(Energy center)
Plant facilities
Manual operation and settings
1 min./cycle
30 min./cycle
DCS control system
Actual data
Customer (on-site)
Calculation engine
◆Visualization of energy saving potential
Visual confirmation of energy saving potentialData analytics
Calculation engine
Data analytics
Online data
(1) Modeling(Information sheet)
(1) Modeling(Model generation)
Visualization of energy-saving effect from past data(Calculation of estimated effect)
(2) Visualization (offline)
◆Optimal operation of power plant (boilers) (Fuel distribution)
Manual operation and settings based on optimum operation guidelines generated by the package
(3) Optimal operation
◆Visualization of energy saving potential
Visual confirmation of energy saving potential
◆Demand forecast (1) Power reception demand (2) Gas holder level
Manual operation and settings based on system guidelines
(4) Supply and demand forecasting
Excel sheet
Automatic model generation
Pastoperation data
Estimated effect
Plant information(Customer
information)Plant diagram
Facilitycharacteristics
(2) Visualization (offline)
Energy optimizationpackage
Fig.2 Overall image of “EMS-Package LITE”
Table 1 Target specifi cations for the cost and energy savings effect of “EMS-Package LITE”
Item EMS-Package LITE* Steel EMS Package
Cost (%) 14 100
Energy-saving effect (%) 20 to 50 100
Applicable energy Power Power, gas, steam
* Calculated at Steel EMS Package ratio of 100%

116 FUJI ELECTRIC REVIEW vol.64 no.3 2018
white arrow in the fi gure shows the room for energy savings.
3.3 Optimal operation and visualization (online)In optimal operation, plant data (actual data)
is collected online and used to create optimal opera-tion plans (energy distribution) for the power plant in 30-minute intervals for a period of 24 hours via an optimal calculation engine. By following the optimal operation plans, on-site operators can achieve energy savings.
In addition, if there is a change in operation, the center operator can recalculate it on the spot to enable optimal operation based on the most recent operation. Furthermore, even though the optimal operation plan is calculated automatically based on the optimal model and actual data, the operation plan and energy balance of the facilities can also be changed as needed. Visu-alization (online) enables users to visually confi rm the conditions of energy-saving operation since it simulta-neously displays the actual state collected in real time via the OPC interface and the forecast energy-saving state after initiating optimal operation. Figure 5 shows the optimal operation work fl ow.
3.4 Supply and demand forecastingThe amount of generated energy and usage can be
forecast for continuous production facilities (such as blast furnaces and coke ovens) based on changes in the out-of-operation plans, actual performance and the in-tensity of each of the facilities (boilers, turbines). Fur-thermore, the amount of generated energy and usage can be forecast for batch production facilities (convert-ers) based on changes in the production plans, actual performance and the steelmaking intensity.(1) Power demand monitoring
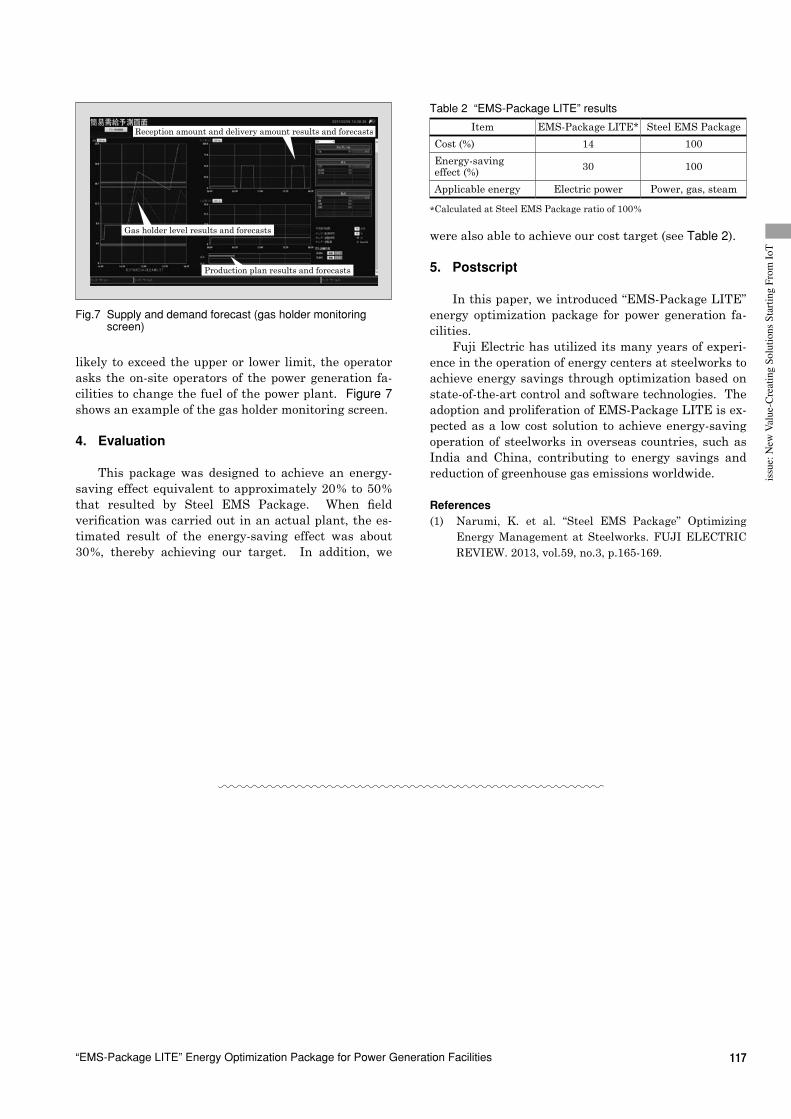
The center operators constantly monitor the amount of power received, and if the forecast amount of power received is likely to exceed the contract value, they will ask the on-site operators of the power genera-tion facilities to change the amount of power genera-tion. Figure 6 shows an example of the demand moni-toring screen.(2) Gas holder monitoring
The center operator constantly monitors the fore-cast gas holder level, and if the gas holder level is
Automatically generate 6 application-specific optimum models using a minimum amount of input
Six types of optimum models(1) Purchased power cost(2) Power reception cost(3) Emissions amount(4) Boiler fuel distribution(5) Turbine steam distribution(6) Turbine extracted steam
distribution
Actual past data
Informationsheet Automatic
model generation
(1) Purchased power cost
(6)Model
Power load (MW)
Pu
rch
ase
cost
(JP
Y)
Fig.3 Workfl ow up to the generation of the optimal model
(1) Purchased power cost
Present actual values
Energy-saving potential improvementPower load (MW)
Pu
rch
ase
cost
(JP
Y)
Fig.4 Example of visualizing purchased power costs
(1) The center operator generates an optimum operation plan using the optimum model based on the present values of the plant, and then instructs on-site operators accordingly.
(2) The center operator visualizes the present state and the post-optimization energy-saving improvement forecast state
Present data
(1) Purchased power cost
(6)Model
Present actual values
Energy-saving improvement forecast values
Centeroperator
On-siteoperator
Plantoperation
Optimumoperation plan
generation
Visualizationanalysis(online)
Pressure. MVFlow rate. SV...
Optimum operation plan
Power load (MW)Pu
rch
ase
cost
(JP
Y)
Fig.5 Optimal operation workfl ow
Demand contract line
Demand results forecast line
Fig.6 Supply and demand forecast (demand monitoring screen)
117“EMS-Package LITE” Energy Optimization Package for Power Generation Facilities
issu
e: N
ew V
alue
-Cre
atin
g So
lutio
ns S
tarti
ng F
rom
IoT
were also able to achieve our cost target (see Table 2).
5. Postscript
In this paper, we introduced “EMS-Package LITE” energy optimization package for power generation fa-cilities.
Fuji Electric has utilized its many years of experi-ence in the operation of energy centers at steelworks to achieve energy savings through optimization based on state-of-the-art control and software technologies. The adoption and proliferation of EMS-Package LITE is ex-pected as a low cost solution to achieve energy-saving operation of steelworks in overseas countries, such as India and China, contributing to energy savings and reduction of greenhouse gas emissions worldwide.
References(1) Narumi, K. et al. “Steel EMS Package” Optimizing
Energy Management at Steelworks. FUJI ELECTRIC REVIEW. 2013, vol.59, no.3, p.165-169.
likely to exceed the upper or lower limit, the operator asks the on-site operators of the power generation fa-cilities to change the fuel of the power plant. Figure 7 shows an example of the gas holder monitoring screen.
4. Evaluation
This package was designed to achieve an energy-saving effect equivalent to approximately 20% to 50% that resulted by Steel EMS Package. When field verification was carried out in an actual plant, the es-timated result of the energy-saving effect was about 30%, thereby achieving our target. In addition, we
Reception amount and delivery amount results and forecasts
Production plan results and forecasts
Gas holder level results and forecasts
Fig.7 Supply and demand forecast (gas holder monitoring screen)
Table 2 “EMS-Package LITE” results
Item EMS-Package LITE* Steel EMS Package
Cost (%) 14 100
Energy-saving effect (%) 30 100
Applicable energy Electric power Power, gas, steam
* Calculated at Steel EMS Package ratio of 100%

A B S T R A C T
* Power Electronics Systems Business Group, Fuji Electric Co., Ltd.
118
1. Introduction
As technologies such as the Internet of things (IoT), big data analysis and artifi cial intelligence (AI) evolve rapidly, we are faced with the challenge of how to specifi cally use the data for productivity improve-ment and predictive maintenance of equipment.
This paper describes the creation of value-added data using the “OnePackEdge System” as an example of how to overcome this challenge.
2. Assembly Process Data Collection System(1)
Customers increasingly need to accelerate the development of new technologies to meet the high de-mands of the market. For example, in the automotive industry autonomous driving, connected cars and elec-tric motorization can be cited.
In many cases today, visualization and the collec-tion of large amounts of data is already advancing in regard to design production technologies and at the de-partmental level of factories. Up until recently, it had been acceptable to initiate improvement of individual production departments and lines, but since these im-provements are limited, a greater number of users are aiming for overall optimization. However, the data collected has not been suffi ciently utilized due to inad-equate sharing of data between departments and in-suffi cient continuity of historical data across multiple processes. Therefore, it is necessary to carry out over-all optimization through data collection and analysis that take into account the coordination and continuity between departments. Figure 1 shows the frameworks that refl ect the current state and ideal future state.
HOSHINO, Jun * FUJIKAWA, Yasutaka * TOYODA, Kenro *
Creating Value in Data with “OnePackEdge System”
Today, visualization is advanced for the process of each department, such as design, production technology, and a factory, and a large amount of data is collected. However, these data are not fully leveraged due to the lack of effi cient coordination between departments and continuity of historical data over different processes. Thus, total optimization is required for cross-department coordination and data continuity through data gathering and analysis. Given this challenge, Fuji Electric has developed “OnePackEdge System” for creating a “value-generating database” to realize a smart factory. An additional data analysis assistant tool is also provided to make analysis more effi cient and create value in data.
In order to overcome these challenges and achieve smart factories, Fuji Electric has developed the “One-PackEdge System” as a system for building “profi t-generating databases.”
・ ・ ・・・・・・・・
・ ・ ・・・・・・・・
・ ・ ・・・・・・・・
・ ・ ・・・・・・・・
No use of on-site data and lack of data continuity and coordination
Facility
Production
FacilityDuplicated
Hierarchically arranged
ProductionQuality
Quality
Production
Quality
Design
Manage-ment
Manufac-turing
(a) Present
State in which required data is identified, collected and shared according to the business tasks of each department
(b) Future
Quality Design Productiontechnology
Manufac-turing
Productionlogistics
Quality Design Productiontechnology
Manufac-turing
Productionlogistics
Fig.1 Framework of current state and ideal future state

119Creating Value in Data with “OnePackEdge System”
issu
e: N
ew V
alue
-Cre
atin
g So
lutio
ns S
tarti
ng F
rom
IoT
2.1 Quality traceability for the assembly process fi eldFigure 2 shows an overview of the quality trace-
ability solution provided by Fuji Electric The dashed line shows the scope of the OnePackEdge System. The quality traceability solution consists of a data collec-tion section that collects raw data from sensors and manufacturing facilities connected via LAN and a server section for the databases that stores the data. The system collects the data needed by the user at the required time and makes it easy to carry out searches when it is necessary to trace stored data.(1) Data collection section
(a) Data collection functionOn assembly process lines, quality traceabil-
ity requires data on the assembling and processing of each machine’s work at all stages from start to completion (one cycle). For every process cycle, the OnePackEdge System collects the computer numeri-cal control (CNC) and programmable logic controller (PLC) signals used to control each piece of machin-ery, as well as various sensor signals such as the pressure, temperature and vibration of each ma-chine. Furthermore, as shown in Fig. 3, the system aggregates collected data within each process cycle (packaged data) to make it meaningful.
By doing this, it can reduce the amount of data collected compared with conventional systems that continuously collect data, because it only col-lects necessary data at the time it is required. As a result, this greatly reduces the effort required to identify data for analysis, greatly decreasing a user workload.(b) Camera server connection function
In order to manage changes in 4M (men, ma-chines, materials and methods), there is a need to centrally manage video taken with a camera along with analog inputs such as vibration and current.
However, the camera is mainly managed by a cam-era system, and because analog data collected from sensors uses a different management system, it has been diffi cult to achieve centralized management.
As shown in Fig. 4, the system provides a func-tion for monitoring events in the fi eld by synchro-nizing the camera’s recorded video with the analog data transition.(c) Engineering tool
The engineering tool performs master mainte-nance of the system, while also adding and deleting data. This solution provides the engineering tool that use Excel*1. Figure 5 shows an overview of the solution. By using the engineering tools prepared on a maintenance dedicated PC, it is possible to specify start and completion signals for each cycle, defi ne fi eld names, data types and storage addresses for the collected data and register such information
FA-LAN
OnePackEdge System
Control LAN
Camera RobotGantry CNC
Maintenance informationFacility operation
Quality information
Server section
Data storage server
Engineering tools
LANRS-485Analog input
Maintenance PC
Pre
ssu
re
Vib
rati
on
Curr
ent/v
oltag
e
Flo
w
Oper
atio
n tim
e
Gau
ge
Temp
eratur
e/hum
idity
Com
pon
ent
AE
PL
C
Pow
er m
eter
Data collection section(Facility information collector)
Fig.2 Overview of quality traceability solution
Database
○Electrical current○Axis○Rotational speed
○Tempera- ture○Vibration○Flow
Process 1
Process cycle
Process 2
Data per cycle in Process n
Process cycle
Process 3
Process cycle
Process 4
Process cycle
Work piece
Fig.3 Image of data collection function
Video at processing
Data at processing
Fig.4 Screen example of camera server connection function
*1: Excel is a trademark or registered trademark of Microsoft Corporation

120 FUJI ELECTRIC REVIEW vol.64 no.3 2018
into the collection terminal’s specifi ed folder. As a result, users now can easily add and edit collected data.
(2) Server section(a) Traceability search function
There is a close relationship between the op-
eration information of manufacturing facilities and the quality information of products. Therefore, us-ers often check operation information and quality information at the same time when problems occur on the production line. However, retrieving such information has been cumbersome because qual-ity information is managed according to product, whereas operation information according to facility. This solution makes it possible to search via both fa-cility axis and work axis, thereby reducing the labor required in user information retrieval.(b) Data summary function
In order to track factors of abnormality, it is necessary to obtain abnormal values (those exceed-ing the threshold), maximum values, minimum val-ues, and average values for each item of measure-ment. However, this takes a lot of effort because the amount of accumulated data is often huge. This so-lution automatically summarizes and displays these values on the traceability search screen to help re-duce the task of checking data by users.
2.2 Facility information collectorIn order to reduce the size and cost of the data col-
lection section, Fuji Electric has developed a facility information collector that integrates the functions de-scribed in Section 2.1. It achieves a 95% reduction in
Collectionterminal
Linkage with upper-level server
Servers
Maintenance PC
Register tospecified
folder
Database
Data name
Motor current
Axial vibration
Analog
Pump pressure
Type
ms
Unit
Numeric
Type
A4340
Address
...
Analog ms Numeric A4341 ...
Analog ms Numeric A4342 ...
...
Fig.5 Overview of engineering tools
Table 1 Overview of facility information collector specifi cations
Function classifi ca-
tion
Detailed classifi ca-
tionSpecifi cations
Data collec-tion
Collection target
◦ PLC or CNC◦ Power meters◦ Various sensors (analog inputs)◦ Contact inputs (digital inputs)
Collection cycle
◦ High speed (1 ms): 16 points (analog inputs)◦ Medium speed (300 ms): 20 points*◦ Low speed (1 s): 128 points*, 24 points (analog
inputs)*,**, 16 points (digital inputs)*,**◦ Cycle: 256 points
Upper-level server transmis-sion
FTP fi le transfer (supports FTP server and FTP client functions)
Data monitor-ing
Threshold value moni-toring
Threshold monitoring for low-speed data 128-point upper upper limit, upper limit, lower limit and lower lower limit***
I/F
LAN
◦ LAN0 (RJ45): 1 Gbits/s (for real-time monitor-ing)
◦ LAN1 (RJ45): 1 Gbits/s (for future expansion)◦ LAN2 (RJ45): 1 Gbits/s (for upper-level PC
connection and engineering tool connection)◦ LAN3 (RJ45): 100 Mbits/s (PLC or CNC con-
nection)
Serial
◦ RS-422 (RJ45): For future expansion ◦ RS-232C0 (D-SUB 9 pin): For future expansion◦ RS-485 (RJ45): Power meter connection◦ RS-232C1 (RJ45): For future expansion◦ USB0, 1, 2: For maintenance
I/O
[Standard] ◦ Analog inputs: 16 points, 4-20 mA/0-20 mA/
±20 mA; Resolution: 14 -bit ◦ Digital inputs: 1 point, 24 V DC, 4 mA ◦ Digital inputs: 1 point, 24 V DC, Ry output[During I/O expansion]*Connection via expansion I/O (RJ45) ◦ Analog inputs: 24 points, 4-20 mA/0-20 mA/
±20 mA; Resolution: 14 bit ◦ Digital inputs: 16 point, 24 V DC, 4 mA
Compatible protocols Mitsubishi MC protocol, FOCAS2 / Modbus RTU
* Only devices with a read response time of 10 ms or less per word** Only at the time of I /O expansion*** When monitoring threshold values, a value is judged to be abnor-
mal when it is continuously above the threshold value for a consecu-tive number of confi gured times.
(Unit: mm)121
90
275
Fig.6 Facility information collector
Fig.7 Example of installing facility information collector
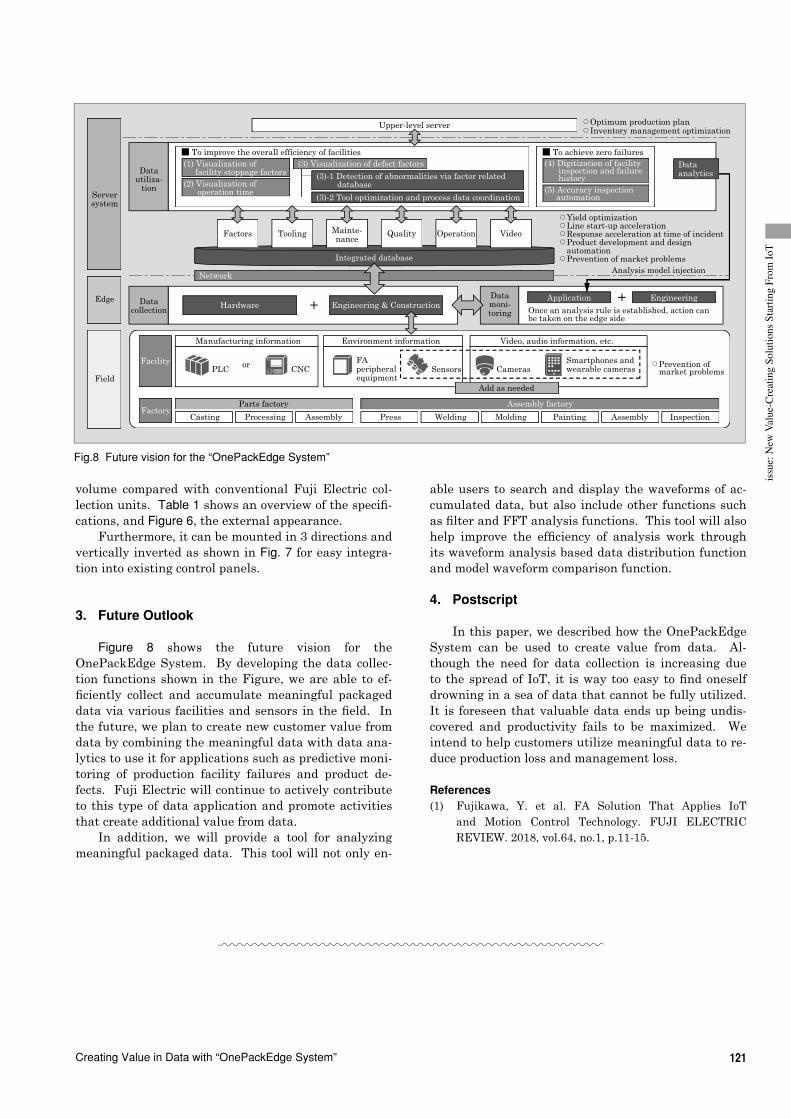
121Creating Value in Data with “OnePackEdge System”
issu
e: N
ew V
alue
-Cre
atin
g So
lutio
ns S
tarti
ng F
rom
IoT
able users to search and display the waveforms of ac-cumulated data, but also include other functions such as fi lter and FFT analysis functions. This tool will also help improve the effi ciency of analysis work through its waveform analysis based data distribution function and model waveform comparison function.
4. Postscript
In this paper, we described how the OnePackEdge System can be used to create value from data. Al-though the need for data collection is increasing due to the spread of IoT, it is way too easy to fi nd oneself drowning in a sea of data that cannot be fully utilized. It is foreseen that valuable data ends up being undis-covered and productivity fails to be maximized. We intend to help customers utilize meaningful data to re-duce production loss and management loss.
References(1) Fujikawa, Y. et al. FA Solution That Applies IoT
and Motion Control Technology. FUJI ELECTRIC REVIEW. 2018, vol.64, no.1, p.11-15.
volume compared with conventional Fuji Electric col-lection units. Table 1 shows an overview of the specifi -cations, and Figure 6, the external appearance.
Furthermore, it can be mounted in 3 directions and vertically inverted as shown in Fig. 7 for easy integra-tion into existing control panels.
3. Future Outlook
Figure 8 shows the future vision for the OnePackEdge System. By developing the data collec-tion functions shown in the Figure, we are able to ef-fi ciently collect and accumulate meaningful packaged data via various facilities and sensors in the fi eld. In the future, we plan to create new customer value from data by combining the meaningful data with data ana-lytics to use it for applications such as predictive moni-toring of production facility failures and product de-fects. Fuji Electric will continue to actively contribute to this type of data application and promote activities that create additional value from data.
In addition, we will provide a tool for analyzing meaningful packaged data. This tool will not only en-
Serversystem
Tooling Mainte-nance
Quality Operation VideoFactors
Parts factory
Manufacturing information
PLC or CNC
Environment information
FA peripheral equipment
Sensors
Video, audio information, etc.
Smartphones and wearable camerasCameras
Add as needed
Processing AssemblyCasting
Assembly factory
Welding MoldingPress
Datautiliza-
tion
Datacollection
Facility
Factory
■ To improve the overall efficiency of facilities
Upper-level server
Integrated database
Hardware + Engineering & ConstructionDatamoni-toring
Application + Engineering
(1) Visualization of facility stoppage factors
Network
(2) Visualization of operation time
(3) Visualization of defect factors(3)-1 Detection of abnormalities via factor related database
(3)-2 Tool optimization and process data coordination
■ To achieve zero failures(4) Digitization of facility inspection and failure history(5) Accuracy inspection automation
Dataanalytics
○Optimum production plan○Inventory management optimization
○Yield optimization○Line start-up acceleration○Response acceleration at time of incident○Product development and design automation○Prevention of market problems
○Prevention of market problems
Once an analysis rule is established, action can be taken on the edge side
Analysis model injection
Edge
Field
Painting Assembly Inspection
Fig.8 Future vision for the “OnePackEdge System”

A B S T R A C T
* Production & Procurement Group, Fuji Electric Co., Ltd.
122
1. Introduction
In addition to conventional production innovation activities, Fuji Electric has been implementing supply chain management (SCM) reform activities throughout the entire supply chain from FY2009 and built a sys-tem in which sales and manufacturing processes syn-chronize autonomously.
We have been promoting manufacturing based In-ternet of things (IoT) through the use of large quanti-ties of data utilizing dramatically improved informa-tion processing capabilities and artifi cial intelligence (AI). As a result, we are carrying out manufacturing reforms and aiming to achieve autonomously synchro-nized production, which we also refer to as the Fuji Electric Production System (FePS) (see Fig. 1).
2. Manufacturing Based IoT Concepts
Figure 2 shows Fuji Electric’s manufacturing
ONO, Masabumi * YAMADA, Takanori * NARUSE, Mitsuhiro *
Manufacturing Reform Utilizing IoT Technology
In addition to the existing production innovation activities, Fuji Electric has developed its supply chain manage-ment (SCM) reform activity since FY2009 to build the system in which sales and manufacturing processes synchro-nize autonomously. We are committed to productivity and quality improvement, security and safety, labor saving, and energy saving. We also promote production innovation and the use of IoT according to each factory’s manufactured items and business characteristics. Fuji Electric, an IoT solution vendor, proactively utilizes its own products and sys-tems.
based IoT concepts. We are promoting IoT along 2 axes, namely SCM and product lifecycle management (PLM), to achieve productivity and quality improve-ment; safety, security and labor savings; and energy savings. By doing this, we aim to achieve a “connected smart factory” in expectation that it will optimize the entire factory including energy savings.
From the SCM axis, we are promoting the automa-tion of production equipment and lines that utilize IoT. From the PLM axis, promoting standardization, digiti-zation, and utilization of cyber physical systems (CPS).
IoT based manufacturing reforms aim to use data obtained from the fi eld to simulate manufacturing via computers in order to achieve optimization by refl ect-ing the results back into the fi eld. To begin with, we established sensing technologies, information collec-tion technologies and connection technologies, while developing a “Factory Visualization Dashboard” (see Section 3.2 below) that we have deployed at each fac-tory.
Currently, in addition to standardizing manufac-turing, we are promoting productivity and quality im-
FePS realization
(Autonomously synchronized production)
Manufac-turing
IoT
Platform-ization
System linkage
Standardization
Global SCM
Line autonomization
Automation and in-house production
Manufacturing inflection point
PLM reform
SCM reform
SC reform activities
Production innovation activities
2005 2010 2015 2020
Com
peti
tive
str
engt
h
Fig.1 History of Fuji Electric's production innovation
Productivity and quality improvement
Digitalization, standardization (PF)
Cost reduction
Value provision
Commercial materialization
Energy savings Safety, security and labor savings
Fig.2 Manufacturing based IoT concepts

123Manufacturing Reform Utilizing IoT Technology
issu
e: N
ew V
alue
-Cre
atin
g So
lutio
ns S
tarti
ng F
rom
IoT
provements through the use of data.
3. Examples of Initiatives
Fuji Electric has been active in a wide range of manufacturing fields from electronic devices and com-ponents to plant equipment. Therefore, we are pro-moting production innovation and IoT advancement on the basis of the characteristics of the products and businesses of each factory.
Fuji Electric, also an IoT solutions vendor, actively utilizes its own products and systems in the develop-ment of IoT.
3.1 Production preparation utilizing CPSProduct functions are becoming increasingly so-
phisticated and diversified, and there has been in-creased demand to shorten the time required for mar-ket launch. It is against this backdrop that Fuji Elec-tric is optimizing manufacturing processes through CPS, while shortening the time required to prepare production processes for mass production activities (see Fig. 3).(1) Process design enhancement and increased effi-
ciency through use of design informationIn the process design, we decide manufacturing
methods, personnel, amount of labor, equipment and tools while verifying manufacturability according to the product design. Therefore, process design is an ex-tremely important work that has decisive influence on the QCD of products. To do this work, it has been nec-essary to spend a lot of time creating forms such as QC process charts and work instructions.
Therefore, we have built systems that can reduce the number of prototypes by extracting optimum man-ufacturing procedures while verifying manufacturabil-ity via computer with product design data, as well as create forms semi-automatically.
As a result, product design and process design can now be performed simultaneously while reflecting the results back into the product design, with the effect that preparation time for production is shortened and process design is simplified.(2) Enhancement and efficiency increase in produc-
tion line design
Fuji Electric has also developed a system that uses a computer to simulate the movement of people, things and equipment to build a more efficient produc-tion line. The system makes it possible to simulate takt time, line capacity and labor-hours using the line design tool that utilizes the manufacturability verifica-tion information mentioned above. Furthermore, by simulating the operations of workers, it is possible to pre-examine difficult-to-implement processes and pro-cesses that influence product quality while eliminating any issues that may occur. In this way, we are work-ing to stabilize work quality and shorten line start-up time.(3) Improving the design quality of automated equip-
ment and shortening the verification periodAfter completing facility design, such as mechani-
cal design, electrical design and software design, proto-types, are created and evaluated with the actual facil-ity.
Therefore, prototyping and evaluation not only takes time, but also requires multiple prototypes to be created because this work is carried out by using real machines.
In order to reduce rework, improve design quality and reduce equipment development time by 20%, we have constructed an environment that uses 3D-CAD data to conduct prototyping and evaluation similar to that of real machines but using a computer instead.
Even when constructing a production line that uses several robots, interference between robots or a robot and human can be verified beforehand, thus making it possible to secure safety at time of actual machine verification.
Another benefit is that it becomes possible to eval-uate operations at the time of mass production at fa-cilities of remote sites, including those overseas, while also enabling operators to update software on the com-puters remotely.
3.2 Factory visualization dashboardManufacturing sites have conventionally made use
of production progress management boards and Andon (a manufacturing status display system) to share on-site information and speed up countermeasures.
To achieve even better response, we developed and are installing “factory visualization dashboards” to achieve centralized monitoring of manufacturing key performance indicators (KPI) by collecting real-time 4M (man, machines, materials, methods) data at manufacturing sites and integrating various types of on-site information through the use of IoT (see Fig. 4).
By using factory visualization dashboards, vari-ous levels of management ranging from administrators and factory managers to line supervisors can ascertain quantitatively and in real-time KPI indicators neces-sary for daily management. This facilitates accurate and speedy response and overall optimization.
The dashboard is configured on a web screen so
PlanningMass
production
Massproduction
Productdesign
Prototypeevaluation
Planning Productdesign
Process design, production preparation
Manufac-turability verifica-tion
Line design
Equip-ment design
Prototypeevaluation
Process design,Production prepara-tion
CPS utilization
Fig.3 Improved production preparation efficiency via CPS

124 FUJI ELECTRIC REVIEW vol.64 no.3 2018
that the display contents can be easily edited to corre-spond to changes in the process and line confi guration. In addition, the network is confi gured taking into ac-count security and access load distribution.
For older equipment that cannot output operation information, it is common to collect operation informa-tion based on operating status indicator signals. How-ever, this only allows for limited types of information such as indicating normal operation, abnormal opera-tion and stoppages. Therefore, we built a system for reading operation information from equipment control lines and displaying detailed operation states on a dashboard to visualize operation.
On integrated automation lines for mass produced products, the operation status and takt time of each piece of equipment are collectively displayed on the dashboard in real time as shown in Fig. 5. This makes it possible to quickly identify where takt disruptions occur. Furthermore, by using the video captured with web cameras, it becomes possible to investigate causes and take remedial measures.
In the future, we will continue to develop the dash-board and strengthen its analysis capabilities by com-bining analytics and AI.
3.3 Quality improvement and predictive maintenance through multivariate analysisBy using Fuji Electric’s “MainGATE/MSPC” multi-
variate analysis tool, it is possible to detect abnormali-ties caused by multiple factors that cannot be moni-tored using individual data alone and extract optimum manufacturing conditions based on the relationship be-tween quality and manufacturing factors. This tool is applied to manufacturing sites to improve quality and enhance equipment operation(1).(1) Quality improvement in semiconductor manufac-
turingFuji Electric’s pressure sensors are processed to
extremely thin with a thickness of only several tens of micrometers by utilizing plasma etching for the back side of the Si wafer. Poor sensitivity will result if the thickness deviates from the specifi cation range. There-fore, they must be processed with high precision (see Fig. 6).
To improve the quality, we investigated the cause of variation in thickness by applying MSPC for batch processes to manufacturing process data.
As a result, among the dozens of parameters, there were 2 specifi c parameters that highly contributed to the Q statistic (the degree of deviation from the normal model of the data being diagnosed) and were the main factors of variability.
By restricting these 2 parameters to within a cer-tain range, it became possible to halve the variation in thickness.(2) Predictive analysis of equipment abnormalities in
press workingDuring press working, slug fl oats pose a big chal-
lenge. It is a situation in which scraps stick to the punch and come out of the die hole. Predictive detec-tion has been diffi cult due to existence of various pos-sible factors such as tool wear, clearance amount, pro-cessing oil viscosity, mold magnetization, and the at-tracting action between the punch and die (see Fig. 7).
Therefore, we implemented monitoring by mount-ing the press equipment with Fuji Electric’s “Diag-nostic Sensor Hub”, a product that makes it possible to centrally manage measurement data by aligning the sampling cycles of various sensors such as tem-perature, current and voltage, 3-axis acceleration and
Factory bird-eye view
Fig.4 Factory visualization dashboard
Visualization (real-time monitoring)
Neck process (equipment) identification
Improvement implementation
Monitoring equipment takt variation
Comparisonwith video
dataNeck process improvementTarget takt time achievement
[Effect] Productivity improvement
Cause investigation
Implementation of improvement cycle
Fig.5 Examples of dashboard based improvements
Glass substrate
Several tens of micrometers
Si thicknessSeveral hundred
micrometers
Si wafer
(a) External appearance (b) Cross-sectional view
Fig.6 Wafer appearance and cross-sectional view
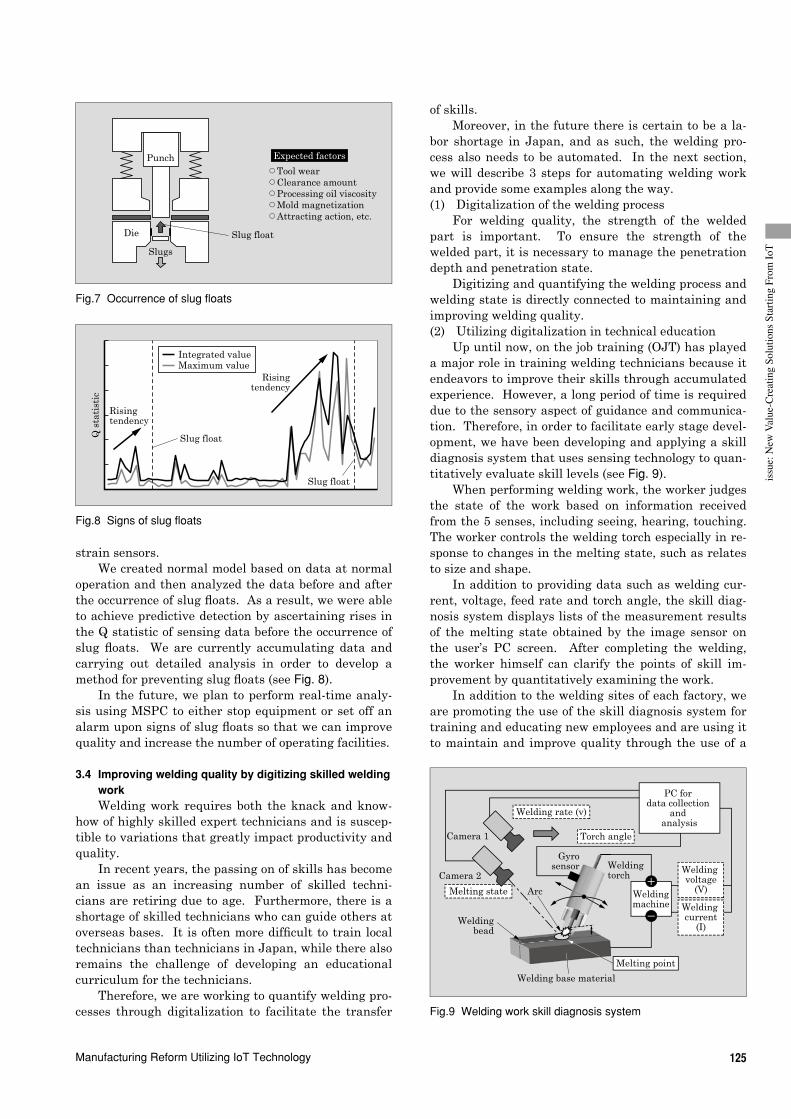
125Manufacturing Reform Utilizing IoT Technology
issu
e: N
ew V
alue
-Cre
atin
g So
lutio
ns S
tarti
ng F
rom
IoT
of skills.Moreover, in the future there is certain to be a la-
bor shortage in Japan, and as such, the welding pro-cess also needs to be automated. In the next section, we will describe 3 steps for automating welding work and provide some examples along the way.(1) Digitalization of the welding process
For welding quality, the strength of the welded part is important. To ensure the strength of the welded part, it is necessary to manage the penetration depth and penetration state.
Digitizing and quantifying the welding process and welding state is directly connected to maintaining and improving welding quality.(2) Utilizing digitalization in technical education
Up until now, on the job training (OJT) has played a major role in training welding technicians because it endeavors to improve their skills through accumulated experience. However, a long period of time is required due to the sensory aspect of guidance and communica-tion. Therefore, in order to facilitate early stage devel-opment, we have been developing and applying a skill diagnosis system that uses sensing technology to quan-titatively evaluate skill levels (see Fig. 9).
When performing welding work, the worker judges the state of the work based on information received from the 5 senses, including seeing, hearing, touching. The worker controls the welding torch especially in re-sponse to changes in the melting state, such as relates to size and shape.
In addition to providing data such as welding cur-rent, voltage, feed rate and torch angle, the skill diag-nosis system displays lists of the measurement results of the melting state obtained by the image sensor on the user’s PC screen. After completing the welding, the worker himself can clarify the points of skill im-provement by quantitatively examining the work.
In addition to the welding sites of each factory, we are promoting the use of the skill diagnosis system for training and educating new employees and are using it to maintain and improve quality through the use of a
strain sensors.We created normal model based on data at normal
operation and then analyzed the data before and after the occurrence of slug fl oats. As a result, we were able to achieve predictive detection by ascertaining rises in the Q statistic of sensing data before the occurrence of slug fl oats. We are currently accumulating data and carrying out detailed analysis in order to develop a method for preventing slug fl oats (see Fig. 8).
In the future, we plan to perform real-time analy-sis using MSPC to either stop equipment or set off an alarm upon signs of slug fl oats so that we can improve quality and increase the number of operating facilities.
3.4 Improving welding quality by digitizing skilled welding workWelding work requires both the knack and know-
how of highly skilled expert technicians and is suscep-tible to variations that greatly impact productivity and quality.
In recent years, the passing on of skills has become an issue as an increasing number of skilled techni-cians are retiring due to age. Furthermore, there is a shortage of skilled technicians who can guide others at overseas bases. It is often more diffi cult to train local technicians than technicians in Japan, while there also remains the challenge of developing an educational curriculum for the technicians.
Therefore, we are working to quantify welding pro-cesses through digitalization to facilitate the transfer
Slugs
Punch
Slug float
○Tool wear○Clearance amount○Processing oil viscosity○Mold magnetization○Attracting action, etc.
Expected factors
Die
Fig.7 Occurrence of slug fl oats
Rising tendency
Slug float
Integrated valueMaximum value
Slug float
Risingtendency
Q s
tati
stic
Fig.8 Signs of slug fl oats
Camera 2
Arc
Camera 1
Melting point
Melting state
Torch angle
Gyrosensor Welding
torch
Weldingmachine Welding
current(I)
Welding voltage
(V)
PC for data collection
and analysis
Welding rate (v)
Weldingbead
Welding base material
Fig.9 Welding work skill diagnosis system
126 FUJI ELECTRIC REVIEW vol.64 no.3 2018
variation of thickness.In the future, Fuji Electric intends to apply auto-
mation to the welding work of all types of products in expectation that it will enhance maintainability and improve the quality of welding.
4. Postscript
In this paper, we described manufacturing reforms that apply IoT. To further advance this innovation, it will be important to integrate production technol-ogy with ICT technology, train IoT specialists such as data scientists and implement collaboration at the de-sign stage that is the origin of this development. We plan to continue to actively utilize Fuji Electric’s IoT products and systems, closely cooperate with related departments and promote further manufacturing re-forms.
References(1) Matsui, T. et al. Data Analysis Technology in Plant
Control. FUJI ELECTRIC REVIEW. 2014, vol.60, no.1, p.21-26.
certification program.(3) Automation of difficult welding work through
melting state sensingFor complex product structures, welding conditions
must be established according to the structure. There-fore, welding is done manually because it is difficult to automate using robots. In particular, when dealing with structures that varying greatly in thickness, the technician must control the feeding operation of the welding torch while visually checking the melting state in order to ensure stable welding beads.
Fuji Electric is developing an automated welding technology for structures that are difficult to weld by using robot control that utilizes melting state sensing technology.
An image sensor mounted to the hand of the ro-bot detects changes in the melting state and provides feedback for the operation of the robot. As a result, the feed rate of the welding torch is controlled to maintain a stable melting state at all times.
This technology will make it possible to automate the confirmation and judgment that are currently visu-ally performed by skilled technicians, thereby enabling stable welding beads even for structures with a large

issu
e: N
ew V
alue
-Cre
atin
g So
lutio
ns S
tarti
ng F
rom
IoT
A B S T R A C T
* Food & Beverage Distribution Business Group, Fuji Electric Co., Ltd.
127
1. Introduction
In recent years, vending machine sales have been decreasing due to competition from large retailers and convenience stores. As a result, beverage manufactur-ers need their vending machines to be differentiated from those of other companies. To meet this need, Fuji Electric has been promoting the proliferation of digital signage vending machines since 2010 as vending ma-chines that display product images on large displays.
The Japanese market for digital signage equip-ment has been increasing year by year. Furthermore, by the time of the Olympic and Paralympic Games Tokyo 2020, we expect that the demand for digital sig-nage vending machines will grow greatly and double in number compared with 2017 (see Fig. 1).
Fuji Electric has been developing an advertise-
TAKAMATSU, Eiji * MORITA, Masahiro * TOKUMASU, Takumi *
New Information Service Solutions Utilizing Vending Machines
Fuji Electric has developed a digital signage vending machine with an advertisement distribution system that can provide product images and advertisements as well as relevant market information as part of value-added services leveraging IoT. The vending machine displays advertisements and product images on the front screen, and it is coor-dinated with a content server. The control module is equipped with functions to control the switch of advertising con-tent, connect applications and services, ensure secure network connection, update the product images on display, and gather and compile market information. It can also use visual data gathered using a camera to analyze and ag-gregate market information.
ment distribution system and digital signage vending machine that provide sales information while simulta-neously displaying images and advertisements of prod-ucts as a value-added service utilizing the Internet of things (IoT). This paper describes our new information service solution that utilizes this advertisement distri-bution system and digital signage vending machine.
2. Overview of the Advertisement Distribution System
Figure 2 shows an overview of our newly developed advertisement distribution system. Advertiser content is provided to the advertisement distribution system through an advertising agency. After this, it is deliv-ered to each vending machine at a specified date and time by using the advertisement distribution function of the advertisement distribution system. Vending machines then combine the distributed advertisements and product images to display the content on the front screen.
The vending machine transmits the display his-Advertisement feeContent creationSystem sales/construction
2015
128,049
2016
148,775
2017(forecast)
178,920
2018(forecast)
(fiscal year)
232,125
2019(forecast)
280,075
2020(forecast)
336,170
2021(forecast)
319,905
400,000(millions of JPY)
200,000
0
Fig.1 Market size for digital signage vending machines in Japan
Advertisingagencies
(Advertisers)
Fuji Electricadvertisement
distribution system
Advertisement distribution
Display historyMarket
information
Content
Vending machineoperator
Display resultsMarket
information
Adver-tisementdisplay
Fig.2 Overview of the advertisement distribution system
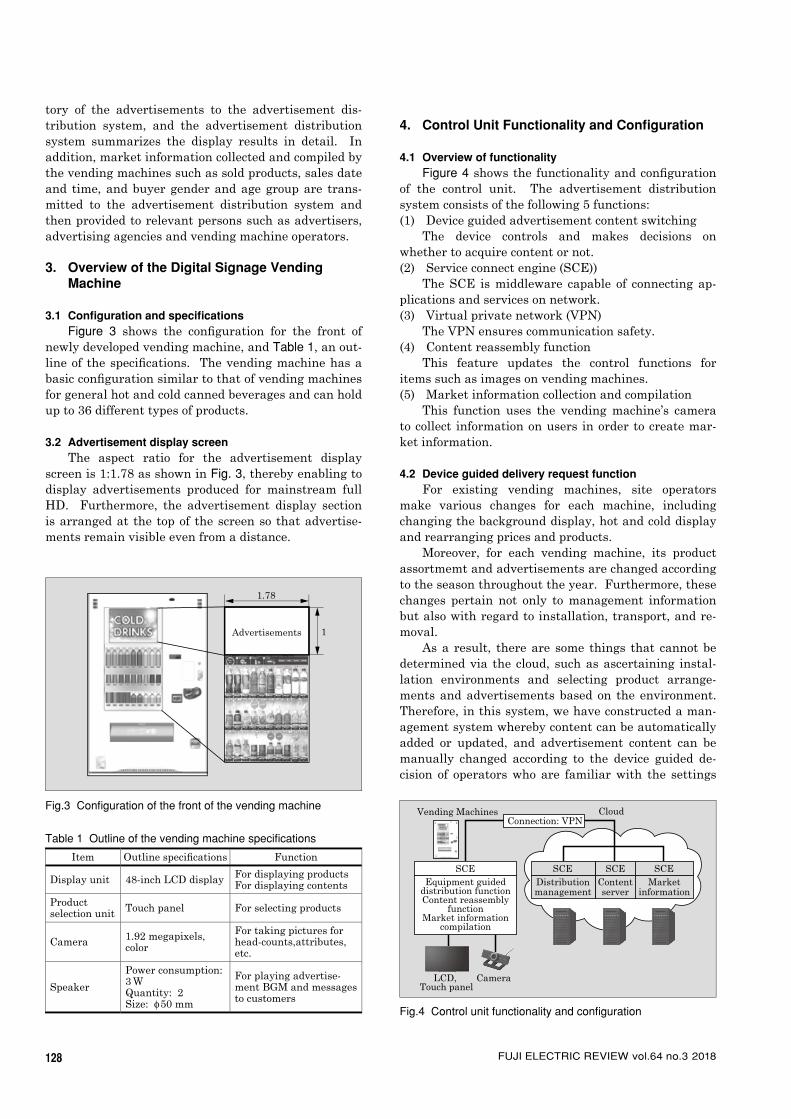
128 FUJI ELECTRIC REVIEW vol.64 no.3 2018
tory of the advertisements to the advertisement dis-tribution system, and the advertisement distribution system summarizes the display results in detail. In addition, market information collected and compiled by the vending machines such as sold products, sales date and time, and buyer gender and age group are trans-mitted to the advertisement distribution system and then provided to relevant persons such as advertisers, advertising agencies and vending machine operators.
3. Overview of the Digital Signage Vending Machine
3.1 Confi guration and specifi cationsFigure 3 shows the confi guration for the front of
newly developed vending machine, and Table 1, an out-line of the specifi cations. The vending machine has a basic confi guration similar to that of vending machines for general hot and cold canned beverages and can hold up to 36 different types of products.
3.2 Advertisement display screenThe aspect ratio for the advertisement display
screen is 1:1.78 as shown in Fig. 3, thereby enabling to display advertisements produced for mainstream full HD. Furthermore, the advertisement display section is arranged at the top of the screen so that advertise-ments remain visible even from a distance.
4. Control Unit Functionality and Confi guration
4.1 Overview of functionalityFigure 4 shows the functionality and confi guration
of the control unit. The advertisement distribution system consists of the following 5 functions:(1) Device guided advertisement content switching
The device controls and makes decisions on whether to acquire content or not.(2) Service connect engine (SCE))
The SCE is middleware capable of connecting ap-plications and services on network.(3) Virtual private network (VPN)
The VPN ensures communication safety.(4) Content reassembly function
This feature updates the control functions for items such as images on vending machines.(5) Market information collection and compilation
This function uses the vending machine’s camera to collect information on users in order to create mar-ket information.
4.2 Device guided delivery request functionFor existing vending machines, site operators
make various changes for each machine, including changing the background display, hot and cold display and rearranging prices and products.
Moreover, for each vending machine, its product assortmemt and advertisements are changed according to the season throughout the year. Furthermore, these changes pertain not only to management information but also with regard to installation, transport, and re-moval.
As a result, there are some things that cannot be determined via the cloud, such as ascertaining instal-lation environments and selecting product arrange-ments and advertisements based on the environment. Therefore, in this system, we have constructed a man-agement system whereby content can be automatically added or updated, and advertisement content can be manually changed according to the device guided de-cision of operators who are familiar with the settings
1.78
Advertisements 1
Fig.3 Confi guration of the front of the vending machine
Table 1 Outline of the vending machine specifi cations
Item Outline specifi cations Function
Display unit 48-inch LCD display For displaying productsFor displaying contents
Product selection unit Touch panel For selecting products
Camera 1.92 megapixels, color
For taking pictures for head-counts,attributes, etc.
Speaker
Power consumption: 3 WQuantity: 2Size: φ50 mm
For playing advertise-ment BGM and messages to customers
SCEContentserver
Marketinformation
SCE SCEDistributionmanagement
SCEEquipment guided
distribution functionContent reassembly
functionMarket information
compilation
Connection: VPNVending Machines Cloud
LCD, Touch panel
Camera
Fig.4 Control unit functionality and confi guration

129New Information Service Solutions Utilizing Vending Machines
issu
e: N
ew V
alue
-Cre
atin
g So
lutio
ns S
tarti
ng F
rom
IoT
and state of each particular vending machine. Figure 5 shows an overview of the device guided advertisement switching function.
(a) The vending machine retrieves the latest infor-mation from the list of distribution management content [see Fig. 5(1)].
(b) It determines the content to be acquired from in-formation such as version number [see Fig. 5(2)].
(c) It contacts the content server to retrieve the con-tent [see Fig. 5(3)].
(d) It enables site operators to manually or auto-matically update the content [see Fig. 5(4)].
4.3 Network application connected middleware (SCE)As shown in Fig. 6, the SCE connects applications
that were developed in different languages (Java*1, C, etc.) on different hardware and on different operating systems.
Conventionally, the embedded software in our vending machines has run on middleware (software that acts as a bridge between the OS and the applica-tions) that was independently developed by Fuji Elec-tric using the programming languages such as C.
In addition to controlling sales and such in a man-ner similar to conventional vending machines through this middleware, the application developed this time controls the image display and touch panel features. Moreover, it also connects to other third party services provided in the cloud.
Therefore, we expanded the functionality of data-distributing middleware by enabling events to be shared between applications running on different hardware. By doing this, we have been able to achieve a lightweight middleware connection that focuses on the way services are called (service name, events, parameters) from applications running on the above-
mentioned middleware developed by Fuji Electric.The SCE manages communication related services
and protocols such as HTTPS. As a result, the SCE makes it possible for developers to create applications without being aware of what hardware the application or service will run on or what communications protocol it will use.
4.4 Virtual private network (VPN)As a countermeasure against crimes such as tam-
pering with or spoofi ng advertising content and prod-uct display images, the vending machine and servers are securely connected to the cloud and terminals us-ing a VPN as shown in Fig. 7.
The VPN that we utilize this time is a software vir-tualization technology for LAN cards, communication channels and switching hubs. The main features are as follows:
(a) It is a low cost solution.(b) It has a high fi le transfer speed.(c) It makes 1:N confi gurations easy.
4.5 Content reassemblyThe advertisement and product arrangement screen
of vending machines is subject to many customer requirements such as those related to its operation, display effect, position, color and size. When design-ing applications that meet the various requirements of customers, we have separated and organized ap-plication features to eliminate complexity by adopting the MVC (model-view-controller) architectural pattern, which is known for its use in GUI design with object-oriented language. Screen-related applications consist of these M-V-C components: (1) the model component for managing data structures related to content dis-play position, size and rotation, (2) the View compo-nent for managing the logic and assembly drawings (XML fi les) of various images displayed on the screen and (3) the control component for controlling the model component through external events. The content re-
VendingMachines
(4) Update according to on-site decision
(2) Selection of content to acquire
← Regis- tration
→ Acqui-sition
Content server (Fuji Electric)
Video materialScreen configuration definition
(Product management)Video program
- Latest version number -
Distribution management(Applicable equipment,
Content, Version, Date)
Vending Machines
(1) Retrieval of latest content information
(3) Retrieval of latest content required
Fig.5 Overview of device guided advertisement switching func-tion
Product selection in conjunction with smartphone services
* Android is a trademark or registered trademark of Google LLC.** Linux is a trademark or registered trademark of Linus Torvalds in Japan and other countries
Vending machine control
SCE(C)
LinuxHardware
(ARM)
Vending machine control
SCE(C)
LinuxHardware
(ARM)
Vending machine control
SCE(C)Linux**
Hardware(ARM)
Product selection
SCE(Java)
Android*
Smartphone
Fig.6 SCE concepts
*1: Java is a trademark or registered trademark of Oracle Corporation and its subsidiary and affi liate companies in the United States and other countries

130 FUJI ELECTRIC REVIEW vol.64 no.3 2018
5. Implementation of Demonstration Experiment
In order to demonstrate the effectiveness of the ad-vertisement distribution system, the vending machine was installed at an actual site to collect data as shown in Fig. 9.
In the demonstration experiment, we not only con-sidered the effect of the presence or absence of adver-tisements, but also endeavored to establish a selection method for displaying advertisements based on market information.
assembly application enables the vending machine to update images with the content received from the advertisement distribution system based on assembly drawings when the operator updates or powers on the machine.
4.6 Collection and compilation of market informationMany digital signage systems unilaterally display
images on the display. Therefore, an operator needs to stand near the machine to measure the effectiveness of the advertisements. In contrast to this, our recently developed vending machine automatically collects de-tailed market information that includes not only data on sold products and the time and date of the sale, but also the gender and age of the customer by using the built-in camera.
In addition, content providers such as advertisers are also interested in whether they can adequately ap-peal to potential customers using the displayed con-tent. Therefore, the machine is also able to provide viewable information based on time, number of people, age, gender and eye gaze. This information is valuable to advertising agencies also when soliciting advertis-ers.
Furthermore, vending machine installation com-panies can predict sales by using the market informa-tion data and thus select appropriate product arrange-ments according to the location.
The built-in camera detects facial orientation and eye gaze for customers who want to ensure that their advertisements are being viewed. Moreover, from the viewpoint of personal information protection, only the following data is saved, which cannot be used to iden-tify individual persons:
(a) Number of persons(b) Age(c) Gender (d) Facial orientation(e) Eye gaze
Furthermore, market information can be analyzed and aggregated using the data collected by the camera (see Fig. 8).
Application(Advertisement display)
Vending Machines Internet network
Application(Camera control)
LAN card
LAN card
Log management
LAN card
Schedule management
Server (distribution management)
Server (content)
VPN tunnel
Encrypts all data that passes through the communication path
VPN tunnel
Virtual LAN card
Virtual LAN card
Virtual LAN card
Virtual hub
Virtual LAN card
Fig.7 Example of software virtual VPN
Analysis data example○No. of passersby○No. of viewers○Viewing time○Passersby by time period○Viewers by time period○Viewing ratio○Product purchase ratio, etc.
Fig.8 Experiment analysis charts
Fig.9 Demonstration experiment unit

131New Information Service Solutions Utilizing Vending Machines
issu
e: N
ew V
alue
-Cre
atin
g So
lutio
ns S
tarti
ng F
rom
IoT
In the future, Fuji Electric will be committed to even more precise sales forecasts employing multivariate analysis and probability inference, allowing our cus-tomers to achieve optimization in sales promotion by using future forecast in addition to the analysis results of collected data.
6. Postscript
In this paper, we described our new information service solution that utilizes vending machines. Using the advertisement distribution system that we devel-oped can collect various types of market information.
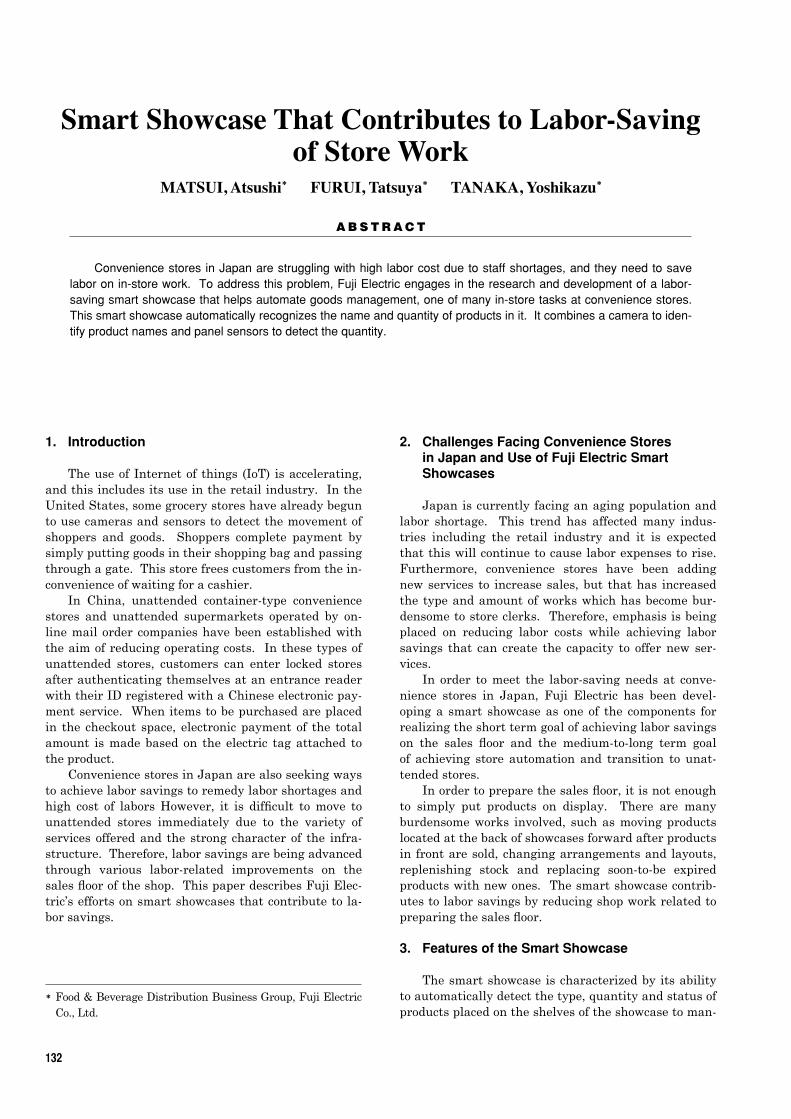
A B S T R A C T
* Food & Beverage Distribution Business Group, Fuji Electric Co., Ltd.
132
1. Introduction
The use of Internet of things (IoT) is accelerating, and this includes its use in the retail industry. In the United States, some grocery stores have already begun to use cameras and sensors to detect the movement of shoppers and goods. Shoppers complete payment by simply putting goods in their shopping bag and passing through a gate. This store frees customers from the in-convenience of waiting for a cashier.
In China, unattended container-type convenience stores and unattended supermarkets operated by on-line mail order companies have been established with the aim of reducing operating costs. In these types of unattended stores, customers can enter locked stores after authenticating themselves at an entrance reader with their ID registered with a Chinese electronic pay-ment service. When items to be purchased are placed in the checkout space, electronic payment of the total amount is made based on the electric tag attached to the product.
Convenience stores in Japan are also seeking ways to achieve labor savings to remedy labor shortages and high cost of labors However, it is difficult to move to unattended stores immediately due to the variety of services offered and the strong character of the infra-structure. Therefore, labor savings are being advanced through various labor-related improvements on the sales floor of the shop. This paper describes Fuji Elec-tric’s efforts on smart showcases that contribute to la-bor savings.
MATSUI, Atsushi * FURUI, Tatsuya * TANAKA, Yoshikazu *
Smart Showcase That Contributes to Labor-Saving of Store Work
Convenience stores in Japan are struggling with high labor cost due to staff shortages, and they need to save labor on in-store work. To address this problem, Fuji Electric engages in the research and development of a labor-saving smart showcase that helps automate goods management, one of many in-store tasks at convenience stores. This smart showcase automatically recognizes the name and quantity of products in it. It combines a camera to iden-tify product names and panel sensors to detect the quantity.
2. Challenges Facing Convenience Stores in Japan and Use of Fuji Electric Smart Showcases
Japan is currently facing an aging population and labor shortage. This trend has affected many indus-tries including the retail industry and it is expected that this will continue to cause labor expenses to rise. Furthermore, convenience stores have been adding new services to increase sales, but that has increased the type and amount of works which has become bur-densome to store clerks. Therefore, emphasis is being placed on reducing labor costs while achieving labor savings that can create the capacity to offer new ser-vices.
In order to meet the labor-saving needs at conve-nience stores in Japan, Fuji Electric has been devel-oping a smart showcase as one of the components for realizing the short term goal of achieving labor savings on the sales floor and the medium-to-long term goal of achieving store automation and transition to unat-tended stores.
In order to prepare the sales floor, it is not enough to simply put products on display. There are many burdensome works involved, such as moving products located at the back of showcases forward after products in front are sold, changing arrangements and layouts, replenishing stock and replacing soon-to-be expired products with new ones. The smart showcase contrib-utes to labor savings by reducing shop work related to preparing the sales floor.
3. Features of the Smart Showcase
The smart showcase is characterized by its ability to automatically detect the type, quantity and status of products placed on the shelves of the showcase to man-

133Smart Showcase That Contributes to Labor-Saving of Store Work
issu
e: N
ew V
alue
-Cre
atin
g So
lutio
ns S
tarti
ng F
rom
IoT
age the products actually displayed in the showcase.This product management contributes to labor-
saving. For example, when replenishing products, clerks can check what products and how many of them need to be replenished from anywhere in the store, and this helps eliminate carrying out unnecessary products to the sales floor and decreases the number of trips to and from the stockroom. Furthermore, this feature help improve the efficiency of the sales floor because clerks can check the state of showcases and find the lo-cation of products that need to be moved forward with-out walking around the sales floor.
In the smart showcase, it is assumed that identi-cal products are arranged depthwise, and on the basis of this, the showcase identifies the name and position of frontmost products with the product name identifi-cation controller and detects how many products are placed in depthwise with the panel sensor controller.
As shown in Fig. 1, the smart showcase system mainly consists of the following devices: (1) Product name identification controller
It identifies frontmost items using images taken with a camera.(2) Panel sensor controller
It detects how many products are on the shelves of the showcase.(3) Management controller
It centrally manages data received from the prod-uct name identification controller and the panel sensor controllers to notify the in-store tablets of the types, quantity and status of products.(4) In-store tablet
It displays information to help the clerk check the showcase’s product display condition.
The point of sales (POS) system has been intro-duced as a system for managing products in conve-nience stores and is characterized by its ability to man-age the quantity of stock for the entire store. There-fore, the POS system alone cannot determine whether
products are on a showcase or in the stockroom. In contrast to this, the smart showcase makes it possible to know what products are on the showcase, thus en-abling clerks to manage the number of products actu-ally placed on the sale floor.
In this regard, the Ministry of Economy, Trade and Industry has formulated the “Declaration of Plan to Introduce 100 Billion Electronic Tags for Products in Convenience Stores Formulated”(1) as an initiative to attach electric tags to all products handled by conve-nience stores by 2025 in order to facilitate individual product management. Electric tags provide several advantages such as the ability to read multiple electric tags at once from a distance, write IDs to individually identify products and manage information such as ex-piration dates. The challenge is to reduce the cost of electric tags and the cost of attaching them.
On the other hand, smart showcase cameras and panel sensors can identify products and detect quan-tity without having to attach an electric tag to prod-ucts. Furthermore, unlike electric tags, it can detect the exact position of products, and in this regard, we expect that the smart showcases will be used in com-bination with electric tags in the future to enhance the identifying function for product location.
4. Product Identification and Detection Technology
4.1 Product name identification controllerThe product name identification controller con-
sists of a camera control component and product name identification component. The camera is connected via Gigabit Ethernet through a Power over Ethernet (PoE) hub. The PoE hub is used to supply power to the cam-era.
As shown in Fig. 2, the camera should be installed on the ceiling of a store with a height of approximately 2.5 m. A single camera is used to capture images of the entire product display for each individual show-case. For the product imaging system, we also con-sidered mounting a camera to the ceiling of each shelf of the showcase to capture images directly above the products and mounting a camera at the foremost part
PoE hub
Panel sensors
Camera
・ ・ ・
Showcase
Product nameidentification
controller
In-storetablet
In-storetabletWireless
LAN routerManagement
controller
In-store network
Panel sensorcontroller
Panel sensors
Camera
・ ・ ・
Showcase
Panel sensorcontroller
Panel sensors
Camera
・ ・ ・
Showcase
Panel sensorcontroller
Fig.1 System configuration diagram
Camera
Approx. 2.5 m
Approx. 1.5 m
Showcase(side)
Ceiling
Fig.2 Relationship between the showcase and camera position
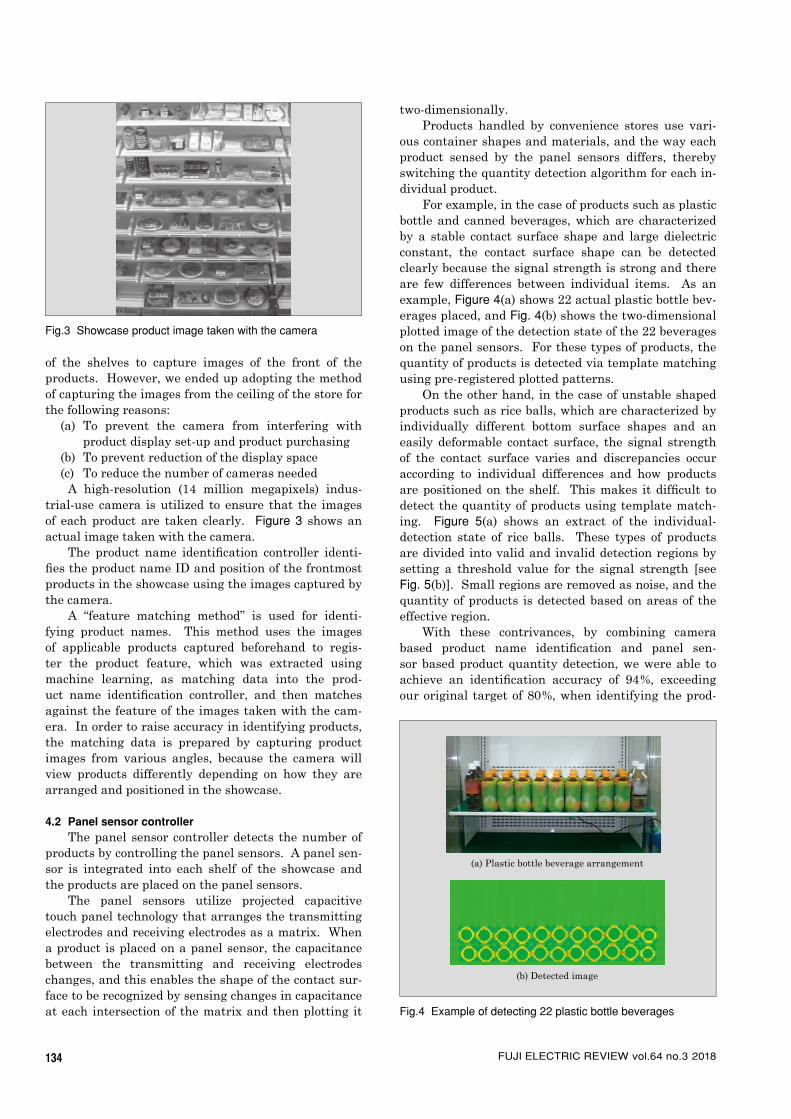
134 FUJI ELECTRIC REVIEW vol.64 no.3 2018
of the shelves to capture images of the front of the products. However, we ended up adopting the method of capturing the images from the ceiling of the store for the following reasons:
(a) To prevent the camera from interfering with product display set-up and product purchasing
(b) To prevent reduction of the display space(c) To reduce the number of cameras needed
A high-resolution (14 million megapixels) indus-trial-use camera is utilized to ensure that the images of each product are taken clearly. Figure 3 shows an actual image taken with the camera.
The product name identifi cation controller identi-fi es the product name ID and position of the frontmost products in the showcase using the images captured by the camera.
A “feature matching method” is used for identi-fying product names. This method uses the images of applicable products captured beforehand to regis-ter the product feature, which was extracted using machine learning, as matching data into the prod-uct name identifi cation controller, and then matches against the feature of the images taken with the cam-era. In order to raise accuracy in identifying products, the matching data is prepared by capturing product images from various angles, because the camera will view products differently depending on how they are arranged and positioned in the showcase.
4.2 Panel sensor controllerThe panel sensor controller detects the number of
products by controlling the panel sensors. A panel sen-sor is integrated into each shelf of the showcase and the products are placed on the panel sensors.
The panel sensors utilize projected capacitive touch panel technology that arranges the transmitting electrodes and receiving electrodes as a matrix. When a product is placed on a panel sensor, the capacitance between the transmitting and receiving electrodes changes, and this enables the shape of the contact sur-face to be recognized by sensing changes in capacitance at each intersection of the matrix and then plotting it
two-dimensionally.Products handled by convenience stores use vari-
ous container shapes and materials, and the way each product sensed by the panel sensors differs, thereby switching the quantity detection algorithm for each in-dividual product.
For example, in the case of products such as plastic bottle and canned beverages, which are characterized by a stable contact surface shape and large dielectric constant, the contact surface shape can be detected clearly because the signal strength is strong and there are few differences between individual items. As an example, Figure 4(a) shows 22 actual plastic bottle bev-erages placed, and Fig. 4(b) shows the two-dimensional plotted image of the detection state of the 22 beverages on the panel sensors. For these types of products, the quantity of products is detected via template matching using pre-registered plotted patterns.
On the other hand, in the case of unstable shaped products such as rice balls, which are characterized by individually different bottom surface shapes and an easily deformable contact surface, the signal strength of the contact surface varies and discrepancies occur according to individual differences and how products are positioned on the shelf. This makes it diffi cult to detect the quantity of products using template match-ing. Figure 5(a) shows an extract of the individual-detection state of rice balls. These types of products are divided into valid and invalid detection regions by setting a threshold value for the signal strength [see Fig. 5(b)]. Small regions are removed as noise, and the quantity of products is detected based on areas of the effective region.
With these contrivances, by combining camera based product name identifi cation and panel sen-sor based product quantity detection, we were able to achieve an identifi cation accuracy of 94%, exceeding our original target of 80%, when identifying the prod-
Fig.3 Showcase product image taken with the camera
(a) Plastic bottle beverage arrangement
(b) Detected image
Fig.4 Example of detecting 22 plastic bottle beverages

135Smart Showcase That Contributes to Labor-Saving of Store Work
issu
e: N
ew V
alue
-Cre
atin
g So
lutio
ns S
tarti
ng F
rom
IoT
6. Postscript
This paper described a smart showcase that con-tributes to store labor savings. In the future, we plan to continue to expand the number of applicable prod-ucts and improve the identification accuracy of product names, quantity and status.
The use of IoT has great potential in convenience store and supermarket applications because it achieves labor savings for the store and improves the conve-nience of customers. High-quality sensing technology is essential for utilizing IoT, and as such, we plan to continue developing sensing technology as we develop and release products and systems that provide high customer value.
References(1) Ministry of Economy, Trade and Industry, “Declara-
tion of Plan to Introduce 100 Billion Electronic Tags for Products in Convenience Stores Formulated: To solve social challenges lying in supply chains”. 2017-04-18. http: / /www.meti.go.jp /english/press /2017/0418_003.html, (accessed 2018-06-18).
uct names, quantity and status of 70 typical conve-nience store products, such as beverages and rice balls, that were placed on the showcase shelves.
5. Application Example
A prototype of the smart showcase was exhibited at the Supermarket Trade Show in February 2018. Figure 6 shows the prototype. Panel sensors were in-stalled for the prototype on the third shelf from the top. A camera was not used due to circumstances at the exhibition hall, and thus the position and type of frontmost products were fixed. The prototype dis-played a list of names, quantity and items requiring replenishment on the screen for 10 different types of products. A demonstration was provided in which the quantity and items requiring replenishment changed in real time as products were removed from the shelf. The smart showcase was very popular, especially for the fact that it did not require the use of electric tags.
Signal values
60 to 7050 to 6040 to 5030 to 4020 to 3010 to 200 to 10−10 to 0−20 to −10−30 to −20−40 to −30
Invalid regionValid region
(a) Rice ball signal values (contour)
(b) Rice ball signal values(after separating valid and invalid regions)
Fig.5 Detecting individual rice ball (excerpt)
Fig.6 Smart showcase prototype
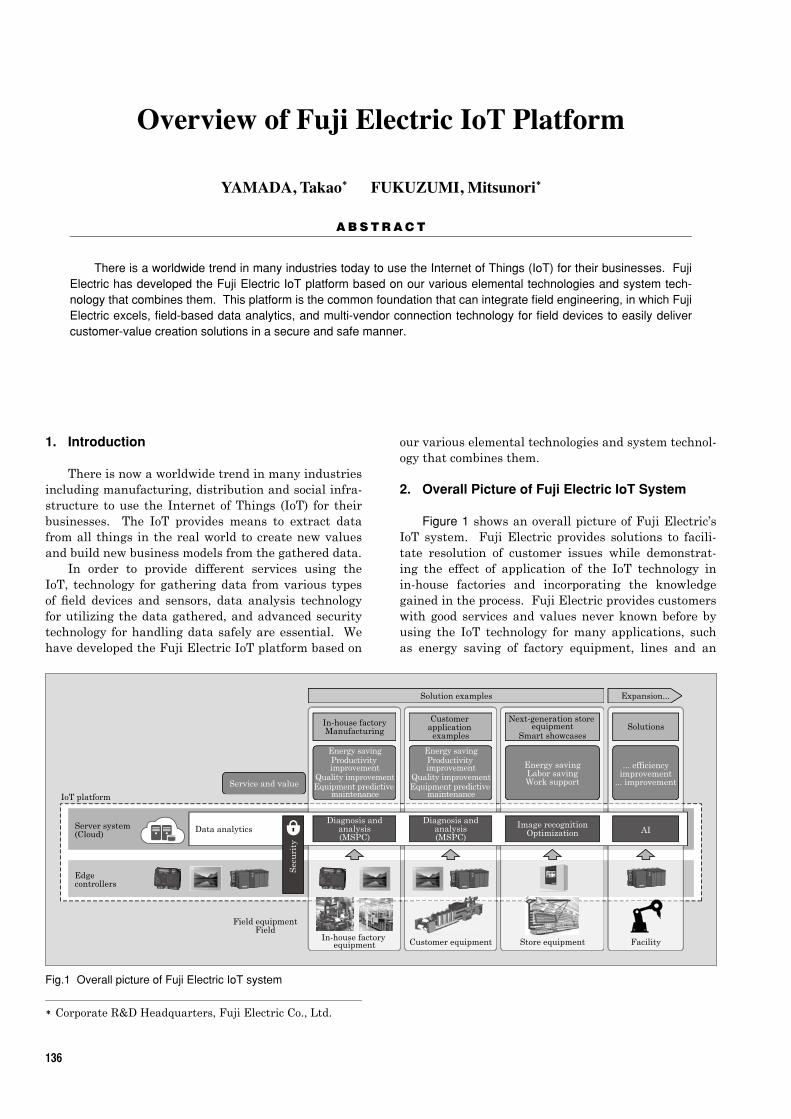
A B S T R A C T
* Corporate R&D Headquarters, Fuji Electric Co., Ltd.
136
1. Introduction
There is now a worldwide trend in many industries including manufacturing, distribution and social infra-structure to use the Internet of Things (IoT) for their businesses. The IoT provides means to extract data from all things in the real world to create new values and build new business models from the gathered data.
In order to provide different services using the IoT, technology for gathering data from various types of fi eld devices and sensors, data analysis technology for utilizing the data gathered, and advanced security technology for handling data safely are essential. We have developed the Fuji Electric IoT platform based on
YAMADA, Takao * FUKUZUMI, Mitsunori *
Overview of Fuji Electric IoT Platform
There is a worldwide trend in many industries today to use the Internet of Things (IoT) for their businesses. Fuji Electric has developed the Fuji Electric IoT platform based on our various elemental technologies and system tech-nology that combines them. This platform is the common foundation that can integrate fi eld engineering, in which Fuji Electric excels, fi eld-based data analytics, and multi-vendor connection technology for fi eld devices to easily deliver customer-value creation solutions in a secure and safe manner.
our various elemental technologies and system technol-ogy that combines them.
2. Overall Picture of Fuji Electric IoT System
Figure 1 shows an overall picture of Fuji Electric’s IoT system. Fuji Electric provides solutions to facili-tate resolution of customer issues while demonstrat-ing the effect of application of the IoT technology in in-house factories and incorporating the knowledge gained in the process. Fuji Electric provides customers with good services and values never known before by using the IoT technology for many applications, such as energy saving of factory equipment, lines and an
AI
Facility
Solutions
Image recognitionOptimization
Store equipment
Next-generation store equipment
Smart showcases
Diagnosis andanalysis(MSPC)
Customer equipment
Customer application examples
Service and value
IoT platform
Server system(Cloud)
Edge controllers
Diagnosis andanalysis(MSPC)
Data analytics
Field equipmentField
Solution examples Expansion...
In-house factory equipment
In-house factoryManufacturing
Sec
uri
ty
... efficiencyimprovement
... improvement
Energy savingLabor savingWork support
Energy savingProductivity improvement
Quality improvementEquipment predictive
maintenance
Energy savingProductivity improvement
Quality improvementEquipment predictive
maintenance
Fig.1 Overall picture of Fuji Electric IoT system

137Overview of Fuji Electric IoT Platform
issu
e: N
ew V
alue
-Cre
atin
g So
lutio
ns S
tarti
ng F
rom
IoT
entire factory, improvement of productivity and qual-ity and provision of predictive maintenance, and labor saving and support for workers in stores.
This platform is the common foundation that can integrate fi eld engineering, fi eld-based data analyt-ics, and connection technology for multi-vendor fi eld devices, in which Fuji Electric excels, to easily deliver customer-value creation solutions in a secure and safe manner. Figure 2 shows the confi guration of the IoT platform.
The IoT platform consists of edge controllers that gather fi eld data, a server system providing an execu-tion environment for service applications, communica-tion function to connect between them, security func-tion for protecting system operation and data analytics that analyzes the data gathered.
For this platform, Fuji Electric uses open-source software for cloud services, standard technologies (de facto standards) for the communication protocol and security, and our proprietary technologies for edge con-trollers and data analytics to achieve the portability and differentiation of the service applications.
3. IoT Platform
3.1 Server systemThe server system provides an execution environ-
ment for service applications that achieve services re-quired by customers. The server system is required to ensure high reliability and high stability in operation of service applications, to allow operation at low cost, and to readily accommodate addition of new services, customers and devices.
To meet these requirements, we built the server system on the basis of general-purpose cloud services. Cloud services are provided by various vendors (cloud vendors) and some customers may specify certain
vendors. As shown in Fig. 2, service applications are implemented via service interfaces in general-purpose cloud services in this confi guration. These service in-terfaces realize multi-vendor support, in which func-tional difference between cloud services provided by various cloud vendors is absorbed, to allow service ap-plications provided by Fuji Electric to be readily imple-mented in the cloud environment specifi ed by the user.
For the communication function to exchange data with edge controllers, Message Queue Telemetry Transport (MQTT), a standard protocol, has been ad-opted to allow easy connection with cloud services of other companies. An authentication function is also provided to identify the edge controller to communicate with and ensure safety of communications.
In addition, server system operation management is provided for monitoring to see if service applications are running normally. The functions of this operation management include registration, addition and change management of users and service applications, per-formance monitoring, resource monitoring, network monitoring and log monitoring for detecting abnormal conditions and the system operator is notifi ed of any abnormality detected (refer to “Server Systems Utiliz-ing General-Purpose Cloud Service” on page 140).
3.2 Edge controllersEdge controllers serve as gateway functions such
as gathering fi eld data and sending them to the server system in the upper level. Accordingly, they have the functions of security and communications with the server system in addition to interfaces for gathering data from fi eld devices.
Fuji Electric has built many systems for plant monitoring and factory line control and provided so-lutions for these applications by gathering and using their fi eld data. By taking advantage of the know-how in data gathering in the fi eld, which we have accumu-lated while establishing a track record, we have devel-oped edge controllers suited for applications and cost requirements to meet the demands from the fi eld for use of the IoT.
Edge controllers provided by Fuji Electric shown in Table 1 can be connected to a few hundred types of fi eld devices, including PLCs, inverters, NC machine tools and robots, allowing users to select devices suited for the respective applications and to facilitate intro-ducing the IoT on site.
These edge controllers do not only function as data
Service
Data analytics
Service Service
Service applications
IoT
pla
tfor
m
Sec
uri
tySer
ver
syst
em
Communicationfunction
Communication function
Service interface
General-purposecloud services
FiTSA Σ MONITOUCH SPH3000-IoT
Edge controllers
Field equipment
・ ・ ・
Fig.2 IoT platform
Table 1 Fuji Electric’s edge controllers and their characteristics
Model Characteristics
FiTSA Σ Compactness, high versatility and device connectivity
MONITOUCH V9-IoT
On-site real-time screen display and device connectivity
SPH3000-IoT High-speed real-time processing making use of features of PLC

138 FUJI ELECTRIC REVIEW vol.64 no.3 2018
gathering devices as they conventionally have but also have the functionality of primary processing of data in themselves without transferring raw data from the fi eld to the server to ensure security and reduce the load on the upper-level network. In addition, edge con-trollers can share real time processes for the advanced processes, such as data analysis, prediction and opti-mization, which have conventionally been performed only in a server system (called “edge heavy” process-ing). This feature provides solutions to fi elds where real-time response is required. Figure 3 shows the schematic diagram of edge heavy processing (refer to “Edge Controllers Connecting Field Devices and Cyber-space” on page 144).
3.3 SecurityConnecting all things to the network by IoT has
created new risks to things and their users.The risks include interference in services due to
unauthorized access to systems and falsifi cation and leakage of important information such as personal data and factory production information stored in IoT devices and systems. If the extent of the impact of attack reaches control of fi eld devices, life may be ex-posed to risks.
An environment must be built in which users can use fi eld devices, systems and services with a sense of security. Accordingly, Fuji Electric has formulated new security policies for the IoT system based on ISO/IEC27017:2015(1), an international standard, and IoT Security Guidelines(2). With the security policies at the core, we strive to reduce risks and protect important information by the management operation system for the organization and personnel and the technical and physical mechanisms, as shown in Fig. 4.
(1) Security measures by management operation sys-tem
As organizational measures Fuji Electric has built a system of systematically classifying information security-related risks and implementing management. We also have established frameworks of monitoring IoT systems and responding to incidents in the Fuji Electric Computer Security Incident Response Team (Fe-CSIRT), which responds to and prevents informa-tion security incidents generated in the Fuji Electric Group,
As personnel measures, we provide Fuji Electric employees with security education and training to raise awareness to strengthen security.(2) Security measures in mechanisms
As physical measures, we implement physical pro-tection of IoT devices and prevention of theft of infor-mation assets by entry management and locking up.
As technical measures, we employ advanced secu-rity technologies for each server system, edge control-ler and communication system to prevent information
Optimization Recognition
Big data
Modeling
DiagnosisAnalysis OptimizationPrediction
DiagnosisAnalysis Prediction
Recognition
Server system (cloud/on-premise)
Value
Field equipment
Value
Value
○Economy○Wide area
○Response○Adaptability
Edge heavy
Model
Internet/LAN
Edge controllers
Big dataBig data
Gateway Primaryprocessing
Fig.3 Schematic diagram of edge heavy processing
Personnel measures
Organiza-tional
measures
Technical measures
Physical measures
Securitypolicies(Rules)
Man
agem
ent
oper
atio
nsy
stem
Mec
han
ism
Fig.4 Concept of security
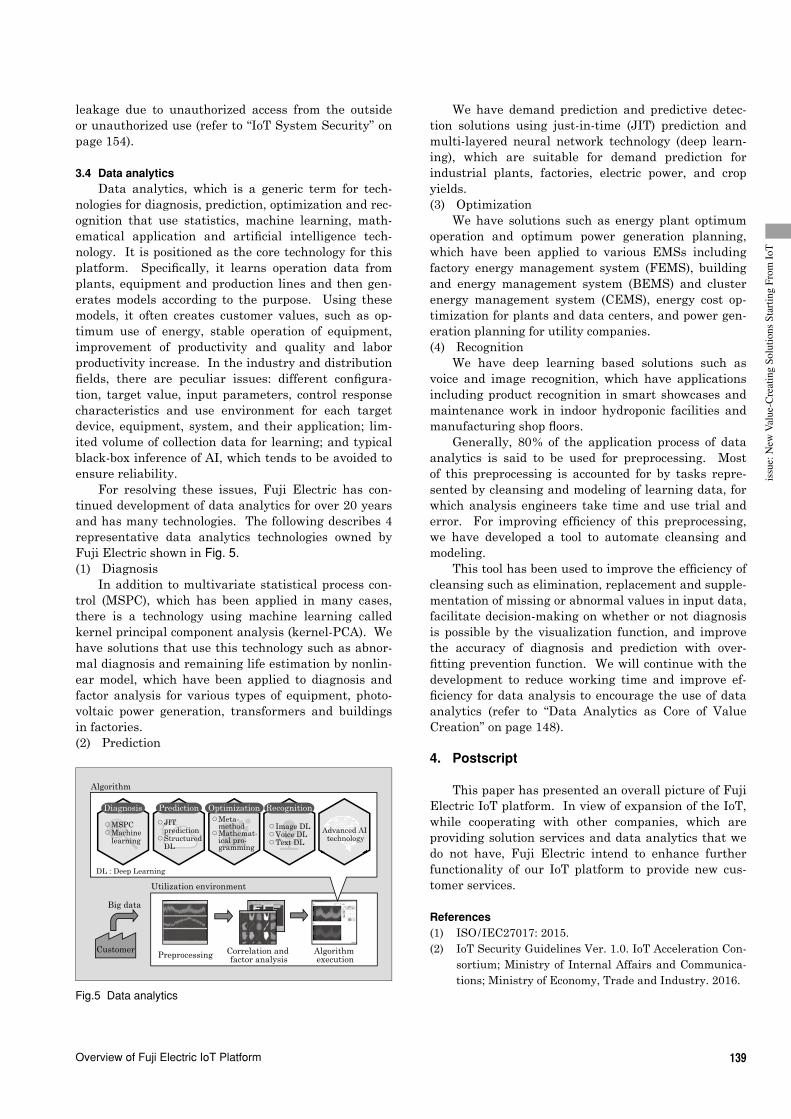
139Overview of Fuji Electric IoT Platform
issu
e: N
ew V
alue
-Cre
atin
g So
lutio
ns S
tarti
ng F
rom
IoT
We have demand prediction and predictive detec-tion solutions using just-in-time (JIT) prediction and multi-layered neural network technology (deep learn-ing), which are suitable for demand prediction for industrial plants, factories, electric power, and crop yields.(3) Optimization
We have solutions such as energy plant optimum operation and optimum power generation planning, which have been applied to various EMSs including factory energy management system (FEMS), building and energy management system (BEMS) and cluster energy management system (CEMS), energy cost op-timization for plants and data centers, and power gen-eration planning for utility companies.(4) Recognition
We have deep learning based solutions such as voice and image recognition, which have applications including product recognition in smart showcases and maintenance work in indoor hydroponic facilities and manufacturing shop fl oors.
Generally, 80% of the application process of data analytics is said to be used for preprocessing. Most of this preprocessing is accounted for by tasks repre-sented by cleansing and modeling of learning data, for which analysis engineers take time and use trial and error. For improving effi ciency of this preprocessing, we have developed a tool to automate cleansing and modeling.
This tool has been used to improve the effi ciency of cleansing such as elimination, replacement and supple-mentation of missing or abnormal values in input data, facilitate decision-making on whether or not diagnosis is possible by the visualization function, and improve the accuracy of diagnosis and prediction with over-fi tting prevention function. We will continue with the development to reduce working time and improve ef-fi ciency for data analysis to encourage the use of data analytics (refer to “Data Analytics as Core of Value Creation” on page 148).
4. Postscript
This paper has presented an overall picture of Fuji Electric IoT platform. In view of expansion of the IoT, while cooperating with other companies, which are providing solution services and data analytics that we do not have, Fuji Electric intend to enhance further functionality of our IoT platform to provide new cus-tomer services.
References(1) ISO/IEC27017: 2015.(2) IoT Security Guidelines Ver. 1.0. IoT Acceleration Con-
sortium; Ministry of Internal Affairs and Communica-tions; Ministry of Economy, Trade and Industry. 2016.
leakage due to unauthorized access from the outside or unauthorized use (refer to “IoT System Security” on page 154).
3.4 Data analyticsData analytics, which is a generic term for tech-
nologies for diagnosis, prediction, optimization and rec-ognition that use statistics, machine learning, math-ematical application and artifi cial intelligence tech-nology. It is positioned as the core technology for this platform. Specifi cally, it learns operation data from plants, equipment and production lines and then gen-erates models according to the purpose. Using these models, it often creates customer values, such as op-timum use of energy, stable operation of equipment, improvement of productivity and quality and labor productivity increase. In the industry and distribution fi elds, there are peculiar issues: different confi gura-tion, target value, input parameters, control response characteristics and use environment for each target device, equipment, system, and their application; lim-ited volume of collection data for learning; and typical black-box inference of AI, which tends to be avoided to ensure reliability.
For resolving these issues, Fuji Electric has con-tinued development of data analytics for over 20 years and has many technologies. The following describes 4 representative data analytics technologies owned by Fuji Electric shown in Fig. 5.(1) Diagnosis
In addition to multivariate statistical process con-trol (MSPC), which has been applied in many cases, there is a technology using machine learning called kernel principal component analysis (kernel-PCA). We have solutions that use this technology such as abnor-mal diagnosis and remaining life estimation by nonlin-ear model, which have been applied to diagnosis and factor analysis for various types of equipment, photo-voltaic power generation, transformers and buildings in factories.(2) Prediction
Algorithm
Utilization environment
DL : Deep Learning
CustomerPreprocessing Correlation and
factor analysisAlgorithm execution
Big data
○JIT prediction○Structured DL
Prediction○Meta- method○Mathemat- ical pro- gramming
Optimization
○Image DL○Voice DL○Text DL
Recognition
Advanced AI technology
○MSPC○Machine learning
Diagnosis
Fig.5 Data analytics

A B S T R A C T
* Corporate R&D Headquarters, Fuji Electric Co., Ltd.⁑Power Electronics Systems Business Group, Fuji Electric
Co., Ltd.
140
1. Introduction
Fuji Electric has developed the Fuji Electric IoT platform for the purpose of prevalence of the Internet of Things (IoT) service business. Figure 1 shows the confi guration of the platform. On the Fuji Electric IoT platform, the part that offers an execution envi-ronment for service applications to provide services required by customers is called server system, which has been built by using general-purpose cloud services. Use of general-purpose cloud services allows infra-structure and hardware resources to be fl exibly added
MIYAZAKI, Tsuyoshi * KITAMURA, Takashi ⁑ TAKEUCHI, Osamu ⁑
Server Systems Utilizing General-Purpose Cloud Service
Fuji Electric has developed a server system that offers an execution environment for IoT services using ser-vice applications on a general-purpose cloud service. It absorbs the difference between the cloud services provided by various cloud vendors, allowing service applications to have portability between cloud vendors. Other features include communicating with edge controllers, saving gathered data on the database and monitoring the states of running service applications and resource load. Utilizing server systems allows Fuji Electric to quickly deliver high-quality IoT services that increase customer value.
or deleted according to the scale of the customer. This facilitates reduction of the lead-time for providing a new IoT service, allowing users to reduce the initial and running costs. It also reduces the troublesome task of operation and maintenance because trouble-shooting during operation is left to cloud vendors. In addition, backing up in multiple locations provided by cloud vendors allows the platform to be highly resis-tant to disasters, such as earthquakes and fl oods.
This paper presents an overall picture of the server system on the Fuji Electric IoT platform together with the individual functions that constitute the server sys-tem.
2. Server System
The server system on the Fuji Electric IoT plat-form is required to have the following features:
(a) Ease of system construction with a small-scale confi guration
(b) Ease of resource expansion by addition of IoT services and edge controllers
(c) Capability of providing services linked with edge controllers and services of other companies
(d) Capability to ensure security(e) Capability of stable operation and ease of opera-
tion and maintenance(f) Capability of offering services to overseas cus-
tomers(g) Continued provision of existing services pro-
vided on premise*1
Figure 2 shows the structure of the server system. To meet these requirements, we have adopted general-
*1: On-premises: Installing and operating information sys-tems, including servers and software, on the premises managed by the user (generally a company)
Service
Data analytics
Service Service
Service applications
IoT
pla
tfor
m
Sec
uri
tySer
ver
syst
em
Communicationfunction
Communication function
Service interface
General-purposecloud services
FiTSA Σ MONITOUCH SPH3000-IoT
Edge controllers
Field equipment
・ ・ ・
Fig.1 Confi guration of Fuji Electric IoT platform

141Server Systems Utilizing General-Purpose Cloud Service
issu
e: N
ew V
alue
-Cre
atin
g So
lutio
ns S
tarti
ng F
rom
IoT
purpose cloud services provided by cloud vendors (see Table 1) for the server system and developed the func-tions described as follows:(1) Service interface function
This function provides common interface that is used to achieve portability between different cloud ven-dors for service applications and effi ciently develop ser-vice applications for users.(2) Edge controller data communication function
This function provides communication with edge controllers responsible for gathering data in the fi eld and stores this data in a distributed data store.(3) Operation management support function
This function monitors the service application run-ning state and resource load state and notify any error
generated to improve service operation quality.
3. Service Interface Function
This function is required to provide the following features:
(a) Multi-vendor support in view of the case that the customer specify a specifi c cloud vendor
(b) Capable of quickly adding service applications and increasing the number of users
(c) Ensured sense of security for users in the use of service applications
(d) Support for various Web browsers(e) Capability of high-speed handling of data of var-
ious formats (numeric value, text, image, voice)(f) Support for existing services
To meet these requirements, we have developed the following 4 types of interfaces.
3.1 Database access interfaceThe database access interface is used to access the
relational database (RDB) and distributed data store provided by general-purpose cloud services.
Cloud vendors employ their own particular RDB and distributed data store for their general-purpose cloud services, and the difference between different vendor’s databases must be absorbed within the data-base access interface. To deal with this issue, we have developed the common interface through which service applications access databases. This interface absorbs the database difference by individually implementing processes for accessing different types of databases. This has made various general-purpose cloud services available for use without depending on specifi c cloud vendors. As a database, using distributed data store capable of accumulating text and binary data allows users to handle various data formats.
Operation management support function
Server system
General-purpose cloud services
Web browserEdge controllers
Serviceapplications
Serviceapplications
Nativeapplications
・Native libraries
Database accessinterface
Edge controllersData communication
function
Connectionservice
Web serverinterface
Batchprocessinginterface
RDBDistributeddata store
PaaSVirtual machine
IaaS
Service interface function
Native codeexecution interface
Fig.2 Structure of server system.
Table 1 General-purpose cloud services
Service name Service description
Relational database (RDB)
◦ Managed database with high availability◦ Allows disk capacity expansion and other
scale-up
Distributed data store
◦ Managed database for storing text data, binary data, etc.
◦ Allows scale-up such as disk capacity ex-pansion and cluster addition
Platform as a Service (PaaS)
◦ Platform for running service applications including hardware and OS
◦ Open-source Cloud Foundry used◦ Allows resource expansion of hardware used
Infrastructure as a Service(IaaS)
◦ Infrastructure environment required for operating information systems such as hardware and network
◦ Allows resource expansion of hardware used and secure communication divided between multiple network levels
Virtual machine
◦ Computer environment that a user can oc-cupy on an IaaS
◦ Allows resource expansion of hardware used
Connection service
◦ Environment for simple and secure gath-ering of data from edge controllers
◦ Allows resource expansion following addi-tion of edge controllers and access control for gathered data

142 FUJI ELECTRIC REVIEW vol.64 no.3 2018
3.2 Web server interfaceThe Web server interface help develop Web appli-
cations efficiently to release to customers.For efficient development of Web applications, we
employed the model-view-controller framework pro-vided for open-source software (OSS) to develop the security function for user authentication and user- specific access control and session management func-tion that accommodates increase of the number of users. This allows users to use their desired Web browser for using Web applications with a sense of se-curity. Increase of the number of users is also quickly accommodated.
3.3 Batch processing interfaceThe batch processing interface is used to efficiently
develop and execute batch processing applications for purposes such as aggregation and form creation.
We developed parallel processing execution and distributed processing execution functions in a multi-thread and multi-instance environment for high-speed execution of individual batch processes and simultane-ous execution of multiple batch processes. These func-tions minimize the impact of adding new service appli-cations on existing service applications.
3.4 Native code execution interfaceThe native code execution interface is to execute
applications and libraries written in the C Language.Generally, service applications are run on a Plat-
form as a Service (PaaS), which makes unusable exist-ing services and data analytics services written in the C language that are provided on-premise. To use these services, we have developed the function for this server system that service applications on a PaaS execute existing services and data analytics services imple-mented on a virtual machine on an Infrastructure as a Service (IaaS).
4. Edge Controller Data Communication Function
This function is required to provide the following features:
(a) Capability of communicating with edge control-lers and IoT devices provided by other compa-nies
(b) Ease of communication even with increased number of devices connected
(c) Safe communication between edge controllers and the server system
(d) Capability of communication of data of various formats (numeric value, text, image, voice) in view of future expansion of applications
4.1 Employment of de facto standard protocolCommunications between edge controllers and the
server system employ the Message Queue Telemetry Transport (MQTT) protocol, which is widely in use as a de facto standard. This allows communications with edge controllers and IoT devices provided by other companies and facilitates communications even when the number of devices connected increases.
4.2 Connection authenticationData sent by edge controllers are provided with
an access token for device authentication. The access token can be verified by the server system to allow communication only with edge controllers permitted to communicate. This ensures safe communications be-tween edge controllers and the server system.
4.3 Employment of distributed data storeData sent from edge controllers are stored in a dis-
tributed data store. As a file data format for storing in a distributed data store, we have employed the Java Script Object Notation (JSON) format, which supports various data formats. This allows various types of data such as measured values and images to be com-municated between edge controllers and the server system.
Service applications can use data stored in a dis-tributed data store via the service interface function described earlier.
5. Operation Management Support Function
This function is required to provide the following features:
(a) Ensured stable operation of service applications(b) Capability of efficient operation management(c) Capability of prompt recovery from any error
generated(d) Capability of preventing impact of any error
Table 2 Operation management support function
Function name Function description
Application monitoring
◦ Monitors the viability and log of various ser-vice applications and detects any error gener-ated in real time.
◦ Allows stable operation of service applica-tions and prompt recovery.
Resource monitoring
◦ Monitors the resource state of virtual ma-chines on a PaaS and IaaS and detects any error such as resource insufficiency in real time.
◦ Allows stable operation of service applica-tions, prompt recovery and prevention of any error from spreading.
E-mail notification of any error detected
◦ Notifies the administrator of any error de-tected by application monitoring and resource monitoring by e-mail.
◦ Allows improvement of efficiency of operation management and prompt recovery.
Operation monitoring portal site
◦ Provides a portal site to show the operating state of service applications.
◦ Allows stable operation of service applica-tions and improvement of efficiency of opera-tion management.

143Server Systems Utilizing General-Purpose Cloud Service
issu
e: N
ew V
alue
-Cre
atin
g So
lutio
ns S
tarti
ng F
rom
IoT
quality level. The server system absorbs the difference between various general-purpose cloud services to al-low use of the cloud vendors specified by customers.
In the future, Fuji Electric intends to develop func-tions of linking with service applications provided by other companies and providing our service applications to other companies. We will thereby work to enhance the functionality of the server system to offer IoT ser-vice with even higher customer value.
generated on other service applicationsTo meet these requirements, we have developed
the functions listed in Table 2.
6. Postscript
This paper has described a server system that makes use of general-purpose cloud services. By using general-purpose cloud services, IoT services with high customer value can be provided promptly at a high

A B S T R A C T
* Power Electronics Systems Business Group, Fuji Electric Co., Ltd.
144
1. Introduction
An edge controller is a component of the Inter-net of things (IoT) system used in the industrial field, including industrial processes. It collects data from various field devices installed on-site at customer fa-cilities. Recent edge controllers have come to perform data processing that requires more advanced functions and high-speed response by dividing the processing performed in the upper layer, in addition to collecting field device data. This is called edge-heavy computing. This paper explains the challenges of edge control-lers, the function and features of Fuji Electric’s edge controllers, and application examples and the future outlook.
2. Challenges and Market Trend of Edge Controllers
Edge controllers collect data from various field de-vices and serve as a bridge to an information system network, such as computers and clouds, in the upper layer. Thus, their main function was converting com-munication protocol as the gateway device that con-nects field networks, where field devices are connected, and information networks.
On the other hand, because of the challenges de-scribed below, computing is becoming edge-heavy, that is, edge controllers installed closer to the field divide and process data that have previously been processed by computers and clouds in the upper layer.(1) Challenges in data processing
(a) Increase in traffic cost due to a greater load on networks or cloud devices
UEDA, Motoyuki * SATO, Yoshikuni * KADOSAKI, Toyofumi *
Edge Controllers Connecting Field Devices and Cyberspace
An edge controller, used in an IoT system, collects data from field devices. Its data processing is currently be-coming more advanced, called edge heavy, by sharing computing with upper layers. Fuji Electric offers advanced real-time IoT solutions by assigning edge controllers part of the analysis and prediction tasks in addition to data col-lection. Our IoT product line includes the display-based “MONITOUCH V9-IoT,” PLC-based “SPH3000-IoT” and gateway-based “FiTSA Σ,” each with device-specific attributes.
(b) Decline in real-time response accompanied by the bottleneck of processing
(c) Concern by users about lowered security related to transmission of raw field data to the outside
The emergence of edge controllers that can real-ize edge-heavy computing is increasing the needs in manufacturing sites and demands for edge controllers as shown in Table 1.
On the other hand, the demand for edge control-lers is expected to increase by 10% to 15% a year(1). To meet this, however, the challenges below need to be solved.(2) Upper system connection
(a) Processing balance between edge controllers and the upper system, and accumulation of know-how
Table 1 Needs of manufacturing sites and demand for edge controllers
Needs of manufacturing sites Demand for edge controllers
Improvement in manufac-turing value(improvement in productiv-ity by shortening the time required for production preparation)
Provision of higher real-time data by selecting production information at sites
Diversified and small- quantity production(realization of mass custom-ization)
Higher processing capability to process control system and higher-level information system at sites
Reduction in programming load
Provision of easy programming tools and applications
Connection between vendors Application in open architecture such as industrial open network
Expansion of service busi-ness of FA equipment and device manufacturers
Revitalization of services such as remote monitoring, support, and preventive maintenance, and implementation at sites on the basis of the data collected by edge controllers

145Edge Controllers Connecting Field Devices and Cyberspace
issu
e: N
ew V
alue
-Cre
atin
g So
lutio
ns S
tarti
ng F
rom
IoT
(b) Security assurance when edge controllers are connected to the upper systems and clouds
3. Fuji Electric’s IoT System and the Role of Edge Controllers
3.1 Fuji Electric’s IoT solutionFor Fuji Electric IoT system, we provide control de-
vices serving as execution base and a series of technol-ogies, including fi eld data sensing, gateway, network connection, data analysis and prediction, optimization control, and advanced control. We have various IoT so-lutions that utilize products and technologies to create customer values.
3.2 Position of Fuji Electric edge controllersThe edge controller of Fuji Electric is a platform
that collects and accumulates various fi eld data and serves as a gateway that utilizes network connection technology to pass the data to cyberspace.
In the future, fi eld devices, machines, and equip-ment will become IoT components and directly connect to the network. Regarding the connection to cyber-space, a fi eld device can be classifi ed into the 3 types below (see Fig. 1). Edge controllers serve as the gate-way device that connects cyberspace and the fi eld de-vices in group II and group III.(1) Group I: Direct type
Field devices that are directly connected to cyber-space. This includes monitoring and control systems, medium and large capacity uninterruptible power systems (UPSs), high function inverters, vending ma-chines linked with IT and radiation monitoring posts.(2) Group II: Edge controller type
Existing devices that have no function of di-
rectly connecting to cyberspace (controllers, inverters, general-purpose equipment such as measuring equip-ment, and analyzers). They are connected to cyber-space using the local communication function of indi-vidual products, regardless of whether they were made in-house or by other manufacturers. To connect this type of equipment to cyberspace, Fuji Electric provides edge controllers, including the “MONITOUCH V9-IoT,” based on a fi eld type display, the “FiTSA Σ ,” based on a general-purpose gateway device, and the “SPH3000-IoT,” based on a programmable controller (PLC). These edge controllers can connect PLCs, inverters, NC machines, robots and measuring equipment of other manufacturers and greatly contributing to the building of IoT systems for fi eld devices.(3) Group III: Edge controller + sensor type
This type connects rotating machines, breakers and buildings, which have no local connection function or intelligent function at all. Sensors, such as those for vibration, temperature, current, are connected to edge controllers, and the state of the object is digitalized via sensors.
To achieve edge-heavy computing, edge controllers need to solve challenges, such as an increase in the communication traffi c cost due to an increase in the amount of fi eld data, decline in real-time responsive-ness, and concern about lowered security, as shown in Chapter 2. In addition, to respond to the request of manufacturing sites, edge controllers need to have various performances and functions, such as a high processing capability to divide and execute the process that are performed by a control system and higher-level information system, real-time data supply, open architecture application, and service application, such as predictive maintenance in the fi eld.
Cyberspace
Server application: Energy monitoring, equipment management and maintenance, etc.
Group I: Direct type
Group II: Edge controller type
○Monitoring and control system (MICREX-VieW XX, MICREX-PARTNER)○Controller (MICREX-SX)○Medium and large capacity UPS, PCS○High-performance inverter○Vending machine linked with IT (sinage vending machine, etc.)○Radiation monitoring post ○General-purpose measuring instrument
(temperature controller, loop controller, etc.)○General-purpose control equipment (PLC, inverter, etc.)○NC machine tools, robots, etc.○Analyzer, etc.
Group III: Edge controller + sensor type○Rotator (vibration sensor)○Storage battery (internal resistance, temperature sensor)○MCB (current sensor)○Building (vibration sensor)
Edge controllers○FiTSA Σ ○MONITOUCH
Series○Programmable controller SPH Series
Cloud and server base
Internet and LAN
Physical space
Fig. 1 Types of connection to cyberspace

146 FUJI ELECTRIC REVIEW vol.64 no.3 2018
We offer edge controllers based on the technolo-gies for data collection, data analysis and prediction, optimization, and advanced control to provide IoT solu-tions. To cope with edge-heavy computing, edge con-trollers divide and implement part of the data analysis and prediction technology and optimization technology performed in cyberspace to solve challenges such as traffi c cost, real-time responsiveness and security con-cerns. Thus, the edge controllers can respond to the request of manufacturing sites and provide solutions more in real time.
4 Characteristics of Fuji Electric Edge Controllers
Table 2 shows the characteristics of MONITOUCH V9-IoT, FiTSA Σ , and SPH3000-IoT, which are the edge controllers of Fuji Electric.
To respond to various demands shown in Chapter 2, it is necessary to enhance data handling (collection, accumulation, processing), which is the gateway func-tion of edge controllers, connection networks, and se-curity functions, and to provide engineering that sup-ports the functions of the edge controllers (see Table
3). As shown in Fig. 2, it is necessary to divide and implement the functions of cyberspace and the edge controller.
5. Application Examples of Edge Controllers
The following presents application examples of edge controllers for each issue of customers.(1) Field data collection
Some customers are not able to connect computers to collect data because an equipment network cannot be connected, there is no installation space for com-puters, or high-speed sampling cannot be performed. SPH3000-IoT has rich equipment connection interfaces and data handling functions, which are the character-istics of PLCs, and can quickly collect data in a period of milliseconds. It is also small and can be installed in a limited space in a production facility, and the instal-lation work can also be easily performed (see Fig. 3).
Table 2 Characteristics and performance of edge controllers
Model Characteristic Diagnosis performance*
MONITOUCH V9-IoT
Real-time screen display on site, equipment con-nectivity
1,000 ms
FiTSA Σ Small, high versatility, equipment connectivity 500 ms
SPH3000-IoTHigh-speed real-time pro-cessing utilizing features of PLCs
50 ms
* The performance when provided with the real-time diagnosis function of multivariate statistical process control (MSPC), which is one of data analysis and prediction technologies, is mounted. The performance is approximately 10 seconds when the diagnosis is performed at a server in cyberspace.
Table 3 Functions required of edge controllers
Function category Outline
Data handling
A. Data collectionCollecting various data for system state analysis and equipment diagnosis
B. Data accumulationAccumulating and transferring collected data
C. Data processingAdding values to collected data (mounted with part of data analysis and prediction technology)
Network
◦ Support for standard protocols for realizing con-nection among cyberspaces
◦ Support for open protocols for realizing connec-tion among fi eld devices of various manufactur-ers
Security Reducing security risk of cyberspace connection
Engineer-ing
◦ Engineering tools for realizing various functions◦ Horizontal link support among edge controllers◦ Vertical link support between cyberspace and
edge
A
B
Cyberspace
Physical space
B. Horizontal link among edges and vertical link between cyberspace and edges○Rapid increase in data circulation amount○Link among edges by large amount of sensors○Dividing and implementing cyberspace functions at edges
A. Edge-heavy computing (dividing and implementing cyberspace functions)○Reduction of data communication amount○Realization of real-time processing○Improvement of reliability (resistance against external transmission of raw data)
OptimizationPrediction
Diagnosis
Diagnosis
Prediction
Optimization
Fig. 2 Division of functions of cyberspace and edge controller
Analysis for defective the product cannot be performed
because the waveform disappeared.
The data is stored in a hard disk for a long time.
Analyzing record data stored in a hard disk using a PC.
Equipment and machine
SPH3000-IoTEdge controllers
NAS (hard disk)
Fig. 3 Example of equipment data collection

147Edge Controllers Connecting Field Devices and Cyberspace
issu
e: N
ew V
alue
-Cre
atin
g So
lutio
ns S
tarti
ng F
rom
IoT
further value from data analysis.
6. Postscript
This paper has explained edge controllers that con-nect field devices to cyberspace.
The need for edge-heavy computing is increasing with diversification of systems and services that use the IoT. It is becoming increasingly necessary to di-vide functions between the field and cyberspace.
Fuji Electric will work to develop edge controllers on the basis of utilization technology for open tech-nologies, such as multi-core microcomputer, embed-ded security, real-time OS, and a general-purpose OS including Linux*1; real-time control technology that has acquired from PLC development; and engineering support technology. Through this development we will solve issues: low cost, high environmental endurance, high reliability, and high speed, which are necessary for field devices.
We will continue providing IoT solutions that lead to the creation of higher customer values.
Referemces(1) “Industrial Network Gateways Market Research
(FIVE-YEAR MARKET ANALYSIS AND TECHNOL-OGY FORECAST THROUGH 2020)”. ARC Advisory Group. https: / /www.arcweb.com/sites/default/files/Documents/study-brochures/study-industrial-network-gateways.pdf, (accessed 2018-08-17).
In addition, the collected data can be stored in the external hard disk (NAS) connected to the edge con-troller as an archive.(2) Introduction of field type diagnosis
Analyzing the collected data can clarify a solu-tion to problems of customer equipment. For example, when the defective product rate increases in a large production facility, analyzing the waveform of sensors provided on the stored facility can clarify that a dete-rioration in a consumable component of the facility and increase in defective products are related to each other and that the consumable needs to be replaced. The MONITOUCH V9-IoT is an edge controller a single unit of which can perform a series of processing includ-ing data collection, analysis, diagnosis, and judgment display for equipment (see Fig. 4).
Thus, customers can collect data with edge control-lers as an initial step of IoT introduction, and create
*1: Linux: Trademark or registered trade mark of Linus Torvalds in Japan and other countries
Is it possible to easily check the product quality state on the display?
Detection notification of abnormality sign
Equipment and machinery
MONITOUCH V9-IoTEdge controllers
Display of judgment and analysis result
Detailed factor analysis
Fig. 4 Example of introduction of field type diagnosis
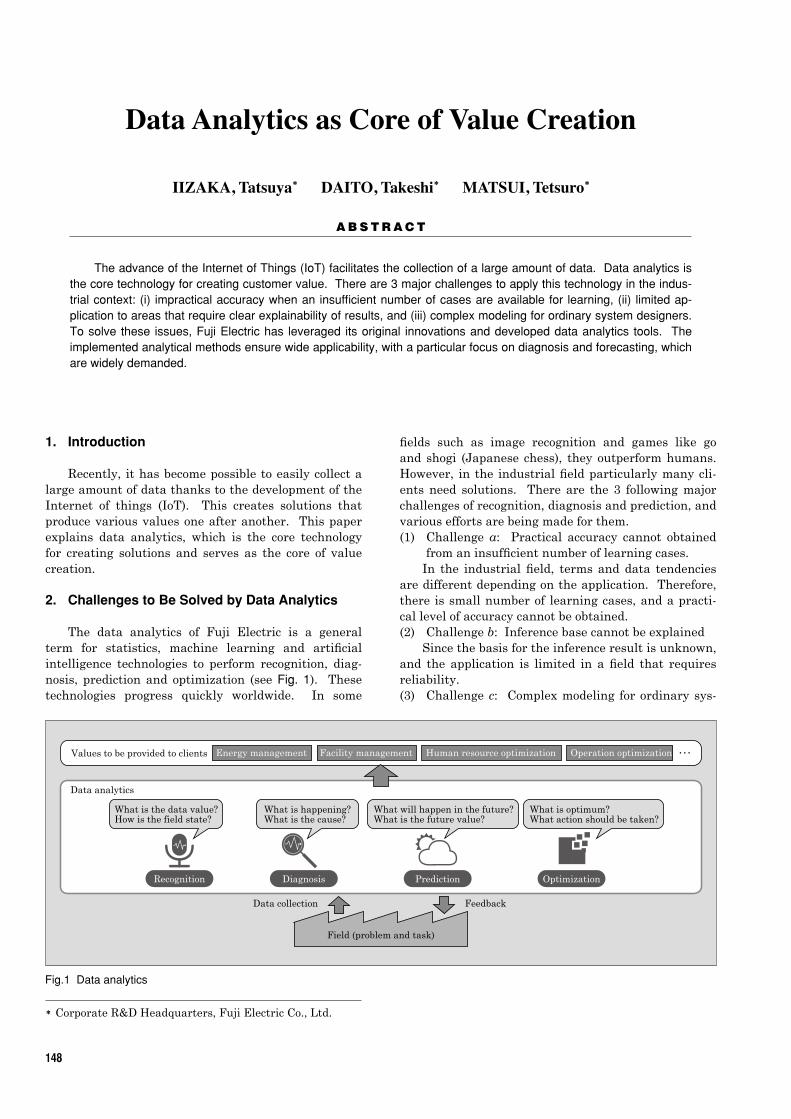
A B S T R A C T
* Corporate R&D Headquarters, Fuji Electric Co., Ltd.
148
1. Introduction
Recently, it has become possible to easily collect a large amount of data thanks to the development of the Internet of things (IoT). This creates solutions that produce various values one after another. This paper explains data analytics, which is the core technology for creating solutions and serves as the core of value creation.
2. Challenges to Be Solved by Data Analytics
The data analytics of Fuji Electric is a general term for statistics, machine learning and artificial intelligence technologies to perform recognition, diag-nosis, prediction and optimization (see Fig. 1). These technologies progress quickly worldwide. In some
IIZAKA, Tatsuya * DAITO, Takeshi * MATSUI, Tetsuro *
Data Analytics as Core of Value Creation
The advance of the Internet of Things (IoT) facilitates the collection of a large amount of data. Data analytics is the core technology for creating customer value. There are 3 major challenges to apply this technology in the indus-trial context: (i) impractical accuracy when an insufficient number of cases are available for learning, (ii) limited ap-plication to areas that require clear explainability of results, and (iii) complex modeling for ordinary system designers. To solve these issues, Fuji Electric has leveraged its original innovations and developed data analytics tools. The implemented analytical methods ensure wide applicability, with a particular focus on diagnosis and forecasting, which are widely demanded.
fields such as image recognition and games like go and shogi (Japanese chess), they outperform humans. However, in the industrial field particularly many cli-ents need solutions. There are the 3 following major challenges of recognition, diagnosis and prediction, and various efforts are being made for them.(1) Challenge a: Practical accuracy cannot obtained
from an insufficient number of learning cases.In the industrial field, terms and data tendencies
are different depending on the application. Therefore, there is small number of learning cases, and a practi-cal level of accuracy cannot be obtained.(2) Challenge b: Inference base cannot be explained
Since the basis for the inference result is unknown, and the application is limited in a field that requires reliability.(3) Challenge c: Complex modeling for ordinary sys-
Data collection Feedback
Operation optimization ・ ・ ・Human resource optimizationFacility managementEnergy managementValues to be provided to clients
Data analytics
What is happening?What is the cause?
Field (problem and task)
Diagnosis
What is the data value?How is the field state?
Recognition
What will happen in the future?What is the future value?
Prediction
What is optimum?What action should be taken?
Optimization
Fig.1 Data analytics

149Data Analytics as Core of Value Creation
issu
e: N
ew V
alue
-Cre
atin
g So
lutio
ns S
tarti
ng F
rom
IoT
tem designersTo construct high-performance diagnosis and pre-
diction models, trial and error learning by data scien-tists is necessary, and it is difficult for general design-ers.
3. Whole Image of Data Analytics
Solutions using our data analytics are classified into recognition, diagnosis, prediction and optimization (see Fig. 1). For recognition, solutions such as voice in-put, image recognition, and semantic analysis improve efficiency of maintenance work at a manufacturing site to create customer values. For diagnosis, solutions such as abnormality diagnosis and remaining lifespan estimation, improve the yield rate and quality to cre-ate customer values. For prediction, solutions such as demand prediction and sign detection reduce cost and supporting driving to create customer values. For optimization, solutions such as optimal operation and power generation planning for energy plants reduce fuel cost to create customer values.
4. Introduction of Data Analytics
Data analytics is a core technology that can realize various solutions by learning a large amount of data, constructing high-precision models and utilizing them. This chapter explains our unique technology that can solve the challenges in Chapter 2.
4.1 Text recognition technologyText recognition technology generally consists of 3
types of processing.◦ Dividing sentences into words and parts of
speech◦ Converting synonyms into the same words◦ Processing, extracting and aggregating sen-
tences in accordance with the purpose of analy-sis
The important processing part of text recognition technology is converting synonyms into the same word. Technology for automatically creating synonyms from a large number of documents was developed, and the accuracy is high for general terms where it is easy to collect learning cases. However, in the industrial field where learning cases are limited, there is problem of impractical accuracy, as described in Challenge a of Chapter 2.
To convert synonyms into the same word, we create 2 types of dictionaries, one for general terms learned with a large amount of cases and one for tech-nical terms learned with limited cases. The result of each dictionary’s sentence processing is integrated (see Fig. 2). Following these approaches(1), we have realized a high recognition accuracy by using general terms to complement the industrial fields where there is a dif-ficulty in collecting learning cases.
We are currently developing a plant maintenance system using this text recognition technology. The sys-tem can shorten the failure time by extracting records (failure state, cause and action result) that are close to the current state of the plant from the past mainte-nance records.
4.2 Diagnosis technologyWe have applied multivariate statistical process
control (MSPC), which has been used in the chemical process field, to diagnosis technologies such as abnor-mality diagnosis. We are developing abnormality diag-nosis technology using machine learning to expand the application to objects having more complicated charac-teristics.
There are various diagnosis methods for com-plicated characteristics. In this section, the kernel- principal component analysis (PCA) method will be used as an example.
In normal machine learning, it is necessary to have learning cases of both normal data and abnormal data. However, there are few learning cases of abnormal data in the actual manufacturing process, and no prac-tical accuracy could be obtained (Challenge a). The kernel-PCA solves this problem by performing learning only with abundant normal data and detecting states that are different from normal data (abnormality).
The kernel-PCA enables diagnosis even with non-linear characteristics by mapping data to a higher dimensional space using kernel functions and per-forming PCA in the higher dimensional space. Nor-mal kernel-PCA can diagnose normal and abnormal states but does not have methods for determining the cause (vibration, voltage, etc.) when it diagnoses the state as an abnormality (Challenge b). Thus, we ex-panded advanced technology called the reconstruction based contribution (RBC) method(2) and applied that to kernel-PCA so a diagnosis basis similar to a normal MSPC can be presented (see Fig. 3). As a result, it is possible to quickly cope with an abnormality in the cli-ent equipment.
Inputting documents of industrial fields
Analyzing with the model (LSTM*) learned with
general terms
Analyzing with the model (LSTM) learned with
technical terms
*LSTM : Long short-term memory
Integrating analysis results
Outputting classification result(failure state, cause,
action result, etc.)
Fig.2 Text analysis method using several dictionaries
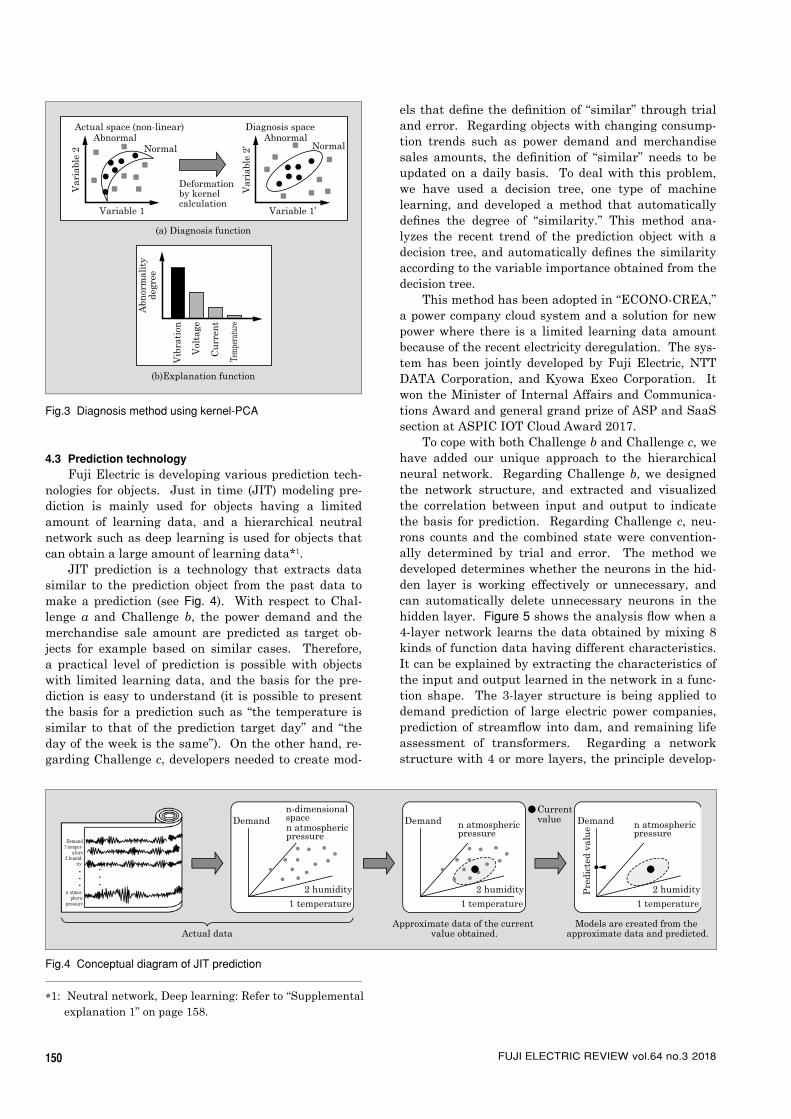
150 FUJI ELECTRIC REVIEW vol.64 no.3 2018
4.3 Prediction technologyFuji Electric is developing various prediction tech-
nologies for objects. Just in time (JIT) modeling pre-diction is mainly used for objects having a limited amount of learning data, and a hierarchical neutral network such as deep learning is used for objects that can obtain a large amount of learning data*1.
JIT prediction is a technology that extracts data similar to the prediction object from the past data to make a prediction (see Fig. 4). With respect to Chal-lenge a and Challenge b, the power demand and the merchandise sale amount are predicted as target ob-jects for example based on similar cases. Therefore, a practical level of prediction is possible with objects with limited learning data, and the basis for the pre-diction is easy to understand (it is possible to present the basis for a prediction such as “the temperature is similar to that of the prediction target day” and “the day of the week is the same”). On the other hand, re-garding Challenge c, developers needed to create mod-
els that defi ne the defi nition of “similar” through trial and error. Regarding objects with changing consump-tion trends such as power demand and merchandise sales amounts, the defi nition of “similar” needs to be updated on a daily basis. To deal with this problem, we have used a decision tree, one type of machine learning, and developed a method that automatically defi nes the degree of “similarity.” This method ana-lyzes the recent trend of the prediction object with a decision tree, and automatically defi nes the similarity according to the variable importance obtained from the decision tree.
This method has been adopted in “ECONO-CREA,” a power company cloud system and a solution for new power where there is a limited learning data amount because of the recent electricity deregulation. The sys-tem has been jointly developed by Fuji Electric, NTT DATA Corporation, and Kyowa Exeo Corporation. It won the Minister of Internal Affairs and Communica-tions Award and general grand prize of ASP and SaaS section at ASPIC IOT Cloud Award 2017.
To cope with both Challenge b and Challenge c, we have added our unique approach to the hierarchical neural network. Regarding Challenge b, we designed the network structure, and extracted and visualized the correlation between input and output to indicate the basis for prediction. Regarding Challenge c, neu-rons counts and the combined state were convention-ally determined by trial and error. The method we developed determines whether the neurons in the hid-den layer is working effectively or unnecessary, and can automatically delete unnecessary neurons in the hidden layer. Figure 5 shows the analysis fl ow when a 4-layer network learns the data obtained by mixing 8 kinds of function data having different characteristics. It can be explained by extracting the characteristics of the input and output learned in the network in a func-tion shape. The 3-layer structure is being applied to demand prediction of large electric power companies, prediction of streamfl ow into dam, and remaining life assessment of transformers. Regarding a network structure with 4 or more layers, the principle develop-
Variable 1
Var
iabl
e 2
Actual space (non-linear)
Deformation by kernel calculation
AbnormalNormal
Variable 1’
Var
iabl
e 2’
Abn
orm
alit
yde
gree
Diagnosis spaceAbnormal
Normal
Vib
rati
on
Vol
tage
Cu
rren
t
Tem
pera
ture
(a) Diagnosis function
(b)Explanation function
Fig.3 Diagnosis method using kernel-PCA
Actual dataApproximate data of the current
value obtained.Models are created from the
approximate data and predicted.
n-dimensional spacen atmospheric pressure
2 humidity 2 humidity 2 humidity
1 temperature
Demand n atmospheric pressure
1 temperature
Demand
Demand1 temper-
ature2 humid-
ity
n atmos-pheric
pressure
・・・
n atmospheric pressure
Current value
1 temperature
Demand
Pre
dict
ed v
alu
e
・・・
Fig.4 Conceptual diagram of JIT prediction
*1: Neutral network, Deep learning: Refer to “Supplemental explanation 1” on page 158.

151Data Analytics as Core of Value Creation
issu
e: N
ew V
alue
-Cre
atin
g So
lutio
ns S
tarti
ng F
rom
IoT
The visualization function in diagnosis determines the possibility of diagnosis. It compresses the multi-dimensional data into 2-dimensional data, and deter-mines the data to be diagnosable if the abnormal data and the normal data are separately shown, and not diagnosable if the data cannot be separated. This func-tion can determine whether the target data is diagnos-able.
Figure 6 shows an example prediction screen of a data analytics tool. The reason for implementing sev-eral methods is because suitable technologies are dif-ferent depending on the characteristic complexity of the diagnosis and prediction target. It is not easy for data scientists to determine which method is the best, and it has conventionally been determined by trial and error. Therefore, the tool has a function of auto-matically presenting the best method. A method that can handle complex characteristics also learns noise, and the accuracy may be reduced in the case of actual use. To prevent this, the method clearly separates the learning data and the test data so verification can be done under the same conditions as in actual use. This mechanism allows those who are not data analysts to easily analyze data and verify the results.
The quality simulation function determines the best manufacturing conditions with the manufacturing factories and plants as objects. This function learns
ment has been done, and the operation support system of the plant is being intensively developed.
5. Data Analytics Tool
Various types of data can now be easily collected by IoT; however, in contrast, there are not enough data scientists to analyze the large amount of data. There-fore, we are developing data analytics tools so other people besides data scientists can easily analyze data. This tool is particularly directed toward diagnosis and prediction, which are in high demand. Several meth-ods are mounted so it can be applied to various targets (see Table 1 and Fig. 6).
The common function would be a cleansing func-tion. The cleansing function can easily remove, re-place, and complement the missing values and abnor-mal values as data pre-processing that generally takes up 80% of data analysis. Thus, the time needed for data analysis can be shortened.
It is possible to extract what kind of functions were learned.
Data combining input variables
Similar neurons (in hidden layer) are united.
Input layer
Hidden layer
Output layerMeasured
value
An unnecessary neurons (in hidden layer) is deleted.
=y ( )+1 1x
ix
f ( )+2 2xf ( )++... 8 8xf
0 2 4 6 8 10Input value
50
10
20
30
40
0
Ou
tpu
t va
lue
50
100
150
200
0
Analysis resultLearning data Deep learning
Unnecessary combination is deleted.
0 10080604020
f 1f 5
f 2f 6
f 3f 7
f 4f 8
Fig.5 Analysis flow of deep learning
Fig.6 Example of prediction screen using data analytics tool
Table 1 Function outline of data analytics
Cat-egory Function Method
Com-mon Cleansing Removal, replacement and complement of
missing values and abnormal values
Diag-nosis
Visualiza-tion
Principal component analysis (PCA)
Generative topographic mapping (GTM)
t-distributed Stochastic Neighbor Embed-ding (t-SNE)
Modeling
PCA
Partial least squares (PLS)
Kernel-PCA
Support vector machine (SVM)
eXtreme Gradient Boosting (XGBoost)
Predic-tion
Modeling
PLS
Just in time modeling (JIT)
Hierarchical neural network (deep learn-ing)
Quality simula-tion
PLS
JIT

152 FUJI ELECTRIC REVIEW vol.64 no.3 2018
7. Postscript
This paper describes data analytics, which serves as the core of value creation, has been described.
A large amount of data can be collected with IoT technology. However, conventional technologies could not handle an enormous amount of data sufficiently, and their performance result was not always satisfac-tory. To provide solutions that accelerate development using these huge data, we think that our unique data analytics is useful. Fuji Electric will expand the ap-plication to actual plants in the future to further create customer values.
References(1) Yi Yang, Jacob Eisenstein. Unsupervised Multi-
Domain Adaptation with Feature Embeddings. NAACL2015.
(2) Carlos F. Alcala, S. Joe Qin. “Reconstruction-based
combinations of various normal conditions and qual-ity data in the past as quality simulation models. By simulating a quality change when the manufacturing condition is changed, the manufacturing condition that improves the yield rate and the quality can easily be obtained.
6. Application Example
The following refers to an example of applying the system to the temperature prediction of a manufactur-ing plant using deep learning. It predicts the tempera-ture of intermediate products of several hours later from several tens of types of measurement data such as fuel and raw material quality. The temperature of intermediate products affects the quality of final prod-ucts, and it is necessary to accurately control the tem-perature. Since the time constant of plants is long, it was necessary to predict the future temperature and control it in a feed-forward manner. The characteristic of the plant is not only complicated, but there is also a change in quality because of the difference in the lot or the origin of the raw material. Thus, it was difficult to automate with computers and controlling was done by human judgment. On the other hand, applying deep learning has made it possible to model complicated phenomena. To update the sequential model with close data, it became possible to deal with chronologi-cal change without human judgment.
As shown in Fig. 7, the change in the actual value can be properly predicted, contributing to the creation of customer values by improving the quality of prod-ucts. Figure 8 shows an example of the analysis result of deep learning. When the ratio of a certain raw ma-terial component is increased, the temperature of the intermediate product drops. When the pressure rises, the temperature of the intermediate product rises. On the other hand, it is possible to quantitatively grasp that the flow rate hardly affects the temperature of intermediate products. That is, clients can use deep learning without anxiety by checking what kind of learning has been performed.
0 100 200 300 400Time (P.U.)
Predicted value (deep learning)
Actual value
0.96
0.94
0.92
0.90
Tem
pera
ture
(P
.U.)
Fig.7 Temperature prediction result of manufacturing plant
(a) Relationship between raw material component and temperature
1.3 1.5 1.7 1.9 2.1Raw material component (%)
0.04
0.03
0.02
0.01
0
Tem
pera
ture
(P
.U.)
(b) Relationship between pressure and temperature
0 0.2 0.4 0.6 0.8 1.0Pressure (P.U.)
0.04
0.03
0.02
0.01
0T
empe
ratu
re (
P.U
.)
(c) Relationship between flow rate and temperature
0 0.2 0.4 0.6 0.8 1.0Flow rate (P.U.)
0.04
0.03
0.02
0.01
0
Tem
pera
ture
(P
.U.)
Fig.8 Example of analysis result using deep learning

153Data Analytics as Core of Value Creation
issu
e: N
ew V
alue
-Cre
atin
g So
lutio
ns S
tarti
ng F
rom
IoT
Contribution for Process Monitoring with Kernel Prin-cipal Component Analysis”. American Control Confer-ence, 2010.

A B S T R A C T
* Corporate R&D Headquarters, Fuji Electric Co., Ltd.
154
1. Introduction
Internet of Things (IoT) devices have been rapidly increasing in number recently. In 2020, about 30 bil-lion IoT devices are predicted to be connected to the Internet(1). As a result, cyberattacks and security inci-dents targeting IoT devices are also increasing rapidly. Thus, standards and guidelines for IoT security are be-ing developed in Japan and overseas.
On the basis of this situation, Fuji Electric is pro-ceeding with IoT security efforts.
This paper explains examples of IoT system secu-rity problems and threats, the concept of IoT security measures based on guidelines in Japan and overseas, and Fuji Electric’s efforts.
2 IoT Security Trend
2.1 Security problems of IoT systemThe IoT is “a global infrastructure for the informa-
tion society, enabling advanced services by intercon-necting (physical and virtual) things based on existing and evolving interoperable information and communi-cation technologies(2),(3).” The following effects are ex-pected(3).
(a) Connecting things to a network makes it possi-ble to collect information quickly and accurately, and control devices and systems in real time.
(b) Mutually linking devices and systems in differ-ent fields enables new functions to be provided.
The following would be IoT security problems(3).◦ The extent of threat impact resulting from various
devices and systems being connected◦ Difference in security concepts and requirements
among various devices and systems
UMEZAKI, Kazuya *
IoT System Security
The current rapid growth of the Internet of Things (IoT) leads to a significant increase in cyberattacks and secu-rity incidents on the IoT devices. To address the IoT security risks, efforts to produce standards and guidelines has been progressing in Japan and other countries. Fuji Electric has established the information security policy based on the IoT security standards and guidelines and takes technical, physical, organizational, and personnel measures to build IoT systems that are secure and safe from their threat.
◦ Limitation on security measures that can be taken associated with restrictions on the functions and performance of IoT devices
◦ Insufficient monitoring of IoT devices◦ Long life cycle of IoT devices
Thus, connecting IoT produces values. On the other hand, there is a concern that the devices and equipment that have not been conventionally con-nected to the Internet may undergo cyberattacks, in-creasing security threats.
2.2 Example of security threat against IoT devicesThe examples below are known as security inci-
dents of IoT devices(3).(a) Web cameras and home energy management
systems (HEMS) connected to the Internet were accessible from the outside because of improper setting.
(b) A vulnerability in the multimedia system of an automobile was attacked, enabling unauthorized remote operation that affected driving.
In both cases, there was unauthorized access from the connection path to the outside such as the Internet or Wi-Fi*1. Unauthorized access succeeded because the device users did not perform appropriate setting and management (access via the development and maintenance interface remained possible, or the de-fault password was not changed) and IoT devices were vulnerable.
Hijacked IoT devices may be used as a stepping stone and cause further invasion and attacks on other parts of a system. In September 2016, several distrib-uted denial-of-service (DDoS) attacks were caused by “Mirai,” the botnet of malware targeting vulnerable
*1: Wi-Fi: Trademark or registered trademark of Wi-Fi Alli-ance

155IoT System Security
issu
e: N
ew V
alue
-Cre
atin
g So
lutio
ns S
tarti
ng F
rom
IoT
IoT devices. This brought great confusion to the Inter-net in the entire area of the East Coast of the United States.
3 IoT Security Measure
Regarding IoT security, standards and guidelines related to security are being developed in Japan and overseas. Table 1 shows the main standards and guidelines.
There are various IoT security approaches to these security standards and guidelines, but the basic con-cept is as follows.(1) Risk analysis
Identify the assets to be protected, and analyze threats and its influence.(2) Security measure
Determine and implement the measures against threats on the basis of risk analysis.
3.1 Risk analysisRisk analysis comprises following three steps: clar-
ifying system configuration, identifying information as-sets, and analyzing threats.(1) Clarifying system configuration
There is a slight difference depending on the stan-dards and guidelines, but the IoT system is generally classified into 4 layers as shown in Fig. 1.
The components (devices and systems) in each layer of the IoT system and the dataflow between them are identified and documented.
(2) Identifying information assetsThe information, functions, and assets contained in
the IoT system components are clarified, and then ob-jects to be protected are identified by importance.(3) Analyzing threats
Existing analysis methods are applied in threat analysis for IoT systems. STRIDE, which is one of the analysis methods, performs analysis for the types of threats shown in Table 2, and extracts vulnerable parts that may be affected by the threats(3) to (5). The de-gree of influence is analyzed on the extracted threat. In DREAD, which is one of the analysis methods, the in-
Table 1 Standards and guidelines related to IoT security
Classifi-cation Publisher* Name of standards and
guidelines Date of issue
Over-seas
oneM2M
oneM2M Technical Speci-fication Application of Security Technology
2016-03 (V1.0.0)2018-02 (V2.0.1)
GSMA GSMA IoT Security Guidelines
2016-02 (V1.0)2017-10 (V2.0)
IIC IIC Security Framework 2016-09 (V1.0)
CSASecurity Guidance for Those Adopting IoT at Early Stage
2016-02 (V1.0)
OTA OTA IoT Trust Frame-work
2016-03 (V1.0)2017-06 (V2.5)
Japan
IPAGuidance on Security Designing in IoT Develop-ment
2016-05 (first edition)2018-04
IoT PromotionConsortium
IoT Security Guideline 2016-07 (V1.0)
* oneM2M: International standards organization of M2M and IoT tech-nologies in the electronic information communication field
GSMA: GSM Association. Business organization of the GSM scheme, which is one kind of mobile phone systems.
IIC: Industrial Internet Consortium. Business organization that promotes implementation of industrial IoT.
CSA: Cloud Security Alliance. Non-profit organization specialized in cloud security.
OTA: A lower branch of Internet Society, an international non-profit organization related to the Internet
IPA: Information-technology Promotion Agency
(1) Service and application
(2) Platform
(3) Network
(4) Equipment
Service
Server, Cloud
Internet, Wide area network
Service
Repeater
Service
System Device
Fig.1 Hierarchical structure of IoT system
Table 2 Threat types and examples of STRIDE
Types of threats Examples of threats
Spoofing
Unauthorized acquisition of IDs and credentials (passwords, for example) causes spoofing of IoT devices and us-ers.
TamperingData is rewritten in one of the stages of data collection, processing, migration or storage in the IoT system.
RepudiationBad data is supplied to the system by unauthorized device connection, not al-lowing the system to operate properly.
Information Disclo-sure
Data is accessed in an unauthorized manner in one of the stages of data col-lection, processing, migration or stor-age in the IoT system.
Denial of ServiceA large amount of data is transmitted to the IoT system components, and the system functions become unavailable.
Elevation of PrivilegeDevices and users without authority can access functions and data of the IoT system.
Table 3 Risk evaluation method DREAD
Evaluation axis of influence Description
Damage potential Degree of damage when vulnerabil-ity is attacked
Reproducibility How easy attacks can be repro-duced (success)
Exploitability How easy attacks can be misused
Affected users Scale of users influenced by attacks
Discoverability Possibility that attackers find vul-nerability

156 FUJI ELECTRIC REVIEW vol.64 no.3 2018
fl uence of the attack on the vulnerability is evaluated by the evaluation axes shown in Table 3(4).
3.2 Security measureBased on the risk analysis result, security mea-
sures are selected and implemented for those risks with a large infl uence.
Security measures can be divided into 4 types—technical measure, physical measure, systematic mea-sure and personal measure—as shown in Table 4.
4. IoT Security Efforts of Fuji Electric
4.1 Fuji Electric IoT platformAs shown in Fig. 2, our IoT platform has a confi gu-
ration in which fi eld devices link with services on the cloud with IoT devices called edge controllers as gate-ways.
For security on this IoT platform, we have devel-oped a security policy considering the risk analysis
result and various guidelines, and we are promoting measures shown in Fig. 3 based on the policy.
4.2 Security policy of IoT systemWe have developed an in-house standard for IoT
system security. The standard is applicable to our IoT systems and related business activities, such as de-velopment, construction, operation, and maintenance, computers and electronic storage media used for these tasks, and the employees who work for the tasks. The in-house standard is based on the concept of security standards and guidelines such as ISO/IEC 27017: 2015(6) and IoT security guidelines(3).
4.3 Technical and physical security measure(1) Measure in general-purpose cloud service
The server system of the IoT platform is built on an external general-purpose cloud service. The general-purpose cloud service is selected and used af-ter checking the security measure status. Specifi cally, the cloud service provider has acquired ISO 27001 and ISO 27017 certifi cations and takes the following mea-sures to secure confi dentiality, integrity and availabil-ity (CIA).
(a) Measure as data centerIntrusion prevention, entry/exit management,
operation evidence management, etc.(b) Measure against network
Firewall, intrusion detection, communication en-cryption, redundancy etc.(c) Measure against physical storage and physical
serverAccess restriction, data encryption, virus infec-
tion prevention, operation evidence management, redundancy, etc.(d) Measure against the virtualization infrastruc-
tureSeparation by network virtualization, vulner-
ability information support, auto failover, etc.(2) Measure against server system and service on
cloud
Table 4 Classifi cation of security measures
Types of measures Examples of measures
Technical measures
User identifi cation and authentication, device identifi cation and authentication, access control, fi rewall, intrusion detection system, communica-tion path encryption, data encryption, log collec-tion, etc.
Physical measures
Information processing area management, pre-vention of information asset theft, management of electronic media, deletion and disposal man-agement of information assets
Organi-zational measures
Building organizational system, operation in accordance with rules and procedures, system monitoring, vulnerability handling system, incident response system, etc.
Personal measures
Improvement of employee awareness, education, training, etc.
Service
Data analytics
Service Service
Service application
IoT
pla
tfor
m
Sec
uri
tySer
ver
syst
em Service interface
General-purpose cloud service
FiTSA Σ MONITOUCH SPH3000-IoT
Edge controllers
Field equipment
・ ・ ・
Fig.2 Confi guration of Fuji Electric IoT platform
Technical measures○Access control○Identification and authentica- tion of users○Prevention of unauthorized access○Prevention of information leakage, etc.
Organizational measures○Building of organizational structure○Operation based on rules and procedures○System monitoring○Incident response system, etc.
Physical measures○Management of information processing zone○Prevention of information asset theft○Management of electronic media○Deletion and disposal manage- ment of information assets
Personal measures○Improvement of employee awareness○Education○Training, etc.
Security policy of IoT system(rules)
Fig.3 IoT security policy of Fuji Electric

157IoT System Security
issu
e: N
ew V
alue
-Cre
atin
g So
lutio
ns S
tarti
ng F
rom
IoT
We have established the Computer Security In-cident Response Team (Fe-CSIRT) in April 2017 to enhance flexibility and defense capability against secu-rity threats that are becoming diversified and compli-cated such as targeted cyberattacks and attacks on the control system and IoT vulnerability.
As one of the IT strategy groups of Fuji Electric, the team deals with and prevents information security incidents that occur within the Fuji Electric groups under the existing information security management system in cooperation with the office that leads moni-toring, audit and education.
Regarding IoT, we also constructed an organiza-tion and operational structure for incident response as with the Fe-CSIRT system.
5. Postscript
Security of an IoT system has been explained in this paper. Cyberattacks and security incidents are increasing with the increase in the number of IoT de-vices. We are constructing an IoT system that can be used safely and securely by developing security poli-cies considering the threats against an IoT system and implementing measures in terms of the system and the mechanism.
Cyberattacks are progressing every day, and it is indispensable to have an ongoing approach to security measures. Fuji Electric will continue developing tech-nology to ensure the security of IoT systems.
References(1) 2018 White Paper on Information and Communications
in Japan. Ministry of Internal Affairs and Communica-tions.
(2) ITU-T Y. 2060 (4000), Overview Of Internet Of Things. 2012.
(3) IoT Security Guidelines Ver. 1.0. IoT Acceleration Con-sortium; Ministry of Internal Affairs and Communica-tions; Ministry of Economy, Trade and Industry. 2016.
(4) Security Guidance for Early Adopters of the Internet of Things (IoT). Cloud Security Alliance. 2015.
(5) IIC Security Framework. 2016.(6) ISO/IEC 27017: 2015.
For the service IoT platforms such as data analyt-ics and service interfaces developed by Fuji Electric, the following security measures of the conventional server cloud application are applied.
(a) Avoidance of vulnerabilityConformity with guidelines for secure software
development(b) Prevention of unauthorized access
Identification and authentication of users of ser-vice, access control, protection of important data, etc.
(3) Measures on edge controllers and communicationRegarding edge controllers, which access the IoT
platform on a cloud, identification, authentication and communication encryption are performed as follows to prevent unauthorized access.
(a) Authentication and encryption on the communi-cation path.
(b) Intrusion prevention at connection points (fire-wall, VPN, etc.) to a network.
(c) Mutually authentication between the server sys-tem and edge controllers.
(d) Access control to the server system.(e) Device authentication for the edge controller as
a data source by the service interface.
4.4 Organization and human security measure(1) On the basis of the Fuji Electric Risk Manage-
ment Rules, which were formulated in May 2006, the Company manages risk in a coordinated, systematic manner. Information security is man-aged as a part of the risk management (see Fig. 4). To protect confidential and personal informa-tion properly, Fuji Electric has formulated and implemented a policy and rules related to informa-tion security. We seek to strengthen information security by instituting annual training programs for employees and endeavor to prevent informa-tion leaks. Companies that handle customer’s confidential and personal information and require a high-level information security management have acquired external certification, such as an information security management system (ISMS) certification and Privacy Mark certification.
(2) Fe-CSIRT
Risk classification system
○Risks related to business activities: managed by business divisions and affiliated companies○Risks common to Fuji Electric: managed by the headquarters corporate division
Common risks○Finance and accounting○Information system○Legal and ethical○Environment, others
Strategy risks○Management strategy○Corporate restructuring○Partnering and withdrawal, others
○Economic trends○Attacks from outside○Natural disasters and accidents, others
Operational risks○Orders, sales○Development, design○Procurement, manufacturing○Service, others
Business risksExternal risks
Fig.4 Risk classification system and management system of Fuji Electric

FUJI ELECTRIC REVIEW vol.64 no.3 2018
Supplemental explanation 1 Neural Network, Deep Learning
A neural network is a general term for models expressing neural cells inside a human brain and the connection thereof by using mathematical expressions in an information processing system. There are vari-ous types, such as a hierarchical neural network and a recurrent network. Fuji Electric has been continuously studying ways to practically realize neural networks since the 1990s, and we have applied them to various systems.
Deep learning is a kind of neural network and is
Supplemental Explanation
p.150
a network structure itself having a large number of layers. For example, there is a deep neural network simply with an increased number of layers, a convolu-tional neural network designed for image processing, and a long sort-term memory (LSTM) designed for text recognition. Since the 2000s, the learning performance has been greatly improved by the development of learning algorithms and the improvement of calcula-tion capability, and it is now a central technique of the recent third-generation AI boom.
158
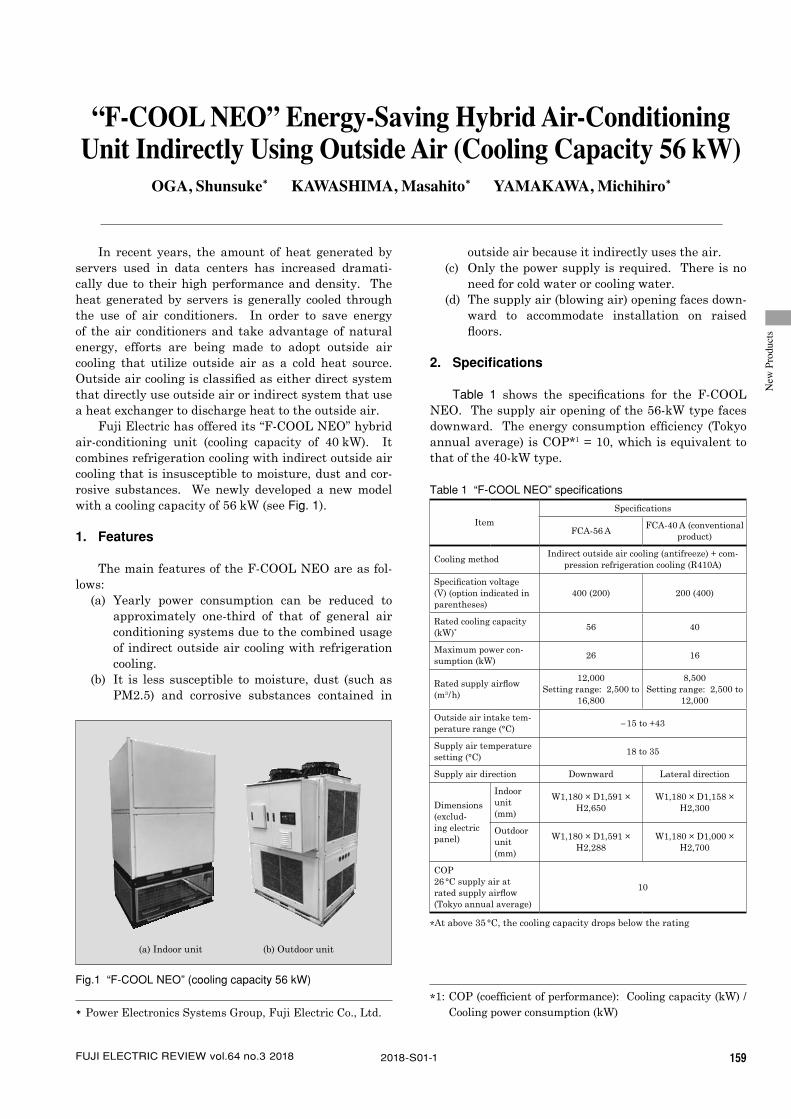
New
Pro
duct
s
159FUJI ELECTRIC REVIEW vol.64 no.3 2018 2018-S01-1
* Power Electronics Systems Group, Fuji Electric Co., Ltd.
In recent years, the amount of heat generated by servers used in data centers has increased dramati-cally due to their high performance and density. The heat generated by servers is generally cooled through the use of air conditioners. In order to save energy of the air conditioners and take advantage of natural energy, efforts are being made to adopt outside air cooling that utilize outside air as a cold heat source. Outside air cooling is classified as either direct system that directly use outside air or indirect system that use a heat exchanger to discharge heat to the outside air.
Fuji Electric has offered its “F-COOL NEO” hybrid air-conditioning unit (cooling capacity of 40 kW). It combines refrigeration cooling with indirect outside air cooling that is insusceptible to moisture, dust and cor-rosive substances. We newly developed a new model with a cooling capacity of 56 kW (see Fig. 1).
1. Features
The main features of the F-COOL NEO are as fol-lows:
(a) Yearly power consumption can be reduced to approximately one-third of that of general air conditioning systems due to the combined usage of indirect outside air cooling with refrigeration cooling.
(b) It is less susceptible to moisture, dust (such as PM2.5) and corrosive substances contained in
OGA, Shunsuke * KAWASHIMA, Masahito * YAMAKAWA, Michihiro *
“F-COOL NEO” Energy-Saving Hybrid Air-Conditioning Unit Indirectly Using Outside Air (Cooling Capacity 56 kW)
outside air because it indirectly uses the air.(c) Only the power supply is required. There is no
need for cold water or cooling water.(d) The supply air (blowing air) opening faces down-
ward to accommodate installation on raised floors.
2. Specifications
Table 1 shows the specifications for the F-COOL NEO. The supply air opening of the 56-kW type faces downward. The energy consumption efficiency (Tokyo annual average) is COP*1 = 10, which is equivalent to that of the 40-kW type.
(b) Outdoor unit(a) Indoor unit
Fig.1 “F-COOL NEO” (cooling capacity 56 kW)
Table 1 “F-COOL NEO” specifications
Item
Specifications
FCA-56 AFCA-40 A (conventional
product)
Cooling methodIndirect outside air cooling (antifreeze) + com-
pression refrigeration cooling (R410A)
Specification voltage (V) (option indicated in parentheses)
400 (200) 200 (400)
Rated cooling capacity (kW)* 56 40
Maximum power con-sumption (kW)
26 16
Rated supply airflow (m3/h)
12,000Setting range: 2,500 to
16,800
8,500Setting range: 2,500 to
12,000
Outside air intake tem-perature range (°C)
-15 to +43
Supply air temperature setting (°C)
18 to 35
Supply air direction Downward Lateral direction
Dimensions (exclud-ing electric panel)
Indoor unit (mm)
W1,180 × D1,591 × H2,650
W1,180 × D1,158 × H2,300
Outdoor unit (mm)
W1,180 × D1,591 × H2,288
W1,180 × D1,000 × H2,700
COP26 °C supply air at rated supply airflow (Tokyo annual average)
10
* At above 35 °C, the cooling capacity drops below the rating
*1: COP (coefficient of performance): Cooling capacity (kW) / Cooling power consumption (kW)

160 FUJI ELECTRIC REVIEW vol.64 no.3 20182018-S01-2
3. Application Examples
Figure 2 shows examples of applying the F-COOL NEO to a data center.
In order to cool the data center, cool air is sup-plied in the lateral direction from the indoor unit with server racks installed on the floor [see Fig. 2(a)], or supplied from underneath the floor with server racks installed on a raised floor [see Fig. 2(b)]. The former has the benefit of suppressing construction costs, while the latter has the advantage of providing uniform cool-ing over a wide floor space. The choice of systems often depends on the size of the data center and the perfor-mance of the installed servers.
Our recently developed type, delivering a large cooling capacity of 56 kW, has the supply air opening facing downward so that it will be used on raised floors of relatively large data centers.
4. Supporting Technologies
This section describes the operation control method for achieving energy savings in the F-COOL NEO. The control method is basically the same for both the 40-kW type and 56-kW type.
Indirect outside air cooling is highly efficient be-cause it does not use a compressor. However, cool-ing capacity decreases as outside air temperature in-creases. A refrigerator is used to compensate for any insufficiencies in the cooling capacity of the indirect outside air cooling system. In order to achieve energy savings by reducing the operation of the compressor as much as possible, the system maximizes the use of
outside air cooling by automatically selecting the ap-propriate mode from among several operating modes.
Figure 3 shows the schematic representation of the capacity sharing between the indirect outside air cool-ing and refrigeration cooling. It shows the ratio of ca-pacity sharing between indirect outside air cooling and refrigeration cooling by plotting the outside air temper-ature on the abscissa and the cooling capacity on the ordinate. In order to maintain cooling capacity regard-less of the outside temperature, operation is primarily carried out by the following 3 modes: (1) Indirect outside air cooling independent operation
(indirect outside air cooling mode)The indirect outside air cooling system runs inde-
pendently when the capacity of the indirect outside air cooling is sufficient for the cooling load.(2) Combined use of indirect outside air cooling and
refrigeration cooling (hybrid operation mode)The refrigerator is used to compensate for any in-
sufficiencies when the cooling capacity of the indirect outside air cooling system falls below the cooling load. However, its usage must be minimized because run-ning the compressor will lower overall efficiency.(3) Refrigerator independent operation (refrigeration
cooling mode)The refrigerator is used independently when the
outside air cooling capacity is ineffective due to the outside air temperature exceeding the return air tem-perature.
Figure 4 shows the schematic representation of the operation of major equipment at each F-COOL NEO cooling mode. As mentioned above, the F-COOL NEO consists of 2 cooling systems, namely, an indirect out-side air cooling system and a refrigeration cooling sys-tem. The indirect outside air cooling mode only uses a pump and fan to cool the air [see Fig. 4(a)]. The hybrid operation mode simultaneously operates refrigeration cooling, which uses the compressor and expansion valve, along with indirect outside air cooling [see Fig. 4(b)]. The refrigeration cooling mode operate refrigera-
Returnair
(RA)
Data center
Refrigerant/antifreeze piping and wiring
Refrigerant/antifreeze piping and wiring
Outsideair
(OA)
Exhaust air(EA)
Supplyair
(SA)
Supply air(SA)
Indoorunit
Outdoorunit
(a) Lateral direction (cooling capacity 40 kW)
Returnair
(RA)
Data center
Outsideair
(OA)
Exhaust air(EA)
Indoorunit
Outdoorunit
(b) Downward (cooling capacity 56 kW)
Servers
Servers
Fig.2 "F-COOL NEO" application examples
Low ← Outside air temperature → High
Coo
lin
g ca
paci
ty
Indirect outside air conditioning system
Indirect outside air conditioning
systemCooling
unitHybrid operation
Cooling unit
Ensures cooling capacity regardless of outside air temperature
Automatic control that responds to changes in the outside air temperature
Fig.3 Schematic representation of the capacity sharing be-tween the indirect outside air cooling and refrigeration cooling

161“F-COOL NEO” Energy-Saving Hybrid Air-Conditioning Unit Indirectly Using Outside Air (Cooling Capacity 56 kW)
New
Pro
duct
s
tion cooling, which uses the compressor and expansion valve instead of the pump [see Fig. 4(c)].
The 56-kW type needs a larger heat exchanger to achieve a cooling capacity beyond that of conventional units, while also maintaining energy saving perfor-mance. Although the heat exchanger for the 40-kW type was installed upright, the same configuration in the 56-kW type would have led to an increase in equip-ment dimensions. Therefore, the heat exchanger in the 56-kW type is segmented and installed at an angle to resolve the issue.
Launch timeNovember 2017
Product inquiriesPlanning Department, Power Supply and Facility Systems Division, Power Electronics Systems Business Group, Fuji Electric Co., Ltd.Tel: +81 (3) 5435-7092
Returnair
(RA)
Indoor unit Outdoor unit
Indoor unit Outdoor unit
Indoor unit Outdoor unit
Supplyair
(SA)
Exhaustair
(EA)
Outside air(OA)
Cooling unit
Indirect outsideair conditioning
system
Cooling unit
Indirect outsideair conditioning
system
Cooling unit
Indirect outsideair conditioning
system
Returnair
(RA)
Supplyair
(SA)
Exhaustair
(EA)
Outside air(OA)
(a) Indirect outside air conditioning mode
(b) Hybrid operation mode
(c) Cooling mode
Returnair
(RA)
Supplyair
(SA)
Exhaustair
(EA)
Outside air(OA)
Expansion valve
Compressor
Pump
Expansion valve
Compressor
Pump
Expansion valve
Compressor
Pump
Fig.4 Operation of major equipment at each cooling mode

162 FUJI ELECTRIC REVIEW vol.64 no.3 20182018-S02-1
* Power Electronics Systems Group, Fuji Electric Co., Ltd
The expansion of globalization through the rapid development of the Chinese and Asian markets has led to increased demand for product supply stability and reduced product prices.
In the industrial sector, the demand for human machine interface (HMI) has been increasing, being used in various types of machinery.
In order to meet the growing demand in the Chi-nese and Asian markets, Fuji Electric developed the “MONITOUCH TS1000 Smart Series” as a program-mable operator interface designed to enhance usabil-ity and visibility while consolidating functionality and launched it in August 2018.
1. Overview
Figure 1 shows the external appearance of the “TS1100Si” of the MONITOUCH TS1000 Smart Se-ries and Table 1 shows its main specifications. The MONITOUCH TS1000 Smart Series provides a line-up of 7-inch and 10.2-inch screen sizes, demand for which is at its highest in the Chinese and Asian markets. All models are compliant with major global and regional standards, such as CE, KC, UL and cUL, enabling them to be used throughout the world.
The Series utilizes a TFT color LCD with 65,536 colors through the use of LED backlights, thereby en-hancing visibility and expressiveness and guarantee-ing reliable status display and usability at production sites. A sleek, simple design is adopted for the exter-nal appearance so that it can be mounted to any ma-chine without any sense of incompatibility.
MATSUMOTO, Mitsuhiro *
“MONITOUCH TS1000 Smart Series” Programmable Operator Interface, Enhancing Usability and Visibility
Fig. 1 “TS1100Si”
Table 1 Main specifications of the “MONITOUCH TS1000 Smart Series”
Item TS1070S TS1070Si TS1100Si
Main unit specifica-tions
Screen size 7 inches 10.2 inches
Display device TFT color
Resolution 800 × 480 dots
Display colors 65,536 colors
Backlight LED
Touch screen Analog resistive film system
Conformity stan-dards CE, KC, UL, cUL
User memory
FROM 26 MB
SRAM 128 KB
External interface
COM1D-sub9 pin (female)
RS-422/485Data length: 7, 8 bits
Parity: Even, odd, noneStop bit: 1, 2 bits
Baud rate: 4,800, 9,600, 19,200, 38,400, 57,600, 76,800,
115,200,187,500*1 bits/s
COM2/COM3D-sub 9 pin (male)
COM2:RS-232CCOM3: RS-422/485 (two-wire type)
Data length: 7, 8 bitsParity: Even, odd, none
Stop bit: 1, 2 bitsBaud rate: 4,800, 9,600, 19,200,
38,400, 57,600, 76,800, 115,200 bits/s
LAN N/A 1 ch
USB-A 1 ch
USB mini-B 1 ch
Power supply
Rated voltage 24 V DC ±10%
Power consumption (max. rating) 11 W or less 12 W or
less
Physical environment
Ambient tempera-ture 0 °C to 50 °C*2
Ambient humidity 85% RH or less (without dew con-densation)
Contamination level (IEC 60664-1) 2
Operating altitude 2,000 m or less
Operating atmo-sphere
No corrosive gas and no excessive dust (no conductive dust)
Ambient storage temperature -10 °C to +60 °C
Ambient storage humidity
85% RH or less (without dew con-densation)
Installation conditions
Protec-tive struc-ture
Panel front
IP65 equivalent (when using a wa-terproof gasket*3 )
IP40 equivalent (when not using a waterproof gasket*3 )
Rear case IP20 equivalent
Dimensions (mm) W198.8 × H141.8 × D38.0
W266.8 × H206.8 ×
D38.0
Panel cut dimen-sions (mm)
189.0 × 134.0(+0.5/-0)
257.0 × 199.0
(+0.5/-0)
*1: 187,500 bits/s only applies to Siemens MPI/PPI communication*2: To prevent accidents, use at a wet-bulb temperature of 39 °C or less*3: Optional item
163“MONITOUCH TS1000 Smart Series” Programmable Operator Interface, Pursuing Usability and Visibility
New
Pro
duct
s
2. Functions
2.1 Server functionIn recent years, the demand for remote monitor-
ing and control of machines has been increasing. The MONITOUCH TS1000 Smart Series comes equipped with VNC server functionality (“i” type only), and it can be remotely monitored and controlled from a PC, tablet and smartphone via a wireless LAN Ethernet*. Furthermore, in situations where a user need to man-age data from a higher level system, it also provides FTP server functionality, enabling the user to read and write files located on the USB drive inserted into the MONITOUCH TS1000 Smart Series from your PC con-nected through Ethernet.
2.2 Remote controlBy connecting a PC and the MONITOUCH TS1000
Smart Series via Ethernet, a user can use the remote desktop function to implement the control of the PC screen on the MONITOUCH TS1000 Smart Series. Moreover, it can also be operated by connecting a mouse to the USB port of the MONITOUCH TS1000 Smart Series. Furthermore, by using “TELLUS & V-Server” remote monitoring software, information on the production site can be collected in real time via Ethernet for remote monitoring and management. Please note that the license of remote desktop and TELLUS & V-Server must be purchased separately.
2.3 8-way communicationsEight-way communications combine Ethernet
based connections (8 protocols) and serial based con-nections (3 protocols) to enable a single MONITOUCH TS1000 Smart Series to connect up to 8 different types of devices or programmable logic controllers (PLC) and peripheral devices of other companies. In addition, it also supports simultaneous communication with the 8 types of devices and data transfer between devices.
2.4 Operation log and security functionsIn recent years, safety of machinery has become
an important issue. The MONITOUCH TS1000 Smart Series contributes to the design of highly safe ma-chines by using operation logs and security functions.
The operation log enables the user to record opera-tions in chronological order, such as switch operations and numerical input on a screen. This makes it pos-sible to refer to history logs and learn who, when, and what operation was executed to analyze factors of ab-normalities.
Security functions are managed by user name and password, and security levels can be set from 0 to 15. Security can be set for screens and switches at varying levels, and logged-in users can perform operations at
their authorized level.
3. Features
3.1 Inheritance of screen assetsThe MONITOUCH TS1000 Smart Series can use
the screen data of the previous model MONITOUCH TS1000 Series as is.
3.2 Reduction in size and weightThe panel cut size and screen size have remained
unchanged, while achieving external miniaturization of 10% to 15% over previous models and mounting footprint reduction. Furthermore, it achieves weight savings of 30% to 40% over previous models by replac-ing the fixations of the housing with a structure that does not require metal plates.
3.3 External interface(1) USB drive mounting direction
Previously, USB drive was inserted into a port on the back of the case, and that required extra space behind the case in the enclosure. The MONITOUCH TS1000 Smart Series no longer requires this space to be secured because USB drive can now be inserted from underneath the case.(2) Adoption of NAND flash memory
Previously, a NOR type was utilized as nonvolatile memory (FROM), but the current model has adopted a NAND FROM in order to facilitate increase in screen data capacity and cost savings. As a result, the screen data size capacity has been increased 2.6 times.(3) NAND flash memory error correction code
An 8-bit BCH error correction code (ECC) scheme has been adopted for the NAND flash memory, and it contributes to enhanced bit error correction.
3.4 Battery voltage detection functionA button cell battery used to back up history logs,
etc. was previously prompted replacement every 3 years regardless of whether or not the battery was con-sumed. Now, the MONITOUCH TS1000 Smart Series is environmentally friendly designed to monitor the battery voltage and prompt the user to replace it by displaying a warning on the screen when the battery is in undervoltage.
3.5 Power consumptionPower consumption is reduced by 25% by adopt-
ing a high-efficiency switching power supply IC and achieving circuit power saving.
Launch timeAugust 2018
*1: Ethernet is a trademark or registered trademark of Fuji Xerox Co., Ltd.

164 FUJI ELECTRIC REVIEW vol.64 no.3 2018
Product inquiriesFactory Automation Systems Division, Power Electronics Systems Business Group, Fuji Electric Co., Ltd.Tel: +81 (3) 5435-7066
Cover Photo:A quote from the catalog “Fuji Electric System Solutions”
32018Vol.64 No. New Value-Creating Solutions Starting From IoT
The fundamental value of the IoT is in connecting everything to the Internet, gathering data to create new value. Today, a variety of IoT solutions have been launched as key technologies to address vari-ous challenges in society, such as enhancing product quality, improving productivity and reforming work style. These are expected to further spread in the future.
Fuji Electric has off ered solutions to optimize energy management and operation of facilities and equipment, and it is accelerating its eff orts to create higher customer value while putting the IoT into practical use.
In this Issue, we present our new value-creating solutions using the IoT. We also introduce the IoT platforms to effi ciently implement them, together with the data analytics that perform analysis, prediction and optimization.
FUJI ELECTRIC REVIEW vol.64 no.3 2018date of issue: September 30, 2018
editor-in-chief and publisher KONDO ShiroCorporate R & D HeadquartersFuji Electric Co., Ltd.Gate City Ohsaki, East Tower, 11-2, Osaki 1-chome, Shinagawa-ku,Tokyo 141-0032, Japanhttp://www.fujielectric.co.jp
editorial offi ce Fuji Electric Journal Editorial Offi cec/o Fuji Offi ce & Life Service Co., Ltd.1, Fujimachi, Hino-shi, Tokyo 191-8502, Japan
Fuji Electric Co., Ltd. reserves all rights concerning the republication and publication after translation into other languages of articles appearing herein.All brand names and product names in this journal might be trademarks or registered trademarks of their respective companies.The original Japanese version of this journal is “FUJI ELECTRIC JOURNAL” vol.91 no.3.
AmericaFuji Electric Corp. of America
Sales of electrical machinery and equipment, semiconductor devices, drive control equipment, and devices
Tel +1-732-560-9410URL https://americas.fujielectric.com/
Reliable Turbine Services LLCRepair and maintenance of steam turbines, generators, and peripheral equipment
Tel +1-573-468-4045 Fuji SEMEC Inc.
Manufacture and sales of door opening and closing systemsTel +1-450-641-4811
AsiaFuji Electric Asia Pacifi c Pte. Ltd.
Sales of electrical distribution and control equipment, drive control equipment, and semiconductor devices
Tel +65-6533-0014URL http://www.sg.fujielectric.com/
Fuji SMBE Pte. Ltd.Manufacture, sales, and services relating to low-voltage power distribu-tion board(switchgear, control equipment)
Tel +65-6756-0988 URL http://smbe.fujielectric.com/
Fuji Electric (Thailand) Co., Ltd.Sales and engineering of electric substation equipment, control panels, and other electric equipment
Tel +66-2-210-0615 URL http://www.th.fujielectric.com/en/
Fuji Electric Manufacturing (Thailand) Co., Ltd.Manufacture and sales of inverters (LV/MV), power systems (UPS, PCS, switching power supply systems), electric substation equipment (GIS) and vending machines
Tel +66-2-5292178 Fuji Tusco Co., Ltd.
Manufacture and sales of Power Transformers, Distribution Transformers and Cast Resin Transformers
Tel +66-2324-0100 URL http://www.ftu.fujielectric.com/
Fuji Electric Vietnam Co.,Ltd. *Sales of electrical distribution and control equipment and drive control equipment
Tel +84-24-3935-1593 URL http://www.vn.fujielectric.com/en/
Fuji Furukawa E&C (Vietnam) Co., Ltd. *Engineering and construction of mechanics and electrical works
Tel +84-4-3755-5067 Fuji CAC Joint Stock Company
Provide the Solution for Electrical and Process Control SystemTel +84-28-3742-0959 URL www.fujicac.com
PT. Fuji Electric IndonesiaSales of inverters, servos, UPS, tools, and other component products
Tel +62 21 574-4571 URL http://www.id.fujielectric.com/
Fuji Electric India Pvt. Ltd.Sales of drive control equipment and semiconductor devices
Tel +91-22-4010 4870 URL http://www.fujielectric.co.in
Fuji Electric Philippines, Inc.Manufacture of semiconductor devices
Tel +63-2-844-6183 Fuji Electric (Malaysia) Sdn. Bhd.
Manufacture of magnetic disk and aluminum substrate for magnetic disk Tel +60-4-403-1111 URL http://www.fujielectric.com.my/
Fuji Furukawa E&C (Malaysia) Sdn. Bhd. *Engineering and construction of mechanics and electrical works
Tel +60-3-4297-5322
Fuji Electric Taiwan Co., Ltd.Sales of semiconductor devices, electrical distribution and control equipment, and drive control equipment
Tel +886-2-2511-1820 Fuji Electric Korea Co., Ltd.
Sales of power distribution and control equipment, drive control equip-ment, rotators, high-voltage inverters, electronic control panels, medium- and large-sized UPS, and measurement equipment
Tel +82-2-780-5011 URL http://www.fujielectric.co.kr/
Fuji Electric Co.,Ltd. (Middle East Branch Offi ce)Promotion of electrical products for the electrical utilities and the indus-trial plants
Tel +973-17 564 569
Fuji Electric Co., Ltd. (Myanmar Branch Offi ce)Providing research, feasibility studies, Liaison services
Tel +95-1-382714
Representative offi ce of Fujielectric Co., Ltd. (Cambodia)Providing research, feasibility studies, Liaison services
Tel +855-(0)23-964-070
EuropeFuji Electric Europe GmbH
Sales of electrical/electronic machinery and components Tel +49-69-6690290 URL https://www.fujielectric-europe.com/
Fuji Electric France S.A.SManufacture and sales of measurement and control devices
Tel +33-4-73-98-26-98 URL https://www.fujielectric.fr/en
Fuji N2telligence GmbH *Sales and engineering of fuel cells and peripheral equipment
Tel +49 (0) 3841 758 4500
ChinaFuji Electric (China) Co., Ltd.
Sales of locally manufactured or imported products in China, and export of locally manufactured products
Tel +86-21-5496-1177 URL http://www.fujielectric.com.cn/
Shanghai Electric Fuji Electric Power Technology (Wuxi) Co., Ltd.
Research and development for, design and manufacture of , and provi-sion of consulting and services for electric drive products, equipment for industrial automation control systems, control facilities for wind power generation and photovoltaic power generation, uninterruptible power systems, and power electronics products
Tel +86-510-8815-9229
Wuxi Fuji Electric FA Co., Ltd.Manufacture and sales of low/high-voltage inverters, temperature controllers, gas analyzers, and UPS
Tel +86-510-8815-2088
Fuji Electric (Changshu) Co., Ltd.Manufacture and sales of electromagnetic contactors and thermal relays
Tel +86-512-5284-5642 URL http://www.fujielectric.com.cn/csfe/
Fuji Electric (Zhuhai) Co., Ltd.Manufacture and sales of industrial electric heating devices
Tel +86-756-7267-861 URL http://www.fujielectric.com.cn/fez/
Fuji Electric (Shenzhen) Co., Ltd.Manufacture and sales of photoconductors, semiconductor devices and currency handling equipment
Tel +86-755-2734-2910 URL http://www.szfujielectric.com.cn/
Fuji Electric Dalian Co., Ltd.Manufacture of low-voltage circuit breakers
Tel +86-411-8762-2000
Fuji Electric Motor (Dalian) Co., Ltd.Manufacture of industrial motors
Tel +86-411-8763-6555
Dailan Fuji Bingshan Vending Machine Co.,Ltd. Development, manufacture, sales, servicing, overhauling, and installa-tion of vending machines, and related consulting
Tel +86-411-8754-5798
Fuji Electric (Hangzhou) Software Co., Ltd.Development of vending machine-related control software and develop-ment of management software
Tel +86-571-8821-1661 URL http://www.fujielectric.com.cn/fhs/
Fuji Electric FA (Asia) Co., Ltd.Sales of electrical distribution and control equipment
Tel +852-2311-8282
Fuji Electric Hong Kong Co., Ltd.Sales of semiconductor devices and photoconductors
Tel +852-2664-8699 URL http://www.hk.fujielectric.com/en/
Hoei Hong Kong Co., Ltd.Sales of electrical/electronic components
Tel +852-2369-8186 URL http://www.hoei.com.hk/
Overseas Subsidiaries* Non-consolidated subsidiaries
最終修正

New Value-Creating Solutions Starting From IoT
Printed on recycled paper
Whole Number 262, ISSN 0429-8284
2018Vol.64 No. 3
FU
JI EL
EC
TR
IC R
EV
IEW
New
Valu
e-Creatin
g S
olu
tion
s Startin
g F
rom
IoT
Vol.64 No.3 2018
最終修正