new polymer mortar formulations - repositorio-aberto.up.pt · a taguchi methodology (for the...
TRANSCRIPT

New Polymer Mortar Formulations - Development, Characterization and Application Forms -
Maria Cristina dos Santos Ribeiro
Department of Mechanical Engineering and Industrial Management
Faculty of Engineering of University of Porto
Ph.D. Thesis
Porto, October 2006

RESUMO
ii

iii
Resumo O betão normal de cimento Portland, principalmente quando associado ao aço sob a
forma de betão armado, tornou-se num dos materiais de construção mais utilizado nas
últimas décadas. As suas propriedades mecânicas associadas, ao seu baixo custo e a um
processo de fabrico relativamente simples, massificaram a sua utilização no campo da
construção civil, em detrimento de outros materiais de construção mais convencionais,
como o aço, a madeira e a pedra. O betão tradicional apresenta contudo uma série de
limitações, principalmente em termos de durabilidade, e estas parecem ser o preço a
pagar pela sua universalidade. A actual pressão conducente ao desenvolvimento de
materiais mais fortes e duráveis trouxe à ribalta um material compósito relativamente
novo, o betão polimérico. Este material distingue-se do betão convencional por utilizar
como ligante uma resina ou polímero em substituição da tradicional pasta de cimento.
Estes novos materiais, os betões de resina, apresentam um leque de vantagens em termos
de resistência mecânica e durabilidade que, por si só, justificam a sua crescente
divulgação e aplicação. Um comportamento deficiente frente ao fogo e uma alta
susceptibilidade à temperatura e aos fenómenos de fluência, derivados do carácter
viscoelástico do ligante de resina, constituem as principais limitações associados a estes
materiais.
A aplicação e desempenho dos materiais de betão polimérico dependem em grande escala
da sua formulação específica, a qual engloba não só o tipo de matérias-primas e a sua
proporção relativa, mas também o tratamento de cura, processo de fabrico e a técnica de
aplicação utilizada. Diferentes formulações podem conduzir a materiais muito
dissimilares com propriedades bastante distintas. O termo betão polimérico nunca deve
sugerir assim um único material mas antes uma família de materiais.

RESUMO
iv
Com o presente trabalho pretende-se dar um contributo significativo na área dos betões
poliméricos, contribuindo nomeadamente para a clarificação de determinados questões
relacionadas com a formulação, procedimentos de teste e avaliação da durabilidade:
Como determinar a melhor combinação de factores materiais de forma a optimizar uma
ou mais propriedades do produto final? Quais os métodos de teste que melhor se
adequam a estes materiais? Que metodologias devem ser aplicadas na avaliação da
durabilidade? (Degradação natural versus degradação acelerada e/ou artificial).
Neste âmbito, desenvolveram-se duas formulações distintas de argamassa polimérica,
uma com ligante de resina epóxida e outra de poliéster insaturado, com vista à
optimização da sua resistência à flexão. No processo de optimização recorreu-se ao
método de Taguchi, para planificar as experiências, e à análise de variância –ANOVA-
como ferramenta estatística para análise dos resultados. Os resultados obtidos
demonstraram que as metodologias utilizadas podem ser aplicadas com sucesso no
desenvolvimento de materiais de betão polimérico. As formulações desenvolvidas foram
posteriormente alvo de exaustiva caracterização física e mecânica. No trabalho
experimental de caracterização, foi dado especial ênfase aos aspectos relacionados com a
durabilidade do material, nomeadamente: à resistência química aos ácidos, alcalis e sais;
à resistência aos agentes atmosféricos, ao nevoeiro salino e às radiações ultravioleta;
resistência às altas temperaturas e aos ciclos de fadiga térmica; e à reacção ao fogo. Uma
vez que nos betões de resina, a resistência à flexão constitui um indicador mais fiável do
comportamento mecânico geral do material, recorreu-se sistematicamente a este
parâmetro para avaliar o nível de degradação sofrido por ambas as formulações testadas.
Ainda no âmbito deste trabalho, foram idealizados e analisados dois tipos de aplicação
distintos para as formulações desenvolvidas: como elemento componente na construção
compósita de vigas com perfis pultrudidos de plático reforçado com fibras – Vigas
híbridas de PRF e betão polimérico-, e como argamassa de base para betão estrutural
com agregados leves – Betão polimérico modificado com agregados naturais leves-.
O trabalho desenvolvido nesta tese constitui uma base para futuros trabalhos na área da
optimização de formulações e condições de processamento de materiais de betão
polimérico, e abre potenciais novas vertentes de aplicação destes materiais no campo da
construção civil.

v
Abstract Ordinary Portland cement concrete is a ready-to-use, widely available building material,
but its low durability under some service conditions seems to be the price paid for its
universality. The demand for a stronger and durable construction material has focused
attention on a relative new type of composite material called polymer concrete. Polymer
concrete is a cementless concrete material formed by polymerizing a monomer with an
aggregate. The polymer acts as a binder for the aggregate reinforcement replacing,
totally, the hydrated cement paste. In comparison with conventional portland cement
concrete, this unique composite material offers a number of advantages, such as higher
strength, better chemical resistance, and higher impermeability. Deficient behavior under
fire, high sensitivity to temperature and creep phenomena, due to the viscoelastic nature
of resin binder, seems to be the main shortcomings related with these materials.
Application and performance of polymer concrete materials are highly dependent on the
specific formulation which encloses mixing design (polymer type, polymer content,
aggregate type and gradation), manufacturing procedures and application techniques.
Thus, different mix formulations, mixture and casting procedures lead to distinct
materials with a varied range of properties. The term polymer concrete should never,
therefore, suggest only a single product but a product family instead.
The present work aims to give a major contribution to resolving certain issues related to
polymer concrete materials such as mix design - How to achieve the better combination
of material factors to get an optimal formulation regarding the enhancement of one or
more properties?-, testing procedures - Which physical and mechanical tests are the most
adequate to characterize these materials?-, and durability assessment -What

RESUMO
vi
methodologies should be applied for the assessment of durability? Natural conditions test
versus accelerated and/or artificial conditions test-.
Within this scope, two different polymer mortar formulations, with epoxy and
unsaturated polyester matrix binders, were developed and optimized regarding flexural
strength property. A Taguchi methodology (for the planning of the experiments) and the
analysis of variance ANOVA (for the analysis of results) were applied for that purpose.
Obtained results showed that the above techniques can be applied with success for
polymer concrete materials’ design. The physical and short-term mechanical properties of
developed formulations were studied and thoroughly characterized by means of various
physical and mechanical tests.
Experimental work was mainly focused on durability issues such as chemical resistance
to various aggressive agents, resistance to high temperatures and thermal fatigue cycles,
frost resistance, natural and artificial weathering, and fire performance. Since the flexural
strength of polymer concrete gives the best indication of its overall behavior, flexural
strength parameter was steadily used for the assessment of degradation rate.
Besides the traditional end-use as repair material, two different applications were
foreseen and investigated for developed polymer mortar formulations: i) as precast
component material for composite construction of structural beams with glass fibre
reinforced plastic pultrusion profiles -GFRP-polymer concrete hybrid beams-; ii) and as
basis material for lightweight aggregate structural concrete –PC material modified with
natural lightweight aggregates-. For both applications, models were designed and
produced, mechanical performance was analyzed and the viability of their appliances was
evaluated.
The work developed provides a scientific base for future studies aimed at optimizing
material selection and processing conditions for polymer concrete materials and opens
new potential branches for future applications of these materials.

vii
Résumé Le béton ordinaire à base de ciment Portland est un matériau, prêt à l’utilisation pour la
construction, largement répandu. Toutefois, sa faible durabilité, sous différentes
conditions de service, semble être le prix à payer pour son universalité. La demande d’un
matériau plus résistant et plus durable pour la construction, a conduit au développement
d’un matériau composite, relativement récent, appelé le béton polymérique. Ce matériau
est un béton, pour lequel, la matrice inorganique de ciment hydraté conventionnelle est
remplacée par une matrice polymérique. Le béton polymérique est donc formé par la
polymérisation d’un monomère avec un agrégat; le polymère agissant comme liant. En
comparaison avec les bétons conventionnels, à base de ciment portland, ce matériau
composite unique offre de nombreux avantages, tels qu’une plus grande résistance
mécanique, meilleure résistance chimique, ainsi qu’une plus grande imperméabilité. Une
réaction au feu déficiente ainsi qu’une sensibilité élevée à la température et aux
phénomènes de fluage provenant de la nature viscoélastique de la résine utilisée comme
liant, semblent être les principale limitations de ces matériaux.
Les applications et les performances des bétons polymériques dépendent
considérablement de leur formulation spécifique, ce qui comprend, non seulement le
choix des matières primes (i.e. type de polymère et d’agrégat, mais aussi les techniques
de fabrication et d’application. Ainsi, différentes formulations peuvent conduire à des
matériaux distincts avec une vaste gamme de propriétés. La désignation béton
polymérique ne devrait donc jamais suggérer uniquement un matériau mais plutôt une
famille de matériaux.
Cette étude prétend donner une contribution significative afin de résoudre certains points
liés aux bétons polymériques tel que la conception de la formulation –Comment atteindre

RESUMO
viii
la meilleure combinaison de facteurs matérielles afin d’obtenir une formulation optimale
considérant l’amélioration d’une ou plusieurs propriétés?-; les procédures de tests –
Quels sont les tests physiques et mécaniques les plus appropriés afin de caractériser ces
matériaux?-; et l’évaluation de la durabilité –Quelles méthodologies devraient être
appliquées afin dévaluer la durabilité?-.
Dans cet esprit, deux différentes formulations de mortier polymérique, l’une à base d’une
matrice époxyde et l’autre de polyester insaturé, ont été développées et optimisées en
considérant leur résistance à la flexion. Pour le processus d’optimisation, la méthode
Taguchi et l’analyse ANOVA ont été appliqués pour la planification des expériences et
pour l’analyse des résultats. Les propriétés physiques et mécaniques à court terme des
formulations développées on été étudiées et complètement caractérisées à partir de
différents essais.
Le travail expérimental s’est principalement focalisé sur les aspects liés à la durabilité du
matériau tel que la résistance chimique à différent agents agressifs; la résistance aux
agents atmosphériques, à la radiation ultraviolet et au brouillard salin (vieillissement
naturelle et artificielle), la résistance aux hautes températures, à la fatigue thermique et
aux cycles de gel-dégel; et la réaction au feu. Étant donné que, dans le cas des bétons
polymériques, la résistance à la flexion donne l’indication la plus fiable sur les
performances mécaniques générales du matériau, ce paramètre a été systématiquement
utilisé afin d’évaluer le taux de dégradation des deux formulations.
Deux types d’application distinctes ont été idéalisées et analysées pour les formulations
développées: i) comme élément d’assemblage pour la construction composite de poutres
avec des éléments de plastique renforcés avec des fibres de verre (PRFV) fabriqués par
pultrusion –Poutres hybrides de PRFV et béton polymérique-; ii) et comme mortier de
base pour bétons structurels à agrégats légers –Béton polymérique modifié avec des
agrégats naturels légers-. Pour les applications, des modèles ont été conçus, les
performances mécaniques ont été analysées et la viabilité de leur application évaluée.
Le travail développé dans cette dissertation constitue une base scientifique pour des
travaux futurs visant l’optimisation de formulations et de conditions de fabrication des
bétons polymériques, et ouvre nouvelles perspectives d’application de ces matériaux dans
la construction civile.

ix
Acknowledgements First and foremost, I must express my unconditional gratitude to my supervisors Prof.
António Ferreira and Prof. Torres Marques for their support, continuous guidance and
patience throughout these past five years. Thanks for believing in me.
Special thanks are due to Paulo Nóvoa, my partner and friend, private adviser and
‘consigliere’, who gave a precious contribution to this thesis due to his critic judgment
and expertise advices on testing of composite materials and polymers. I’m also very
grateful for his continuous and sharp sense of humor that cheered my cloudiest working
days at INEGI.
Acknowledgements are also due to Cassilda Tavares, João Reis, Miguel Sousa, Célia
Novo, Rui Oliveira, João Rodrigues, António Amador and to all INEGI team; to Miguel
Figueiredo, Prof. Augusto Fernandes, Prof. Luís Juvandes and his students from FEUP;
and to Prof. Gonçalves da Silva from UNL, for their help and support during the course
of my research.
The financial support of ‘Fundação para a Ciência e Tecnologia’ and INEGI (Institute of
Mechanical Engineering and Industrial Management) is also gratefully acknowledged.
Finally, I’m deeply indebted to my parents, Serafim and Aracina, and to my husband
Pedro, for their unconditional love and patience, especially in the last months during
which my bad mood was so unbearable that, even I could not withstand it. Without their
continuous encouragement, the completion of this thesis would not have been possible.

RESUMO
x

xi
To my parents
…to Pedro and to my son who didn’t arrive to born…

RESUMO
xii

xiii
Table of Contents
Resumo ..................................................................................................................... iii
Abstract ...................................................................................................................... v
Résumé..................................................................................................................... vii
Acknowledgements................................................................................................... ix
List of Figures ......................................................................................................... xxi
List of Tables ....................................................................................................... xxvii
I Introduction I-1
1.1 Concrete-Polymer Composites Materials .......................................................I-2 1.2 Scope and Objectives......................................................................................I-6 1.3 Organization....................................................................................................I-7 1.4 Relevant Publications......................................................................................I-8 Bibliography
II Polymers in Concrete Review II-1
2.1 History of Polymers in Concrete................................................................... II-1 2.1.1 Ancestor materials ............................................................................ II-1 2.1.2 Development of concrete-polymer composites ................................ II-3 2.1.3 Relevant activities............................................................................. II-5
2.2 Polymers Concretes and Polymers Mortars.................................................. II-9 2.2.1 Introduction....................................................................................... II-9
2.2.1.1 Polymers and polymerization: The basic concepts .......... II-10 2.2.1.2 Thermosetting and thermoplastics polymers ................... II-11
2.2.2 PC raw materials ............................................................................. II-13

TABLE OF CONTENTS
xiv
2.2.2.1 Polymer binders ............................................................... II-13 2.2.2.2 Aggregates ....................................................................... II-21 2.2.2.3 Fibre reinforcements and other strengthening
materials ........................................................................... II-22 2.2.2.4 Additives, modifiers and other admixtures...................... II-23
2.2.3 Mix design and manufacturing process .......................................... II-24 2.2.3.1 Mix design ....................................................................... II-24 2.2.3.2 Manufacturing process..................................................... II-25 2.2.3.3 Safety considerations ....................................................... II-30
2.2.4 Generic properties of PC materials ................................................. II-33 2.2.4.1 Main assets of polymer mortars and concretes ................ II-33 2.2.4.2 Main limitations of polymer mortars and concretes ........ II-40
2.2.5 Application fields of PC materials. Recent and foreseen developments .................................................................................. II-44 2.2.5.1 Precast PC products ......................................................... II-44 2.2.5.2 PC overlays and protective coatings ................................ II-47 2.2.5.3 PC for repair and rehabilitation purposes ........................ II-48 2.2.5.4 Waste recycling, encapsulation and storage .................... II-51
Bibliography ............................................................................................... II-54
III Polymer Mortar Formulations: Optimization Process III-1
3.1 Introduction.................................................................................................. III-1 3.3.1 General ............................................................................................. III-1 3.3.2 Material design methodologies: Significant applications to PC
materials........................................................................................... III-2 3.2 Experimental Program ................................................................................. III-8
3.2.1 Material’s design.............................................................................. III-8 3.2.1.1 Definition of property to be optimized ............................. III-8 3.2.1.2 Planning of experiments ................................................... III-9
3.2.2 Characterization of raw materials .................................................. III-17 3.2.2.1 Polymeric binders ........................................................... III-17 3.2.2.2 Sand aggregates .............................................................. III-19 3.2.2.3 Charge ............................................................................. III-21
3.2.3 Manufacturing and casting process of PM specimens................... III-22 3.2.3.1 Mix procedure................................................................. III-22 3.2.3.2 Moulds and casting process ............................................ III-23 3.2.3.3 Curing treatment ............................................................. III-26
3.2.4 Flexural tests procedure ................................................................. III-26

TABLE OF CONTENTS
xv
3.2.4.1 Specimens’ preparation................................................... III-26 3.2.4.2 Test set-up....................................................................... III-27
3.3 Experimental Results and Treatment of Data ............................................ III-29 3.3.1 Flexural tests results....................................................................... III-29
3.3.1.1 Flexural strength ............................................................. III-29 3.3.1.2 Load-deflection curves.................................................... III-30
3.3.2 Principal effects and interactions’ effects on bending strength ..... III-33 3.3.2.1 Numeric values of principal and interactions’ effects .... III-33 3.3.2.2 Response graphics........................................................... III-35
3.3.3 Analysis of variance –ANOVA-....................................................... III-38 3.3.3.1 Concept of analysis of variance ...................................... III-39 3.3.3.2 Variance analysis results. Calculation process ............... III-40
3.4 Discussion of Results................................................................................. III-44 3.4.1 Variance analysis results................................................................ III-44 3.4.2 Analysis of response graphics........................................................ III-44
3.4.2.1 Principal effects .............................................................. III-44 3.4.2.1 Interactions’ effects......................................................... III-45
3.4.3 Optimal formulations ..................................................................... III-47 3.5 Conclusions................................................................................................ III-50 Bibliography .............................................................................................. III-52
IV Physical and Static Mechanical Properties of PM Formulations. IV-1
4.1 Introduction.................................................................................................. IV-1 4.1.1 Variability of strength properties ..................................................... IV-2 4.1.2 Research Objective .......................................................................... IV-2
4.2 Physical Properties....................................................................................... IV-4 4.2.1 Fresh state properties: workability, consistency and working
life .................................................................................................... IV-4 4.2.1.1 Definitions and usual test methods ................................... IV-4 4.2.1.2 Experimental procedures and results ................................ IV-6
4.2.2 Setting shrinkage.............................................................................. IV-8 4.2.2.1 Usual test methods for setting shrinkage of PC
materials............................................................................ IV-9 4.2.2.2 Applied test methods for setting shrinkage of PM
formulations .................................................................... IV-10 4.2.2.3 Experimental procedures and results .............................. IV-11
4.2.3 Specific gravity and air content ..................................................... IV-15

TABLE OF CONTENTS
xvi
4.2.3.1 Calculation procedure ..................................................... IV-15 4.2.3.2 Obtained results .............................................................. IV-16
4.2.4 Coefficient of thermal expansion................................................... IV-17 4.2.4.1 Usual test methods for CTE of PC materials .................. IV-18 4.2.4.2 Applied test method for determining CTE of PM
formulations .................................................................... IV-20 4.2.4.3 Experimental procedure 4.2.4.4 Test results and discussion.............................................. IV-24 4.2.4.5 Conclusions..................................................................... IV-29
4.3 Short-Term Mechanical Properties ............................................................ IV-30 4.3.1 Flexural properties ......................................................................... IV-30
4.3.1.1 Test and calculation procedures...................................... IV-30 4.3.1.2 Test results and discussion.............................................. IV-32
4.3.2 Compressive properties.................................................................. IV-38 4.3.2.1 Test and calculation procedures...................................... IV-38 4.3.2.2 Test results and discussion.............................................. IV-41
4.3.3 Tensile properties........................................................................... IV-51 4.3.3.1 Test and calculation procedures...................................... IV-52 4.3.3.2 Test results and discussion.............................................. IV-54
Bibliography .............................................................................................. IV-59
V Durability Study of PM Formulations. V-1
5.1 Introduction................................................................................................... V-1 5.1.1 General .............................................................................................. V-1 5.1.2 Causes of deterioration ..................................................................... V-2
5.2 Chemical Durability...................................................................................... V-5 5.2.1 Introduction....................................................................................... V-5
5.2.1.1 Overview............................................................................ V-5 5.2.1.2 Research objective ............................................................. V-7
5.2.2 Experimental program ...................................................................... V-7 5.2.2.1 Test specimens ................................................................... V-7 5.2.2.2 Chemical resistance tests procedure .................................. V-8 5.2.2.3 Calculation procedure ........................................................ V-8
5.2.3 Experimental results.......................................................................... V-9 5.2.4 Discussion of results ....................................................................... V-16
5.2.4.1 Mass variation.................................................................. V-16 5.2.4.2 Flexural strength variation ............................................... V-17

TABLE OF CONTENTS
xvii
5.2.4.3 Correlation between mass and flexural strength variations.......................................................................... V-18
5.2.5 Conclusions..................................................................................... V-19 5.3 Thermal Durability...................................................................................... V-21
5.3.1 Introduction..................................................................................... V-21 5.3.1.1 Overview.......................................................................... V-21 5.3.1.2 Research objective ........................................................... V-25
5.3.2 Experimental program .................................................................... V-26 5.3.2.1 Test specimens ................................................................. V-26 5.3.2.2 Thermal durability tests procedure .................................. V-26
5.3.3 Test results and discussion.............................................................. V-29 5.3.3.1 Influence of temperature on flexural strength.................. V-29 5.3.3.2 Influence of thermal fatigue cycles on flexural
strength............................................................................. V-34 5.3.4 Conclusions..................................................................................... V-38
5.4 Weathering Durability ................................................................................ V-40 5.4.1 Introduction..................................................................................... V-40
5.4.1.1 Agents of the weather ...................................................... V-40 5.4.1.2 Weathering test methods for polymeric materials –
Natural versus accelerated and/or artificial tests- ............ V-45 5.4.1.3 Weatherability studies of PC materials............................ V-50 5.4.1.4 Research objective ........................................................... V-52
5.4.2 Experimental program .................................................................... V-52 5.4.2.1 Outdoors weathering program ......................................... V-52 5.4.2.2 Artificial weathering program.......................................... V-56
5.4.3 Test results and discussion.............................................................. V-58 5.4.3.1 Outdoors weathering program ......................................... V-58 5.4.3.2 Artificial weathering program.......................................... V-63 5.4.3.3 Correlation between natural and artificial weathering
test results......................................................................... V-67 5.4.4 Conclusions..................................................................................... V-70
Bibliography ............................................................................................... V-73
VI Fire Performance of PM Formulations. VI-1
6.1 Fire Reaction................................................................................................VI-1 6.1.1 Introduction......................................................................................VI-1 6.1.2 Fire test standards ............................................................................VI-2 6.1.3 Fire reaction: Euroclassification ......................................................VI-6
TABLE OF CONTENTS
xviii
6.1.4 Flame and fire retardant additives....................................................VI-8 6.1.4.1 Mechanism of action of flame retardant additives............VI-9 6.1.4.2 Families of flame retardants............................................VI-11 6.1.4.3 New flame-retardants: Silicon based FRs and
nanocomposites...............................................................VI-14 6.1.5 Research objective .........................................................................VI-16
6.2 Heat and Smoke Release Rates..................................................................VI-18 6.2.1 General ...........................................................................................VI-18 6.2.2 Experimental program ...................................................................VI-19
6.2.2.1 Test apparatus, measured parameters and their significance .....................................................................VI-19
6.2.2.2 Test specimens and test procedure..................................VI-20 6.2.3 Test results and discussion.............................................................VI-21
6.2.3.1 Experimental results........................................................VI-21 6.2.3.2 analysis of results and discussion ...................................VI-22
6.2.4 Conclusions....................................................................................VI-28 6.3 Flame Spread Rate. Reaction to Fire: Classification .................................VI-30
6.3.1 General ...........................................................................................VI-30 6.3.2 Experimental program ...................................................................VI-31
6.3.2.1 Test specimens ................................................................VI-31 6.3.2.2 Epirradiator test method: Equipment and test
procedure.........................................................................VI-34 6.3.2.3 Reaction to fire classification..........................................VI-37
6.3.3 Test results .....................................................................................VI-39 6.3.3.1 Radiation fire test results ................................................VI-39 6.3.3.2 Flexural test results .........................................................VI-42
6.3.4 Discussion of results ......................................................................VI-44 6.3.4.1 Plain polyester and epoxy PMs.......................................VI-44 6.3.4.2 Epoxy PMs modified with FR systems...........................VI-44 6.3.4.3 Restrictions to end-use....................................................VI-46
6.3.5 Conclusions....................................................................................VI-48 Bibliography ..............................................................................................VI-50
VII Conclusions and Recommendations VII-1
7.1 Synopsis ......................................................................................................VII-1 7.2 Main conclusions ........................................................................................VII-2 7.3 Recommendations......................................................................................VI-14

TABLE OF CONTENTS
xix
APPENDIXES Applications:
A: GFRP polymer concrete hybrid beams A-1
i) ‘Analysis of hybrid beams composed of GFRP profiles and polymer concrete’, International Journal of Mechanics and Materials in Design, 1: 143-155, 2004................................................. A-3
ii) ‘Flexural behaviour of GFRP-polymer concrete hybrid structural systems’, 6th International Symposium on FRP Reinforcement for Concrete Structures -FRPRCS-6-, July 2003, Singapore, 695-704. ........................................................................... A-17
iii) ‘Development of composites hybrid structures based on polymer concrete – GFRP pultrusion profiles assembly system’, Third International conference on Composites in Construction – CCC2005-, July 11-13, 2005, Lyon, France...................................... A-27
B: Polymer concrete modified with natural lightweight aggregates B-1
i) ‘Mechanical characterization of lightweight wood-modified polymer concrete’, Ciência & Tecnologia dos Materiais, Vol. 16, n.º 2-3, 2004, 81-87. ............................................................................ B-3
ii) ‘Mechanical characterization of lightweight polymer mortar modified with cork granules’, Composites Science and Technology, Vol. 64, Issues 13-14 (2004), 2197-2205 ..................... B-11

TABLE OF CONTENTS
xx

List of Figures 1.1 Classification system of concrete-polymer composite materials. ...........................I-5
2.1 The Great Wall of China – One of the first applications of natural polymer modified polymers................................................................................................. II-2
2.2 Commercially available resins currently used as matrix binders in PC materials .............................................................................................................. II-13
2.3 Examples of continuous automated mixers for PC with vacuum support and automatic feeding systems for aggregates, resin binders, initiators and pigments. ............................................................................................................ II-29
2.4 Appearance of poly-methyl methacrylathe PC specimens (left) and portland cement concrete specimens (right) after 20 years of outdoor exposure, according to investigation work reported by the U.S. Bureau of Reclamation. Both types of beam specimens were installed near seawater and at half-tide elevation. .................................................................................... II-36
2.5 Comparison between flexural fatigue strengths of plain MMA PC and plain portland cement concrete beams: in stress level scale, at left, and in stress scale, at right (Hsu and Fowler 1985). Wöhler curves corresponding to the stress ranges of R=σmin/σmax= 0.05, 0.10, and 0.25 (average values). Beam specimens were cyclically loaded at a constant rate of 5 Hz. ............................. II-38
3.1 Linear graphics associated to Taguchi orthogonal array L16 (215), for five factors and ten interactions (Taguchi 1986). ...................................................... III-15
3.2 Mechanical batch mixer used to mix the polymeric resins with the aggregates. .......................................................................................................... III-24

LIST OF FIGURES
xxii
3.3 Standard steel prismatic molds for flexural testing purposes of polymer mortar specimens................................................................................................ III-24
3.4 Casting steps for molding polymer mortar specimens. ...................................... III-25
3.5 Oven (at left) and climatic chamber (at right) used to dry the aggregates and for conditioning of PM specimens ..................................................................... III-27
3.6 Mechanical testing machine, flexural testing set-up and specimen geometry. .. III-28
3.7 Load-deflection curves obtained from flexural tests performed on PM specimens of formulations nº1 to nº6. ................................................................ III-30
3.8 Load-deflection curves obtained from flexural tests performed on PM specimens of formulations nº7 to nº12. .............................................................. III-31
3.9 Load-deflection curves obtained from flexural tests performed on PM specimens of formulations nº13 to nº16. ............................................................ III-32
3.10 Response graphics of principal effects: a) Resin Type; b) Charge Content; c) Resin Content; d) Sand Type; and e) Curing Method. ....................................... III-36
3.11 Response graphics of interaction effects: a) Resin Type*Charge Content; b) Resin Type*Resin Content; c) Resin Type*Sand Type; d) Resin Type*Curing Method; e) Charge Content*Resin Content; and f) Charge Content*Sand Type. ........................................................................................... III-37
3.12 Response graphics of interaction effects: a) Charge Content*Curing Method; b) Resin Content*Sand Type; c) Resin Content*Curing Method........ III-38
4.1 Slump and flow tests of PM formulations: cone removal (left) and typical slump shapes of epoxy and polyester PM formulations (center and right, respectively). ........................................................................................................ IV-7
4.2 a) Embedding process of optical fibre; b) Strain variation of epoxy PM specimen during setting. ..................................................................................... IV-12
4.3 Polyester PM specimens used for determining final setting shrinkage.............. IV-14
4.4 Strain data of PM formulations acquired by data logger throughout the three thermal cycles. .................................................................................................... IV-25
4.5 Evolution of strains of epoxy (EPM) and polyester (PPM) PM specimens with temperature, during the three cycles........................................................... IV-25

LIST OF FIGURES
xxiii
4.6 Dilatation-temperature curves of both PM formulations: epoxy (EPM) and polyester (PPM) PMs. ....................................................................................... IV-26
4.7 Variation laws of instantaneous linear coefficient of thermal expansion with temperature of epoxy (EPM) and polyester (PPM) PMs.................................... IV-27
4.8 Plot of strains versus temperature of aluminum alloy reference specimen. Calculation of expected value of its mean coefficient of thermal expansion between 20ºC and 100ºC. ................................................................................... IV-28
4.9 Histograms for flexural strength distribution of epoxy (at left) and polyester (at right) of PM specimens. ................................................................................ IV-32
4.10 Normal probability plots for flexural strength data of epoxy (at left) and polyester (at right) PM formulations. ................................................................. IV-33
4.11 Test set-ups of compression tests performed on a) broken parts of prismatic PM specimens tested in bending, and b) cylindrical PM specimens.................. IV-39
4.12 Stress-strain curves obtained from compression tests. ....................................... IV-43
4.13 Typical failure modes of cylinder PM specimens tested in compression: epoxy PM specimens (E1, E2 and E3), and polyester PM specimens (P1, P2 and P3). ............................................................................................................... IV-43
4.14 Comparison of stress-strain relationships to the experimental data. .................. IV-48
4.15 Splitting tensile test set-up (at left) and load-displacement curves obtained from correspondent tests performed (at right).................................................... IV-54
4.16 Stress-strain curves obtained from third-point loading tests performed on instrumented prismatic specimens of both PM formulations. ............................ IV-55
5.1 Mass change (%) of polyester and epoxy PM specimens as function of immersion periods and test solutions. ................................................................. V-10
5.2 Flexural strength change (%) of polyester and epoxy PM specimens as function of immersion periods and test solutions................................................ V-10
5.3 Flexural strength retained by polyester and epoxy PM specimens after 84 immersion days in the various liquid solutions (average of three specimens). ... V-11
5.4 Failure surface of control and test specimens for the successive immersion periods in test solutions (1, 7, 21, 56 and 84 days). ............................................ V-13
LIST OF FIGURES
xxiv
5.5 Detail of failure surfaces of polyester PM specimens immersed for 84 days in alkalis solution (right) and distilled water (left), in which, the erode rim caused by liquid medium diffusion is notorious.................................................. V-14
5.6 Incrustations dark chestnut that appeared in the exterior surface of epoxy PM specimens that have been immersed in sodium chloride solution, and correspond record photographic obtained by optical microscopic (50x). ........... V-14
5.7 Density map (SEM) of an affected sample of epoxy PM specimen that have been immersed in sodium chloride solution, and elementary distribution profiles of three different points of that sample obtained by spectroscopy......... V-15
5.8 Correlation between water uptake (mass change) and flexural strength decrease for both formulations of PMs immersed in water, acid and alkalis solutions............................................................................................................... V-18
5.9 Thermal fatigue cycles that were subject the specimens of both PM formulations......................................................................................................... V-27
5.10 Flexural strength of both epoxy and polyester PMs as function of test temperature. ......................................................................................................... V-30
5.11 Stress-deflection curves of epoxy PM specimens obtained from flexural tests carried out at aging temperature. ................................................................. V-31
5.12 Stress-deflection curves of polyester PM specimens obtained from flexural tests carried out at aging temperature. ................................................................. V-31
5.13 Flexural strength of epoxy and polyester PM specimens, after tempering, as function of conditioning temperature. ................................................................. V-32
5.14 Residual flexural strength of epoxy and polyester PMs after exposure to 50 and 100 positive thermal fatigue cycles. ............................................................. V-35
5.15 Residual flexural strength of epoxy and polyester PMs after exposure to 50 and 100 freeze-thaw dry cycles. .......................................................................... V-35
5.16 Residual flexural strength of epoxy and polyester PMs after exposure to 50 and 100 freeze-thaw wet cycles........................................................................... V-36
5.17 Failure surface of PM specimens after exposure to 100 freeze-thaw wet cycles. .................................................................................................................. V-36

LIST OF FIGURES
xxv
5.18 Meteorological tower sited at Aveiro University that provided hourly weathering observation data (left). Detail of measurement equipment (right). .................................................................................................................. V-53
5.19 Monthly average temperatures during the exposure periods (medium, maximum and minimum average values)............................................................ V-55
5.20 Accumulated precipitation of each moth during the exposure periods. .............. V-55
5.21 Monthly average sunshine radiation (medium, maximum and minimum average values). ................................................................................................... V-55
5.22 Estimated ultraviolet radiation doses of each month during the exposure periods. Estimations were made with basis on empirical relationships established by Coblentz....................................................................................... V-55
5.23 Salt fog chamber (left) and arc-xenon solar box (right) artificial weathering devices. ................................................................................................................ V-57
5.24 Some representative load-deflection curves obtained from flexural tests performed on epoxy and polyester PM specimens, after being submitted to outdoors weathering and aging test programs. .................................................... V-59
5.25 Surface color change of epoxy and polyester PM specimens that have been exposed to natural weathering. ............................................................................ V-60
5.26 Relative flexural strengths of epoxy and polyester PM specimens as function of exposure time. Isolated effects of outdoors weathering ‘versus’ the combined effects of weathering/aging processes. ......................................... V-63
5.27 Yellowing and discoloration processes suffered by epoxy and polyester PM specimens submitted, respectively, to artificial solar radiation (in the left) and salt-fog spray cycles (in the right). ............................................................... V-64
5.28 Relative flexural strengths of epoxy and polyester PM formulations submitted to salt fog artificial weathering as function of exposure period. ........ V-65
5.29 Predicted flexural strength behaviors of epoxy and polyester PMs under long-term exposure to natural environment (similar to Aveiro site). .................. V-69
6.1 Oxygen consumption calorimeter apparatus used to perform heat release tests. ....................................................................................................................VI-20
6.2 A schematic view of the cone calorimeter showing its main components.........VI-20

LIST OF FIGURES
xxvi
6.3 Some sequential images taken off during the cone calorimeter test: a) Placement of test specimen on apparatus holder; b) Beginning of combustion reaction when a sustainable flame appeared; c) Maximum reaction intensity; and d) Specimen appearance at the end of the test. ..............VI-22
6.4 Heat release rate, effective heat of combustion and specific extinction area as function of time, for both epoxy and polyester PM formulations..................VI-23
6.5 Mass loss, carbon dioxide and carbon monoxide release as function of time, for both epoxy and polyester PM formulations..................................................VI-24
6.6 Plot of carbon monoxide yield and peak of heat release rate against both averages of heat release rate: average during the first 180 seconds and average over the entire test period. Reported data are referred to all PM test specimens. ..........................................................................................................VI-28
6.7 a) Epoxy PM test specimens for fire radiation tests after casting process; b) Epirradiator test equipment used to perform fire radiation tests. .......................VI-33
6.8 Schematic view of epirradiator apparatus showing its main components..........VI-35
6.9 Epirradiator test steps: a) Beginning of the test, with both gas burners already positioned against superior and inferior surfaces of test specimen; b) First effective inflammations on both faces of the specimen; c) Maximum combustion reaction, with flames reaching the maximum extent; d) Extinction of he flame on the inferior surface of the specimen; e) End of the test; and f) Appearance of plain epoxy PM specimen after fire radiation test. ..VI-36
6.10 Intumescent process occurring during fire radiation tests of epoxy PM specimens modified with APP flame retardant system. .....................................VI-41
6.11 Final appearance of PM specimens after fire radiation tests: a) Epoxy PM specimen; b) Polyester PM specimen; c) APP modified epoxy PM specimen; and d) ATH-II modified epoxy PM specimen, where is visible a white vitreous layer caused by FR system. ........................................................VI-42
6.12 Load-deflection curves obtained from flexural tests performed on plain epoxy PM specimens and epoxy PM specimens modified with flame retardant systems: APP, ATH-I and ATH-II. .....................................................VI-43

List of Tables 1.1 Range of values commonly found for concrete-polymer composites. ....................I-6
2.1 Overview of major international events in Polymers in Concrete. ....................... II-7
2.2 Relevant standards, specifications, reports and user’s guides addressed to CPC materials. ....................................................................................................... II-8
2.3 Typical range of properties of common PC materials and ordinary portland cement concrete (average values)........................................................................ II-34
2.4 Freeze-thaw, chemical, abrasion and impact resistances of some commercial precast PC products. ............................................................................................ II-37
2.5 Typical applications of PC overlays.................................................................... II-49
3.1 Stages in the design process - Cross methodology -. ........................................... III-3
3.2 Factors and levels considered in mix formulations. ........................................... III-13
3.3 Taguchi orthogonal array L 16 (215) (Taguchi 1986). .......................................... III-14
3.4 Triangular table associated to orthogonal array L 16 (215) Interactions between two columns. ........................................................................................ III-15
3.5 Attribution of factors and interactions to columns of L 16 (215) orthogonal array.................................................................................................................... III-16
3.6 Mix formulations to be tested............................................................................. III-17
3.7 Properties of S226E polyester resin (not-cured stage). ...................................... III-18
3.8 Properties of S226E polyester resin after one week at 23ºC. ............................. III-18
3.9 Properties of EPOSIL-551 epoxy resin system (not-cured stage)......................... III-19
3.10 Properties of EPOSIL-551 epoxy resin system after one week at 25ºC. .............. III-19

LIST OF TABLES
xxviii
3.11 Physical and chemical properties of ‘Clean sand’.............................................. III-20
3.12 Size grading of ‘Clean sand’. ............................................................................. III-20
3.13 Physical and chemical properties of foundry sand SP55.................................... III-21
3.14 Size grading of foundry sand SP55. ................................................................... III-21
3.15 Physical and chemical properties of calcium carbonate Plastex 25. .................. III-22
3.16 Flexural test results: average values and correspondent standard deviations..... III-29
3.17 Calculus process of numeric values of principal and interaction effects. .......... III-34
3.18 ANOVA variance analysis. ................................................................................ III-40
4.1 Slump and flow test results of PM formulations (average of two samples)......... IV-7
4.2 Working life of PM formulations (average of two samples)................................ IV-8
4.3 Final setting shrinkage of PM formulations (average of two specimens). ......... IV-14
4.4 Specific gravity and air content of PM formulations. Average results and correspondent standard deviations referred to 41 specimens. ............................ IV-16
4.5 Mean coefficients of thermal expansion of PM and aluminium alloy reference specimens............................................................................................ IV-26
4.6 Mean coefficients of thermal expansion of PM formulations considering a bilinear law for strain-temperature curves.......................................................... IV-27
4.7 Statistical analysis results of flexural strength data of PM formulations. .......... IV-34
4.8 Statistical analysis results of flexural elasticity modulus of PM formulations........................................................................................................ IV-37
4.9 Statistical analysis results of compressive test data of PM formulations........... IV-42
4.10 Parameters of the empirical stress-strain relationships. ..................................... IV-49
4.11 Splitting tensile test results of PM formulations. ............................................... IV-54
4.12 Four-point bending test results of PM formulations........................................... IV-55
4.13 Estimation of direct tensile strength of PM formulations. ................................. IV-56
5.1 Summary of chemical resistant test program. ....................................................... V-8
5.2 Relative mass change and relative flexural strength change of both PM formulations after 84 immersion days in chemical test solutions. ...................... V-10

LIST OF TABLES
xxix
5.3 Appearance change of PM specimens after immersion in test solutions. ........... V-12
5.4 Flexural test results after exposure to different test temperatures. ...................... V-30
5.5 Flexural test results after exposure to positive fatigue cycles and freeze-thaw cycles. ......................................................................................................... V-34
5.6 Annual weather observation data at outdoor exposure site (Meteorological Tower – Aveiro). ................................................................................................. V-54
5.7 Average monthly ratios of UV radiation < 315 nm [mWmin/cm2] to total solar radiation [g cal/cm2] at Washington (Lat. 38º 54’N).................................. V-56
5.8 Summary of natural weathering program............................................................ V-56
5.9 Summary of artificial weathering program. ........................................................ V-58
5.10 Relative flexural strengths and mass changes of PM specimens submitted to natural weathering (outdoors) and ageing (indoors).-Average values and correspondent standard deviations-. .................................................................... V-59
5.11 Relative flexural strengths of PM specimens submitted to artificial weathering tests. – Average values and correspondent standard deviations-...... V-64
6.1 Euro classification criteria for fire reaction..........................................................VI-7
6.2 Conversion trial from the German, British and French fire classification to European classification in terms of flame spread contribution (SpecialChem 2005).....................................................................................................................VI-8
6.3 Experimental results obtained from cone calorimeter tests performed on polyester and epoxy PM specimens. ..................................................................VI-22
6.4 Heat release and smoke data for various composites materials - Heat flux of 50.0 kW/m2 and exhaust duct flow rate of 25 m3/s- (Sorathia et al. 1999). ......VI-27
6.5 Epoxy PM formulations modified with flame retardant systems (mass percentages). .......................................................................................................VI-33
6.6 Physical and chemical characteristics of flame retardant compounds. ..............VI-34
6.7 Summary of classification of building materials according to their reaction to fire (rigid materials or flexible materials thicken than 5 mm). ......................VI-38
6.8 Combustibility of building materials according to fire reaction classification. ......................................................................................................VI-38

LIST OF TABLES
xxx
6.9 Epirradiator test results and classification index of plain polyester and epoxy PM formulations. .....................................................................................VI-39
6.10 Epirradiator test results and classification index of epoxy PM formulation modified with APP flame retardant system (20% in weight of resin content). ..VI-40
6.11 Epirradiator test results and classification index of epoxy PM formulation modified with ATH flame retardant systems: ATH-I and ATH-II (40% and 80%, respectively, in weight of resin content). ..................................................VI-40
6.12 Fire reaction classification of all PM formulations in study. .............................VI-41
6.13 Flexural test results (average values) of all epoxy PM specimens (modified and not modified with flame retardant additives)...............................................VI-43
6.14 Summary of regulatory requirements for materials used on constructive elements of housing buildings. ...........................................................................VI-47
6.15 Comparison table between the French and the European classifications (Collignon 2004). ...............................................................................................VI-48
7.1 Summary of physical and short-term mechanical properties of PM formulations.........................................................................................................VII-4
7.2 Summary of durability characteristics of PM formulations ..............................VII-11


I-1
I. INTRODUCTION Conventional portland cement concrete, specially when associated to steel, became in the
last decades the most widely used construction material. Its mechanical properties, in
combination with relatively low cost and quite simple manufacturing process, led to its
massive application over the more traditional construction materials such as wood, stone
or steel.
In spite of their extensive use, cement mortar and concretes present a number of
shortcomings such as low tensile and flexural strengths, low failure strain, delayed
hardening, susceptibility to frost damage, low bonding strength in repair applications, and
poor resistance to aggressive agents.
Some of these drawbacks can be overcome by the incorporation of an organic polymer or
resin in concrete mass, instead or in conjunction with portland cement binder. These
relatively new materials, the concrete-polymer composites (CPC), offer a number of
advantages that justify their growing use and application.
Higher strength, excellent durability, good resistance to corrosion, reduced water
permeability and greater resistance to damage from freeze-thaw cycles, are some of the
enhanced features presented by CPC materials (Blaga and Beaudoin 1985b). In addition,
the improved strength and durability offered by these materials, which are the major
requirements for the enhancement of infrastructure materials used in the civil
construction industry, reduce the need for maintenance and frequent repairs required by
conventional concrete. An other advantage showed by some of these composite materials
is their fast curing time, which is an asset in the production of precast elements, as parts
can be demolded a few hours only after concrete placement (Fowler 1999).

I. INTRODUCTION
I-2
Although the growing requirement for strong and durable materials to replace cement
concrete, specially regarding chemical resistance properties, this need has not yet been
translated into widespread usage of concrete-polymer composites. The most likely
reasons behind this are the lack of information on the properties of these materials, the
technology employed in their production and their higher cost (Gorninski et al. 2004).
The polymeric resin used in their production constitutes the major cost component.
Thus, as the incorporation of polymers in concrete leads to a considerable increase of
total cost of final product, the use of concrete-polymer composites only becomes
advantageous when their higher cost could be justified by the advantages brought by the
polymers to concrete. It is therefore necessary that civil and designer engineers have a
reasonable awareness of the capacities and limitations of these ‘new materials’, in order
to select the most appropriate product according to its intended application or end-use
(Blaga and Beaudoin 1985a).
1.1 Concrete-Polymer Composite Materials
The general concept of concrete-polymer materials, from technical point of view,
involves a process by which chemicals (monomers, oligomers, prepolymers polymers)
introduced into a concrete mix are subjected to polymerization and polycondensation by
thermo-catalytic or other systems (Czarnecki 2001). Thus, concrete-polymer materials
can be considered as hybrid composites of concrete using polymers.
Like a composite material, concrete-polymer materials can be understood as poly-phase
systems, whose phases cannot be mutually transformed into each other by any treatment,
and which attains properties not attainable by any of the constituting phases by
themselves, neither by the sum of them.
Similar to conventional cement concretes, polymer concrete composites comprise three
phases: a dispersed phase, constituted by the aggregates and reinforcements (if applied); a
continuous phase, formed by the binder matrix (cement and/or polymer), and a certain
porosity, imposed either by the size grading of aggregate material or by the process
I. INTRODUCTION
I-3
technology itself. The properties of these materials arise not only from those of their
components, but also from the synergetic effect created by their conjunction.
An infinite number of different mixtures depending on the chemical nature of
components, their contents and manufacturing process can be found observing the above
definitions. For this reason, it will be useful to clarify some simple categorization and
definitions.
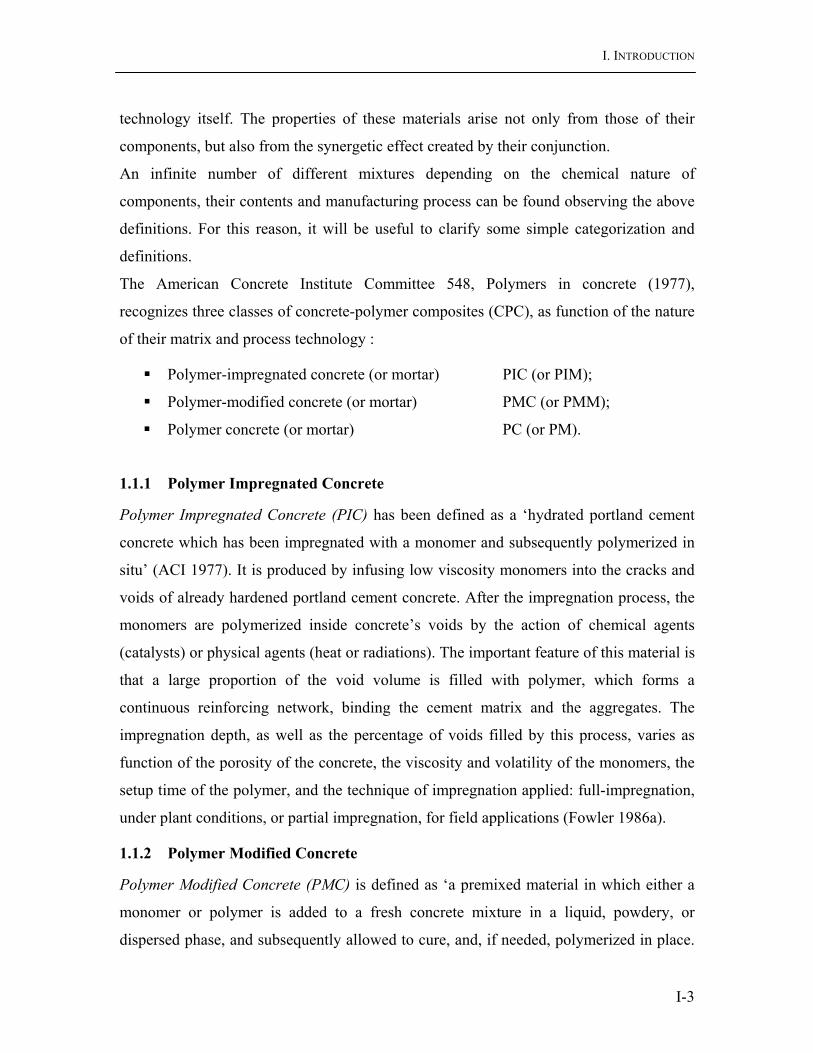
The American Concrete Institute Committee 548, Polymers in concrete (1977),
recognizes three classes of concrete-polymer composites (CPC), as function of the nature
of their matrix and process technology :
Polymer-impregnated concrete (or mortar) PIC (or PIM);
Polymer-modified concrete (or mortar) PMC (or PMM);
Polymer concrete (or mortar) PC (or PM).
1.1.1 Polymer Impregnated Concrete
Polymer Impregnated Concrete (PIC) has been defined as a ‘hydrated portland cement
concrete which has been impregnated with a monomer and subsequently polymerized in
situ’ (ACI 1977). It is produced by infusing low viscosity monomers into the cracks and
voids of already hardened portland cement concrete. After the impregnation process, the
monomers are polymerized inside concrete’s voids by the action of chemical agents
(catalysts) or physical agents (heat or radiations). The important feature of this material is
that a large proportion of the void volume is filled with polymer, which forms a
continuous reinforcing network, binding the cement matrix and the aggregates. The
impregnation depth, as well as the percentage of voids filled by this process, varies as
function of the porosity of the concrete, the viscosity and volatility of the monomers, the
setup time of the polymer, and the technique of impregnation applied: full-impregnation,
under plant conditions, or partial impregnation, for field applications (Fowler 1986a).
1.1.2 Polymer Modified Concrete
Polymer Modified Concrete (PMC) is defined as ‘a premixed material in which either a
monomer or polymer is added to a fresh concrete mixture in a liquid, powdery, or
dispersed phase, and subsequently allowed to cure, and, if needed, polymerized in place.

I. INTRODUCTION
I-4
The term polymer cement concrete (PCC) has also been used to refer this same material
definition’ (ACI 1977). Thus, PMC is a normal portland cement concrete with a polymer
admixture. The polymer acts as a modifier of the cement or as co-matrix, forming a
polymeric phase simultaneously with cement hydration. As a result, a hybrid matrix is
obtained, formed by an interpenetrating structures’ network of polymer and cement
hydration products that work together, resulting in an improvement in the material
properties. The polymer-binder ratio, as function of the specific formulation, is vary
variable (between 0.15% and 50%), but the usual amounts of polymers are in the range of
10% to 20% by weight of the portland cement binder. There are only few polymers
suitable for adding to concrete; most polymers would produce poor quality PMC due to
incompatibility problems with cement. The process technology used is very similar to
that of conventional concrete in mixing, placing and finishing. Therefore, PMC can be
cast in field applications, whereas PIC has to be used, most of the times, as a precast
structure (Blaga and Beaudoin 1985b; Fowler 1986b; Ohama and Ramachandran 1995).
1.1.3 Polymer Concrete
Finally, under the designation of Polymer Concrete (PC), also referred to as resin
concrete, it is assembled all concrete materials whose binder matrix is entirely formed by
organic polymers. PC is defined as ‘a composite material formed by polymerizing a
monomer and aggregate mixture. The polymerized monomer acts as the binder for the
aggregate’ (ACI 1977). Hence, PC is a cementless material. The polymer matrix binds
very well to aggregate particles with no transition zone, unlike conventional cement
concrete. Since polymer materials are more expensive than portland cement, and can
generate heat and undergo shrinkage under curing, PC is made with evenly graded
aggregates to achieve close packing, minimizing the space between the aggregates to be
filled with binder (Kardon 1997). Therefore, the amount of polymer binder used is
generally small and is usually determined by the size of the aggregates. Normally the
polymer content will range from 5% to 15% of the total weight, but if the aggregate is
fine, up to 30% may be required. Among the different types of concrete-polymer
composites, PC is the simplest and the easiest to produce. Further, its processing cost is
extremely low, even when compared with that one of conventional concrete (Blaga and
Beaudoin 1985a).

I. INTRODUCTION
I-5
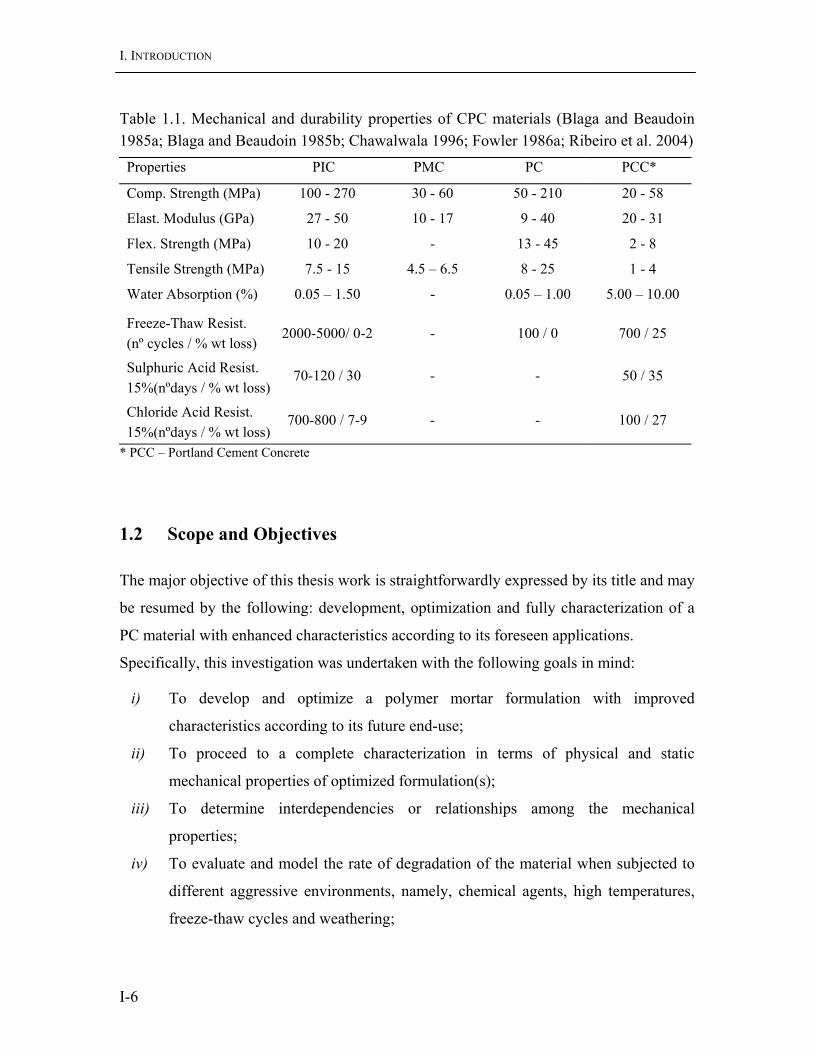
Figure 1.1 summarize the classification system of concrete-polymer composites and, in
the Table 1.1, the range of values usually found for the mechanical and durability
properties of these materials is given.
Fig. 1.1. Classification system of concrete-polymer composite materials.
Concrete-Polymer Composites
Dispersed Phase Aggregates
Porosity Continuous Phase Binder Matix
Inorganic Portland Cement
Hybrid
Polymer/Cement Portland
Organic
Polymer
PCC PIC PMC PC
Portland Cement Concrete
Polymer Impregnated Concrete
Polymer Modified Concrete
Polymer Concrete
None
Co-Matrix
Impregnant Modifier
Unique Matrix
Polymer Function
Semi-cont. phase Dispersed. Phase Cont. Phase
‘Polymer / Binder’ ratio by weight (%)
5 -15 % 0.15 – 50 % 100 % 0 %
I. INTRODUCTION
I-6
Table 1.1. Mechanical and durability properties of CPC materials (Blaga and Beaudoin 1985a; Blaga and Beaudoin 1985b; Chawalwala 1996; Fowler 1986a; Ribeiro et al. 2004) Properties PIC PMC PC PCC*
Comp. Strength (MPa) 100 - 270 30 - 60 50 - 210 20 - 58
Elast. Modulus (GPa) 27 - 50 10 - 17 9 - 40 20 - 31
Flex. Strength (MPa) 10 - 20 - 13 - 45 2 - 8
Tensile Strength (MPa) 7.5 - 15 4.5 – 6.5 8 - 25 1 - 4
Water Absorption (%) 0.05 – 1.50 - 0.05 – 1.00 5.00 – 10.00
Freeze-Thaw Resist. (nº cycles / % wt loss)
2000-5000/ 0-2 - 100 / 0 700 / 25
Sulphuric Acid Resist. 15%(nºdays / % wt loss)
70-120 / 30 - - 50 / 35
Chloride Acid Resist. 15%(nºdays / % wt loss)
700-800 / 7-9 - - 100 / 27
* PCC – Portland Cement Concrete
1.2 Scope and Objectives
The major objective of this thesis work is straightforwardly expressed by its title and may
be resumed by the following: development, optimization and fully characterization of a
PC material with enhanced characteristics according to its foreseen applications.
Specifically, this investigation was undertaken with the following goals in mind:
i) To develop and optimize a polymer mortar formulation with improved
characteristics according to its future end-use;
ii) To proceed to a complete characterization in terms of physical and static
mechanical properties of optimized formulation(s);
iii) To determine interdependencies or relationships among the mechanical
properties;
iv) To evaluate and model the rate of degradation of the material when subjected to
different aggressive environments, namely, chemical agents, high temperatures,
freeze-thaw cycles and weathering;

I. INTRODUCTION
I-7
v) To investigate the material’s behavior under fire and classify its fire reaction, as a
construction material, according to the present regulation;
vi) To evaluate the viability of its application either as a component material for
composite structural members -GFRP-polymer concrete hybrid beams-, or as a
mortar for lightweight aggregate structural concretes –PC material modified with
natural lightweight aggregates-.
1.3 Organization
The investigation study carried out in this thesis work is organized as follows:
Chapter II summarizes the background related to PC materials and their performance as
compared to ordinary cement concretes. The review also deals with the concepts and
processes technologies associated to concrete-polymer composites, their development and
progress over the last decades, and the standardization work that has been made regarding
them in the industry.
In Chapter III, all steps of optimization process that led to the most advantageous PM
formulations are depicted. Selection of raw materials, process technology and applied
design process are here described and the criteria of choice are discussed.
The basic physical and static mechanical properties of optimized formulation(s) such as
fresh state properties, setting shrinkage, specific gravity, coefficient of thermal
expansion, flexural, compressive and tensile strengths, stress-strain behavior and
deformability characteristics are included in Chapter IV. The usual test methods applied
to determine these properties are also reviewed and the suitability of their application to
PC materials is discussed.
Chapter V investigates the effect of aggressive environments on flexural performance of
PM formulation(s). Chemical durability, thermal durability and weatherability are the
main issues in analysis. The degradation rate of the material when subjected to different
chemical solutions, high temperature levels, positive thermal fatigue cycles, freeze-thaw
cycles, salt fog cycles, arc-xenon radiations and natural weathering agents is assessed and
modelled (for certain environment conditions).

I. INTRODUCTION
I-8
Behavior under fire is evaluated in Chapter VI. Heat release, ignition time, flame spread,
smoke and toxic gases release rates are some of the parameters determined in this part of
the study, which allowed the assessment of fire performance of PM formulation(s). The
effect of different flame retardant systems on material’s fire reaction is also analyzed.
Reaction to fire classification, according to French regulation, is performed and expected
classification according to the present European Union regulation is discussed.
The concluding remarks of the overall study and the recommendations for future works
are summarized in Chapter VII.
Finally, as Appendix, some publish works related with applications forms of developed
PM formulations are presented. Two main applications are approached: composites
structural beams made with GFRP (Glass Fibre Reinforced Plastics) profiles filled with a
PC material, and lightweight structural concretes based on PC materials modified with
lightweight natural aggregates, such as cork granules and wood shavings.
1.3 Relevant Publications
Some of the work reported in this thesis has been already published for publication. For
an easier reference, these publications are listed below:
i) C.M. Tavares, M.C. Ribeiro, M. Figueiredo, A.J.M. Ferreira, A.A. Fernandes,
“Influence of Material Parameters in the Mechanical Behaviour of Polymer
Concrete”, Mechanical and Materials in Design 3 -MMD3-, Orlando, USA,
May 2000, 239
ii) A.J.M. Ferreira, C.M. Tavares, M.C. Ribeiro – “Flexural properties of polyester
resin concretes” -, Journal of Polymer Engineering, Freund Publishing House,
Vol.20, No 6, 2000, 459-468.
iii) C.M. Tavares, M.C. Ribeiro, M. Figueiredo, A.J.M. Ferreira, A.A. Fernandes,
“Caracterização mecânica em flexão de betões de resina poliéster e epóxida”,
Betão Estrutural 2000, Porto, Novembro 2000, 55-64.

I. INTRODUCTION
I-9
iv) M.C.S. Ribeiro, C.M.L. Tavares, A.J.M. Ferreira, A.M.C. Paulo, M.A.G. Silva,
“Mechanical behaviour of degradated polymer concrete”, International
Conference on Composites in Construction –CCC 2001-, Porto, Portugal,
October 2001, 83-88.
v) C.M.L. Tavares, M.C.S. Ribeiro, D. Monteiro, P.P. Camanho, A.J.M. Ferreira,
“Experimental investigation into the static and fatigue behaviour of polymer
concrete reinforced with GFRP rods”, International Conference on Composites
in Construction –CCC 2001-, Porto, Portugal, October 2001, 329-334.
vi) C.M.L. Tavares, M.C.S. Ribeiro, A.J.M. Ferreira, R.M. Guedes, “Creep
Behaviour of frp-reinforced polymer concrete”, 11th International Conference
on Composite Structures, Melbourne, Australia, November 2001.
vii) M.C.S. Ribeiro, C.M.L. Tavares, A.J.M. Ferreira, A.T. Marques, “Static
flexural performance of GFRP-polymer concrete Hybrid beams”, International
Conference on FRP Composites in Civil Engineering –CICE 2001-, Hong
Kong, China, December 2001, 1355-1362.
viii) M.C.S. Ribeiro, C.M.L. Tavares, A.J.M.Ferreira – “Chemical resistance of
epoxy and polyester polymer concrete to acids and salts” -, Journal of Polymer
Engineering, Freund Publishing House, Vol.22, No 1, 2002, 27-44.
ix) A.J.M. Ferreira, A.T. Marques, C.M.L. Tavares, M.C.S. Ribeiro, ‘Polymer
concrete under severe conditions’, ORGAGEC’02 – Organic materials: A future
in the field of civil engineering? Environmental uncertainties? Poitiers, France,
13-15/03/2002, p.42.
x) Cassilda M.L.Tavares, Maria C.S.Ribeiro, António J.M.Ferreira, António
T.Marques, ‘Flexural analysis of polymer concrete beams reinforced with steel
and pultruded rebars’, 10th European Conference on Composite Materials
ECCM10, Bruges, Belgium, 03-07/06/2002.
xi) M.C.S. Ribeiro, A.J.M. Ferreira, A.T. Marques, ‘Durability assessment of
unsaturated polyester and epoxy polymer mortars’, ARQUIMACOM’02, S.
Paulo, Brasil, November 2002.
I. INTRODUCTION
I-10
xii) M.C.S.Ribeiro, C.M.L. Tavares, A.J.M. Ferreira, A.T. Marques, “Static flexural
performance of GFRP-polymer concrete hybrid beams”, Key Engineering
Materials, Vols. 230-232 (2002), 148-151.
xiii) C.M.L. Tavares, M.C.S. Ribeiro, A.J.M. Ferreira, R.M. Guedes, “Creep
Behaviour of FRP-reinforced polymer concrete”, Composite Structures 57 (July
2002), 47-51.
xiv) M.C.S. Ribeiro, A.J.M. Ferreira, A.T. Marques, ‘Flexural Behaviour of GFRP-
Polymer Concrete Hybrid Structural Systems’, 6th International Symposium on
FRP Reinforcement for Concrete Structures (FRPRCS-6), 8-11 July 2003,
Singapore, 695-704.
xv) M.C.S. Ribeiro, A.J.M. Ferreira, A.T. Marques, ‘Assessment of thermal
degradation on polymer mortars’, Journal of Polymer Engineering, Freund
Publishing House, Vol. 23, No 5, special issue, 2003, 299-313.
xvi) M.C.S. Ribeiro, A.J.M. Ferreira, A.T. Marques, ‘Analysis and experiments on
GFRP-Polymer Concrete Hybrid Beams’, Journal of Polymer Engineering,
Freund Publishing House, Vol. 23, No 5, special issue, 2003, 337-351.
xvii) M.C.S. Ribeiro, C.M.L. Tavares, M. Figueiredo, A.A. Fernandes, A.J.M.
Ferreira, ‘Bending characteristics of resin concretes’, Materials Research-
Revista Ibero Americana de Materiais, Vol.6, No 2, 2003, 247-254.
xviii) M.C.S. Ribeiro, J.M.L. Reis, A.J.M. Ferreira, A.T. Marques, ‘Thermal
expansion of epoxy and polyester polymer mortars. Plain polymer mortars and
Fibre reinforced polymer mortars’, Polymer Testing, Vol. 22, Issue 8, 2003,
849-857.
xix) M.C.S. Ribeiro, P.R.O. Nóvoa, A.J.M. Ferreira, A.T. Marques, ‘Mechanical
behaviour of polymer concrete modified with light organic aggregates’, 2nd
International Conference on Eco-Composites, 1-2 September 2003, Queen
Mary, University of London, UK.

I. INTRODUCTION
I-11
xx) M.C.S. Ribeiro, P.R. Nóvoa, A.J.M. Ferreira, A.T. Marques, ‘Flexural
performance of polyester and epoxy polymer mortars under severe thermal
conditions’, Cement & Concrete Composites, Vol 26, Issue 7, (2004), 803-809.
xxi) A.J. Mendes Ferreira, M.C.S. Ribeiro, A. Torres Marques, ‘Analysis of hybrid
beams of polymer concrete and composite materials’, International Journal of
Mechanics and Materials in Design, Vol.1 (2004), 143-155.
xxii) P.J.R.O. Nóvoa, M.C.S. Ribeiro, A.J.M. Ferreira and A.T. Marques,
‘Mechanical Behavior of Cork-Modified Polymer Concrete’, Key Engineering
Materials – Advanced Materials Forum II, Vols. 455-456 (2004), 805-809.
xxiii) P.J.R.O. Nóvoa, M.C.S. Ribeiro, A.J.M. Ferreira and A.T. Marques,
‘Mechanical characterization of lightweight polymer mortars modified with
cork granules’, Composites Science and Technology, Vol. 64, Issues 13-14
(2004), 2197-2205.
xxiv) M.C.S. Ribeiro, P.J.R.O. Nóvoa, A.T. Marques and A.J.M. Fereira,
“Mechanical characterization of lightweight wood-modified polymer concrete”,
Ciência & Tecnologia dos Materiais, Vol. 16, n.º 2-3, 2004, 81-87.
xxv) C. Novo, P. Nóvoa, C. Ribeiro, C. Ramos, A. Ferreira, A. Marques, ‘Health
monitoring with FRG sensors applied on polymer concrete structures’, 3rd
International Conference on Composites in Construction –CCC 2005-, Lyon,
France, July 11-13, 2005, 1053-1059.
xxvi) Paulo J.R.O. Nóvoa, Maria C.S. Ribeiro, António J.M. Ferreira, ‘Development
of lightweight polymer mortars based on binary aggregate compositions’, 3rd
International Conference on Composites in Construction –CCC 2005-, Lyon,
France, July 11-13, 2005, 733-740.
xxvii) M.C.S. Ribeiro, A.J.M. Ferreira, A.T. Marques, ‘Development of composite
hybrid structures based on polymer concrete – GFRP pultrusion profiles
assembly system’, 3rd International Conference on Composites in Construction
–CCC 2005-, Lyon, France, July 11-13, 2005, 1003-1010.

I. INTRODUCTION
I-12
xxviii) M.C.S. Ribeiro, ´Behaviour of hybrid polymer concrete-composite materials’,
Workshop on Advances on Composite and Polymer Mechanics and Process
Simulation, INTERREG III, Porto, Novembro 2005.
xxix) M.C.S. Ribeiro, P.R.O. Nóvoa, A.J.M. Ferreira and A.T. Marques, ´Mechanical
behaviour of lightweight wood fibre-modified polymer concrete`, 3rd
International Conference on Composites Testing and Model Identification –
CompTest 2006, Porto, Portugal, April 2006, 66.
xxx) M.C.S. Ribeiro, J.A. Rodrigues, A.J.M Ferreira and A.T. Marques, ‘Fire
Reaction Assessment of Epoxy Polymer Mortars Modified with Flame Retardant
Systems’, 12th European Conference on Composite Materials, ECCM 12,
Biarritz, France, August 2006, 201 (paper nº 500).

I. INTRODUCTION
I-13
Bibliography
ACI. (1977). "Polymers in Concrete." Report of ACI Committee 548R-77, American Concrete Institute, 1977, Detroit, Michigan.
Blaga, A., and Beaudoin, J. J. (1985a). "Polymer Concrete." Institute for Research in Construction Publications, Canadian Buiding Digest, CBD-242, www.irc.nrc-cnrc.gc.ca.
Blaga, A., and Beaudoin, J. J. (1985b). "Polymer Modified Concrete." Institute for Research in Construction, Canadian Buiding Digest, CBD-241, www.irc.nrc-cnrc.gc.ca, .
Chawalwala, A. J. (1996). "Material characteristics of polymer concrete," MS Thesis, University of Delaware, Newark, Delaware.
Czarnecki, L. "Polymers in concrete on the edge of the millennium." 10th Int. Congress on Polymers in Concrete - ICPIC 01, 2001, Honolulu, Hawai.
Fowler, D. W. (1986a). "Polymer-Impregnated Concrete." Corrosion and Chemical Resistant Masonry Materials Handbook, W. L. J. Sheppard, ed., William Andrew Publishing, Noyes, 383-391.
Fowler, D. W. (1986b). "Polymer Portland Cement Concrete." Corrosion and Chemical Resistant Masonry Materials Handbook, W. L. J. Sheppard, ed., Wiiliam Andrew Publishing, Noyes, 376-378.
Fowler, D. W. (1999). "Polymers in Concrete: a vision for the 21st century." Cement & Concrete Composites, 21(1999), 449-452.
Gorninski, J. P., Molin, D. C. D., and Kazmierczak, C. S. (2004). "Study of the modulus of elasticity of polymer concrete compounds and comparative assessment of polymer concrete and cement concrete." Cement and Concrete Research, 34(2004), 2091-2095.
Kardon, J. B. (1997). "Polymer-Modified Concrete: Review." Journal of Materials in Civil Engineering, 9(2), 85-92.
Ohama, Y., and Ramachandran, V. S. (1995). "Polymer-Modified Mortars and Concretes." Concrete Admixtures Handboock - Properties, Science and Technology, V. S. Ramachandran, ed., William Andrew Publishing, Noyes, 558-656.

I. INTRODUCTION
I-14
Ribeiro, M. C. S., Nóvoa, P. R. O., Ferreira, A. J. M., and Marques, A. T. (2004). "Flexural performance of polyester and epoxy polymer mortars under severe thermal conditions." Cement and Concrete Composites, 26(2004), 803-809.

II. POLYMERS IN CONCRETE REVIEW 2.1 History of Polymers in Concrete
2.1.1 Ancestor Materials
The use of polymeric compounds in building constructions is an old practice.
In the early history of humankind, there is evidence that people had the experience of
combining organic polymers with inorganic materials to produce a high-strength and
durable construction material. In the Bible, one of its excerpts mentions the use of
bitumen, a natural polymer, to build the masonry foundations of the Babel Tower
(Genesis 11:1-4). Other natural polymers such as albumen, glutinous rice paste, asphalt
and even blood, were also widely used as binders in the construction of ancient palaces,
temples and graves, which remain preserved to the present day (Chandra and Ohama
1994).
As far as we know, polymers have been used in construction as long ago as the fourth
millennium B.C., when the clay brick walls of Babylonia were built using natural
polymer asphalt in the mortar. The walls of Jericho were also built using a polymer
bituminous earth in about 2500-2100 B.C.. Other historic applications of bituminous
mortars in construction have been identified in the ancient Indus Valley cities of
Monhenjo-Daro and Harappa around 3000 B.C., and near the Tigris River in 1300 B.C.
(Kardon 1997). However, the most well known historic application of polymer mortars in
construction is perhaps the Great Wall of China (Fig. 2.1). Two thousand years before our
age, the glutinous rice paste-lime mortar was used to consolidate the brick walls of this
great monument, one of the seven wonders of the world (Wang 1981).

II. POLYMERS IN CONCRETE REVIEW
II-2
Fig. 2.1. The Great Wall of China – One of the first applications of natural polymer modified mortars.
Apparently, the earliest indication of using natural polymers in cement concrete was in
1909, in the United States, when a patent was granted to L.H. Backland. Thirteen years
later, in France, another patent on natural polymer modification for cement mortar was
granted to M.E. Varegyas (Chandra and Ohama 1994).
In Britain, polymers in concrete advanced in 1923 with L. Cresson’s patent for rubber-
modified road surfacing materials (Cresson 1923). The patent refers to paving materials
with natural rubber latexes where cement was used as filler.
In 1924, with L. Lefebure’s development of natural rubber latex cement (Lefebure 1924),
the first patent with the present concept of polymer modification was published, and later,
in 1925, another patent concerning the innovation on that product was issued to
Kirkpatrik (Ohama 1978).
Throughout the 1920’s and the 1930’s, the PMCs using natural rubber latexes were
extensively developed (Ohama and Ramachandran 1995).

II. POLYMERS IN CONCRETE REVIEW
II-3
2.1.2 Development of Concrete-Polymer Composites
The first synthetic polymers were developed in the beginning of the twentieth century
(Katz 1998) but industrial production of these new materials only saw significant
expression from the ‘40s onward, in response to wartime decline in availability of natural
rubber and increasing demand of the war effort. The first syntheses aimed at producing
substitutes for two natural polymers: silk and caoutchouc (natural rubber) whose
supplying sources in Malaysia were cut by the Japanese during the World War II.
However, since then, with increasing advances in polymer technology, hundreds of
synthetic polymers have been produced with no equivalent in nature.
Shortly after the end of World War II, began the practice of incorporating synthetic
polymers in concrete and mortar materials (Dikeou 1978).
In the ‘40s, some patents were published on polymer-modified systems with synthetic
latexes such as chloroprene and polyacrylic ester rubber latexes (Cooke 1941; Jaenicke et
al. 1943). In 1953, Geist et al. reported a detailed study on polyvinyl acetate modified
mortar (1953). In the ‘60s, styrene-butadiene rubber (SBR), polyacrylic ester and
poly(vinylidene chloride-vinyl chloride) modified mortars and concretes became
increasingly used in practical applications (Anon. 1959; Anon. 1964; Tyler and Drake
1961). Since then, the development of PMCs and PMMs has advanced significantly in
various countries, particularly USA, Russia, West Germany, Japan and the UK (Ohama
and Ramachandran 1995).
The widespread of knowledge about PIC occurred after researchers at Brookhaven
National Laboratory and the Bureau of Reclamation in the United States performed an
extensive research on the material during the ‘60s, although, USSR researchers claimed
to have invented it earlier (Fowler 1999). Producing of PIC by full-impregnation
technique was one of the most exciting material developments when it was announced.
This new material could develop mechanical strengths up to three to four times greater
than the concrete from which it was made and in addition, had excellent durability and
chemical resistance, due to its extremely low permeability. With such outstanding
properties, many applications were foreseen. However, as commented by Fowler, ‘like a
little girl who was all dressed up with no place to go’, PIC by full-impregnation technique

II. POLYMERS IN CONCRETE REVIEW
II-4
remained a material with great potential based on considerable research, but with
essentially no cost-effective applications (Fowler 1999). Apparently, at the present, only
one company at Ozawa in Japan, is still producing precast PIC components by full-depth
impregnation.
PC came into use in the ‘50s, although applications were very limited. It was first used in
the building industry in the USA, in 1958, for fabricating innovative precast wall panels
and artificial marble (Prusinsky 1978). In Europe, it was used as a prepackage repair
material as early as 1961 (Peschke 1978). However, it was only in the late ‘60s and early
‘70s, after PIC was developed that PCs received significant publicity. The increasing
interest in the great performances of PICs led researchers to explore the use of monomers
and resins as binders for aggregates. PC rapidly proved to be an excellent material for
both concrete repair and precasting of construction elements.
Those years, the sixties and the seventies, were characterized by an unlimited belief in
new and modern materials and techniques. The use of polymers was considered a sign of
progress and a modern attitude in construction (Van Gemert and Knapen 2006). Glass
fibre reinforced polyester panels, polyester resin and polyester mortars were known as
inexpensive plastics. With the oil crise, the industrialized world realized that mineral oil,
as a cheap basis for polymer production, was not longer available. It was also found that
oil reserves were limited. As a result, all uses for polymers were questioned. The massive
use of polymers as an alternative for classical building materials such as concrete,
masonry, timber and metals decreased. However, the research on concrete-polymer
composites did not stop and instead, it became part of a search for durable and
sustainable construction materials. Polymers began to be used both in a more rational
way, in the areas where their specific properties were needed, and in a more synergetic
manner in combination with classical construction materials, with which, a more
synergetic effect could be exploited (Van Gemert 2003).
This evolution led to new developments of CPCs. A better knowledge of material
behavior, specially in the field of admixtures, a better understanding of curing processes,
and a higher concern not only for the product’s end properties but also regarding
processability, allowed the development of high performing CPC materials (Van Gemert

II. POLYMERS IN CONCRETE REVIEW
II-5
2003). As a result, CPC-science is now an invaluable element in the development of
sustainable construction materials.
2.1.3 Relevant Activities
The progress of CPC-science can be assessed by the relevant amount of international
activities, published papers, awarded patents and standardization works that have been
developed in the last decades. The relevant activities addressing this subject are reported,
in what follows.
Considerable volume of information and studies is presently available on concrete-
polymer composites. According to Czarnecki’s own estimation, until 2001, over seven
thousand papers were published and over five thousand patents were awarded on CPC
materials (2001).
The first International Congress on Polymers in Concrete (ICPIC) was held in London in
1975, and since then, ten ICPIC’s more have been held, one at every three years. The
next congress, the 12th ICPIC will be held at Chucheon, Korea, in 2007. Earlier and
throughout this period, regular ACI (American Concrete Institute), RILEM (Union of
Testing and Research Laboratories for Materials and Structures) and EASPIC (East Asia
Symposium on Polymers in Concrete) symposia have also been held every two or three
years, helping to make CPC materials household words in the construction industry. A
list of the most important congresses and symposia that have been held up to the present
time can be found in Table 2.1.
In the United States, ACI’s Committee 548 for ‘Polymers in Concrete’, was created in
1971. Its mission was to gather, correlate, and evaluate information on the effects of
polymers on the properties of concrete, and to prepare a guide for their use. Since its
birth, this committee has sponsored several symposia and convention meetings on a
variety of topics relating to the use of polymers in concrete, by publishing the respective
volumes of proceedings (ACI SP-40 1973; SP-58 1978; SP-69 1981; SP-89 1985; SP-99
1987; SP-116 1989; SP-137 1993a; SP-214 2003). A state-of-the-art report, entitled
‘Polymers in Concrete’, was published in 1977 as ACI 548R-77, and an update edition,
II. POLYMERS IN CONCRETE REVIEW
II-6
with modifications, in 1981. Since then, ACI’s Committee 548 has issued several reports
and users’ guides for PC, PMC and PIC, as described later.
Also in the United States, in 1986, the Society of Plastics Industries (SPI) organized the
‘Polymer Concrete’ Committee and prepared 12 test methods for polymer concrete. At
few years earlier, the American Society for Testing and Materials (ASTM), under
Committees C 09 (‘Concrete and Concrete Aggregates’) and C 03 (‘Chemical-Resistant
non Metallic Materials’), established several subcommittees that issued during recent
years several standards on polymer mortars and polymer-modified mortars.
In Europe, RILEM’s Technical Committee TC-105-CPC ‘Concrete-Polymer
Composites’, was organized in 1986. The tasks of this Committee were to make the state-
of-the-art report on concrete-polymer composites, to set up classification criteria and to
agree on terminology and definitions. Later, another RILEM Committee was created to
study suitable test methods for concrete-polymer composites. At that time, although there
was worldwide usage of CPC materials, no appropriate test methods were available. The
need to prepare standard procedures for testing properties of concrete-polymer
composites was urgent. The use of internationally agreed standards for testing would not
only allow obtaining comparable and verifiable results, but more important, it would help
eliminating products of low or unsatisfactory quality. RILEM endorsed to these points of
view and formed the Technical Committee TC-113-CPT ‘Test Methods for Concrete-
Polymer Composites’. Thirty-one test methods were prepared for CPC materials, mainly
for polymer-modified concretes (and mortars), and polymer concretes (and mortars). An
international symposium held at Oostende in 1995 concluded the Committee’s work, with
the presentation of its results to the international scientific and industrial communities.
In Japan, standardization work on concrete-polymer composites began earlier. In 1987,
the Japan Concrete Institute (JCI) issued 17 standard test methods for polymer-modified
mortars. Several reports in the area were also published: The ‘Plastics Concrete’
Committee of the Architectural Institute of Japan (AIJ), which had a great contribution to
the field of CPC materials for many years, published a user’s guide and a state-of-the-art
report. It was discharged in 1987. The ‘Synthetic-Resins-for-Concrete’ Committee of the
Society of Materials Science (JSMS) also published a design recommendation for
polyester concrete structures in 1985, and a mix design guide in 1992.
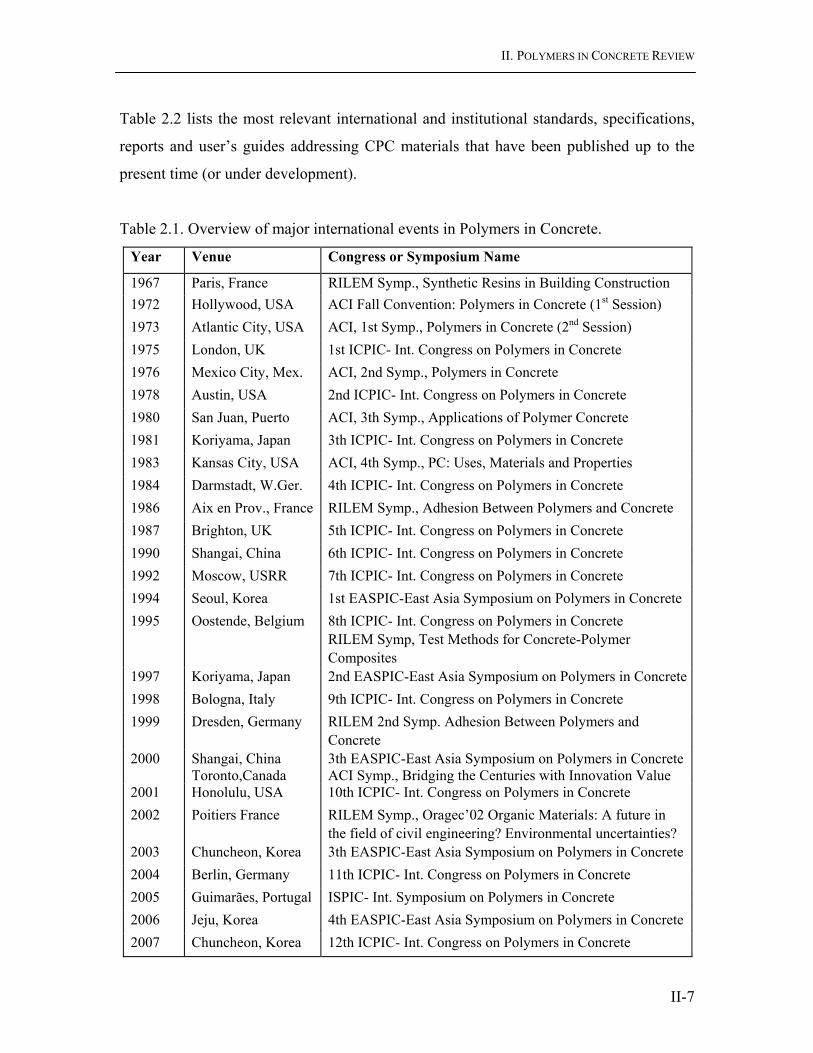
II. POLYMERS IN CONCRETE REVIEW
II-7
Table 2.2 lists the most relevant international and institutional standards, specifications,
reports and user’s guides addressing CPC materials that have been published up to the
present time (or under development).
Table 2.1. Overview of major international events in Polymers in Concrete.
Year Venue Congress or Symposium Name
1967 Paris, France RILEM Symp., Synthetic Resins in Building Construction 1972 Hollywood, USA ACI Fall Convention: Polymers in Concrete (1st Session) 1973 Atlantic City, USA ACI, 1st Symp., Polymers in Concrete (2nd Session) 1975 London, UK 1st ICPIC- Int. Congress on Polymers in Concrete 1976 Mexico City, Mex. ACI, 2nd Symp., Polymers in Concrete 1978 Austin, USA 2nd ICPIC- Int. Congress on Polymers in Concrete 1980 San Juan, Puerto ACI, 3th Symp., Applications of Polymer Concrete 1981 Koriyama, Japan 3th ICPIC- Int. Congress on Polymers in Concrete 1983 Kansas City, USA ACI, 4th Symp., PC: Uses, Materials and Properties 1984 Darmstadt, W.Ger. 4th ICPIC- Int. Congress on Polymers in Concrete 1986 Aix en Prov., France RILEM Symp., Adhesion Between Polymers and Concrete 1987 Brighton, UK 5th ICPIC- Int. Congress on Polymers in Concrete 1990 Shangai, China 6th ICPIC- Int. Congress on Polymers in Concrete 1992 Moscow, USRR 7th ICPIC- Int. Congress on Polymers in Concrete 1994 Seoul, Korea 1st EASPIC-East Asia Symposium on Polymers in Concrete 1995
Oostende, Belgium
8th ICPIC- Int. Congress on Polymers in Concrete RILEM Symp, Test Methods for Concrete-Polymer Composites
1997 Koriyama, Japan 2nd EASPIC-East Asia Symposium on Polymers in Concrete1998 Bologna, Italy 9th ICPIC- Int. Congress on Polymers in Concrete 1999
Dresden, Germany
RILEM 2nd Symp. Adhesion Between Polymers and Concrete
2000 Shangai, China Toronto,Canada
3th EASPIC-East Asia Symposium on Polymers in Concrete ACI Symp., Bridging the Centuries with Innovation Value
2001 Honolulu, USA 10th ICPIC- Int. Congress on Polymers in Concrete 2002
Poitiers France
RILEM Symp., Oragec’02 Organic Materials: A future in the field of civil engineering? Environmental uncertainties?
2003 Chuncheon, Korea 3th EASPIC-East Asia Symposium on Polymers in Concrete 2004 Berlin, Germany 11th ICPIC- Int. Congress on Polymers in Concrete 2005 Guimarães, Portugal ISPIC- Int. Symposium on Polymers in Concrete 2006 Jeju, Korea 4th EASPIC-East Asia Symposium on Polymers in Concrete 2007 Chuncheon, Korea 12th ICPIC- Int. Congress on Polymers in Concrete

II. POLYMERS IN CONCRETE REVIEW
II-8
Table 2.2. Relevant standards, specifications, reports and users’ guides on CPC materials. Institution Designation or Title
ASTM
ASTM C 267, 307-308, 321, 395, 399, 413, 531, 579-580, 658, 881-882, 884,905 ASTM D 3262, 3517, 384.
DIN DIN 51290 BS BS 6319 Part 1-12 JIS JIS A 1171-1174, 6203, 6909, 6916 (PMC); JIS A 1181- 1186, 5350. (PC) JCI JCI Test Methods for Polymer-Modified Mortar: 1-17. SPI SPI Polymer Concrete Test Methods: 1-7, 9-11, 13, 14. RILEM
RILEM TC113 Test Methods for Concrete-Polymer Composites: PC1-PC13 (PC) PCM1-PCM18 (PMC)
JSMS
Guide for Mix Design of Polyester Resin Concrete; Recommendation for Design of Polyester Resin Concrete Structures;
AIJ Guide for the Use of Concrete-Polymer Composites ACI
ACI 548R-77(81) Polymers in Concrete; ACI 548.1R-97 Guide for the Use of Polymers in Concrete; ACI 548.2R-93 Guide for Mixing and Placing Sulfur Concrete in Construction; ACI 548.3R-03 Polymer-Modified Concrete; ACI 548.4 Standard Specification for Latex-Modified Concrete Overlays. ACI 548.5R-94 Guide for Polymer Concrete Overlays; ACI 548.6R-96 Polymer Concrete:Structural-Applications State of the Art
Report; ACI 548.7-04 Test Method for Load Capacity of Polymer Concrete Underground
Utility Structures; ACI 548.AR Specification for Type ES Polymer Concrete Overlays; ACI 548.BR Guide for Structural Analysis of Polymer Concrete Structures; ACI 548.C Specifications for Cast in Place Sulfur Concrete; ACI 548.XR Report on Precast Sulfur Concrete; ACI 548.YR Type EM Polymer Concrete Overlays for Bridge and Parking
Decks; ACI 548.ZR Specification for Type PM Polymer Concrete Overlays.
The contributions made from all the above relevant activities (conferences and meetings,
published reports, users’ guides and standardization works), along with the practical
experience gained within the growing industry that applies polymers to concrete
technology, constitute the basis of CPC applied science, which is at present only limited
by the ingenuity of the concrete user.

II. POLYMERS IN CONCRETE REVIEW
II-9
2.2 Polymer Concretes and Polymer Mortars
2.2.1 Introduction
As stated earlier, polymer concrete (PC), also known as synthetic resin concrete, plastic
resin concrete or simply resin concrete, is a composite material in which the aggregate is
bound together in a matrix with a polymer binder. The composite does not contain a
hydrated cement phase, although portland cement can be used as an aggregate filler (ACI
1997). Polyester-styrene, epoxies and acrylics have been the most widely used
monomers/resins, but vinyl ester, furan, urethane and sulfur, have also been applied as
binders (Fowler 1999).
PC composites possess a unique combination of properties dependent of the formulation
(Fontana and Bartholomew 1981). These include:
• High tensile, flexural and compressive strengths;
• Good chemical and corrosion resistances;
• Low permeability to water and aggressive solutions;
• Good long-term durability with respect to freeze-thaw cycles;
• Rapid curing at ambient temperatures, with quick development of mechanical
strengths;
• Good adhesion to most surfaces;
• Excellent damping and electric properties (insulation);
• Low weight;
Application and performance of PC is dependent upon the specific polymer binder and its
content, as well as the type of aggregate and its gradation. Fibre reinforcements and
chemical additives, or other specific additions, as well as mixture design, mixing
procedures and application techniques, also have an important role on final product
properties. Therefore, the term PC should never suggest a single product, but a product
family instead.

II. POLYMERS IN CONCRETE REVIEW
II-10
In this section, the main features of PC composites such as the common raw materials
used in their production, process technologies, physical and mechanical properties
attained, and major application fields, are reported. However, before going on to this
review, it is worthwhile introducing a short parenthesis to clarify some basic concepts
regarding polymers and polymerization processes.
2.2.1.1 Polymers and polymerization: The basic concepts
The most majority of polymers are organic materials, natural or synthetic, with long chain
molecules of high molecular weight, made up of many individual repeated single units –
the monomers- connected end to end. The word polymer is derived from the Greek poly
meaning ‘many’ and mero, meaning ‘part’. The term polymer is thus understood as
something made up of many parts. Polymers made up of one type of monomer are called
homopolymers, and those made up of more than one monomer type are called
copolymers. A pre-polymer is a product resulting from the partial polymerization of a
group of monomers.
Polymerization is the name of the reaction through which the monomers link to each
other to form the long polymeric chains. Polymerization can occur with little energy input
or only in the presence of a curing agent, depending on the chemical nature of the
monomer. The curing agents can be constituted either by a catalyst system, which usually
comprises an initiator and (or) a promoter, or by a hardener, as in the case of epoxy
resins.
Initiators, often referred as catalysts, are chemical agents that initiate the growth of
polymer chains by decomposing into free radicals that actually start the chain’s growth.
The rate of reaction, and hence the rate of polymerization, depends on the temperature
and initiator concentration. The amount of initiator required is very low, ranging from 0.5
to 4% of monomer weight. The polymerization initiators generally used are either organic
peroxides or azo-compounds (ACI 1997).
Promoters, also referred as activators or accelerators, are generally used in polymer
composites when it is desired to conduct polymerization at ambient temperatures. A
promoter is a chemical compound that greatly increases the decomposition rate of
initiators. Promoters are also used in small quantities compared to the monomer. Some of

II. POLYMERS IN CONCRETE REVIEW
II-11
the most commonly used promoters are N,N-dimethyl aniline, cobalt octoate and cobalt
naphthenate (ACI 1997).
To prevent premature polymerization, most monomers contain an inhibitor when they are
shipped by manufacturers. Inhibitors are free-radical scavengers. More specifically, they
serve two functions. First, they can react with and deactivate the free radicals from
growing polymeric chains. Secondly, they can act as antioxidants and prevent
polymerization by reacting with oxidation products that may be formed in the storage
vessel through contamination from oxygen in the air.
2.2.1.2 Thermosetting and thermoplastic polymers
Due to the great capacity of conformation, ‘plastics’ became the common designation for
polymers. However, this term can be misleading, as there are many kinds of polymers,
with considerable differences between them. In synthetic polymers, the arrangement and
morphology of polymer chains can vary significantly. It is the different arrangement of
polymer chains, as well as the way as these ones remain linked, that determines the
classification of ‘plastic’ materials into two main groups: thermoplastics and thermosets.
Each one of these groups is characterized by the type and relative amount of crosslinking
of polymer chains.
Thermoplastics have weaker crosslinking of the molecular chains, and these links are
lesser effective than in the case of thermosetting plastics. The long polymeric chains are
held together by relatively weak liaisons, either by ‘Van der Waals’ forces or by
hydrogen bridges, which are reversible links. These materials may be softened by heat
and then regain their original properties upon cooling. This cycle of softening by heat and
solidifying on cooling can be repeated more or less indefinitely, and is a major advantage
in that it is the basis of most processing methods for these materials. It does have its
drawbacks, however, because it means that the properties of thermoplastics are more heat
sensitive. A useful analogy, which is often used to describe these materials, is that of
candle wax: they can be repeatedly softened by heat and will solidify when cooled.
Polyethylene, polystyrene, polyvinyl chloride, polyamides, cellulose acetate,
polypropylene and polymethyl methacrylate (PMMA) are some examples of
thermoplastic polymers (Crawford 1990).

II. POLYMERS IN CONCRETE REVIEW
II-12
Thermosetting plastics have stronger and more effective crosslinking of the molecular
chains. They are produced by a chemical reaction, which has two stages. The first stage
results in the formation of long chain-like molecules similar to those present in
thermoplastics, but still capable of further reaction. In the second stage, very strong
covalent bonds between polymeric chains are formed, assuring a tridimensional network
extremely stiff, which is practically irreversible (crosslinking of chains). These materials
cannot be remelted by heat. Indeed, heating process can result on a stiffer material due to
the forming of superior amounts of crosslinks between polymeric chains. However, if an
excess of heat is applied to these materials, they will char and degrade. This type of
behavior is analogous to boiling an egg: once the egg has been cooled and hardened, it
cannot be softened again by the application of heat. Since the crosslink of molecules
involves strong chemical bonds, thermosetting plastics are typically quite rigid materials
and their mechanical properties are less heat sensitive (within a certain temperature
range) than thermoplastic materials. Epoxy resin systems, unsaturated polyesters, furan,
vinyl ester and phenol resins are included in this group of polymers (Crawford 1990).
Both thermoplastics and thermosets can reap the benefit of fibre reinforcement or mineral
filler inclusion although they have developed in separate market sectors. This situation
has arisen due to fundamental differences in the nature of the two classes of materials,
both in terms of properties and processing characteristics.
An important physical characteristic of both classes of materials is their glass transition
temperature range (Tg). At temperatures above Tg, the material acts more rubbery,
undergoing plastic deformation when loaded. Below Tg, the material behaves more in a
glassy manner, deforming elastically and being susceptible to brittle failure (Su 1995).
Thermosetting polymers present higher Tg values than thermoplastics materials.
The polymer type, regarding the glass transition temperature range and the effectiveness
or density of the crosslinking, influences the physical characteristics of the polymer,
which in turn, affects the properties of the hardened polymer composite.
The polymers more frequently used in PC materials are of the thermosetting type;
however, in some applications thermoplastic polymers are also applied.

II. POLYMERS IN CONCRETE REVIEW
II-13
2.2.2 PC Raw Materials
2.2.2.1 Polymer binders
The role of polymer binder in PC technology is threefold: (1) they bond together the
aggregates particles; (2) they fill the voids in the aggregate mixture, minimizing moisture
absorption; and finally, (3) they provide sufficient fluidity in the mix to give a workable
polymer concrete (McBee et al. 1986).
Thermosetting resins that cure at ambient temperature, such as unsaturated polyesters,
epoxy systems and acrylic resins are the most often used polymers in PC materials,
although thermoplastic materials, such as methacrylate based ones, have also been
applied as binders. Sulphur also exists in polymer form, and sulphur concrete has been
used for PC applications requiring high acid resistance (Fowler 2001).
In Fig. 2.2, the commercially available resins more widely used in PC composites are
listed.
a) MMA -Methyl methacrylate; b) TMPTMA -Ttrimethylol propane trimethacrylate; c) UMA -Urethane methacrylate; d) HMWMA –High molecular weight methacrylate. Fig. 2.2. Commercially available resins currently used as binders in PC materials.
ThermosettingResins
ThermoplasticResins
PC BINDERS
• Unsaturated polyester
• Epoxy
• Phenol
• Vinyl Esther
• Acrylic (MMAa + TMPTMAb)
• Furan
• Acrylic (MMAa, HMWMc, UMAd)
• Sulphur
- Orthophtalic
- Isophtalic

II. POLYMERS IN CONCRETE REVIEW
II-14
The specific properties of each type of polymeric binder have a great influence on the
final properties of the hardened PC, therefore, the main characteristics of most commonly
used polymers in PC materials are here described.
i) Unsaturated polyester resin
The most widely used polymer-binders are based on unsaturated polyester polymers. In
most process technologies associated to polymer composites, such as RTM (resin transfer
moulding), pultrusion, filament winding, compression moulding and hand lay-up
impregnation, the polyester binder became a general purpose choice, due mainly to its
excellent performance/cost ratio.
Unsaturated polyester formulations result from the copolymerization of a primary resin
(polyester prepolymer) with a vinyl monomer in which the prepolymer is dissolved.
These formulations are available in the form of 60% to 80% solutions of the prepolymer
in copolymerizable monomers, which act as crosslink agents. During hardening, the
polyester prepolymer and the monomer react through their unsaturated groups (double
bonds), and the resulting polymer binder is a thermosetting polymer (Blaga 1974b). The
addition of a catalytic system (initiator and promoter) is required to initiate the
polymerization reaction. Thus, a typical polyester formulation comprises four
components: the prepolymer polyester resin, the reactive or crosslink agent, the initiator
and the promoter.
The primary polyester resin is in general, a high viscosity material, with a low level of
polymerization, produced by the polycondensation (polymerization reaction in which,
secondary products are released) of dihidroxy alcohols with dicarboxylic acids.
According the nature of the later, one can classify polyester resins into two main groups:
isophtalic and orthophtalic polyester. Isophtalic polyester is produced from isophtalic
acid while orthophtalic polyester is the result of a reaction with a phtalic acid.
Usually, commercially available polyester resins are already supplied with the reactive
monomers. Depending on intended end-use, an additional amount of reactive monomers
may be required. This can be done by adding the required amount of monomers to the
polyester resin prior to polymerization. Due to low cost, low viscosity and easy handling,
II. POLYMERS IN CONCRETE REVIEW
II-15
styrene and styrene-methyl methacrylate monomers are the most widely used reactive
monomers.
The polymerization initiators commonly used in producing polyester PC are organic
peroxides, namely dibenzoyl and methyl-ethyl-ketone peroxides (ACI 1997). As
accelerators or promoters, cobalt octoates are commonly used. The promoters should first
be mixed with the resin system, and only after, the initiators should be added. However,
some commercial polyester resin systems are already pre-accelerated by the
manufacturer. Hence, in these cases, there is no need of promoter addition to endorse the
polymerization process. To prevent premature polymerization, stored unsaturated
polyester-styrene resins are usually inhibited by the manufacturer with t-butyl
pyrocatechol at levels of 10 to 20 ppm.
Polymerization reaction is exothermic and it occurs by addition, i.e. without release of
secondary products. Polymerization and heat release rates are relatively high. These
features, associated to an elevated setting shrinkage, can lead to undesirable internal
stresses, which may inclusively lead to cracks in the component. However, it is possible
to adjust environment temperature and catalyst system in order to optimize both, enlarge
curing time and slow down the exothermic reaction.
Pot life, for each specific polyester resin, determines the available time for mixture
manipulation and can vary as function of environment temperature, type and amount of
catalyst system, formwork shape and material, and filler content. Curing process is also
highly sensitive to environmental conditions, namely temperature, moisture and contact
surface with air.
For temperatures below 18ºC, polymerization rate drops drastically and it may even not
occur for temperatures below 10ºC. Parts not properly cured, show poor mechanical
properties, not attainable with time. On the other hand, for temperatures above 25ºC, gel
times become increasingly shorter, leading to mixture heterogeneities and deficient
workability. Generally, moisture has a deleterious effect on curing process of polyester
resin systems. For moisture contents higher than 0.1%, catalyst systems that apply cobalt
compounds as accelerator are severely affected. Hence, if it is not possible to avoid
environment moisture, the use of aromatic amines (promoter) with dibenzoyl peroxides
(initiator) as catalyst system is strongly recommended. Oxygen may also inhibit the
II. POLYMERS IN CONCRETE REVIEW
II-16
curing process of certain polyester resins. Components’ casting into open formworks are
sometimes problematic, as the surfaces in contact with air may not achieve a proper cure,
remaining sticky and soft. Small amounts of paraffin or analogous compatible materials,
thoroughly mixed in the resin, can solve or minimize this problem, as these compounds
tend to migrate to the surface forming a shielding film (San José 1996).
In the absence of thermo post-curing treatment, final properties of polyester resin systems
are attained after a minimum period of one week at ambient temperature. These
properties vary according to polyester resin type and crosslink process, but in general,
they are reasonably good in terms of dimensional stability, mechanical strength and
resistance to chemical agents.
PCs made with polyester resin binders have good mechanical strength, relatively good
adhesion to other materials, and good chemical and freeze-thaw resistance, especially
those made with isophtalic polyester resins. They show, however, large setting and post-
setting shrinkage (up to ten times greater than portland cement concrete), which is a
serious disadvantage in certain applications (Blaga and Beaudoin 1985).
ii) Epoxy resin systems
The word epoxy is derived from epi, the Greek word for ‘on the outside of’, and oxygen,
which describes part of the molecular structure of the polymer (Popovics 1993). Epoxy
polymer systems, like unsaturated polyesters, are thermosetting polymers.
Epoxy systems constitute a class of plastic materials widely spread in the field of civil
engineering, aeronautics and industry in general. They were initially applied as adhesives,
but due to their excellent properties, they rapidly gained the status of construction
material on their own. Nowadays, epoxy compounds are commonly applied as coating,
patching, reinforcing and repair materials, and a large number of new other applications
have already be considered for these products as is the case of their use as binder, co-
binder or impregnator for CPC materials. The main drawback associated to this kind of
polymers is their relatively high cost (San José 1996).
Epoxy compounds are generally formulated in two or more parts. Part A is most often the
portion containing the epoxy resin that contains the epoxy groups, and Part B, is the

II. POLYMERS IN CONCRETE REVIEW
II-17
hardener system. The ratio of resin to hardeners varies considerably depending on the
formulation of epoxies (ACI 1997).
Most commercial epoxy resins are condensation products of bysphenol A with
epychloridrine (dyglicdil ether of bysphenol A), resulting in a primary resin with linear
polymeric chains, and with hydroxyl and epoxy groups in each extremity that allow
further crosslinking. Reticulation process, leading to a tri-dimensional network, is
accomplished by the chemical reaction between the epoxy groups of primary resin and
the active hydrogen or free radicals supplied by the curing hardeners.
The epoxy primary resin can be hardened with a variety of curing agents, the most
frequently used being polyamines, polyamides and polysulfide polymers (ACS 1979).
The use of polyamine hardeners results in PC products with the highest chemical
resistance, while epoxy PC products cured with polyamides have greater flexibility, better
heat resistance, and reduced tendency to chalk in outdoor exposure. However, the later
present lower solvent and chemical resistance than similar products cured with
polyamines. The use of polysulfide polymers produces epoxy PC with even greater
flexibility (Blaga and Beaudoin 1985).
Polymerization reaction, as in the case of polyester resin systems, is exothermic with
rising polymerization rates with increasing temperatures. Heat release may be
considerable and it depends of system reactivity, environment temperature and total
amount of mixture. Depending upon specific formulation, heat release can lead to
significant shrinkage on final product. However, exothermic peak occurs before
hardening, which partially prevents the risk of internal residual stresses (San José 1996).
Epoxy formulations present great versatility, which can be demonstrated by the wide
range of properties offered by these compounds: a) extremely short curing times, almost
instantaneous, or very long working lives, of several hours; b) ability to cure at very low
or at high temperature levels; c) chemical resistance concerning specific chemical agents,
covering almost the complete spectrum of solvents, alcohols, ketone, alkalis, bases,
organic and inorganic acids; d) high flexibility regarding workability (low to high
viscosity formulations); etc. (Mendis 1983).
Thus, chemical nature of this group of resins allows a large and varied set of properties,
therefore, almost without exception, epoxy systems must be formulated to make them

II. POLYMERS IN CONCRETE REVIEW
II-18
suitable for specific end-uses. An even greater number of flexibilizers, fillers and other
chemicals may be combined with these systems to produce several hundred different end-
products with various combinations of their unique properties (ACI 1997).
Epoxy PC products exhibit, in general, high adhesion strength to most materials, low-
setting and post-setting shrinkage, high chemical resistance, and good fatigue and creep
resistances. Because epoxy polymers are relatively expensive, epoxy PC is used for
special applications, in situations in which its higher cost can easily be justified, such as
mortar for industrial flooring to provide physical and chemical resistances, skid-resistant
overlays in highways, epoxy plaster for exterior walls and resurfacing material for
deteriorated areas (Blaga and Beaudoin 1985).
iii) Acrylic resins
The most common acrylic polymer used in PC is poly methyl methacrylate (PMMA),
obtained by polymerization of methyl methacrylate (MMA) monomers (Blaga 1974a).
The low viscosity, high reactivity, excellent wetting ability and relative low cost made
MMA monomers very popular in PC industry. PMMA has an excellent weathering
resistance, good waterproofing properties, good chemical and impact resistance, and
relatively low setting shrinkage. Most of these features are also showed by acrylic-based
PC products. In addition, these materials present coefficients of thermal expansion
equivalent to that of portland cement concrete, which is an advantage in repair
applications.
The main shortcoming associated to these compounds comes from the high flammability
and volatility of MMA monomers, which may constitute a safety problem in
manufacturing and casting processes of acrylic-based PC materials (ACI 1997).
In structural applications, MMA monomer is usually crosslinked with a reactive agent or
poly-functional monomer, most of the times trimethylol propane trimethacrylate
(TMPTMA), resulting in a thermosetting plastic material. As a catalyst system (initiator-
promoter), dibenzoyl peroxide and dimethyl-p-toluidine are usually applied (San José
1996). The chemical nature of the polymerization reaction is very similar to that of
polyester resins. Whereas polyester resins result of copolymerization of a pre-polymer
with a monomer, methacrylate resins are copolymers of two different monomers.

II. POLYMERS IN CONCRETE REVIEW
II-19
Although the MMA monomer is a little more expensive than the prepolymer-monomer
used in the more popular polyester PC, its unique properties justify its use in many
applications, including the manufacture of stair units, sanitary products, countertops, and
façade elements.
A highly successful development of acrylic PC has been its use as a rapid-setting,
structural patching material for repairing large holes in bridge decks and highways (Blaga
and Beaudoin 1985).
iv) Furan resins
Furan polymers are based on furfuryl alcohol monomer, which is derived from
agricultural wastes such as corn cobs, rice hulls or sugar cane bagasse (ACS 1979).
The furan monomer system is usually crosslinked with furfuraldehyde or formaldehyde to
yield thermosetting polymers. These resins are highly resistant to most aqueous acidic or
basic solutions and strong solvents, such as ketones, aromatic and chlorinated
compounds. They also present an excellent heat resistance and good capacity to penetrate
into porous materials (Muthukumar and Mohan 2005). In addition, being derived of
agricultural residues, they are relatively inexpensive when compared to other synthetic
resins. The main inconvenient of furan resins arises from their strong dark colour, which
may constitute an aesthetical limitation for certain applications.
Furan polymers are used as binders in mortars and grouts to achieve chemical-resistant
brick floors and linings. Precast or cast in-place tanks, repair of existing concrete and the
protection of new one from chemical attack are other reported applications. Since these
polymers have a very low viscosity, high filler contents are possible with binder content
running in the 7% to 13% range (McBee et al. 1986). In addition to exhibiting superior
chemical resistance, furan concretes have excellent resistance to elevated temperatures
and thermal shocks (Blaga and Beaudoin 1985).
v) Phenolic resins
The first completely synthetic polymer was a phenolic resin and it was introduced by Leo
Baekeland under the name of ‘Bakelite’ (1909). It was initially used as a substitute for
shellac to make billiard balls, but later, was applied to make valve parts, knobs, knife
handles and moulded plastic containers for radios and electronic instruments.
II. POLYMERS IN CONCRETE REVIEW
II-20
Phenolic resins are thermosetting polymers obtained by condensation of phenol and
formaldehyde. Two different polymerization reactions may occur depending upon the
phenol/formaldehyde ratio and pH environment.
When polymerization reaction is carried out with an excess of formaldehyde and under
alkalis catalysis, a thermoplastic polymer with low molecular weight is produced. This
kind of resins may lead to thermosetting polymers at high temperatures (up to 150-170ºC)
and under alkalis environments. The crosslinking process may also occur at ambient
temperatures if pH environment is decreased to highly acid values (pH<1).
If instead the polymerization reaction is processed with a surfeit of phenol and under acid
catalysis, the addition of a hardening agent is required to yield a thermosetting polymer.
A typical hardening agent is hexamethylenetetramine, a reaction product of formaldehyde
with ammoniac (San José 1996).
The excellent behaviour under fire of phenolic resins is their main advantage over other
synthetic polymers. Besides this desirable feature, phenolic resins also present excellent
resistance to abrasion, chemical attacks, and high temperatures, good dimensional
stability and great adhesion to other resins (Gálan 2001). Their main drawbacks,
regarding their use as binder in PC materials, seems to be their availability being limited
to dark colours, the high temperatures required for a proper polymerization process and
the great sensitivity to pH of the environment (under intermediate pH environments,
polymerization reaction may not occur).
vi) Sulphur based polymers
Sulphur polymers are inorganic thermoplastic materials produced by heating sulphur in
the temperature range of 120ºC to 150ºC. In this range, sulphur is a liquid with a viscosity
slightly higher than that of water. On cooling to ambient temperatures, solid products are
formed.
The use of sulphur as a hot-melt bonding agent and sealer for water vessels has been
known since prehistoric times (Sheppard 1975). Investigation works in the early ‘60s
showed that sulphur concretes with excellent strength properties could be prepared from
sulphur and aggregates mixtures (Crow and Bates 1970; Dale and Ludwing 1966; Dale
and Ludwing 1968). However, these first sulphur concretes failed when exposed to
II. POLYMERS IN CONCRETE REVIEW
II-21
normal temperature cycling, moisture conditions, or water immersion. Later, these
problems were solved by the development of sulphur modifiers that resulted on durable
and corrosion-resistant sulphur concretes (McBee and Sullivan 1982; McBee et al. 1981;
Sullivan 1982).
By reacting sulphur with unsaturated hydrocarbons, dicyclopentadiene (DCPD) and
oligomers of cyclopentadiene (CPD), stable sulphur compounds can be prepared by the
formation of long-chain polymeric polysulphides. Other modifiers for treating sulphur
include olefinic hydrocarbon polymers, polyol additives, phosphoric acids and
organosilanes (McBee et al. 1986).
Since the ‘80s, commercial production and installation of corrosion-resistant sulphur
concretes has increased continually, especially in the United States. Sulphur concretes are
being precast or installed directly in industrial plants where conventional concrete
materials have failed due to acid and salt corrosion. Typical installations are floors,
electrolytic cells, drainage ditches, sidewalls and foundations for columns and pumps.
Like phenol based concretes, the main disadvantage of sulphur concretes is the hot-
melting process involved in their production.
2.2.2.2 Aggregates
Aggregates for PC composites, as for conventional concretes, are generally obtained from
two sources. One is natural sand and gravel deposits produced by natural weathering and
abrasion from running water. These aggregates are primarily silica. The second source is
quarried rock, which is previously crushed and screened. Stone quarry products include
limestone, granite, quartz, marble, sandstone, and in general, all coarse and fined-grained
igneous rock. As filler materials (here understood as very fine aggregates), chalk, calcium
carbonate, clay, fly ash, silica fume, metallic fillers, and even portland cement, have been
successfully used in the production of PC materials.
Generally, any dry, non-absorbent solid material can be used as aggregate. However, in
order to achieve the full potential of PC products, aggregates of the highest available
quality should be used (e.g. silica-based, quartz, granite or good limestone).
When sand is used as single aggregate, the concrete composite material is usually
referred as polymer mortar.

II. POLYMERS IN CONCRETE REVIEW
II-22
All general considerations regarding aggregates in conventional cement concrete are also
valid for PCs, with one exception: moisture content. Aggregates for PC production must
usually be dry, and always be free of dust, grease, oil, or other organic materials.
Moisture reduces the bond strength between most of the monomers and epoxy resins and
the aggregate (Fowler et al. 1981). Unless otherwise specified, surface moisture should
not be allowed for aggregates used in the production of PC. Moisture contents of less
than 1% are acceptable, although some systems can tolerate up to 3% (ACI 1997).
Natural and artificial lightweight aggregates, such as expanded clay, expanded glass,
plastic chips, cork and rubber particles, can also be used in order to decrease self-weight
or introduce other features into the final product, as thermal and acoustic insulate
properties. (Kawakami et al. 2001; Larena et al. 1996; Lee et al. 1998; Nóvoa et al. 2005;
Nóvoa et al. 2004; Ribeiro et al. 2003).
Due to the great capacity of conglomeration and hermetic nature of polymer binders,
wastes, debris and by-products of other industries, even the hazardous ones for public
health, may also be incorporated as aggregates in PC materials. As described later,
recycling and wastes’ reutilization are some of the possible uses of PC composites that
have been exploited in recent years.
2.2.2.3 Fibre reinforcements and other strengthening materials
In certain applications of PC, short chopped fibres are sometimes introduced as
reinforcements. These include glass, carbon, polyaramid and metal fibres. Fracture
toughness, flexural and splitting flexural strengths are some of the mechanical properties
enhanced by the incorporation of fibre reinforcements in PC, and steadily reported in
several investigation works (Brockenbrough and Atterson 1982; Griffiths and Ball 2000;
Ohama and Nishimura 1982; Ohama and Sugahara 1981; Potapov et al. 2004; Reis 2003;
Vipulanandan et al. 1988).
Natural fibres, such as sisal, bamboo, wood, hemp and coconut, which have been used to
‘strengthen’ conventional cement concrete and mortars, may also be considered for PC
materials (Filho et al. 2003; Lundin et al. 2004; Yao and Li 2003).
In structural applications of PC materials, mild steel bars, high-strength steel bars (for
pre-stressed concrete), and FRP (fibre reinforced plastics) rods with carbon or glass
II. POLYMERS IN CONCRETE REVIEW
II-23
fibres, have also been used to reinforce PC elements (Ferreira et al. 2002; Rebeiz et al.
1993; San José and Ramírez 1999; San José et al. 1998; Tavares et al. 2002a; Tavares et
al. 2002b).
2.2.2.4 Additives, modifiers and other admixtures
Flame retardant systems, plasticizers, stabilisers, pigments and coupling agents are the
most common additives used in PCs.
Flame retardants: Most polymers, because they are organic materials, are flammable.
Additives that contain chlorine, bromine, phosphorous or metallic salts reduce the
likelihood to combustion occurrence or spread.
Plasticizers: Plasticizers are low molecular weight materials that alter the properties and
forming characteristics of the binder system. They have a reducing effect on polymer
viscosity, improving the workability and mouldability of fresh PC material.
Stabilisers: Stabilisers prevent degradation of the polymer due to environmental factors.
Antioxidants, heat and ultraviolet stabilisers are the most widely used.
Pigments: Pigments introduced during mixing process allow a large variety of colours in
the final product.
Coupling agents: Coupling agents are adhesion promoters for systems involving organic
and inorganic materials. Since they are bifunctional materials, they react with both the
organic polymer and the inorganic siliceous aggregate (or fibre reinforcement),
improving the adhesion towards the concrete matrix. A variety of silanes and titanates are
commercially available for this purpose.
Several other modifiers are also used either in resin binder systems or directly in PC
formulations, in order to change both the properties of the mixture and the resulting
mechanical properties for the cured material. These include resins modifiers (reactive
modifiers), and other additives or admixtures used to modify viscosity, flow, adhesion,
wetting, curing time, and naturally, the entire range of mechanical properties such as
tensile strength, compressive strength, modulus of elasticity, flexibility, temperature
resistance, etc.

II. POLYMERS IN CONCRETE REVIEW
II-24
2.2.3 Mix Design and Manufacturing Processes
As with portland cement concrete, the best mixture design and manufacturing process for
PC must account for the properties desired for specific uses.
2.2.3.1 Mix design
In developing mixture designs for PCs, aggregates and polymer binders with physical,
chemical and mechanical characteristics consistent with their future use must be selected.
By making the proper material choice, one can obtain concrete resistant to acid, alkali,
ultraviolet radiation, solvents, or combination of these.
i) Polymer binder type
The wide variety of resins and polymer binders used in PC materials may result in a
bewildering impression. Which resin is the best? Which polymer should be used for a
given purpose? There is no simple answer to these questions but a rational approach will
lead to satisfactory solutions.
First, no single polymer binder is the best one under all circumstances. Even if cost is
ignored, none of the available commercial resins can be regarded as the all-round winner.
So, if no single resin is the best all round, one should look at the second question: which
polymer binder should be used for a given purpose? Most properties of PC, on both fresh
and hardened stages, depend, to a greater or lesser extent, on the properties of the
polymer binder used. It is on this basis that the choice of binder matrix could be made.
However, in many cases, no one polymer binder is the best one and more than one
polymer type met the predefined requirements. The choice will depend on availability, on
cost (a very important feature in engineering decision-making), and on the particular
circumstances of available equipment and skilled labour force.
ii) Aggregate type and gradation
All the above considerations, regarding the best choice of polymer binder for a specific
PC product, are also generally applied for the selection of aggregate component. Intend
end-use should be always taken into account. For instance, quartz aggregates are suitable
in acid environment, whereas either quartz or limestone aggregates may be used where
salt corrosion is the problem (McBee et al. 1986). In general, aggregates for corrosion-

II. POLYMERS IN CONCRETE REVIEW
II-25
resistant PCs must be clean, hard, tough, strong, durable and free from any swelling
constituents.
Aggregate gradation design should aim to produce aggregates mixtures with the
maximum bulk density and the minimum voids’ content. The distribution should be such
as to allow for a minimum void volume for dry-packed aggregate. With this design, less
polymer binder will be required to assure the proper bonding between all aggregate
particles, resulting in a more economical PC. Generally, this leads to higher strength
materials, due to improved aggregate agglomeration, and to less shrinkage, as polymer
binder content is lower. Usually, suitable aggregate gradation designs for PCs are
achieved based on Fuller maximum density curves (McBee et al. 1986).
iii) Polymer binder content
As the most expensive component of PC, in order to decrease the total cost of final
product, just the required amount of polymer binder should be used. Therefore, polymer
binder content is generally small and is usually determined by the size, gradation and
total specific surface of aggregate mixture. Monomer viscosity also has some influence
on binder content: the higher the viscosity of the resin system, the higher the amount that
will be necessary to achieve the required workability of PC mixture.
Criteria used to determine the best mix design are based on adjusting the binder level to
provide the best balance between maximum mechanical strength, maximum specific
gravity, minimum absorption water, and workability. Normally, the polymer content will
range from 5% to 15% of the total weight, but if average size of aggregate’s particles are
very small, as in the case of some polymer mortars and grouts, up to 30% may be
required (Blaga and Beaudoin 1985).
In chapter III, optimization processes for PC formulations are thoroughly discussed.
2.2.3.2 Manufacturing process
The manufacturing process of PC largely depends of its end-use.
The ACI report ‘Guide for the use of polymers in concrete’ (1997) considers three main
classes of PC products according their specific end uses: polymer concrete patching
materials, for repair purposes; polymer concrete overlays, for floorings, bridges and
decks; and precast polymer concrete products.
II. POLYMERS IN CONCRETE REVIEW
II-26
For each class, respective process technology is described.
i) PC patching materials
In order to achieve a successful repair, before attempting any patch up on a concrete
surface with a PC patching material, two surface conditions must be met: a) the concrete
surface must be strong and sound, without signs of delamination, and b) the concrete
surface must be dry and clean (free of dust, oil grease or paint).
All deteriorated and unsound material should be removed. Patching over delaminated
areas is not recommended, unless delaminations are made sound (filled and glued) by
epoxy injection or other techniques. Moisture on the concrete surface should be also
eliminated, unless it is known that the adhesion of PC material to be use is not affected by
moisture. Dry-compressed air and gas-fire torches can be employed for cleaning and
drying the concrete surfaces.
Several methods have been applied for placing PC patching materials: dry pack
placement, premix placement and pre-packaged systems (ACI 1997).
In the ‘dry pack placement’ method, the graded aggregate is placed in the area to be
repaired and compacted by tamping, and posterior, saturated with a low viscosity
monomer mixture. Care should be taken to assure that the aggregate is completely wetted
with the monomer; therefore, sometimes several monomer applications are required. This
method eliminates the need of using a mechanical mixer, but it is difficult to determine
the required amount of monomer.
In the ‘premix placement’ method, the mixing and placement of PC is similar to that used
for portland cement concrete. Polymer binder is added directly to the mixer (which can be
a conventional concrete one, paddle-type or rotating-drum mixer), then fine aggregates
are added, and finally the coarse aggregates. Once all particles are completely wetted, the
composite mixture is placed over the repair area. Over-mixing should be avoided as it
will only serve to shorten the working period and may incorporate air in the mix
unnecessarily. Generally, the surfaces to be coated should first be primed with the
polymer binder. This method can be used either for high or low viscosity polymer
binders, and their quantity is predetermined.
Finally, in the case of ‘prepackaged systems’, all the components are packaged in units so
that no field measurements are required. The mixing of the components can be made by

II. POLYMERS IN CONCRETE REVIEW
II-27
hand or through mechanical mixers. The entire composite is then placed and can be
consolidated using adequate methods. In all cases, the recommendations of the
manufacturer should be strictly followed.
Once the PC has been placed by any of the methods described, it can be finished by using
manual or power trowels, or vibrating screeds. Power trowels are not recommended with
MMA systems due to their high flammability.
Cleaning tools after placement of PC material is always required. For this purpose,
organic solvents such as 1,1,1-trichloroethane, methylene chloride, xylene or methyl
ethyl ketone (MEK) may be used. However, other more environmentally friendly
cleaners, which act as emulsifiers instead of solvents, are becoming increasingly available
and their use is advised. Clean up of mechanical mixers can be accomplished by
immediately rinsing the drum with one of these chemicals, followed by operating the
mixer with a load of coarse aggregate.
ii) PC overlays
As in the case of PC patching materials, prior to the application of a PC overlay, the
surface to be coated must be evaluated, and according to that evaluation, a proper
preparation should be conducted. The above general considerations for patching PC
materials, regarding removal of delaminated or deteriorated material, and concrete
surface cleaning, are also here applied.
The ACI report (1997) recognizes four main types of PC overlays: thin sand-filled resin,
polymer seal coat, premixed polymer concrete and pre-packaged polymer mortar
overlays’ types.
‘Thin sand-filled resin overlays’ are placed by multiple applications of resin and sand
aggregates. A thin layer of initiated and promoted resin is applied over the cleaned
concrete surface. Immediately thereafter, a slight excess of sand is spread onto the resin
layer before it has gelled or cured. When the resin is completely cured, the excess of
aggregate is taken off, and the process is repeated until a total of three or four layers have
been applied. This results on a nonpermeable overlay with a highly skid-resistance
surface.
For the application of a ‘polymer-seal-coat overlay’, a 6 mm layer of dry sand is placed
upon the clean and dry concrete surface. A skid-resistant and hard aggregate is then
II. POLYMERS IN CONCRETE REVIEW
II-28
broadcast over the sand and hand rolled. The monomer mixture requires two applications.
The first application uses a low-viscosity system to penetrate into the aggregate mixture.
A second application of monomer, whose viscosity has been increased by the addition of
a pre-polymer, is then spread over the aggregate surface and allowed to cure.
Polyethylene films are often used to reduce the monomer evaporation.
In the ‘premixed PC overlay’ type, the grade aggregate and the monomer or resin system
are mixed together in a portable concrete mixer, placed on the concrete surface, and then
spread and compacted. Continuous pavement-finishing machines may be used for
highway overlays. Some overlays require a final broadcasting of aggregate onto the
finished surface in order to provide a skid-resistance surface.
The ‘pre-packaged polymer mortar overlay’ materials are generally applied in
thicknesses of 6 to 13 mm. Guide-rails placed on both sides of the lane to be overlaid
have been used with success. The mortar mixture, after being mixed in a mechanical
mixer, is placed within the forms. The guide forms are moved along as required.
In all situations, the manufacturer’s recommendations should always be followed.
iii) Precast PC products
Most of the procedures used for precast portland cement concrete can be applied to
making precast PC products.
Mixer selection is dependent on the monomer system being used. Conventional concrete
mixers perform well with low-viscosity monomers, but high-viscosity formulations tend
to adhere to the mixer paddles or to the rotating drums. Mixers should be selected so that
do not generate sparks.
For production casting, a continuous flow, high-speed mixer is far preferable to batch
mixers. Such automatic mixers are self-cleaning, requiring much less labour than batch
mixers, which should be thoroughly cleaned after each batch. Refined continuous mixers
with various degrees of sophistication are now available, including automatic feeding
systems for aggregates and resin binders. Automatic and variable metering of initiators
and promoters, resin pre-heaters and vacuum systems are also available. These mixers
present relatively high output rates and, with continuous delivery, can provide very high
daily production with much lower maintenance requirements than batch mixers. Some
examples of continuous automated mixers for precast PC products are shown in Fig. 2.3.

II. POLYMERS IN CONCRETE REVIEW
II-29
Fig. 2.3. Examples of continuous automated mixers for PC with vacuum support and automatic feeding systems for aggregates, resin binders, initiators and pigments.
Formworks and moulds for precast PC products must be extremely durable, solvent
resistant, have a low coefficient of thermal expansion, have smooth and cleanable
surfaces, and preferably, should be a good heat conductor (ACI 1997). For very low-
viscosity monomers, such as MMA, sealed forms are required. Stainless steel, mild steel,
silicone rubber, polyethylene, polypropylene, cast aluminium and wood have been
successfully used as forming materials for PC materials.
Generally, resin binders adhere strongly to the most conventional forming materials.
Selection of proper release agents is therefore important. Plastic sheeting, such as
polyethylene, vegetable oils, paraffin wax, or silicone greases may be used for that
purpose.
Formwork design must account for the effects of polymerization shrinkage, exothermic
heat, accessibility for removing entrapped air, for cleaning, coating, and reinforcing (if
applied). In addition, formworks should be designed in order to minimize or eliminate
postcasting process and finishing work. If possible, the forms should be conceived so that
the unformed surface is not exposed in the finished product, as smooth and high quality
II. POLYMERS IN CONCRETE REVIEW
II-30
finishes are best achieved against formed surfaces. As with conventional concrete,
different forming materials produce varying surface textures. Texture variations from
glassy smoothness to lightly sandblasted or wood appearance have been achieved.
For mix consolidation, conventional concrete vibrators may be used. Form vibration,
achieved by vibration tables or by attached vibrators to the formworks, provides better
results than internal vibration (e.g. finger vibrators). Amplitude and frequency are more
critical with PC than with traditional concrete. Low-viscosity monomers require low-
frequency with high-amplitude to remove entrapped air, while higher viscosity monomers
are better consolidated by high-frequency, low-amplitude vibrators. According ACI
report (1997), for high-viscosity resins, frequencies in the range 6000 to 9000
cycles/second (Hz), with an amplitude of about 1 mm, provide the best results.
In precast production, the temperature development in the PC formulations is very
important. As stated earlier, the polymerization reaction is exothermic, with the amount
of heat produced dependent on the types and amounts of materials of the specific
formulation. This heat development affects the time at which formwork can be removed
from the PC. Moulds may be removed after gel state, at a time when the PC has
developed enough strength that allow demoulding process without damaging the part that
have been casted.
2.2.3.3 Safety considerations
The use of polymers in concrete construction requires careful considerations to safety.
The unique nature of these materials and processes in construction requires cautious
attention by workers, engineers, contractors and inspectors.
Some chemicals used in the production of PCs may be flammable, volatile, toxic, or a
combination of these. Therefore, all job personnel involved in the production of PC
materials should be aware of the potential hazards and the safe handling practices related
to these chemicals, which include monomers, epoxy systems, initiators and promoters.
The main safety aspects concerning these products are here briefly discussed.
i) Monomers
Generally, monomers are volatile, combustible, and toxic liquids. The principal factors
that influence the stability of monomers and determine the methods to be used for safe

II. POLYMERS IN CONCRETE REVIEW
II-31
handling are: a) level and effectiveness of inhibitors, b) storage temperature, c)
flammability and combustibility, and d) toxicity. Secondary safety considerations include
sensitivity to light, moisture and oxygen. Odour may be an indirect problem because it
causes discomfort, but in itself is not a physical hazard.
The inhibitor level should be maintained above a minimum concentration at all times,
which is dependent of resin type. If it drops below the critic level, usually due to a long
storage, the amount remaining may not be adequate to prevent a premature
polymerization. Other factors, such as heat and air may also be responsible for the
depletion of inhibitor. Drums containing monomers should not be stored in the sun. As
soon as possible after they are received, they should be placed in a cool, shaded area.
Data on the effect of temperature and inhibitor level on the storage stability of monomers
is available from the manufacturers.
Special attention should be paid to the flash-points and explosive limits of monomers,
also available in respective safety data sheets. For instance, MMA, styrene and butyl
acrylate have been classified as flammable liquids because their close-cup flash points are
less than 38ºC. Other monomers not classified as flammables, such as polyester-styrene,
are nevertheless combustibles and should be treated accordingly.
Like most organic chemicals, most common monomers have varying toxic properties,
thus some precautions are necessary. The safety and health labour codes established
limits for the concentrations in the air of MMA and styrene to which employees may be
exposed. Normally, irritation in the eyes or respiratory system becomes noticeable long
before explosive or flammable concentrations are reached.
ii) Epoxy systems
Special precautions should be taken when handling epoxy resins, curing agents and
solvents with which they are used. Skin irritation as burns, and skin sensitization reaction,
constitute two typical health problems that may be encountered when epoxy materials are
carelessly handled. Allergic reactions may occur immediately, but in other cases, they
occur only after long periods of continual exposure. Safe handling of epoxy materials can
generally be accomplished in a well-ventilated area and using disposable gloves, suits and
equipment, wherever possible. Safety eyeglasses are also strongly recommended.
Involuntary habits, such as face scratching and adjusting eyeglasses should be avoided. In
II. POLYMERS IN CONCRETE REVIEW
II-32
case of direct contact with skin, the user should wash or shower immediately with soap
and water. Solvents other than soap and water soluble cleaners are not suitable for
personal cleanup, as most solvents merely dilute the epoxy compounds, aiding them in
penetrating the skin. Further details on handling epoxy compounds can be found in ACI
report ‘Use of epoxy compounds with concrete’ (ACI 1993b).
iii) Initiators and promoters
The polymerization initiators should be kept in a cool place, well away from heat or any
source of sparks and light. They should be stored separately, away from monomers,
flammable and combustible materials, and, in particular, away from promoters or other
oxidizing materials. Depending upon initiator’s nature, these chemicals may present both
fire and explosion hazards, can be toxic and skin irritants, chock and sunlight sensitive,
and, usually, they easily react with other chemicals. Stocks should be kept to a minimum,
as initiators have a limited shelf life losing efficiency with time.
The procedures for handling promoters are similar to those used for monomers.
Promoters should be kept in a cool place, but not in the same area as the peroxide
initiators, and should be treated as toxic and combustible materials. Particular care must
be taken to avoid mixing promoters directly with peroxide initiators, because the mixture
can react explosively. Promoters should first be added to the monomer and dispersed
thoroughly. Then, and only then, should the peroxide be added.
Smoking should be absolutely forbidden in and around facilities areas where monomers,
initiators, and promoters are stored or used. Fire extinguishers should be strategically
placed around the working areas. The extinguishers should use foam, dry powder, or
carbon dioxide.
Other general safety rules, concerning the handling of chemicals used in PC production,
can be found in the safety and health labour codes, which typically govern: a) limitations
of chemicals’ storage, b) fire protection and detection, c) employee safety, d) plant
ventilation requirements, and e) site use restrictions. The safety data sheet of each
particular material, given by the manufacturer, constitutes other important information
source. When properly used and applied, by well-informed workers under technically
competent supervision, the chemicals used in PC production should present no undue
safety hazards.

II. POLYMERS IN CONCRETE REVIEW
II-33
2.2.4 Generic Properties of PC Materials
The properties of the fresh and hardened polymer concrete and mortars are affected by a
number of factors such as mix formulation (which includes polymer type, binder content,
aggregate type and gradation), air content, mixing process and curing conditions. In
particular, the properties of polymer matrix have a strong influence on final properties of
PC materials, and most of them, are markedly improved over conventional cement
concrete materials.
The general properties of PC materials, regarding their main advantages and principal
limitations comparing with conventional cement concrete and mortars, are here
discussed.
2.2.4.1 Main assets of polymer mortar and concretes
i) Higher compressive, tensile and flexural strengths
In general, PCs and PMs present considerable higher mechanical strength than ordinary
cement mortar and concretes. Typically, PC systems are stronger by a factor of 3 or more
in compression, a factor of 4 to 6 in tension and flexure and a factor of 2 in impact, when
compared with ordinary portland cement concrete (Dharmarajan 1987; Fowler and Paul
1981).
The increase in mechanical strength is particularly notorious relatively to tensile and
flexural resistances. Flexural to compressive strength ratios in the range of 0.2 to 0.5 are
commonly found in PC materials. This is interpreted in terms of the contribution of high
tensile strength by the polymers themselves and an overall improvement in matrix-
aggregate bond.
Strength properties are influenced by various factors that tend to interact with each other.
The main factors are the nature of materials used, the controlling factors for mix
proportions, mixing processes, curing methods and, of course, applied testing methods.
The same mix formulation processed by different mixing techniques (ordinary
mechanical mixer and vacuum assisted mixer) result on PC materials with distinct
mechanical strengths. Compressive strength is more sensitive to mixing process as air or
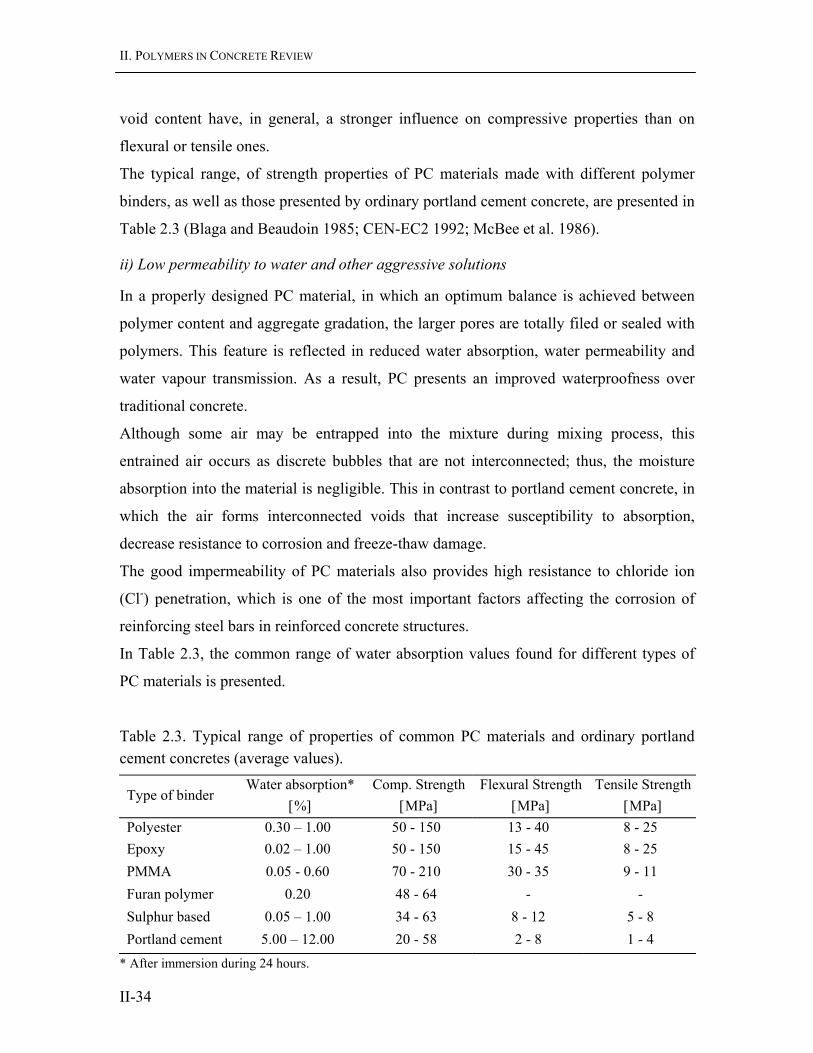
II. POLYMERS IN CONCRETE REVIEW
II-34
void content have, in general, a stronger influence on compressive properties than on
flexural or tensile ones.
The typical range, of strength properties of PC materials made with different polymer
binders, as well as those presented by ordinary portland cement concrete, are presented in
Table 2.3 (Blaga and Beaudoin 1985; CEN-EC2 1992; McBee et al. 1986).
ii) Low permeability to water and other aggressive solutions
In a properly designed PC material, in which an optimum balance is achieved between
polymer content and aggregate gradation, the larger pores are totally filed or sealed with
polymers. This feature is reflected in reduced water absorption, water permeability and
water vapour transmission. As a result, PC presents an improved waterproofness over
traditional concrete.
Although some air may be entrapped into the mixture during mixing process, this
entrained air occurs as discrete bubbles that are not interconnected; thus, the moisture
absorption into the material is negligible. This in contrast to portland cement concrete, in
which the air forms interconnected voids that increase susceptibility to absorption,
decrease resistance to corrosion and freeze-thaw damage.
The good impermeability of PC materials also provides high resistance to chloride ion
(Cl-) penetration, which is one of the most important factors affecting the corrosion of
reinforcing steel bars in reinforced concrete structures.
In Table 2.3, the common range of water absorption values found for different types of
PC materials is presented.
Table 2.3. Typical range of properties of common PC materials and ordinary portland cement concretes (average values).
Type of binder Water absorption*
[%] Comp. Strength
[MPa] Flexural Strength
[MPa] Tensile Strength
[MPa] Polyester 0.30 – 1.00 50 - 150 13 - 40 8 - 25 Epoxy 0.02 – 1.00 50 - 150 15 - 45 8 - 25 PMMA 0.05 - 0.60 70 - 210 30 - 35 9 - 11 Furan polymer 0.20 48 - 64 - - Sulphur based 0.05 – 1.00 34 - 63 8 - 12 5 - 8 Portland cement 5.00 – 12.00 20 - 58 2 - 8 1 - 4
* After immersion during 24 hours.
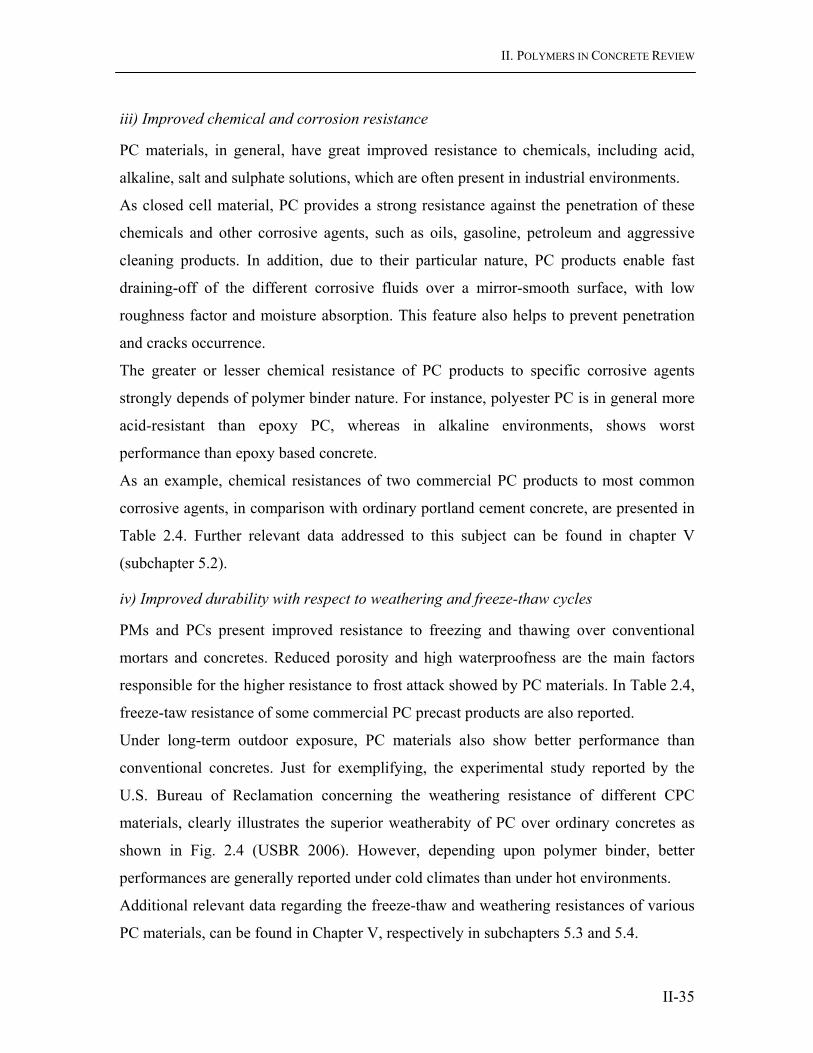
II. POLYMERS IN CONCRETE REVIEW
II-35
iii) Improved chemical and corrosion resistance
PC materials, in general, have great improved resistance to chemicals, including acid,
alkaline, salt and sulphate solutions, which are often present in industrial environments.
As closed cell material, PC provides a strong resistance against the penetration of these
chemicals and other corrosive agents, such as oils, gasoline, petroleum and aggressive
cleaning products. In addition, due to their particular nature, PC products enable fast
draining-off of the different corrosive fluids over a mirror-smooth surface, with low
roughness factor and moisture absorption. This feature also helps to prevent penetration
and cracks occurrence.
The greater or lesser chemical resistance of PC products to specific corrosive agents
strongly depends of polymer binder nature. For instance, polyester PC is in general more
acid-resistant than epoxy PC, whereas in alkaline environments, shows worst
performance than epoxy based concrete.
As an example, chemical resistances of two commercial PC products to most common
corrosive agents, in comparison with ordinary portland cement concrete, are presented in
Table 2.4. Further relevant data addressed to this subject can be found in chapter V
(subchapter 5.2).
iv) Improved durability with respect to weathering and freeze-thaw cycles
PMs and PCs present improved resistance to freezing and thawing over conventional
mortars and concretes. Reduced porosity and high waterproofness are the main factors
responsible for the higher resistance to frost attack showed by PC materials. In Table 2.4,
freeze-taw resistance of some commercial PC precast products are also reported.
Under long-term outdoor exposure, PC materials also show better performance than
conventional concretes. Just for exemplifying, the experimental study reported by the
U.S. Bureau of Reclamation concerning the weathering resistance of different CPC
materials, clearly illustrates the superior weatherabity of PC over ordinary concretes as
shown in Fig. 2.4 (USBR 2006). However, depending upon polymer binder, better
performances are generally reported under cold climates than under hot environments.
Additional relevant data regarding the freeze-thaw and weathering resistances of various
PC materials, can be found in Chapter V, respectively in subchapters 5.3 and 5.4.
II. POLYMERS IN CONCRETE REVIEW
II-36
Fig. 2.4. Appearance of poly-methyl methacrylathe PC specimens (left) and portland cement concrete specimens (right) after 20 years of outdoor exposure, according to investigation work reported by the U.S. Bureau of Reclamation (USBR 2006). Both types of beam specimens were installed near seawater and at half-tide elevation.
v) Good impact and abrasion resistances
PC materials have an excellent impact and abrasion resistances in comparison with
conventional mortar and concretes. This is because polymers themselves have a high
impact and wear resistances. The incorporation of short fibre reinforcements, such as
glass, carbon or steel fibres, considerably enhances these features (Neelamegan and
Parameswaran 1992; Ohama and Sugahara 1981).
In Table 2.4, abrasion and impact resistances of some commercial PC precast products
are reported.
vi) Fast curing with quick development of mechanical strengths
A valuable advantage of PC is its fast curing time, which is an asset in the production of
precasts as parts can be demoulded few hours only after the concrete placement.
Sometimes, depending upon polymer binder, catalyst system and environment
temperature, this period may be even further reduced for less than one hour.
Mixture hardening is also accompanied by a quick development of mechanical strength.
Therefore, in applications with coatings and repairs, the original structure can be in use

II. POLYMERS IN CONCRETE REVIEW
II-37
again after one single day. In general, after 24 hours, more than 80% of total mechanical
strength of PCs is already reached, and after one week at room temperature, all full
strength is usually achieved (in contrast with ordinary concrete, whose full strength is
only attained after 28 days) (Demura et al. 1993). The fast curing process of PC materials
can be even more accelerated by application of thermal treatment.
In particular, furan-based PCs cure very rapidly which led to being designated, in the
‘70s, as ‘30 minute concrete’. At the time, the Air Force of U.S. developed several furan
concrete formulations, which could be used to fill bomb craters in airfield runways after
an air attack. This concrete material could fill craters up to 23 meters in diameter, cured
quickly under any weather conditions and could bear the weight of a landing jet plane
few hours after installation (McBee et al. 1986). Nowadays, furan concretes find
extensive use as a highway repair material, in areas where traffic cannot be diverted for
an extended period of time.
Table 2.4. Freeze-thaw, chemical, abrasion and impact resistances of some commercial precast PC products.
Durability Property Manufacturer Test method PC PCC
Chemical resistance: - H2 SO4 (1:5) - KOH (200g/l) - H Cl (1:5) - Gasoline - Fuel oil - Cleaning products
ULMA
Int. Method (IM) - Comp. strength (Kg/cm2) / Retained comp. strength (%), after immersion period
1331 / 102 1078 / 82 1206 / 92 1272 / 97 1228 / 94 1234 / 94
Damaged 256 / 99 190 / 74 206 / 80 177 / 69 202 / 78
- H2 SO4 (0.1N) - Na Cl (5%) - Hydrochloric Ac 0.2 - Na OH (0.1N)
STRONGWELL ASTM D-543 - Section 7, Proc. 1
Approved Not satisfy
Freeze-thaw resistance ULMA STRONGWELL
UNE 127 004 IM (2500 cycles)
Unchanged Unchanged
Damaged Damaged
Impact resistance
ULMA
UNE 127 007
95 cm
55 cm
Abrasion resistance
ULMA
UNE 127 005/1
0.53 mm
5.03 mm

II. POLYMERS IN CONCRETE REVIEW
II-38
vii) Improved fatigue strength
Several studies have been published reporting the improved resistance of PC materials
over conventional concretes under dynamic fatigue loads (Hsu 1984; Hsu and Fowler
1985; Kwak and Kim 1995; Mebarkia 1993; Tavares et al. 2001).
As in the case of portland cement concretes, the applied stress (S) is the most important
factor influencing the fatigue life of PC materials: as the applied stress increases, the
fatigue life decreases. The effect of the range between the maximum and the minimum
applied stress (R) is also significant: the wider the stress range, the shorter the fatigue life.
As an example, in Fig. 2.5, the comparison between the flexural fatigue strength of MMA
PC beams and that of portland cement concrete beams is shown. The Wöhler curves were
reported by Hsu and Fowler (1985), in which those correspondent to portland cement
concrete were adopted from Murdock and Kesler (1958).
Fig. 2.5. Comparison between flexural fatigue strengths of plain MMA PC and plain portland cement concrete beams: in stress level scale, at left, and in stress scale, at right (Hsu and Fowler 1985). Wöhler curves corresponding to the stress ranges of R=σmin/σmax= 0.05, 0.10, and 0.25 (average values). Beam specimens were cyclically loaded at a constant rate of 5 Hz.

II. POLYMERS IN CONCRETE REVIEW
II-39
viii) High adhesion and bond strength to various substrates
A very useful aspect of PCs and PMs is their improved adhesion or bond strength to
various substrates compared with traditional cement concrete materials. Most of PC
composites have an excellent adhesion to brick and ceramic materials, traditional
concrete, steel, wood and stone. This feature is attributed to the high bonding capacity of
polymers.
For a successfully bonding, the substrates must fill two single requirements: they must be
dried and properly cleaned (free of dust, oil or grease). The adhesion is usually affected
by the polymer content, polymer type and the properties of the substrates’ surface.
Smooth surfaces are not suitable for a good adhesion. In order to obtain a strong bond,
surface preparation by abrasive blasting or chipping techniques is recommended.
Generally, under normal conditions, it is not possible determining the adhesion of PC
materials to prepared cement concrete surfaces, since most PC materials provide more
than enough strength and adhesion to rupture the surface of the cement concrete before
the bond is broken. This type of test will simply measure the surface strength of concrete
substrate in tension. Hence, most PC manufacturers list bond to cement concrete as
‘stronger than concrete’ (McBee et al. 1986).
Adhesion to sandblasted steel surfaces is usually on the same order of magnitude as the
tensile or shear strength of PC material (San José et al. 2003). Usually, a cohesive failure
of PC adjacent to the sandblast profile occurs.
ix) Excellent damping and electric properties
One of the PC advantages is the ability to damp of vibrations. The great capacity of PC to
absorb energy makes it very suitable for the manufacturing of machine tool foundations,
in a highly competitive basis with cast iron and steel (Ates 1994; Karademir 1997).
Damping characteristics of PC materials might be 4 to 7 times higher than cast iron, and
in addition, they present other desirable characteristics such as excellent corrosion-
resistance, low thermal conductivity and high strength-to-weight ratio (Orak 2000).
Nowadays, it is attempted to take advantage of the excellent damping properties of PCs
for building structures undergoing dynamic loads.

II. POLYMERS IN CONCRETE REVIEW
II-40
PC materials also present high electrical resistivity, which is a very useful property for
specific applications where non-conductive materials are required (Gunasekarane 1977;
Vidaurre et al. 1998). The insulate properties of PC materials eliminate the loss of ‘stray
current’ that occurs when an ordinary cement-based material is used. PC materials
present a volume resistivity in the order of 1013 ohm-m, whereas conventional cement
concretes possess electrical resistivities in the wide range of 40 ohm-m (moist concrete)
up to 104 ohm-m (air-dried concrete), depending upon water/cement ratio and curing
process (McBee et al. 1986; Neville 1995).
x) Lightweight
Since polymers present lower specific weight than hydrated cement pastes, PCs
depending upon of applied formulation and manufacturing process are in general lighter
than ordinary cement concretes. Specific gravity of PC materials can vary widely, but the
common range of values is found between 1.7 and 2.2 kg/dm3. This feature, lightweight,
is further enhanced taking into account that smaller cross-sections are required for the
same load carrying capacity. In addition, with lighter concrete, the total mass of materials
to be handled is reduced with a consequent increase in productivity. Thus, in precast
applications, reduced transportation and labour costs are achieved with the use of PC
instead of portland cement concrete.
2.2.4.2 Main limitations of polymer mortar and concretes
i) Cost
One of the primary limitations of PC materials is cost. The cost of polymers usually range
from 10 to 100 times that of portland cement, and even considering the higher specific
gravity of cement (around 2.5 times higher), the cost per unit volume of polymer
composites is still considerable higher than traditional cement concrete (Fowler 1999).
As a more expensive material, the use of PC for high volume applications becomes
unpractical, excepting for the specific cases where durability requirements render
ordinary concrete unsuitable.
A meaningful comparison of cost, however, cannot be limited to the cost of materials but
should be made with basis on the design of the ‘structure’. The higher price of PC

II. POLYMERS IN CONCRETE REVIEW
II-41
materials is mitigated by their longer service life, lower labour maintenance and lower
life cycle costs. In addition, smaller cross-sections are required to attain a certain load-
bearing capacity, when compared to conventional concrete materials, reducing the total
cost of final product. Further, it is believed that the development of mass production
systems for precast PC materials, and of automated application systems for cast-in-place
PMs and PCs, will cause a cost reduction and a good cost-performance balance (Ohama
1997).
ii) High sensitivity to temperature and creep
The mechanical strength of PC materials is highly dependent on temperature due to
temperature dependence of the polymers themselves (especially thermoplastic polymers).
PCs and PMs show a rapid reduction in strength and deflection with increased
temperature. This trend is substantial at temperatures higher than both the glass transition
(Tg) and heat distortional (HDT) temperatures of the polymers. Thermal resistance is thus
governed by the nature of polymer binders (their Tg and HDT), polymer-aggregate ratio,
heating conditions, and at last, by the thermal degradation of polymers. Relevant data
concerning this subject can be found in Chapter V (subchapter 5.3)
Due to viscoelastic nature of polymers, PCs are also very sensitive to creep and
relaxation. The most characteristic features of viscoelastic materials are that they exhibit
a time dependent strain response to a constant stress (creep) and a time dependent stress
response to a constant strain (relaxation). In addition, when the applied stress is removed,
the materials have the ability to recover slowly over a period of time. These effects can
also be observed in metals but the difference is that in plastics they occur at room
temperature whereas in metals they only occur at very high temperatures (Crawford
1990). The viscoelasticity of PC materials leads to that quantities such as modulus,
strength and ductility are sensitive to straining rate, elapsed time, loading history and
temperature.
In the investigation work carried out by Hsu (1984), on flexural behavior of polyester PC
formulation, it was found that, for stress levels up to 0.4, the compressive creep in PC
was approximately one to two times higher than that found in portland cement concrete.
At higher stress levels, creep in PC drastically increased. However, the specific creep,
II. POLYMERS IN CONCRETE REVIEW
II-42
which is the creep strain per unit of applied stress, was found to be within the range of
portland cement concrete.
A deep review on creep behavior of PC systems can be found on Dharmarajan thesis
work (Dharmarajan 1987) and more recent data on this subject, is available on studies
carried out by Hu and Sun(2000), Monteiro (2005), and Tavares et al (2002a).
Irrespective of PC type, main conclusions of all referenced studies are in quite agreement
with each other:
• Creep strains increase with polymer content, temperature and stress level applied;
• Stress-to-strength ratios exceeding 0.5 generally lead to catastrophic creep failure;
• PCs creep more than portland cement systems at the same stress levels;
• and Creep failure occurs at lower stress-to-strength ratios in PC materials than in
portland cement concrete.
It was also noticed that the sustained creep loads did not affect the ultimate strength of
PC materials, and epoxy-based PC systems were, in general, more creep resistant than
those formulated with polyester resins.
iii) Deficient behaviour under fire
Reaction to fire is another important shortcoming of PC materials. Most of them are
classified as median to highly flammable materials, and therefore they cannot be used as
structures for housing buildings (Fowler 1999).
Fire behavior of PC systems may be improved either by the use of fire resistant resins,
such as phenol resins, or by the incorporation of flame retardant additives in polymer
binder. Fireproofing coatings further applied on the outer surface of the material could
also be an efficient solution to minimize this undesirable feature.
This issue will be discussed in Chapter VI.
iv) Relative high coefficient of thermal expansion and shrinkage
In general, depending upon polymer binder type and content, PC materials show higher
coefficients of thermal expansion (CTE) than portland cement concrete (2 to 4 times
higher). This feature may constitute a problem when PC is used as repair or patching
material for concrete structures. Thermal changes can produce high shear and tensile

II. POLYMERS IN CONCRETE REVIEW
II-43
stresses at the interface, which may cause the repair to delaminate or crack (Fowler et al.
2001; McBee et al. 1986). Two different situations may occur:
• At elevated temperatures, the polymeric repair material tries to expand at a rate
greater than that of the concrete and steel it is adhered to, and, as a result, it is held in
a compressive state. This has not been found to be a problem as far as shear stress
developed at the interface remained lower than shear bond strength. Otherwise,
delamination will occur.
• When the PC repair material is exposed to lower temperatures after installation, as in
summer-to-winter weather cycles, tensile stresses result. Depending on the physical
configuration of the material, the stresses produced may result in cracks in the PC
material. To prevent this situation, the use of MMA based polymer binders, which
present CTE similar to portland cement concrete is advised.
Shrinkage can also be quite large in PC when compared to conventional concrete,
especially in the case of polyester based concretes. Generally, polyester PCs and PMs
have a setting shrinkage of about ten times that of the cement concrete (Ohama and
Komiyama 1979). However, shrinkage occurs quickly and after 24 hours or less, it is
negligible due to relaxation.
v) Odour, flammability and toxicity of raw materials
Another limitation, as already mentioned in ‘safety considerations’ issue, is the odour,
toxicity and/or flammability of many of the monomers and resins during construction and
fabrication. Although these limitations only exist during the relative short period between
handling, mixing and curing, the use of these materials can create safety problems and/or
user discomfort, which must be taken into account during construction.
vi) Lack of experience with PC by many users
Due to lack of familiarity and experience, polymers are often used to make PCs without
considering the demands on the job, resulting on deficient or poor materials. Polymers are
also often applied to make repairs without taking into consideration the cause of damage
and/or without proper preparation of the repair object. As a result, some failures occurred
due to incompatibility of PC and the substrate. Any material used inappropriately can
give bad results, but the material itself is not responsible. An additional challenge is the

II. POLYMERS IN CONCRETE REVIEW
II-44
departmentalization of research and knowledge. People knowledgeable about polymers
lack background in building materials and, on the other hand, people versed in building
materials do not well understand polymer technology (Chandra and Ohama 1994). In
fact, both disciplines must be taken into account and a better bridge between both sides is
fundamental.
2.2.5 Application Fields of PC Materials
Recent and Foreseen Developments
PC materials are not intended as a replacement for portland cement concretes or other
conventional construction materials in uses in which those materials have proven being
durable and cost efficient. PCs have their own place where durability, strength or other
particular requirements render conventional materials unusable.
There are thee main well-known application fields where PC materials revealed to be
competitive over conventional materials: overlays for pavements and floorings,
precasting, and patching materials for repair and rehabilitation of purposes.
Recently, with the great interest that has been shown in construction materials with
ecological and safety characteristics, a new branch market emerged for PC materials:
recycling and waste encapsulation. Each one of these successful or under development
applications will be discussed.
2.2.5.1 Precast PC products
Precasting is one of the fastest growing applications of polymers in concrete.
Precast represents an excellent use of the material due to its fast curing, high strength-to-
weight ratio and ability to form complex shapes. Used at first as concrete replacement,
precast PC is nowadays also applied as a substitute for cast iron, steel and other metals,
wood and even structural plastics.
The most current and well-known precast PC applications are here described.
i) Artificial marble
PCs were most widely used initially and today for cultured marble for counter tops,
lavatories and other sanitary wear, interior wall panels, stairs and worktops for kitchens

II. POLYMERS IN CONCRETE REVIEW
II-45
and laboratories. Marble aggregates, by-products proceeding from marble industry, bind
with acrylic or polyester resins, result on highly strong materials that simulate closely (in
touch, finishing surface and appearance) natural marble products. Cheaper than those
made with natural marble, synthetic marble products made up with PC have the
additional advantages of being corrosion and chemical resistant.
ii) Façade panels and tiles
Façade panels, window sills and tiles are another well-known application of PC materials.
Their low water absorption, excellent durability, impact and abrasion resistance, make
them very suitable for this kind of application. Additionally, due to their great capacity to
texture and color, exterior appearances of stone, granite, shale or wood are easily
obtained in these products (Kaeding and Prusinsky 2001), allying aesthetic requirements
to a strong, light and durable material, with the benefit of saving natural resources.
iii) Drainage and channeling systems
Precast components for drainage systems are another successful and widely spread
application of PC materials.
PC drainage systems, which include gutters, sewer pipes, manholes, equipment vaults and
drain channels, are commonly found both outdoors and indoors, in transportation
infrastructures (driveways, highways and airports), sportive facilities (e.g. football
stadiums, motorways, swimming pools and running tracks), industrial and chemical
plants, bottling and food processing industries, parking garages, service stations and
docks.
High resistance to aggressive solutions and froze attack, excellent axial and compressive
strengths, great impermeability, rapid drainage due to an extremely low roughness factor,
easy handling and self cleaning process, reduced weight, low installation and
maintenance costs, are some of the advantages of PC drain systems over those made with
conventional concrete, PVC or steel (Bloomfield 1995).
iv) Tanks and hazardous waste containments
As a closed cell and high corrosion resistant material, PC reveled to be the ideal choice
for the manufacturing of acids tanks and hazardous waste containments. PC has also been
applied as conditioning and storage tanks in the bottling and food processing industry.

II. POLYMERS IN CONCRETE REVIEW
II-46
The hermetic nature and easy cleaning of PC surfaces hinders the appearance and
growing of fungus and other microorganisms.
v) Components for transportation infrastructure
Products for the transportation industry continue to grow and the applications in this field
still have a great potential to explore. The high strength, durability, impact resistance and
damping make PC an ideal material for precast tunnel liners, median highway barriers,
railroad sleepers, tunnel sidewall panels, bridge pilings and parapet protective panels
(Fontana and Bartholomew 1981).
These precast PC products further offer low installation costs, less downtime and traffic
disruption and reduced labor costs.
vi) Utility boxes and underground enclosures
Utility boxes such as electrical, telephone and traffic signal bases made up with PC
materials are already available in the market (Perry 1981). Precast PC traffic signal bases
eliminate forming and pouring, are lightweight for easier handling and lower installed
cost. PC bases or pads are also used under electrical transformers and telephone cabinets
to add stability, prevent corrosion of metal cabinets, and to protect them from damage
caused by mowing equipment. Further, these precast units can be re-used in other
locations (excavation and installation of entire unit can be done in one single day).
Precast PC underground enclosures for use as splice boxes, pull boxes, or equipment
enclosure for any application requiring easy access to an underground service (i.e.
electrical, water, gas, fibre optics), are also available in a large variety of sizes and styles.
No grounding is required for the box and the skid-resistant covers can fit flush with
sidewalk or grass area.
vii) Metal and porcelain replacement applications
Metal replacement is another growing application sector. The high strength-to-weight
ratio, low thermal conductivity, high damping and mouldability make PC a strong
competitor for many current applications using metals, such as machinery tool bases,
where PC has been found to be very competitive with cast iron and steel (see page II-38).
Recently, it has also been found that PMs can successfully be used to make
counterweights for shovels and forklifts in the heavy and construction industries, in place

II. POLYMERS IN CONCRETE REVIEW
II-47
of cast iron (Bhutta et al. 2000). The materials and production costs of cast iron
counterweights are quite high, and the manufacturing process may cause environmental
pollution. PMs using unsaturated polyester resin as binder, calcium carbonate filler and
waste iron (cast iron scraps proceeding from cast iron industry) as fine aggregates result
on efficient counterweights with densities up to 6.0. Good workability and sufficient
strengths are achieved at low binder contents of less than 6% (by mass), and a high waste
iron content of 80%. Furthermore, PC counterweights can easily be recycled as
aggregates for new counterweights, and materials and manufacturing process costs are
found to be inexpensive compared to those of the cast iron counterweights.
Due to their excellent insulating properties and because the processing of the composite is
carried out at room temperature, PC materials have been profited for the manufacturing
of post insulators in a very competitive basis with traditionally used materials such as
porcelains or ceramics. In the US, PC post insulators are now in routine use in outdoor
applications at voltages up to and including 138 kV. There is, in fact, interest in
developing PC station post insulators for uses at 230 kV, especially in seismic regions,
where porcelain insulators have behaved very badly in recent major earthquakes
(Gunasekarane and Duguid 1992).
viii) Complex architectural forms
Complex architectural shapes are commonly made with PC materials, taking advantage
of their ability to mold, texture and color. Examples include complex façade elements,
domes, column covers, statuary, fountains and urban furniture, such as garden seats,
ashier, dustbins, and lamp poles.
A larger number of other precast PC products, with innovative end-uses, have been
designed and commercialized in the last decades. Many of them are still under
development. Some examples include: components for the animal feeding industry,
nonconductive support structures for electrical equipment, foundation ventilation
systems, truncated dome tactile floor tiles for step-safe projectile impact ballistic panels,
infrastructures for wind power turbines, stair treads and large scale pre-insulated wall
panels for segmental building construction.
II. POLYMERS IN CONCRETE REVIEW
II-48
2.2.5.2 PC overlays and protective coatings
PCs have been extensively used for bridge decks, road surfacing and floor overlays where
a high corrosion and/or abrasion resistance is required, such as, parking garages, chemical
plants, food processing industry and other industries where corrosive and strong wear
conditions are encountered.
PC overlays can provide a durable and wear-resistant surface for portland cement
concrete. In addition, the overlays may be formulated to provide low permeability to
water and chloride ions, and thus also helps to prevent deterioration and spalling of the
concrete due to freeze-thaw cycles and corrosion of reinforcing steel. Surface texture of a
PC overlay for highway applications can be made to provide a suitable skid-resistant
surface and hydroplaning characteristics that are within the required limits. Other
advantages of PC overlays include the ability to use thin layers, fast curing, excellent
bond strength to concrete and high flexural strength.
Typical applications of PC overlays and coatings are described in Table 2.5.
Table 2.5. Typical applications of PC overlays.
Function/Application End-uses
Floorings and pavements Floors for houses, warehouses, schools, hospitals, offices, shops, toilets, passages, gymnasiums, factories, industrial plants, stairs, garages, railway platforms, airport runways, etc.
Waterproofing coatings Concrete roofdecks, water tanks, septic tanks, swimming pools, silos, etc.
Decorative coatings Wall coatings, coating materials for textured finishes of buildings, surface preparation materials for coatings, etc.
Anticorrosive coatings Effluent drains, chemical or machinery plant floors, grouts for acid proof tiles, floors for chemical laboratories and pharmaceutical warehouses, hot spring baths, rustproof coatings for steel roofs decks, etc.
Deck coverings Bridge decks, internal and external ship decks, footbridge decks, train and subway floors, etc.
2.2.5.3 PC for repair and rehabilitation purposes
Nowadays, concrete polymer composites are mostly used not for build up, but for rebuild
or repair, and PC materials have their share on that. Its rapid curing, excellent bond to

II. POLYMERS IN CONCRETE REVIEW
II-49
concrete and steel reinforcement, and excellent strength and durability make it a very
attractive repair material (Czarnecki et al. 1999). Surface repair, partial depth repair, full
depth or structural repair, and strengthening are typical examples of application. Thus, it
is not surprising that among eight existing models applicable to modeling concrete repair
(Vaysburd et al. 2000), two of them have been developed by polymer people: Fowler et
al. and Czarnecki et al..
i) Concrete pavements and overlays
The fact that PCs cure very rapidly make them of interest in repairs to existing facilities
where downtime must be held to a minimum, such as bridge decks, roadways, highways,
and airport runways. Since the curing reaction is most of the times exothermic, the heat
produced speeds the cure. Additionally, the low-temperature curability of some PC
materials, specially those based on acrylic resins, enables that repair works could be made
under cold weather conditions (McBee et al. 1986).
For repair of concrete pavements and airport runways, mechanized trains for repair
systems have been developed which can prepare the damaged area, batch, place and
finish the repair materials in the most economical and fast manner (Marsh et al. 1985).
Bridge decks repairs present, in particular, special problems not associated with other
types of repairs. The vibration of bridge decks makes initial concrete applications more
heterogeneous and therefore, the constant bending movement frequently creates concrete
delaminations. While a variety of fast setting and durable repair products is available on
the market, PC patching materials, due to their rapid transition from a liquid to a gel state,
are not only rapid setting and high strength, but also the materials most insensitive to
traffic vibrations (Dinitz and Ferri 1985).
ii) Concrete structures
Because the rapid deterioration of reinforced concrete structures has become a serious
problem in recent years, a strong interest has focused on PCs as repair patching material,
and there is a growing demand for them. These CPC materials are currently becoming
low-cost, promising materials for preventing chloride-induced corrosion and repairing
damaged reinforced concrete structures. After removal of the deteriorated concrete and
cleaning of the reinforcing steel, the cement concrete is replaced with a suitable PC or
PM. Not only the original load carrying capacity is re-established, but also any further

II. POLYMERS IN CONCRETE REVIEW
II-50
corrosion activity is stopped in the repaired section. Usually, premixed systems are used
for this purpose, but recently, some investigation works have been done concerning the
use of preplaced graded aggregates with the injection of the monomer or resin system
(Murray 2004), eliminating the batching of aggregates and resins.
PMs have also been used as sealer crack in concrete. While plain polymers, such as
epoxy and high molecular weight methacrylate (HMWM), are usually applied (injected
or sprayed on) to fill the cracks with reduced surface widths, PMs are rather used for
sealing larger width cracks (Fowler 1999).
Rehabilitation of deteriorated concrete structures is also possible by means of precast PC
products (Barnaby and Dikeou 1984):
• PC bridge parapet panels can encapsulate existing deteriorated concrete structures
prolonging the service life of these aged facilities at a fraction of the cost of
remove/replace options;
• Thin corrosion-resistant PC pile jackets and panels, installed above the high water and
below the low water level, stop the deterioration of conventional concrete structures
exposed to sea or river water environments, enabling them to withstand the combined
effects of ice flows, corrosive solutions, debris and other environmental hazards;
• PC highway median barriers allow the rehabilitation of deteriorated barriers without
costly demolition, thereby eliminating roadway downtime and traffic disruption. The
lightweight shell barriers are installed, and then filled with conventional concrete.
These barriers, behind the greater resistance to weathering, are quicker and easier to
install than cast-in-place concrete barriers;
• PC cladding panels provide a long-lasting and cost-effective solution for bench walls
in highway tunnels requiring rehabilitation due to environmental conditions, exposure
to de-icing salts and vehicular impacts;
• PC shells for repairing equipment bases are a very cost-effective option. Equipment
can be removed, the base cleaned, the precast shell placed over the base, and the void
filled with a PC grout, resulting in a fast repair which minimizes the down time of the
equipment.

II. POLYMERS IN CONCRETE REVIEW
II-51
iii) Wood structures
In recent years, it has been shown that PC materials can be used to repair and strengthen
deteriorated or broken wooden beams and construction elements (Van Gemert et al.
1998). Repair is accomplished by replacement of deteriorated parts by a PM prosthesis.
The decayed part is removed by sawing or cutting. A casing is then installed which
reconstitutes the original shape of the wooden element. If the reconstruction has to meet
aesthetic requirements, as in the case of heritage or historic buildings, the casing should
be made out of the same wood as the original beam, and it will be kept in place to cover
the prosthesis of PM. The connection between the original wood and the prosthesis is
assured by means of anchoring bars (steel rods or FRP rods).
PM repair of wooden beams is often called polymeric restoration of timber beams. This
technique has been further developed for the strengthening of broken beams, were
bending as well as shear forces are presented. The technique is often combined with
externally bonded steel plates or FRP laminates, glued on the wooden beams (Ignoul et
al. 2000).
2.2.5.4 Waste recycling, encapsulation and storage
PC materials are very attractive under an ecological and safety point of view because of
their ability for using recycled waste products. This feature of polymer composites has
been developed mainly through two different approaches. Firstly, by the use of
unsaturated polyester resins from recycled poly(ethyleneterephthalate), usually known by
PET, and secondly, by the incorporation of industrial by-products and wastes as fillers or
aggregates.
i) Waste recycling for PC binder
As the high cost of the polymers is usually considered the main factor limiting the growth
of PCs, unsaturated polyesters based on recycled PET might be a potentially lower source
cost of resins for producing useful PC based products (Abdel-Azim and Attia 1995;
Rebeiz and Fowler 1996; Soh et al. 1995). PET wastes are typically found in plastic
beverage bottles; thus, a large waste stream of PET is available for recycling applications.
A main advantage of recycling PET in PC is that the PET waste does not have to be
purified, including removal of colors, to the extent that other PET recycling applications

II. POLYMERS IN CONCRETE REVIEW
II-52
might require, which minimizes recycling process cost. The recycling of PET in PC
applications also helps in saving energy.
ii) Waste recycling for PC aggregates
The growing awareness of environmental impact of both industrial waste disposal and
exhaustion of natural resources, also led that a large number and variety of industrial
wastes was attempted to be incorporated into PC materials as aggregates. Most of the
successful applications reported, involved either industrial by-products or end-life
products.
In the early ‘70s, Steinberg already reported the development of a polymer composite
material that (re)used paper waste (1975). Flat paper newsprint soaked in a liquid resin
and polymerized in situ under pressure, result on a polymer composite with high
compressive strength (50 MPa) and outstanding flexural strength (52 MPa). Inexplicably,
no posterior references were found regarding the development and/or application of this
new material, called at the time paper polymer composite (PPC) or paper plywood (due to
its very good tensile strength along the plane of the paper). The development of this
‘polymer-paper concrete’ as replacement for plywood forms should be reconsidered from
the viewpoint of the preservation of forest resources.
Since then, industrial wastes, such as fly ash, slag, wood ships, cork powder and cork
granulates, tire rubber, plastic ships from used polyethylene (PE) and polyvinyl chloride
(PVC) films, plastic granulates coming from milled waste electrical cables and FRP
powders proceeding from waste FRP products, have been successfully used for replacing
or partially substituting the filler and aggregate components in PC materials (Bignozzi et
al. 2000; Bignozzi et al. 2002; Nóvoa et al. 2005; Nóvoa et al. 2004; Ohama and
Yamashita 1984; Rebeiz et al. 2004; Rebeiz et al. 1994; Ribeiro et al. 2003; Ribeiro et al.
2004; Sandrolini et al. 1993; Saurina et al. 1996).
Fine glass fillers, obtained by vitrification of bottom ashes collected from incineration of
urban solid wastes or derived from glassy and ceramic waste fractions, have also been
used to produce glass fibres for PM reinforcement (Bignozzi et al. 2004).
Development work on these PCs based on recycled waste aggregates or reinforcements,
will lead to the conversion of an ecological problem into a positive asset in the form of
II. POLYMERS IN CONCRETE REVIEW
II-53
commercially valuable construction materials. This is of great importance in the recycling
and reuse of man’s solid waste.
iii) Hazardous waste encapsulation or storage
Due to hermetic nature of polymer matrix, PC materials have also been used to
encapsulate waste hazardous products, such as crushed waste glass, contaminated silica
sands proceeding from foundry industry, and geothermal waste with heavy metals
(Bignozzi et al. 2004; Fontana 1991; Fowler 1994; Sousa et al. 2004).
Non-returnable glass bottles have been crushed, and the mixed particulate glass has been
filled with a monomer system in a manner similar to that for PC. Resultant glass-polymer
composites (GPC) present a relative high compressive strength and are highly resistant to
attack by corrosion media. One application of this material is for sewer pipes, especially
for acid wastes or under aerobic conditions when the hydrogen sulfide gas coming from
sewage is oxidized to sulfuric acid.
Moulds made out of silica sands, with a high-grade of silica bind with phenolic resins, are
widely used in foundry casting industry. The high melting point of crystalline silica and
the high heat resistance of phenol based binder, enable castings to be produced by
pouring molten metal into moulds made out of these two components. Disposal of these
moulds has been of great concern due to potential risk of environment contamination by
phenolic resins. Recently, it has been shown that phenolic foundry sands can be used as
aggregates in epoxy PC materials with considerable advantages over those made up with
virgin foundry sands.
PC also shows potential for immobilizing radioactive waste from the nuclear power
industry for long-term engineered storage. A major problem facing the exponentially
growing nuclear power industry is the safe disposal of fission product wastes. A
technically and economically reasonable approach is immobilizing fissionable and fission
products into long-term durable materials in an engineered storage system. The wastes
must be stored for 1000 years before they can be considered biologically safe. PC, with
additional durability and strength, appears to be an attractive material for this purpose. In
particular, PCs containing polystyrene are especially radiation resistant (Steinberg 1975).
However, much more will have to be learned before PC can be confidently recommended
as a material that wills last one thousand years ore more.

II. POLYMERS IN CONCRETE REVIEW
II-54
Bibliography
Abdel-Azim, A. A., and Attia, I. A. (1995). "Making polymer concrete and polymer mortar using synthesized unsaturated polyester resins from poly(ethyleneterephthalate) waste." Polymer for Advanced Technologies, 6, 688-697.
ACI. (1973). Polymers in Concrete, SP-40, American Concrete Institute, Detroit, Michigan.
ACI. (1978). Polymers in Concrete, International Symposium, SP-58, American Concrete Institute, Detroit, Michigan.
ACI. (1981). Applications of Polymer Concrete, SP-69, American Concrete Institute, Detroit, Michigan.
ACI. (1985). Polymer Concrete: Uses, Materials and Properties, SP-89, American Concrete Institute, Detroit, Michigan.
ACI. (1987). Polymer Modified Concrete, SP-99, American Concrete Institute, Detroit, Michigan.
ACI. (1989). Polymer Concrete: Advances and Applications, SP-116, American Concrete Institute, Detroit, Michigan.
ACI. (1993a). Polymer Concrete, SP-137, American Concrete Institute, Detroit Michigan.
ACI. (1993b). "Use of Epoxy Compounds with Concrete." Report of ACI Committee 503R-93, American Concrete Institute, 1993, Detroit, Michigan.
ACI. (1997). "Guide for the Use of Polymers in Concrete ", Report of ACI Committee 548.1R-97, American Concrete Institute, 1997, Detroit, Michigan.
ACI. (2003). Polymers in Concrete: The First Thirty Years, SP-214, American Concrete Institute, Detroit, Michigan.
ACS. (1979). Plastics, Mortars, Sealants and Caulking Compounds, American Chemical Society, Series 113, Washington D.C.

II. POLYMERS IN CONCRETE REVIEW
II-55
Anon. (1959). Dow Latex 560 for Portland Cement Compositions, Dow Chemical Co., Midland, Michigan.
Anon. (1964). Rhoplex MC-4530, Cement Mortar Modifier, Rohm & Hass Co., Philadelphia.
Ates, E. (1994). "Using epoxy resin concrete on manufacturing machine tools beds," Ph.D. Thesis, Balikesir University, Balikesir.
Baekeland, L. (1909). "Condensation product and method of making same (Bakelite)." United States Patent, 0942809, Dec 7, US.
Barnaby, D., and Dikeou, J. (1984). "Applications of permanent precast polymer concrete forms for concrete rehabilitation." Transportation Research Report, No. 1003, 46-49.
Bhutta, M. A. R., Narisawa, B., Maeda, N., and Ohama, Y. "Polymer mortars counterweights." Third Asia Symposium on Polymers in Concrete, 2000, Shangai, China, 402-407.
Bignozzi, M. C., Saccani, A., and Sandrolini, F. (2000). "New polymer mortars containing polymeric wastes. Part1: Microstructure and mechanical properties." Composites: Part A, 31(2000), 97-106.
Bignozzi, M. C., Saccani, A., and Sandrolini, F. (2002). "New polymer mortars containing polymeric wastes. Part 2. Dynamic mechanical and dieletric behaviour." Composites: Part A, 33(2002), 205-211.
Bignozzi, M. C., Saccani, A., and Sandrolini, F. "Glass waste valorization in advanced composite materials." 11th Congress on Polymers in Concrete, 2004, Berlin, Germany, 587-596.
Blaga, A. (1974a). "Thermoplastics." Institute for Research in Construction, Canadian Buiding Digest, CBD-158, www.irc.nrc-cnrc.gc.ca,.
Blaga, A. (1974b). "Thermosetting Plastics." Institute for Research in Construction, Canadian Buiding Digest, CBD-159, www.irc.nrc-cnrc.gc.ca,.
Blaga, A., and Beaudoin, J. J. (1985). "Polymer Concrete." Institute for Research in Construction Publications, Canadian Buiding Digest, CBD-242, www.irc.nrc-cnrc.gc.ca.

II. POLYMERS IN CONCRETE REVIEW
II-56
Bloomfield, T. D. (1995). "Sewers and manholes with polymer concrete." NO-DIG Engineering, 2(2).
Brockenbrough, T. W., and Atterson, D. N. (1982). "Fiber-reinforced-Methyacrylate Polymer Concrete." ACI Journal, 79, 322-325.
CEN-EC2. (1992). "Eurocode 2: Design for Concrete Structures." European Committee for Standardization.
Chandra, S., and Ohama, Y. (1994). "Historical background of the use of natural polymers." Polymers in Concrete, CRC Press, Boca Raton, USA.
Cooke, G. B. (1941). Department of Commerce, United States Patent 2, 227, 553, Jan. 7, US.
Crawford, R. J. (1990). Plastics Engineering, Pergamon Press, Oxford, UK.
Cresson, L. (1923). "Improved manufacture of rubber road-facing, rubber-flooring or other rubber-linning." British Patent 191, 474, 12 Jan. UK.
Crow, L. J., and Bates, R. C. (1970). "Strength of sulphur-basalt concretes." Int. Rep. Nº 7349, Bureau of Mines.
Czarnecki, L. "Polymers in concrete on the edge of the millennium." 10th Int. Congress on Polymers in Concrete - ICPIC 01, 2001, Honolulu, Hawai.
Czarnecki, L., Garbacz, A., Lukowski, P., and Clifton, J. R. (1999). "Polymer Composites for Repairing of Portland Cement Concrete: Compatibility Project." -NISTIR 6394- Warsaw University of Technology, Building and Fire Research Laboratory, Warsaw, Gaithersburg.
Dale, J. M., and Ludwing, A. C. (1966). "Feasibility study for using sulphur-aggregate mixtures as a structural material." Tec. Rep. Nº AFWL-TR-68-21, Southwest Research Institute, San Antonio, Texas.
Dale, J. M., and Ludwing, A. C. (1968). "Advanced studies of the sulphur-aggregate mixtures as a structural material." Tec. Rep. Nº AFWL-TR-68-21, Sulphur Research Institute, San Antonio, Texas.
Demura, K., Bhutta, M. A. R., and Ohama, Y. (1993). "Strength Properties of Commercial Polymer Concretes." Journal of the College of Engineering of Nihon University, Series A-34, 103-108.

II. POLYMERS IN CONCRETE REVIEW
II-57
Dharmarajan, N. (1987). "Flexural creep behavior of polymer concrete systems," Ph.D. Thesis, Rice University, Houston.
Dikeou, J. "Polymers in concrete: new construction achievements on the horizon." 2nd International Congress on Polymers in Concrete, Detroit, U.S.A., 1-8.
Dinitz, A. M., and Ferri, R. (1985). "Polymer concrete (MMA) for bridge rehabilitation applications." Polymer Concrete: Uses, Materials and Properties, SP-89, J. Dikeou and D. W. Fowler, eds., American Concrete Institute, Detroit, Michigan, 141-160.
Ferreira, A. J. M., Fernandes, A. A., Meyer, F., San José, J. T., Letsch, R. H., Neumann, B., Izurieta, M., Sheard, P., Carneiro, A., and Mauro, G. "On an European project on polymer concrete and non-metallic reinforcements." Int. Conference on Polymer Concretes, Mortars and Asphalts, 2002, Porto, Portugal, 191-222.
Filho, R. D. T., Ghavami, K., England, G. L., and Scrivener, K. (2003). "Development of vegetable fibre-mortar composites of improved durability." Cement & Concrete Composites, 25(2003), 185-196.
Fontana, J. J. (1991). "Development of UP concrete products with crushed waste glass as aggregate." ICPIC Working Papers, North American Workshop on Polymers in Concrete, American Concrete Institute, Detroit.
Fontana, J. J., and Bartholomew, J. (1981). "Use of Concrete Polymer Materials in the Transportation Industry." Applications of Polymer Concrete, SP-69, American Concrete Institute, Detroit, Michigan, 21-30.
Fowler, D. W. "Encapsulation of geothermal waste with heavy metals by UP concrete." 1st East Asia Symposium on Polymers in Concrete, 1994, Chuncheon, Korea, 3-9.
Fowler, D. W. (1999). "Polymers in Concrete: a vision for the 21st century." Cement & Concrete Composites, 21(1999), 449-452.
Fowler, D. W. "Polymers in Concrete: where have we been and where are we going?" 10th Int. Congress on Polymers in Concrete - ICPIC 2001, 2001, Honolulu, Hawai.
Fowler, D. W., Choi, D. U., Zalatimo, J., and Wheat, D. L. "Stresses in PC overlays due to thermal changes." 10th Int. Congress on Polymers in Concrete - ICPIC 2001, 2001, Honolulu, Hawaii.

II. POLYMERS IN CONCRETE REVIEW
II-58
Fowler, D. W., Meyer, A. H., and Paul, D. R. (1981). "Techniques to improve strength of polymer concrete made with wet aggregates." Applications of Polymer Concrete, SP-69, American Concrete Institute, Detroit, Michigan, 107-122.
Fowler, D. W., and Paul, D. R. "Status of Concrete-Polymer Composites in The United States." 3th Internatinal Congress on Polymer in Concrete, 1981, Koryama, Japan.
Gálan, C. M. (2001). "Caracterización de un mortero polimérico con resina de poliéster insaturado y árido de albero para su aplicación en construcción," Ph.D. Thesis, Universidad de Sevilla, Sevilla.
Geist, J. M., Amagna, S. V., and Mellor, B. B. (1953). "Improved Portland Cement Mortars with Polyvinyl Acetate Emulsions." Industry and Engineering Chemicals, 45(4), 759-767.
Griffiths, R., and Ball, A. (2000). "An assessment of the properties and degradation behaviour of glass-fibre-reinforced polyester polymer concrete." Composite Science and Technology, 60, 2747-2753.
Gunasekarane, M. (1977). "Development of polymer bonded silica (Polysil) for electical applications." Final Report EPRI EL-488, Electrical Power Research Institute, Palo Alto.
Gunasekarane, M., and Duguid, T. P. "Polymer concrete high voltage insulation in the U.K." International Symposium on Electrical Insulation, 1992, Baltimore, USA, 229-232.
Hsu, H. T. (1984). "Flexural behavior of polymer concrete beams (fatigue, creep)," Ph.D. Thesis, University of Texas, Austin.
Hsu, M., and Fowler, D. W. (1985). "Creep and Fatigue of Polymer Concrete." Polymer Concrete: Uses, Materials, and Properties, SP-89, J. Dikeou and D. W. Fowler, eds., American Concrete Institute, Detroit, Michigan, 323-341.
Hu, H., and Sun, C. T. (2000). "The characterization of physical aging in polymeric composites." Composite Science and Technology, 60(2000), 2693-2698.
Ignoul, S., Van Gemert, D., and Van Meer, H. "Restrengthening of te 17th Century Abbey Barn 'Tiendenschuur' at Herckenrode, Belgium." Int. Workshop on Urbain Heritage and Building Maintenance, 2000, Zurich, Switzerland, 123-130.

II. POLYMERS IN CONCRETE REVIEW
II-59
Jaenicke, J., Knoop, H., and Schweitzer, O. (1943). United States Patent 2, 311, 233, Feb. 16, US.
Kaeding, A. O., and Prusinsky, R. C. "Curtain wall panels." 10th International Congress on Polymers in Concrete, 2001,Honolulu, Hawai.
Karademir, S. (1997). "Investigation of damping of polymer concrete on the manufacturing machine tool beds," Ph.D. Thesis, Osmangazi University, Osmangazi.
Kardon, J. B. (1997). "Polymer-Modified Concrete: Review." Journal of Materials in Civil Engineering, 9(2), 85-92.
Katz, D. A. (1998). "Polymers." www.chymist.com.
Kawakami, M., Tokushige, H., Matsuoka, S., Morohashi, T., and Okamoto, T. "Physical and mechanical properties of ultra-lightweight polymer concrete." 10th Int. Congress on Polymers in Concrete - ICPIC 2001, 2001, Honolulu, Hawai.
Kwak, K. H., and Kim, J. J. (1995). "Fatigue strength in polymer-reinforced concrete beams under cyclic loading." Nuclear Engineering and Design, 156(1995), 63-73.
Larena, A., Alonso, J. V., and Bernabeu, J. "Materiales compuestos de matriz organica y arcillas expandidas." Materiales Compuestos en Arquitectura y Construcción - ARQUIMACOM'96, 1996, Sevilla, Spain, 59-62.
Lee, H. S., Lee, H., Moon, J. S., and Jung, H. W. (1998). "Development of Tire-Added Latex Concrete." ACI Materials Journal, 95(4), 356-364.
Lefebure, V. (1924). "Improvements in or relating to concrete, cements, plasters and the like." British Patent 217, 279, UK.
Lundin, T., Cramer, S. M., Falk, R. H., and Felton, C. (2004). "Accelerated weathering of natural fiber-filled polyethylene composites." Journal of Materials in Civil Engineering, 16(6), 547-555.
Marsh, D., Simonsen, W. J., and Fowler, D. W. (1985). "Machine application of polymer concrete for highway repairs." Polymer Concrete: Uses, Materials and Properties, SP-89, J. Dikeou and D. W. Fowler, eds., American Concrete Institute, Detroit, Michigan, 1-17.
II. POLYMERS IN CONCRETE REVIEW
II-60
McBee, W. C., and Sullivan, T. A. (1982). "Concrete formulations comprising polymeric reaction products of sulphur/cyclopentadiene, olygomer/digyclopentadiene." US Department of Commerce, US Patent 4, 348, 313, Sept. 7, US.
McBee, W. C., Sullivan, T. A., Fike, H. F., Slama, W., Walters, J. M., and Stumpo, A. J. (1986). "Polymer Concretes." Corrosion and Chemical Resistant Masonry Materials Handbook, W. L. J. Sheppard, ed., William Andrew Publishing, Noyes, 392-438.
McBee, W. C., Sullivan, T. A., and Jong, B. W. (1981). "Modified sulphur cements for use in concretes, flexible pavings, coatings and grouts." Int. Rep. Nº8547, Bureau of Mines.
Mebarkia, S. A. (1993). "Mechanical and fracture properties of high strength polymer concrete under various loading conditions and corrosive environments," Ph.D. Thesis, University of Houston, Houston.
Mendis, P. (1983). "Commercial Applications and Property Requirements for Epoxies in Construction." Polymer Concrete: Uses, Materials and Properties, SP-89, J. Dikeou and D. W. Fowler, eds., American Concrete Institute, Detroit, Michigan, 127-140.
Monteiro, D. F. (2005). "Comportamento à fractura e à fluência de betões poliméricos," Ph.D. Thesis, Faculty of Engineering of Porto, Porto (in portuguese).
Murdock, J. W., and Kesler, C. E. (1958). "Effect of range of stress on fatigue strength of plain concrete beams." ACI Journal, 55, 221-231.
Murray, M. "Beam repair with preplaced aggregate epoxy concrete." 11th Congress on Polymers in Concrete, 2004, Berlin, Germany, 345-348.
Muthukumar, M., and Mohan, D. (2005). "Studies on furan polymer concrete." Journal of Polymer Research, 12(2005), 231-241.
Neelamegan, M., and Parameswaran, V. S. "Impact and abrasion resistance of glass fiber reinforced resin mortar composites." 7th International Congress on Polymers in Concrete, 1992, Moscow, Russia.
Neville, A. M. (1995). Properties of Concrete, Pearson Education Limited, Harlow.
Nóvoa, P. J. R. O., Ribeiro, M. C. S., and Ferreira, A. J. M. "Development of lightweight polymer mortars based on binary aggregate compositions." 3rd International Conference on Composites in Construction - CCC2005, Lyon, France.
II. POLYMERS IN CONCRETE REVIEW
II-61
Nóvoa, P. R. O., Ribeiro, M. C. S., Ferreira, A. J. M., and Marques, A. T. (2004). "Mechanical characterization of lightweight polymer mortar modified with cork granulates." Composite Science and Technology, 64(2004), 2197-2205.
Ohama, Y. "Development of concrete-polymer materials in Japan." 2nd International Congress on Polymers in Concrete, Detroit, U.S.A., 121-137.
Ohama, Y. (1997). "Recent Progress in Concrete-Polymer Composites." Advanced Cement Based Materials, 5(1997), 31-40.
Ohama, Y., and Komiyama, M. "Early strength and length change of polyester resin concrete with shrinkage-reducing agent." 22nd Japan Congress on Materials Research, 1979, Kyoto, Japan, 356-359.
Ohama, Y., and Nishimura, T. "Properties of steel-reinforced concrete." 22nd Congress on Materials Research, Society of Material Science, Tokio, 364-367.
Ohama, Y., and Ramachandran, V. S. (1995). "Polymer-Modified Mortars and Concretes." Concrete Admixtures Handboock - Properties, Science and Technology, V. S. Ramachandran, ed., William Andrew Publishing, Noyes, 558-656.
Ohama, Y., and Sugahara, T. "Impact resistance of steel fiber reinforced polymer concretes." 24th Japan Congress on Materials Research, 1981, Kyoto, Japan, 254-257.
Ohama, Y., and Yamashita, H. "Strength properties of polyester resin concrete with waste plastics." 27th Japan Congress on Materials Research, 1984, Kyoto, Japan.
Orak, S. (2000). "Investigation of vibration damping on polymer concrete with polyester resin." Cement and Concrete Research, 30(2000), 171-174.
Perry, E. R. (1981). "Polymer concretes and the Electric Power Industry." Applications of Polymer Concrete, SP-69, American Concrete Institute, Detroit, Michigam, 63-72.
Peschke, H. J. "18 years experience with polymers in concrete in Europe." 2nd International Congress on Polymers in Concrete, Austin, U.S.A., 75-102.
Popovics, S. (1993). "Principles of epoxy modification of portland cement concrete." Polymer Concrete, D. W. Fowler, ed., American Concrete Institute (ACI SP-137), Detroit, 73-92.

II. POLYMERS IN CONCRETE REVIEW
II-62
Potapov, Y., Borisov, Y., Panfilov, D., Figovsky, O., and Beilin, D. (2004). "Research of polymer concrete based on low molecular polybutadiene. Part VII:Strength of continuosily reinforced polymer concrete with various kinds of fibres." Scientific Israel - Technological Advantage, 6(3-4), 71-74.
Prusinsky, R. C. "Study of commercial development in precast polymer concrete." Polymers in Concrete International Symposium, SP-58, American Concrete Institute, Detroit, U.S.A., 75-102.
Rebeiz, K. S., and Fowler, D. W. (1996). "Flexural strength of reinforced polymer concrete made with recycled plastic waste." ACI Structural Journal, 93(5), 524-530.
Rebeiz, K. S., Serhal, S. P., and Craft, A. P. (2004). "Properties of polymer concrete using fly ash." Journal of Materials in Civil Engineering, 16(1), 15-19.
Rebeiz, K. S., Serhal, S. P., and Fowler, D. W. (1993). "Recommended design procedure in shear for steel-reinforced polymer concrete." ACI Structural Journal, September-October( 1993), 562-567.
Rebeiz, K. S., Yang, S., and Fowler, D. W. (1994). "PM and PC using FRP powders manufactured from waste FRP products." ACI Materials Journal, 91, 313-319.
Reis, J. M. L. (2003). "Fracture mechanisms of polymer concrete," Ph.D. Thesis, Deparyment of Mechanical Engineering and Industrial Management, Faculty of Engineering, University of Porto, Porto.
Ribeiro, M. C. S., Nóvoa, P. R. O., Ferreira, A. J. M., and Marques, A. T. "Mechanical behavior of polymer concrete modified with light organic aggregates." 2nd Int. Conference on Eco-Composites, 2003, London, UK.
Ribeiro, M. C. S., Nóvoa, P. R. O., Marques, A. T., and Ferreira, A. J. M. (2004). "Mechanical Characterization of Lightweight Wood-Modified Polymer Concrete." Ciência & Tecnologia dos Materiais, Revista da SPM (Sociedade Portuguesa dos Materiais), 16(2-3), 81-87.
San José, J. T. (1996). "Hormigon polimero estructural y decorativo. Aplicacion a composites para la construcion," Ph.D. Thesis, Universidad del Pais Vasco, Bilbao.
San José, J. T., and Ramírez, J. L. "FRP bars in the bending behavior of the polymer concrete." Integrity, Reliability and Failure: An International Conference, 1999, Porto, Portugal.
II. POLYMERS IN CONCRETE REVIEW
II-63
San José, J. T., Ramirez, J. L., and Maribona, R. "Polymer reinforced concrete: Calculation procedure in bending." 9th International Congress on Polymers in Concrete - ICPIC'98, 1998, Bologna, Italy.
San José, J. T., Vegas, I., and Ramírez, J. L. (2003). "Static and dynamic behaviour between rebars and polymer concrete." Journal of Polymer Engineering, 23(5), 315-336.
Sandrolini, F., Bonora, V., Saccani, A., Dinelli, G., and Belz, G. "Pulverized fly ash recycling in composite materials for innovative building elements." 1st Conference on Chemistry and Process Engineering, 1993, Florence, Italy, 703.
Saurina, J., Arnau, J., Carrasco, F., Blavia, J., Pagès, P., Melchor, V., and Berlanga, R. "Reutización de virutas de madera como carga para la fabricación de un compuesto de matriz polimérica." Materiales Compuestos en Arquitectura y Construcción - ARQUIMACOM'96, 1996, Sevilla, Spain, 245-256.
Sheppard, W. L. (1975). "Sulphur mortars: A historical survey." Sulphur Institute Journal, 11(3-4), 15-17.
Soh, Y. S., Park, H. S., and Lee, D. S. "Mechanical properties of polymer mortar made from recycled PET-based unsaturated polyester resins." International RILEM Workshop, 1995, Tokyo,China, 61.
Sousa, M., Reis, J. M. L., and Ferreira, A. J. M. "Fracture mechanisms of polymer concrete made with recycled aggregates." 9th Portuguese Conference on Fracture, 2004.
Steinberg, M. (1975). "Concrete-Polymer Composite Materials and Their Potential for Construction, Urban Waste Utilization, and Nuclear Waste Storage." Copolymers, Polyblends, and Composites, Norbert A.J. Platzer, eds., Advances in Chemistry Series 142, Washington, D.C.
Su, Z. (1995). Microstructure of polymer-cement concrete, Delft University Press, Delft, The Netherlands.
Sullivan, T. A. (1982). Corrosion-resistant sulphur concretes. Design Manual, The Sulphur Institute, Washington D.C.
Tavares, C. M. L., Ribeiro, M. C. S., Ferreira, A. J. M., and Guedes, R. M. (2002a). "Creep behaviour of FRP-reinforced polymer concrete." Composite Structures, 57(1-4), 47-51.

II. POLYMERS IN CONCRETE REVIEW
II-64
Tavares, C. M. L., Ribeiro, M. C. S., Ferreira, A. J. M., and Marques, A. T. "Flexural analysis of polymer concrete beams reinforced with steel and pultruded rebars." 10th European Conference on Composite Materials - ECCM10, 2002, Bruges, Belgium.
Tavares, C. M. L., Ribeiro, M. C. S., Monteiro, D., Camanho, P. P., and Ferreira, A. J. M. "Experimental investigation into the static and fatigue behaviour of polymer concrete reinforced with GFRP rods." Int. Conference on Composites in Construction - CCC01, 2001, Porto, Portugal, 329-334.
Tyler, O. Z., and Drake, R. S. (1961). "Superior Strength Properties with Polymer-Modified Portland Cements." Adhesives Age, 4(9), 30-39.
USBR. (2006). "Concrete-Polymer Materials." U.S. Bureau of Reclamation, U.S. Army Corps of Engineers, Engineer Reserch and Development Center, www.wes.army.mil/SL/TREAT_ISL/Programs/ConcretePolymerMaterials3.html.
Van Gemert, D. "Research and development in design and application of concrete-polymer composites in Europe." 4th Asia Symposium on Polymers in Concrete, 2003, Chunchon, Italy.
Van Gemert, D., Herroelen, B., Shueremans, L., and Dereymaeker, J. "Strengthening of wooden structural elements by means of polymer concrete." 9th Int. Congress on Polymers in Concrete - ICPIC'98, 1998, Bologna, Italy.
Van Gemert, D., and Knapen, E. "Cement concrete and concrete-polymer composites: two merging worlds. A report from 11th ICPIC Congress in Berlin, 2004." International Symposium on Polymer in Concrete, 2006, Guimarães, Portugal, 1-12.
Vaysburd, A. M., Carino, N. J., and Bissonette, B. (2000). "Predicting the performance of concrete repair materials." -NISTIR 6402- Warsaw University of Technology, Building and Fire Research Laboratory, Warsaw, Gaithersburg.
Vidaurre, V., Dufeu, J., and Bendek, W. "Void and gas occlusion free dielectric polymeric composite materials and cost effective manufacturing processes for production of high reliability electric insulators." 9th International Congress on Polymers in Concrete, Bologna, Italy, 139-149.
Vipulanandan, C., Dharmarajan, N., and Ching, E. (1988). "Mechanical behavior of polymer concrete systems." Material and Structures, 21, 268-277.

II. POLYMERS IN CONCRETE REVIEW
II-65
Wang, Y. Y. "Research and application of polymer concrete in China." 3rd International Congress on Polymers in Concrete, Koryama, Japan.
Yao, W., and Li, Z. (2003). "Flexural behavior of bamboo-fiber-reinforced mortar laminates." Cement and Concrete Research, 33(2003), 15-19.

II. POLYMERS IN CONCRETE REVIEW
II-66

III-1
III. POLYMER MORTAR FORMULATIONS OPTIMIZATION PROCESS 3.1 Introduction
3.1.1 General
The first objective of this thesis was to develop an optimal polymer concrete formulation,
in order to maximize certain desirable properties of resultant composite.
Due to a potential large number of variables or factors involved in an experimental
program, the beginning can be troublesome. The complexity of products and processes
involved are barriers that not easier the use of a generalized experimentation. Engineering
intuition is usually insufficient in the design of polymer concrete and mortars because of
complex mechanism of the forming of concrete properties (Piasta and Czarnecki 1988).
Polymer concrete materials cannot be regarded as a simple mixture, which is just a
combination of ingredients with properties that are a result only of the simple summation
of properties of the components. These materials are instead a ‘composite’, a solid
material system consisting of two or more phases with macroscopically distinguishable
boundaries among phases, which has properties not attainable by a single component, or
by a simple summation of the properties of the components (Czarnecki et al. 1999). In
particular, polymer concrete composite materials can be regarded as a triphasic system
consisting of a dispersed phase, the aggregates, a continuous phase formed by a monomer
system and a certain percentage of porosity imposed either by aggregate size grading or
by manufacturing process. The properties of this composite will be given not only by the

III. POLYMER MORTAR FORMULATIONS
III-2
properties of each of the components, as a function of their weight percentage, but also by
interface surface phenomena. Changing the type or the amount of each component,
different types of polymer concrete and features, with distinct properties, can be created.
The question that remains is how to find the most cost-effective way for optimizing
suitable polymer concrete formulations.
Optimising overall properties with respect to component properties and proportions is
included in the definition of a composite. However, the problem of optimisation is
complex because a number of mechanisms in the generation and application of polymer
composites can act synergistically, both negatively and positively. Any optimisation
process must therefore handle these synergisms quantitatively (Czarnecki et al. 1999).
On the other hand, before going through with any optimization process, it will be
necessary to define what properties or attributes should be optimized in the final
composite product, which are directly related with specific material requirements
imposed by its final application or end-use. The idea is to develop a ‘tailor-made’
material for each application.
3.1.2 Material Design Methodologies:
Significant Applications to Polymer Concrete Materials
Several methods have been proposed in the past to model product design process based
either on the description of a sequence of activities or on systematic procedures that
attempt to propose a more adequate set of activities. It is not the aim of this chapter thesis
to review the different methods used in practice, however the exposition of some of these
methods is necessary to understand the choice for the material design methodology used
in this work.
Cross (1996) proposed an integrated systematic approach based on rational methods that
cover the whole design process, from problem analysis and conceptual design to
detailing. The methodology proposed, illustrated in Table 3.1, involve seven steps in the
design process, each applying a widely used rational method.

III. POLYMER MORTAR FORMULATIONS
III-3
Table 3.1. Stages in the design process - Cross methodology -.
Stage Relevant Design Method
1. Clarifying Objectives
Objectives Tree Aim: To clarify design objectives and sub-objectives, and the
relationships between them.
2. Establishing Functions
Function Analysis Aim: To establish the functions required, and the system boundary, of
a new design.
3. Setting Requirements
Performance Specification Aim: To make an accurate specification of the performance required of
a design solution.
4. Determining Characteristics
Quality Functional Deployment Aim: To set targets to be achieved for the engineering characteristics of
a product, such they satisfy customer requirements.
5. Generating Alternatives
Morphological Chart Aim: To generate the complete range of alternative design solutions for
a product. Search for potential new solutions.
6. Evaluating Alternatives
Weighted Objectives Aim: To compare the utility values of alternative design proposals, on
the basis of performance against differentially weighted objectives.
7. Improving Details
Value Engineering Aim: To increase or maintain the value of a product to its purchaser
whilst reducing its cost to its producer.
The first sets of activities proposed by this method are especially useful to define which
properties and attributes of the final product should be enhanced. Although devised
primarily for product development an attempt was made to apply this methodology,
which integrates Quality Function Deployment (QFD) principles, to the design of a new
material.
Fernandes et al (1998) illustrated the application of this methodology for material design,
in the case of development of a polymer concrete material. It was concluded that
chemical and corrosion resistance, as well as compressive strength should be optimized,

III. POLYMER MORTAR FORMULATIONS
III-4
as those represent the most significant material properties. These attributes received the
importance levels of 4.75 and 4.50, respectively, in a scale of 1 to 5. Other properties,
such as tensile and flexural strength, cost effectiveness, water absorption and dimensional
stability, also received a good score (between 4.00 and 4.25).
Once defined the specific material requirements that should be met by a polymer
concrete, and correspondent desired properties that should be enhanced in the design
process, an efficient statistical method for the experimental design and optimisation of
final product must be defined. The main advantage of using statistically designed
experiments is the minimization of the number of the tests necessary to obtain the desired
information on a material. With statistical methods it is possible to significantly decrease
the number of tests compared to traditional methods, as well to shorten the experimental
period (Cornell 1981). The results are also more amenable to statistical analysis and the
error of the estimates obtained from fitting the test results may be decreased over other
methods (Piasta 1978).
There are many experimental designs that can be applied on the planning of experiments,
such as simplex, factorial and rotatable (Box and Draper 1987).
The rotatable experimental design is based on regression analysis, making possible the
formulation of mathematical models and evaluation of their precision. This experimental
design enables a mathematical description of an object of unknown characteristics to be
determined based on the testing of the values of the input and output parameters.
Szarnecki applied the rotatable experimental design to optimise polymer concrete
formulations. Since the latest ‘80s, Szarnecki and co-workers have been involved with
research studies concerning material optimisation of polymer concretes by statistical
methods (Czarnecki 1984; Czarnecki and Weiss 1988; Van Gemert et al. 1985). The
basic idea of these studies is that every application requires specific material properties
that can be produced by controlling the material structure. This investigation culminated
with a three-year project entitled ‘Polymer Concrete Composite’, carried out
collaboratively by the National Institute of Standards and Technology (NIST) and the
Institute of Technology and Organization of Building Production (Czarnecki et al. 1999).
The main objective of this project was the development of a statistical method for the
material design and optimisation of polymer concrete. Material models for various

III. POLYMER MORTAR FORMULATIONS
III-5
polymer concrete materials were developed as the basis of the optimisation process, and
were formulated in terms of quadratic functions that fit in a regression process to
experimental data measured according to a statistical design. An overall desirability
function was then applied as the metric for the multi-criteria optimisation of polymer
concrete. The aim was to produce a PC material that had a certain desired property, which
could be obtained without sacrificing other properties of importance. That is why the
multi-criteria nature of the optimisation was important, as no variable property was to be
optimised without taking into consideration the other variable properties (Czarnecki et al.
1999).
The effect of material heterogeneity on final properties of polymer concretes was
determined considering the following experimental variables:
Type of mineral aggregate;
Maximum size of aggregate;
Type of resin;
and Curing method.
Three categories of properties were assessed:
Physical property: density;
Mechanical properties: compressive strength, flexural strength, and elasticity
modulus;
Processing parameters: linear shrinkage on curing.
Optimal results for various polymer concrete formulations were determined, analyzed
both analytically and graphically, and compared with experimental results. The following
three cases were considered: the use of silica fume in polyester concrete, the production
of an expensive highly-filled polyester concrete that did not sacrifice important technical
properties, and the production of an epoxy concrete with low flammability but good
mechanical properties. The reliability of the proposed method was demonstrated for all
polyester and epoxy concrete formulations. The usefulness of the method for product
development and identification of the effects of major variables on performance was
demonstrated.
Taguchi (1986) used a different experimental design, based on complete factorials, for
the planning of experiments . Since the last years of 1940, this research engineer has been

III. POLYMER MORTAR FORMULATIONS
III-6
involved in the improvement of product quality and industrial processes of his country,
the Japan. He developed a new philosophy or methodology, which aims on the
improvement of the quality itself. This methodology, known by ‘Taguchi Method’,
depends strongly on statistical concepts and techniques, and is especially related with
statistical planning of experiences (Coimbra 1988; Fernandes et al. 1998).
The use of complete factorial in the planning of experiences consists in testing all
possible combinations between the different values (levels) adopted by the major
variables (factors), in an organized way. ‘Traditionally, engineers tend to change only
one variable of an experiment at a time. The strength of Taguchi technique is that the
engineer can change many variables at the same time and still retain control of the
experiment’ (Ashley 1992). This technique allows the assessing of the influence of each
factor on the global response (target characteristic), as well as the identification of
interactions between them. The effect of each factor is determined by taking into account
all different levels adopted by the other major factors.
The following notation is normally used to describe this type of plans:
LF = C (3.1)
where L is the number of levels adopted by each factor; F is the number of factors; and C
is the number of possible combinations.
The planning of experience is expressed through a complete factorial array, which
presents the same number of rows as the number of possible combinations. The number
of columns is equal to the number of factors plus the number of all possible interactions
between factors.
The main drawback of this type of plans arises from the high number of tests that are
necessary to the accomplishment of the method. The number of tests increases, in
geometric progression, with the number of variables or factors in study. The experimental
program becomes almost unpractical with more than four factors or with more than two
levels. For instance, an experimental program considering 4 major factors with 3
variations levels will lead to 34 different combinations, i.e., 81 different tests to perform.
An experimental plan with the same advantages than those brought by the complete
factorial, but with a significant reduction of number of experiences, was the major
contribution of Taguchi method to Quality Engineering (Coimbra 1988). Taguchi found

III. POLYMER MORTAR FORMULATIONS
III-7
that some columns of the complete factorial orthogonal array, those correspondents to
interaction effects with minor value, could be used in a more efficient way to study the
principal effects of additional factors.
This technique, explained in detail in several publications (Coimbra 1988; Figueiredo and
Fernandes 1996; Taguchi 1986), allows a reduction of the number of test combinations
through a library of pre-set orthogonal arrays, which can be applied in many experimental
situations without loss of relevant information. A Taguchi orthogonal array is composed
by several combinations of levels of factors in such way that any pair of columns obeys
to the orthogonal conditions. The usual notation is as follows:
L a (bc) (3.2)
where a is the number of tests to perform (or combinations of levels); b is the number of
levels for each factor; and c is the number of columns (to attribute to factors or
interactions).
The analysis of variance – ANOVA – is used by Taguchi to analyze the data obtained by
the orthogonal arrays. ANOVA allows the testing of the significance of the effects
relatively to random error (usually called by ‘noise’, e.g., variability in the environmental
conditions, variability in the components or raw materials, variability during the
manufacturing process, measuring errors, uncontrollable factors, etc.).
Taguchi method has proven to give good results in practice and many companies in the
worldwide, especially in the U.S.A., have successfully applied it for product design and
processes in the last years (ASI 2000).
Recently, Ferreira et al. (2000) showed that Taguchi techniques can also be applied in the
experimental design of a polymer concrete material. Unfortunately, in their experimental
work some parameters were not accurately controlled. Manual mix process of concrete
mixtures and the use of deformable molds, conducted to a large variation in the quality of
concrete specimens, which made difficult to obtain reliable conclusions. Nevertheless the
inconclusive results, it was demonstrated that Taguchi techniques could be applied with
success to the design of this particular material.
For this reason and due to its simplicity of application and its comprehensive set of
design decision-making tools, this methodology was also chosen in this thesis for the
experimental design and optimization process of polymer concrete materials.
III. POLYMER MORTAR FORMULATIONS
III-8
3.2 Experimental Program
3.2.1 Material’s Design
The aim of this first part of the present thesis was to develop and optimize a polymer
concrete material that presented certain improved properties according to its future
application. The objective was to determine an optimal PC formulation suitable either for
precasting of structural members (GFRP-polymer concrete hybrid beams), or as a matrix
of a lightweight structural concrete (Polymer concrete modified by light aggregates).
The first step consisted in defining the property or properties that should be optimized in
the final composite, which are related with the specific material requirements imposed by
the future application as a construction material.
Once defined the property that should be optimized, the response characteristic, a
Taguchi experimental planning can be implemented.
3.2.1.1 Definition of property to be optimized
Some results of previous research carried out by Fernandes et al. (1998) showed that the
most desirable properties of a PC construction material, those that should be optimized in
design stage, were chemical and corrosion resistance, and compressive strength. Behind
those, other properties such as tensile and flexural strengths, low permeability,
dimensional stability and cost effectiveness, were also considered as important attributes.
However, if it is intended to apply the Taguchi method in the experimental design, one
single property to optimize must be chosen.
The above study was conducted considering PC as a new alternative material to cement
concrete, for certain applications. The idea was that an improved chemical resistance and
compressive strength, relatively to conventional concrete, would turn this new material
more competitive in the construction market.
However, the bibliography review conducted in chapter II, shows that PCs present
generally, as function of polymer binder, better chemical resistance than Portland cement

III. POLYMER MORTAR FORMULATIONS
III-9
concretes (Chawalwala 1996; Fowler 1999; Mebarkia and Vipulanandan 1995; Ohama et
al. 1886). Therefore, this attribute, brought by resin matrix, is already present.
Nevertheless, a special care should be put in the choice of resin binders, if it is intended
to improve this property.
On the other hand, although being unquestionable that compressive strength is one of the
most important mechanical properties of a concrete material, it’s the flexural strength that
better define the mechanical characteristics of a PC (San José 1996).
In conventional cement concretes, there is a straightforward correlation between
mechanical properties such as compressive, flexural and tensile strengths. Empirical
relationships are given on almost of the concrete design codes (CEB/FIP 1990; CEN-EC2
1992) and their use is a common practice in design. As compressive tests are relatively
easier to perform and very simple in procedure, compressive strength became the first
element of control to normal cement concretes. Its value defines the resistance class of
the concrete, and all the other mechanical properties are given as function of this one.
In the case of PCs, it is no possible to establish such relationships. Generally, a PC with a
compressive strength higher than other one also possesses higher flexural strength.
However, different kinds of PC manufactured with distinct resins may have similar
compressive strengths and exhibit very distinct magnitudes of flexural strengths.
Therefore, flexural resistance represents a stronger parameter in the assessment of PC
quality, allowing a more clear differentiation in terms of mechanical strength. Therefore,
this mechanical property will be the material characteristic chosen to be improved in
design process.
The other attributes, such as good dimensional stability and cost effectiveness, can be
taken into account in the selection process of polymeric resins to use in the experimental
program. Low shrinkage and good relationship between cost and mechanical performance
will also take part in the selection criteria of resin binder.
3.2.1.2 Planning of experiments
The planning of the various mixtures to test was achieved through a Taguchi
methodology. With this technique, a detailed analysis of the effect of several materials
factors on a specified property of mix formulations can be obtained. As stated earlier, this

III. POLYMER MORTAR FORMULATIONS
III-10
method presents the great advantage of reducing the mixture combinations, which
represents a considerable saving in time and costs. To perform all possible mixture
combinations would not be practical due to the potential high number of parameters
involved.
Taguchi experimental planning was accomplished by following the sequential steps:
i. Selection of major factors and interactions to study;
ii. Selection of the levels’ values adopted by the material factors;
iii. Selection of the most convenient Taguchi orthogonal array;
iv. Attribution of the major factors and/or interactions to the columns of the
orthogonal array.
After these fundamental steps, specimen’s manufacture, experimental tests and analysis
of obtained data can be performed.
i) Selection of major factors and interactions;
In order to minimize the initial dimension of experimental plan, the use of many factors
and few levels is advised. This first experimental planning will allow reducing the
number of factors to the most important ones, which could be later investigated with
several levels, without producing an excessive dimension of experimental plan.
The following material factors or variables were considered:
Resin type (A);
Charge content in resin (B);
Resin content (C);
Sand type (D);
and Curing method (E).
In a Taguchi experimental plan, the reduction of the number of tests is made by re-using
some columns related to interactions of the factorial array. This ‘confuses’ the original
plan with new factors, meaning that is not possible to separate the principal effect of a
new factor and the effect of the interaction that column represents.
There is some discussion between the classic statistics and Taguchi. The later supports
the use of saturated arrays (all columns of the factorial are used to study factors), while
the classics advise not to ignore the interaction between two factors, supporting the use of
III. POLYMER MORTAR FORMULATIONS
III-11
fractioned factorials (only the columns correspondents to interactions between more than
two factors are used for the study of new factors) (Coimbra 1988).
In order not to ‘mask’ in excess the plan and reduce its ‘confusion’, all interactions
between any two factors were considered. Only the interactions between more than two
factors were ignored. Thus, the effects of the following ten interactions were investigated:
“Resin type * Charge content” (A*B);
“Resin type * Resin content” (A*C);
“Resin type * Sand type” (A*D);
“Resin type * Curing method” (A*E);
“Charge content * Resin content” (B*C);
“Charge content * Sand type” (B*D);
“Charge content * Curing method” (B*E);
“Resin content * Sand type” (C*D);
“Resin content * Curing method” (C*E);
and “Sand type * Curing method” (D*E).
i) Selection of the variation levels;
For each material factor, two variation levels were established. The selection criteria used
for the variation levels of each factor are explained in what follows.
Resin Type: An epoxy and an unsaturated polyester thermoset resins were chosen for
variation levels of the first factor. The choice for these two types of resin was not
arbitrary. As mentioned in chapter II, epoxy resins generally lead to better mechanical
properties in the final product, whereas polyester resins usually present a good
relationship between price and performance. The specific resins of epoxy and polyester
were chosen among the available commercial resins in the local industrial market. The
main selection parameters were: ability to cure at room temperature and to incorporate
charges, low viscosity, reduced shrinkage, and good relationship between price and
mechanical properties.
Sand Type: For the aggregates, two types of sand with different size grading were chosen:
clean river sand and foundry sand. ‘Clean’ sand is a well-graded sand but with low
content of fines, while foundry sand presents rather a fine uniform grade size. In general,
III. POLYMER MORTAR FORMULATIONS
III-12
the aggregates grading should provide a material having the lowest possible surface area
and void content per unit volume, thus requiring the lowest possible binder content to
achieve the desired workability, strength and other concrete properties (Smith and Collis
1999). In general continuously graded aggregates tend to provide relatively
straightforward and easy-to-place concretes, whereas gap-graded concretes usually
require appreciably more expertise in mix design, production, handling and placing
(Schaffler 1979; Shacklock 1959).
Since no coarse aggregates were used in mix formulations, polymer mortar term would
be a more proper designation for resultant materials. However, it was decided to maintain
the generic term of polymer concrete, as this is the global designation of this class of
materials. The option do not include coarse aggregates was determined by the means and
equipment available at INEGI lab that did not allow the production and testing of PC
specimens with large size aggregates.
Resin Content: The design of concrete mixes is normally based on the premise that the
voids in the bulk volume of aggregates, generally between 25% up to 40%, should be
filled with binder (Smith and Collis 1999). As mentioned by Beningfield (1980), the
inability to fill the voids completely does not necessarily result in failure, but surely
increases the probability of trouble arising, as unfilled voids are potential initiators of
cracks.
In order to determine the variations levels for resin content, two prismatic moulds were
filled with the two types of sand considered in this study. The moulds were placed in a
vibrator table in order to reach the maximum of packing. After that, an alcohol was shed
into the molds. The volume contents of alcohol, necessary to fill the voids between
particles sand, in each mold, gave an orientation for the resin contents to use as variation
levels. Volume contents of 27% and 33% were found, respectively, for the clean and
foundry sands, which correspond to mass percentages of resin around 17% and 20%. In
order to simplify calculation process, the same specific gravity was considered for both
resins.
Charge content: The contents of 0% and 25% were chosen as variations levels for charge
content in resin. These percentages are related to resin mass. There was no prior
experimental study that conducted to these values, but previous studies on PC carried out

III. POLYMER MORTAR FORMULATIONS
III-13
by Ohama et al. (1981) suggest values around 0 to 60%, according to the size distribution
of aggregates. Due to the mean diameter and the maximum aggregate size of both sands,
the inclusion of filler with contents higher than 25% led to poor workability even for
resin contents of 20%. Therefore, 25% filler content was chosen for superior level of
charge content.
Curing Cycle: Two alternative curing methods were considered: seven days at room
temperature or three hours at 80ºC after 1 day at room temperature. In general, depending
on the type of resin matrix and environment temperature, polymer concrete and mortars
reach their maximum strength at seven days after casting process. Thermal treatments are
normally used to accelerate the cure process and/or to improve mechanical strengths of
composite materials. The temperature at which the thermal treatment must be done and
conditioning period are function of resin type and specimen size.
The variation levels for each considered material factor are summarized in Table 3.2.
Table 3.2. Factors and levels considered in mix formulations.
Factors
A- Resin Type
B- Charge Content
C- Resin Content
D- Sand Type
E- Curing Cycle
Level 1 Polyester 0% 17% Clean 3 hours at 80ºC
Level 2 Epoxy 25% 20% Foundry 7 days at 23ºC
iii) Selection of Taguchi orthogonal array;
The selection of Taguchi orthogonal array depends on the number of levels adopted by
each factor and the total number of freedom degrees needed to lodge all the factors and
interactions considered. The selected orthogonal array should have a number of
freedom’s degrees larger, or equal, than the total number of degrees of freedom requested
by the factors and/or interactions in study. The total number of freedom’s degrees of an
experimental plan (orthogonal array), is equal to the sum of freedom’s degrees of each
column, and equivalent to the number of tests less one. If the column represents a factor,
its degree of freedom is equal to the number of levels adopted by that factor less one. If
the column represents an interaction instead, its degree of freedom is obtained by

III. POLYMER MORTAR FORMULATIONS
III-14
multiplying the freedom’s degrees of the factors involved in that interaction (Coimbra
1988).
In this case, as it is pretend to investigate the effect of five factors with two levels, and
ten interactions, an orthogonal array with at least fifteen degrees of freedom is required.
A Taguchi orthogonal array L16 (215) fulfills this requisite.
This orthogonal array, illustrated in Fig. 3.3, can lodge up to fifteen factors, each one
with two levels. Fifteen columns and sixteen rows compose L16 (215). Each column is
coded with 1’s and 2’s, representing the levels, and each row corresponds to a specific
combination of levels determining a test to perform. This array is similar to the complete
factorial 2 4.
Table 3.3. Taguchi orthogonal array L 16 (215) (Taguchi 1986).
Col. No. 1 2 3 4 5 6 7 8 9 10 11 12 13 14 15
1 1 1 1 1 1 1 1 1 1 1 1 1 1 1 1 2 1 1 1 1 1 1 1 2 2 2 2 2 2 2 2 3 1 1 1 2 2 2 2 1 1 1 1 2 2 2 2 4 1 1 1 2 2 2 2 2 2 2 2 1 1 1 1 5 1 2 2 1 1 2 2 1 1 2 2 1 1 2 2 6 1 2 2 1 1 2 2 2 2 1 1 2 2 1 1 7 1 2 2 2 2 1 1 1 1 2 2 2 2 1 1 8 1 2 2 2 2 1 1 2 2 1 1 1 1 2 2 9 2 1 2 1 2 1 2 1 2 1 2 1 2 1 2
10 2 1 2 1 2 1 2 2 1 2 1 2 1 2 1 11 2 1 2 2 1 2 1 1 2 1 2 2 1 2 1 12 2 1 2 2 1 2 1 2 1 2 1 1 2 1 2 13 2 2 1 1 2 2 1 1 2 2 1 1 2 2 1 14 2 2 1 1 2 2 1 2 1 1 2 2 1 1 2 15 2 2 1 2 1 1 2 1 2 2 1 2 1 1 2 16 2 2 1 2 1 1 2 2 1 1 2 1 2 2 1
iv) Attribution of factors and interactions to the columns of Taguchi orthogonal array;
If it is intend not to saturate the plan, triangular tables and linear graphics are associated
jointly with Taguchi orthogonal arrays in order to select the columns to attribute to the
interactions in study. In Table 3.4 and Fig. 3.1, triangular table and linear graphics
associated to orthogonal array L 16 (215) are presented.

III. POLYMER MORTAR FORMULATIONS
III-15
Table 3.4. Triangular table associated to orthogonal array L 16 (215) Interactions between two columns.
Col. No. 1 2 3 4 5 6 7 8 9 10 11 12 13 14 15
(1) 3 2 5 4 7 6 9 8 11 10 13 12 15 14 (2) 1 6 7 4 5 10 11 8 9 14 15 12 13 (3) 7 6 5 4 11 10 9 8 15 14 13 12 (4) 1 2 3 12 13 14 15 8 9 10 11 (5) 3 2 13 12 15 14 9 8 11 10 (6) 1 14 15 12 13 10 11 8 9 (7) 15 14 13 12 11 10 9 8 (8) 1 2 3 4 5 6 7 (9) 3 2 5 4 7 6 (10) 1 6 7 4 5 (11) 7 6 5 4 (12) 1 2 3 (13) 3 2 (14) 1
Fig. 3.1. Linear graphics, associated to Taguchi orthogonal array L 16 (215), for five factors and ten interactions (Taguchi 1986)
How to use triangular tables and linear graphics?
For instance, if factor A was associated to column 1 and factor B to column 4, the
interaction between these two factors is represented by column 5 (cross-point on
triangular table between row 1 -factor A-, and column 4 -factor B-). To quantify the
1
2
3
4
5
6 7
8
9
10 11
12
13
14
15
9
10
3
12
5
6 15
8
1
2 11
4
13
14
7
5
6
3
4
1
2 7
12
9
10 15
8
13
14
11
a) b) c)

III. POLYMER MORTAR FORMULATIONS
III-16
interaction between these two factors, A and B, it will be necessary to keep column 5 free
of any association with another factor.
The information obtained by triangular tables is also available in the linear graphics.
These graphics are used so that the attribution of factors and interactions to columns of
more complexes plans becomes easier. Each factor is associated to a point in the graphic.
The point number indicates the column to attribute to that factor. The interaction between
two factors (points) is associated to the straight-line that joints their corresponding points.
The straight-line number determines the column to attribute to that interaction.
In this study, to distribute the factors and interactions by the columns of L 16 (215), the
arrangement displayed in linear graphic a), of Fig. 3.3, was used.
The final disposal of major factors and interactions by columns of orthogonal array is
showed in Table 3.5. Resultant sixteen mix formulations to test are summarized in Table
3.6.
Table 3.5. Attribution of factors and interactions to columns of L 16 (215) orthogonal array. Factors: A B C D E Interactions: A*B A*C B*C D*E A*D B*D C*E C*D B*E A*E
Col. No. 1 2 3 4 5 6 7 8 9 10 11 12 13 14 15
1 1 1 1 1 1 1 1 1 1 1 1 1 1 1 1 2 1 1 1 1 1 1 1 2 2 2 2 2 2 2 2 3 1 1 1 2 2 2 2 1 1 1 1 2 2 2 2 4 1 1 1 2 2 2 2 2 2 2 2 1 1 1 1 5 1 2 2 1 1 2 2 1 1 2 2 1 1 2 2 6 1 2 2 1 1 2 2 2 2 1 1 2 2 1 1 7 1 2 2 2 2 1 1 1 1 2 2 2 2 1 1 8 1 2 2 2 2 1 1 2 2 1 1 1 1 2 2 9 2 1 2 1 2 1 2 1 2 1 2 1 2 1 2
10 2 1 2 1 2 1 2 2 1 2 1 2 1 2 1 11 2 1 2 2 1 2 1 1 2 1 2 2 1 2 1 12 2 1 2 2 1 2 1 2 1 2 1 1 2 1 2 13 2 2 1 1 2 2 1 1 2 2 1 1 2 2 1 14 2 2 1 1 2 2 1 2 1 1 2 2 1 1 2 15 2 2 1 2 1 1 2 1 2 2 1 2 1 1 2 16 2 2 1 2 1 1 2 2 1 1 2 1 2 2 1
Once defined the mix formulations to test, the experimental part of this program, which
included the specimens manufacturing and testing, is ready to be performed.
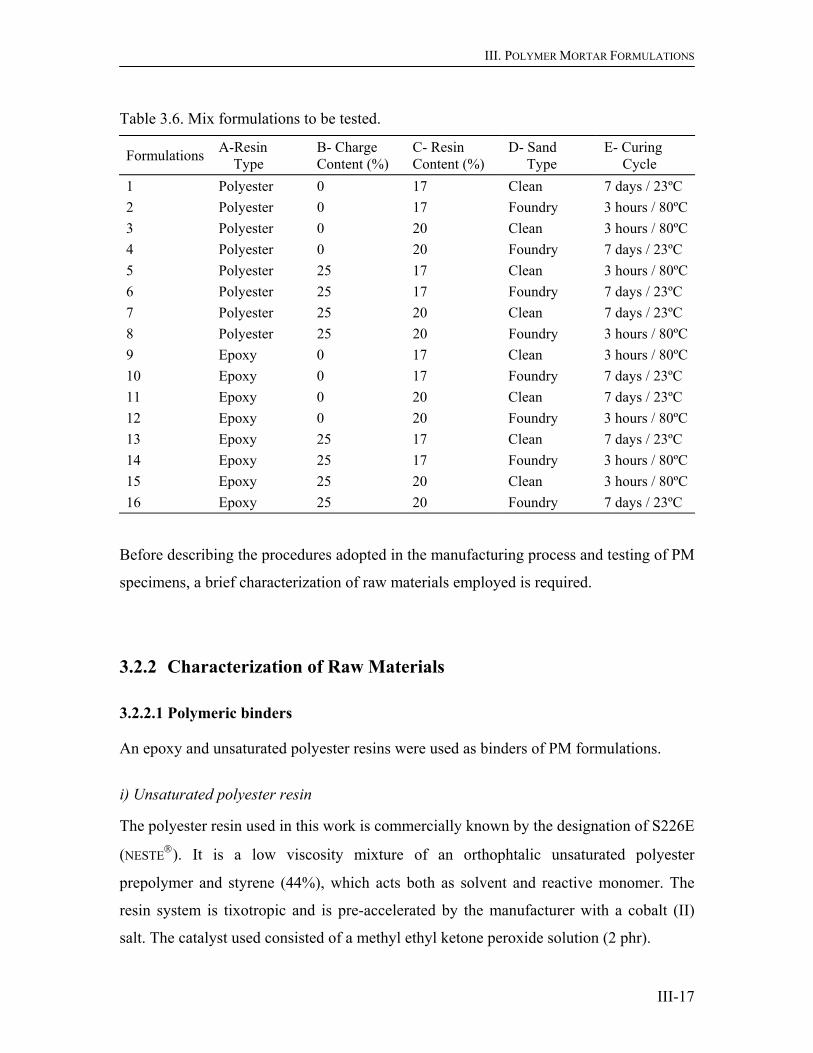
III. POLYMER MORTAR FORMULATIONS
III-17
Table 3.6. Mix formulations to be tested.
Formulations A-Resin Type
B- Charge Content (%)
C- Resin Content (%)
D- Sand Type
E- Curing Cycle
1 Polyester 0 17 Clean 7 days / 23ºC 2 Polyester 0 17 Foundry 3 hours / 80ºC3 Polyester 0 20 Clean 3 hours / 80ºC4 Polyester 0 20 Foundry 7 days / 23ºC 5 Polyester 25 17 Clean 3 hours / 80ºC6 Polyester 25 17 Foundry 7 days / 23ºC 7 Polyester 25 20 Clean 7 days / 23ºC 8 Polyester 25 20 Foundry 3 hours / 80ºC9 Epoxy 0 17 Clean 3 hours / 80ºC10 Epoxy 0 17 Foundry 7 days / 23ºC 11 Epoxy 0 20 Clean 7 days / 23ºC 12 Epoxy 0 20 Foundry 3 hours / 80ºC13 Epoxy 25 17 Clean 7 days / 23ºC 14 Epoxy 25 17 Foundry 3 hours / 80ºC15 Epoxy 25 20 Clean 3 hours / 80ºC16 Epoxy 25 20 Foundry 7 days / 23ºC
Before describing the procedures adopted in the manufacturing process and testing of PM
specimens, a brief characterization of raw materials employed is required.
3.2.2 Characterization of Raw Materials
3.2.2.1 Polymeric binders
An epoxy and unsaturated polyester resins were used as binders of PM formulations.
i) Unsaturated polyester resin
The polyester resin used in this work is commercially known by the designation of S226E
(NESTE). It is a low viscosity mixture of an orthophtalic unsaturated polyester
prepolymer and styrene (44%), which acts both as solvent and reactive monomer. The
resin system is tixotropic and is pre-accelerated by the manufacturer with a cobalt (II)
salt. The catalyst used consisted of a methyl ethyl ketone peroxide solution (2 phr).

III. POLYMER MORTAR FORMULATIONS
III-18
The S226E resin is mainly used for RTM (resin transfer moulding) systems. Its low
viscosity, low exothermic peak and good resistance to high temperatures make it suitable
for products that required a fast demoulding, a good finishing or a reduced shrinkage.
This resin allows the incorporation of charge and cures at room temperature.
In Tables 3.7 and 3.8, physical and mechanical properties of S226E polyester resin are
presented.
Table 3.7. Properties of S226E polyester resin (not-cured stage). Properties of S226E (Stage not cured)
Unity Nominal Value
Standard Method
Viscosity (23ºC) mPa.s 140 ISO 2255 Density Kg/dm3 1.08 ISO 2811 Gel time (23ºC) min. 25 Int. Method
Table 3.8. Properties of S226E polyester resin after one week at 23ºC. Properties of S226E (Stage cured)
Unity Nominal Value
Standard Method
Hardness Barcol 40-50 ASTM D 2583
Tg (Glass Transition Temp.)* ºC 87 ISO 6721-5
HDT (Heat Distortion Temp.)* ºC 50 ISO 75 Mét. A
Flexural Resistance MPa 119 ISO 178 Tensile Resistance MPa 58 ISO 527 Flexural Elasticity Modulus MPa 4100 ISO 178
* -Determined at INEGI lab.
ii) Epoxy resin
The epoxy resin used in this study is commercialised by SILICEM and is designated by
EPOSIL-551. This resin system is based on diglycidil ether of bisphenol A and an aliphatic
amine hardener and it is processed with a maximum mix ratio to the hardener of 2:1.
EPOSIL -551 presents low viscosity, good impregnation, and it cures at room temperature.
As a binder, allows the incorporation of high percentage of agglomerates, exceeding
largely the conventional systems.

III. POLYMER MORTAR FORMULATIONS
III-19
Physical and mechanical properties of EPOSIL-551 resin system are presented in Tables
3.9 and 3.10.
Table 3.9. Properties of EPOSIL-551 epoxy resin system (not-cured stage).
Properties of EPOSIL-551 (Stage not cured)
Unity Nominal Value
Standard Method
Viscosity (23ºC) mPa.s 400-600 ISO 2255 Density Kg/dm3 1.18 ISO 2811 Gel time (23ºC) min. 27 Int. Method
Table 3.10. Properties of EPOSIL-551 epoxy resin system after one week at 25ºC.
Properties of EPOSIL-551 (Stage cured)
Unity Nominal Value
Standard Method
Hardness Shore D 85 ISO 868
Tg (Glass Transition Temp.)* ºC 45 ISO 6721-5
HDT (Heat Distortion Temp.)* ºC 35 ISO 75 Mét. A
Flexural Resistance MPa 70 +/- 5 ISO 178 Tensile Resistance MPa 40 +/- 5 ISO 527 Flexural Elasticity Modulus MPa 2200 +/- 200 ISO 178
* - Determined at INEGI lab.
3.2.2.2 Sand aggregates
As the larger part of the total volume of concrete mixes is formed by the aggregate, its
characteristics have a strong influence on the performance and properties of the fresh or
hardened concretes in many ways.
The inherent properties of the sand, such as chemical inertness and durability are
important but, in particular, the shape, surface texture and grading of aggregate particles
are likely to have a major influence on the properties of the mortar or concrete mixes.
Particle shape and surface texture, whilst easily ascertained for coarse aggregates, are
more difficult to determine for finer grained particles, as it is the case of clean and
foundry sands. Microscopy study can show the particle shape but, unfortunately, the
surface texture (e.g. glassy, smooth, etc.) is not so easy to describe. For this reason, this
last parameter was not defined for both sands in this study.

III. POLYMER MORTAR FORMULATIONS
III-20
i) Clean sand
‘Clean sand’ was the designation given to certain river sand supplied by a local extractive
industry. It is well- graded sand with a continuously graded particle between 0-1.2 mm.
The chemical and physical properties of clean sand, as well as size grading, are presented
in Tables 3.11 and 3.12.
Table 3.11. Physical and chemical properties of ‘Clean sand’. Chemical properties Physical properties
Si O 2 98.0 % Bulk Density 1.52 g/cm3
Al 2 O 3 0.78 % Particle Density 2.61 g/cm3
Fe 2 O 3 0.10 % Hardness 7 mohs K 2 O 0.08 % pH 7 Na 2 O 0.02 % Average Diameter D50 800 µm Ca O 0.01 % Particle shape Roundness Mg O 0.01 %
Table 3.12. Size grading of ‘Clean sand’. Sieve size (µm) Restrained mass percentage
1200 5.5 1000 16.5 850 25.0 710 23.5 600 18.5 300 6.1 212 3.2 150 1.2 106 0.3
ii) Foundry sand
Foundry sand is a generic term to denote sand with a high-grade of silica.
Silica is hard, chemically inert and has a high melting point due to strength of inter-
atomic bonds. These are prized qualities in various industrial uses, particularly in foundry
casting. Crystalline silica has a higher melting point than iron, copper or aluminium. This
enables castings to be produced by pouring molten metal into moulds made out of silica
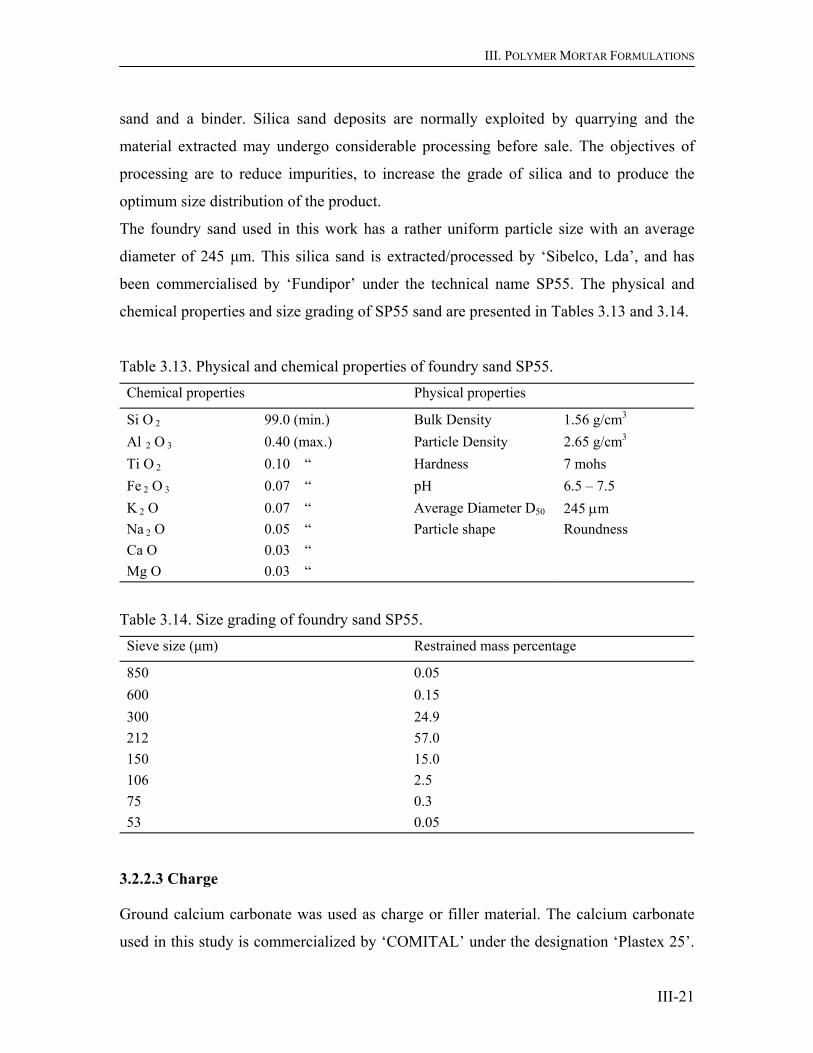
III. POLYMER MORTAR FORMULATIONS
III-21
sand and a binder. Silica sand deposits are normally exploited by quarrying and the
material extracted may undergo considerable processing before sale. The objectives of
processing are to reduce impurities, to increase the grade of silica and to produce the
optimum size distribution of the product.
The foundry sand used in this work has a rather uniform particle size with an average
diameter of 245 µm. This silica sand is extracted/processed by ‘Sibelco, Lda’, and has
been commercialised by ‘Fundipor’ under the technical name SP55. The physical and
chemical properties and size grading of SP55 sand are presented in Tables 3.13 and 3.14.
Table 3.13. Physical and chemical properties of foundry sand SP55. Chemical properties Physical properties
Si O 2 99.0 (min.) Bulk Density 1.56 g/cm3
Al 2 O 3 0.40 (max.) Particle Density 2.65 g/cm3
Ti O 2 0.10 “ Hardness 7 mohs Fe 2 O 3 0.07 “ pH 6.5 – 7.5 K 2 O 0.07 “ Average Diameter D50 245 µm Na 2 O 0.05 “ Particle shape Roundness Ca O 0.03 “ Mg O 0.03 “
Table 3.14. Size grading of foundry sand SP55. Sieve size (µm) Restrained mass percentage
850 0.05 600 0.15 300 24.9 212 57.0 150 15.0 106 2.5 75 0.3 53 0.05
3.2.2.3 Charge
Ground calcium carbonate was used as charge or filler material. The calcium carbonate
used in this study is commercialized by ‘COMITAL’ under the designation ‘Plastex 25’.

III. POLYMER MORTAR FORMULATIONS
III-22
The main characteristics of this product are very fine particle size, low abrasion and
excellent whiteness. Technical specifications are shown in Table 3.15.
Table 3.15. Physical and chemical properties of calcium carbonate Plastex 25. Chemical specifications Physical properties
Ca O 56.24 % Density 0.75 g/cm3
PF 43.32 % Abrasion 5 mg (Einiehner) Al 2 O 3 0.46 % Hardness 2.5 mohs Fe 2 O 3 0.06 % pH 9.5 Ti O 2 0.00 % Average Diameter D50 4.05 µm K 2 O 0.00 % Mass finer than 36 µm 99 % Na 2 O 0.00 % Whiteness L 95.83 a -0.21 b +4.31 Si O 2 0.00 % Volatiles 0.18 % Mg O 0.00 % Oil Absorption 19 ml / 100 g
3.2.3 Manufacturing and Casting process of PM Specimens
Mix concrete formulations were manufactured following as close as possible the
procedures described in RILEM recommendations PC-1 (1995a) and PC-2 (1995b).
3.2.3.1 Mix procedure
The mixing of each concrete formulation was accomplished according to the following
steps:
The aggregates and the charge (if the case) were previously oven dried in order to
ensure moisture contents lower than 0.1 %;
The raw materials were measured, separately, by weight and stored in suitable
containers to prevent moisture absorption and evaporation;
The liquid resin, polyester or epoxy, was poured in a container and mixed with the
initiator or the hardener. If the concrete formulation considered the incorporation of
charge, this one was added at this stage to the resin system, and the paste was
thoroughly mixed until uniform aspect;
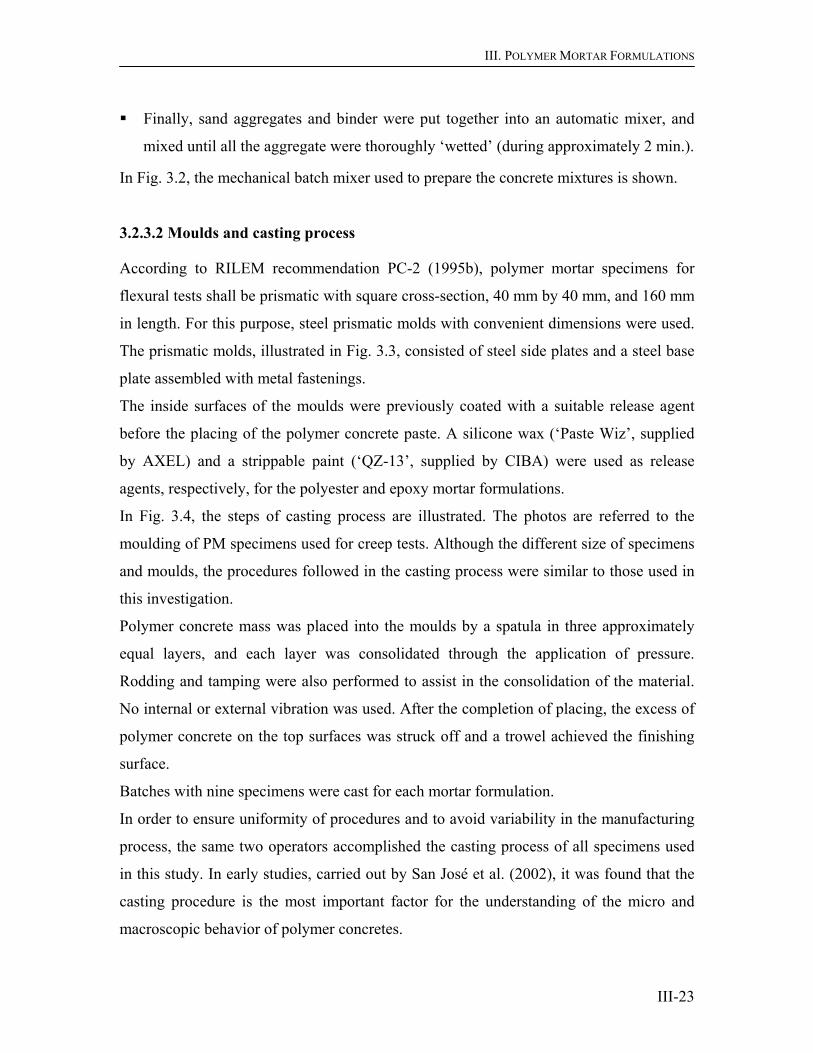
III. POLYMER MORTAR FORMULATIONS
III-23
Finally, sand aggregates and binder were put together into an automatic mixer, and
mixed until all the aggregate were thoroughly ‘wetted’ (during approximately 2 min.).
In Fig. 3.2, the mechanical batch mixer used to prepare the concrete mixtures is shown.
3.2.3.2 Moulds and casting process
According to RILEM recommendation PC-2 (1995b), polymer mortar specimens for
flexural tests shall be prismatic with square cross-section, 40 mm by 40 mm, and 160 mm
in length. For this purpose, steel prismatic molds with convenient dimensions were used.
The prismatic molds, illustrated in Fig. 3.3, consisted of steel side plates and a steel base
plate assembled with metal fastenings.
The inside surfaces of the moulds were previously coated with a suitable release agent
before the placing of the polymer concrete paste. A silicone wax (‘Paste Wiz’, supplied
by AXEL) and a strippable paint (‘QZ-13’, supplied by CIBA) were used as release
agents, respectively, for the polyester and epoxy mortar formulations.
In Fig. 3.4, the steps of casting process are illustrated. The photos are referred to the
moulding of PM specimens used for creep tests. Although the different size of specimens
and moulds, the procedures followed in the casting process were similar to those used in
this investigation.
Polymer concrete mass was placed into the moulds by a spatula in three approximately
equal layers, and each layer was consolidated through the application of pressure.
Rodding and tamping were also performed to assist in the consolidation of the material.
No internal or external vibration was used. After the completion of placing, the excess of
polymer concrete on the top surfaces was struck off and a trowel achieved the finishing
surface.
Batches with nine specimens were cast for each mortar formulation.
In order to ensure uniformity of procedures and to avoid variability in the manufacturing
process, the same two operators accomplished the casting process of all specimens used
in this study. In early studies, carried out by San José et al. (2002), it was found that the
casting procedure is the most important factor for the understanding of the micro and
macroscopic behavior of polymer concretes.
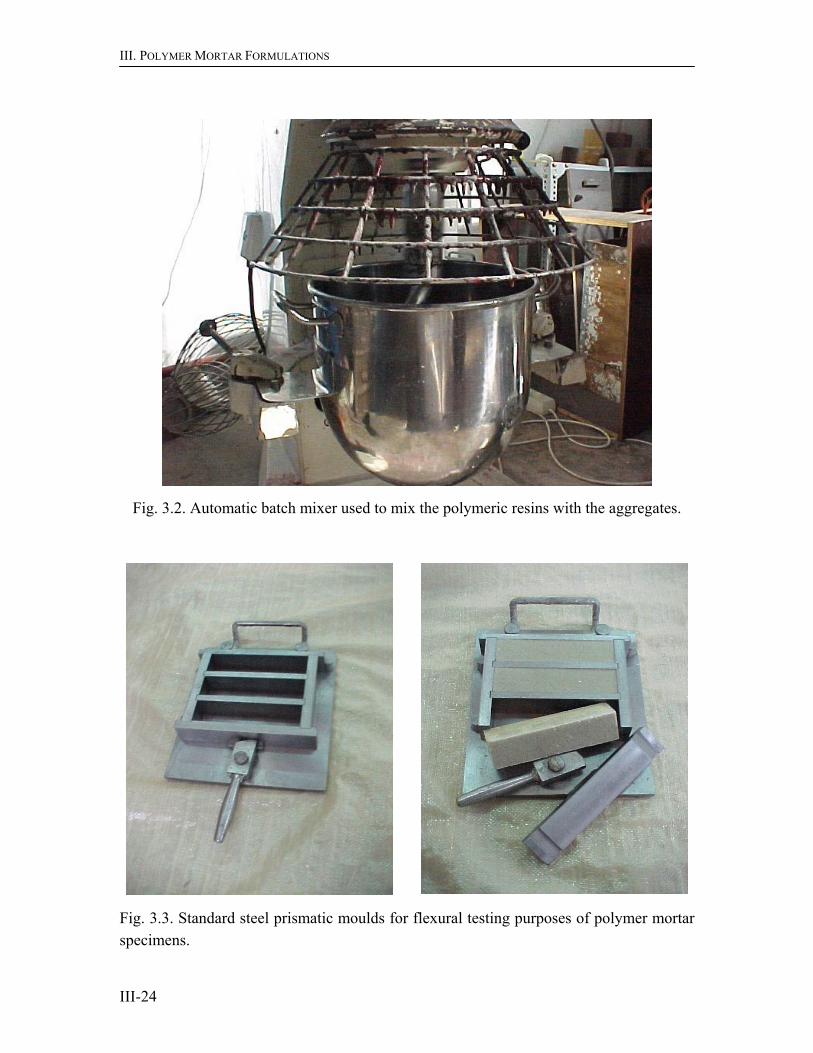
III. POLYMER MORTAR FORMULATIONS
III-24
Fig. 3.2. Automatic batch mixer used to mix the polymeric resins with the aggregates.
Fig. 3.3. Standard steel prismatic moulds for flexural testing purposes of polymer mortar specimens.
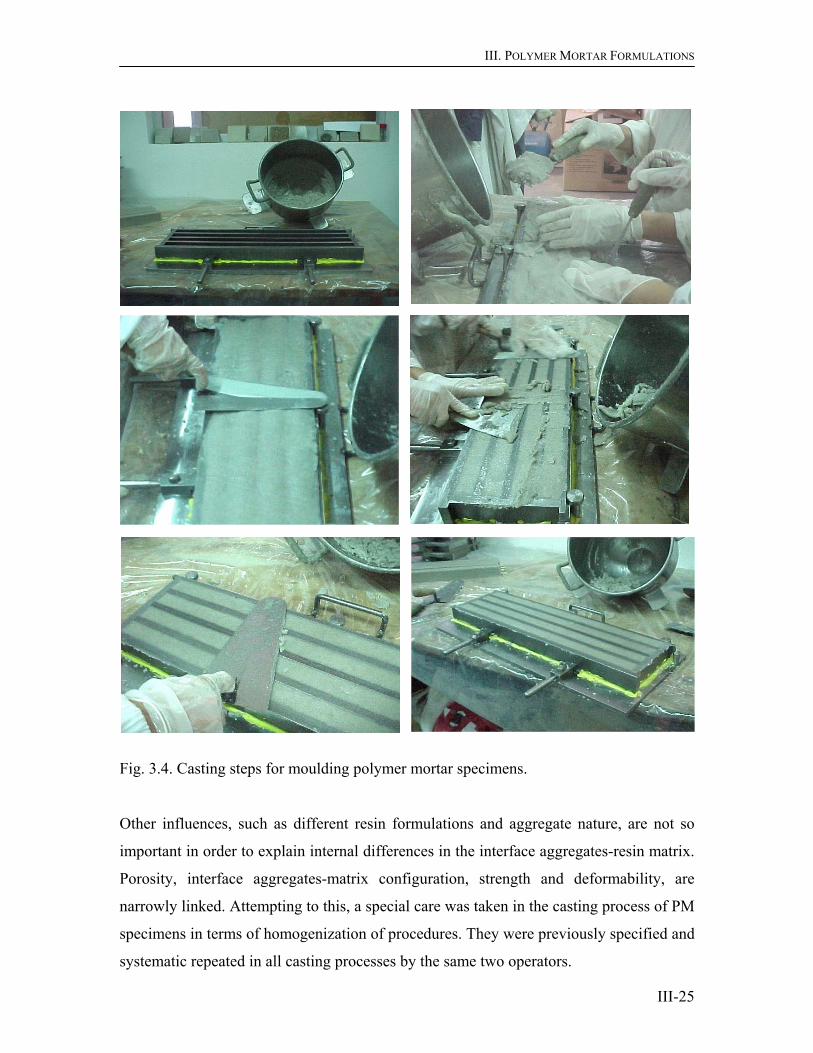
III. POLYMER MORTAR FORMULATIONS
III-25
Fig. 3.4. Casting steps for moulding polymer mortar specimens.
Other influences, such as different resin formulations and aggregate nature, are not so
important in order to explain internal differences in the interface aggregates-resin matrix.
Porosity, interface aggregates-matrix configuration, strength and deformability, are
narrowly linked. Attempting to this, a special care was taken in the casting process of PM
specimens in terms of homogenization of procedures. They were previously specified and
systematic repeated in all casting processes by the same two operators.

III. POLYMER MORTAR FORMULATIONS
III-26
3.2.3.3 Curing treatment
The specimens were allowed to cure in the moulds during 24 hours before removal. A
climatic chamber ensured a controlled environment during these first hours.
After removal from moulds, as function of PM formulation and correspondent curing
method, PM specimens were submitted to different treatments:
PM specimens, belonging to formulations nº 1, 4, 6, 7, 10, 11, 13 and 16, were stored
at room temperature in a climatic chamber during one, three and six days. Afterwards
they were tested in bending. For each conditioning period, three specimens of each
mortar formulation were tested in order to access flexural strength development with
cure time. Only the flexural test results of the specimens conditioned during seven
days after casting process were taken into account in the application of Taguchi
methodology.
The remaining PM specimens were submitted to oven post-curing treatment, at 80ºC
during 3 hours. Before being tested in bending, the specimens were allowed to cool at
least until all concrete mass had reached the room temperature. All nine specimens of
each mix formulation were tested at the same time. For the accomplishment of
Taguchi method, only three test results, randomly chosen among the nine tests
performed, were taken into account. The limitation of the number of results is
imposed by the analysis of variance (ANOVA) used for data treatment. This test is
minimally affected by violations of population normality and homogeneity of
variance so long as the samples are the equal size.
The oven and the climatic chamber used in this study (to dry the aggregates and for
specimens conditioning), are illustrated in Fig. 3.5.
3.2.4 Flexural Tests Procedure
3.2.4.1 Specimens’ preparation
All specimens were conditioned in a climatic chamber at room temperature, during at
least 3 hours, before being tested in bending.

III. POLYMER MORTAR FORMULATIONS
III-27
Fig. 3.5. Oven (at left) and climatic chamber (at right) used to dry the aggregates and for conditioning of PM specimens.
Specimens’ loading surfaces were previously sandpapered in order to obtain a desirable
and adequate contact between the loading nose and supports of loading apparatus, and the
specimen.
For effects of flexural strength calculation, width and height of middle cross section of
each specimen were measured with the accuracy of a micrometer.
3.2.4.2 Test set-up
An Instron universal testing machine, displacement control type, with a load cell of 100
kN was used to perform the flexural tests. The loading apparatus followed the RILEM
recommendation (1995c) for the three-point loading method of flexural test, with a span
length of 100 mm.

III. POLYMER MORTAR FORMULATIONS
III-28
In order to ensure a homogeneous cross section throughout the loading plan, test
specimens were placed in the loading apparatus support in such way that the casting
surface was not a loading surface.
Load was then applied at a crosshead rate of 1.0 mm.min-1 until failure occurred. An
electronic measuring device connected to the testing machine recorded load-displacement
curves and maximum load corresponding to the collapse bending moment.
Testing set-up and specimen geometry, as well as the mechanical testing machine, are
illustrated in Fig. 3.6.
Fig. 3.6. Mechanical testing machine, flexural testing set-up and specimen geometry.
100
160 40
40
30 30 [mm]

III. POLYMER MORTAR FORMULATIONS
III-29
3.3 Experimental Results and Treatment of Data
3.3.1 Flexural Tests Results
3.3.1.1 Flexural strength
Flexural strength was calculated according to the following equation:
2
32
Plfbh
σ = (3.1)
where fσ is the flexural strength (MPa); P is the maximum load recorded (N); l is the
span length (mm); b is the width of specimen (mm) and h is the height of specimen (mm).
For each test series, arithmetic mean of flexural strength results and correspondent
standard deviations were calculated, and shown in Table 3.16.
Table 3.16. Flexural test results: average values and correspondent standard deviations.
Failure load (kN)
Failure stress (MPa) Concrete
formulation Nº Average St. Deviation Average St. Deviation
1 10.04 0.50 23.52 1.17 2 8.82 0.12 20.67 0.28 3 10.15 0.22 23.79 0.52 4 14.02 0.46 32.85 1.07 5 6.90 0.39 16.18 0.91 6 2.15 0.11 5.04 0.26 7 11.26 0.75 26.38 1.75 8 8.34 0.49 19.55 1.16 9 12.71 0.67 29.80 1.58
10 15.31 0.03 35.87 0.08 11 12.74 0.05 29.85 0.11 12 16.52 0.94 38.72 2.20 13 12.82 0.89 30.04 2.08 14 12.55 0.72 29.41 1.68 15 14.71 0.65 34.47 1.53 16 14.91 0.91 34.94 2.14

III. POLYMER MORTAR FORMULATIONS
III-30
3.3.1.2 Load- deflection curves
In Figs. 3.7 to 3.9, typical bending load-displacement curves are displayed.
Formulation nº 5
0
3000
6000
9000
12000
15000
0 0.1 0.2 0.3 0.4 0.5
Deflection (mm)
Load
(N)
Formulation nº 6
0
3000
6000
9000
12000
15000
0 0.1 0.2 0.3 0.4 0.5 0.6 0.7 0.8
Deflection (mm)
Formulation nº 1
0
3000
6000
9000
12000
15000
0 0.1 0.2 0.3 0.4 0.5 0.6
Deflection (mm)
Load
(N)
Formulation nº 2
0
3000
6000
9000
12000
15000
0 0.1 0.2 0.3 0.4 0.5 0.6 0.7
Deflection (mm)
Formulation nº 3
0
3000
6000
9000
12000
15000
0 0.1 0.2 0.3 0.4 0.5
Deflection (mm)
Load
(N)
Formulation nº 4
0
3000
6000
9000
12000
15000
0 0.1 0.2 0.3 0.4 0.5 0.6Deflection (mm)
Fig. 3.7. Load-deflection curves obtained from flexural tests performed on PM specimens
of formulations nº 1 to 6.
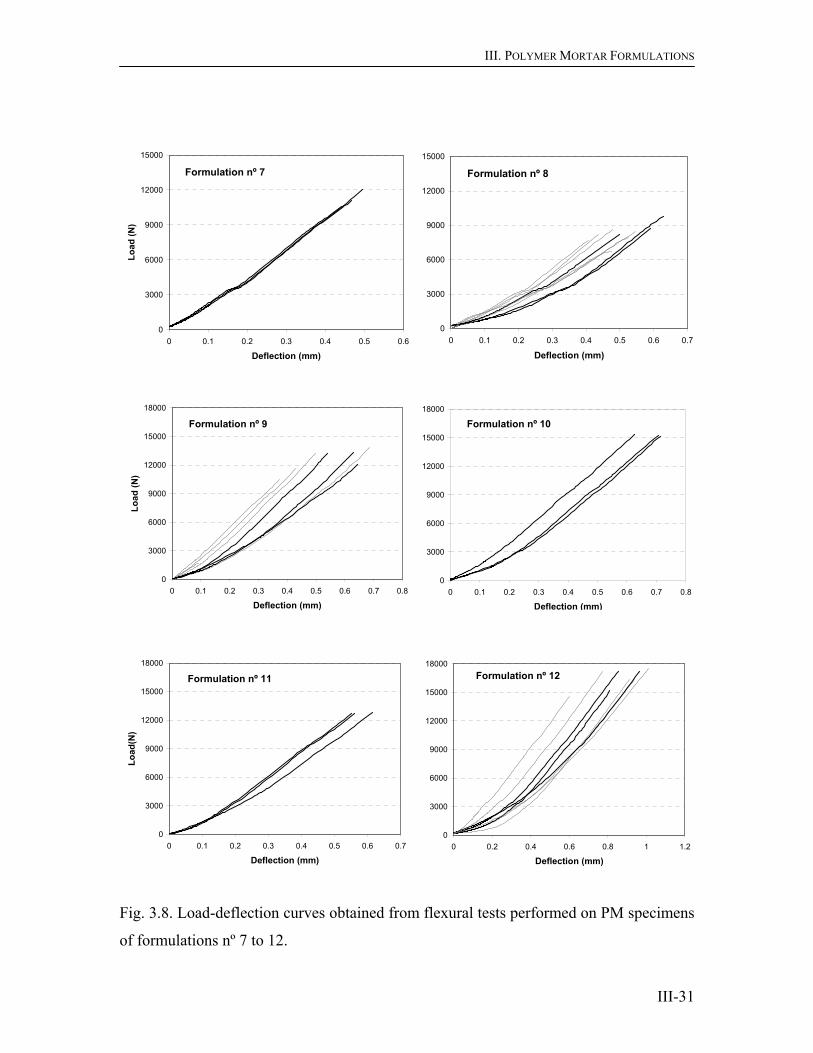
III. POLYMER MORTAR FORMULATIONS
III-31
Formulation nº 7
0
3000
6000
9000
12000
15000
0 0.1 0.2 0.3 0.4 0.5 0.6
Deflection (mm)
Load
(N)
Formulation nº 9
0
3000
6000
9000
12000
15000
18000
0 0.1 0.2 0.3 0.4 0.5 0.6 0.7 0.8
Deflection (mm)
Load
(N)
Formulation nº 10
0
3000
6000
9000
12000
15000
18000
0 0.1 0.2 0.3 0.4 0.5 0.6 0.7 0.8
Deflection (mm)
Formulation nº 8
0
3000
6000
9000
12000
15000
0 0.1 0.2 0.3 0.4 0.5 0.6 0.7
Deflection (mm)
Formulation nº 11
0
3000
6000
9000
12000
15000
18000
0 0.1 0.2 0.3 0.4 0.5 0.6 0.7
Deflection (mm)
Load
(N)
Formulation nº 12
0
3000
6000
9000
12000
15000
18000
0 0.2 0.4 0.6 0.8 1 1.2
Deflection (mm)
Fig. 3.8. Load-deflection curves obtained from flexural tests performed on PM specimens
of formulations nº 7 to 12.

III. POLYMER MORTAR FORMULATIONS
III-32
Formulation nº 13
0
3000
6000
9000
12000
15000
18000
0 0.1 0.2 0.3 0.4 0.5 0.6
Deflection (mm)
Load
(N)
Formulation nº 14
0
3000
6000
9000
12000
15000
18000
0 0.1 0.2 0.3 0.4 0.5 0.6 0.7 0.8
Deflection (mm)
Formulation nº 15
0
3000
6000
9000
12000
15000
18000
0 0.1 0.2 0.3 0.4 0.5 0.6
Deflection (mm)
Load
(N)
Formulation nº 16
0
3000
6000
9000
12000
15000
18000
0 0.1 0.2 0.3 0.4 0.5 0.6 0.7
Deflection (mm)
Fig. 3.9. Load-deflection curves obtained from flexural tests performed on PM specimens
of formulations nº 13 to 16.
From the experimental graphs displayed in Figs. 3.7 to 3.9, it seems clear that load-
displacement curves, for each concrete formulation, are relatively quite similar, and the
maximum load values are also very close, which is a good indication of prediction of
material behavior.
In these figures, black curves are correspondent to flexural test results considered for data
treatment by way of average and variance’s analysis. Grey curves correspond to flexural
tests performed on PM specimens belonging to batches of formulations that were post-
cured at 80ºC during 3 hours, which results were not considered for data treatment.

III. POLYMER MORTAR FORMULATIONS
III-33
3.3.2 Principal Effects and Interactions’ Effects on Bending Strength
The influence of a factor or an interaction on the global variance can be determined as a
function of the numeric values of the effects and they indicate the level of influence in the
global response, which is, in this case, the bending resistance in terms of failure load.
The calculus of the effects can be processed, through the analysis of averages, by way of
the columns of the orthogonal array.
3.3.2.1 Numeric values of principal and interactions’ effects
The numeric value of factor’s effect, XE , or principal effect, is not more than the
difference between the average values obtained on the two levels adopted by that factor.
To calculate each of these averages, all response values where that factor interacts with
the level in question are considered. This effect is designated by ‘principal effect’, as
each average used in the calculation of the effect, involves response values corresponding
to several levels of the other factors, as given by expressions 3.2 to 3.3.
2 1XE = X - X (3.2)
i i i = 1, 21X = (X ) n
R∑ (3.3)
where iX represents the average value corresponding to all responses involving factor X
with level i, and n is the number of responses obeying to those conditions.
The determination of the interaction’s effect value between two factors, (X*Y)IE , is not so
straightforward and involves the calculus of four different average values:
22 21 12 11(X*Y)1IE = (XY XY ) (XY XY )2
− − − (3.4)
or
22 12 21 11(X*Y)1IE = (XY XY ) (XY XY )2
− − − (3.5)

III. POLYMER MORTAR FORMULATIONS
III-34
where ji YX represents the average value corresponding to responses involving factor X
with level i, factor Y with level j and the other factors with any levels.
The numeric values of principal and interactions’ effects can be calculated, directly, with
basis on the coded columns of orthogonal array.
In Table 3.17, the L 16 (215) orthogonal array is presented, from which the calculation of
numeric values of principal and interactions effects can be followed.
Table 3.17. Calculus process of numeric values of principal and interaction effects.
Factors Interactions Nº
A B C D E A*B A*C A*D A*E B*C B*D B*E C*D C*E D*E Response
(kN)
1 1 1 1 1 1 1 1 1 1 1 1 1 1 1 1 10.04 2 1 1 1 2 2 1 1 2 2 1 2 2 2 2 1 8.82 3 1 1 2 1 2 1 2 1 2 2 1 2 2 1 2 10.15 4 1 1 2 2 1 1 2 2 1 2 2 1 1 2 2 14.02 5 1 2 1 1 2 2 1 1 2 2 2 1 1 2 2 6.90 6 1 2 1 2 1 2 1 2 1 2 1 2 2 1 2 2.15 7 1 2 2 1 1 2 2 1 1 1 2 2 2 2 1 11.26 8 1 2 2 2 2 2 2 2 2 1 1 1 1 1 1 8.34 9 2 1 1 1 2 2 2 2 1 1 1 2 1 2 2 12.71 10 2 1 1 2 1 2 2 1 2 1 2 1 2 1 2 15.31 11 2 1 2 1 1 2 1 2 2 2 1 1 2 2 1 12.74 12 2 1 2 2 2 2 1 1 1 2 2 2 1 1 1 16.52 13 2 2 1 1 1 1 2 2 2 2 2 2 1 1 1 12.82 14 2 2 1 2 2 1 2 1 1 2 1 1 2 2 1 12.55 15 2 2 2 1 2 1 1 2 1 1 2 1 2 1 2 14.71 16 2 2 2 2 1 1 1 1 2 1 1 2 1 2 2 14.91
1X 9.0 12.5 10.2 11.4 11.6
2X 14.0 10.5 12.8 11.6 11.4
11XY + 2 2XY 12.2 10.9 12.2 11.7 12.0 10.4 11.8 12.0 11.3 11.6
12XY + 21XY 10.8 12.1 10.8 11.3 11.0 12.6 11.2 11.0 11.7 11.4
5.1 -2.1 2.6 0.2 -0.3 1.5 -1.3 1.4 0.5 1.0 -2.1 0.7 1.1 -0.5 0.2

III. POLYMER MORTAR FORMULATIONS
III-35
In Table 3.17, the last column presents the average responses obtained from flexural tests
results, and the last row, the calculated effects on global response for each factor and
interaction.
From Table 3.14, the following relevant information can be extracted:
Which or whose factor(s) influence(s) the most the concrete bending strength;
The existence (or not) of interactions between factors that may affect bending
resistance.
3.3.2.2 Response graphics
Response graphics allow the evaluation of the relative importance of each factor, or
interaction, in a much easier way than the numeric values of effects.
For principal effects, the interpretation of response graphics is straightforward. Each
point in each graphic represents the average response for a certain level of the factor. The
numeric value of the effect is the difference between the two points: the higher the
difference, the higher the influence of the factor.
In Fig. 3.10, the response graphics of principal effects, with 95% confidence error bars,
are presented.
To analyse response graphics of interactions effects, the principal effects of the factors
involved must be ignored and attention should be focused on their interactions. Each
point represents the average response for two levels of the factors in question. Therefore,
to draw response graphic of an interaction, the previous calculation of partial
averages 11XY , 12XY , 21XY and 22XY is required.
The four average points define two straight lines: between 11XY and 12XY (or 21XY )
points, and between 22XY and 21XY (or 12XY ) points. The interaction is graphically
defined by the parallelism between the two lines: the smaller the parallelism, the higher
the interaction.
The parallelism between the two lines can be quantified through a numeric value, which
is straightforwardly comparable with the numeric values of principal effects.
Response graphics of interaction effects are displayed in Figs. 3.11 and 3.12.

III. POLYMER MORTAR FORMULATIONS
III-36
Fig. 3.10. Response graphics of principal effects: a) Resin Type; b) Charge Content; c) Resin Content; d) Sand Type and e) Curing Method.
7
8
9
10
11
12
13
14
15
0 1 2 3 4 5Resin Type
Flex
ural
Loa
d (k
N)
Epoxy Polyester
Effect: Resin TypeDependent: Load (kN)95% Confidence error bars
7
8
9
10
11
12
13
14
15
0 1 2 3 4 5Charge Content
25 % 0 %
Effect: Charge ContentDependent: Load (kN)95% Confidence error bars
7
8
9
10
11
12
13
14
15
0 1 2 3 4 5Resin Content
Flex
ural
Loa
d (k
N)
17 % 20 %
Effect: Resin ContentDependent: Load (kN)95% Confidence error bars
7
8
9
10
11
12
13
14
15
0 1 2 3 4 5Sand Type
Foundry Clean
Effect: Sand TypeDependent: Load (kN)95% Confidence error bars
7
8
9
10
11
12
13
14
15
0 1 2 3 4 5Curing Method
Flex
ural
Loa
d (k
N)
3 hours 80ºC 7 days 23ºC
Effect: Curing MethodDependent: Load (kN)95% Confidence error bars
a) b)
c) d)
e)

III. POLYMER MORTAR FORMULATIONS
III-37
Fig. 3.11. Response graphics of interactions’ effects: a) Resin Type*Charge Content; b) Resin Type*Resin Content; c) Resin Type*Sand Type; d) Resin Type*Curing Method; e) Charge Content*Resin Content and f) Charge Content*Sand Type.
4
6
8
10
12
14
16
0 1 2 3 4 5Charge Content
Flex
ural
Loa
d (k
N)
25 % 0 %
Int: Resin Type * %ChargeDependent: Load (kN)95% Confidence error bars
Epoxy
Polyester
4
6
8
10
12
14
16
0 1 2 3 4 5Resin Content
17 % 20 %
Int: Resin Type * % ResinDependent: Load (kN)95% Confidence error bars
Epoxy
Polyester
4
6
8
10
12
14
16
0 1 2 3 4 5Sand Type
Flex
ural
Loa
d (k
N)
Foundry Clean
Int: Resin Type * Sand TypeDependent: Load (kN)95% Confidence error bars
Epoxy
Polyester
4
6
8
0
2
4
6
0 1 2 3 4 5Curing Method
3 hours 80ºC 7 days 23ºC
Int: Resin Type * CuringDependent: Load (kN)95% Confidence error bars
Epoxy
Polyester
4
6
8
10
12
14
16
0 1 2 3 4 5Resin content
Flex
ural
Loa
d (k
N)
17 % 20 %
Int: % Charge * % ResinDependent: Load (kN)95% Confidence error bars
0% Charge
25% Charge
4
6
8
10
12
14
16
0 1 2 3 4 5Sand Type
Foundry Clean
Int: % Charge * Sand TypeDependent: Load (kN)95% Confidence error bars
0% Charge
25% Charge
a) b)
c) d)
e) f)

III. POLYMER MORTAR FORMULATIONS
III-38
Fig. 3.12. Response graphics of interactions’ effects: a) Charge Content*Curing Method; b) Resin Content*Sand Type; c) Resin Content*Curing Method and d) Sand Type*Curing Method.
3.3.3 Analysis of Variance –ANOVA-
The Taguchi method uses the analysis of variance ANOVA to analyse data obtained from
the execution of the experimental planning. The analysis of variance ANOVA allows the
analysis of the global variation in a set data or sample, identifying its origins and
assessing the contribution of each variable or factor to the global dispersion (Guimarães
and Cabral 1997). This statistical analysis revealed being a powerful tool, and it has been
4
6
8
10
12
14
16
0 1 2 3 4 5Curing Method
Flex
ural
Loa
d (k
N)
3 hours 80ºC 7 days 23ºC
Int: % Charge * CuringDependent: Load (kN)95% Confidence error bars
0% Charge
25% Charge
4
6
8
10
12
14
16
0 1 2 3 4 5Sand Type
Foundry Clean
Int: % Resin * Sand TypeDependent: Load (kN)95% Confidence error bars
20% Resin
17% Resin
4
6
8
10
12
14
16
0 1 2 3 4 5Curing Method
Flex
ural
Loa
d (k
N)
3 hours 80ºC 7 days 23ºC
Int: % Resin * CuringDependent: Load (kN)95% Confidence error bars
20% Resin
17% Resin
4
6
8
10
12
14
16
0 1 2 3 4 5Curing Method
3 hours 80ºC 7 days 23ºC
Int: Sand Type * CuringDependent: Load (kN)95% Confidence error bars
Foundry Sand
Clean Sand
a) b)
c) d)

III. POLYMER MORTAR FORMULATIONS
III-39
widely used as an efficient method for data treatment in many investigation fields,
inclusively in the assessment of PC compounds (Gorninski et al. 2004).
3.3.3.1 Concept of analysis of variance
The basic concept of ‘analysis of variance’ is not a difficult one to grasp. Some basic
understanding of regression analysis combined with computer statistical skills are
important prerequisites to interpret the data for ANOVA, but the concept of the analysis
itself is quite simple.
An ANOVA calculation is derived from a statistical calculation for significance based on a
T or F-Statistic calculated from the regression formula based on the least squares fit. A
relatively higher mean or average compared to the errors indicates a more precise system
or group from which the data was derived. In an ANOVA analysis, the relationship
between measurements of the mean and the variance or ‘random error’ of each group
provides the information needed to determine if the difference between them is
significant. When the statistical significance of the differences of means is assessed, then
a more accurate comparison between groups can be made (Rehberg and Trochim 1996).
In order to better illustrate this concept of mean, variance, and analysis of variance, a part
of a lecture given by Karl Popper could be useful (Popper 1972). Popper imagined that
scientific measurement ran the continuum of measuring systems with precision ranging in
randomness from clouds to clocks:
“…some natural phenomena, such as the weather, or the coming and going of clouds, are
hard to predict: we speak of the vagaries of the weather. On the other hand, we speak of
clockwork precision if we wish to describe a highly regular and predictable phenomenon.
There are many things, natural processes and natural phenomena, which we may place
between these two extremes, the clouds on the left and the clocks on the right. The
changing seasons are somewhat unreliable clocks and may therefore be put somewhere
towards the right, though not too far.”
Karl Popper’s discussion on clouds and clocks describes the fundamentals of ANOVA. At
one end of the continuum are clouds. Clouds are associated with higher random error,
with all of the imprecision associated with higher variance. In terms of clouds, they are
systems with an average or mean, but far more variance. Clocks, on the other hand, are

III. POLYMER MORTAR FORMULATIONS
III-40
far more efficient systems, with much smaller measurements of random error. Clouds
would have high errors associated with the mean. Clocks would have low errors
associated with the mean and the difference between clouds and clocks is highly
significant. However, in groups that are more alike than different, the ANOVA analysis
provides a logical tool to assess the significance of the difference between those groups.
Therefore, the analysis of variance becomes an important tool to understand the statistical
differences between the averages of two or more different populations or samples. The
differences are not so clear unless an ANOVA analysis is used to compare the averages and
the errors for levels of significance.
3.3.3.2 Variance analysis results. Calculation process
The analysis of variance was performed for a significance level of 5%, or for a
confidence level of 95%. Variance analysis results are shown in Table 3.18.
Table 3.18. ANOVA variance analysis.
Factors and Interactions df* Sum of Squares SS (N2)
Mean Square MSD (N2) F-values Contribution
P (%) Resin type 1 308848754.32 308848754.32 919.13 49.66 % of Charge 1 52092015.42 52092015.42 155.03 8.33 % of Resin 1 85382646.52 85382646.52 254.10 13.69 Sand type 1 314706.55 314706.55 0.94 0.00 Curing 1 1186241.50 1186241.50 3.53 0.14 Resin type * % of Charge 1 27367979.98 27367979.98 81.45 4.35 Resin type * % of Resin 1 20147315.13 20147315.13 59.96 3.19 Resin type * Sand type 1 24047207.40 24047207.40 71.56 3.82 Resin type * Curing 1 2954330.26 2954330.26 8.79 0.42 % of Charge * % of Resin 1 12723477.52 12723477.52 37.86 1.99 % of Charge * Sand type 1 52713912.21 52713912.21 156.88 8.43 % of Charge * Curing 1 5173855.17 5173855.17 15.40 0.78 % of Resin * Sand type 1 13817761.19 13817761.19 41.12 2.17 % of Resin * Curing 1 2805697.22 2805697.22 8.35 0.40 Sand type * Curing 1 920905.13 920905.13 2.74 0.09 Residual 32 10752703.10 336021.97 Total 47 621249508.63 * df – degrees of freedom.

III. POLYMER MORTAR FORMULATIONS
III-41
In the calculation process of the parameters needed to the analysis of variance ANOVA the
main steps described below were followed. All these calculus can be made by
computational means, through available software such as ‘Statgraphics’ (Statistical
Graphics Corporation 1988) or ‘Analyse-it General Statistics’ (Analyse-it Software Lda
1997)
i) Calculus of sum of squares (SS) of each column of Taguchi orthogonal array
The variations due to factors and/or interactions are characterized by the sum of squares
deviations (differences from the mean), or more simply SS (third column of Table 3.18).
The SS of a certain column gives the variation due to the factor or interaction represented
by that column. The SS of a column correspondent to a factor X, with two levels, is given
by the following expression:
2
2ii
i = 1( )x xSS = n (X -T) ∑ (3.6)
where iX represents the average value of all responses involving factor X with level i;
i( )xn represents the number of observations obeying to that condition; and T the average
value of all responses or global average.
ii) Calculus of total variation (TSS)
The total variation is the total of sum of squares (last cell of third column of Table 3.18).
The TSS can be calculated as follows:
N
2n
n = 1TSS = (y -T) ∑ (3.7)
where N is the total number of responses or observations; and ny is the nth observation.
iii) Calculus of variation due to random error (ESS)
The variation due to random error, sometimes called residual or error sum of squares,
ESS, can be calculated indirectly as shown in expression 3.8, as the total variation (TSS)
III. POLYMER MORTAR FORMULATIONS
III-42
is equal to the sum of partial variations (factors, interactions and error). This value can be
visualized in penultimate row of third column of Table 3.18.
ESS = TSS – SS X – SS Y -.....- SS XY -…. (3.8)
iv) Calculus of mean of squared deviations or variance’s estimators (MSD)
The mean of squared deviations is derived from the sum of squared differences averaged
over the degree of freedom correspondent to the factor, interaction or error, as shown by
expressions 3.9 and 3.10.
X
X X
SS MSD =df
(3.9)
E E
SSEMSD =df
(3.10)
where Xdf , Edf represents the number of freedom’s degrees, respectively, of the factor
X and the error.
In this particular case, the number of degrees of freedom (df’s) of each factor or
interaction is one, and the number of df’s of the error is equal to the total number of df’s
(N-1, with N equal to the total number of observations (48)) minus the number of df’s
correspondent to all factors and interactions in study (15).
v) F-test of significance
The F-test statistic is a measure of variances, allowing the comparison between variances
of several groups. For a certain chosen level of significance, the F-test allows verifying if
the effects are significantly different from zero. The F-test statistic is calculated as the
ratio between the mean of squares of the group (factor or interaction) and the mean of
squares of the random error, as shown in expression 3.11. Just like for the T-test, critical
F-value, critF , is found from a table giving the freedom’s degrees, of the numerator and
denominator, and the level of significance (Zady 1999).

III. POLYMER MORTAR FORMULATIONS
III-43
Xcalc X
E
MSD F =MSD
(3.11)
If calcF is greater than critF , then the null hypothesis is rejected which indicates that the
effect or interaction is significant in statistical terms. If calcF is less than critF , then the null
hypothesis is accepted, which means that the groups are not significantly different, i.e.,
the effect or interaction is not significant. The calculated F-values are shown in the fifth
column of Table 3.18.
The value of 5% is commonly used in practice for the level of significance (α). It
represents the probability of accepting an effect or interaction as significant, when the
null hypothesis is being false reject (Type I error).
For the significance level of 5%, the tabulated critF value is 4.15 (Guimarães and Cabral
1997).
v) % Contribution (P)
The percentage of contribution indicates the relative influence of a factor and/or
interaction on the global variation observed, and it is derived from the expected value of
the variance due exclusively to that factor or interaction. The expected value for the
variance of a factor includes a certain value associated to the error, which must be
previously subtracted before the determination of the percentage of contribution, as
shown by the following:
( )X X E X X E XMSD" = MSD - MSD SS" = SS - MSD df ⇔ × (3.12)
X
XSS"P (%) = 100TSS
× (3.13)
where X MSD" , X SS" are the mean of squared deviation and the sum of squares,
respectively, of the factor X due exclusively to that factor.

III. POLYMER MORTAR FORMULATIONS
III-44
3.4 Discussion of Results
3.4.1 Variance Analysis Results
From Table 3.18, it can be concluded that ‘resin type’ is the most influencing factor,
followed by ‘resin content’ and ‘charge content’. The interaction between ‘charge
content’ and ‘sand type’ also presents a significant contribution to global response.
Resin type 49.66 %
Resin content 13.69 %
Charge content 8.33 %
Interaction ‘Charge content * Sand type’ 8.43 %
The remaining major factors and interactions have very small influence in the total
variation. In particular, sand type and curing conditions factors, as well as the interaction
involving these two factors, have been rejected for a significance level of 5%, as
calculated F-values are less than 4.15, the critical F-value.
3.4.2 Analysis of Response Graphics
3.4.2.1 Principal effects
From the analysis of the response graphics of principal effects, it is clear that the bending
strength is strongly increased with the use of epoxy resin instead of polyester resin.
Response values of epoxy mortar formulations are not only higher, but also more reliable
due to a smaller scatter found in the results (see graph a) of Fig. 3.10). Despite the higher
mechanical strength of polyester resin, epoxy mortar formulations show better flexural
performance than polyester based ones. Improved adhesion between aggregates and
epoxy matrix could be the main reason for the observed behavior.
Global response is also increased, at a lower level, in all mortar formulations that present
the highest resin content (20%) and/or the lowest charge content (0%), as shown

III. POLYMER MORTAR FORMULATIONS
III-45
respectively in graphs c) and b) of Fig. 3.10. The relative high specific surface of clean
and foundry sands used in mix formulations, is probably the main factor responsible for
this behavior.
Sand type and curing treatment, when considered alone, have no significant influence on
bending strength, which can be confirmed by the small slope in corresponding response
graphics (graphs d) and e) of Fig. 3.10).
3.4.2.2 Interactions’ effects
Analyzing interaction effects response graphics, in Figs. 3.11 and 3.12, the following
conclusions can be drawn by descending order of interaction significance (Ribeiro et al.
2003).
i) Interaction between ‘Charge content’ and ‘Sand type’ – 8.43 %
Foundry sand formulations are very sensitive to charge incorporation in resin matrix. The
best mechanical results are obtained for 0% charge content. Clean sand based
formulations are instead hardly affected by variation of charge content (the two average
points are coincident – graph f) of Fig. 3.11).
The observed distinct behaviors can be explained by each sand particle’s size distribution.
Foundry sand, with rather fine grain size, has a larger specific surface, and therefore, it
reacts poorly to the incorporation of more fine particles. Clean sand, with a smaller
specific surface, requires less binder. Thus, mortar materials made from this kind of sand
and 25 % of charge content, balance the lower effective resin content with a better void
filling through the incorporation of calcium carbonate.
ii) Interaction between ‘Resin type’ and ‘Charge content’ – 4.35 %
Charge incorporation in polyester formulations has a rather negative influence in global
response. This effect is not so pronounced when epoxy resin matrix is used. An average
reduction of 4 % in bending strength of epoxy PM formulations occurs, when charged,
against a 33 % reduction in the case of polyester based ones (graph a) of Fig. 3.11).
This phenomenon is probably explained by the lower wetting ability of polyester resin,
which turns correspondent formulations more susceptible to the incorporation of filler.

III. POLYMER MORTAR FORMULATIONS
III-46
Although the higher viscosity of epoxy resin, it was experimentally observed, that
polyester resin presents a lower wetting ability than epoxy resin providing, as a result, a
poorer workability of final mixture.
iii) Interaction between ‘Resin type’ and ‘Sand type’ – 3.82 %
Epoxy resin formulations present better bending behavior when manufactured with
foundry sands. On the other hand, polyester based ones present better performance when
incorporating clean sands (graph c) of Fig. 3.11).
Higher wetting ability of epoxy resins relatively to polyester resins, enabling the use of
finer sands, also justifies these distinct preferences for sand type.
iv) Interaction between ‘Resin type’ and ‘Resin content’ – 3.14 %
Polyester formulations are more susceptible to resin content than epoxy formulations. An
increase of 17 % to 20 % in resin content increases global response in about 56%, for mix
formulations with polyester resin, against an increase in 10 % for those with epoxy resin
(graph b) of Fig. 3.11).
Once more, the distinct wetting abilities of resins are in the basis of this different
susceptibility to resin contents.
v) Interaction between ‘Resin content’ and ‘Sand type’ – 2.17 %
By incorporating higher resin content (20 %) better results are obtained when foundry
sands are used, while when smaller content is used (17 %), better response is obtained
with clean sands (graph b) of Fig. 3.12).
Lower resin contents require sands with lower specific surfaces, in order to reach an
appropriate wetting of all aggregate material. However, if an excess of binder occurs, the
glut resin tends to migrate to the surface reducing concrete mass homogeneity.
vi) Interaction between ‘Charge content’ and ‘Resin content’ – 1.99 %
Global response values increase much more with the resin content in samples with 25%
charge than in those with 0% charge (graph e) of Fig. 3.11).

III. POLYMER MORTAR FORMULATIONS
III-47
Charge incorporation, leading to an increase in the totally of particles’ specific surface,
turns mix formulations more susceptible to binder content than those without any charge.
vii) Other interactions - < 1.0 %
The remaining interactions, all of them involving the factor ‘Curing treatment’, have no
significant influence on the global response. This can be confirmed by the almost perfect
parallelism of the two straight lines of corresponding response graphics (graph d) of Fig.
3.12 and graphs a), c) and d) of Fig. 3.12).
It must be pointed out that all considerations discussed here, were made, accepting the
hypothesis that the effect of a factor or interaction on global response varies linearly
between the two levels adopted by that factor (or those factors), which might not be
completely correct. It would be necessary at least three variation levels to verify if the
effect of a factor or interaction is linear or not.
3.4.3 Optimal Formulation
The analysis of variance and the analysis of principal effects allowed the definition of the
most interesting levels for the three more influential factors on global response: Resin
type, Resin content and Charge content.
It was found that flexural performance of polymer mortars is significantly improved with
the use of epoxy resin, with a level content of 20%, and without incorporation of charge.
This means that mechanical behavior of polymer mortar formulations is improved by
using these factors’ levels in detriment of the other ones also in study.
The analysis of interactions’ effects, not only confirms the last conclusions, but also
allows the determination of the preferable levels for the two remain missing factors: Sand
type and Curing treatment.
With basis on response graphics of the interactions ‘Charge content * Sand type’, ‘Resin
type * Sand type’ and ‘Resin content * Sand type’, foundry sand was chosen for Sand type
level, as this type of sand, jointly with 20% of epoxy resin content without charge,
conducted to better results than clean sand.

III. POLYMER MORTAR FORMULATIONS
III-48
Taking into account the analysis made to the response graphics of principal effect and
interactions concerning Curing treatment, the choice for one of the two possible levels
adopted by this factor has no relevant consequences on flexural strength of resultant
formulation. It was concluded that seven days cure, at room temperature, has the same
effect than three hours cure, at 80ºC.
The optimal formulation, corresponding to the best combination of factors’ levels that
leads to a PM with improved flexural strength, was finally determined. It is composed by:
Epoxy Resin type;
20% (in mass) of Resin content;
0% of Charge content;
Foundry Sand type;
and submitted to Curing treatment: seven days at room temperature or three hours at
80ºC.
This particular mix formulation was actually tested. It corresponds to mortar formulation
nº 12, which presented an average bending strength of 38 MPa (Table 3.16 and Fig. 3.8).
Thus, there is no need to predict the bending strength of mortar formulation
corresponding to the optimal formulation by the Taguchi method, neither to perform the
advised confirmation test. However, in order to compare experimental bending strength
value with that one that would be predicted by Taguchi method, the following prevision
formula can be used:
2 1 12 1 22PREDR = T (A T) (B T) (C T) (BD T) (B T) (D T) + − + − + − + − − − − − (3.14)
PREDR = 17.53 kN
where R PRED is the predicted failure load given by Taguchi method; T is the global
average of all observations; 2A , 1B , 2C are the average values corresponding to
responses involving the most influencing factors on bending resistance (Resin type,
Charge content and Resin content, respectively), with the levels that improved that
characteristic; and 12BD is the average value corresponding to responses involving
simultaneously the factors Charge content and Sand type with the levels that lead the

III. POLYMER MORTAR FORMULATIONS
III-49
highest value for that significant interaction. This prevision formula is derived from the
global average of results plus the contribution of the effects of each significant factor (or
interaction) for the optimum level.
The average failure load predicted by Taguchi technique,17.53 kN, overestimates only in
6% the value obtained experimentally (16.52 kN). Thus, a quite good reproducibility was
obtained as the effects of significant factors were enabled to be replicated.
Although presenting the best flexural performance, PM formulation nº12 is not the most
desirable one in economical terms, taking into account the higher cost of epoxy resin (7.5
€/kg against 1.75 €/kg of polyester resin) and resin content involved. The best
price/performance relationship was presented by combination nº4. It is similar to nº12,
but with polyester resin instead of epoxy resin. This formulation is almost five times
cheaper, and its bending strength is only 17% smaller than the optimal combination.
A compromise solution must be sought according the specifications required by
material’s specific application.
The ideal would be to go on with the optimization process in order to refine and accurate
optimal formulation. To repeat Taguchi experimental program with fewer factors, but
considering intermediate levels each one, would be advised. For instance, the second
experimental program could be performed eliminating the factors with minor relevance,
such as Curing treatment and Sand type, and considering an intermediate level for the
other factors (e.g.: another type of resin, 18.5% of resin content and 12.5% of charge
content).
However, attending to thesis schedule limitations, it was decided not to go beyond the
obtained results, accepting them as quite satisfactory for the intended purpose.

III. POLYMER MORTAR FORMULATIONS
III-50
3.5 Conclusions
The first objective of this thesis work was to develop and to optimize a polymer concrete
material suitable either for the precast of structural members, either as a matrix of a
lightweight structural concrete.
For that purpose, a number of mortar mix formulations, with different combinations of
material factors and curing treatments, were manufactured and tested in bending. Load-
displacement curves and failure loads were recorded.
In order to reduce the total number of formulations to be tested, an experimental planning
was achieved through a Taguchi methodology. The influence of material factors and their
interactions on flexural strength of polymer mortar materials was assessed. A variance
analysis – ANOVA - was used for data analysis.
Taking into account the material factors and levels considered in this study, the following
conclusions can be drawn:
The most decisive factor for bending strength of PM formulations is the resin
type, followed by resin content and charge content;
Curing cycle has not significant influence on PM final characteristics. Seven days
cure, at room temperature, has the same effect than three hours cure, at 80ºC.
The analysis of principal effects and their interactions allowed establishing the
most desirable levels for each factor.
The optimal combination, corresponding to the most flexural resistant PM was
found. It is composed by:
- 20 % (in mass) epoxy resin;
- 0 % charge;
- 80 % foundry sand.
The combination that leads to the best relationship between cost and flexural
performance was also acceded. It is formed by:
- 20 % (in mass) polyester resin;

III. POLYMER MORTAR FORMULATIONS
III-51
- 0 % charge;
- 80 % foundry sand.
The obtained results of optimization process show that the Taguchi method and the
analysis of variance ANOVA can be applied, with success, to polymer concrete materials’
design.
The two optimized PM formulations were chosen as basis for sustaining the further
objectives of present thesis. Both PM formulations will be submitted to an exhaustive
characterization process, as described in chapters IV, V and VI, and their potential
applications as construction materials, will be discussed and analyzed in the published
papers presented in Appendixes A and B.

III. POLYMER MORTAR FORMULATIONS
III-52
Bibliography
Analyse-it Software Lda. (1997). "Analyse-it General Statistics." Analyse-it Software Lda, Leeds, England.
Ashley, S. (1992). "Applying Taguchi's Quality Engineering to Technology Development." Mechanical Engineering, 114(7), 58-60.
ASI. (2000). "ACI's Taguchi Method Clients List." The American Supplier Institute - www.amsup.com.
Beningfield, N. (1980). "Aspects of cement-based mortars for brickwork and blockwork." Cement, Jan, 27-30.
Box, G., and Draper, N. (1987). Empirical model-buiding and response surfaces, John Wiley & Sons, New York - Toronto.
CEB/FIP. (1990). "CEB-FIP Model Code 1990: design code." Comite Euro-International du Béton and International Federation for Prestressing.
CEN-EC2. (1992). "Eurocode 2: Design for Concrete Structures." European Committee for Standardization.
Chawalwala, A. J. (1996). "Material characteristics of polymer concrete," M. Sc., University of Delaware, Newark, Delaware.
Coimbra, E. (1988). Introdução ao planeamento de experiências, Faculdade de Engenharia da Universidade do Porto, Porto.
Cornell, J. A. (1981). Experiments with mixtures; designs, models and the analysis of mixture data, John Wiley & Sons, New York.
Cross, N. (1996). Engineering Design Methods. Strategies for product design., John Wiley & Sons, New York.
Czarnecki, L. "Introduction to material model of polymer concrete." IV International Congress on Polymers in Concrete, 1984, Darmstadt, 50-64.
Czarnecki, L., Garbacz, A., Lukowski, P., and Clifton, J. R. (1999). "Polymer Composites for Repairing of Portland Cement Concrete: Compatibility Project." -NISTIR 6394- Warsaw University of Technology, Building and Fire Research Laboratory, Warsaw , Gaithersburg.
III. POLYMER MORTAR FORMULATIONS
III-53
Czarnecki, L., and Weiss, V. "Meaning of synergetic effects in composite materials and structures." II International Symposium on Brittle Matrix Composites, 1988, Cedzyna, 526-535.
Fernandes, M. C., Ferreira, A. J. M., Marques, A. T., and Fernandes, A. A. "A methodology for material design. A case study on cast polymer concrete." DOGMA Thematic Net 9work Meeting ISQ, Oeiras, Portugal.
Ferreira, A. J. M., Camanho, P. P., Fernandes, M. C., Figueiredo, M. A. V., and Fernandes, A. A. (2000). "Taguchi analysis of polymer concrete properties." Composite Mechanics and Design (Mekhanika Kompozitsionnykh Materialov i Konstruktsii, The Russian Academy of Sciences), 6(4), 541-550.
Figueiredo, M. A., and Fernandes, A. A. (1996). "O Método de Taguchi no Planeamento e Análise de Operações de Soldadura." Ingenium, 2(11), 79-85.
Fowler, D. W. (1999). "Polymers in Concrete: a vision for the 21st century." Cement & Concrete Composites, 21(1999), 449-452.
Gorninski, J. P., Molin, D. C. D., and Kazmierczak, C. S. (2004). "Study of the modulus of elasticity of polymer concrete compounds and comparative assessment of polymer concrete and cement concrete." Cement and Concrete Research, 34(2004), 2091-2095.
Guimarães, R. C., and Cabral, J. A. S. (1997). Estatística, McGraw-Hill, Lisboa.
Mebarkia, S. A., and Vipulanandan, C. (1995). "Mechanical properties and water diffusion in polyester polymer concrete." Journal of Engineering Mechanics, 121(12), 1359-1365.
Ohama, Y., Demura, K., and Kobayashi, T. (1981). "Mix proportions and mechanical properties of polymethyl methacrylate resin concrete." Transactions of the Japan Concrete Institute, 3, 97-104.
Ohama, Y., Kobayashi, T., Takeuchi, K., and Nawata, K. (1886). "Chemical resistance of polymethyl methacrylate concrete." The International Journal of Cement Composites and Lightweight Concrete, 8(2), 87-91.
Piasta, A. (1978). "Method for selecting the optimal design of experiments in technological research," PhD, Kielce University of Techonology, Kielce.
Piasta, Z., and Czarnecki, L. "Analysis of material efficiency of resin concretes." II Intenational Symposium on Brittle Matrix Composites, 1988, Cedzyna, 593-602.
Popper, K. (1972). Objective Knowledge, Claredon Press, Oxford.
Rehberg, and Trochim, W. M. K. (1996). "Concept of Analysis of Variance." Cornell University - http://trochim.human.cornell.edu.

III. POLYMER MORTAR FORMULATIONS
III-54
Ribeiro, M. C. S., Tavares, C. M. L., Figueiredo, M., and Fernandes, A. A. (2003). "Bending Characteristics of Resin Concretes." Materials Research, 6(2), 247-254.
RILEM. (1995a). "PC-1: Method of making samples of polymer concrete and mortars in the laboratory." Technical Committee TC-113 'Test Methods for Concrete-Polymer Composites' (CPT), International Union of Testing and Research Laboratories for Materials and Structures.
RILEM. (1995b). "PC-2: Method of making polymer concrete and mortar specimens." Technical Committee TC-113 'Test Methods for Concrete-Polymer Composites' (CPT), International Union of Testing and Research Laboratories for Materials and Structures.
RILEM. (1995c). "PCM-8: Method of test for flexural strength and deflection of polymer-modified mortar." Technical Committee TC-113 'Test Methods for Concrete-Polymer Composites' (CPT), International Union of Testing and Research Laboratories for Materials and Structures.
San José, J. T., Vegas, I., and Ramirez, J. L. "Macroscopic properties in relation to polymer concrete internal structure." Int. Conference on Polymer Concretes, Mortars and Asphalts, 2002, Porto, Portugal, 113-124.
San José, J. T. L. (1996). "Hormigón polimérico estructural y decorativo. Aplicación a composites para la construcción," PhD Thesis, Universidade del Pais Basco, Bilbao.
Schaffler, H. (1979). "Concrete with gap-graded aggregates." Betonwerk + Fertigteil-Technik, 46(6), 341-345.
Shacklock, B. W. (1959). "Comparison of gap- and continuously graded concrete mixes." TRA / 240, C & CA.
Smith, M. R., and Collis, L. (1999). "Aggregates. Sand, gravel and crushed aggregates for construction purpose." Geological Society.
Statistical Graphics Corporation. (1988). "Statgraphics, statistical graphics system." STSC, Inc.
Taguchi, G. (1986). Introduction to Quality Engineering; Designing Quality into Products and Processes, Asian Productivity Organization, Tokyo.
Van Gemert, D., Czarnecki, L., and Bares, R. (1985). "Basis for selection of PC and PCC for concrete repair." International Journal of Cement Composites and Lightweight Concrete, 7, 121-123.
Zady, M. F. (1999). "Z-Stats: Basic Statistics." WesTgard Quality Corporation - www.westgard.com.

III. POLYMER MORTAR FORMULATIONS
III-55

IV-1
IV. PHYSICAL AND STATIC MECHANICAL
PROPERTIES OF PM FORMULATIONS 4.1 Introduction
Unlike conventional Portland cement concrete, there is not much information on the
variability of properties in PC materials, especially on the variability of mechanical
strengths (Mebarkia 1993). However, statistical information on PC and PM properties is a
very important issue in the decision process of the minimum number of tests required to
assure reproducibility.
As for traditional concrete, variation in properties for PC materials may be due to any of
the following parameters:
• Variation in basic properties of the individual constituents (aggregates, polymers,
catalyst system, and eventual additives);
• Variations in the environment conditions (temperature and moisture);
• Variation due to production techniques applied (mixing and casting procedures,
compaction effort, and curing processes) (San José et al. 2002).
• And variation due to improper or inadequate testing methods, which may cause
apparent or mistaken differences in PC properties (Richardson 1991).
In particular, strength test results may be specially affected by variation in the test
parameters such as specimen geometry, specimen size, preparation of end surfaces,
rigidity of testing equipment, and rate of application of stress. For this reason, testing
should follow a single standard, with no departure from prescribed procedures.

IV. PHYSICAL AND STATIC MECHANICAL PROPERTIES OF PM FORMULATIONS
IV-2
4.1.1 Variability of Strength Properties
The strength of a brittle material such as concrete and PC cannot be described by an only
average value: an indication of the variability of strength must be given, as well as
information about the size and shape of the specimens. Whatever the test, the test results
have to be interpreted in statistical terms. For instance, the mere fact that some test result
is larger than some other result does not necessarily mean that the difference is
‘significant’ and not, instead, a chance consequence of the natural variability of values
from the same source.
The variability in strength can be assessed by the standard deviation (SD). For a given
mean strength, the SD characterizes fully the distribution (assumed to be of the normal
type), as scattering data about the mean is a fixed function of SD. This is defined as the
root-mean square deviation, i.e.
SD = [ ∑ (x-µ)2 / n ] ½ (4.1)
where x represents the values of strength of all n specimens and µ is the arithmetic mean
of these strengths. In practice, a limited number of specimens are computed, and their
mean, the sample mean, is the estimation of the true population mean. In these cases, in
the denominator of the expression, (n-1) is put, instead of n (Bessel´s correction).
Sometimes, it is convenient to express the scatter of results on a percentage basis. Hence,
the coefficient of variation, COV (COV = SD/µ × 100), may be used for that purpose.
SD can also be used to determine the required average of strength that will provide the
specified strength of the concrete, at a certain confidence level (Neville 1995).
4.1.2 Research Objective
In this chapter, the main physical and static mechanical properties of PM formulations are
analyzed. Fresh state properties, setting behavior, specific weight, coefficient of thermal
expansion, static compressive, bending and splitting-tensile strengths, deformation
characteristics, and stress-strain relationships were determined and analyzed.
IV. PHYSICAL AND STATIC MECHANICAL PROPERTIES OF PM FORMULATIONS
IV-3
An effort was made in order to select the most adequate testing methods, regarding each
property, so that reliable and comparable results could be obtained. The usual applied test
methods were reviewed and discussed.
A special care was taken in maintaining both the production procedures, for all batches
produced, and the environment conditions, during manufacturing and testing, in order to
minimize induced variability on results.
Statistical variations of some of the analyzed properties were also investigated.

IV. PHYSICAL AND STATIC MECHANICAL PROPERTIES OF PM FORMULATIONS
IV-4
4.2 Physical Properties
4.2.1 Fresh State Properties: Workability, Consistency and Working Life
Although fresh concrete is only of transient interest, it should be noted that the strength of
a particular concrete formulation is very seriously affected by the degree of its
compaction. It is vital, therefore, that the consistency of the mix be such that the concrete
mass can be placed, compacted and finished sufficiently easily and without segregation.
This is particularly crucial in the case of PC formulations, where mixture workability and
consistency are considerably time-dependent, and thus, the available time for a proper
placement, compaction and finishing is significantly reduced. Therefore, working life of
PC mixtures is also a physical characteristic of paramount importance in process
technology of PC materials.
4.2.1.1 Definitions and usual test methods
i) Workability and consistency
Technical literature abounds with variations of definitions of workability and consistency
but they are all qualitative in nature and they further reflect a personal viewpoint rather
than a precise scientific meaning (Bartos 1992; Neville 1995).
The ASTM C 125 (2006) defines workability, in a qualitative manner, as the ‘property
determining the effort required to manipulate a freshly mixed quality of concrete with
minimum loss of homogeneity’. The ACI definition of workability is: ‘that property of
freshly mixed concrete or mortar which determines the ease and homogeneity with which
it can be mixed, placed, consolidated and finished’ (ACI:116R-90). In the same
reference, the definition of consistency is given as ‘the relative mobility or ability of
freshly mixed concrete or mortar to flow’, which is measured by slump. These terms have
indeed specific meaning, but only under a set of certain circumstances and they can
hardly be used as an objective and quantifiable description of a concrete mix.

IV. PHYSICAL AND STATIC MECHANICAL PROPERTIES OF PM FORMULATIONS
IV-5
There is no acceptable test which will measure directly the workability as given by any of
the above definitions. Several attempts have been made to correlate workability with
some easily determinable physical measurement, but none of them may be considered as
fully satisfactory. However, they may provide useful information, in comparative terms,
within a range of variation in workability.
Among the several methods developed to determine workability, the tests that measure
the slump and the flow of concrete mixes, the penetration depth, the Vebe time and the
compaction factor are the most widely used. However, it should be noted that no
comparison is really possible between these different test methods as each one measures
the behavior of freshly concrete under different test conditions. In addition, the particular
use of each test depends upon of workability level of the given concrete mixture: while
Vebe and compaction factor tests are more appropriate for low to medium workability
mixes, slump and flow tests are more adequate for concrete mixtures with medium to
very high workabilities (BS:1881-102; BS:1881-103; BS:1881-104; BS:1881-105).
In the investigation works carried out by Ohama et al. (1986; 1979), it was found that the
workability and consistency of fresh polyester PC materials are remarkably affected by
the binder content rather than the binder viscosity, regardless of the type of polyester
resin binder. The same studies revealed that to determine workability and consistency of
polyester PCs, the slump and flow tests are more adequate in the case of high binder
contents, and the penetration test at low binder contents.
It is believed that above considerations are also generally applied to PC mixtures with
other binders than polyester resins. Therefore, taking into account the relative high
polymer content of epoxy and polyester mix formulations, the slump and flow tests were
selected in the present study to assess workability and consistency of developed PM
formulations.
ii) Working life
Working life of PC mixtures determines the available time for a proper mixing,
placement, compaction and finishing of fresh PC materials. It can be defined as the
elapsing time between adding the catalytic system to the liquid resin and the moment at
which the mixture is no more workable. This moment is determined by different criteria
according to the test method applied.

IV. PHYSICAL AND STATIC MECHANICAL PROPERTIES OF PM FORMULATIONS
IV-6
The working life of PC mixtures is very variable and it is affected by different factors,
namely the pot-life of polymer binder, the polymer content, and the amount and type of
catalytic system. For the same formulation, working life is also considerably affected by
environmental conditions and total amount of concrete mass. Therefore, all test methods
usually applied for determining working life of fresh PC mixtures define the environment
conditions at which the test should be conducted (usually at temperature of 20±2ºC and a
relative humidity of 70% or below), and the total amount of mixture that should be used
for such determination.
Different criteria are used for determining the moment at which the fresh mixture is
considered no more workable, depending upon the test method applied: the penetration
resistance method, the pull-out method or the finger-touching method.
In the investigation work carried out by Ohama et al. (1981) concerning the working life
of different formulations of polyester resin concretes, it was concluded that both the
penetration resistance and the finger-touching tests are effective methods for determining
the working life of fresh PC mixtures with a wide range of working life, consistency and
mix proportions. It was also found that the reproducibility of the working life data by the
tests is successfully obtained.
Attending to the above and taking into account that the finger-touching method does not
require any special device, in the present study, this test method, as the simplest one, was
chosen for determining the working life of PM formulations.
4.2.1.2 Experimental procedures and results
i) Workability and consistency
Workability and consistency of PM formulations were determined according to RILEM
recommendation ‘Method of test for slump and flow of fresh polymer concrete and
mortar’ (1995a). The tests were conducted in the laboratory maintained at a temperature
of 20 ± 2ºC and a relative humidity of 65%. For each PM formulation, the slump and the
flow were determined for two samples proceeding from different batches.
A steel cone with a top inside diameter of 50 mm, a base inside diameter of 100 mm and
a height of 150 mm was used for the slump tests according to the specification. The cone,
with the inside surfaces properly coated with release agent, was placed on a flat steel

IV. PHYSICAL AND STATIC MECHANICAL PROPERTIES OF PM FORMULATIONS
IV-7
plate and then filled with the polymer mortar mass in two layers. Each layer was stroked
15 times with a standard tamping rod (straight steel rod with a diameter of 9 mm and a
length of 300 mm, having the tamping end rounded to a hemispheric tip). After the top
layer has been struck off, the cone was removed by raising it carefully in a vertical
direction. All these operations were done within the maximum period of 3 minutes.
After cone removal, the slump was immediately measured by determining the vertical
difference between the top of the cone and the displaced original center of the top surface
of the PM. The flow was measured by determining the diameter, after the mortar has
spread out, in the direction with larger diameter and in the direction at right angles to the
former. The average value of these measures was taken as the flow of PM.
In all slump tests performed, a true slump (i.e. slumping evenly all round) was rather
observed than a shear slump, and therefore they all were considered valid.
Obtained slump and flow test results are presented in Table 4.1 and, in Fig. 4.1, typical
slump shapes of epoxy and polyester PM formulations are illustrated.
Table 4.1. Slump and flow test results of PM formulations (average of two samples).
PM Formulation Slump Test Flow Test
Batch 1 55 mm 126 mm Epoxy PM
Batch 2 57 mm 56 mm
129 mm 128 mm
Batch 1 53 mm 126 mm Polyester PM
Batch 2 50 mm 52 mm
124 mm 125 mm
Fig. 4.1. Slump and flow tests of PM formulations: Cone removal (left) and typical slump shapes of epoxy and polyester PM formulations (center and right, respectively).

IV. PHYSICAL AND STATIC MECHANICAL PROPERTIES OF PM FORMULATIONS
IV-8
ii) Working life
Working life of PM formulations was determined by finger-touching test method,
according to RILEM recommendation ‘Determining methods for working life of fresh
polymer concrete and mortar’ (1995b). The tests were conducted in the laboratory
maintained at a temperature of 20 ± 2ºC and a relative humidity of 60%. For each PM
formulation, the working life was determined for two samples proceeding from the same
batch.
Samples of fresh PMs of about 200 ml were packed and sealed in polyethylene film bags,
and then the sense of touching through polyethylene film on them was inspected. Total
time elapsing from adding the catalyst to polyester resin, or the hardener to epoxy resin,
to the moment when a stiff feeling was felt for the first time was reported as working life.
Obtained results, for both PM formulations are presented in Table 4.2.
Table 4.2. Working life of PM formulations (average of two samples).
PM Formulation Working Life by Finger Touching Method
Sample 1 42 min Epoxy PM
Sample 2 42 min 42 min
Sample 1 17 min Polyester PM
Sample 2 18 min 18 min
4.2.2 Setting Shrinkage
Setting shrinkage in PC materials can be quite large when compared to ordinary cement
concretes. This undesirable feature is one of the most serious problems facing their
precast and cast-in-place applications as large setting shrinkages may result in short-term
troubles such as exfoliation, cracks and poor dimensional stability. Therefore, the
examination of length change of resin mortar and concretes during setting bears
considerable significance.
Shrinkage in PC materials occurs, basically, during the first hours due to polymerization
process and it is generated by means of the interbreeding between polymer chains, which
results on a volume lower than the initial one.

IV. PHYSICAL AND STATIC MECHANICAL PROPERTIES OF PM FORMULATIONS
IV-9
Generally, length change of PCs and PMs occurs in two different phases. In the first
phase, at the start of polymerization (within the first 3-5 hours), a small expansion of PC
takes place due to the exothermic nature of polymerization process. The initial opening of
the bonds, which takes place along the crossing of polymeric chains, generates the heat
that causes PC expansion as the incorporation of aggregates does not damper the
exothermic process, which is associated with the polymeric reaction. After the
exothermic peak has been reached, this effect quickly disappears due to crosslink process
that shortens the distances between the long polymeric chains, leading to a general and
steady reduction of material volume. In this stage, shrinkage process goes on until all
polymeric reactions have been attained, converging to stable values after 24 hours after
casting.
For the same matrix binder, final shrinkage of PC materials is significantly affected by
resin content, catalyst and accelerator contents, environment temperature, and total
amount of mass per batch. At higher catalyst and accelerator contents, the shrinkage
increases through the curing time and the length change becomes nearly constant at an
early curing time. Higher values of the later parameters also lead to increasing values of
setting shrinkage on the final product (Letsch 1991; Ohama and Komiyama 1979).
4.2.2.1 Usual test methods for setting shrinkage of PC materials
At present, there is a lack of standards for setting shrinkage of PC materials, which led to
the development of various internal methods by several researchers in the field, in order
to fill this gap. Various techniques for measuring and monitoring the setting shrinkage of
PCs and PMs have been proposed such as the use of many kinds of contact-type
displacement meters, the use of mold gauges, and, more recently, the use of non contact-
type measuring devices based on optical methods (Cano et al. 1998; Letsch 1991;
Moriyoshi et al. 1997).
In the contact-type displacement meter method, resilience of its built-in spring can
adversely affect the measurements. On the other hand, measuring process by mould
gauges is unable to measure the strain of PC mass in its early stage of setting, when no
adherence has yet been developed between the fresh material and the strain gauge.

IV. PHYSICAL AND STATIC MECHANICAL PROPERTIES OF PM FORMULATIONS
IV-10
The optical method based devices, as non-intrusive methods that do not confer any
resistance to shrinkage deformations, seem to be the most satisfactory ones. This type of
measuring systems consist of a mould with a bottom plate and side plates, lined with a
Teflon sheet for reducing friction against the fresh PC material, an aluminum L-shaped
end plates for measuring displacement, and a laser beam displacement meter. The bottom
and side plates are assembled in advance and the L-shaped end plates are installed at both
ends of the assembly to allow the contact to move freely, according to the expansion or
shrinkage of the specimen. After the placing of the fresh material, displacement is
measured with the laser beam displacement meter at given intervals. Some of these
devices are further complemented with thermocouples and load cells that allow
monitoring, respectively, temperature and internal stresses developed during setting.
Unfortunately, at the time, none of above measuring devices was available at INEGI lab.
Therefore, alternatives methods were attempted in order to monitoring the setting
shrinkage of PM formulations.
4.2.2.2 Applied test methods for setting shrinkage of PM formulations
In order to continuous monitoring setting shrinkage of PM formulations during the first
hours, a first attempt was made using Fibre Bragg Grating (FBG) sensors embedded into
PM specimens during casting.
FBG sensors system is a sensitive technique for health monitoring of structures with wide
application in the field of Civil Engineering. This technique has a great potential as it
gives in-real time data evaluation of measurements such as strains and temperature. The
fabrication process of FBG sensors is based on the photosensitive mechanism, which is
observed in Ge-doped optical fibres (Hill et al. 1993). If broadband light is traveling
through an optical fibre containing such periodic structure, its diffractive properties
promote that only a very narrow wavelength band is reflected back. The FBG resonance
wavelength will vary accordingly with temperature or strain changes experienced by the
fibre. Therefore, FBG sensor systems are enable to measure the internal strain state of a
material into which they are embedded without influencing the stress of the specimen.
Moreover, the dimensions of the optical fibres are very small so the sensors can be
embedded in fresh concrete material during casting without damaging the host material,
IV. PHYSICAL AND STATIC MECHANICAL PROPERTIES OF PM FORMULATIONS
IV-11
they can survive into the fresh material without any protective jacket, and they are
immune to the influence of electromagnetic fields. An optical system apparatus
connected by cables to the optical fibre can provide the in-real time monitoring of
internal strains.
There are several successful FBG sensor related applications concerning traditional
portland cement concrete structures (Shultz et al. 2001), but until now, no works have
been done regarding their application in PC materials. This first experience, however, did
not work out as well as it was expected. Some problems occurred related to both fibre
embedding process and data acquisition system, which did not allow reliable readings. In
spite of this, some qualitative information was obtained regarding the volumetric changes
suffered by epoxy PMs during setting. More information related with this experience can
be found in Novo et al. (Novo et al. 2005).
Attending to the failing of the above experience, in the present work, only the final
shrinkage of PMs was determined. For that purpose, a conventional digital caliper was
used for measuring length change of PM specimens 24 hours after casting. The accuracy
of the method is not the most desirable one but it provides an estimate of the range of
values of setting shrinkage that will be expected for these materials.
4.2.2.3 Experimental procedures and results
i) Continuous monitoring of setting shrinkage by FBG sensors
This attempt of monitoring setting shrinkage of PMs by embedded FBG sensors was only
performed for epoxy PM formulation.
One single prismatic specimen with cross section of 30×10 mm2 and 150 mm length was
used in this study. A low thickness specimen allows the reduction of the effect of the
variation of polymerization rate, as this parameter varies throughout the thickness of the
specimen. Specimen dimensions were achieved by introducing a second silicon rubber
mould in one of the steel cavities of the steel moulds usually applied for casting standard
PM specimens (40×40×160 mm3).
Immediately after specimen casting, a FBG sensor was embedded into the fresh PM
specimen at 1 mm depth and a pre-tension was applied to keep it well aligned as shown in
Fig. 4.2.

IV. PHYSICAL AND STATIC MECHANICAL PROPERTIES OF PM FORMULATIONS
IV-12
The optical fibre used in this study was a single mode fibre with an acrylate coating (SMF
28-Corning), with a fibre diameter of 250 µm and a 10 mm length Bragg grating
(attenuation for 1550 nm: < 0.22 dB/km). In previous works, the results of strain and
temperature measured by this type of optical fibres were validated by comparison with
thermocouples and conventional strain gauges whose behavior is well known (Costa et al.
2003). The embedded optical fibre was extended by welding an optical cable that was
connected to the optical system.
The optical system used for in-time real monitoring consisted of an erbium broadband
source (Photonetics FIBREWHITE) to illuminate the FBG sensors, an optical spectrum
analyzer (ANDO AQ6330) to view the Bragg wavelengths shifts, and a computer with
data acquisition system (LabView®) for flexibility in data display, processing and storage
of all information observed.
Strain variation of epoxy PM specimen during setting was monitored during 15 hours in a
controlled environment. The obtained spectrum can be observed in Fig. 4.2. This curve is
the result of volumetric variations of epoxy PM specimen during setting.
Fig. 4.2. a) Embedding process of optical fibre; b) Strain variation of epoxy PM specimen during setting.
Due to some troubles arisen from fibre embedding process, no reliable absolute strain
values were obtained, therefore, strain variation as function of time is presented without
strain scale. In spite of this incident, some useful information was achieved, concerning
0 3 6 9 12 15
0
Stra
in (µ
m)
Time (hours)
a) b)Expansion
Shrinkage

IV. PHYSICAL AND STATIC MECHANICAL PROPERTIES OF PM FORMULATIONS
IV-13
volumetric and thermal behavior of epoxy PMs during setting period, resumed in the
following:
• During curing period, epoxy PM formulation reaches its exothermic peak within
the range of 2.5 to 3 hours after mixing/casting process;
• Expansion phenomenon occurs within the first 3 hours, having its maximum value
been estimated about 15% of the total value of shrinkage (obtained after 15
hours).
• After the first 3 hours, shrinkage process assumes higher significance, presenting
positive values 6 hours after mixing.
• Shrinkage rate rises between the first 8 to 12 hours and tends to decrease after this
period. Based on previous studies carried out by other researchers (Moriyoshi et
al. 1997; San José 1996), it is reasonable to presume that shrinkage rate of epoxy
PM would follow the same trend, decreasing progressively with time until a stable
shrinkage value has been reached.
Experimental results illustrated the potential of the FBG sensors system for monitoring
curing process of PC materials. Several issues, however, need further investigation in
order to obtain reliable readings. In particular, the process to keep the optical fibre well
aligned and under stress during polymerization must to be improved in order to avoid
buckling due to PC expansion and shrinkage, as ill placement of the fibre leads to
erroneous reading’s interpretation.
Fibre Bragg Grating sensors are a new sensitive technique and their interaction with
different materials such as PC materials must be studied and well understood before
quality data can be obtained.
ii) Final setting shrinkage
Taking into account the impossibility to determine the absolute values of setting
shrinkage of PM formulations, with basis on the results of the first experience, the basic
method of measuring length variation by means of a digital caliper was applied.
Two PM specimens of each formulation, with square section of 20×20 mm2 and 100 mm
length, were casted in order to determine final setting shrinkage. A special silicone mould
with two cavities was used for that purpose, as shown in Fig.4.3. The precise dimensions

IV. PHYSICAL AND STATIC MECHANICAL PROPERTIES OF PM FORMULATIONS
IV-14
of these cavities, inside which PM specimens were casted, were known by means of the
models used to produce the silicone mould.
Fig. 4.3. Polyester PM specimens used for determination of final setting shrinkage.
The temperature (23ºC) and the relative humidity (60%) were maintained as constant as
possible throughout all the steps of experimental work: mixing process, casting and
setting period. One day (24 hours) after casting, the specimens were removed from the
mould and their lengths were measured by means of a caliper to the nearest 0.01 mm.
Relative variation lengths of both types of PM specimens, computed as final setting
shrinkage of PMs at 24 hours, are presented in Table 4.3.
Table 4.3. Final setting shrinkage of PM formulations (average of two specimens).
PM Formulation Final setting shrinkage (24 hours)
Specimen 1 1.99 ‰ Epoxy PM
Specimen 2 2.49 ‰ 2.24 ‰
Specimen 1 5.49 ‰ Polyester PM
Specimen 2 6.49 ‰ 5.99 ‰
As it was expected, shrinkage value of polyester PM formulation is higher than epoxy
based one and much higher than traditional cement concrete (0.35 ‰). For both
formulations, obtained results are within the common range of values usually found for
epoxy and polyester PMs with 20% of resin content (Letsch 1991; San José 1996).

IV. PHYSICAL AND STATIC MECHANICAL PROPERTIES OF PM FORMULATIONS
IV-15
4.2.3 Specific Gravity and Air Content
PC materials made with natural aggregate originating from hard rock have a density
within a relative narrow range because the specific gravity of most rocks varies little.
Further, the densities of common resins usually applied as matrix binders are very
similar, which also contribute for the relative similarity of density values commonly
found for these materials.
Although the volumetric content of the binder in the mix has a greater influence on the
specific weight of this concrete material than in the case of conventional one, this feature
too is not a major factor. Mixing and casting processes are the main contributing factors
for the variability of densities on PC materials as different procedures lead to different air
content entrainments. Thus, PC elements made according to the same formulation can
attain different densities as function of mixing technique applied and compaction
procedure.
4.2.3.1 Calculation procedure
Specific gravity and air content of epoxy and polyester PM formulations were determined
with basis on RILEM specification PCM-4 (1995g). This recommendation covers the
method of test for determining the unit weight and air content of freshly mixed polymer-
modified mortars. Calculation procedures were adapted in order to determine the
mentioned parameters for hardened PM formulations, taking advantage of the great
number of both epoxy and polyester prismatic PM specimens produced during the
experimental work of this thesis.
The unit weight (W) of each PM specimen, in kg/dm3, was calculated according to the
following equation:
W = W1 / V (4.2)
where W1 and V are, respectively, the mass (kg) and the volume (dm3) of PM specimens.
Accordingly, the air content (A) in percentage of each PM specimen was calculated from
the following equations:
A = [ (T-W) / T ] × 100 (4.3)
with

IV. PHYSICAL AND STATIC MECHANICAL PROPERTIES OF PM FORMULATIONS
IV-16
T = (Wb + Wa) / [ (Wb / ρb) + (Wa / ρa) ] (4.4)
where
- T is the unit weight of PM specimens calculated on an air-free basis (kg/dm3);
- W is the unit weight of each PM specimen as given by equation (4.2);
- Wb, ρb are, respectively, the mass per batch (kg) and the specific gravity of resin
binder (kg/dm3);
and - Wa, ρa are, respectively, the mass per batch (kg) and the specific gravity of
foundry sand (kg/dm3).
4.2.3.2 Obtained results
Average results and correspondent standard deviation for specific gravity and air content
of each PM formulation are presented in Table 4.4. Presented values correspondent to the
average of several epoxy and polyester PM specimens of different batches, whose
weights and volumes were measured throughout the experimental work of this thesis.
Table 4.4. Specific gravity and air content of PM formulations. Average results and correspondent standard deviations referred to 41 specimens.
PM Formulation Specific gravity
(Average St. Deviation) [kg/dm3]
Air content (Average St. Deviation)
[%]
Epoxy PM 1.799 0.021 15.21 0.98 Polyester PM 1.882 0.022 8.33 1.10
According to ACI 213R-87, both PM formulations can be classified into the category of
structural lightweight concrete materials, as their densities are lower than 1.9 kg/dm3 and
their compressive strengths are higher than 17 MPa (ACI 1994).
Although the lower density of polyester resin (0.1 point less than epoxy system),
polyester based mortars present higher density than epoxy based one. The high value of
air content present on epoxy PMs, almost twice of polyester PM, is surely the responsible
factor for this feature. The unexpected high content of accidental entrained air into epoxy
PM formulation is probably due to the mixing process of both components of the resin
system. Although the low viscosity of the hardener component (350 mPa.s), the epoxy

IV. PHYSICAL AND STATIC MECHANICAL PROPERTIES OF PM FORMULATIONS
IV-17
resin base is very viscous (600 mPa.s), making hard the mixing process. The required
thorough hand mix of the two components leads to the entrainment of a considerable
amount of small air bubbles into resin system, which are hardly released during mixing
and casting processes.
The higher values found for slump and flow of epoxy PM formulation, in spite of the
higher viscosity of its resin binder, are certainly due to this great amount of air content,
which has a considerable effect on workability and consistency of concrete mixes.
Air content of polyester PM formulation is within the range of values commonly found
for polyester mortars (with similar resin contents), mixed in batch mixers without vacuum
support, and casted without special compaction or vibration system devices (Gálan 2001).
4.2.4 Coefficient of Thermal Expansion
Coefficients of thermal expansion (CTE) are widely used for design purposes and to
determine if failure by thermal stresses may occur when a solid body, composed of two
different materials, is subjected to temperature variations.
Like most engineering materials, PC has a positive CTE but its value depends essentially
on the composition of the mix. The influence of the mix arises from the fact that the two
main constituents of PC, polymer binder and aggregate, have dissimilar thermal
coefficients, and the coefficient of PC is a resultant of the two values. The linear
coefficient of thermal expansion of polymers varies within a wide range of values,
between 20 and 150 ×10-6 per ºC (Crawford 1990), and is higher than the coefficient of
the aggregate, which varies, for the more common parent rocks, between 5 × 10⁻⁶ and 13
× 10-6 per ºC. As a result, depending upon PC formulation, the common range of values
for the coefficient of thermal expansion of these materials is between 20 × 10-6 and 40 ×
10-6 per ºC (for temperatures ranges between 10ºC and 40ºC).
As stated earlier, PC materials are often used to repair Portland cement concrete
structures. From the previous chapter, it is already known, that PCs have in general
higher coefficient of thermal expansion than Portland cement concretes as polymers have
higher thermal coefficients than hydrated cement paste. In addition, the variation of
IV. PHYSICAL AND STATIC MECHANICAL PROPERTIES OF PM FORMULATIONS
IV-18
thermal expansion of polymeric materials within the common temperature ranges is
higher than that one that occurs for hydraulic concretes. Therefore, thermal behavior
analysis of these repair materials, in terms of thermal expansion, is of crucial importance.
4.2.4.1 Usual test methods for CTE of PC materials
Different test methods, based on different standards, are being used to determine the
linear coefficients of thermal expansion of PC materials, and it seems there is no
consensus between them (ASTM:C:351 2000; ASTM:E:228 1989; RILEM 1995e).
Applied procedure to measure length change, the specimen geometry and analyzed
temperature range are the main discussion subjects.
The test method described on ASTM norm E 228, covers the determination of linear
thermal expansion of solid materials over the temperature range of –180ºC to 900ºC,
using vitreous silica dilatometers. This method can be applied to mortars and composites,
among other solid materials. A transducer (dial gage or differential transducer) is
commonly used for measuring the difference in length and a caliper is used to measure
the reference length of the specimen. Length specimen is dependent of the transducer
accuracy, and the tube and rod type of dilatometer apparatus determines the dimensions
of the cross-section specimen. The accuracy of this method is strongly dependent of the
precision of length and temperature measurements, as well as the calibration of the
dilatometer. In addition, the method requires a special device, not commonly available on
research labs, and the specified specimen geometry is not easily reached by casting
process.
Recently, the ASTM standard test method for linear shrinkage and coefficient of thermal
expansion of chemical-resistant mortars, grouts and monolithic surfaces, the ASTM
C531, was adjusted in order to extend its application to polymer concretes. According to
this method, thermal expansion of the material is evaluated by means of the average of
coefficient of thermal expansion between room temperature and 100ºC. Length change is
measured, through a micrometer, between special metal studs embedded in each end of
the specimens (bars of square cross-section 25×25 mm2 and 250 mm length). The
measurements are performed after the conditioning of the specimens, for at least 16
hours, at each temperature level. The precision of this method has not yet been

IV. PHYSICAL AND STATIC MECHANICAL PROPERTIES OF PM FORMULATIONS
IV-19
established. However, it is obvious that it will depend of user skill. The measurements at
the highest temperature (100ºC) must be done very quickly, and the specimens must be
removed, one at a time, at a rate that does not allow the temperature of the oven to drop
below the established temperature. This method presents yet another drawback, which is
the need to use special moulds that enables the moulding bars with the metal studs
embedded at each end. On the other hand, the mean coefficient between 23ºC and 100ºC,
determined by this method, gives only a rough idea of thermal expansion behaviour of
resin concretes and mortars.
RILEM PC-13 norm, presented by Technical Committee 113: Test-Methods for
Concrete-Polymer Composites, also specifies a test method for coefficient of thermal
expansion of polymer concrete and mortar. In this method, lengths are measured by
means of a length comparator, which must be capable of pressing on gage studs
embedded on the sides of the specimens, at a gage length of 250mm. Prismatic
specimens, with square cross-section of 100 mm and 400 mm length, are recommended.
Thermal expansion is analysed over the temperature range of 20ºC to 80ºC, with stepwise
measurements of 20ºC. A thermostatic water bath, with sufficient capacity for the
immersion of the specimens, is used to control the temperature. Water temperature is
raised at a rate of 20ºC/h and held constant in each step for 2 hours. The mean coefficient
of thermal expansion is calculated as the slope of the straight line that better expresses the
relationship between thermal expansion and water temperature. This norm is not very
clear about the way the measurements should be done: with the length comparator also
immersed in the thermostatic bath, removing the specimens to make the measurements,
or providing studs with enough length to allow the placement of the length comparator
outside the bath. Regardless of this last remark, and considering all possible
interpretations, this test procedure does not seem very practical.
Some researchers, based on existent standards applicable to ceramic tiles and cement
pastes, developed their own methods for determination of the coefficient of thermal
expansion of PC materials (Cano et al. 1998). However, these methods also present the
shortcomings resulting from the mechanical process used to measure length changes of
the specimens. Thermal strain of polymer concrete and mortars is normally not a linear
function of temperature. Methods of measuring the expansion coefficient, by averaging

IV. PHYSICAL AND STATIC MECHANICAL PROPERTIES OF PM FORMULATIONS
IV-20
the thermal strain over a large temperature range of many degrees, may result in failure to
determine the variation in the coefficient of thermal expansion of these materials.
4.2.4.2 Applied test method for determining CTE of PM formulations
Previous studies, conducted by Wheat and co-workers (1995), showed that length change
measurements, required to determine the coefficients of thermal expansion of PCs, could
be made by electrical strain gages. This measuring process allows for a continuously
monitoring thermal strain as function of temperature. Therefore, information on how
coefficient of thermal expansion changes with temperature is obtained.
Ideally, a strain gage bonded to a test part would respond only to the applied strain in the
part, and it would be unaffected by other surrounding variables. Unfortunately, the
resistance strain gage, as all sensors in general, is somewhat less than perfect. The
electrical resistance of the strain gage varies not only with strain, but with temperature as
well. This temperature-induced resistance change is independent of, and unrelated to, the
strain induced by mechanical and/or thermal stresses in the test object to which the strain
gage is bonded. It is purely due to temperature change, and is thus called the thermal
output of the gage.
Two concurrent and algebraically additive effects cause this phenomenon, sometimes
referred to as ‘temperature-induced apparent strain’. First, the electrical resistivity of the
grid conductor is temperature dependent; and, as a result, the gage resistance varies with
temperature. The second contribution to thermal output is due to the differential thermal
expansion between the grid conductor and the test part or substrate material to which the
gage is bonded. Because the grid is, by design, strain sensitive, the gage exhibits a
resistance change proportional to the differential expansion. The errors due to thermal
output can become extremely large as temperatures deviate from the arbitrary reference
temperature (ordinarily, room temperature). Additionally to thermal output errors, the
relation between strain and resistance change, the ‘gage factor’, varies with temperature,
inducing more measuring errors.
However, using self-temperature-compensated strain gages, which employ specially
processed alloys, it is possible to minimize the thermal output over a wide temperature
range, as long as they are applied to test materials with thermal expansion coefficients for

IV. PHYSICAL AND STATIC MECHANICAL PROPERTIES OF PM FORMULATIONS
IV-21
which they are intended. Depending upon the test temperature, higher accuracy can be
obtained making additional corrections, for the thermal output and gage factor variation,
in the strain measurement. Engineering data sheet supplied in each package, series and lot
of self-temperature-compensated strain gages, provides polynomial equations for the
correspondent thermal output curve and gage factor variation with temperature. It should
be noted that the thermal output data are only applicable to the strain gages of the
designated lot number, applied to test material with the same coefficient of thermal
expansion than the type of material used in determining the supplied thermal output
curves.
To measure strains induced only by thermal effects, in a material not mechanically
loaded, self-temperature-compensated strain gages indicated for test materials without
thermal expansion, can be applied. This way, the effect of resistance change with
temperature is compensated; the thermal expansion of grid conductor is also taken into
account, but not the thermal expansion of the test part. Therefore, strain data obtained
from tests are only due to the thermal expansion of test material.
Ordinary strain gages, not self-temperature-compensated, can however be applied to
measure strains induced by thermal effects, as specified by Wheat et al (1995), and also
recommended in ASTM D5335 (2000). However, this practice requires the use of
compensate (dummy) gage bonded in a test material that has a known reproducible
thermal expansion. On the other hand, this procedure yields less accuracy, as the thermal
output error, due to the differential thermal expansion between the grid conductor and the
test part, still remains.
In this research work, to measure the strains induced by temperature changes on epoxy
and polyester PM formulations, strain gages with constant alloy in self-temperature
compensated form for structural materials with coefficient equal to zero, were used. This
process of length variation measurement provides more consistent and reliable results.
The variation of the CTE of PM formulations with temperature was also analyzed. It has
been found that polymer concrete and mortars have lower coefficients of thermal
expansion at lower temperatures than at higher temperatures. Plots of strains versus
temperature are often bilinear, indicating a sharp change in the coefficient of thermal
expansion (Wheat et al. 1995). To determine how this discontinuity varies for these two

IV. PHYSICAL AND STATIC MECHANICAL PROPERTIES OF PM FORMULATIONS
IV-22
materials, specimens of both formulations were tested for several temperature ranges
between –15ºC and 60ºC.
4.2.4.3 Experimental procedure
i) Specimens’ geometry
Prismatic specimens, with square cross-section of 40×40 mm2 and 100 mm length were
used, but other geometries were possible as long as the specimens have the minimum
dimensions (at least twice the length of the strain gages). All specimens were allowed to
cure, for one day at room temperature and then post-cured at 80ºC for three hours, before
being tested for thermal expansion.
ii) Length change measuring
Length changes measuring were made by strain gages, with constant alloy in self-
temperature compensated form for structural materials without thermal expansion.
Flexible gages with a cast polyamide backing, completely encapsulated, with 6.35 mm
grid length, were used. Three specimens of each PM formulation were instrumented with
one strain gage bonded longitudinally on one of their lateral faces.
In order to test the accuracy of the method for posterior validation, an aluminum alloy
reference specimen (2017 4.0Cu-0.6Mg-0.7Mg-0.5Si), with a known coefficient of
thermal expansion (mean coefficient of thermal expansion, between 20ºC to 100ºC, of
23.6 µm/mº C), was also instrumented and tested (ASM 1991).
Electrical strain gage data were recorded using two data loggers with continuous
acquisition system (SPIDER-8) in eight channels. Strain gage data were registered with the
gage factor setting of the strain indicator at 2.00. Corrections for the gage factor variation
and for the thermal output were performed after data acquisition.
iii) Specimens’ conditioning
Three instrumented specimens of each type of polymer mortar, as well as the aluminum
alloy specimen, were placed in a climatic chamber at room temperature during eight
hours. Strain indicator of data logger was then balanced for zero strain, in all channels.
Afterwards, the temperature was lowered by steps of 12,5ºC to –15ºC, then it was
increased in six increments until +60ºC, and finally, it was decreased by three steps to
IV. PHYSICAL AND STATIC MECHANICAL PROPERTIES OF PM FORMULATIONS
IV-23
room temperature. The heating/cooling rate between temperature levels was
approximately 0.28ºC/minute, and in each step, temperature was held constant for 7.75
hours in order to allow the specimens to reach thermal equilibrium. All specimens were
subjected to a total of three of these cycles.
iv) Data treatment
Strain data used to determining the mean CTE, for each temperature range, was taken
from the last strain measurement in each temperature level or step. At those points, the
thermal equilibrium was already reached and the strain gage readings were constants. The
obtained strain values were then corrected for the thermal output and gage factor
variation according to the following equations:
ε = [ εA – ε T/O (Ti) ] . F* / F(Ti) (4.5)
ε T/O (Ti) = A0 + A1.Ti + A2. Ti2 +A3. Ti
3 + A4. Ti4 (4.6)
F(Ti) = F0 . [1 + V%(Ti)/100 ] (4.7)
where:
- εA is the obtained strain, before any correction;
- ε is the strain magnitude corrected for both thermal output and gage factor variation with temperature;
- ε T/O (Ti) is the thermal output at temperature Ti; - A0, A1, A3 and A4 are the polynomial coefficients of thermal output curve of
gage strain;
- F* is the instrument gage factor set;
- F(Ti) is the strain gage factor at temperature Ti
- F0is the room temperature gage factor;
and - V%(Ti) is the variation of gage factor for temperature Ti;
The coefficients of thermal expansion, for each temperature range, were calculated by
first fitting straights lines between adjacent points of consecutive measurements of
correct strain values and correspondent temperatures (Ei,Ti), and then, determining the
respective slopes, as described in equation (4.8).
α (Ti, Ti+1 ) = [ε (Ti+1)- ε (Ti) ] / [Ti+1- Ti] (4.8)

IV. PHYSICAL AND STATIC MECHANICAL PROPERTIES OF PM FORMULATIONS
IV-24
where:
- α (Ti, Ti+1 ) is the mean coefficient of thermal expansion for temperature range between Ti and Ti+1;
- ε (Ti), ε (Ti+1) is the correct strain magnitudes at temperatures Ti and Ti+1, respectively.
For each polymer mortar formulation and for each temperature range, the mean
coefficient of thermal expansion considered, corresponds to the average of eighteen
values of α(Ti+1, Ti) (2 values per cycle × 3 cycles × 3 specimens).
Dilatation-Temperature curves were obtained considering, for each temperature range,
the expansion of an elementary volume of test material when temperature is raised from
–15ºC to +60ºC. For each temperature range, the expansion was calculated considering
the correspondent coefficient of thermal expansion, as described in equation (4.9).
∆V(Ti,Ti+1)=3[∆T(Ti,Ti+1).α(Ti,Ti+1)]+3[∆T(Ti,Ti+1).α(Ti,Ti+1)]2+[∆T(Ti,Ti+1).α(Ti,Ti+1)]3 (4.9)
where:
- ∆V(Ti,Ti+1) is the expansion of an elementary volume of test material when
temperature is increased from Ti to Ti+1.
- ∆T(Ti,Ti+1) is the temperature variation between Ti and Ti+1.
4.2.4.4 Test results and discussion
i) Mean coefficients of thermal expansion
Strain data acquired by data logger throughout the three cycles, are plotted in Fig. 4.4,
showing the different thermal behaviors of polyester and epoxy PMs when subject to
temperatures changes. These data are not yet treated. In general, polyester mortars
recover the equilibrium quite fast after temperature changes, while epoxy mortars require
more time to stabilize and strain measurements present slightly more scatter.
For each type of PM, the variations of strain with temperature, during the three cycles,
are shown in Fig. 4.5. Strain versus temperature data for specimens of the same
formulation are very similar, and when plotted in the same graph become almost
coincident. In order to make the obtained results more clear, only the strain-temperature
curve of one specimen of each type is presented.
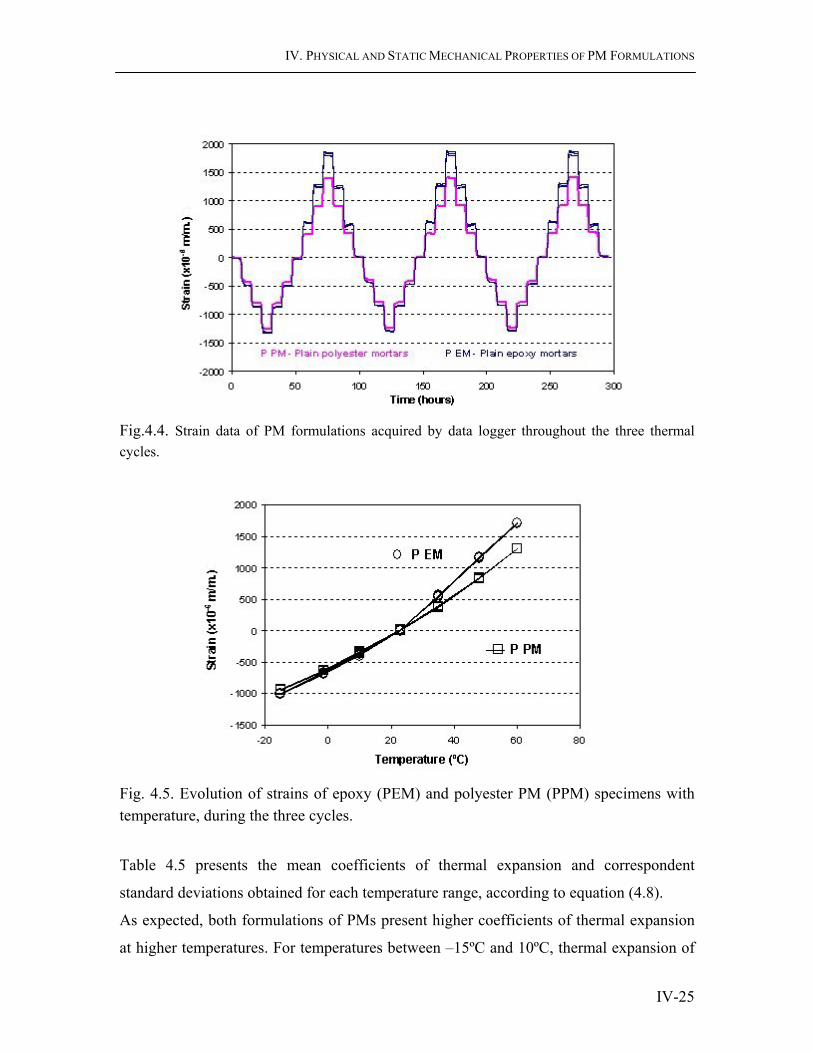
IV. PHYSICAL AND STATIC MECHANICAL PROPERTIES OF PM FORMULATIONS
IV-25
Fig.4.4. Strain data of PM formulations acquired by data logger throughout the three thermal cycles.
Fig. 4.5. Evolution of strains of epoxy (PEM) and polyester PM (PPM) specimens with temperature, during the three cycles.
Table 4.5 presents the mean coefficients of thermal expansion and correspondent
standard deviations obtained for each temperature range, according to equation (4.8).
As expected, both formulations of PMs present higher coefficients of thermal expansion
at higher temperatures. For temperatures between –15ºC and 10ºC, thermal expansion of
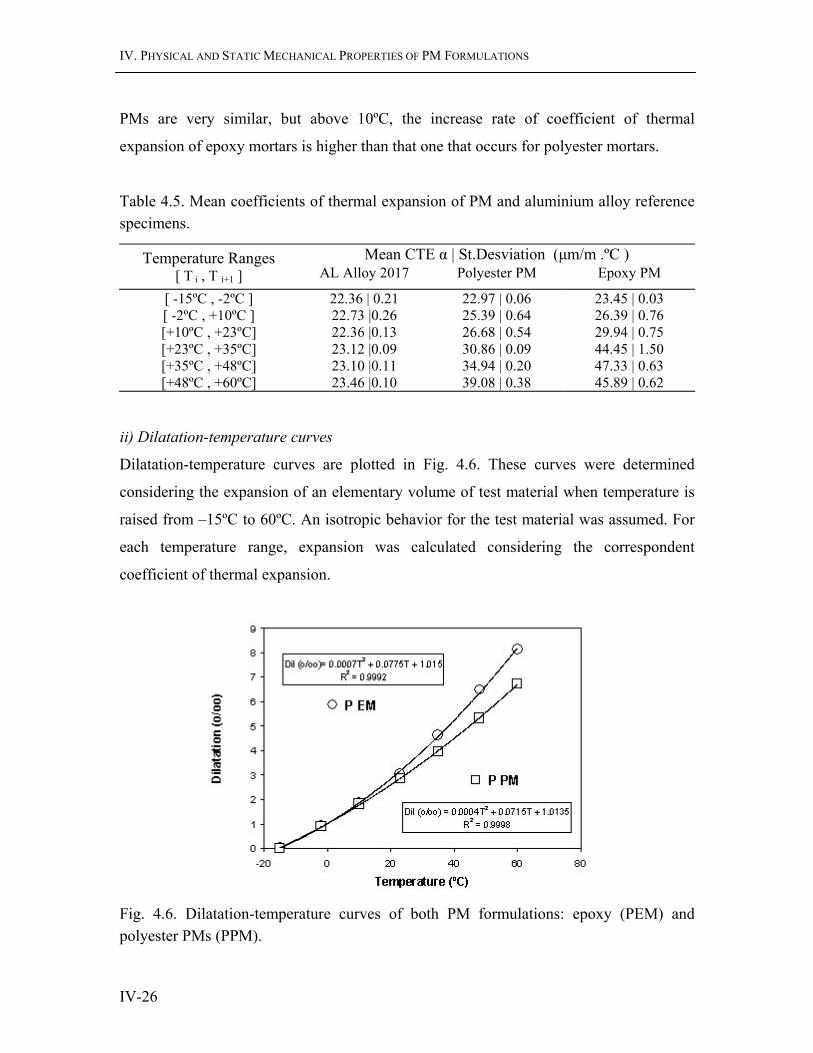
IV. PHYSICAL AND STATIC MECHANICAL PROPERTIES OF PM FORMULATIONS
IV-26
PMs are very similar, but above 10ºC, the increase rate of coefficient of thermal
expansion of epoxy mortars is higher than that one that occurs for polyester mortars.
Table 4.5. Mean coefficients of thermal expansion of PM and aluminium alloy reference specimens.
Mean CTE α | St.Desviation (µm/m .ºC ) Temperature Ranges [ T i , T i+1 ] AL Alloy 2017 Polyester PM Epoxy PM
[ -15ºC , -2ºC ] 22.36 | 0.21 22.97 | 0.06 23.45 | 0.03 [ -2ºC , +10ºC ] 22.73 |0.26 25.39 | 0.64 26.39 | 0.76 [+10ºC , +23ºC] 22.36 |0.13 26.68 | 0.54 29.94 | 0.75 [+23ºC , +35ºC] 23.12 |0.09 30.86 | 0.09 44.45 | 1.50 [+35ºC , +48ºC] 23.10 |0.11 34.94 | 0.20 47.33 | 0.63 [+48ºC , +60ºC] 23.46 |0.10 39.08 | 0.38 45.89 | 0.62
ii) Dilatation-temperature curves
Dilatation-temperature curves are plotted in Fig. 4.6. These curves were determined
considering the expansion of an elementary volume of test material when temperature is
raised from –15ºC to 60ºC. An isotropic behavior for the test material was assumed. For
each temperature range, expansion was calculated considering the correspondent
coefficient of thermal expansion.
Fig. 4.6. Dilatation-temperature curves of both PM formulations: epoxy (PEM) and polyester PMs (PPM).

IV. PHYSICAL AND STATIC MECHANICAL PROPERTIES OF PM FORMULATIONS
IV-27
Dilatation-temperature curves of both PM formulations, between –15ºC and 60ºC, are
more accurately predicted through an approximation to a parabolic law than a bilinear
law. Considering these approximations, the variation of instantaneous coefficients of
thermal expansion of both formulations with temperature, follow linear laws, as
illustrated in Fig. 4.7.
Fig. 4.7. Variation laws of instantaneous linear coefficient of thermal expansion with temperature of epoxy (PEM) and polyester (PPM) polymer mortars.
Regardless the above considerations, for practical uses, it can be considered that
dilatation-temperature curves of both type of PMs follow bilinear laws, with discontinuity
points both located at 23ºC. Corresponding mean coefficients of thermal expansion, for
temperatures below and above these points, are presented at Table 4.6.
Table 4.6. Mean coefficients of thermal expansion of PM formulations considering a bilinear law for strain-temperature curves.
Mean Linear Coefficient of Thermal Expansion α (µm/m .ºC ) Temperature Ranges
[ T i , T i+1 ] Polyester PM Epoxy PM
[ -15ºC , +23ºC ] 25 27 [ +23ºC , +60ºC ] 34 46

IV. PHYSICAL AND STATIC MECHANICAL PROPERTIES OF PM FORMULATIONS
IV-28
iii) Validation of the method
Evolution of strains as function of temperature of the reference specimen used in this
study, an aluminium alloy (1207), is plotted in Fig. 4.8. The known literature value of the
coefficient of thermal expansion of this material is the mean coefficient between 20ºC
and 100ºC: α (20ºC, 100ºC) = 23.6 µm / m.ºC.
The measured values of strain and temperature (Ti, εi) throughout the thermal cycles were
used to calculate, by inter and extrapolation processes, the expected values for ε20ºC and
ε100ºC. The correspondent slope of the straight line between the two points, (20ºC, ε20ºC)
and (100ºC, ε100ºC), gave the expected value for the mean coefficient of thermal expansion
of the aluminum alloy within the temperature range of 20ºC to 100ºC. The described
calculation allowed assessing the accuracy of the applied method.
Fig. 4.8. Plot of strains versus temperature of aluminum alloy reference specimen. Calculation of expected value of its mean coefficient of thermal expansion between 20ºC and 100ºC.
Only a small difference of 0.5% was found between the literature value (23.6 µm/m.ºC)
and the expected value obtained by this method (23.48 µm/m.ºC), which is a good
indicator of the accuracy and precision of applied methodology for determining the
thermal expansion of PC materials.
IV. PHYSICAL AND STATIC MECHANICAL PROPERTIES OF PM FORMULATIONS
IV-29
4.2.4.5 Conclusions
Based on test results, the following conclusions can be drawn:
• Both formulations of PMs present higher coefficients of thermal expansion at higher
temperatures. For temperatures ranges between –15ºC and +10ºC, thermal expansion
of both binder formulations are very similar, but above +10ºC, the increase rate of
coefficient of thermal expansion of epoxy mortars is higher than the one found for
polyester mortars.
• For both formulations, the variation of thermal expansion with temperature follows a
polynomial law rather than a bilinear law. Therefore, it can be concluded that
coefficients of thermal expansion of these materials vary continuously within the
temperature range between -15ºC and +60ºC.
• For practical use, when a higher precision is not required, the following values for the
mean coefficients of thermal expansion of epoxy and polyester PM formulations, may
be considered: for temperatures ranges below room temperature, the coefficient
values of 25 and 27 µm/mºC for polyester and epoxy mortars, respectively; and for
temperatures ranges above this point, the correspondent values of 34 and 46 µm/mºC.
The method applied to determine the coefficient of thermal expansion of PM
formulations is quite precise, with excellent accuracy for practical purposes. The method
does not require any specific devices or special equipment, allows a higher freedom in
terms of specimen geometry and it is very simple to implement, which make it a good
alternative to the conventional methods.

IV. PHYSICAL AND STATIC MECHANICAL PROPERTIES OF PM FORMULATIONS
IV-30
4.3 Short-Term Mechanical Properties
4.3.1 Flexural Properties
In PC materials, the differences among the flexural parameters are higher than in the
compression study. Therefore, flexural tests have been widely used for mechanically
ranking the different PC types, in detriment of the compression ones, which are more
adjusted for developing this purpose in conventional cement concretes (San José 2006).
According to this, throughout this thesis, flexural strength was systematically used for the
assessment of PMs behavior under different environment conditions. This procedure
enabled a great number of flexural test results (control specimens), which could now be
used for a feasible statistical analysis.
4.3.1.1 Test and calculation procedures
i) Flexural strength
All flexural test results of control prismatic specimens of both formulations tested in
three-point bending throughout the global present study were computed for this analysis.
All specimens were tested in bending up to failure at the loading rate of 1 mm.min-1, with
a span length of 100 mm, according to RILEM CPT PCM-8 test method (see chapter III for
more information regarding test procedure and testing set-up).
The specifications of RILEM standard, in terms of specimen geometry and span length,
are similar to those specified in ASTM C348-02, standard test method for flexural strength
of hydraulic cement mortars (2002). In both standards, shear effect is not taken into
account on calculation procedure of flexural strength. Despite the very short span length
compared with specimen thickness, shear effect is disregarded. Concrete and mortars are
assumed as isotropic materials and the theory of plane cross sections is used. Flexural
strength, considered as the strength under normal stresses, is determined applying
equation well known from the strength of materials.

IV. PHYSICAL AND STATIC MECHANICAL PROPERTIES OF PM FORMULATIONS
IV-31
Nevertheless, corrections could be made but obtained results could not be compared to
those obtained on other studies on cement or polymer mortars, which usually apply the
above standards. On the other hand, analytical research shows that the effect of shear on
the stress distribution over the height of a bar is considerably less than the effect on
deflection. According to Tarnopol’skii and Kincis (1984), for sufficient practical
accuracy, the deviations of the normal stress distributions from linear, and tangential
stresses from parabolic, can be disregarded if parameter k is less than 1.2, where k, for
isotropic materials is given by the following expression:
( )h = π 2 1+2 l
k µ (4.10)
where h is the specimen height, l is the span length and µ is the Poisson’s ratio.
In this particular case, for Poisson’ ratio values around 0.22 to 0.26 (values obtained
experimentally), k values between 0.98 and 1.00 were found. Thus, flexural strength,
considered as the strength under normal stresses, was determined applying equation (3.1)
from the strength of materials.
i) Flexural elasticity modulus
Load-deflection curves obtained from flexural tests were used to determine secant
elasticity modulus in accordance with the procedure described in the ASTM C580-02,
standard test method for flexural strength and elasticity modulus of chemical-resistant
mortars, grouts and polymer concretes (2002).
According to this standard, once again, shear effect is not considered in the calculation
procedure. Deflections are assumed to be small and the theory of plane cross sections is
used. For a simply supported prismatic specimen, with a concentrated load P in the
middle of span l, and without allowance for shear, elasticity modulus (E) is easily
calculated only by means of the testing variables, load P and deflection at midspan wmax,
by:
E = P l3 / 48 I wmax (4.11)
where I is the second moment of area of the cross section of the specimen (I =bh3/12).
However, modulus of elasticity determined by equation (4.11) is fictitious since it does
not reflect the effect of shear stress, which is so much higher as greater the height to span

IV. PHYSICAL AND STATIC MECHANICAL PROPERTIES OF PM FORMULATIONS
IV-32
ratio (h/l). Therefore, and taking into consideration that shear has a larger effect on
deflection than on the distribution of stresses, shear effect was here taken into account on
calculation procedure of flexural elasticity modulus, through Timoshenko simplified
approach for the deflection at midspan of a rectangular bar with allowance for shear
(Tarnopol'skii and Kincis 1984):
wmax = w*max [ 1 + α (h/l)2 E/G ] = w*max (1 + 0.486 k 2) (4.12)
where w*max is the maximum deflection of the bar without allowance for shear (see
equation 4.11); h is the height of the bar; α is a coefficient depending on cross-sectional
of the bar (α=1.2 for a rectangular cross section); and k is the coefficient given by
equation (4.10).
In the above expression, elastic to shear modulus ratio was obtained considering polymer
mortars as isotropic materials.
4.3.1.2 Test results and discussion
i) Flexural strength
The distributions of the flexural strength of both types of test specimens are represented,
graphically, by the histograms shown in Fig. 4.9. The data are also depicted in a
probability scale in Fig. 4.10.
Fig. 4.9. Histograms for flexural strength distributions of epoxy (at left) and polyester (at right) PM formulations.
0
5
10
15
20
25
30
<33 33-35 35-37 37-39 39-41 41-43 43-45 45-47 >47
Flexural Strength (MPa)
Num
ber o
f Spe
cim
ens
Epoxy PM
0
5
10
15
20
25
<1818
-1919
-2020
-2121
-2222
-2323
-2424
-2525
-2626
-2727
-2828
-2929
-3030
-3131
-3232
-3333
-34 >34
Flexural Strength (MPa)
First batchesPosterior batches
Polyester PM
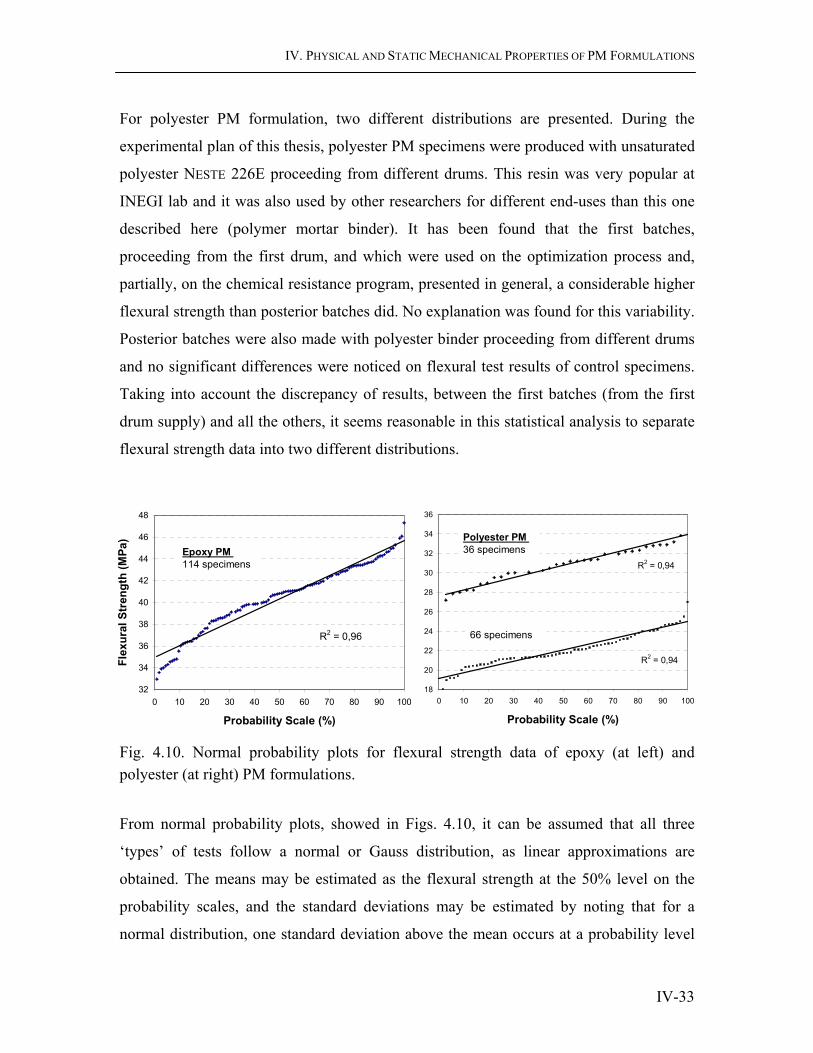
IV. PHYSICAL AND STATIC MECHANICAL PROPERTIES OF PM FORMULATIONS
IV-33
For polyester PM formulation, two different distributions are presented. During the
experimental plan of this thesis, polyester PM specimens were produced with unsaturated
polyester NESTE 226E proceeding from different drums. This resin was very popular at
INEGI lab and it was also used by other researchers for different end-uses than this one
described here (polymer mortar binder). It has been found that the first batches,
proceeding from the first drum, and which were used on the optimization process and,
partially, on the chemical resistance program, presented in general, a considerable higher
flexural strength than posterior batches did. No explanation was found for this variability.
Posterior batches were also made with polyester binder proceeding from different drums
and no significant differences were noticed on flexural test results of control specimens.
Taking into account the discrepancy of results, between the first batches (from the first
drum supply) and all the others, it seems reasonable in this statistical analysis to separate
flexural strength data into two different distributions.
Fig. 4.10. Normal probability plots for flexural strength data of epoxy (at left) and polyester (at right) PM formulations.
From normal probability plots, showed in Figs. 4.10, it can be assumed that all three
‘types’ of tests follow a normal or Gauss distribution, as linear approximations are
obtained. The means may be estimated as the flexural strength at the 50% level on the
probability scales, and the standard deviations may be estimated by noting that for a
normal distribution, one standard deviation above the mean occurs at a probability level
R2 = 0,96
32
34
36
38
40
42
44
46
48
0 10 20 30 40 50 60 70 80 90 100
Probability Scale (%)
Flex
ural
Str
engt
h (M
Pa)
Epoxy PM 114 specimens R2 = 0,94
R2 = 0,94
18
20
22
24
26
28
30
32
34
36
0 10 20 30 40 50 60 70 80 90 100
Probability Scale (%)
Polyester PM 36 specimens
66 specimens
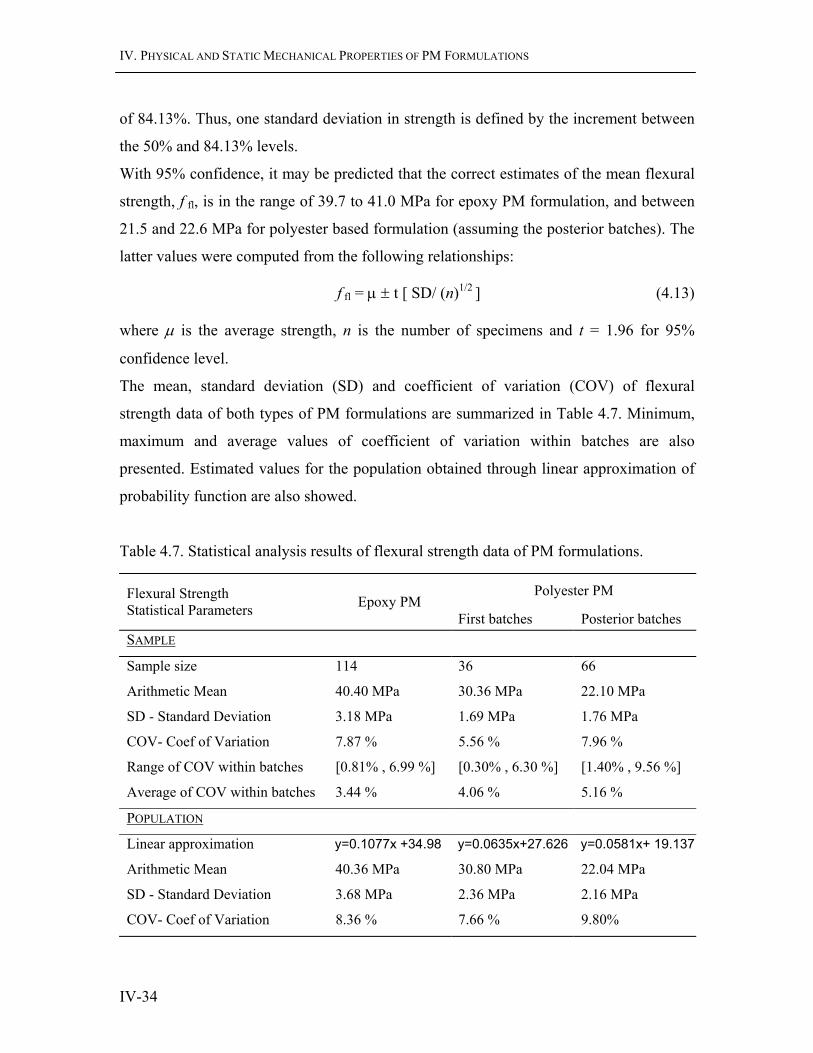
IV. PHYSICAL AND STATIC MECHANICAL PROPERTIES OF PM FORMULATIONS
IV-34
of 84.13%. Thus, one standard deviation in strength is defined by the increment between
the 50% and 84.13% levels.
With 95% confidence, it may be predicted that the correct estimates of the mean flexural
strength, f fl, is in the range of 39.7 to 41.0 MPa for epoxy PM formulation, and between
21.5 and 22.6 MPa for polyester based formulation (assuming the posterior batches). The
latter values were computed from the following relationships:
f fl = µ ± t [ SD/ (n)1/2 ] (4.13)
where µ is the average strength, n is the number of specimens and t = 1.96 for 95%
confidence level.
The mean, standard deviation (SD) and coefficient of variation (COV) of flexural
strength data of both types of PM formulations are summarized in Table 4.7. Minimum,
maximum and average values of coefficient of variation within batches are also
presented. Estimated values for the population obtained through linear approximation of
probability function are also showed.
Table 4.7. Statistical analysis results of flexural strength data of PM formulations.
Polyester PM Flexural Strength Statistical Parameters Epoxy PM
First batches Posterior batches SAMPLE
Sample size 114 36 66
Arithmetic Mean 40.40 MPa 30.36 MPa 22.10 MPa
SD - Standard Deviation 3.18 MPa 1.69 MPa 1.76 MPa
COV- Coef of Variation 7.87 % 5.56 % 7.96 %
Range of COV within batches [0.81% , 6.99 %] [0.30% , 6.30 %] [1.40% , 9.56 %]
Average of COV within batches 3.44 % 4.06 % 5.16 %
POPULATION
Linear approximation y=0.1077x +34.98 y=0.0635x+27.626 y=0.0581x+ 19.137
Arithmetic Mean 40.36 MPa 30.80 MPa 22.04 MPa
SD - Standard Deviation 3.68 MPa 2.36 MPa 2.16 MPa
COV- Coef of Variation 8.36 % 7.66 % 9.80%

IV. PHYSICAL AND STATIC MECHANICAL PROPERTIES OF PM FORMULATIONS
IV-35
Average flexural strength of epoxy PM formulation is rather near the upper limit of the
common values found for this type of mortar, which are usually within the range of 15
MPa to 45 MPa, as function of binder content. This feature reinforces the assumption that
a high quality PM has been developed.
Relatively to polyester PM formulation, average flexural strength is within the range of
values commonly found for these types of resin based mortars (between 13 MPa and 40
MPa). Nevertheless, the mean flexural strength obtained for the first batches of polyester
PMs was unusually high for mortars with 20% in weight of polyester binder.
In order to determine whether the two sets of data corresponding to polyester PM flexural
test results were the ‘same’ or ‘different’, the means were compared by using the ‘t test’
based on the student’s distribution. The T-test revealed that the two sets of data were in
fact, statistically speaking, largely different and could not be considered the same system.
In testing the null hypothesis at the 5% level of significance, t-test value was considerably
above the critical value. Some explanations could be advanced for the occurrence, but
none of them is certain. Poor quality control system of the producer? Lack of styrene or
accelerator in the posterior drum supplies? Deficient mixing of the drum before pouring
the required resin? Nevertheless, the occurrence did not compromise the present research
work as all conclusions were made with basis, mostly, on relative results and not on
absolute values.
Hereinafter, for polyester PM formulation, the distribution with the larger number of
specimens will be assumed as more representative of material’s behavior.
The variability of flexural strength data of PM formulations, assessed by correspondent
coefficient of variations, are quite good taking into account that no support system was
used during casting process for compaction and vibration. Until now, there is not much
available information on the variability of strength properties of PC materials to use as
comparison basis. Mebarkia (1993) reported a coefficient of variation of 5% for the
flexural test data of polyester PC formulation with a sample size of 15 specimens; Hsu
(1984) found the COV value of 8% for the same type of test data of MMA based PC, but
with a larger sample size (39 specimens). Both studies revealed that the coefficient of
variation depends on the type of testing, as similar trends were observed regarding the
variation of COV with the type of strength test data. Highest coefficients were found for
IV. PHYSICAL AND STATIC MECHANICAL PROPERTIES OF PM FORMULATIONS
IV-36
splitting tensile tests (16% and 12% for, respectively, polyester and MMA PCs) and
lowest for compression tests (4% and 5%, for the same PC formulations). One of the few
studies on PC materials in which uniaxial tensile tests were performed, reported a COV
of 11% for the test data of seventeen MMA based PC specimens (Kim 1986).
Nevertheless, irrespectively of the testing type, COV value will always be strongly
related with the reproducibility of the manufacture technology applied.
ii) Minimum number of tests required
In order to determine, for each formulation, the minimum number of future tests required
to ensure that the committed error in average measured value, with 95% confidence, is
kept below 5%, the following relationship was used (Soroushian et al. 1993):
N = t 2 COV 2 / Er2 (4.14)
where N is the minimum number of test specimens; t is the value of student’s distribution
for the specified confidence level (t=1.645 for large sample size at 95% confidence
level); COV is the coefficient of variation; and Er is the maximum error in the average
measured value (5%).
For the coefficient of variation (COV) of the ‘samples’, a minimum number of 7 test
specimens was found for both formulations. However, if the average values of COV
within batches is computed instead of COV of global distributions, the minimum number
of tests decreases for 2, as variability within batches is lower than in the global
distribution. This result sustain the reliability of the experimental work done throughout
this thesis, as, in all the experiments involving flexural resistance, a minimum number of
3 flexural test results was computed for material assessment behavior. Moreover, in each
part of the experimental program, specimens belonging to same batch were used.
iii) Flexural elasticity modulus
Secant elasticity modulus of both PM formulations, determined by means of load-
defection curves, is presented in Table 4.8. Standard deviation and correspondent
coefficient of variation are also presented. Statistical analysis was performed for minor
set of data than those used for flexural strength analysis. The reason for the different
criterion is related with the treatment data required by each test, which is very time
consuming, as described in the following:

IV. PHYSICAL AND STATIC MECHANICAL PROPERTIES OF PM FORMULATIONS
IV-37
Firstly, an initial correction of the original load-defection curves is required to eliminate
the initial small slope branch, characterized by high deflection to load ratios, caused by
specimen accommodation to nose supports.
Then, a second adjustment is necessary to remove the typical stepwise of the curve, at
approximately 3.5 kN to 4.0 kN load level. The likely reason for this ‘stair’ effect on
flexural curve might be related to a slight indentation on specimen surface. Prismatic
specimen surfaces generally tend to be richer in resin content, and consequently, less
tough than core material. Thus, this systematic bump in the curve does not reflect a
material characteristic; instead, it rather reflects a surface material characteristic. The
same effect was already noticed in other research works. For large size specimens, this
effect is not noticeable and can be disregarded.
Al the above procedures require a minutiae data treatment taking into account that each
load-deflection curve contains more than one hundred points.
Table 4.8. Statistical analysis results of flexural elasticity modulus of PM formulations.
Elasticity Modulus Statistical Parameters Epoxy PM Polyester PM*
Sample size 6 6
Arithmetic Mean 3.92 GPa 3.21 GPa
SD - Standard Deviation 0.06 GPa 0.13 GPa
COV- Coef of Variation 1.5 % 4.0 %
* Test results of specimens proceeding from posterior batches.
The results obtained for flexural elasticity modulus of both PM formulations are largely
behind the expected range of values. Even considering the corrections for allowance in
shear, obtained values are very low and do not seem plausible. It is not reliable that PMs
have stiffness in the same order than the resin binders, even considering their high
content. Since introduced simplifications induce to large errors, this procedure is not
suitable for the determination of elasticity modulus. Another approach must be thought in
order to determine this parameter, either by bonded gages in the outer surface of the
specimens, to directly measure the tensile strains in a four-point bending test (see section
4.3.3.1), or by increasing the span to height ratio in order to reduce the shear effect. Until
then, obtained results must be disregarded.

IV. PHYSICAL AND STATIC MECHANICAL PROPERTIES OF PM FORMULATIONS
IV-38
4.3.2 Compressive Properties
The most common of all tests on hardened conventional concrete is the compressive
strength test, partially because it is an easy test to perform, and partially because many of
the desirable characteristics of concrete are quantitatively related to its compressive
strength.
Although flexural strength test has been considered as the most relevant one for PC
materials, as more indicative of the strength characteristics of these materials,
compressive test is also of major significance, mainly because of the intrinsic importance
of material’s compressive strength in structural design.
The complete stress-strain relationships in axial compression are also important to better
understand material’s behavior, being an important tool for accurate prediction of
deflection, toughness and dynamic response.
4.3.2.1 Test and calculation procedures
i) Compressive strength, compressive elasticity modulus and Poisson’s ratio
In order to determine compressive strength of PM formulations, two types of
compression tests were performed: compression tests on cylinder specimens, with 50 mm
diameter and 100 mm height, and compression tests on broken parts of standard prismatic
specimens (40×40×160 mm3) tested in bending. A universal mechanical testing machine
INSTRON, shown in Fig. 3.7, with a load cell of 300 kN was use for that purpose.
Prior testing, the end surfaces of cylinder specimens were ground on a geological rock
grinder until they were smooth, flat and perpendicular to the axis of the specimen. All
specimens were allowed to cure at room temperature during one day, and post cured at
80ºC during three hours, before being tested in compression.
Cylinder PM specimens were tested in compression at the loading rate of 1.25 mm.min-1
according to RILEM PC-5 test method (1995c). With the purpose of determining secant
elasticity modulus, three specimens were instrumented with wire strain gages bonded to
two diametrically opposite gage lines parallel to the axis of the specimen, in accordance
with procedures described in RILEM PC-8 and ASTM C 469 standards (ASTM:C469-94
1994; RILEM 1995f). In order to obtain Poisson’s ratio, one specimen of each series was
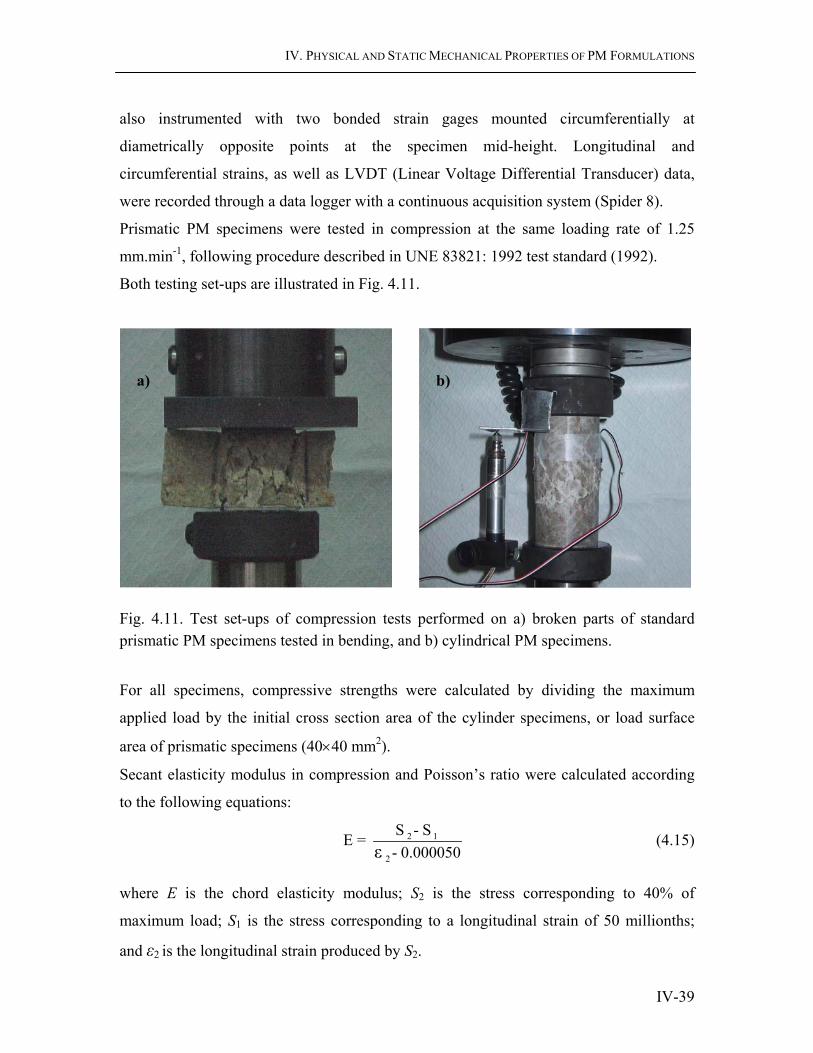
IV. PHYSICAL AND STATIC MECHANICAL PROPERTIES OF PM FORMULATIONS
IV-39
also instrumented with two bonded strain gages mounted circumferentially at
diametrically opposite points at the specimen mid-height. Longitudinal and
circumferential strains, as well as LVDT (Linear Voltage Differential Transducer) data,
were recorded through a data logger with a continuous acquisition system (Spider 8).
Prismatic PM specimens were tested in compression at the same loading rate of 1.25
mm.min-1, following procedure described in UNE 83821: 1992 test standard (1992).
Both testing set-ups are illustrated in Fig. 4.11.
Fig. 4.11. Test set-ups of compression tests performed on a) broken parts of standard prismatic PM specimens tested in bending, and b) cylindrical PM specimens.
For all specimens, compressive strengths were calculated by dividing the maximum
applied load by the initial cross section area of the cylinder specimens, or load surface
area of prismatic specimens (40×40 mm2).
Secant elasticity modulus in compression and Poisson’s ratio were calculated according
to the following equations:
2 1
2
S - S E = - 0.000050ε
(4.15)
where E is the chord elasticity modulus; S2 is the stress corresponding to 40% of
maximum load; S1 is the stress corresponding to a longitudinal strain of 50 millionths;
and ε2 is the longitudinal strain produced by S2.
a) b)

IV. PHYSICAL AND STATIC MECHANICAL PROPERTIES OF PM FORMULATIONS
IV-40
t 2 t 1
2
- = - 0.000050ε ε
εν (4.16)
where ν is the Poisson’s ratio, and ε t 2 and ε t 1 are the transverse strains at mid-height of
the specimen, produced respectively by stresses S2 and S1.
iii) Stress-strain relationships
Experimental stress-strain curves were obtained by means of load-strain data recorded
during compression tests performed on instrumented cylinder PM specimens.
The ascending part of the stress-strain curve in axial compression is easier to obtain
experimentally than the descending part. The difficulties arise from the fact that the shape
of the softening branch is dependent not only on the concrete material but mainly on the
test conditions. Specimen height to diameter ratio, control mode of testing machine
(displacement or load control mode), strain or load rate, type of strain gage and gage
length are some of the influencing factors.
Several empirical relationships have been developed to fit the experimental stress-strain
curves. In general, all of them are function of three experimental parameters: peak stress
fc , strain at peak stress ε c , and initial tangent elastic modulus E0. Additional constants,
obtained by means of experimental data, are usually introduced to fit the steep of
descending branch.
The usual empirical relationships can be categorized into three main classes.
• The first class consists of two separate relations, one for the ascending part and
the other for the descending part. One example of this type of empirical
relationship can be found in research work carried out by Zhang et Guo (1987),
concerning the tensile behavior of conventional portland cement concrete.
• The second category consists of one equation but with two sets of constants, for
the ascending and the descending curves. Fanella et Naaman (1985) purposed an
empirical relationship of this type to describe the compressive stress-strain curves
of fiber reinforced cement mortars, which was also applied, with success, by
Mebarkia (1993) to feet the compressive stress-strain curves of glass fiber
reinforced polymer mortars
IV. PHYSICAL AND STATIC MECHANICAL PROPERTIES OF PM FORMULATIONS
IV-41
• The third category is represented by one equation with the same constants for the
complete stress-strain curve. An example of such equation may be as follows
(Carreira and Chu 1985):
Y = X / [ q + (1-q) X 1/(1-q) ] (4.17a)
with Y and X given by the following expressions:
Y = σ / fc (4.17b)
X = ε / ε c (4.17c)
q = Ec / E0 (4.17d)
where σ and fc are, respectively, the stress and the peak stress; ε and ε c are,
respectively, the strain and the strain at peak stress; and q is the ratio of secant
elasticity modulus at peak stress (Ec), to initial elastic modulus (E0); and reflects
the nonlinear pre-peak behavior of the stress-strain relationship.
The above equation (4.17a) has one parameter q. A two-parameter relationship,
which constitutes one of the most interesting general expressions, was proposed
by Sargin (1979) and may be written as:
Y = [ k X + (k’-1) X2 ] / [ 1 + (k-2) X + k’X2 ] (4.18)
where X and Y are defined by Eqs. (4.17b) and (4.17c); the parameter k is the
ratio of initial elasticity modulus (E0) to secant elasticity modulus at peak stress
(Ec), e.g k =1/q, with q defined by Eq. (4.17d); and the second parameter k’,
which allows to adjust the steep of post-peak curve, is determined by the least-
squares fit of the predicted to the experimental data points.
In order to fit the obtained experimental stress-strain curves, both empirical relationships
described in Eqs. (4.17) and (4.18) were applied.
4.3.2.2 Test results and discussion
i) Compressive strength, compressive elasticity modulus and Poisson’s ratio
For both PM formulations, obtained results of compression tests performed on cylinder
and prismatic specimens are presented throughout Table 4.9.

IV. PHYSICAL AND STATIC MECHANICAL PROPERTIES OF PM FORMULATIONS
IV-42
Stress-strain curves obtained from compression tests performed on cylinder PM
specimens are plotted in Fig. 4.12. Typical failure modes are also illustrated in Fig. 4.13.
Table 4.9. Statistical analysis results of compressive test data of PM formulations.
Compressive Properties Statistical Parameters Epoxy PM Polyester PM
COMPRESSIVE STRENGTH -CYLINDERS
Number of specimens 9 (3 batches) 9 (3 batches)
Arithmetic Mean 70.16 MPa 64.13 MPa
SD - Standard Deviation 6.74 MPa 1.43 MPa
COV- Coef of Variation 9.61 % 2.24 %
Range of COV within batches [0.61 % , 2.50 %] [0.23 % , 1.17 %]
Average of COV within batches 1.33 % 0.69 %
COMPRESSIVE STRENGTH -PRISMATIC
Number of specimens 18 (3 batches) 18 (3 batches)
Arithmetic Mean 75.23 MPa 65.03 MPa
SD - Standard Deviation 3.15 MPa 3.09 MPa
COV- Coef of Variation 4.19 % 4.76 %
Range of COV within batches [1.02 % , 3.99 %] [2.12 % , 2.64 %]
Average of COV within batches 2.44 % 2.43 %
ELASTICITY MODULUS -CYLINDERS
Number of specimens 3 (1 batch) 3 (1 batch)
Arithmetic Mean 12.60 GPa 11.57 GPa
SD - Standard Deviation 0.32 GPa 0.17 GPa
COV- Coef of Variation 2.57 % 1.50 %
MAXIMUM STRAIN -CYLINDERS
Number of specimens 3 (1 batch) 3 (1batch)
Arithmetic Mean 10.45 ‰ 15.99 ‰
SD - Standard Deviation 0.24 ‰ 0.35 ‰
COV- Coef of Variation 2.26 % 1.59 %
POISSON’S RATIO -CYLINDERS
Number of data 2 (1specimen) 2 (1 specimen)
Arithmetic Mean 0.26 0.22

IV. PHYSICAL AND STATIC MECHANICAL PROPERTIES OF PM FORMULATIONS
IV-43
Fig. 4.12. Stress-strain curves obtained from compression tests (cylinder specimens).
Fig.4.13. Typical failure modes of cylinder PM specimens tested in compression: epoxy PM specimens (E1, E2 and E3) and polyester PM specimens (P1, P2 and P3).
0
10
20
30
40
50
60
70
80
0 10 20 30 40 50 60Strain (0/00)
Com
pres
sive
Str
ess
(MPa
)Epoxy PMs
Polyester PMs
E1 E2 E3
P1 P2 P3

IV. PHYSICAL AND STATIC MECHANICAL PROPERTIES OF PM FORMULATIONS
IV-44
Failure Mode:
For both formulations, cylinder test specimen failed, mostly, in shear (eight of the nine
epoxy PM specimens and seven of the nine polyester based ones). Examples of this type
of failure are illustrated in Fig. 4.13, namely through images E2, E3, P2 and P3.
The angle that the crack pattern makes with the horizontal (bottom of the specimen)
defines the type of failure. A cone-type failure is observed if the angle is between 0º and
45º, a shear failure if the angle is between 45º up to 70º-80º and a splitting failure if upper
angle values occur. In general terms, it was observed that the angles’ failure of polyester
PM specimens were higher than those found for epoxy PM specimens: the other two
polyester PMs failed in splitting (see image P1 of Fig. 4.13) and the last epoxy PM had a
cone-type failure (see image E1 of Fig 4.13). Moreover, the disintegration of the core of
tested specimens was more notorious on epoxy PM specimens than on polyester based
ones. Additionally, a crosslink of micro shear cracks, oriented at 45% with reference to
specimen end-surfaces, was noticed in all epoxy PM specimens immediately after the
maximum load has been reached (see images E1, E2 and E3 of Fig. 4.13).
As noticed by other researchers, the polymer content, the aggregate type, the test
conditions in terms of specimen confinement, and the specimen height to diameter ratio,
have a great influence on the type of failure (Mebarkia 1993; Wang 1981). As these
parameters were the same for both types of specimens, material characteristics, such as
Poisson’s ratio, material friction angle and cohesion, seem to be the single factors
accountable for the differentiated observed failure mode.
Compressive Strength:
As it was expected epoxy PMs present higher compressive strength than polyester based
mortars. However, this difference (9% and 15% higher for, respectively, cylinder and
prismatic specimen) is not so outstanding as in the case of flexural strength, which is
almost two times higher. This is in accordance with the assumed premise that flexural
resistance is a better parameter for the mechanical assessment of PC materials.
Flexural to compressive strength ratios of 0.57 and 0.34 were found for, respectively,
epoxy and polyester PM formulations. These ratios are much higher than similar
parameters found for conventional cement concretes (around 0.2), mainly due to the great
flexural resistance of PMs, especially of epoxy based ones.

IV. PHYSICAL AND STATIC MECHANICAL PROPERTIES OF PM FORMULATIONS
IV-45
Obtained compressive strengths of PM formulations were within the usual range of
values obtained for polyester and epoxy PMs.
Cylinder/Cube Strength Ratio:
For both formulations, compressive tests performed on ‘modified cubes’ of prismatic
specimens led to slight higher values of compressive strength (around 7.5% and 1.5%
higher than compressive strength values of, respectively, cylinder epoxy and polyester
mortar specimens). A higher difference was expected taking into account the following:
• The restraining effect of the platens of the testing machine, which extends over
the entire height of the cube but leaves unaffected a part of the test cylinder,
generally leads to higher ultimate strengths on compression tests of cube
specimens;
• The different equivalent sizes of the specimens (it would be expected that a cube
with 4 cm height had an ultimate strength higher than the equivalent cube with 10
cm height);
• The restraining effect of the overhanging parts of the ‘modified cube’, which, is
reasonably to assume, that would have a slight increasing effect on the ultimate
strength.
Nevertheless, considering the small size of the samples and the high scatter of data found
for epoxy cylinder specimens tested in compression, no reliable conclusions could be
made regarding the cylinder/cube strength ratio of PM formulations. However, the
obtained results allow that, in the future, compression test of ‘modified cubes’, jointly
with flexural tests, could be used as a comparative test to assess and/or control the quality
of PM batches. No different specimens (cylinder) are required and the same control
prismatic specimens used for bending tests can be reused for compressive tests.
Elasticity Modulus:
Secant elasticity modulus of epoxy PM specimens is slight higher than polyester based
mortars. The same pattern was observed for initial tangent elastic modulus. Both obtained
values are closer to the lower limit of the common range of values found for PC
materials.
Several formulas have been derived from which the compressive modulus of elasticity
can be calculated for composite materials when the moduli of the component materials

IV. PHYSICAL AND STATIC MECHANICAL PROPERTIES OF PM FORMULATIONS
IV-46
are known. With the purpose of comparing the theoretical limits of the elasticity modulus
with the experimental data, the expression purposed by Hansen (1965) was applied:
E = 1 / [(V1/E1) + (V2/E2)]-1 (4.19)
where E is the elasticity modulus of the two-phase material; E1 and E2 are the elasticity
modulus of component materials; and V1 and V2 are the respective fractional volumes.
Equation (4.19) is based on the assumption that the average stress in a two-phase material
is the same in the matrix and in the particles, conversely to the rule of mixtures (Kevin-
Voigt model), which assumes that the average strain in the material is the same in the
components. Neither the approximation of uniform strain nor of uniform stress is in fact
correct, but the former leads to an upper limit and the latter, in principle, gives a lower
limit. It would expect that Eq. (4.19) is more adequate to PM since its matrix has a much
lower modulus of elasticity than does its aggregates.
Assuming an elasticity modulus between 45 GPa and 65 GPa for foundry sand, which is a
common range of values given in the literature for silica aggregates (Neville 1995), the
lower and upper limits found for the elasticity modulus of PM formulations were within
the following ranges:
• Epoxy PM: [7.2 to 7.4 GPa; 25.2 to 36.0 GPa]
• Polyester PM: [10.2 to 10.7 GPa; 27.0 to38.4 GPa]
The lower elasticity modulus of epoxy resin and the higher air content of epoxy PM
formulation are probably the major factors accountable for the lower theoretical limit
values found for this formulation.
A higher lateral to longitudinal compressive strain ratio was found for epoxy based
mortars comparatively to polyester based ones. The value for the latter is within the range
of values usually found for conventional concrete materials (between 0.15 to 0.22).
Stress-strain curves:
As it can be observed through stress-strain curves plotted in Fig. 4.12, a higher stiffness is
shown by epoxy PM specimens than by polyester based mortars. The determined secant
elasticity moduli (at 40% of peak stress) do not reflect this large difference in stiffness of
the two materials. The ascending branch of stress-strain curves of epoxy PM specimens is
not only steeper, but also almost linear up to 60% of maximum stress, whereas polyester

IV. PHYSICAL AND STATIC MECHANICAL PROPERTIES OF PM FORMULATIONS
IV-47
based mortars present rather a more ductile behavior, with corresponding ascending
branches approximately linear only up to 40% of peak stress.
As in the case of ordinary concrete, the deviation from linearity indicates the propagation
of bond microcracks at the interface between the matrix binder and the aggregates. As a
result, there is a reduction in the effective area resisting the applied load, so that the local
stress is larger than the nominal stress based on the total cross-section of the specimen.
These changes cause that the strain increases at a faster rate than the nominal stress, and
so stress-strain curve bends over, and becomes increasingly non-linear. Viscoelastic
nature of polymer binder may also contribute to increase the non-linearity of stress-strain
curve as polymer chain slipping, in addition to chain coiling (bending of bond angles),
cause plastic deformation in the polymeric phase of PMs. Thus, it seems that microcracks
propagation and/or polymer chain slipping phenomena start earlier in polyester based
mortars than in epoxy based ones.
With increasing applied stress, matrix cracks, connecting to bond cracks, begin to form
much more extensively. The development of this continuous crack system, reducing
progressively the number of load carrying paths, leads to the stress-strain curves bend to
an increase rate until the ultimate strength of the specimen is reached. Until this point,
polyester PM specimens withstand much more strain than epoxy mortars do (an average
strain at peak stress of 16‰ was found for polyester PMs against 10.5‰ for epoxy based
mortars).
Post-peak behavior is also very distinct for both PM formulations. Descending branch of
polyester PM formulation is almost symmetric to the ascending part, but it has a limited
extension as a brittle failure occurs at compressive strains around 25‰ to 30‰
(approximately at 80% of maximum capacity load). Conversely, softening branch of
epoxy PM specimens is less steep than the ascending part and greatly larger than in the
case of polyester based mortars. Furthermore, no brittle failure was observed. Instead, a
progressive and steadily loss of load capacity occurs as compressive strain increases.
For this last formulation, it is difficult to define a criterion for failure. Ultimate strain has
been defined as the strain at which, for above corresponding stress, Poisson’s ratio
increases sharply. This is caused by extensive vertical cracking, and at this stage (collapse
stage), concrete is no longer a truly continuous body and its behavior is similar to a soil

IV. PHYSICAL AND STATIC MECHANICAL PROPERTIES OF PM FORMULATIONS
IV-48
(Neville 1995). In terms of stress-strain curve, for lightweight concrete, it is usual to
associate this discontinuity moment to the point, above which, descending branch
becomes convex, with reference to strain axis, tending to a horizontal line (Arnould and
Virlogeux 1986). As shown in Fig. 4.12, no point with the above description can be
found. After inflexion points, slopes of descending branches tend to stabilize, becoming
almost constants. In face of the above, and taking into account that no transversal strain
data was available after peak stress, ultimate strain was considered around 35‰, as the
strain above which, a significant change in the slope of at least one of the descending
branches occur.
ii) Stress-strain relationships
Empirical relationships, correspondent to Eqs. (4.17) and (4.18), versus experimental test
data, are plotted in Fig. 4.14 for both formulations.
Fig. 4.14. Comparison of stress-strain empirical relationships to the experimental data.
The parameters and constants of applied equations that better fit experimental data are
shown in Table 4.10. The average values of compressive strength, strain at peak stress,
secant elasticity modulus at peak stress (Ec = fc /ε c), and initial tangent elastic modulus
were used to determine the parameters q and k. Initial tangent elastic modulus was
0
10
20
30
40
50
60
70
80
0 10 20 30 40 50 60Strain (0/00)
Com
pres
sive
Str
engt
h (M
Pa)
Exp. DataEq. 4.17Eq. 4.18
Epoxy PMs
0
10
20
30
40
50
60
70
80
0 5 10 15 20 25 30Strain (0/00)
Exp. DataEq. 4.18Eq. 4.17
Polyester PMs

IV. PHYSICAL AND STATIC MECHANICAL PROPERTIES OF PM FORMULATIONS
IV-49
determined through experimental strain-stress curves (average values of 13.93 GPa and
12.36 GPa were found, respectively, for epoxy and polyester PM formulations).
Table 4.10. Parameters of the empirical stress-strain relationships.
Parameters of equations Epoxy PM Polyester PM
CARREIRA ET CHU EQ. 4.17 – q
SARGIN EQ. 4.18 – k EQ. 4.18 – k’
0.465772
2.146114 1.331114
0.325151
3.075494 0.000494
As shown in Fig. 414, the two-parameter relationship purposed by Sargin, defined by Eq.
(4.18), shows the best agreement with the experimental data, for both types of PM
specimens.
For conventional cement concrete, experimental studies show that the theoretical curve
that best fit experimental data is always between the two curves correspondent to k’ = k-1
and k’= 0. The former is representative of the compressive behavior of ductile cement
concretes with weak resistances, whereas the later (symmetric parabola) is rather
representative of brittle concrete materials with high resistance (Arnould and Virlogeux
1986).
The above statements concerning the relationship between k’ value and stress-strain
behavior are, partially, in agreement with obtained results, as explained in the following:
• On one hand, stress-strain curves of polyester PMs are clearly representatives of
ductile materials with pseudo-plastic behavior, with soft bending curvatures near the
peak, either for the ascending part or for the descending branch. In the same manner,
for epoxy PMs, the ascending curves and the first parts of the descending branches,
immediately after peak stresses, being steeper, are rather characteristics of stiffer
materials. These features are in disagreement with the physical mean of k’ values
found for both formulations.
• On the other hand, polyester PMs present a brittle failure. Collapse does not occur
immediately after peak stress, but it is clearly a brittle failure, with total loss of
capacity load, which is in agreement with value found for k’ parameter(k’≅ 0). In the
same manner, descending branch of epoxy PMs, after the initial post-peak drop,

IV. PHYSICAL AND STATIC MECHANICAL PROPERTIES OF PM FORMULATIONS
IV-50
become progressively smoother and less steeper, with the strains increasing a faster
rate than the nominal applied stress. This is also in agreement with the physical mean
of k’ value found for this formulation (k’= k-0.82).
Regardless of the validity, or not, of physical mean of k’ parameter when applied to PC
materials, Sargin empirical stress-strain relationship, with the determined k and k’
parameters (Table 4.10) and average values of cylinder compressive strength and strain at
peak stress given in Table 4.9, can be applied with success to modelling compressive
stress-strain behavior of PM formulations.
iii) Overall comparison with ordinary concrete materials
In the global sense, similarities in fact exist between stress-strain behavior of PC
materials and conventional concretes. However, significant differences also coexist. PC
materials withstand much more strain than ordinary concretes do, and this feature is
greater the lower the loading rate. Strains corresponding to peak stress as high as 8‰ to
14‰ are commonly found in PC materials, which is four to seven times more than the
usual values observed in ordinary concretes. This implies that polymer based concrete is
a more ductile material than Portland cement concrete. This characteristic arises from the
viscoelastic nature of matrix binder.
The overall stress-strain behavior of PC materials may be considered, as this way, as
governed majority by two distinct phenomena:
• Crack growth in the composite structure, which is presumed to be at some extent
similar to crack growth in ordinary concrete;
• The elastic and plastic deformation of polymeric binder matrix, which is
presumed to be analogous to that of the plain polymer. Coiling and slipping of
polymeric chains are here considered as the main mechanisms accounted for those
deformations.
Thus, some of the PC material’s behavior can be understood by considering the known
behavior of regular concrete, and some of its behavior can be understood by examining
the behavior of polymers.

IV. PHYSICAL AND STATIC MECHANICAL PROPERTIES OF PM FORMULATIONS
IV-51
4.3.3 Tensile Properties
There are three types of test for strength in tension: direct tension test, flexure test, and
splitting tension test.
A direct application of a pure tension force, free from eccentricity, is very difficult to
obtain. To avoid secondary stresses such as those induced by grips or embedded studs is a
complicated and complex process that is not easily reached most of the times. On the
other hand, these tests usually require special shapes for the test specimens not easily
obtained by casting. In consequence of this, direct tensile tests are rarely used to
determine tensile strength of concrete materials. Instead, indirect tensile tests such as
flexural or splitting-tension tests are preferred.
The splitting tensile test is simple to perform, does not require unusual specimen types
and gives more uniform results than direct tensile tests. The strength determined in the
splitting test is believed to be closed to the direct tensile strength of the concrete, being
5% to 12% higher (Neville 1995). However, some studies indicate that, in the case of
mortar and lightweight aggregate concrete, the splitting test yields to low a result
(Hannant et al. 1973).
In flexure tests, the maximum tensile stress reached in the bottom fibre of the test
specimen also gives an indirect measure of tensile strength. The four-point bending test,
with the load points spaced at one-third of the span, offers some advantages over the
three-point bending test. The former is considered to be more reliable and realistic in the
sense that more elements are subjected to the critical stress (Hammant 1971;
Tarnopol'skii and Kincis 1984). Under four-point bending, one-third of the length of the
bottom fibre is subjected to the maximum stress, so that the probability of a weak element
occurring is higher than in the case of centre-point loading, in which, only the elements of
the extreme fibre, immediately behind the load line, are subjected to the maximum stress.
It follows that modulus of rupture given by three-point bending tests are usually higher
than those determined by four-point bending, being both higher than direct tensile
strength.
There are additional possible reasons, besides the influence of loading arrangement, why
the modulus of rupture test gives a higher value of strength than a direct tension test made

IV. PHYSICAL AND STATIC MECHANICAL PROPERTIES OF PM FORMULATIONS
IV-52
on the same material. First, the issue already mentioned in point 4.3.2.1, the modulus of
rupture is determined with basis on the elastic beam theory, in which the stress-strain
relation is assumed to be linear; however, in tension, the departure from linearity of the
stress-strain relation occurs at stress/strength ratios of around one-half (Neville 1995).
Second, in the flexural test, the maximum stress reached may be higher than in direct
tension because the less-stressed fibres, nearer the neutral axis, hinder the propagation of
eventual cracks.
Comparative experimental studies showed that the correct value of tensile strength for
concrete materials is around 75% of the theoretical modulus of rupture given by the four-
point bending test (Raphael 1984).
In the present study, tensile strength of PM formulations was assessed by both indirect
tensile tests: splitting tensile test and four-point bending test. Additionally, flexural-
tensile elasticity modulus was also determined, directly, by means of stress-strain curves
obtained from flexural tests.
4.3.3.1 Test and calculation procedures
i) Splitting tensile test
The splitting tension tests were conducted on cylinder specimens, with 50 mm diameter
and 100 mm height, according to RILEM PC-6 test method (1995d). All test specimens,
three for each formulation, received the usual curing treatment before being tested in
splitting at room temperature. Prior to testing, the end surfaces of the test specimens were
trimmed with a diamond-blade saw to make it easier to measure the length.
The tests were performed in a Universal testing machine INSTRON, with a load cell of 300
kN., shown in Fig. 4.15, at LABEST facilities (Laboratory of Civil Engineering
Structures of Faculty of Engineering of Porto). The specimens were placed horizontally at
the centre of the bearing plates to prevent any eccentricity in loading, and the lower and
upper bearing plates were maintained parallel during loading. Load was then applied, in
load-control mode, at a constant rate of 0.7 kN/s until failure.
Splitting tensile strength, f sp,t, was determined by the following equation:
f sp,t = 2P / πDL (4.20)
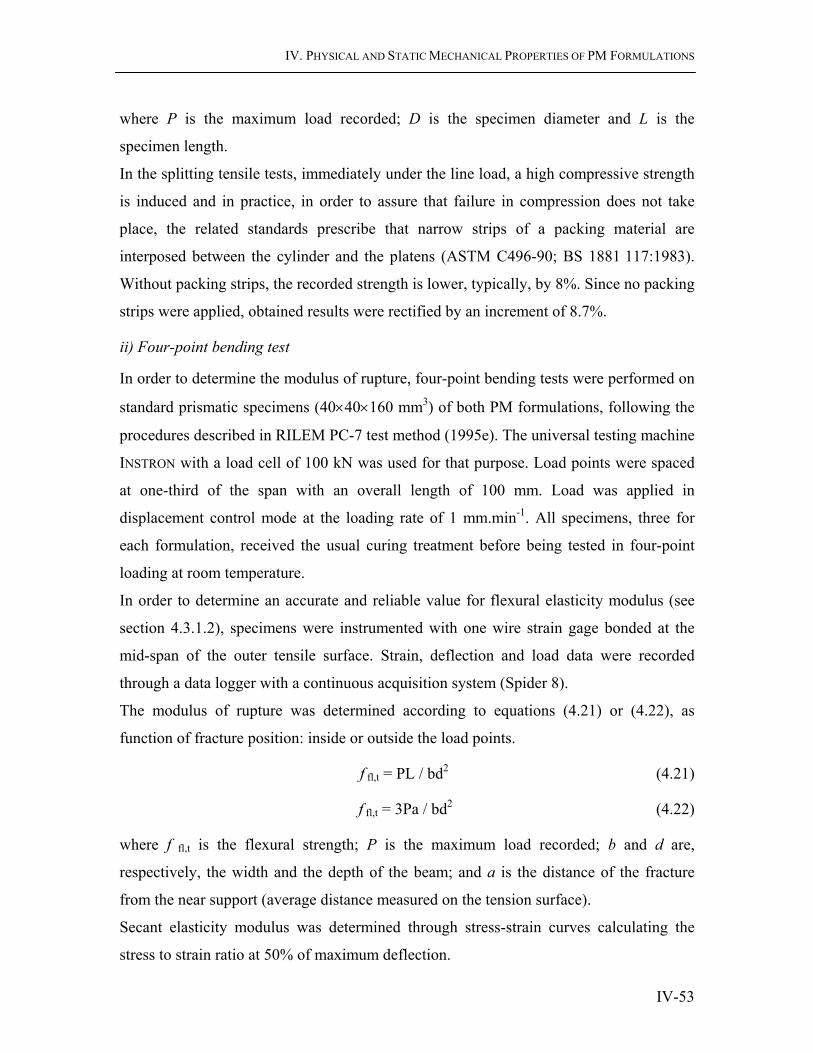
IV. PHYSICAL AND STATIC MECHANICAL PROPERTIES OF PM FORMULATIONS
IV-53
where P is the maximum load recorded; D is the specimen diameter and L is the
specimen length.
In the splitting tensile tests, immediately under the line load, a high compressive strength
is induced and in practice, in order to assure that failure in compression does not take
place, the related standards prescribe that narrow strips of a packing material are
interposed between the cylinder and the platens (ASTM C496-90; BS 1881:117:1983).
Without packing strips, the recorded strength is lower, typically, by 8%. Since no packing
strips were applied, obtained results were rectified by an increment of 8.7%.
ii) Four-point bending test
In order to determine the modulus of rupture, four-point bending tests were performed on
standard prismatic specimens (40×40×160 mm3) of both PM formulations, following the
procedures described in RILEM PC-7 test method (1995e). The universal testing machine
INSTRON with a load cell of 100 kN was used for that purpose. Load points were spaced
at one-third of the span with an overall length of 100 mm. Load was applied in
displacement control mode at the loading rate of 1 mm.min-1. All specimens, three for
each formulation, received the usual curing treatment before being tested in four-point
loading at room temperature.
In order to determine an accurate and reliable value for flexural elasticity modulus (see
section 4.3.1.2), specimens were instrumented with one wire strain gage bonded at the
mid-span of the outer tensile surface. Strain, deflection and load data were recorded
through a data logger with a continuous acquisition system (Spider 8).
The modulus of rupture was determined according to equations (4.21) or (4.22), as
function of fracture position: inside or outside the load points.
f fl,t = PL / bd2 (4.21)
f fl,t = 3Pa / bd2 (4.22)
where f fl,t is the flexural strength; P is the maximum load recorded; b and d are,
respectively, the width and the depth of the beam; and a is the distance of the fracture
from the near support (average distance measured on the tension surface).
Secant elasticity modulus was determined through stress-strain curves calculating the
stress to strain ratio at 50% of maximum deflection.
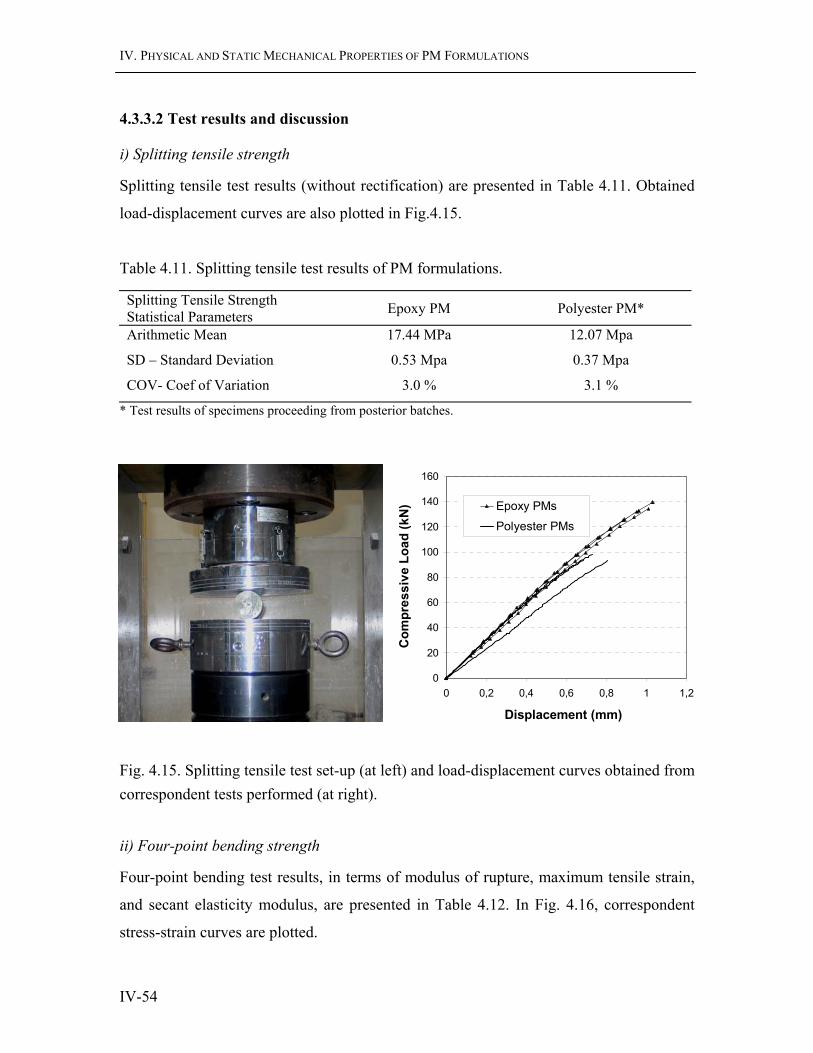
IV. PHYSICAL AND STATIC MECHANICAL PROPERTIES OF PM FORMULATIONS
IV-54
4.3.3.2 Test results and discussion
i) Splitting tensile strength
Splitting tensile test results (without rectification) are presented in Table 4.11. Obtained
load-displacement curves are also plotted in Fig.4.15.
Table 4.11. Splitting tensile test results of PM formulations.
Splitting Tensile Strength Statistical Parameters Epoxy PM Polyester PM*
Arithmetic Mean 17.44 MPa 12.07 Mpa
SD – Standard Deviation 0.53 Mpa 0.37 Mpa
COV- Coef of Variation 3.0 % 3.1 %
* Test results of specimens proceeding from posterior batches.
Fig. 4.15. Splitting tensile test set-up (at left) and load-displacement curves obtained from correspondent tests performed (at right).
ii) Four-point bending strength
Four-point bending test results, in terms of modulus of rupture, maximum tensile strain,
and secant elasticity modulus, are presented in Table 4.12. In Fig. 4.16, correspondent
stress-strain curves are plotted.
0
20
40
60
80
100
120
140
160
0 0,2 0,4 0,6 0,8 1 1,2
Displacement (mm)
Com
pres
sive
Loa
d (k
N) Epoxy PMs
Polyester PMs

IV. PHYSICAL AND STATIC MECHANICAL PROPERTIES OF PM FORMULATIONS
IV-55
For all tests performed, fracture occurred inside the load points, therefore, modulus of
rupture was determined according to Eq. (4.21).
Table 4.12. Four-point bending test results of PM formulations.
Flexural Properties Statistical Parameters Epoxy PM Polyester PM*
FLEXURAL STRENGTH
Arithmetic Mean 25.82 Mpa 16.99 Mpa
SD – Standard Deviation 1.07 Mpa 0.81 Mpa
COV- Coef. Of Variation 4.2 % 4.8%
MAXIMUM TENSILE STRAIN
Arithmetic Mean 3.08 ‰ 3.74 ‰
SD – Standard Deviation 0.08 ‰ 0.22 ‰
COV- Coef. Of Variation 2.6 % 5.8 %
SECANT ELASTICITY MODULUS
Arithmetic Mean 9.82 Gpa 9.74 Gpa
SD – Standard Deviation 0.48 Gpa 0.51 Gpa
COV- Coef. Of Variation 4.9 % 5.2%
* Test results of specimens proceeding from posterior batches.
Fig. 4.16. Stress-strain curves obtained from third-point loading tests performed on instrumented prismatic specimens of both PM formulations.
0
5
10
15
20
25
30
0 0,5 1 1,5 2 2,5 3 3,5 4 4,5Tensile Strain (0/00)
Flex
ural
Str
ess
(MPa
)
Epoxy PMs
0
5
10
15
20
25
30
0 0,5 1 1,5 2 2,5 3 3,5 4 4,5Tensile Strain (0/00)
Polyester PMs

IV. PHYSICAL AND STATIC MECHANICAL PROPERTIES OF PM FORMULATIONS
IV-56
As in compression tests, a higher stiffness is shown by epoxy PM specimens than by
polyester based mortars, as it can be observed through stress-strain curves plotted in Fig.
4.16.
Once again, the determined flexural elasticity modulus does not reflect this distinct
behavior. Departure from linearity of the stress-strain relations occurs at similar
stress/strength ratios for both formulations, between 45% and 50%, but, after this point,
the stress-strain curves of polyester based mortars bend drastically comparing with those
of epoxy PMs. In spite of the higher flexural-tensile strength reached by epoxy mortars, a
higher tensile strain is sustained by polyester based mortars until failure.
Flexural-tensile elasticity modulus values, obtained directly from stress-strain curves, are
coherent with material composition as well as with determined compressive elasticity
modulus. Therefore, hereinafter they will be assumed as the ‘correct’ ones.
iii) Tensile strength
With basis on both indirect tensile test results, the following relationship could be used to
estimate the average direct tensile strength, f t , of PM formulations:
f t = [α β f sp,t + β’ f fl,t] / 2 (4.23)
where f sp,t and f fl,t are, respectively, the average splitting tensile and four-point bending
strength values, presented at Tables 4.11 and 4.12; α is the correction parameter for the
effect of the lack of packing strips on splitting test (α=100/92); and β, β’ are the
correlation factors between direct tensile strength and, respectively, splitting tensile and
four-point bending strengths (β = 1/1.12 to 1/1.05 and β’= 0.75).
Obtained estimating results are presented at Table 4.13.
Table 4.13. Estimation of direct tensile strength of PM formulations.
Direct Tensile Strength Epoxy PM Polyester PM
By means of splitting strength 16.92 to 18.05 MPa 11.71 to 12.49 MPa
By means of four-point bending strength 19.36 MPa 12.74 MPa
Arithmetic Mean 18.14 to 18.70 MPa 12.22 to 12.62 Mpa

IV. PHYSICAL AND STATIC MECHANICAL PROPERTIES OF PM FORMULATIONS
IV-57
The obtained indirect tensile strengths and the correspondent estimated direct tensile
strengths are within the range of values usually obtained for these materials. The higher
strength values found for epoxy based mortars are in accordance with the higher bond
capacity and greater adhesion to mineral aggregates of epoxy resin binder.
Estimated tensile to cylinder compressive strength ratios between 0.26 and 0.27, and
between 0.19 and 0.20 were found, respectively, for epoxy and polyester PM
formulations. For ordinary concrete, the same ratio varies in general between 0.07 and
0.11. The relative high ratio of tensile to compressive strength of PM formulations (and
PC materials in general) is mainly due to the tighter bonding between the polymeric
binder and the aggregates, since the cracking of ordinary concrete is usually initiated
from the interfaces of cement paste and aggregates.
However, it is interesting to note that, the same way as for ordinary cement concretes, the
ratios of the nominal tensile and compressive strengths vary in a similar manner than the
Poisson’s ratios and between approximately the same limits. The higher the Poisson’s
ratio, the higher the tensile to compressive strength ratio.
For cement concrete materials, there are strong indications, that is not a limiting
compressive strain, but a limiting tensile strain that determines the strength of concrete
under compressive static loading. It has been found that, at the point of initial cracking,
the strain on the tension face of a beam in flexure and the lateral tensile strain in a
cylinder in uniaxial compression are of the same magnitude (Neville 1995). It is,
therefore, possible that compressive failure is governed by the lateral strain induced by
Poisson’s ratio, since for elements sufficiently removed from the platens of the testing
machine, lateral strain can exceed the ultimate tensile strain of concrete. Failure occurs
then by splitting, at right angles to the direction of the load, and this has been frequently
observed, especially in specimens whose height is greater than their breadth (Yin et al.
1989).
In the case of epoxy and polyester PM formulations, lateral tensile strain induced by
Poisson’s ratio in the cylinder specimens during compression tests, was estimated as
equal, respectively, to 89% and 94% of correspondent ultimate tensile strains. It follows
that the conditions of tensile failure were not achieved before the limiting compressive
strain of PM specimens has been reached. However, concrete failure is a complex process

IV. PHYSICAL AND STATIC MECHANICAL PROPERTIES OF PM FORMULATIONS
IV-58
not yet well understood, even for ordinary cement concretes. Several mechanisms are
involved, and therefore the hypothesis that some PM specimens failed in compression
tests due to tensile strains induced by Poisson’s ratio cannot be disregarded, especially in
the case of polyester PM specimens.

IV. PHYSICAL AND STATIC MECHANICAL PROPERTIES OF PM FORMULATIONS
IV-59
Bibliography
ACI. (1994). "Guide for structural lightweight aggregate concrete." ACI 213R-87- Manual of Concrete Pratice, Part 1: Materials and General Properties of Concrete, American Concrete Institute, Detroit, Michigam.
ACI:116R-90. "Cement and concrete terminology." ACI Manual of Concrete Practice, Part 1: Materials and General Properties of Concrete, American Concrete Institute, Detroit, Michigan, 1994.
Arnould, M., and Virlogeux, M. (1986). Granulats et Betons Legers: Bilan de dix ans de recherches, Presse de lécole natinale des Ponts et Chaussés.
ASM. (1991). Properties and selection: Nonferrous Alloys and Special Purpose Materials, ASM Hand Book, American Society of Materials,Vol.2.
ASTM:125-06. (2006). "Standard Termninology Relating to Concrete and Concrete Aggregates." Annual Book of ASTM Standards, American Society of Testing Materials, 04(02).
ASTM:C348-02. (2002). "Standard Test Method for Flexural Strength of Hydraulic Cement Mortars." Annual Book of ASTM Standards
American Society of Testing Materials.
ASTM:C469-94. (1994). "Standard Test Method for Static Modulus of Easticity and Poisson's Ratio of Concrete in Compression." Annual Book of ASTM Standards, American Society of Testing Materials.
ASTM:C580-02. (2002). "Standard Test Method for Flexural Strenght and Modulus of Elasticity of Chemical-Resistant Mortars, Grouts, Monolithic Surfacing and Polymer Concretes." Annual Book of ASTM Standards, American Society of Testing Materials.
ASTM:C:351. (2000). "Standard test method for linear shrinkage and coefficient of thermal expansion of chemical-resistant mortar-grouts, monholitic surfacing and polymer concretes." Annual Book of ASTM Standards, Vol. 04.05.
IV. PHYSICAL AND STATIC MECHANICAL PROPERTIES OF PM FORMULATIONS
IV-60
ASTM:D:5335. (2000). "Standard test method for linear coefficient of thermal expansion of rock using bonded electric resistance strain gages." Annual Book of ASTM Standards, Vol. 04.08.
ASTM:E:228. (1989). "Test method for linear thermal expansion of solid materials with a vitreous silica dilatometer." Annual Book of ASTM Standards, Vol. 14.02.
Bartos, P. (1992). Fresh Concrete, Elsevier, Amsterdam.
BS:1881-102. (1983). "Testing concrete. Method for determination of slump." British Standard Institution.
BS:1881-103. (1983). "Testing concrete. Method for determnation of compacting factor." British Standard Institution.
BS:1881-104. (1983). "Testing concrete. Method for determination of Vebe time." British Standard Institution.
BS:1881-105. (1984). "Testing concrete. Method for determination of flow." British Standard Institution.
Cano, M., San José, J. T., and Ramirez, J. L. "Polyester polymer concrete. Fundamental hardened and fresh state." 2éme Conf. Int. sur les Matériaux Composites en Architecture, Construction et Génie Civil - ARQUIMACOM'98, 1998, Bordeaux, France, 191-200.
Carreira, D. J., and Chu, K. (1985). "Stress-strain relationship for plain concrete in compression." ACI Journal, 82, 797-800.
Costa, A. N., Novo, C., Sousa, M., Marques, A. T., Frazão, O., and Dias, I. "Fibre Bragg Grating sensors for RTM process monitoring and composite structures health monitoring." 4th Canadian International Composite Conference, 2003, Ottawa, Canada, Ppr-pvsd-058.
Crawford, R. J. (1990). Plastics Engineering, Pergamon Press, Oxford, UK.
Fanella, D. A., and Naaman, A. E. (1985). "Stress-strain properties of fiber reinforced mortar in compression." ACI Journal, 8, 512-518.
Gálan, C. M. (2001). "Caracterización de un mortero polimérico con resina de poliéster insaturado y árido de albero para su aplicación en construcción," Ph.D. Thesis, Universidad de Sevilla, Sevilla.
IV. PHYSICAL AND STATIC MECHANICAL PROPERTIES OF PM FORMULATIONS
IV-61
Hammant, B. (1971). "Use of 4-Point Loading Tests to Determine Mechanical Properties." Composites, 2(4), 246-249.
Hannant, D. J., Buckley, K. J., and Croft, J. (1973). "The effect of aggregate size on the use of the cylinder splitting test as a measure of tensile strength." Materials and Structures, 6(31), 15-21.
Hansen, T. C. (1965). "Influence of aggregate and voids on modulus of elasticity of concrete, cement mortar and cement paste." ACI Journal, 62(Feb), 194.
Hill, K. O., Malo, B., Bilodeau, F., Johnson, D. C., and Albert, J. (1993). "Photosensitivity in optical fibre." Annual Review of Material Science, 23, 125-157.
Hsu, H. T. (1984). "Flexural behavior of polymer concrete beams (fatigue, creep)," Ph.D. Thesis, University of Texas, Austin.
Kim, K. (1986). "The processing, mechanical properties and microfractography of polimer concrete composite material," Ph.D. Thesis, University of California, Santa Barbara.
Letsch, R. H. "Shrinkage and temperature stresses in PC and PCC due to hindered deformation." Int. Symposium on Concrete Polymer Composites, 1991, Bochum, Germany, 53-62.
Mebarkia, S. A. (1993). "Mechanical and fracture properties of high strength polymer concrete under various loading conditions and corrosive environments," Ph.D. Thesis, University of Houston, Houston.
Moriyoshi, A., Omata, F., Kawakami, M., Tokushige, H., and Ohama, Y. "Stresses and strains of resin mortar during setting." 2nd East Asia Symposium on Polymers in Concrete, 1997, Koriyama, Japan, 353-362.
Neville, A. M. (1995). Properties of Concrete, Addison Wesley Longman Limited, Harlow, England.
Novo, C., Nóvoa, P., Ribeiro, C., Ramos, C., Ferreira, A., and Marques, A. "Health monitoring with FBG sensors applied on polymer concrete structures." 3rd Int. Conference on Composites in Construction - CCC2005, 2005, Lyon, France, 1003-1010.

IV. PHYSICAL AND STATIC MECHANICAL PROPERTIES OF PM FORMULATIONS
IV-62
Ohama, Y., Demura, K., and Shimizu, A. (1986). "Effects of Mix Porportioning Factors on Consistency of Fresh Polyester Resin Concrete." Transactions of the Japan Concrete Institute, 8(1986), 51-56.
Ohama, Y., Demura, K., and Terata, O. "Penetration resistance test for determining working life of polyester concrete." Int. Symposium on Plastics in Material and Structural Engineering, 1981, Prague, 317-320.
Ohama, Y., and Komiyama, M. "Early strength and length change of polyester resin concrete with shrinkage-reducing agent." 22nd Japan Congress on Materials Research, 1979, Kyoto, Japan, 356-359.
Ohama, Y., and Terata, O. "Determination methods for consitency of polyester resin concrete." 22nd Japan Congress on Materials Research, 1979, Kyoto, Japan, 352-355.
Raphael, J. M. (1984). "Tensile strength of concrete." Concrete International, 81(2), 158-165.
Richardson, D. N. (1991). "Review of variables that influence measured concrete compressive strength." Journal of Materials in Civil Engineering, 3, 95-111.
RILEM. (1995a). "PC-3: Method of test for slump and flow of fresh polymer concrete and mortar." Technical Committee TC-113 'Test Methods for Concrete-Polymer Composites' (CPT), International Union of Testing and Research Laboratories for Materials and Structures.
RILEM. (1995b). "PC-4: Determining methods for working life of fresh polymer concrete and mortar." Technical Committee TC-113 'Test Methods for Concrete-Polymer Composites' (CPT), International Union of Testing and Research Laboratories for Materials and Structures.
RILEM. (1995c). "PC-5: Method of test for compressive strength of polymer concrete and mortar." Technical Committee TC-113 'Test Methods for Concrete-Polymer Composites' (CPT), International Union of Testing and Research Laboratories for Materials and Structures.
RILEM. (1995d). "PC-6: Method of test for splitting tensile strength of polymer concrete and mortar." Technical Committee TC-113 'Test Methods for Concrete-Polymer Composites' (CPT), International Union of Testing and Research Laboratories for Materials and Structures.

IV. PHYSICAL AND STATIC MECHANICAL PROPERTIES OF PM FORMULATIONS
IV-63
RILEM. (1995e). "PC-7: Method of test for flexural strength of polymer concrete and mortar." Technical Committee TC-113 'Test Methods for Concrete-Polymer Composites' (CPT), International Union of Testing and Research Laboratories for Materials and Structures.
RILEM. (1995f). "PC-8: Method of test for static elasticity modulus of polymer concrete and mortar." Technical Committee TC-113 'Test Methods for Concrete-Polymer Composites' (CPT), International Union of Testing and Research Laboratories for Materials and Structures.
RILEM. (1995g). "PCM-4: Method of test for unit weight and air content of fresh polymer-modified mortar." Technical Committee TC-113 'Test Methods for Concrete-Polymer Composites' (CPT), International Union of Testing and Research Laboratories for Materials and Structures.
San José, J. T. (1996). "Hormigon polimero estructural y decorativo. Aplicacion a composites para la construcion," Ph.D. Thesis, Universidad del Pais Vasco, Bilbao.
San José, J. T. "Influence of the viscoelastic nature of the polymer concrete in its structural behaviour." 2006, International Symposium on Polymers in Concrete, Guimarães, Portugal, 69-83.
San José, J. T., Vegas, I., and Ramirez, J. L. "Macroscopic properties in relation to polymer concrete internal structure." Int. Conference on Polymer Concretes, Mortars and Asphalts, 2002, Porto, Portugal, 113-124.
Sargin, M. (1979). "Stress-strain relationshipsfor concrete and the analysis of structural concrete sections." SM Study nº4, Solid Mechanics Division, University of Waterloo, Ontario, Canada.
Shultz, W. L., Conte, J. P., and Udd, E. "Long gage fiber optic Bragg grating strain sensor to monitor Civil Structures." International Conference on Optical Engineering, SPIE, 2001, San Diego, USA, 4330-4356.
Soroushian, P., Tlili, A., Yohena, M., and Tilsen, B. L. (1993). "Durability characteristics of polymer-modified glass fiber reinforced concrete." ACI Materials Journal, January-February(1993), 40-49.
Tarnopol'skii, Y. M., and Kincis, T. (1984). Static Test Methods for Composites, Van Nostrand Reinhold Company Inc., New York.

IV. PHYSICAL AND STATIC MECHANICAL PROPERTIES OF PM FORMULATIONS
IV-64
UNE:83821. (1992). "Morteros. Métodos de ensayo. Morteros endurecidos. Determinación de las resistencias a flexión y a compressión." AENOR Associación Española de Normalización y Certificación.
Wang, Y. Y. "Research and application of polymer concrete in China." 3rd International Congress on Polymers in Concrete, Koryama, Japan.
Wheat, D. L., Fowler, D. W., and Harris, C. M. "Test procedures for determining the thermal expansion of polymer concrete." RILEM Symposium on Properties and Test Methods for Concrete-Polymer Composites, Oostende, Belgium, 71-79.
Yin, W. S., Su, E. C. M., Mansur, M. A., and Hsu, T. C. (1989). "Biaxial tests of plain and fibre concrete." ACI Materials Journal, 86(3), 236-243.
Zhang, X. Q., and Guo, Z. H. (1987). "Investigation of complete stress-deformation curves for concrete in tension." ACI Materials Journal, 84(278-285).

V-1
V. DURABILITY STUDY OF PM
FORMULATIONS 5.1 Introduction
5.1.1 General
Durability is one of the most important features of a construction material.
Neville defines this attribute as the ‘ability of the material to withstand the processes of
deterioration to which it can be expected to be exposed’ (Neville 1995). Until recently,
there was a wrong assumption that ‘strong material is a durable material’ and as a result,
the developments in construction material technology have concentrated on achieving
higher and higher strengths. It is now known, that, for many conditions of exposure of
building materials, especially of those with structural role, both strength and durability
have to be considered explicitly at the design stage. However, it will be a mistake to
replace overemphasis on ‘strength’ by overemphasis on ‘durability’.
It is essential that every construction material should continue to perform its intended
functions, i.e. it should maintain its required strength and serviceability during the
specified or traditionally expected service life.
Polymeric composite materials are one of the youngest construction materials and the
ones that are appearing time after time, with new and changed properties, as new
combinations and formulations are developed. Therefore, long-term behavior of these
materials cannot be deduced from experience with the material over the expected lifetime
or from long-time tests (Letsch 2001a). Regardless of their significant advantages over

V. DURABILITY STUDY OF POLYMER MORTAR FORMULATIONS
V-2
conventional construction materials, mechanical and durability properties are highly
susceptible to the type of polymer and reinforcement (or aggregate) employed, as well as
to the content of both components (Pardo et al. 1995).
The number of possible formulations (ingredients and proportions) that can be used to
produce polymer composite materials is limitless. Therefore, the results of previous
research are often applicable only to that particular material. Even if certain consistencies
may exist, they always must be verified.
Hence, it is necessary to study the rate of degradation of each specific PC formulation
when subjected to different aggressive environments, as this rate varies as function of the
matrix type (and content), is strongly affected by the adhesion between matrix and
aggregates at interface, and it is also dependent of the nature and packing level of
aggregates.
Considering this, the various aspects affecting the durability of developed PM
formulations are the subject matter of the present chapter.
5.1.2. Causes of deterioration
Inadequate or poor durability manifests itself by deterioration, which can be due either to
external factors or to internal causes within the material itself. The various actions can be
physical, chemical, or mechanical.
Mechanical damage can be caused by impact, abrasion or erosion. The later will be
considered towards the end of present chapter, as an effect of wind, one of the
components of weather that cause degradation.
Chemical (acid and alkalis) attacks occur mainly through the action of aggressive ions,
such as chlorides, sulfates, or of carbon dioxide, as well as many natural or industrial
liquids and gases. This topic is discussed in section 5.2.
Physical causes of deterioration include the effects of high temperatures, freezing and
thawing, thermal shocks, and also the effects of differences in thermal expansion of
aggregates and of the binder matrix. The influence of these thermal factors is also
analyzed in this chapter, throughout section 5.3.

V. DURABILITY STUDY OF POLYMER MORTAR FORMULATIONS
V-3
Another important cause of physical damaging is fire. Behavior under fire is of
paramount impact, and hence it will be discussed in chapter VI.
As emphasized by Neville (1995), it should be observed that the mechanical, physical and
chemical processes of deterioration could act in a synergetic manner, as it occurs in
weathering processes. Deterioration of concrete materials is rarely due to one isolated
cause, and that’s why, it is sometimes very difficult to assign damage to a particular
factor. In section 5.4, the main components of weather that cause degradation, which
include sunlight, temperature, moisture, wind, dust and pollutants, are discussed. The
influence of outdoors exposure to natural weathering on material mechanical properties is
analyzed. Additionally, a comparative analysis with the effects caused by accelerated
artificial weathering, in salt fog and arc-xenon chambers, is also done.
At this point, a special mention must be done to a particular material characteristic, which
has been considered as the main cause of material deterioration: permeability. Indeed,
with the exception of mechanical damage, all the adverse influences on durability involve
the transport of fluids through the material. Concrete durability largely depends on the
ease with which fluids, both liquids and gases, can enter into, and move through concrete,
(which is commonly referred to as permeability of concrete). For this reason,
consideration of durability requires an understanding of the mechanisms involved.
In the strict sense of the word, permeability refers to flow through a porous medium.
However, the movement of various fluids through concrete takes place not only by flow
through the porous system but also by diffusion and sorption, so the phenomenon
involved is in fact (prior to) lied to penetrability of concrete. Nevertheless, the commonly
term permeability will be used to designate the overall movement of fluids into and
through concrete.
Often permeability is misunderstood with porosity. In the pore system of concrete, there
are pores of different types, some of which contribute to permeability and some of do not,
and it is this feature that allows to distinguish between porosity and permeability.
According to Neville (1995), porosity is a measure of the proportion of the total volume
of concrete occupied by pores, and is usually expressed in percent. If the porosity is high
and the pores are interconnected, they contribute to the transport of fluids through
concrete, so its permeability is also high. Conversely, if the pores are discontinuous or
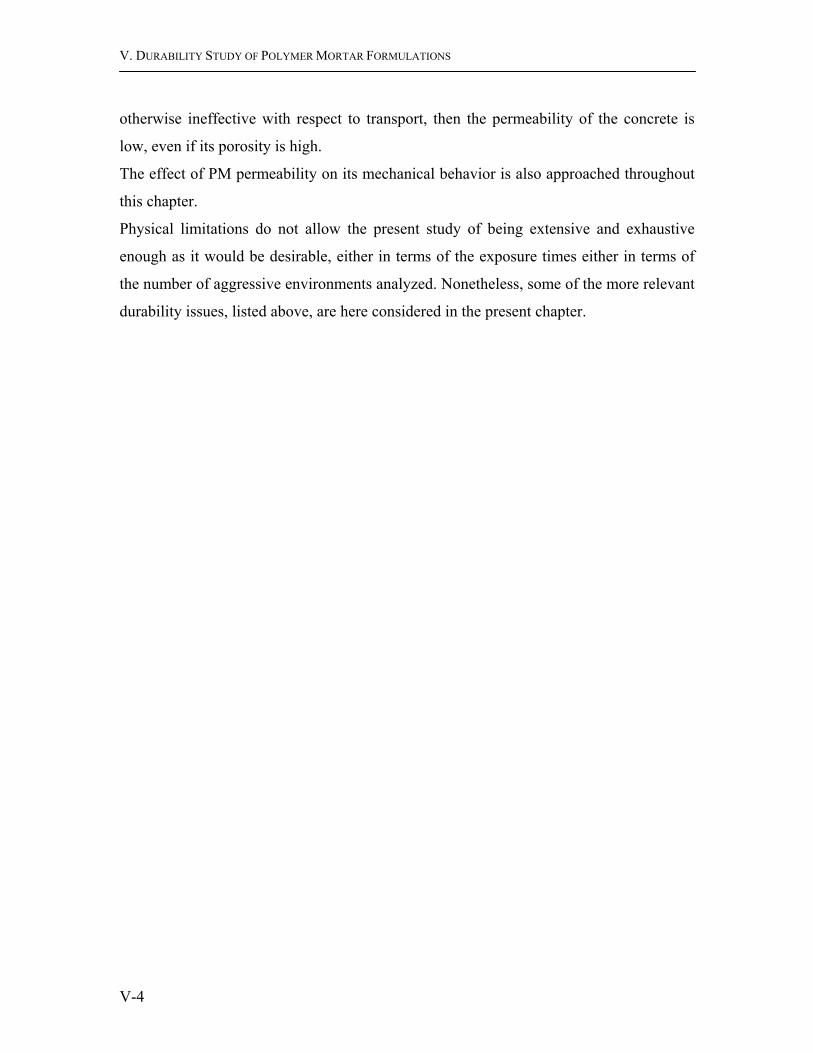
V. DURABILITY STUDY OF POLYMER MORTAR FORMULATIONS
V-4
otherwise ineffective with respect to transport, then the permeability of the concrete is
low, even if its porosity is high.
The effect of PM permeability on its mechanical behavior is also approached throughout
this chapter.
Physical limitations do not allow the present study of being extensive and exhaustive
enough as it would be desirable, either in terms of the exposure times either in terms of
the number of aggressive environments analyzed. Nonetheless, some of the more relevant
durability issues, listed above, are here considered in the present chapter.

V. DURABILITY STUDY OF POLYMER MORTAR FORMULATIONS
V-5
5.2 Chemical Durability
5.2.1 Introduction
5.2.1.1 Overview
There have been several publications on deterioration of Portland cement concrete when
exposed to corrosive chemical agents (Attiogbe and Rizkalla 1988; Fattuhi and Hughes
1988; Hendrik and Orbison 1987; Kurashidge and Uomoto 2001), however, little
information is available concerning the resistance of polymer concrete and mortars to
those aggressive environments, especially over a long period of time.
Previous literature on polymer-metal composites showed that one of the most common
aggressive environments is water (Kinlock 1987). Within this scope, Ohama (1977)
studied the resistance of polyester PC to hot water as found in the construction works in
hot spring areas or chemical plants. Cylindrical PC specimens, with five different
polyester matrixes, were immersed in boiling water for up to 1 year before being tested in
compression and splitting tension. He concluded in general, that with additional
immersion time, the erosion depth of polyester PC specimens tends to increase, and the
compressive and tensile strengths tend to decrease, with no remarkable appearance or
weight change.
Mebarkia and Vipulanandan (1995) also investigated the behavior of polyester PC and
polyester polymer when exposed to water, over a maximum period of 1 and 3 years
respectively. After one-year immersion, a strength decrease of more than 30% was
observed on PC specimens. On the other hand, immersion of polyester polymer
specimens in water for 3 years resulted in less than 5% decrease in strength. It was
concluded that water diffusion into the PC affected the interface rather than the polymer.
The limited studies on PC have shown, in general, the superior chemical resistance of this
kind of material over Portland cement concrete when subjected to a wide range of
chemical environments, such as acids, alkalis, and petroleum products.

V. DURABILITY STUDY OF POLYMER MORTAR FORMULATIONS
V-6
Yammamoto (1987) immersed Portland cement and polyester resin mortar specimens in
10% hydrochloric acid and 10% sulphuric acid solutions for a period of 28 days. No loss
in weight was observed for the polymer mortars; however, cement mortar specimens lost
about 50% of their initial weight.
Mebarkia (1993) analyzed the changes in compressive and splitting tensile strength of
polyester PC, after one-month immersion, in chemical solutions with various pH levels .
It was observed that the strength of PC decreased with the increase in pH level of the
chemical solutions.
Ohama and co-workers (1986a) also investigated the effect of 11 typical reagents for
industrial uses in the compressive strength of polymethyl methacrylate concrete. Test
results showed that this kind of material is seriously attacked by acetone and toluene, and
slightly attacked by hydrochloric, sulfuric and acetic acids. Conversely, it shows good
resistance to tap water, alkali, salts, kerosene and rapeseed oil.
Chawalwala (1996) studied the application of vinyl and polyester PC, with basalt
aggregates, as a wear overlay surface for a composite bridge deck. The behavior of these
PCs when exposed to water and chemicals, such as motor oil and antifreeze solutions,
was investigated. Test results showed that basalt based PC systems were particularly
affected by water (water immersion and diluted antifreeze), and property losses were
primarily due to the weakness of the interface between the aggregate and the polymer
matrix phases, which depends on the absorbed water content.
Griffiths and Ball (2000) conducted a research work on degradation processes of glass-
fibre-reinforced polyester PC (GFR PC). The deterioration of flexural strength of GFR
PC specimens after immersion in several chemical solutions for varying periods was
evaluated. Exposures to water, gasoline, diesel fuel, engine oil, saline, alkalis and acid
solutions were considered. No measurable degradation of polyester PC occurred after
three weeks exposure to water and petroleum products, and furthermore, no visible signs
of deterioration were noticed. On the other hand, exposure to acids and alkalis resulted in
moderate to severe strength losses, particularly in those specimens immersed in alkaline
solutions. Attack of the resin/aggregate/fibre interface and deterioration of polyester
matrix itself were identified as the principal mechanisms of chemical degradation.

V. DURABILITY STUDY OF POLYMER MORTAR FORMULATIONS
V-7
All the above investigation works indicated that the degradation of PC materials, after
exposure to water or chemical agents, is either due to weakening of the matrix material or
due to the degradation of the interface. But as metioned by Chawalwala (1996), the
former is likely only one part of the problem, since plain resin materials exposed to
similar conditions usually degraded at a significantly lower rate than correspondent PC
materials.
The contact of polymer composite materials with aggressive liquid media is accompanied
by a complex range of physical and chemical processes, such as the absorption and
diffusion of the medium and also the dissociation of the macromolecules. These complex
processes are indubitably related to the particular nature of each material. Therefore, it is
necessary to study the rate of degradation of each particular PC formulation when
exposed to different chemical agents, as this rate, as stated earlier, depends on polymer
binder matrix, aggregate type and on the interface between these two components.
5.2.1.2 Objective
In this subchapter, the effect of a variety of chemicals and water on the performance and
durability of developed PM formulations is analyzed. For this purpose, specimens of both
formulations were immersed for various periods of time, up to 12 weeks, in several liquid
media simulating various environmental conditions. The liquids included water, sodium
chloride, sulphuric acid and sodium hydroxide solutions. The choice for these chemical
reagents is justified by the increasing use of PM and PC structures near seawater and
residual waters. Chemical resistance was evaluated through the variation of bending
strength and variation of mass, after immersion in test solutions. The rate of degradation
with exposure time was also evaluated.
5.2.2 Experimental Program
5.2.2.1 Test specimens
The study was conducted on prismatic specimens (40×40×60 mm3) of both formulations
in analysis. For each kind of PM formulation, four batches with 18 specimens each (3

V. DURABILITY STUDY OF POLYMER MORTAR FORMULATIONS
V-8
control specimens + 15 test specimens) were produced. All the specimens were allowed
to cure for one day at room temperature and then post-cured at 80ºC for three hours.
5.2.2.2 Chemical resistant tests procedure
The cured specimens were tested for chemical resistance at room temperature in
accordance with RILEM recommendation PC-12 TC113: ‘Method of test for chemical
resistance of polymer concrete and mortar’ (1995b). Used test solutions were as follows:
• 10 % sulphuric acid H2 SO4 pH = 0.5
• 10% sodium hydroxide Na OH pH = 13.5
• 10% sodium chloride Na Cl pH = 7.0
A control solution of distilled water was also used according to the above specification
(pH = 7). The pH levels of test solutions and water covered a wide range, from 0.5 to
13.5. Test specimens, after record of their weight, were soaked in above solutions for
periods of time of 1, 7, 21, 56 and 84 days. After each immersion period, the appearance
of three test specimens was visually checked, cleaned by running tap water, quickly dried
by blotting they with a paper towel, and their weight was measured. Finally, they were
submitted to three-point bending tests according to RILEM PCM-8 recommendation
(1995c). Test results were compared with those obtained from flexural tests of the three
control specimens. The test program is summarized in Table 5.1.
Table 5.1. Summary of chemical resistant test program. Nº and Type of Specimens Test Solutions Immersion
Periods 10 % H2 SO4 Solution 10 % Na Cl Solution 10 % Na OH Solution
18 Epoxy PM specimens
18 Polyester PM specimens
Distilled Water (Control Sol.)
0, 1, 7, 21, 56 and 84 days
5.2.2.3 Calculation procedure
Mass and flexural strength change of the specimens, after each immersion period, were
calculated by equations (5.1) and (5.2), as follows:

V. DURABILITY STUDY OF POLYMER MORTAR FORMULATIONS
V-9
Mass change = [(Mf – Mi) / Mi] × 100 (5.1)
where Mi is the mass (g) of the specimens before immersion; and Mf is the mass (g) after
immersion period.
Flexural strength change = [(Ff – Fi) / Fi] × 100 (5.2)
where Fi is the flexural strength (MPa) of control specimens; and Ff is the flexural
strength (MPa) of test specimens after each immersion period.
Accordingly, relative mass change and relative flexural strength change of the specimens,
after each examination period, were calculated by equations (5.3) and (5.4):
Relative mass change = (Moi / Mow) × 100 (5.3)
where Moi is the mass change of the specimens, after immersion in each test solution, for
each examination period (%); and Mow is the mass change of the specimens, after
immersion in control solution of distilled water, for the same examination period (%).
Relative flexural strength change = (Foi / Fow) × 100 (5.4)
where Foi is the flexural strength change of the specimens, after immersion in each test
solution, for each examination period (%); and Fow is the flexural strength change of the
specimens, after immersion in control solution of distilled water, for the same
examination period (%).
5.2.3 Test Results
Test results, in terms of mass change and flexural strength change (average values), for
each test solution and for each kind of PM formulation, as function of immersion period,
are shown in Figs. 5.1 and 5.2.
Additionally, in Fig. 5.3, flexural strength retained by PM specimens after the longest
immersion period, as function of test solution is also presented.
The relative changes of mass and flexural strength, for the same immersion period, are
presented in Table 5.2.

V. DURABILITY STUDY OF POLYMER MORTAR FORMULATIONS
V-10
Fig. 5.1. Mass change (%) of polyester and epoxy PM specimens as function of immersion period and test solution.
Fig. 5.2. Flexural strength change (%) of polyester and epoxy PM specimens as function of immersion period and test solution.
Table 5.2. Relative mass change and relative flexural strength change of both PM formulations after 84 immersion days in chemical test solutions.
Polyester PM Epoxy PM
Test Solutions
Relative Mass Change (%)
Relative Flexural Strength Change (%)
Relative Mass Change (%)
Relative Flexural Strength Change (%)
H2 SO4 57 95 243 591 Na Cl 36 51 118 -114 Na OH 222 212 961 3271
Polyester PM
0
0.2
0.4
0.6
0.8
1
0 15 30 45 60 75 90
Immersion period (days)
Mas
s C
hang
e (%
)
WaterSulph. Acid Sol.Sod. Chl. Sol.Sod. Hid. Sol.
Epoxy PM
0
0.2
0.4
0.6
0.8
1
0 15 30 45 60 75 90
Immersion period (days)
WaterSulp. Acid Sol.Sod. Chl. Sol.Sod. Hid. Sol
Polyester PM
-80
-60
-40
-20
0
20
0 15 30 45 60 75 90
Immersion period (days)
Flex
. Str
. cha
nge
(%)
WaterSulp. Acid Sol.Sod. Chl. Sol.Sod. Hid. Sol.
Epoxy PM
-80
-60
-40
-20
0
20
0 15 30 45 60 75 90Immersion period (days)
WaterSulp. Acid Sol.Sod. Chl. Sol.Sod. Hid. Sol.

V. DURABILITY STUDY OF POLYMER MORTAR FORMULATIONS
V-11
100%100% 101.7%
83.8%
98.5%
68.6%
91.4%
70.0%
56.6%
33.2%
0
20
40
60
80
100
120
Polyester PM Epoxy PM
Flex
ural
Str
engt
h R
etai
ned
(%)
Con
trol
Na
Cl
Na
OHH
O
H S
O
Con
trol
Na
Cl
H S
O
H O
Na
OH
Fig. 5.3. Flexural strength retained by polyester and epoxy PM specimens after 84 immersion days in the various liquid solutions.
Other than the specimens of epoxy PM formulation immersed in sodium chloride
solution, no notorious visible changes were observed after removing the specimens from
the test solutions. Nevertheless, after being tested in bending, the failure surface of almost
test specimens, especially polyester based ones, revealed an eroded rim or color-faded
caused by water diffusion, which became larger as the immersion period increased.
The appearance change, on the exterior and failure surfaces of test specimens, after each
examination period, is described in Table 5.3. The more relevant changes are illustrated
in Figs. 5.4 to 5.6.
By an X-Ray microanalysis (EDS/WDS) and a scanning electronic microscopy (SEM)
analysis on samples of attacked surface, it was possible to determine the chemical nature
of the incrustations that appeared in the surface of some epoxy PM specimens immersed
in sodium chloride solution.
The photographic record of the density map of an affected sample, obtained by scanning
electronic microscopy, is illustrated in Fig. 5.7.
H2 S
O 4
H 2
O

V. DURABILITY STUDY OF POLYMER MORTAR FORMULATIONS
V-12
Table 5.3. Appearance change of PM specimens after immersion in test solutions.
Polyester PM Time
(days) Control Solution
H2 SO4 Solution
Na OH Solution
Na Cl Solution
1 ES1 No change No change No change No change
FS2 No change No change No change No change
7 ES No change No change No change No change
FS No change No change Slight erode rim (3 mm)
No change
21 ES No change No change No change No change
FS Marked erode rim (1 mm)
Slight erode rim (2 mm)
Marked eroded rim (6 mm)
Slight erode rim (1 mm)
56 ES No change No change No change No change
FS Marked erode rim (3 mm)
Marked erode rim (3 mm)
Marked erode rim (10 mm)
Slight erode rim (2 mm)
84 ES No change No change No change Fair whitening
FS Marked erode rim (5 mm)
Marked erode rim (4 mm)
Marked erode rim (15 mm)
Slight erode rim (3 mm)
Epoxy PM Time
(days) Control Solution
H2 SO4 Solution
Na OH Solution
Na Cl Solution
1 ES No change No change No change No change
FS No change No change No change No change
7 ES No change No change No change Small chestnut incrustations
FS No change No change No change No change
21 ES No change Slight whitening No change Small chestnut incrustations
FS No change No change Slight erode rim (0.5 mm)
No change
56 ES No change Slight whitening No change Small chestnut incrustations
FS No change No change Slight erode rim (1 mm)
No change
84 ES No change Slight whitening No change Small chestnut incrustations
FS No change No change Slight erode rim (2 mm)
No change
1 ES- Exterior surface; 2 FS- Failure surface

V. DURABILITY STUDY OF POLYMER MORTAR FORMULATIONS
V-13
Fig. 5.4. Failure surface of control (0) and test specimens for the successive immersion periods in test solutions (1, 7, 21, 56 and 84 days).
Polyester PM Epoxy PM
Dis
tille
d W
ater
H
2 SO
4 Sol
utio
n N
a C
l Sol
utio
n N
a O
H S
olut
ion
0 1 7
21 56 84
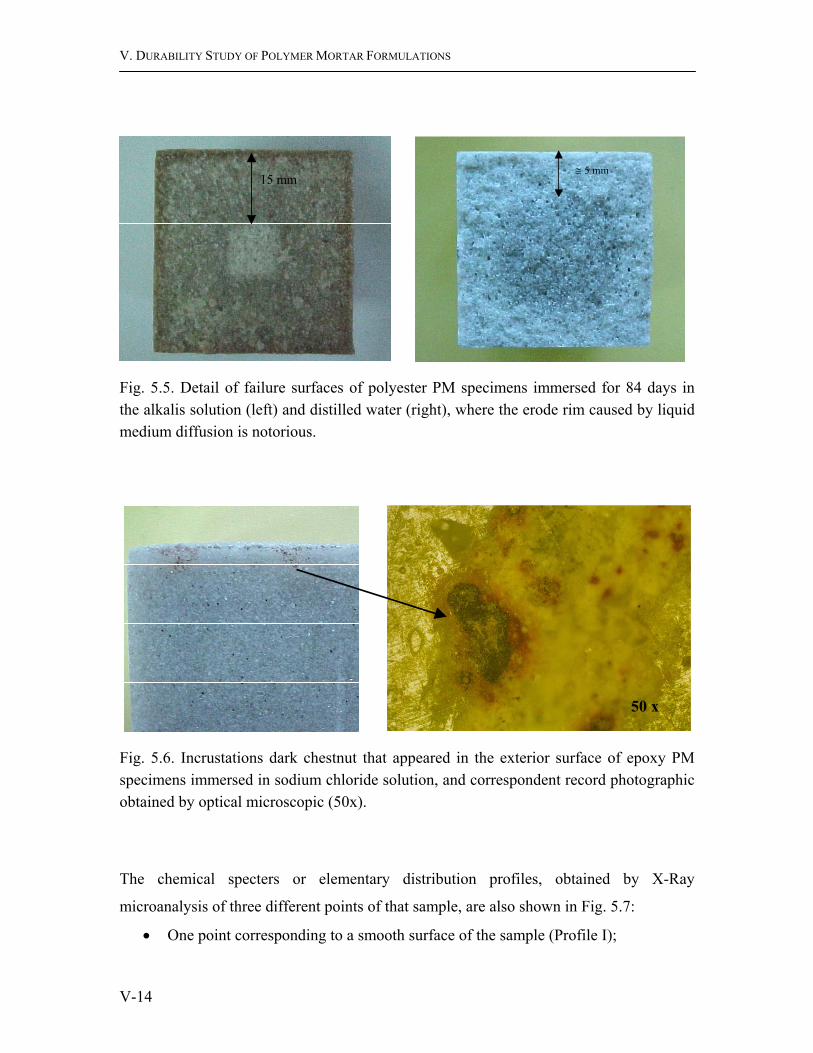
V. DURABILITY STUDY OF POLYMER MORTAR FORMULATIONS
V-14
Fig. 5.5. Detail of failure surfaces of polyester PM specimens immersed for 84 days in the alkalis solution (left) and distilled water (right), where the erode rim caused by liquid medium diffusion is notorious.
Fig. 5.6. Incrustations dark chestnut that appeared in the exterior surface of epoxy PM specimens immersed in sodium chloride solution, and correspondent record photographic obtained by optical microscopic (50x).
The chemical specters or elementary distribution profiles, obtained by X-Ray
microanalysis of three different points of that sample, are also shown in Fig. 5.7:
• One point corresponding to a smooth surface of the sample (Profile I);
15 mm ≅ 5 mm
50 x

V. DURABILITY STUDY OF POLYMER MORTAR FORMULATIONS
V-15
• Another point corresponding to an area where there was a slight detachment of
concrete mass caused by demoulding process, but without chemical attack signs
(Profile II);
• And finally, a third point in the edge of that detachment area in which
incrustations were located (Profile III).
Fig. 5.7. Density map (SEM) of an affected sample of epoxy PM specimen immersed in sodium chloride solution, and elementary distribution profiles of three different points of that sample obtained by spectroscopy.
Attempting to high pattern of iron oxide present in profile III, it was concluded that the
formations dark chestnut were, unequivocally, little rust incrustations. The appearance of
these incrustations is probably related to the presence of iron trioxide in foundry sand
I
II
III
Profile III Profile II
Profile I

V. DURABILITY STUDY OF POLYMER MORTAR FORMULATIONS
V-16
constituents (0.1%). This compound, despite its little content, is unstable in alkali
environments, and is reduced to iron (II) oxide, the stable form when pH increases.
Zones with slight detachments are suitable for the occurrence of this phenomenon, as in
these zones, sand grains are not totally recovered with polymer binder due to abrasion
process. The presence of free amine in those places, proceeding from epoxy resin
hardener, creates a favorable alkali environment to oxidation process.
5.2.4 Discussion of Results
5.2.4.1 Mass variation
No scaling surfaces were noticed and no sediments were found inside solutions
containers. It can therefore be concluded that weight change of all test specimens was
only due to water uptake.
Other than epoxy PM specimens immersed in sodium hydroxide solution, the weight
changes of this kind of PM specimens were very small and always smaller than those for
polyester based specimens. The divergence of values was more significant in relation to
control solution of distilled water: for 84 days immersion period, average mass change of
epoxy mortar specimens was 0.09 % against 0.44 % for polyester mortar specimens.
Weight gains of polyester specimens immersed in control solution were, indeed, higher
than those occurred for acid and salted solutions. It seems that the presence of acid and
salt in water hinders, somehow, the sorption-diffusion process into polyester based PC
materials. This phenomenon was already noticed by Aniskevich et al. (2003), who
studied the influence of sorbed liquid and temperature on polyester PC creep behavior.
Based on experimental results, they concluded that the presence of acid in water hampers
the sorption-diffusion processes. This effect gets more expression, as the acid
concentration gets higher.
For both formulations, a very high mass change occurs for specimens immersed in
sodium hydroxide solution: after 84 immersion days, weight gains by polyester and
epoxy mortar specimens were, respectively, up to 2 and 9 times higher than
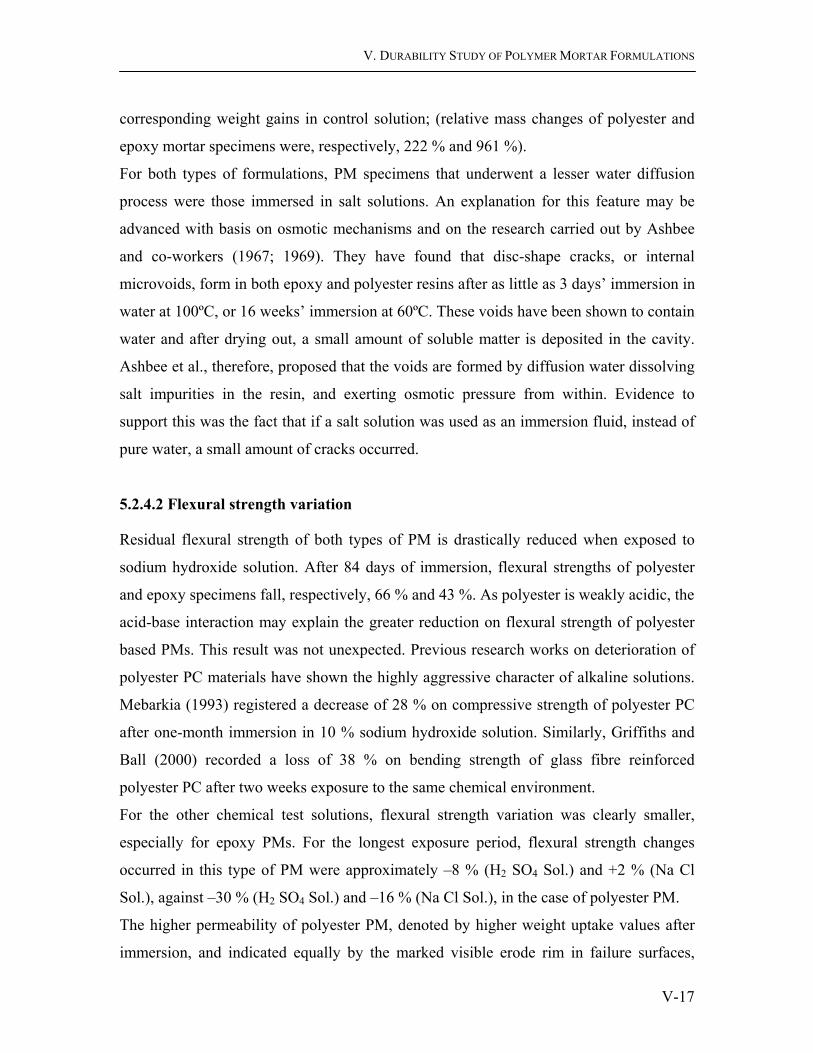
V. DURABILITY STUDY OF POLYMER MORTAR FORMULATIONS
V-17
corresponding weight gains in control solution; (relative mass changes of polyester and
epoxy mortar specimens were, respectively, 222 % and 961 %).
For both types of formulations, PM specimens that underwent a lesser water diffusion
process were those immersed in salt solutions. An explanation for this feature may be
advanced with basis on osmotic mechanisms and on the research carried out by Ashbee
and co-workers (1967; 1969). They have found that disc-shape cracks, or internal
microvoids, form in both epoxy and polyester resins after as little as 3 days’ immersion in
water at 100ºC, or 16 weeks’ immersion at 60ºC. These voids have been shown to contain
water and after drying out, a small amount of soluble matter is deposited in the cavity.
Ashbee et al., therefore, proposed that the voids are formed by diffusion water dissolving
salt impurities in the resin, and exerting osmotic pressure from within. Evidence to
support this was the fact that if a salt solution was used as an immersion fluid, instead of
pure water, a small amount of cracks occurred.
5.2.4.2 Flexural strength variation
Residual flexural strength of both types of PM is drastically reduced when exposed to
sodium hydroxide solution. After 84 days of immersion, flexural strengths of polyester
and epoxy specimens fall, respectively, 66 % and 43 %. As polyester is weakly acidic, the
acid-base interaction may explain the greater reduction on flexural strength of polyester
based PMs. This result was not unexpected. Previous research works on deterioration of
polyester PC materials have shown the highly aggressive character of alkaline solutions.
Mebarkia (1993) registered a decrease of 28 % on compressive strength of polyester PC
after one-month immersion in 10 % sodium hydroxide solution. Similarly, Griffiths and
Ball (2000) recorded a loss of 38 % on bending strength of glass fibre reinforced
polyester PC after two weeks exposure to the same chemical environment.
For the other chemical test solutions, flexural strength variation was clearly smaller,
especially for epoxy PMs. For the longest exposure period, flexural strength changes
occurred in this type of PM were approximately –8 % (H2 SO4 Sol.) and +2 % (Na Cl
Sol.), against –30 % (H2 SO4 Sol.) and –16 % (Na Cl Sol.), in the case of polyester PM.
The higher permeability of polyester PM, denoted by higher weight uptake values after
immersion, and indicated equally by the marked visible erode rim in failure surfaces,
V. DURABILITY STUDY OF POLYMER MORTAR FORMULATIONS
V-18
could be the main factor for the higher decrease in flexural strength showed by this type
of PM.
For both types of mortar, the specimens immersed in salt solution showed the smallest
flexural strength decrease after 84 immersion days. Moreover, for the first examination
periods (1, 7, and 21 days), even an increase in the flexural strength occurred. This
increase in flexural resistance could be irrelevant, but it also could be indicative of little
representation of control specimens. (The control specimens, chosen among all the
specimens proceeding from the same batch, could be precisely those, which had smaller
flexural strength).
The rust incrustations that appeared in the surface of some epoxy PM specimens
immersed in salt water, did not affect their flexural strength. It is a located and superficial
phenomenon, and even for longer immersion periods, it is not expected it becomes
influential in the mechanical strength of the material.
5.2.4.3 Correlation between mass and flexural strength variations
There is a positive correlation between mass change and flexural strength reduction.
This correlation is very clear in the case of polyester PMs immersed in distilled water,
alkalis and acid solutions, as shown in Fig. 5.8.
Fig. 5.8. Correlation between water uptake (mass change) and flexural strength reduction for both formulations of PM immersed in water, acid and alkalis solutions.
Polyester PM
R2 = 0.98
R2 = 0.97
R2 = 0.90
-80
-70
-60
-50
-40
-30
-20
-10
0
0 0.2 0.4 0.6 0.8 1Mass Change (%)
Flex
ural
Str
. Cha
nge
(%)
WaterSulph. Acid Sol.Sod. Hid. Sol.
Epoxy PM
R2 = 0.92
R2 = 0.67
R2 = 0.64
-80
-70
-60
-50
-40
-30
-20
-10
0
0 0.2 0.4 0.6 0.8 1Mass Change (%)
WaterSulph. Acid Sol.Sod. Hid. Sol.
V. DURABILITY STUDY OF POLYMER MORTAR FORMULATIONS
V-19
The linear correlation coefficients obtained were, respectively, 0.98, 0.97 and 0.90. In
relation to epoxy PM specimens, the correlation is not so strong: for the same test
solutions, the coefficients obtained were 0.64, 0.92 and 0.67.
The correlation between these two parameters was already expected, as mentioned in
previous works carried out by several researchers (Chawalwala 1996; Mebarkia 1993;
Mebarkia and Vipulanandan 1995; Ohama et al. 1986a).
It is very important in composite materials that good adhesion is maintained across the
interfacial region. This is because, in most multiphase composites, the load is transferred
from one phase to another through a shear mechanism at the interface. Previous studies
showed that polymers did not react or dissolve in water, and their strength is not affected
by immersion up to 3 years in water (Davis and Sims 1983; Kinlock 1987; Mebarkia
1993). Hence, it can be concluded that the most predominant factor causing the reduction
in strength is the degradation of the interface due to water diffusion into PM.
In the case of the test specimens (both types) that have been immersed in salt solution, it
was not possible to establish a positive correlation between water uptake and strength
reduction due to flexural strength increases in the first examination periods.
5.2.5 Conclusions
The effects of sodium chloride, sodium hydroxide and sulphuric acid solutions on the
bending strength and mass of epoxy and polyester PM formulations were investigated in
various periods, from 1 to 84 immersion days. A comparative analysis with the effect of
water immersion was also done.
Based on experimental results, the following conclusions are proposed:
Polyester and epoxy PM formulations are markedly attacked by sodium hydroxide
solutions. A deeper study, with longer immersion times, is needed to evaluate the
significance and the level of strength reduction.
Epoxy PMs are hardly affected by sulphuric acid and sodium chloride solutions,
which is an indicator of the excellence chemical resistance of this kind of material
to these aggressive chemical environments. It seems that the natural heterogeneity

V. DURABILITY STUDY OF POLYMER MORTAR FORMULATIONS
V-20
among specimens is, likely, the main reason of the small differences recorded for
the flexural strengths obtained for consecutive examination periods.
Flexural strength decrease of polyester PMs with immersion time in water,
sodium chloride and sulphuric acid solutions is not irrelevant, specially in the last
one, and it cannot be attributet to the natural variability among specimens
proceeding from the same batch. Another experimental program, with longer
immersion periods, would be needed to determine the trend decrease.
V. DURABILITY STUDY OF POLYMER MORTAR FORMULATIONS
V-21
5.3 Thermal Durability
5.3.1 Introduction
As mentioned earlier, durability is one of the most important properties for a material to
be used in the building industry. The relevant literature commonly reports the chemical
durability in various aggressive environments. However, thermal durability, i.e. the
ability of a component to retain its physical-mechanical properties during and after
exposure to severe thermal conditions, is also very important (Oshima et al. 2001).
Building components, during their lifetime, are often subject to changing temperatures.
These temperatures can change from well below zero up to about 80ºC in direct sunlight,
depending on geographical location and on the color of the surface, and it can be much
higher than the temperature of the surrounding air (Letsch 1987). Therefore, thermal
sensitivity is an important subject that must be taken into account in the evaluation of
durability and service life of construction materials.
One of the foremost problems related with polymeric composite materials, arises from the
viscoelastic properties of the polymer, which results in creep and high sensitivity to high
temperatures (Cano et al. 1998; Tavares et al. 2002). Mechanical properties of polymers
undergoing temperature variation change considerably, especially within the glass
transition temperature range. Glass transition temperature (Tg) takes place over a wide
temperature range, which lies for many resins used in Civil Engineering between 20ºC
and 80ºC. This means that during the service lifetime of the material the glass transition
can occur (Letsch 2001a). Hence, thermal durability becomes one of the most important
factors in the assessment criteria of a polymeric composite material, as a potential
construction material.
5.3.1.1 Overview
Previous works on the mechanical behavior of hydraulic concrete materials when
subjected to severe thermal conditions, can be found in Sun et al. (2001; 1999),

V. DURABILITY STUDY OF POLYMER MORTAR FORMULATIONS
V-22
Balendran et al. (2001), Komonen and Pantalla (2001), and Shao and Jiang (2001).
However, in spite of the previous explanation, there appears to be only a very limited
amount of work done on the performance of polymer concretes and mortars under the
same conditions. Furthermore, most of the related literature is restricted to a limited
temperature range and to a certain type of polymer. Traditional approaches are usually
focused on temperatures above room temperature, which is understandable taking into
account that typical polymer concrete resins present glass transition temperatures above
this value. However, resistance to very low temperatures, depending upon polymer
concrete application, could also be a very important and even crucial subject.
Letsch (2001b) conducted a research work on the mechanical behavior of a polyester PC
at temperatures of 23ºC, 40ºC and 60ºC. He concluded that the presence of higher
temperatures resulted only in a small decrease in compressive strength, but a relatively
large decrease in flexural strength and a very large increase in creep deformation.
A similar study was carried out by Vipulanandan and Paul (1990). The compressive and
splitting-tensile behavior of epoxy and polyester PCs were studied under various test
temperatures: 22ºC, 60ºC and 80ºC. In the same way as Lestch, they observed that
increasing temperatures causes only slight decreases in compressive strengths of both PC
formulations, while splitting-tensile strengths are severely affected by the same
temperature conditions.
A comparative study of the influence of temperature on the mechanical strength of three
different PCs (epoxy, polyester and acrylic based ones), had also been carried out by
Pardo and co-workers (1995), with the aim of establishing a criterion to determine the
safety factor for precast structures. Concrete specimens were tested in bending and
compression, after conditioning at different temperatures, from 20ºC to 200ºC. The test
results showed that, when the specimens were tested at room temperature, after
tempering, no important reduction in strength occurred. However, when the specimens
were tested at aging temperature, a significant decrease of both flexural and compressive
strength characteristics took place.
The same research team also analyzed the mechanical behavior of polyester PC after
exposure to 100 thermal fatigue cycles (San José et al. 1998). Six different thermal cycles
have been considered: 30 minutes at 20ºC followed by 3 hours at 40º, 60º, 80º, 120º, 140º
V. DURABILITY STUDY OF POLYMER MORTAR FORMULATIONS
V-23
and 160ºC, respectively for each cycle. After 100 thermal cycles, three specimens of each
series were tested at room temperature, and the other specimens were tested at the
maximum cycle temperature. They concluded that thermal fatigue does not affect
strength if PC is taken back to its initial conditions, and as long as polymer
decomposition temperatures are not exceeded. However, the combination of mechanical
and thermal actions up to 60ºC implies the obligation of applying the thermal partial
safety coefficients, depending on the type of resin and load (live or permanent).
Gálan (2001) also used thermal fatigue cycles to evaluate thermal durability of binder
formulations of unsaturated polyester PMs. The aim of her research work was to analyze
the viability of application of ‘Polialbero’ as local construction material. Polialbero was
the designation given by the research to PM prepared with a specific aggregate called
Albero. This aggregate can only be found in the province of Sevilla (Spain), and its use is
widespread in the Andalusia region. In order to simulate local weathering conditions
(temperature and moisture fluctuations), polialbero specimens were exposed to distinct
thermal fatigue cycles. Temperature and humidity ranges, simulating Spring/Summer and
Autumn/Winter season conditions, were defined according to the maximum and
minimum values recorded locally for these parameters in the last years. After 360 cycles,
corresponding to one year of outdoor exposure, no significant influence was observed on
mechanical strength of polialbero specimens.
A different approach was used by Oshima et al. (2001) to analyze thermal sensitivity of
epoxy and polyester PCs. Tests were performed on temperature-dependent mechanical
properties such as dynamic Young’s modulus, logarithmic decrement, creep coefficient,
compressive and flexural strengths. The study was conducted in order to determine the
temperature inflexion points in the respective properties where the temperature
dependency became dominant. Tests results showed that the inflection points were
related to the heat distortion temperature (HDT) of the resins used, rather than the glass
transition temperature (Tg). Furthermore, it was found out that the temperature inflexion
points were not affected by the resin content.
Only a few papers focused on freeze-thaw resistance of polymer mortars and concretes
have been written until now. The absence of moisture in the matrix of this kind of
concrete material, which is the principal cause of the relative vulnerability of ordinary
V. DURABILITY STUDY OF POLYMER MORTAR FORMULATIONS
V-24
hydraulic concretes to freeze-thaw actions, is probably the main reason for this lack of
data.
However, frost resistance is also related with the material porosity and with its coefficient
of water absorption, and as a result, depending upon these characteristics, frost durability
could also be an important feature to taken into account.
Chawalwala (1996) conducted a research work on freeze-thaw durability of vinyl and
polyester PC. The aim of his study was to assess the viability in applying these materials
as a wear overlay surface for a composite bridge deck. PC specimens were exposed to
controlled humidity freeze-thaw cycles, ranged from +15 ºC to –10 ºC, up to 500 cycles.
Flexural tests were then conducted in order to evaluate strength retention after
environmental exposure. It was observed that dry freeze-thaw cycling had practically no
effect on flexural properties of PC, while freeze-thaw cycling conducted under high
humidity conditions (90%) showed significant strength degradation.
Bhutta and co-workers (2001) studied the durability, including the freeze-thaw resistance,
of a polyester PM formulation with waste iron aggregates for counterweight purposes.
The tests were conducted in a temperature range of +5 ºC to –18 ºC. Freeze-thaw
durability was evaluated through the relative dynamic modulus of elasticity and mass
change of the specimens at every 30 cycles in a total of 300 cycles. At the end of the
experimental program, all the specimens were tested in compression. Throughout the
cycles, the measured relative dynamic modulus of elasticity of counterweight specimens
was practically the same, and moreover, no significant mass change was found. However,
after 300 cycles, the compressive strength of PM specimens was slightly influenced by
the alternating freeze-thaw actions.
When wet aggregates are used in PC formulations, as it is sometimes required in field
applications, their deterioration due to freeze-thaw actions can be more pronounced due
to misture. Under this perspective, Ohama et al. (1986b) analyzed the freeze-thaw
durability of a polyester PC formulation made with wet aggregates. Polyester PC
specimens were prepared with various moisture contents, from less than 0.1% up to 5%,
and tested for freeze-thaw cycling in water in a temperature range of –17.8 ºC to +4.4 ºC.
Freeze-thaw durability was evaluated through the weight change and the relative dynamic
modulus of elasticity measured at every 50 cycles up to 600 cycles. It was noticed, from

V. DURABILITY STUDY OF POLYMER MORTAR FORMULATIONS
V-25
the durability factor data, that the freeze-thaw resistance of polyester PC with aggregate
moisture content of 1%, or less, is excellent, while that of polyester PC with aggregate
moisture contents of 3% and 5% is very poor. Test results were attributed to the complex
effect of the strength reduction, due to the hydrolysis of polyester resin matrix during
curing process, together with the volume expansion caused by the freeze-thaw cycling
action.
The same research team conducted a posterior study, in order to improve the freeze-thaw
durability of polyester and methyl methacrylate PC made with wet aggregates (Ohama et
al. 1987). Moisture absorptive additives, such as zeolite and ordinary Portland cement, a
silane coupling agent and steel fibres were added to PC formulations in order to achieve
the intended purpose. It was concluded, from the test results, that the use of the
mentioned admixtures with wet aggregates causes a great deal of improvement in the
freeze-thaw durability of polyester and metyl methacrylate PCs, although their moisture
contents reaches about 5%. In particular, in the case of polyester PC, they realized that
the use of the ordinary Portland cement concrete as a moisture absorptive additive could
be recommended because of its hydraulic property.
5.3.1.2 Research objective
Following all the above studies, the work presented in this subsection aims to analyze and
quantify the strength degradation process occurring in the developed PM formulations as
a consequence of different thermal effects.
For this purpose, specimens of both formulations were exposed to the following thermal
conditions: conditioning at constant temperatures, for temperature levels between –20ºC
and +100ºC; positive thermal fatigue cycles (+20ºC / +100ºC); and wet and dry freeze-
thaw cycles (-10ºC / +10ºC).
Residual flexural strengths, during and after exposure to these severe thermal conditions,
were obtained.
The analysis of flexural strength degradation process allowed the assessment of material
thermal durability.
V. DURABILITY STUDY OF POLYMER MORTAR FORMULATIONS
V-26
5.3.2 Experimental Program
5.3.2.1 Test specimens
The study was conducted on prismatic specimens, 40x40x60 mm, of both formulations in
analysis. For each kind of PM formulation, five batches with 18 specimens each (3
control specimens + 15 test specimens) were casted.
All the specimens were allowed to cure for one day at room temperature and then post-
cured at 80ºC for three hours, before being exposed to the defined environmental
conditions.
5.3.2.2 Thermal durability tests procedure
A climatic chamber, shown in Fig. 3.6, was used to submit the test specimens to the
different thermal conditions defined in the following. Flexural tests were carried out
according to RILEM recommendation (RILEM 1995c).
i) Conditioning at constant temperature
To determine the influence of temperature on flexural strength of PM formulations, two
types of study were carried out:
• In the first one, specimens were heated or cooled to the different test temperatures
in the climatic chamber (three specimens for each temperature level), and after
that, they were immediately tested in bending at aging temperature (conditioning
temperature). Heating/cooling rates were respectively, +5 ºC/min. and –2 ºC/min.
Temperature test was maintained for 3 hours in order to establish a steady state
condition of heat transfer.
• The second study was carried out as the first one, but the specimens were quickly
tempered, by immersion in water, before being tested in bending at room
temperature. Test specimens were kept in the water bath for at least 3 hours.
ii) Thermal fatigue cycles
To evaluate the flexural strength deterioration of PM induced by repeated thermal
actions, specimens of both formulations were also exposed to the following thermal
fatigue cycles:
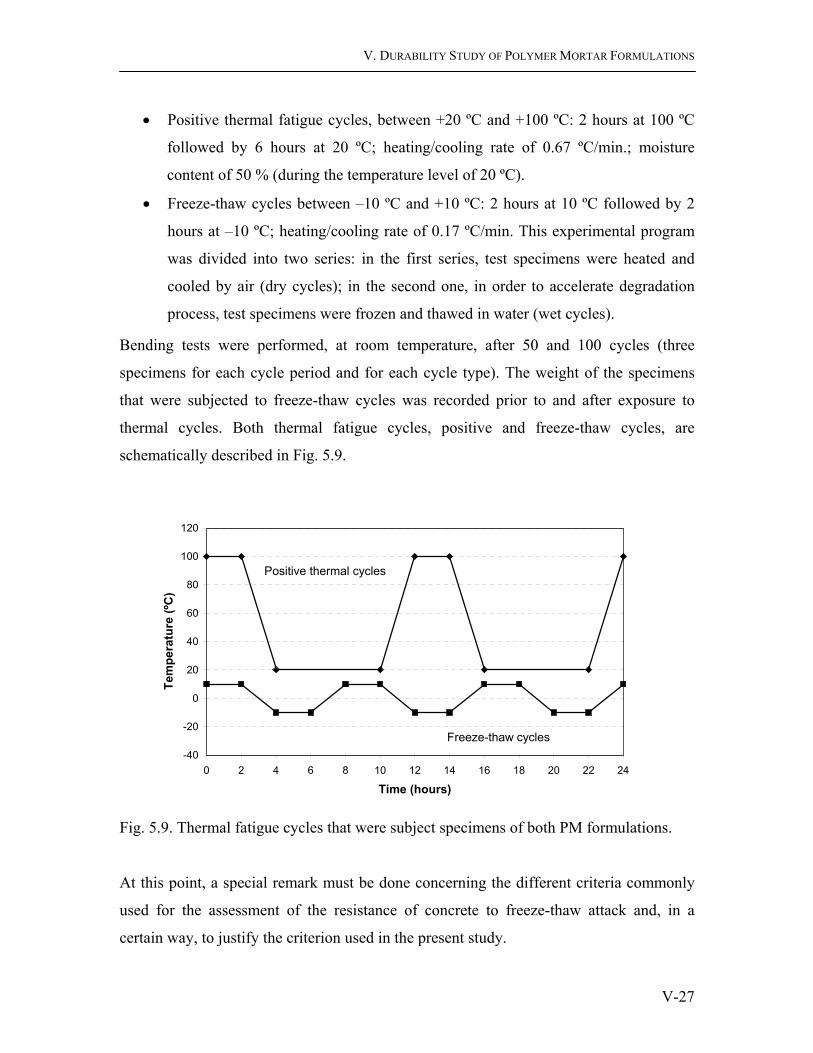
V. DURABILITY STUDY OF POLYMER MORTAR FORMULATIONS
V-27
• Positive thermal fatigue cycles, between +20 ºC and +100 ºC: 2 hours at 100 ºC
followed by 6 hours at 20 ºC; heating/cooling rate of 0.67 ºC/min.; moisture
content of 50 % (during the temperature level of 20 ºC).
• Freeze-thaw cycles between –10 ºC and +10 ºC: 2 hours at 10 ºC followed by 2
hours at –10 ºC; heating/cooling rate of 0.17 ºC/min. This experimental program
was divided into two series: in the first series, test specimens were heated and
cooled by air (dry cycles); in the second one, in order to accelerate degradation
process, test specimens were frozen and thawed in water (wet cycles).
Bending tests were performed, at room temperature, after 50 and 100 cycles (three
specimens for each cycle period and for each cycle type). The weight of the specimens
that were subjected to freeze-thaw cycles was recorded prior to and after exposure to
thermal cycles. Both thermal fatigue cycles, positive and freeze-thaw cycles, are
schematically described in Fig. 5.9.
Fig. 5.9. Thermal fatigue cycles that were subject specimens of both PM formulations.
At this point, a special remark must be done concerning the different criteria commonly
used for the assessment of the resistance of concrete to freeze-thaw attack and, in a
certain way, to justify the criterion used in the present study.
-40
-20
0
20
40
60
80
100
120
0 2 4 6 8 10 12 14 16 18 20 22 24
Time (hours)
Tem
pera
ture
(ºC
)
Positive thermal cycles
Freeze-thaw cycles

V. DURABILITY STUDY OF POLYMER MORTAR FORMULATIONS
V-28
Generally, in the case of Portland cement concrete, the criteria are the course of scaling
during the attack and the overall amount of scaling after the attack. However, only by
means of the amount of scaling, it can be hardly assessed how far the microstructure has
really been damaged (Dimming et al. 2001). Especially, in the case of PC and PM, the
consideration of scaling alone is questionable.
Another common method to assess concrete deterioration is to measure the change in the
dynamic modulus of elasticity of the specimen. The reduction in the modulus after a
number of cycles of freezing and thawing expresses the deterioration of the concrete.
With the ASTM method (ASTM:C666/C666M-03 2003) it is usual to continue freezing
and thawing for 300 cycles or until the dynamic modulus of elasticity is reduced to 60%
of its original value, whatever occurs first. Durability factor can then be calculated as
function of the total number of the cycles, the number of cycles at the end of the test, and
the relative dynamic modulus of elasticity. There are no establish criteria for acceptance
or rejection of concrete in terms of the durability factor; this parameter is thus primarily
useful in a comparison of different concretes. These methods, using the measurement of
the dynamic elasticity modulus, indicate damage before it has become apparent, either
visually or by other methods, although there are some doubts about the interpretation of
the decrease of the modulus after the first few cycles (Neville 1995).
The effects of freezing and thawing can also be assessed from measurements of the loss
of compressive or flexural strength, or from observations of the change in length or in the
mass. A large change in length is indicative of internal cracking. The measurement of
mass change is more appropriate when damage takes place mainly at the surface of the
specimen, but is not reliable in cases of internal damage. Loss of load carrying capacity
gives a straight measure of strength deterioration of concrete, but requires a superior
number of test specimens as a destructive assessment method.
It can be seen that a number of tests and of means of assessing freeze-thaw durability are
available, and thus, the interpretation of test results may become quite difficult. The ideal
would be to use all of them, in order to make possible a consistent comparison with other
concrete materials or other studies, but this procedure would not be reasonable, neither in
terms of time, nor in terms of the number of specimens required.

V. DURABILITY STUDY OF POLYMER MORTAR FORMULATIONS
V-29
As a straight assessing methodology of the damage, and also in order to maintain a
uniform criterion throughout this thesis, the assessment of freeze-thaw durability of PM
formulations was based on loss of flexural strength. Nevertheless, the experimental
program could be complemented and improved with the measurement of the changes in
dynamic elasticity modulus. Unfortunately, the unavailability of resonance vibration
equipment, necessary to measure the fundamental transverse frequency, hindered the
determination of this parameter.
The range of temperatures, heating/cooling rate and periods of time under the same
temperature level were chosen among usual values recommended by the norms
(ASTM:C666/C666M-03 2003; EN:1340 2003; JIS:A-6204 2000) and reported in
previous literature. A previous control test was performed in order to check if the chosen
parameters met the required conditions.
In spite of the number of cycles prescribed by ASTM test method (300 freeze-thaw
cycles), only 100 cycles were carried out in this experimental program. Limitations of
time and availability schedule of climatic chamber were the restrictive factors that
conditioned this option. Nevertheless, it can be stated that some accelerated freeze-thaw
tests may result in destruction of concrete materials that in practice could behave
satisfactory. The ability of a concrete material to withstand a considerable number of
laboratory freeze-thaw cycles (say 100-150) is a probable indication of its high degree of
durability under service conditions (Neville 1995).
5.3.3 Experimental Results and Discussion
5.3.3.1 Influence of temperature on flexural strength
Flexural test results (average flexural strength and correspondent standard deviation) are
presented at Table 5.4. Relationships between conditioning temperature and flexural
strength of both formulations of PMs, for each test condition, are shown in Figs. 5.10 and
5.13. In order to access test temperature effect on ductility and stiffness of PM
formulations, typical shapes of stress deflection curves obtained from flexural tests were
determined and plotted in Figs. 5.11 and 5.12.

V. DURABILITY STUDY OF POLYMER MORTAR FORMULATIONS
V-30
Table 5.4. Flexural test results after exposure to different test temperatures.
Epoxy PM
Flex. Strength | St. Deviation (MPa)b)
Polyester PM
Flex. Strength | St. Deviation (MPa)b) Test Temp.
(ºC) Aging Temp. Room Temp. Aging Temp. Room Temp.
-20 51.30 | 2.32 41.35 | 1.78 20.22 | 0.97 22.50 | 0.44 -10 48.10 | 1.45 - 19.67 | 2.61 - 0 45.66 | 0.82 40.97 | 2.20 20.02 | 1.26 22.90 | 2.05 +10 41.92 | 2.21 - 20.29 | 2.19 - +20 41.26 | 0.73 - 20.89 | 2.08 - +23 (Ref.)a) 41.09 | 1.24 42.64 | 0.79 20.33 | 0.26 23.80 | 2.05 +30 33.48 | 0.51 - 18.98 | 0.85 - +40 18.37 | 0.78 42.25 | 0.68 18.87 | 0.46 22.98 | 1.95 +50 6.86 | 0.43 - 15.21 | 0.25 - +60 3.09 | 0.13 41.72 | 0.81 12.89 | 0.20 23.32 | 2.32 +80 1.26 | 0.52 - 6.92 | 0.18 +100 0.80 | 0.61 45.48 | 0.44 2.44 | 0.19 24.26 | 1.21
a) Control specimens. b) Average values of three specimens.
Fig. 5.10. Flexural strength of epoxy and polyester PMs as function of test temperature.
Flexural tests at aging temperature
0
10
20
30
40
50
60
-30 -20 -10 0 10 20 30 40 50 60 70 80 90 100 110
Temperature (ºC)
Flex
ural
Str
engt
h (M
Pa)
Polyester PM
Epoxy PMRef.
Ref.
+ 11.1 %
+ 24.8 %
- 92.5 %
- 55.3 %
- 1.5 %- 0.5 % - 36.6 % - 7.2 %
HDT Epoxy
HDT Polyester
Tg Epoxy
Tg Polyester

V. DURABILITY STUDY OF POLYMER MORTAR FORMULATIONS
V-31
Fig. 5.11. Stress-deflection curves of epoxy PM specimens obtained from flexural tests carried out at aging temperatures.
Fig. 5.12. Stress-deflection curves of polyester PM specimens obtained from flexural tests carried out at aging temperatures.
Flexural tests at aging temperature
0
10
20
30
40
50
60
0 0.5 1 1.5 2 2.5 3 3.5 4 4.5 5
Deflection (mm)
Flex
ural
Str
ess
(MPa
) Epoxy PM
-20ºC-10ºC
0ºC +10ºC+20ºC
+30ºC
+40ºC
+50ºC+60ºC
+100ºC+80ºC
Flexural tests at aging temperature
0
5
10
15
20
25
0 0.2 0.4 0.6 0.8 1 1.2 1.4 1.6 1.8 2
Deflection (mm)
Flex
ural
Str
ess
(MPa
) Polyester PM
+80ºC
+100ºC
+60ºC
+50ºC
+40ºC+30ºC
+20ºC
-10ºC
-20ºC
+10ºC 0ºC

V. DURABILITY STUDY OF POLYMER MORTAR FORMULATIONS
V-32
Fig. 5.13. Flexural strength of epoxy and polyester PMs, after tempering, as function of conditioning temperature.
i) Flexural tests carried out at aging temperature
As shown in Fig. 5.10, flexural strength of epoxy mortars presents a strong and marked
temperature dependency. The characteristic value of flexural resistance remains stable
just within a limited range of temperatures, approximately between +10 ºC and +23 ºC.
For temperatures above room temperature, flexural strength of this particular mortar
decreases drastically: between +23 ºC and +50 ºC, a decrease of 85% of its initial
resistance occurs, and at +100 ºC, the load carrying capacity becomes almost
insignificant.
On the other hand, for temperatures below +10 ºC, bending strength tends to increase as
the temperature test decreases. This trend is very clear, and it appears to indicate, that for
lower temperatures than –20 ºC, a higher increase of flexural strength should be expected.
Relatively to polyester mortar formulation, it seems that its flexural strength is not
significantly affected by environmental temperature within temperature range between
–20 ºC and +40 ºC. For higher temperatures, a gradual decrease of flexural strength
Flexural tests at room temperature
0
10
20
30
40
50
60
-30 -20 -10 0 10 20 30 40 50 60 70 80 90 100 110
Temperature (ºC)
Flex
ural
Str
engt
h (M
Pa)
Polyester PM
Epoxy PM
+ 6.7 %
Ref.
Ref.

V. DURABILITY STUDY OF POLYMER MORTAR FORMULATIONS
V-33
occurs, but the decrease rate is lower than the one that occurs for epoxy binder
formulation.
For both mortar formulations, the loss of load bearing capacity with increasing
temperature is associated with a progressive loss of material stiffness, as shown in Figs.
5.11 and 5.12. As temperature test increases, the flexural elasticity modulus decreases
and failure mode becomes more ductile, and less brittle.
The temperature values of the inflection points, when temperature dependency becomes
dominant, are related to the heat distortional temperatures (HDT) of the resins used in
each mortar formulation, rather than the correspondent glass transition temperatures (Tg),
as can be seen in Fig. 5.10. These points, named by other researchers (Oshima et al.
2001) as ‘heat distortional temperatures of polymer mortars’, are both located around 10
ºC lower than HDT values of resins used (40ºC and 24ºC respectively, for polyester and
epoxy PM formulations). Although the inflection points of the temperature dependency
of the flexural properties of PM formulations are well related to HDT of resins used, the
flexural properties are not related to HDT, which are mainly the characteristics values of
the deformation property of resins.
ii) Flexural tests carried out at room temperature after specimens tempering
According to test results presented in Fig. 5.13, conditioning temperature during exposure
time had no significant influence on flexural strength of both formulations, as long as
specimens were taken back to their initial environmental conditions and tested at room
temperature. A slight increase on flexural strength of epoxy mortar specimens that have
been exposed to the highest conditioning temperature was observed, possibly due to a
post-curing phenomenon. A similar behavior was found by Pardo and co-workers (1995)
on a epoxy PC formulation subjected to the same conditions.
Similarly, no noteworthy differences induced by temperature conditioning were observed
on the flexural elasticity modulus and failure mode of mortar specimens.
The recovering of initial flexural properties observed on both formulations could be
explained, partially, by molecular mobility of polymeric chains. This mobility increases
with temperature, and is associated to local motions of the less hindered groups around
their equilibrium position. As temperature reaches the glass transition temperature,
molecular mobility strongly increases leading to configuration rearrangements of the

V. DURABILITY STUDY OF POLYMER MORTAR FORMULATIONS
V-34
polymer chain backbones. The loss of mechanical strength is one consequence of this
process. However, when polymers are tempered, there is not enough energy to maintain
this mobility, and therefore, initial cohesion between polymeric chains is recovered.
5.3.3.2 Influence of thermal fatigue cycles on flexural strength
Average flexural test results of mortar specimens that have been subjected to thermal
fatigue cycles are presented in Table 5.5. The weight change of mortar specimens
submitted to freeze-thaw cycles is also presented. Residual flexural strengths of both
formulations after 50 and 100 exposure cycles, for each different thermal cycle, are
shown in Figs. 5.14 to 5.16.
In addition, in Fig. 5.17, failure surface of both types of PM specimens that were
submitted to 100 freeze-thaw cycles in water is also shown.
Table 5.5. Flexural test results after exposure to positive fatigue cycles and freeze-thaw cycles.
Epoxy PM Polyester PM
Thermal Fatigue cycles Flex. Str. | St. Dev.
(MPa)a) Mass change (%)a, b)
Flex. Str. | St. Dev. (MPa)a)
Mass change (%)a, b)
+20ºC / +100ºC
- 0 cycles 40.70 | 0.27 - 20.33 | 1.24 - - 50 cycles 34.75 | 2.58 - 19.17 | 1.28 - - 100 cycles 30.82 | 1.66 - 19.49 | 1.63 -
-10ºC / +10ºC (dry)
- 0 cycles 40.85 | 1.11 0 22.11 | 0.96 0 - 50 cycles 40.56 | 2.69 0.010 23.20 | 0.83 0.031 - 100 cycles 39.18 | 1.86 0.017 23.19 | 0.30 0.052
10ºC / +10ºC (wet)
- 0 cycles 40.85 | 1.11 0 22.11 | 0.96 0 - 50 cycles 38.27 | 0.61 0.094 23.40 | 0.20 0.240 - 100 cycles 38.66 | 1.66 0.137 22.11 | 0.63 0.355
a) Average result of three specimens. b) Mass change was determinate in accordance with RILEM TC113/PC-11 (RILEM 1995a).

V. DURABILITY STUDY OF POLYMER MORTAR FORMULATIONS
V-35
Fig. 5.14. Residual flexural strength of epoxy and polyester PMs after exposure to 50 and 100 positive thermal fatigue cycles.
Fig. 5.15. Residual flexural strength of epoxy and polyester PMs after exposure to 50 and 100 freeze-thaw dry cycles.
Positive thermal fatigue cycles
0
10
20
30
40
50
Nº of thermal cycles
Flex
ural
Str
engt
h (M
Pa)
Epoxy PM
Polyester PM
20ºC/100ºC
-14.6 %- 24.3 %
- 5.7 % - 4.1 %
0 50 100
Ref.
Ref.
Freeze-Thaw dry cycles
0
10
20
30
40
50
Nº of thermal cycles
Flex
ural
Str
engt
h (M
Pa)
Polyester PM
Epoxy PM
-10ºC/10ºC
- 0.7 % - 4.1 %
+ 4.9 % + 4.9 %
0 50 100
Ref.
Ref.

V. DURABILITY STUDY OF POLYMER MORTAR FORMULATIONS
V-36
Fig. 5.16. Residual flexural strength of epoxy and polyester PMs after exposure to 50 and 100 freeze-thaw wet cycles.
Fig. 5.17. Failure surface of PM specimens after exposure to 100 freeze-thaw wet cycles.
Freeze-thaw wet cycles
0
10
20
30
40
50
Nº of thermal cycles
Flex
ural
Str
engt
h (M
Pa)
Polyester PM
Epoxy PM
- 6.3 % - 5.4 %
+ 5.8 % 0 %
0 50 100
-10ºC/10ºC
Ref.
Ref.
Epoxy PM Polyester PM
V. DURABILITY STUDY OF POLYMER MORTAR FORMULATIONS
V-37
i) Positive thermal fatigue cycles
The influence of thermal fatigue cycles, between +20 ºC and +100ºC, on flexural strength
of epoxy PM is not irrelevant. Regardless of its recovering capacities showed by last
tests, the continued exposure of epoxy PM to high temperatures has a negative effect on
its flexural strength. After 50 thermal fatigue cycles, a percentage drop of 14 % occurs on
flexural strength, and after 100 cycles, this property falls to 75 % of its initial value.
It seems that the continuous cycling to temperatures up to 100 ºC (more than twice the
epoxy resin Tg), leads somehow to partial degradation of the epoxy network. This
phenomenon, not noticeable for one cycle, becomes notorious after a certain number of
cycles, as degradation progresses cycle after cycle.
The described phenomenon has no significant expression in the case of unsaturated
polyester mortars. In this case, the maximum cycling temperature is only 15 % higher
than the polyester resin Tg, so it represents a much less severe condition to the polyester
polymer network.
The flexural elasticity modulus and failure mode of both type of mortars are not affected
by exposure to these thermal actions.
ii) Freeze-thaw cycles
Exposure to thermal fatigue cycles between –10 ºC and +10 ºC had no relevant influence
on flexural strength of both formulations of PMs. Even for specimen’s series immersed in
water, subjected to frost attack, the flexural strengths retained after 100 freeze-thaw
cycles were still very high. In addition, no scaling surface was observed and no sediments
appeared on water containers. This means that specimens weight change was only due to
water absorption.
Frost damage is very clearly linked to water uptaking during freeze/thaw exposure or to
the degree of water saturation. The obtained results may be explained by the insufficient
water diffusion into PM specimens. After 100 freeze-thaw cycles, only a small amount of
water up-take was observed on both types of test specimens and furthermore, as shown in
Fig. 5.17, no erode rim was visible on their failure surfaces after bending tests. The low
degree of water absorption and high watertightness of PM specimens, already known by

V. DURABILITY STUDY OF POLYMER MORTAR FORMULATIONS
V-38
the previous study (see subchapter 5.2), are most certainly the main reasons for the
absence of frost damage.
This explanation is supported by Setzer research (2001). According to Setzer, the high
number of freeze-thaw cycles is primarily needed to saturate the specimens artificially by
a micro-ice-lens-pump, and not for the fatigue fracture process. The micro-ice-lens-pump
model, described by Setzer, is based on the phenomenon that the three phases of water
coexist between 0 ºC and –60 ºC with thermodynamical stability. This is only possible
because a high negative pressure is generated in the unfrozen gel-water. In the cooling
phase the matrix is compressed, water is squeezed out and trapped at the ice. During
subsequent heating, the matrix expands and water is sucked in from external sources
since the ice particles are still frozen. With every freeze-thaw cycle, the degree of
saturation is increased until a critical value is reached and damage sets in. Until this point,
only a relative small damage should be expected.
Water uptake during the 100 freeze-thaw cycles was not sufficiently enough to saturate
the PM specimens, as indicated by weight change observed, and therefore, no noticeable
damage induced by the alternate freezing and thawing actions occurred.
5.3.4 Conclusions
In this subchapter, the influence of temperature and thermal fatigue cycles on flexural
behavior of binder formulations of PMs in study was briefly discussed. Based on test
results, the following conclusions can be drawn:
• Flexural properties of both PM formulations are strongly affected by environment
temperature. Except within a limited temperature range, flexural strength of these
mortar formulations decreases drastically with raising test temperatures. The
inflection points, where temperature dependency becomes notorious, are related
to the heat distortional temperatures of the resins used rather than the glass
transition temperatures, in accordance with the conclusions of the investigation
work carried out by Oshima and co-workers (2001).

V. DURABILITY STUDY OF POLYMER MORTAR FORMULATIONS
V-39
• Epoxy mortars are more sensitive to temperature than polyester mortars. The
‘HDT of epoxy mortars’ is lower than corresponding ‘HDT of polyester mortars’.
After such critical points, decrease of flexural strength of epoxy-based mortars
occurs at a higher rate. For temperatures lower than +10 ºC, flexural behavior of
epoxy mortars improves with further decreases in temperature.
• Exposure to constant or changing temperatures (thermal fatigue cycles) has no
significant influence on flexural properties of both formulations of PM, as long as
specimens are taken back to their initial environmental conditions. However,
recovering capacity of epoxy mortars is gradually reduced by repeated exposure
to high temperatures.
• One hundred freeze-thaw cycles, between –10 ºC and +10 ºC, produce very little
damage on both epoxy and polyester PMs, possibly due to a reduced degree of
water absorption.
These experimental results show the relevance of material properties assessment with
temperature. In particular, with epoxy PM formulation, it can be concluded that the use of
such material is restricted to lower temperature environments in order to benefit from its
total potential in strength. In the case of higher temperatures care should be taken in both
formulations as properties may drop significantly.
V. DURABILITY STUDY OF POLYMER MORTAR FORMULATIONS
V-40
5.4 Weathering Durability
5.4.1 Introduction
Most materials are subjected to weathering.
Chemical and physical processes as a result of exposure to the elements degrade the
earth’s crust. The rate of deterioration depends on the nature of the material: for the
hardest rocks, the time scale extends to millions of years whereas for some organic
polymers, major changes can be induced by exposures of a few days (Davis and Sims
1983).
Polymer composites, in many of their applications, are often exposed to the outdoor
environment. Thus, there is a natural concern regarding the weatherability of these
materials, partly because composites are relatively recent materials and, in part, because
if the useful lifetime of these materials can be predicted their maintenance and
replacement can be planned.
5.4.1.1 Agents of the weather
Sunlight, temperature, moisture, wind, dust and pollution, are among the main variables
or components of the weather that cause degradation (Greathouse and Wessel 1954).
i) Sunlight:
The sun is the major cause of most climatic phenomena found on earth. Heat, atmosphere
moisture, air movement and winds are primarily related to the sun.
For most polymeric materials degraded outdoors the main cause of loss of properties is
the photo-oxidative attack, i.e. the combined action of oxygen and sunlight on their
chemical structure.
In an attempt to quantify sunlight as a deterioration agent, three main approaches have
been proposed based on measurement of the following aspects: sunshine duration, total
solar radiation and ultraviolet radiation. In going from the former to the later, the
information becomes more specific, however, the availability of such data also decreases

V. DURABILITY STUDY OF POLYMER MORTAR FORMULATIONS
V-41
in the same sequence. Whereas there are thousands of places where sunshine hours are
computed, sites where continuous measurement of solar ultraviolet radiation is made are
numbered in the tens (Davis and Sims 1983).
Efforts have been made to relate resistance to photo degradation of polymers to the
number of sunshine hours they can withstand before loosing their useful properties. The
main limitation arises from the fact that the measurement devices of sunshine duration,
such as Campbell-Stokes and Martin-Marvin sunshine recorders, do not make the
differentiation neither between early morning and mid-day sunshine hour, nor between
sunshine in the tropics and sunshine in a temperate zone (Coulson 1975).
The search for a quantitative and reliable relationship between sunshine hours and global
solar radiation has been the subject of considerable interest since it is recognized as a
precious mean of complementing the limited amount of available solar radiation data
(Collingbourne 1976). However, this scope is not as simple as the basic dependence of
global radiation on latitude and on time (day hour and day year), or more accurately on
sun elevation, is significantly affected by the general weather conditions, in particular the
degree of cloud cover.
Approximately 6% of the total solar radiation reaching the earth’s surface is ultraviolet
radiation, with wavelengths between 290 nm and 400 nm. Radiation below 290 nm is
effectively eliminated by stratospheric ozone. Since most polymers have bond
dissociation energies on the order of 290 nm to 400 nm wavelengths, they are greatly
affected by exposure to this portion of solar spectrum (Chin et al. 2001).
The intensity of global ultraviolet radiation depends on, among other things, the altitude
of the sun and therefore, like total solar radiation, it is subject to diurnal and seasonal
changes. As the ultraviolet portion of the solar spectrum is attenuated more than any other
region of the spectrum by passage through the atmosphere, these daily and seasonal
changes are more pronounced. Further, all wavelengths within the ultraviolet region are
not equally affected: as the wavelength is reduced the scattering becomes increasingly
important. The relative intensities of different wavelengths can vary within wide limits.
The effect of cloud cover, fog and fluctuations in the thickness of the ozone layer, which
also presents diurnal and seasonal changes, increase the range of possible ultraviolet
radiation intensities (Koller 1965).

V. DURABILITY STUDY OF POLYMER MORTAR FORMULATIONS
V-42
For long-term outdoor exposure, ultraviolet radiation data is more meaningful, therefore,
several programs have been developed to estimate ultraviolet radiation doses on a
worldwide basis (Schulze and Gräfe 1969).
Coblentz (1952) has established an empirical relationship between radiation of
wavelength up to 315 nm and total solar radiation for each month of the year at
Washington , and various researchers have made use of these ratios to estimate ultraviolet
radiation doses (McCullough 1970). However, it should be pointed out that estimates
should only be attempted for sites that have sun zenith angles similar to those of
Washington.
Although medical community have in the past concentrated interest in the shortest
wavelengths, which are responsible for skin cancer and erythema, many natural and
synthetic polymeric materials are affected by wavelengths outside the ‘erythema’ region
(λ<310 nm), for instance, polyphenylene oxide is degraded by wavelengths up to about
400 nm. As a result of this property, this material has been used to give a continuous
measure of the total solar ultraviolet radiation region at 24 sites throughout the world.
(Davis et al. 1976). The total annual doses of ultraviolet radiation correlates quite well
with site altitudes. Although clear sky reference sites tended to have higher annual doses
than sites which had higher preponderance of cloud, it was observed that the correlation
of annual ultraviolet radiation with latitude was much more obvious than that observed
for total solar radiation. Estimates can be made for other sites with similar latitudes, but
care should be taken as the variable distance to the sea (continental or maritime location),
also has considerable influence on total solar ultraviolet radiation.
ii) Temperature:
Extreme temperatures can have an adverse effect on the performance of polymeric
materials: low environment temperatures may reduce the flexibility of a normal rubbery
material and the opposite may well soften the stiffest thermoset resin.
Air temperature is primarily determined by the amount of solar radiation received. In
general, temperatures decrease with latitude towards Polar Regions. Until 1983, the
lowest temperature ever recorded was –88ºC at Vostock in the Antarctic, and the highest
temperature, 58ºC, was observed at El Fasher, in Libya, 13º 38’ north of the equator
(Davis and Sims 1983). These extremes, whilst they demonstrate the possible range of

V. DURABILITY STUDY OF POLYMER MORTAR FORMULATIONS
V-43
temperatures that could be encountered, are not realistic values for the purpose of
considering the deterioration of the materials. Within this scope, it is more usual to
consider the mean maximum and the mean minimum values over some interval of time,
normally a month. The oceans and large landmasses modify temperature dependency on
latitude. Maritime sites tend to be cooler in summer and warmer in winter than
continental sites of similar latitudes. The high heat capacity of water and its high heat of
evaporation and condensation have the effect of reducing the range of temperatures over
oceans.
Diurnal range of temperatures, also affected by the continentally, is also an important
contributing factor in weathering, as significant mechanical stresses can be induced by
large temperature variations in composite systems containing materials with widely
different coefficients of thermal expansion.
In summary, temperature is strongly related to latitude but factors such as altitude, local
topography, cloud cover and continentally can modify this relationship significantly.
However, nowadays there is a large amount of available data and one can estimate with
reasonable reliability the prevailing temperature for most areas of the globe (Gates 1965;
Greathouse and Wessel 1954).
iii) Moisture:
Moisture, whether in the form of dew, frost, rain or snow, also plays a major part in the
weathering processes. The importance of water lies in the combination of its unique
physical properties with its chemical reactivity, and it is for this reason that moisture is
such an important factor in the deterioration of organic materials.
The chemical attack of water on polymer bonds and on the interface between matrix and
reinforcement of polymeric composites, the physical damages caused by freeze-thaw
cycles on permeable materials, the leaching of additives from plastics and rubbers, the
dimensional changes caused by the systematic alternation between dry and wet periods,
and the biological attack favored by long periods of wetness surface, are some of the
deleterious effects of exposure to rain, snow and atmospheric moisture (Davis and Sims
1983).
Whatever the form that moisture takes, it is strongly dependent on environment
temperature. There is a wide variation in the relative humidity and in the amount of

V. DURABILITY STUDY OF POLYMER MORTAR FORMULATIONS
V-44
rainfall recorded throughout the globe. In general, precipitation variations are larger
within the tropics.
As the same way as for ambient temperature, there is a large amount of available data
relatively to precipitation levels and relative humidity of almost areas of the globe (Gates
1965).
iv) Pollutants:
Pollutants, which can cause the deterioration of polymers, include inert particle’s matter,
biologically active materials and reactive gases (Davis and Sims 1983). Whatever the
nature of the pollutant, air movement is generally the prime mean of transport.
The wind is the usual transporting agent of solid particles. Air is never without dust or
smoke in suspension. The fires or volcanic eruptions furnish some of the particles carried
in the air, but even more are proceeding from the erosion of earth’s crust by the wind
itself. The range of diameters of sand particles and dust extends from about 0.1 to 2000
µm. In general, depending upon wind velocity, the air mass in movement carrying sand is
restricted to the air layer within the first meter above the ground. Therefore, most
abrasion damage caused by sand grains is at or near ground level. In contrast, dust
particles can remain suspended in the air indefinitely, and can settle on surfaces at any
height.
High environment temperature, relative humidity below 30% and the drying action of the
wind invariably aggravate the dust problems, although the correlations are not known
quantitatively. A coating of dust can have a number of effects on the stability of a
material. Some dusts, due to their chemical composition, can initiate or catalyze chemical
attack on a material, particularly when moist. A layer of dust can also act as a trap for
biologically active materials and favours hydrolytic processes, as it maintains a higher
humidity level by water entrapment than would otherwise exist in equilibrium. On the
other hand, dust may also have a protective effect on material. It can absorb a significant
amount of solar radiation and thus have the double effect of decreasing the temperature
attained by the specimen and of decreasing the extent of photo degradation (Davis and
Sims 1983).
Concerning reactive gases, the most commonly found in the atmosphere are sulphur
compounds, ammonia, oxides of nitrogen, aliphatic and aromatic hydrocarbons, carbon
V. DURABILITY STUDY OF POLYMER MORTAR FORMULATIONS
V-45
monoxide and carbon dioxide (Stern 1978). These volatile pollutants are generally
associated with man’s industrial and domestic activities. However, many of those are also
emitted by natural sources, such as volcanic eruptions and forest fires. Sulphur dioxide is
the only major pollutant that arises mainly from man-made sources.
Colour, transparency, and surface resistance of polymeric materials can be significantly
altered by chemical and physical modification of the surface, and for that reason all
reactive pollutants constitute a threat to the service life of these materials in the natural
environment (Jellinek 1978).
Due to a synergistic effect, the combined action of aforementioned weather agents has a
higher deterioration effect than the sum of the eventual damages caused by each one of
them if they could act one at a time.
Atmospheric pollutants, such as sulfur oxides, hydrocarbons, dust and soot particles, may
cause degradation, but in combination with solar radiation and other weather factors, they
can be responsible for severe damage. Soot is acidified by interaction with moisture and
other particles. In the presence of sulfur dioxide and oxygen, ultra-violet (UV) radiation
causes cross-linking of polymer and is responsible for the rapid loss of color in pigment
coatings (Fried 2003; Mills 1993). Micro cracks that develop on a UV irradiated surface
provide pathways for rapid ingress of moisture and chemical agents. Moisture, especially
in the form of dew, can also remove soluble products of photo-oxidation reactions from a
UV irradiated surface, and thereby, expose fresh surfaces susceptible to further
degradation by UV radiation (Fried 2003; Sinmazçelik 2006; Springer 1984).
Polymer composites’ weathering is, as this way, a complicated process with ill-defined
interactions among the variables (Pickett and Gardner 2005), and hardly assessed by
accelerated weathering devices or by relative ‘short-term’ exposures to natural
environments.
5.4.1.2 Weathering test methods for polymeric materials.
- Natural ‘versus’ accelerated and/or artificial weathering tests-
For new materials, the background data on weathering performance is generally not
known. While it is preferable to have factual information on the actual long-term
performance outdoors of a material, reliable prediction of durability is recognized as

V. DURABILITY STUDY OF POLYMER MORTAR FORMULATIONS
V-46
being a necessary substitute in most cases for the confident outdoor application of
polymeric materials. Within this scope, three complementary approaches have been
applied:
• Natural outdoor exposure trials;
• Accelerated outdoor exposure trials;
• Laboratory artificial weathering.
Organizing weathering test methods in this manner, a trade off exists between
acceleration and confidence. In going from the former method to the later, the speed of
obtaining test results increases, but the confidence or reliability of such data, (e.g., the
types and rates of degradation are in fact those that can be observed in the end use
environment?), also decreases in the same order (Atlas 2005).
i) Natural outdoor exposure trials
Of the three approaches, that of outdoor exposure trials has the longest history.
Natural outdoor exposure testing of polymeric materials began, in the U.S.A., in the early
20th century, when painted or coated samples were exposed at sites in North Dakota
(Pickett and Gardner 2005). Investigators later found that the subtropical and tropical
climates would cause their paints or coatings to fail much sooner, and thus allow faster
turn around of the data. The high levels of temperature, humidity and solar radiation
found in such regions have proved being more aggressive to materials than those of
temperate zones. As the levels of individual critical weathering variables increase, the
probability of interactions between these variables also increases. Interactions can
accelerate deterioration rates beyond what is expected by increased levels of critical
weathering factors alone (Davis and Sims 1983).
Thus, tropical and other severe exposure trials were considered as a means of obtaining
advanced information on the resistance of a material to temperate conditions.
Several commercial exposure sites were then created, and the subtropical area of South
Florida, near Miami, became one of the main standard environments for outdoor
weathering in the U.S.A.. Over the years, many other commercial sites have appeared all
over the world, namely in Arizona and Jacksonville, desert and acid rain sites at USA, in
south of France, Holland and Australia. Nowadays, many other worldwide exposure sites
V. DURABILITY STUDY OF POLYMER MORTAR FORMULATIONS
V-47
are regularly used; however, South Florida exposure remains as the benchmark for
weathering of most materials (Atlas 2005; Pickett and Gardner 2005).
Exposure trials in the aforementioned reference environments represent the first step in
accelerating degradation from traditional end use conditions. Beyond the optimization of
location, the use of unbacked racks or special backs for the test specimens, as well as the
criterious choice of their exposure angles, are also methods that have been widely used to
slightly increase the critical weathering factors, and thus, to accelerate degradation
mechanisms in a natural field exposure (Atlas 2005).
Methods of acceleration and increasing critical weathering variables beyond those
discussed so far, may present considerable risks for correlating testing results back to full
system end use exposures. ASTM G90 standard (2005) clearly states ‘No accelerated
exposure test methods can be specified as a total simulation of natural field exposure’ .
ii) Accelerated outdoor exposure trials
Alternative approaches to natural weathering test methods involve the magnification of
the conditions of outdoor exposure, either by means of sun-concentrating and following
devices or by exposures under mechanical stresses.
Sun-concentrating devices, such as EMMA (Equatorial Mount with Mirrors for
Acceleration) and EMMAQUA (EMMA + water spray), have been extensively used since
1960, mainly to evaluate surface coatings with regard to their color retention (Atlas 2005;
Ellinger 1979). These weathering devices employ several highly reflective mirrors and a
sun-tracking system to concentrate sunlight onto test specimens. Because of their natural
light source, such equipments require clear sky conditions for their efficient use.
Approximately, a nine and a three-fold increase in, respectively, total and ultra-violet
radiation are achieved in going from natural to EMMA and EMMAQUA exposure. Whilst
EMMA is designed to simulate arid conditions, the EMMAQUA, on which specimens are
automatically sprayed with water at regular times, is claimed to correspond to wet
climates. Definitive evaluation of these weathering instruments that intensify solar
radiation has not yet been established, however, they are widely used with quite
successful by many manufacturers who wish to assess rapidly the durability of their
products outdoors (Davis and Sims 1983).

V. DURABILITY STUDY OF POLYMER MORTAR FORMULATIONS
V-48
Exposure under stress constitutes another method to accelerate the major deterioration
processes in the weathering of polymer composites, and can result in a more realistic
evaluation of these materials since they are often subject to some type of mechanical
stress in their practical applications. Stress facilitates the rupture of polymer chains as it
causes a distortion of the bond angles and an increase in inter-atomic distances (Casale
and Porter 1978). Surface breackdown, crack initiation, delamination and water
ingression are some of the deterioration mechanisms that could be induced and
accelerated by exposure under stress. Although there is no clear evidence as yet of stress
affecting directly the rate or nature of chemical processes, other than increasing the
surface area available for reaction, it is a proven way of accelerating important physical
processes in the weathering/aging of certain polymer systems (Davis and Sims 1983; Hu
and Sun 2000).
iii) Laboratory artificial weathering
It has been argued that natural exposure is wasteful in that ‘idle time’ is high.
Artificial weathering tests are aimed at reducing this apparent waste by increasing the
combined ultraviolet radiation, temperature and water effects while keeping them
properly balanced.
Nowadays, there are a considerable multiplicity and variety of artificial weathering
devices for the testing of polymer materials. Most of them attempt to reproduce the
sunlight-induced degradation processes by an artificial light source (carbon-arc, xenon-
arc, metal halide or fluorescent tube lamps). The xenon-arc source, when properly
filtered, more closely simulates full spectrum solar radiation than any other artificial light
source, and its superiority in this context is a major reason for its growing use in the
testing of a wide range of materials (Atlas 2005).
Corrosion testing cabinets has also been widely used to simulate the highly corrosive
environment of maritime sites. These weathering devices reproduce the salt-fog cycling
conditions and can switch automatically from salt fogging to dry-off state.
Over the years, as the result of continuous development, highly sophisticated weathering
chambers are now available (Atlas 2005; Brunner et al. 2005; Klemann 2005). As well as
the production of a constant radiation output, the temperature and humidity within these

V. DURABILITY STUDY OF POLYMER MORTAR FORMULATIONS
V-49
‘weatherometers’ may also be controlled. Other features that can be incorporated into
these systems include rain, dew and atmospheric pollutants.
Concerning the reliability of artificial weathering tests, some questions arise immediately:
Is it possible to predict the outdoor lifetime of a material with basis on artificial
weathering test results? How confident and feasible is that prevision? This issue, the
value of artificial weathering tests, is a subject that has been debated for at least the last
60 years (Atlas 2005; Davis and Sims 1983).
For the addicts, the use of artificial weathering tests is a practical means of tackling
methodically the subject of polymer durability. In addition to the ability to manipulate
and accelerate weathering conditions on demand, they also argue that the control offered
by the laboratory test, as opposed to the variability found outdoors, is a fundamental
benefit as it offers the possibility of relating performance to environment more
confidently. Further, each of the weather factors can be manipulated independently. Thus,
research can be conducted into the specific response of the materials to various weather
factors, experiments that would be impossible to conduct outdoors.
For the detractors of artificial weathering, the basic concept of trying to accelerate natural
weathering is flawed. They claim that since the variability in the conditions found in
nature and their interactions on the material is a major reason for the complexity of the
weather process, then the conditions chosen for an artificial test will produce data results
peculiar to those conditions. The critics also claim that the user of artificial weathering
tests is faced with a problematic choice: either to employ the severest conditions (which
presumes a deep knowledge of the degradation process, usually not yet known), or to
simulate as closely as possible the environment found outdoors. The later solution
invariably leads to the setting up of an environment indoors that is commonly found
outdoors, and consequently, the specific advantage of speed that is claimed for the
artificial tests is not profited.
The advantages and disadvantages of artificial ‘versus’ natural weathering were
thoroughly discussed on research work of Davis and Sims (1983) regarding the
weatherability of polymers, and it seems that the former approach is neither as perfect as
its disciples claim nor so useless as its detractors state . Many of the drawbacks of the
artificial weathering approach, such as the use of unrealistic extreme conditions, can be

V. DURABILITY STUDY OF POLYMER MORTAR FORMULATIONS
V-50
avoided and useful information concerning the likely performance of a material outdoors
can be achieved by settling for realistic conditions and hence modest acceleration factors.
On the other hand, the variable conditions found outdoors cannot be matched in the
weathering chambers, and therefore, with more or less degree, discrepancies between
artificial and natural performances will always occur.
With regard to durability study of polymeric materials, nevertheless the advantages
eventually brought by the use of artificial weathering tests, this technique will not replace
the natural exposure. It is a complementary method the value of which largely depends on
how intelligently it is applied (Davis and Sims 1983). Accurate predictions of durability
will depend on valid accelerated tests, which should be designed to simulate as closely as
possible the worst-case in-service conditions. The guiding should be “simulate, then
accelerate”.
5.4.1.3 Weatherability studies of PC materials
Although the effects of natural weathering and ageing on polymer materials have
extensively been studied in the literature (Alves et al. 2005; Brunner et al. 2005; Davis
and Sims 1983; Hu and Sun 2000; Sinmazçelik 2006; Wypych 2003), there are extremely
limited studies on weatherability of polymer concrete and mortar composites.
Olivares and co-workers (2005) analyzed the degradation process of mechanical
properties of polyester PMs induced by exposure to natural environment at Seville, Spain.
Four different formulations were tested for flexural and compressive strength after being
exposed to natural weathering during 3, 6, 12 and 36 months. Degradation process was
variable according to the pair of specimen’s characteristics obtained when combining
dry/wet aggregate type and orthophtalic/isophtalic polyester resin type. Decay of
mechanical properties after the exposure revealed a non-linear evolution with a tendency
towards the stabilization. The most stable pair was the one tried out with orthophtalic
resin and dry aggregates (OD). For this formulation, after three years exposure period,
20% and 18% average losses were obtained respectively in compression and in flexure.
The pair formed by isophtalic resin and dry aggregates showed the worst weathering
performance, with average losses of 53% in compression and 25% in flexure after the
same exposure period.

V. DURABILITY STUDY OF POLYMER MORTAR FORMULATIONS
V-51
Ohama et al. (1997) studied the weatherability of polymer-modified mortars (PMM) after
ten-year outdoor exposure in Koryama and Sapporo, Japan. PMMs using eight types of
polymer dispersions and two types of redispersible polymer powders were prepared with
various polymer-cement ratios, and tested for compressive and flexural strengths,
appearance change, carbonation and chloride ion penetration after ten-year exposure to
natural weathering. It was concluded that in general, depending upon polymer type and
polymer-cement ratio, relative mechanical strengths of PMMs were smaller than those of
unmodified mortars. However, mechanical strengths of PMMs remained higher than
those of unmodified mortars, regardless of exposure site. From the points of view of
surface conditions, resistance to carbonation and chloride ion penetration, PMMs also
showed a superior weatherability. Except for few cases in study, it was also found that
retained properties of Sapporo-exposed PMMs were somewhat superior to those of
Koryama-exposed ones. Although the larger number of freeze-thaw cycles of Sapporo
site, considered as one of the main deterioration factors for cement mortars and concrete
materials, the higher average temperature and longer sunshine duration of Koryama
region revealed being more aggressive to PMM stability.
Griffiths and Ball (2000) conducted a study in order to investigate the resistance of glass-
fibre reinforced polyester PC to ultraviolet radiation exposure. Standard specimens were
exposed to artificial UV radiation of wavelength 300-400 nm for periods ranging 0 to 8
weeks; - unfortunately, intensity radiation of artificial light source is not given in the
reference paper-. Exposure tests were repeated for verification of the results, as the
random alignment of the chopped fibre reinforcement generally leads to considerable
variations in material mechanical properties. Degradation process was assessed by the
decay in flexural strength. Obtained results showed that moderate to severe strength
losses are possible in polyester PC after exposure to UV radiation. Flexural strength loss
after eight weeks amounted to approximately 24%.
Reis and Ferreira (2005) studied the effects of marine exposure on fracture properties of
plain and glass/carbon fibre reinforced epoxy PMs. The stress intensity factor and the
energy of fracture were measured after two different exposure periods, Spring-Summer
and Fall-Winter. The Spring-Summer exposure revealed being more grievous to epoxy
PMs, in terms of degradation of fracture properties, than the same exposure time in Fall-

V. DURABILITY STUDY OF POLYMER MORTAR FORMULATIONS
V-52
Winter period. For both exposure periods, glass fibre reinforced epoxy PMs showed the
best weathering performance, especially stress intensity factor concerning, while PMs
reinforced with carbon fibres presented the worst behavior, even relatively to plain epoxy
PMs. The worst performance of carbon-fibre reinforced PMs was attributed to the higher
sensitivity of carbon fibres to solar radiation.
5.4.1.4 Research objective
Like the aforementioned research works, with the aim to contribute for reducing the
information gap regarding weatherability of polymer mortar and concrete materials,
natural and artificial weathering tests were conducted on both epoxy and polyester PM
formulations in study. Experimental results are here reported and discussed.
5.4.2 Experimental Program
In order to assess weathering durability of polymer mortar formulations, two kinds of
experimental programs were carried out.
In the first one, specimens of both formulations were exposed to natural environment
during one year nearby the city of Aveiro, a maritime site in the middle of Portugal.
In the second experimental program the effects of artificial weathering, by means of a
solar box and a salt fog chamber devices, were considered. Test specimens were exposed
for periods of 500 hours up to 10000 hours.
Flexural strength retained after exposure to the defined environments was the key
parameter for the assessment of weatherability of PM formulations.
5.4.2.1 Outdoors weathering program
The natural weathering experiment was performed in Ilhavo, a little village nearby the
Atlantic Ocean, very close to city of Aveiro (Lat. 40º38’N, Long. 8º39’W), Portugal.
Test specimens, with standard dimensions (16×40×40 mm3) for flexural strength
evaluation, after the usual curing treatment, were exposed to the defined outdoor
environment with one-week age. They were placed on the roof floor of a private building,
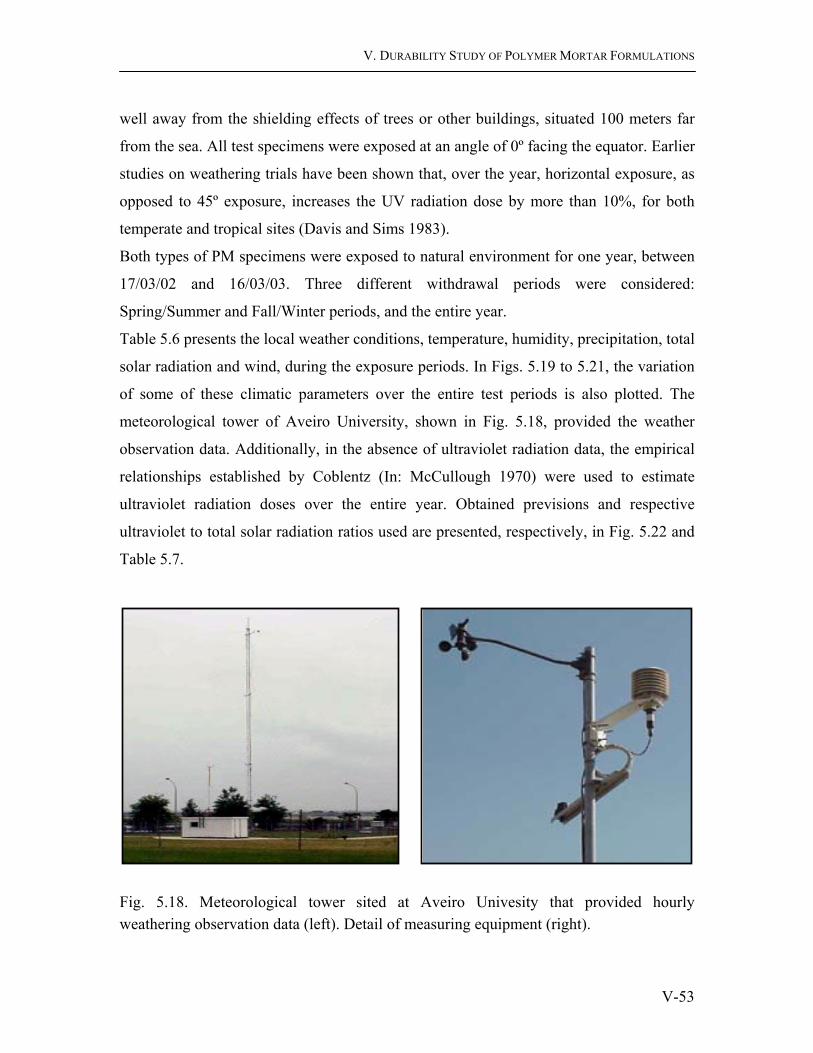
V. DURABILITY STUDY OF POLYMER MORTAR FORMULATIONS
V-53
well away from the shielding effects of trees or other buildings, situated 100 meters far
from the sea. All test specimens were exposed at an angle of 0º facing the equator. Earlier
studies on weathering trials have been shown that, over the year, horizontal exposure, as
opposed to 45º exposure, increases the UV radiation dose by more than 10%, for both
temperate and tropical sites (Davis and Sims 1983).
Both types of PM specimens were exposed to natural environment for one year, between
17/03/02 and 16/03/03. Three different withdrawal periods were considered:
Spring/Summer and Fall/Winter periods, and the entire year.
Table 5.6 presents the local weather conditions, temperature, humidity, precipitation, total
solar radiation and wind, during the exposure periods. In Figs. 5.19 to 5.21, the variation
of some of these climatic parameters over the entire test periods is also plotted. The
meteorological tower of Aveiro University, shown in Fig. 5.18, provided the weather
observation data. Additionally, in the absence of ultraviolet radiation data, the empirical
relationships established by Coblentz (In: McCullough 1970) were used to estimate
ultraviolet radiation doses over the entire year. Obtained previsions and respective
ultraviolet to total solar radiation ratios used are presented, respectively, in Fig. 5.22 and
Table 5.7.
Fig. 5.18. Meteorological tower sited at Aveiro Univesity that provided hourly weathering observation data (left). Detail of measuring equipment (right).

V. DURABILITY STUDY OF POLYMER MORTAR FORMULATIONS
V-54
Table 5.6. Annual weather observation data at outdoor exposure site (Meteorological Tower – Aveiro).
Observation Item a
Av. Temp. (ºC)
Max.Temp. | Av. Max. Temp.
(ºC)
Min.Temp. | Av. Min. Temp.
(ºC)
Av. Relative Humidity
(%)
Precipitation (mm/month)
Av. Speed Wind (m/s)
Av. Sunshine Radiation (W/m2)
Total SunshineRadiation (MJ/m2)
Mars / 02 b 13.2 24.4 | 18.1 6.6 | 9.2 83.67 33.0 1.70 254.15 288.20 April / 02 12.2 24.1 | 15.1 5.2 | 8.3 82.12 105.8 4.19 198.74 514.42 May / 02 13.1 23.0 | 15.8 6.8 | 10.5 85.54 106.2 4.08 - - June / 02 14.8 24.9 | 17.6 8.4 | 12.4 90.81 78.2 4.47 - - July / 02 16.0 30.4 | 19.4 10.8 | 13.3 88.51 39.4 4.71 317.56 856.26 Aug. / 02 16.3 29.0 | 19.8 10.6 | 13.5 90.30 0.4 3.54 294.70 788.28 Sept. / 02 c 16.6 31.5 | 20.3 10.3 | 13.7 87.94 62.0 1.05 192.92 266.69
Spr./Summer 14.6 26.6 | 17.8 8.4 | 11.6 87.18 62.9 ∑ = 425 3.73 258.63 > 2713.85
Sept / 02 d 17.8 26.0 | 21.6 13.4 | 15.3 84.04 102.0 2.77 163.16 197.36 Octob. / 02 16.0 24.7 | 19.7 7.4 | 13.3 87.73 111.0 2.91 128.48 344.12 Nov. / 02 11.8 18.9 | 14.4 2.0 | 9.3 91.18 300.8 3.24 74.94 172.13 Dec. / 02 11.2 17.5 | 13.7 2.6 | 8.7 89.23 237.6 0.45 65.30 173.96 Jan. / 03 9.3 16.7 | 12.7 0.6 | 6.1 74.50 425.4 2.11 80.56 215.78 Febr. / 03 9.9 17.0 | 13.1 1.5 | 7.3 81.03 233.2 1.74 106.05 256.56 Mars / 03 e 12.9 22.8 | 17.5 5.3 | 9.3 79.58 1174.2 1.13 171.98 237.76
Fall/Winter 12.2 19.9 | 15.5 3.9 | 9.5 84.25 324.4 ∑ = 2584 2.07 104.38 1597.67
Annual 13.4 23.2 | 16.6 6.2 | 10.6 85.72 193.6 ∑ = 3009 2.90 181.50 > 4311.52
a) All average values were obtained with basis on hourly observation data; b) 17/03/02 to 31/03/02; c) 01/09/02 to 16/09/02; d) 17/09/02 to 30/09/02; e) 01/03/03 to 16/03/03

V. DURABILITY STUDY OF POLYMER MORTAR FORMULATIONS
V-55
0
5
10
15
20
25
0 6 12Exposure Period (months)
Ave
rage
Tem
pera
ture
(ºC
) Spring / Summer Autumn / Winter
0
200
400
600
800
1000
1200
0 6 12
Exposure Period (months)
Ave
rage
Sun
shin
e R
adia
tion
(W /
m^2
)
Spring / Summer Autumn / Winter
Fig. 5.19. Monthly average temperature during the exposure periods (medium, maximum and minimum average values).
Fig. 5.20. Accumulated precipitation of each month during the exposure periods.
Fig. 5.21. Monthly average sunshine radiation (medium and maximum average values).
Fig. 5.22. Estimated ultraviolet radiation doses of each month during the exposure periods. Estimations were made with basis on empirical relationships established by Coblentz (see Table 5.7).
0
200
400
600
800
1000
1200
0,5 6 11,5
Exposure Period (months)
Tota
l Pre
cipi
tatio
n (m
m /
mon
th)
Autumn / WinterSpring / Summer
0
400
800
1200
1600
0 6 12Exposure Periods (months)
Ultr
avio
let R
adia
tion
(m W
min
/ cm
^2)
Spring / Summer Autumn / Winter
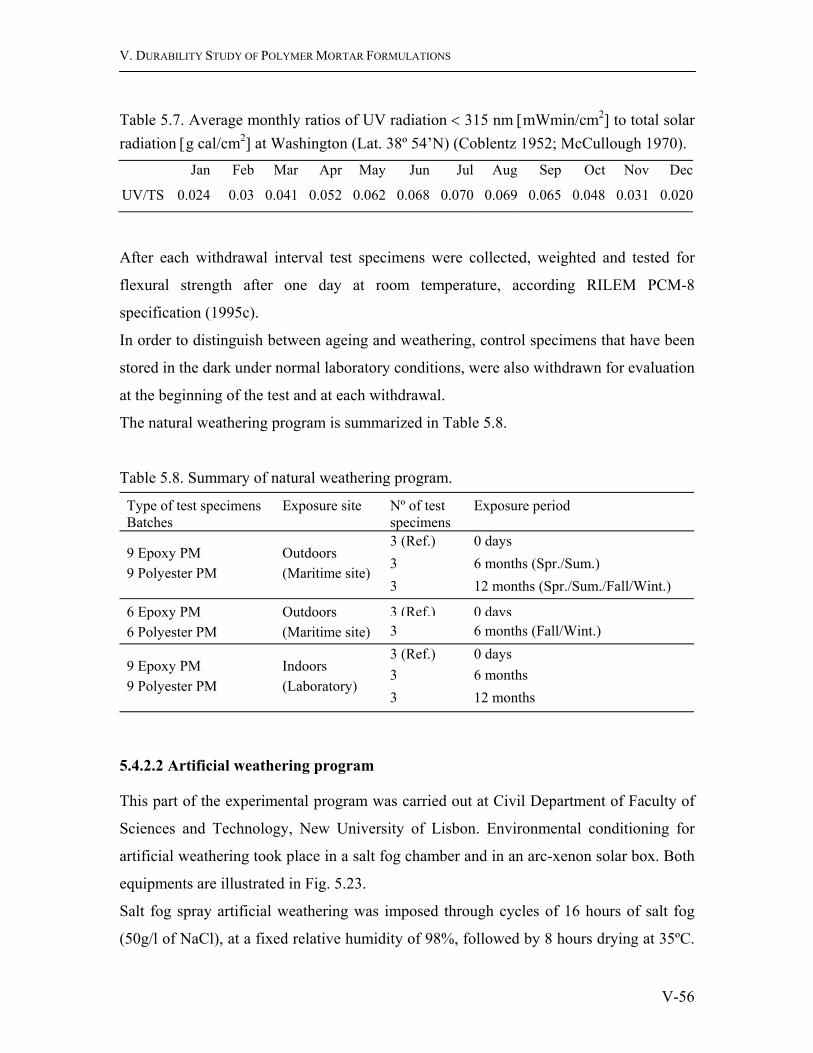
V. DURABILITY STUDY OF POLYMER MORTAR FORMULATIONS
V-56
Table 5.7. Average monthly ratios of UV radiation < 315 nm [mWmin/cm2] to total solar radiation [g cal/cm2] at Washington (Lat. 38º 54’N) (Coblentz 1952; McCullough 1970).
Jan Feb Mar Apr May Jun Jul Aug Sep Oct Nov Dec
UV/TS 0.024 0.03 0.041 0.052 0.062 0.068 0.070 0.069 0.065 0.048 0.031 0.020
After each withdrawal interval test specimens were collected, weighted and tested for
flexural strength after one day at room temperature, according RILEM PCM-8
specification (1995c).
In order to distinguish between ageing and weathering, control specimens that have been
stored in the dark under normal laboratory conditions, were also withdrawn for evaluation
at the beginning of the test and at each withdrawal.
The natural weathering program is summarized in Table 5.8.
Table 5.8. Summary of natural weathering program.
Type of test specimens Batches
Exposure site Nº of test specimens
Exposure period
3 (Ref.) 0 days 3 6 months (Spr./Sum.)
9 Epoxy PM 9 Polyester PM
Outdoors (Maritime site)
3 12 months (Spr./Sum./Fall/Wint.)
3 (Ref.) 0 days6 Epoxy PM 6 Polyester PM
Outdoors (Maritime site) 3 6 months (Fall/Wint.)
3 (Ref.) 0 days 3 6 months 9 Epoxy PM
9 Polyester PM Indoors (Laboratory)
3 12 months
5.4.2.2 Artificial weathering program
This part of the experimental program was carried out at Civil Department of Faculty of
Sciences and Technology, New University of Lisbon. Environmental conditioning for
artificial weathering took place in a salt fog chamber and in an arc-xenon solar box. Both
equipments are illustrated in Fig. 5.23.
Salt fog spray artificial weathering was imposed through cycles of 16 hours of salt fog
(50g/l of NaCl), at a fixed relative humidity of 98%, followed by 8 hours drying at 35ºC.

V. DURABILITY STUDY OF POLYMER MORTAR FORMULATIONS
V-57
Test specimens of both formulations (160 x 40 x 40 mm) were tested for flexural strength
after being exposed during 1000, 1350, 3000, 5000 and 10000 hours to salt-fog
environment, which correspond, respectively, to 42, 56, 125, 208 and 418 salt-fog cycles.
Fig. 5.23. Salt fog chamber (left) and arc xenon solar box (right) artificial weathering devices.
Artificial solar radiation was imposed through filtered arc xenon rays emitted by a bulb
that created an average irradiance of 550 W/m2, with a spectral power distribution of 300-
800 nm bandwidth range. This narrow band includes both high-energy ultraviolet light,
considered important for photo degradation, and visible light that may have an
independent or synergistic effect on materials photo degradation. The choice of 300 nm
as the minimum radiation wavelength was influenced by the fact that UV radiation of
shorter wavelength is mostly absorbed by the ozone layer in the atmosphere.
Test specimens of both formulations were evaluated, relatively to discoloration
(qualitatively) and flexural strength, after being exposed to arc xenon rays during 500,
1000, 2000 and 3000 hours. The incidence of the rays was mostly over one lateral
160×40 mm2 face, without rotation of the specimens, simulating the usual condition of a
member subjected to solar rays solely over a part of its external surface.
The artificial weathering program is summarized in Table 5.9.

V. DURABILITY STUDY OF POLYMER MORTAR FORMULATIONS
V-58
Table 5.9. Summary of artificial weathering program.
Type of test specimens Batches
Artificial Environment Nº of test specimens
Exposure period (hours)
3 -Ref. 0 3 1000 3 1350 3 3000 3 5000
18 Epoxy PM 18 Polyester PM
Salt fog spray:
16 h- Salt fog: 50g/l NaCl 8h – Drying: 35ºC
3 10000
2 -Ref. 02 500 2 1000 2 2000
10 Epoxy PM 10 Polyester PM
Arc xenon rays:
Intensity: 550 W/m2 Bandwidth: 300-800nm
2 3000
5.4.3 Test Results and Discussion
5.4.3.1 Outdoors weathering program
i) Test results
Test results, in terms of relative flexural strength and mass change of PM specimens that
have been exposed to outdoors environment during Spring/Summer, Fall/Winter and one
year periods, are presented in Table 5.10. Jointly, relative flexural strengths of control
specimens that have been stored in the dark under normal laboratory conditions,
subjected only to ageing effect, are also presented.
In order to assess weathering and ageing effects on flexural stiffness of PM formulations,
some representative load-deflection curves are plotted in Figs. 5.24.
As shown in Fig. 5.25, excepting a slight color change of exposed surfaces, no visible
cracks or other exterior signals of deterioration were found on both types of test
specimens that have been subjected to outdoors weathering environment.
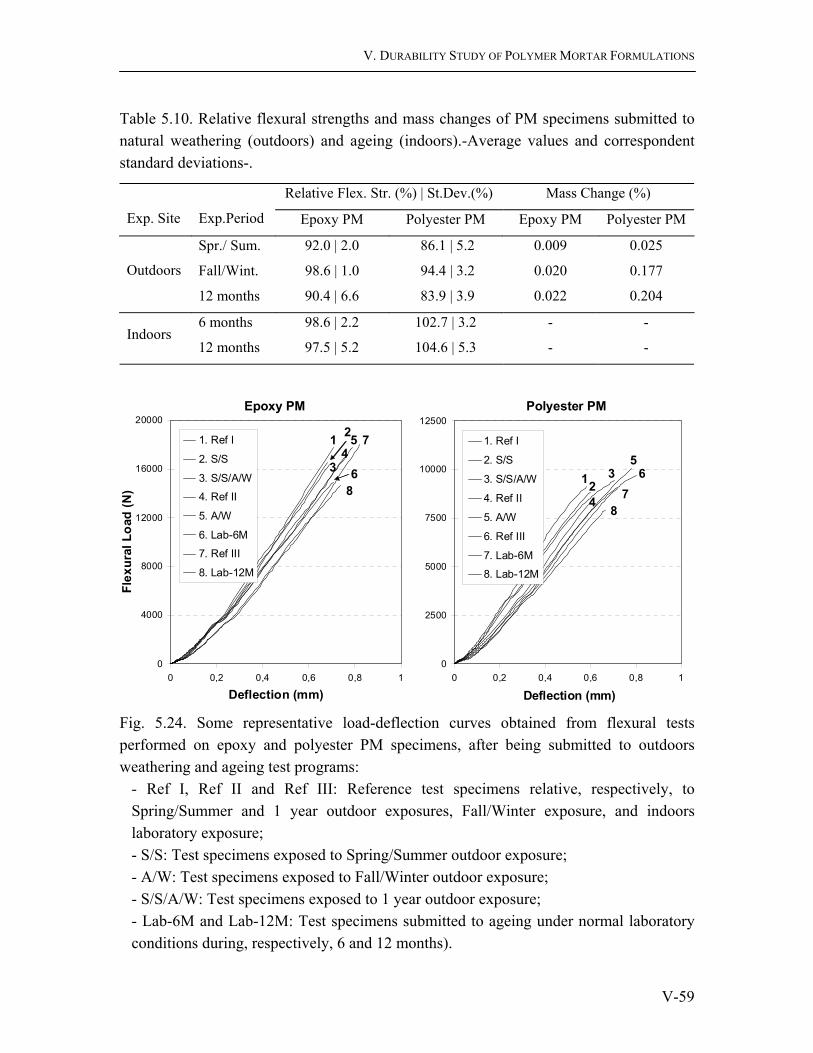
V. DURABILITY STUDY OF POLYMER MORTAR FORMULATIONS
V-59
Table 5.10. Relative flexural strengths and mass changes of PM specimens submitted to natural weathering (outdoors) and ageing (indoors).-Average values and correspondent standard deviations-.
Relative Flex. Str. (%) | St.Dev.(%) Mass Change (%)
Exp. Site
Exp.Period Epoxy PM Polyester PM Epoxy PM Polyester PM
Spr./ Sum. 92.0 | 2.0 86.1 | 5.2 0.009 0.025
Fall/Wint. 98.6 | 1.0 94.4 | 3.2 0.020 0.177 Outdoors
12 months 90.4 | 6.6 83.9 | 3.9 0.022 0.204
6 months 98.6 | 2.2 102.7 | 3.2 - - Indoors
12 months 97.5 | 5.2 104.6 | 5.3 - -
Fig. 5.24. Some representative load-deflection curves obtained from flexural tests performed on epoxy and polyester PM specimens, after being submitted to outdoors weathering and ageing test programs:
- Ref I, Ref II and Ref III: Reference test specimens relative, respectively, to Spring/Summer and 1 year outdoor exposures, Fall/Winter exposure, and indoors laboratory exposure; - S/S: Test specimens exposed to Spring/Summer outdoor exposure; - A/W: Test specimens exposed to Fall/Winter outdoor exposure; - S/S/A/W: Test specimens exposed to 1 year outdoor exposure; - Lab-6M and Lab-12M: Test specimens submitted to ageing under normal laboratory conditions during, respectively, 6 and 12 months).
Polyester PM
0
2500
5000
7500
10000
12500
0 0,2 0,4 0,6 0,8 1
Deflection (mm)
1. Ref I
2. S/S
3. S/S/A/W
4. Ref II
5. A/W
6. Ref III
7. Lab-6M
8. Lab-12M
123
56
78
4
Epoxy PM
0
4000
8000
12000
16000
20000
0 0,2 0,4 0,6 0,8 1
Deflection (mm)
Flex
ural
Loa
d (N
)
1. Ref I
2. S/S
3. S/S/A/W
4. Ref II
5. A/W
6. Lab-6M
7. Ref III
8. Lab-12M
2
3
14
5
6
7
8

V. DURABILITY STUDY OF POLYMER MORTAR FORMULATIONS
V-60
Epoxy PM Polyester PM
Autumn/Winter
1 Year
Reference
Spring/Summer
Fig. 5.25. Surface change color of epoxy and polyester PM specimens that have been exposed to natural weathering.
ii) Analysis of results
With exception of control polyester specimens that were submitted to natural ageing, all
specimens suffered some kind of degradation due to weathering and/or ageing.
Epoxy based mortars present generally a better weathering performance than polyester
based ones, with higher relative flexural strengths and lower scattering of results. After
one-year exposure to maritime environment, an average loss of 9.6% in flexural strength
was obtained for epoxy PM specimens, against an average decrease of 16.1% for
polyester based mortars. These results are consistent with the consensual knowledge
within the polymer degradation community, where it is usually considered that epoxy
composites are in general more weather resistant than polyester composites (Davis and
Sims 1983).
For both formulations, degradation rates occurred during one-year of outdoor exposure
were quite similar to the sum of degradation rates corresponding to Spring/Summer and
Fall/Winter exposure periods. Sums of degradation rates of 9.4% and 19.5% were
obtained, respectively, for epoxy and polyester PM formulations.

V. DURABILITY STUDY OF POLYMER MORTAR FORMULATIONS
V-61
The variation of load bearing capacities induced by weathering/ageing processes did not
reflect on material flexural stiffness, neither for epoxy PM specimens nor for polyester
based ones, as it can be seen through load-deflection curves plotted in Fig. 5.24.
Spring/Summer outdoor exposure revealed being more prone to PM specimens than
Fall/Winter exposure, regardless the resin type of mortar formulations. Similar results
have been found by Reis and Ferreira (2005) in their research work (see page V-50). This
study, regarding the effects of marine exposure on fracture properties of epoxy polymer
mortars, has a particular interest within the scope of present investigation work. Exposure
site and withdrawal exposure periods were the same, and the basic formulation of epoxy
PMs was precisely that one developed in this study. This is not a coincidence, as it seems,
because there was a collaboration ship between the mentioned authors and the present
one, as belonging to the same research team. Although the different assessing means of
degradation process induced by natural weathering, (e.g. flexural properties ‘versus’
fracture properties), obtained results on both experiments are in agreement, which is a
good indicator of the reproducibility of results.
Attending to weathering observation data in Table 5.6, particularly to temperature and
humidity weathering factors, there are no considerable differences between
Spring/Summer and Fall/Winter periods that could explain the differentiated degradation
rates. Further, taking into account the higher levels of rainfall corresponding to
Fall/Winter period, reflected on higher water uptakes presented by the specimens
collected at the end of that period, small differences on degradation rates would be
expected. The single weathering variable that might explain the observed differentiated
behavior is sunshine radiation, which assumes considerable higher values for
Spring/Summer period.
As already referred, the radiation of the sun, particularly the ultraviolet (UV) portion is
mainly responsible for limiting the lifetime of polymeric materials exposed to the
environment. Breakage of polymer bonds and consequent oxidation process are the main
degradation mechanisms involved. The sun radiation, like other light sources, is
described by the wavelengths emitted and their intensities, i.e., by its spectral power
distribution. Both the absorption of light (a necessary first step in the interaction of light
with materials), and bond breakage (a critical primary effect of the absorbed radiation),

V. DURABILITY STUDY OF POLYMER MORTAR FORMULATIONS
V-62
are wavelength dependent. Generally, short wavelengths are absorbed by materials to a
greater extent than longer wavelengths. In addition, the shorter the wavelength, the larger
the energy of the photon associated with that wavelength and the greater the propensity to
break the higher energy chemical bonds. The number of photons associated to each
wavelength determines the intensity of light of that wavelength. Thus, the greater the
intensity light, the larger the amount of incident photons absorbed by the material and,
generally, the gravest the photo-oxidative attack.
On the other hand, the temperature of materials exposed to solar radiation can have a
significant influence on the effect of that absorbed radiation. The destructive effects of
light are usually accelerated at elevated temperatures, mainly by increasing the rate of
secondary reactions. At high temperatures, molecules have a greater mobility. Therefore,
the rate of oxygen diffusion increases and free radicals fragments formed from the
primary photochemical processes are more readily separated. As a result, the chance of
recombination is reduced and secondary reactions are promoted. A general rule for the
effect of temperature on reaction rates is hat the latter doubles for each 10ºC increase in
temperature (Atlas 2005).
Thus, considerable higher intensities of sunlight radiation, specially in the UV region, in
combination with quite higher levels of temperature, seem to be the major reasons for the
higher degradation rates occurred on Spring/Summer exposure period.
Over the time, somehow, polyester based mortars that have been stored in the dark under
normal laboratory conditions underwent some kind of post-cure process, which led to
increasing flexural strengths after six and twelve month ageing. Conversely, epoxy based
mortars showed some sensitivity to degradation processes due to ageing effect. After six
and twelve-month ageing, slight decreases on flexural strength occurred.
It must be noted that above considerations must be taken with caution, as flexural
strength variations were quite small on both cases and within the range of values
expected for specimens proceeding of the same batch (see Table 4.7). Further, both the
small amount of test specimens and the relative short ageing periods do not allow stating
the existence of clear trends concerning polymer mortar’s behavior with ageing.
Discounting the ageing or timing effect, which had different outcomes for each
formulation, strength decreases due to the single effect of weather become higher for

V. DURABILITY STUDY OF POLYMER MORTAR FORMULATIONS
V-63
polyester PMs and, conversely, lower for epoxy PMs. In graphs of Fig. 5.26, the
separated effect of weathering versus the combined effect of ageing/weathering with
exposure time are plotted.
Additive mechanism of effects is also highlighted in Fig. 5.26: the sum of the two
‘vectors’ corresponding to flexural strength decreases of PM specimens submitted to both
shorter exposure periods is practically similar to that one corresponding to flexural
strength decay of PM specimens subjected to outdoor exposure during all entire year.
Fig. 5.26. Relative flexural strengths of epoxy and polyester PM specimens, as function of exposure time. Isolated effects of outdoors weathering ‘versus’ the combined effects of weathering/aging processes.
5.4.3.2 Artificial weathering program
i) Test results
Residual flexural strengths of PM specimens that have been subjected to artificial
weathering in the salt fog chamber and solar box devices, for the different exposure
periods, are presented in Table 5.11.
Appearance changes induced by imposed environments on epoxy PMs are illustrated in
Fig. 5.27.
Epoxy PM
80
85
90
95
100
105
0 6 12
Exposure period (months)
Rel
ativ
e fle
xura
l str
engh
t (%
) Spring / Summer Autumn / Winter
Weathering / Ageing Isolated Weathering
Polyester PM
80
85
90
95
100
105
0 6 12
Exposure period (months)
Spring / Summer Autumn / Winter

V. DURABILITY STUDY OF POLYMER MORTAR FORMULATIONS
V-64
Table 5.11. Relative flexural strengths of PM specimens submitted to artificial weathering tests. – Average values and correspondent standard deviations-.
Relative Flex. Strength (%) | St.Dev.(%) Artificial Environment
Exposure Period (hours) Epoxy PM Polyester PM
1000 91.7 | 9.9 94.0 | 8.0 1350 86.5 | 6.5 87.2 | 11.1 3000 79.1 | 4.1 85.3 | 3.1 5000 64.8 | 1.3 64.2 | 11.4
Salt Fog Chamber
10000 52.2 | 3.7 62.0 | 3.1 500 102.0 | 3.2 98.9 | - 1000 105.1 | 1.5 96.2 | - 2000 105.9 | 5.7 102.2 | -
Arc-Xenon Solar Box
3000 110.7 | 1.3 104.9 | -
Fig.5.27. Yellowing and discoloration processes suffered by epoxy PM specimens submitted, respectively, to artificial solar radiation (in the left) and salt fog spray cycles (in the right).
Arc Xenon Salt Fog
Ref.
Ref.
1000 h
3000 h
5000 h
10000 h
500 h
1000 h
2000 h
3000 h

V. DURABILITY STUDY OF POLYMER MORTAR FORMULATIONS
V-65
A strong staining was observed on exposed surfaces of both polyester and epoxy PM
specimens that have been subjected to artificial solar radiation. As shown in Fig. 5.27, the
browning process was so much remarkable as longer was the exposure period. Slight
whitening was also observed on the exterior surfaces of PM specimens submitted to salt
fog environment, as it can be seen in the same figure, but discoloration process with
exposure time was not so outstanding. Whatever both the environment that caused the
color change and the exposure time, the observed phenomenon had a superficial character
affecting only the exposed surfaces of the specimens, as it was verified by observation of
failure surfaces posterior to bending tests.
ii) Analysis of results
Both types of PM specimens were severely affected by exposure to salt fog spray
artificial weathering, specially epoxy based ones. After 10000 hours of exposure,
corresponding to 478 salt fog cycles, flexural strength decays of 48% and 38% were
recorded, respectively, for epoxy and polyester based mortars. Strength decrease rates
showed a non-linear evolution with a tendency towards the stabilization, as shown in Fig.
5.28.
Fig. 5.28. Relative flexural strengths of epoxy and polyester PM formulations, submitted to salt-fog spray artificial weathering, as function of exposure period.
y = 4E-07x2 - 0,009x + 100R2 = 0,99
0
20
40
60
80
100
120
0 2000 4000 6000 8000 10000 12000
Exposure period (hours)
Rel
ativ
e fle
xura
l str
engt
h (%
) Epoxy PM
y = 5E-07x2 - 0,0084x + 100R2 = 0,94
0
20
40
60
80
100
120
0 2000 4000 6000 8000 10000 12000
Exposure period (hours)
Polyester PM
V. DURABILITY STUDY OF POLYMER MORTAR FORMULATIONS
V-66
Whereas epoxy PM specimens experienced a progressive and steadily resistance loss
until half of the total exposure period, and later on seemed to tend to stabilization;
polyester based specimens clearly showed two different stabilization periods: between
1350 and 3000 hours and after 5000 hours of exposure.
Obtained results were completely unexpected regarding the excellent resistance showed
by epoxy based mortars to saline solutions (see subchapter 5.2). After 84 immersion days
(2016 hours) in 10% sodium chloride solution, this material retained 102% of its original
flexural strength. It seems that the cycling process from salt fogging to dry-off conditions
causes more severe damages on epoxy polymer matrix than the continuous diffusion
process of salted water into mortar mass. An explanation can be advanced with basis on
fatigue processes. Mechanical cyclic loading can be induced in many polymeric materials
that are sensitive to expansion and contraction by moisture cycling: absorbed water
results in compressive stresses on the outside and tensile stresses in the bulk; subsequent
drying periods create bulk compressive and surface tensile stress gradients. Eventual
microcraks induced by this fatigue process weak the overall resistance of the material,
leading to early failures under higher mechanical stresses.
Conversely to what that occurred in salt fog artificial weathering tests, no mechanical
degradation effects were observed on PM specimens that have been exposed to arc-xenon
artificial light source. Instead, in general for both formulations, progressive increases on
flexural strength were found. After 3000 hours of exposure to artificial solar radiation,
increases of 11% and 5% on average flexural strengths were obtained, respectively, for
epoxy and polyester PM specimens. For epoxy-based mortars, flexural strength increase
with exposure time was almost linear, while for polyester based ones, this trend was only
noticed after the two first exposition periods, in which some small decreases on resistance
occurred.
Lack of agreement between the solar spectrum and that of the artificial light source is
likely the main reason for the poor correlation between the two modes of exposure.
Although the higher average irradiance associated to artificial exposure (550 W/m2)
comparing to natural one (182 W/m2), high daily intensity peaks are found in the later,
specially during Spring/Summer period, which not occur in the artificial exposure (see
Fig. 5.19). Further, mismatch in the infrared region (λ> 800 nm) can cause the surface

V. DURABILITY STUDY OF POLYMER MORTAR FORMULATIONS
V-67
temperatures of natural and artificially exposed specimens to be quite different, and thus
the synergetic effect due to combination of UV radiation and heat has rather different
magnitudes in the two situations. On the other hand, the daily fatigue due to night’s
condensation and day’s solar drying that occur in a natural exposure, interacts with photo
degradation processes causing mechanisms significantly different from those that can be
encountered in an arc-xenon solar box without any correspondent simulation devices
(e.g., dark cycles and water spray at lower temperatures). Another feature that might
explain the absence of any sign of degradation, apart the browning process, is the
‘solarization’ mechanism. As arc xenon lamps and filters age, the quartz envelope of the
burner and the filters themselves undergo a UV deterioration process, which decreases
the optical transmission, specially the shorter wavelengths.
Thus, although the discrepancies found in the infrared radiation, in the light intensity and
in the other mentioned environment conditions, could cause the degradation processes of
natural and artificially exposed specimens to be quite different, it seems that it was
differences in the ultraviolet radiation that were most likely to cause the observed
differentiated behavior.
5.4.3.3 Correlation between natural and artificial weathering test results
Before drawing any considerations concerning the possible pattern that might exist
between degradation processes that occurred on the different weathering tests performed,
natural and artificial ones, some concepts must be clarified. These are ‘correlation’ and
‘acceleration factor’. The usefulness of artificial weathering tests may be characterized by
these two parameters.
Correlation is the degree to which data obtained in the artificial weathering test agrees
with data obtained outdoors. This term has also been used with reference to the type of
degradation produced on both types of tests.
Acceleration is a measure of how rapidly the test can be conducted using an accelerated
weathering device compared with outdoor testing. Only if agreement exists with outdoor
results is it valid to estimate the acceleration of laboratory test. The acceleration factor is
the time to failure (or change in property) under natural exposure, divided by the time to
failure under the accelerated test condition, both evaluated by the same technique. It can

V. DURABILITY STUDY OF POLYMER MORTAR FORMULATIONS
V-68
vary over a wide range of values from 1 to 100 or larger. However, for accelerated test
conditions that correlate with outdoor exposure, the factors are commonly between 2 and
10 (Atlas 2005). Generally, the greater the acceleration the poorer the correlation.
Acceleration factors are material specific and vary with formulation. They also depend on
the accelerated test method and, obviously, on environmental conditions of outdoor
exposure. Therefore, for a variety of materials and formulations, it is not possible to
establish a single acceleration factor for extrapolating test results in order to predict
lifetimes under natural weathering conditions.
As already has been pointed out, no correlation was observed between data obtained in
arc-xenon artificial weathering tests and test results of natural weathering program, and
therefore, it is not possible to estimate correspondent acceleration factors.
Relatively to salt-fog artificial weathering test results, it is also premature to state that a
good agreement exists with outdoor results. The first two exposure periods to natural
weathering cannot be considered for correlation purposes, as their results were strongly
affected by the time of year that those periods began. It is believed, in agreement with the
folk wisdom in the polymer degradation community, that the time of year that an
exposure begins is important at first but no longer makes a difference after one-two years
(Pickett and Gardner 2005).
Thus, there is only one single data (one-year outdoor exposure results) that could be used
for correlation effects, which is not quite enough. Assuming, however, that there is a
reasonable connection between salt-fog artificial weathering test results and data obtained
with one-year outdoor exposures, an attempt was made in order to estimate correspondent
acceleration factors.
These parameters were calculated by dividing the number of hours of one year, by the
number of hours under salt-fog cycling that would be required to achieve equivalent
flexural strength decreases. For this purpose, the regression curves plotted in Fig 5.28
were applied. Acceleration factors of 7.80 and 3.97 were obtained, respectively, for
epoxy and polyester PM formulations.
What are the mean and the relevance of these factors?
It can only be stated that flexural strength decrease of epoxy and polyester PM
formulations, induced by one-year exposure to natural weathering (at maritime sites with

V. DURABILITY STUDY OF POLYMER MORTAR FORMULATIONS
V-69
similar latitudes than Aveiro), corresponds, respectively, to 46 and 92 days of salt fog
spray artificial weathering (with the same set-points used in this experimental program).
No reliable extrapolations can be done beyond these ones.
If posterior flexural test results of PM specimens withdrawn at longer outdoor exposure
periods (more than one year) also agree with the data obtained on artificial weathering
tests, and thus following the same trend, then previsions regarding outdoors lifetime of
PM formulations might be done. Presuming the veracity of this hypothesis, flexural
strength behavior of PM formulations with exposure time, in a natural outdoor
environment similar to Aveiro, could be modeled according the following equation:
Y = (A / af2) x2 + (B / af) x + 100 with x ≤ -(B/2A) af (5.5)
where Y is the retained flexural strength, in percentage; x is the exposure time in hours; af
is the acceleration factor, and A and B are the polynomial factors of the regression curve
correspondent to material flexural strength behavior under salt fog accelerated weathering
test.
According this model, predicted flexural strength behaviors of PM formulations with
exposure time are plotted in Fig. 5.29.
Fig. 5.29. Predicted flexural strength behaviors of epoxy and polyester PMs under long-term exposure to natural environment (similar to Aveiro site).
y = 6,57E-09x2 - 0,00115x + 100
0
20
40
60
80
100
120
0 20000 40000 60000 80000 100000 120000
Exposure period (hours)
Rel
ativ
e fle
xura
l str
engt
h (%
) Epoxy PM
10 years
y = 3,17E-08x2 - 0,0021x + 100
0
20
40
60
80
100
120
0 10000 20000 30000 40000 50000 60000
Exposure period (hours)
Polyester PM
4 years

V. DURABILITY STUDY OF POLYMER MORTAR FORMULATIONS
V-70
It must be remarked that the presented model was developed assuming that equal or very
similar acceleration factors would be obtained for outdoor exposures longer than one
year, which is just a mere assumption.
One important feature that may affect the acceleration factors is the time scale of the
experiments. Most of the comprehensive assessments of various types of weathering tests
in the literature do not include correlation data, which makes difficult any comparison
with the present results. However, the few published results show that the acceleration
factors tend to increase with the time scale of the experiments (Bauer 2000; Crump 1996;
Klemann 2005). For all test materials studied by Klemann (2005), which include different
classes of polymers, higher acceleration factors were found for two years than for one-
year outdoor data. It is believed that these parameters may rise even further in longer
tests, until they may eventually approach a stable long-term value.
Thus, the relationship between natural and artificial exposure is not necessarily best
expressed in terms of a constant factor (Howard and Gilroy 1969). Ideally, acceleration
factor should be determined not as a constant parameter but as a function of time scale.
Hence, the prediction model here presented, with basis on a short-term value of the
acceleration factor, only gives a rough indication of the relationship between natural and
artificial weathering. However, it has the benefit of running by the safety side,
representing the worst scenario that could be encountered in a real situation of long-term
outdoor exposure.
5.4.4 Conclusions
In order to assess weatherability of epoxy and polyester PMs, natural and artificial
accelerated weathering tests were conducted on specimens of both formulations. Based
on test results the following conclusions may be drawn:
• PM formulations are sensitive to degradation effects of natural weathering. One-
year outdoor exposure to natural maritime environment, similar to that one of
Aveiro region, has a moderate deleterious effect on mechanical flexural strength
of both types of PMs. Epoxy based mortars revealed being in general more
V. DURABILITY STUDY OF POLYMER MORTAR FORMULATIONS
V-71
weather resistant than polyester based ones (- after one-year exposure, average
flexural strength losses of 9.6% and 16.1 % were found, respectively, for epoxy
and polyester PM specimens-).
• Spring/Summer outdoor exposure is more prone to PM specimens than equivalent
exposure time in Fall/Winter period. Flexural strength decays in the former period
were between two up to five times greater than those that occurred in the later
one. Higher intensities of sunlight radiation, especially in the UV region,
combined with quite higher levels of temperature, seem to be the major reasons
for the superior degradation rates that occur on Spring/Summer period.
• Different outcomes were found for the effect of ageing on mechanical strength of
PM formulations. Whereas for epoxy-based mortars, slight decreases on flexural
strength were observed after six and twelve months ageing, polyester based ones
underwent some kind of post cure process that led to increasing flexural strengths
after the same ageing periods. Nonetheless, no clear statements can be done
regarding the role of polymer aging on weathering mechanisms of epoxy and
polyester PMs, as strength variations of control specimens were quite small on
both cases.
• Beyond yellowing and staining processes, relative short-term exposures to arc-
xenon artificial light source (up to 3000 hours), with the set-up points used in the
present experimental program, has no noticeable deleterious effects on both types
of PM formulations. Instead, slight increases on mechanical flexural strength were
in fact observed. Lack of agreement between the solar spectrum and that of the
artificial light source, especially in the infrared and UV region, appear to be the
main reason for the differentiated behavior of natural and artificially exposed
specimens.
• Both types of PMs are severely affected by exposure to salt-fog spray artificial
weathering, specially epoxy based ones. After 10000 hours of exposure, epoxy
and polyester PM flexural strengths dropped to 52% and 62% of their original
values. The strength decrease rates presented a non-linear evolution with a
tendency to stabilization. Mechanical cyclic loading induced by moisture cycling,

V. DURABILITY STUDY OF POLYMER MORTAR FORMULATIONS
V-72
leading to fatigue processes, is likely the major cause responsible for the strong
degradation rates occurred during salt-fog artificial exposure.
• Regarding the correlation between salt-fog artificial weathering test results and
data obtained with natural exposure, with basis on one-year time-scale, it can be
stated that the former tests accelerate 7.80 and 3.97 times the natural weathering
degradation processes that occur, respectively, on epoxy and polyester PM
formulations. Obtained acceleration factors can only be applied relatively to
maritime sites, with similar latitudes as Aveiro, and to salt-fog artificial
environments with the same set points used in this study.
• Previsions regarding the long-term behavior of PM formulations with outdoor
exposure time can be attempted, but only with a merely indicative value. Within
the uncertainty of the data, maximum flexural strength decreases of 50% and 35%
will be expected, respectively for epoxy and polyester PMs. It is estimated that
predicted residual flexural strengths, which constitute the long-term stable values,
will be attained, respectively, after 10 and 4 years of outdoor exposure.
It must be pointed out that prediction models based on short-term values of acceleration
factors only give rough indications about the relationship between natural and artificial
weathering, representing, eventually, the worst scenario that could be encountered in a
real situation of long-term outdoor exposure.
Since major deleterious effects of weathering are confined to superior layers of the
material, another point that should be realized is the fact that damage magnitude becomes
size piece dependent. The larger the element, the minor the importance of the damage. It
is not reasonable to expect that a larger element of PM material would loss the same load
bearing capacity as a standard prismatic specimen.
Nevertheless, estimated residual flexural strengths of PM formulations after long-term
outdoor exposure are, even so, still competitive with those presented by ordinary cement
concrete materials (not exposed to weathering processes).

V. DURABILITY STUDY OF POLYMER MORTAR FORMULATIONS
V-73
Bibliography
Alves, A. L. S., Nascimento, L. F. C., and Suarez, J. C. M. (2005). "Influence of weathering and gamma irradiation on the mechanical and ballistic behavior of UHMWPE composite armor." Polymer Testing, 24(2005), 104-113.
Aniskevich, K., Hristova, J., and Jansons, J. (2003). "Sorption characteristics of polymer concrete during long-term exposure to water." Mechanics of Composite Materials, 39(4), 305-314.
Ashbee, K. H. G., Frank, F. C., and Wyatt, R. C. (1967). "Water damage in polyester resins." Proceedings of Royal Society, A300, 415-419.
Ashbee, K. H. G., and Wyatt, R. C. (1969). "Water damage in glass fiber/resin composites." Proceedings of Royal Society, A312, 553-564.
ASTM:C666/C666M-03. (2003). "Standard Test Method for Resistance of Concrete to Rapid Freezing and Thawing." Annual Book of ASTM Standards, 04(02).
ASTM:G90-05. (2005). "Standard Practice for Performing Accelerated Outdoor Weathering of Nonmetallic Materials using Concentrated Natural Sunlight." Annual Book of ASTM Standards, 14(04).
Atlas. (2005). "ATLAS Material Testing Technology." www.atlas-mts.com.
Attiogbe, E. K., and Rizkalla, S. H. (1988). "Response of concrete to sulfuric acid attack." ACI Materials Journal, November-December(1988), 481-488.
Balendran, R. V., Nadeem, A., and Maqsood, T. "Effect of elevated temperatures on the flexural and split cylinder strengths of high strength concrete." 3th Int. Conference on Concrete Under Severe Thermal Conditions, Vancouver, Canada, 2001, 120-126.
Bauer, D. R. (2000). "Interpreting weathering acceleration factors for automative coatings using exposure models." Polymer Degradation and Stability, 69(2000), 307-316.
Bhutta, M. A. R., Narisawa, B., Maeda, N., and Ohama, Y. "Durability of polymer mortar counterweights." 10th Int. Congress on Polymers in Concrete - ICPIC 2001, 2001, Honolulu, Hawaii.
Brunner, S., Richner, P., Muller, U., and Guseva, O. (2005). "Accelerated weathering device for service life prediction for organic coatings." Polymer Testing, 24(2005), 25-31.

V. DURABILITY STUDY OF POLYMER MORTAR FORMULATIONS
V-74
Cano, M., San José, J. T., and Ramirez, J. L. "Polyester polymer concrete. Fundamental hardened and fresh state." 2éme Conf. Int. sur les Matériaux Composites en Architecture, Construction et Génie Civil - ARQUIMACOM'98, 1998, Bordeaux, France, 191-200.
Casale, A., and Porter, R. S. (1978). Polymer Stress Reactions, Vol.1, Academic Press, New York.
Chawalwala, A. J. (1996). "Material characteristics of polymer concrete," M. Sc., University of Delaware, Newark, Delaware.
Chin, J. W., Martin, J., and Nguyen, T. (2001). "Effects of Ultraviolet (UV) Radiation." Gap Analysis for Durability of Fiber Reinforced Polymer Composites in Civil Infrastructures, CERF, ed., ASCE, New York, 80-99.
Coblentz, W. W. (1952). Bulletin of American Meteorology Society, 33, 158.
Collingbourne, R. H. (1976). The Climates of the British Isles, Longman Press, London.
Coulson, K. L. (1975). Solar Terrestrial Radiation, Academic Press, New York.
Crump, L. S. "Evaluating the durability of gel coats using outdoor and accelerated weathering techniques: A correlation study." 51st Annual Conference of the SPI Composites Institute, 1996, Cincinnati, Session 22B,1-34.
Davis, A., Deane, G. H. W., Gordon, D., Howell, G. V., and Ledbury, K. J. (1976). "A world-wide program for the continuous monitoring of solar and UV radiation using poly(phenylene) oxide film, and a consideration of results." Journal of Applied Polymer Science, 20(5), 1165-1174.
Davis, A., and Sims, D. (1983). Weathering of Polymers, Applied Science Publishers, Ltd., New York.
Dimming, A., Bode, K. A., and Erfurt, W. "Methods of determining the gradient of damage in polymer-modified mortar after freeze-deicing salt attack." 10th Int. Congress on Polymers in Concrete - ICPIC, 2001, Honolulu, Hawai.
Ellinger, M. L. (1979). Polymers, Paints and Colour Journal, Nov. 1979, 1112.
EN:1340. (2003). "Concrete kerb units. Requirements and test methods." European Norm, TC-178, European Committee for Standardization.
Fattuhi, N. I., and Hughes, B. P. (1988). "Ordinary Portland cement mixes with selected admixtures subjected to sulfuric acid attck." ACI Materials Journal, November-December(1988), 512-518.
Fried, J. R. (2003). Polymer Science and Technology, Pearson Education, Inc., New York.

V. DURABILITY STUDY OF POLYMER MORTAR FORMULATIONS
V-75
Gálan, C. M. (2001). "Caracterización de un mortero polimérico con resina de poliéster insaturado y árido de albero para su aplicación en construcción," Ph. D., Universidad de Sevilla, Sevilla.
Gates, E. S. (1965). Meteorology and Climatology for Sixth Forms, G.G. Harrap & Co. Ltd, London.
Greathouse, G. A., and Wessel, C. J. E. (1954). Deterioration of Materials, Reinhold Publ. Corp., New York.
Griffiths, R., and Ball, A. (2000). "An assessment of the properties and degradation behaviour of glass-fibre-reinforced polyester polymer concrete." Composite Science and Technology, 60, 2747-2753.
Hendrik, L., and Orbison, J. (1987). "Concrete deterioration due to acid precipitation." ACI Journal, 84(1987), 110-116.
Howard, J. B., and Gilroy, H. M. (1969). "Natural and artificial weathering of polyethylene plastics." Polymer Engineering and Science, 9(3), 286-294.
Hu, H., and Sun, C. T. (2000). "The characterization of physical aging in polymeric composites." Composite Science and Technology, 60(2000), 2693-2698.
Jellinek, H. H. G. E. (1978). Aspects of Degradation and Stabilisation of Polymers, Elsevier Publishing, Amsterdam.
JIS:A-6204. (2000). "Chemical Admixtures for Concrete, Appendix 2- Method of freezing and thawing test for concrete." Japanese Standard.
Kinlock, A. J. (1987). Environmental attack at metal-adhesive interfaces, Elsevier Applied Science, New York.
Klemann, B. M. (2005). "Correlations between Xenon Arc Accelerated Weathering Tests and Outdoor Weathering." Material Testing Product and Technology News, 35(75), 1-9.
Koller, L. R. (1965). Ultra-Violet Radiation, John Wiley and Sons, New York.
Komonen, J., and Pentalla, V. "Effect of high temperature on the pore structure and strength of cement paste." 3th Int. Conference on Concrete Under Severe Thermal Conditions, Vancouver, Canada, 2001, 269-276.
Kurashidge, I., and Uomoto, T. "Deterioration of concrete due to sulfuric acid attack." 3th Int. Conference on Concrete under Severe Conditions, 2001, Vancouver, Canada, 285-292.

V. DURABILITY STUDY OF POLYMER MORTAR FORMULATIONS
V-76
Letsch, R. "Behaviour of plastics and plastic mortars at constant and changing temperatures." 1st Int. RILEM Congress: From Material Science to Construction Material Engineering, 1987, Versailles, France, 1107-1114.
Letsch, R. "Behaviour of polymers and polymer mortars at constant and changing temperatures." 10th Int. Congress on Polymers in Concrete, 2001, Hawai, Honolulu, USA.
Letsch, R. "Polymer concrete with metallic and non-metallic reinforcement." 10th Int. Congress on Polymers in Concrete, 2001, Hawai, Honolulu.
McCullough, E. C. (1970). "Qualitatve and quantitative features of the clear day terrestrial solar ultraviolet radiation environment." Physics in Medicine and Biology, 15(1970), 723-734.
Mebarkia, S. A. (1993). "Mechanical anf fracture properties of high strength polymer concrete under various loading conditions and corrosive environments," Ph. D., University of Houston, Houston.
Mebarkia, S. A., and Vipulanandan, C. (1995). "Mechanical properties and water diffusion in polyester polymer concrete." Journal of Engineering Mechanics, 121(12), 1359-1365.
Mills, N. J. (1993). Plastics: microstructure, properties and applications Halsted Press, Wiley, New York.
Neville, A. M. (1995). Properties of Concrete, Pearson Education Limited, Harlow.
Ohama, Y. "Hot water resistance of polyester resin concrete." 20th Japan Congress on Materials Research, 1977, Kyoto, Japan, 176-178.
Ohama, Y., Demura, K., and Uchiyama, T. (1997). "Weatherability of polymer-modified mortars after ten-year out-door exposure in Koriyama and Sapporo." Polymers in Concrete, Y. Ohama, M. Kawakami, and K. Fukuzawa, eds., E & FN Spon, London.
Ohama, Y., Kobayashi, T., Takeuchi, K., and Nawata, K. (1986a). "Chemical resistance of polymethyl methacrylate concrete." The International Journal of Cement Composites and Lightweight Concrete, 8(2), 87-91.
Ohama, Y., Sugi, M., and Hamatsu, M. "Freeze-thaw durability of polyester concrete made with wet aggregates." 29th Japan Congress on Materials Research, 1986, Kyoto, Japan, 167-170.
Ohama, Y., Sugi, M., and Hamatsu, M. "Improvement in freeze-thaw durability of polymer concretes with wet aggregates." 5th Int. Congress on Polymers in Concrete, 1987, Brighton, UK, 113-118.

V. DURABILITY STUDY OF POLYMER MORTAR FORMULATIONS
V-77
Olivares, M., Galán, C., and Roa, J. "Study on degradation in a polymeric mortar due to natural ageing." Composites in Construction 2005, Lyon, France.
Oshima, M., Sato, R., Hayashi, F., and Koyanagi, W. "Thermal properties and temperature dependency of mechanical properties of resin concretes for structural use." 10th Int. Congress on Polymers in Concrete, 2001, Hawai, Honolulu.
Pardo, A. I., Maribona, R., Urreta, O. J. I., San José, J. T., and Muguerza, A. "Influence of Dosage and Temperature on Mechanical Properties of Polymer Concrete." Int. Congress on Polymers in Concrete - ICPIC'95, 1995, Oostende, Belgium.
Pickett, J. E., and Gardner, M. M. (2005). "Reproducibility of Florida weathering data." Polymer Degradation and Stability, 90(2005), 418-430.
Reis, J. M. L., and Ferreira, A. J. M. (2005). "Effect of marine exposure on fracture properties of epoxy concretes." Polymer Testing, 24(2005), 121-125.
RILEM. (1995a). "PC-11: Method of test for water absorption of polymer concrete and mortar." Technical Committee TC-113 'Test Methods for Concrete-Polymer Composites' (CPT), International Union of Testing and Research Laboratories for Materials and Structures.
RILEM. (1995b). "PC-12: Method of test for chemical resistance of polymer concrete and mortar." Technical Committee TC-113 'Test Methods for Concrete-Polymer Composites' (CPT), International Union of Testing and Research Laboratories for Materials and Structures.
RILEM. (1995c). "PCM-8: Method of test for flexural strength and deflection of polymer-modified mortar." Technical Committee TC-113 'Test Methods for Concrete-Polymer Composites' (CPT), International Union of Testing and Research Laboratories for Materials and Structures.
San José, J. T., Ramirez, J. L., and Maribona, R. "Polymer reinforced concrete: Calculation procedure in bending." 9th International Congress on Polymers in Concrete - ICPIC'98, 1998, Bologna, Italy.
Schulze, R., and Gräfe, K. (1969). The Biological Effects of Ultra-Violet Radiation, Pergamon Press, Oxford.
Setzer, M. J. "The micro ice lens pump - A new sight of frost attack and frost testing." 3th Int. Conference on Concrete under Severe Conditions, 2001, Vancouver, Canada.
Shao, Y., and Jiang, L. "Freeze-thaw resistance of high performance fiber reinforced concrete." 3th Int. Conference on Concrete Under Severe Thermal Conditions, Vancouver, Canada, 2001, 447-454.

V. DURABILITY STUDY OF POLYMER MORTAR FORMULATIONS
V-78
Sinmazçelik, T. (2006). "Natural weathering effects on the mechanical and surface properties of polyphenylene sulphide (PPS) composites." Materials & Design, 27(2006).
Springer, G. S. (1984). Environmental effects on composites materials, Technomic Publishing Company, Inc., New York.
Stern, A. C. (1978). Air Pollution, Academic Press, New York.
Sun, W., Luo, X., and Chan, S. Y. N. "Properties of high performance concrete subjected to high temperature attack." 3th Int. Conference on Concrete Under Severe Thermal Conditions, Vancouver, Canada, 2001, 472-479.
Sun, W., Zhang, Y. M., Yan, H. D., and Mu, R. (1999). "Damage and damage resistance of high strength concrete under the action of load and freeze-thaw cycles." Cement and Concrete Research, 29(1999), 1519-1523.
Tavares, C. M. L., Ribeiro, M. C. S., Ferreira, A. J. M., and Guedes, R. M. (2002). "Creep behaviour of FRP-reinforced polymer concrete." Composite Structures, 57(1-4), 47-51.
Vipulanandan, C., and Paul, E. (1990). "Performance of Epoxy and Polyester Polymer Concrete." ACI Structural Journal, May-June 1990, 241-251.
Wypych, G. (2003). Handbook of material weathering, ChemTec Publishing, New York.
Yamamoto, T. "The production performance and potential of polymers in concrete." 5th Inetrnational Congress on Polymers in Concrete, 1987, Brighton, England, 395-398.

VI-1
VI. FIRE PERFORMANCE OF PM
FORMULATIONS 6.1 Fire Reaction
6.1.1 Introduction
An important cause of physical damaging is fire. The behavior under fire is a feature of
paramount impact concerning building materials, both from the point of view of
structural security as well as the security of the occupants in the building.
Composite materials made from organic matrices, depending upon matrix type and
matrix content, are generally combustible. In most cases, polymers initiate or propagate
fires because, being organic compounds, they decompose into volatile products when
exposed to heat. The present spread of synthetic polymers has thus greatly increased the
‘fire risk’ and the ‘fire hazard’ that are respectively the probability of fire occurrence and
its consequence either on humans or on structures.
Polymer concretes (PC) and mortars (PM), as organic composite materials, are not free
from fire risks. Despite of their high mineral aggregate content, common resins used as
binders are highly flammables, which weaken the overall behavior under fire of this kind
of composite materials. Unsaturated polyesters and epoxy resins generally require flame-
retardants to meet fire protection standards. In particular, flammability of epoxy resins is
greater than comparable thermosetting resins since they have a reduced tendency to
carbonize. After removal of the ignition source they continue to burn on their own
(Horold 1999).
VI. FIRE PERFORMANCE OF POLYMER MORTAR FORMULATIONS
VI-2
Therefore, in many fields, the use of polymers is restricted by their flammability,
irrespective of the advantages their use may bring.
Fire performance is thus one of the main drawbacks that restrict the most the use of PCs
and PMs in construction (Browne et al. 1975).
6.1.2 Fire Test Standards
The 1988 edition of fire tests compilation by the American Society for Testing and
Materials (ASTM), alone, lists more than 70 tests, and ASTM is only one of the many
international organizations publishing fire test standards (ASTM 1988). Thus, in the
nineties it was estimated that the number of fire tests in use throughout the world was at
least in the hundreds (Troitzsch 1990).
It is typical to divide the fire test standards into two broad categories: reaction-to-fire, or
flammability, and fire endurance, or fire resistance.
At this point, a comment must be done concerning the distinct means of fire reaction and
fire resistance. Fire resistance applies mainly to a building element, (with structural,
bearing carrying or partition role), while fire reaction applies rather to a building material.
Fire resistance of a building element can be defined as its capacity to perform its function
under a fire situation, and it can be interpreted as the period of time under fire during
which the building element continues to perform its function satisfactorily. Fire resistant
tests are performed on barriers to fire and structural or load-bearing elements, such as
walls, floors, ceilings, doors, windows and related items.
Reaction-to-fire of a material, by contrast, can be defined as its potential contribution to a
fire. The fire reaction is determined by the material flammability and it can be
characterized by the same parameters as this last one: ignitability, flame spread, heat
release, and emission of smoke and toxic gases. Fire reaction tests are typically
performed on combustibles materials or products. The scope of the present study is
restricted to this kind of fire tests.

VI. FIRE PERFORMANCE OF POLYMER MORTAR FORMULATIONS
VI-3
A larger number of different standards and test procedures exist for assessing the reaction
to fire performance of construction products, and in almost of the cases, there is no
consensus or equivalence between them. Just for itemizing some of them:
The ASTM method for fire test response E:1354-04 (2004), provides means for
the determination of the ignitability, heat release rates, mass loss rates, effective
heat of combustion, and visible smoke development of materials and products.
The heat release rate is determined with basis on oxygen consumption principle.
This principle is based on the fact that the heat of combustion of organic materials
per unit of oxygen consumed is approximately the same. The heat release rate is
one of the most important parameters used to characterize the fire reaction
(Babrauskas and Peacock 1992). It provides an indication of the size of the fire,
the rate of fire growth, and as a consequence, the release rate of smoke and toxic
gases, the fire rating, the type of suppression actions that are likely to be effective,
and other attributes that define the fire hazard.
Other ASTM method for fire test response, E:662-03 (2003), covers the
determination of the specific optical density of smoke generated by solid
materials. Measurement is made of the attenuation of a light beam by smoke
accumulating within a closed chamber (chamber box) due to non-flaming
pyrolytic decomposition and flaming combustion.
The ‘Gross Calorific Potential test’ (GCP) determines the potential maximum
total heat release by a product when complete combustion occurs, regardless of its
end use (EN-ISO:1716 2002).
The ‘Oven-test for non-combustibility’ allows the identification of products that
will not contribute significantly to a fire, also in spite of their intended use (EN-
ISO:1182 2002).
The ‘Single Burning Item test’ (SBI) evaluates the potential contribution of a
material to the development of a fire in terms of heat release, smoke yield and
burning droplets. The reference scenario for the SBI test, as the name suggests, is
a fire originating from a single burning item in the corner of a room and growing
within that room to flashover. The amount of heat and smoke developed is

VI. FIRE PERFORMANCE OF POLYMER MORTAR FORMULATIONS
VI-4
measured while particle projection and flaming droplets are just observed
(EN:13823 2002).
The ‘Ignitability test’ assesses the ignitability of a product in a vertical orientation
when exposed to a small flame on the surface and, when appropriate, on the edge
too (EN-ISO:11925-2 2002).
The French norms NF X10-702 (1994) and NF X70-100 (Part 1, 2001; Part 2,
2001) provide means for determining the opacity and the toxicity of smoke and
gases released by a material under fire, which are the required parameters to
calculate the ‘smoke index’. This indicator allows the classification of the
materials into classes rated from F0 (materials that do not release neither smoke
nor toxic gases) up to F5 (materials that strongly release smoke and toxic gases),
according NF F16-101 (1988).
Another classification system of grading building materials according to their fire
reaction, forming the denominated ‘second generation’ of group of fire tests, is based on
radiant panels or in the epirradiator test. Ignition times, spread flame and variation of the
thermal balance are the parameters controlled in these types of tests. There are three
different main versions for these standards usually known by ´The Three Sisters’: the
French, the British and the German ones.
The ‘German sister’, regulated by DIN 4102-1 (1998) norm, establishes three
types of fire tests: in the electric furnace, in the combustion chamber
(Brandschacht) and in the little burner. Materials are classified as non-
combustibles (Class A) or combustibles (Class B). Non-combustibles materials
are subdivided into two categories: A1 and A2, according they observe,
respectively, all the non-combustibility requirements, surpassing the tests of the
electric furnace, combustion chamber, opacity of smoke, toxicity, thermal power
and heat release rate, or only the later five.
Combustible materials, on their turn, are subdivided into three subclasses
according to their flammability: hardly (B1), medially (B2) or easily flammables
(B3). These classifications are determined as function of obtained results of both
combustion chamber and little burner tests.

VI. FIRE PERFORMANCE OF POLYMER MORTAR FORMULATIONS
VI-5
The British branch, specified in BS 476 (Part 4, 1970; Part 7, 1997), establishes
the non-combustibility and spread flame tests as basis for fire reaction
classification. Materials are classified as non-combustibles if they suppress the
required criteria for the non-combustibility test, being categorized as class 0.
Combustible materials are divided into four classes rated from 1 to 4, according to
obtained results of spread flame test.
The French stream, over-headed by French Norm NF P92-507 (2004),
incorporates the Portuguese directive and Spanish standard, and they have no
requirements for smoke or toxicity of gases produced by combustion of building
materials. Materials are classified according to their combustibility and
flammability into five classes rated from M0 to M4.
A ‘M0’ class indicates that the material is not combustible. The criterion depends
on the maximum heat of combustion released by the material, determined by the
Gross Calorific Potential test (GPC). A ‘M1’ material is combustible, but not
flammable, i.e., the combustion ceases when the external heating source is
interrupted. Materials ‘M2’, ‘M3’ and ‘M4’ are respectively, moderately, medium
or highly flammable. For rigid materials, these classifications are determined by
the ‘classification index’ value, which is calculated with basis on specific
parameters obtained from the radiation or epirradiator test results.
The variation and differences between all these procedures meant that transition and
comparison of performance of a material when assessed by different methods became
very difficult. For instance, the same material with the same thickness, ordinary plywood,
has been classified according to its reaction-to-fire as a M4 in France, as a B2/B3 in
Germany, and indexed as a material 3 in the United Kingdom. The non-equivalence
between the different classification systems led to a lack of consensus between certified
products of different countries.
Some years ago, a researcher had tried to make a compilation of all the standards and
procedures in order to simplify this task (Troitzsch 1990). His book was particularly
useful, at the time, in simplifying the difficult and often confusing area of international
and national regulations of fire test procedures.

VI. FIRE PERFORMANCE OF POLYMER MORTAR FORMULATIONS
VI-6
Recently, a new system has been developed, which was negotiated with the national fire
regulators of the EU by the European Commission. As the concept and procedures for the
evaluation of reaction to fire of varying products differed from one country to another, a
harmonized approach was developed by CEN (European Committee for Standardization)
following a mandate from the European Commission. Today, this has resulted in new
testing methods and classifications of fire reaction and fire performance for building
materials– the Euroclasses.
6.1.3 Fire Reaction: Euroclassification
The European classification system, detailed in EN 13501-1 (2002), is in use since
February 1st, 2002. After this date, all national classifications for construction products
are still recognized on the national markets for a period of 3 to 5 years. The exact length
of this transitional period has not yet been fixed. At the end of the period, only European
classification will be valid, at both national and European level.
The European classification consists of seven Euroclasses: A1, A2, B, C, D, E and F.
Classes A1 and A2 cover products that contain only traces or minor quantities of
flammable elements and are, therefore, considered to be virtually or completely
non-combustible.
Classes B, C, D, and E cover the combustible products. They characterize the
most dangerous products as far as their performance in fire conditions is
concerned.
Classe F relates to products about which no data concerning their fire
performance is available or those products that failed the ignitability test that
normally regulates access to classification E.
With exception of Euroclasses A1, E and F, two additional classifications, relating to
smoke intensity and generation of burning particles or droplets supplement the main
Euroclasses. These additional classifications are subdivided into three levels of severity:
For smoke intensity: levels s1, s2 and s3 (corresponding to low, average, and high
quantity and speed of emission, respectively).

VI. FIRE PERFORMANCE OF POLYMER MORTAR FORMULATIONS
VI-7
For burning particles or droplets: levels d0, d1 and d2 (corresponding,
respectively, to no burning particles or droplets, no burning particles or droplets
with a burning time of more than 10 seconds, and not classifiable into the last two
levels).
The Euro classifications are based in a set of supporting tests. Test methods were
established to simulate the three levels of thermal activity that correspond to the different
stages in the development of a fire, e.g.: a direct attack by a small flame; additionally
thermal activity due to the heat of burning object; and a fully-developed fire in the
chamber. To respond to these three levels, four testing methods were selected and
harmonized to define the reaction to fire of construction materials:
The Gross Calorific Potential test (EN-ISO:1716 2002);
The Oven-test for non-combustibility (EN-ISO:1182 2002);
The Single Burning Item test -SBI (EN:13823 2002);
The Ignitability test (EN-ISO:11925-2 2002).
The criteria for classification as defined in the norm EN 13501-1 (2002) is summarized in
Table 6.1. When the experimental work of this thesis concerning fire reaction of PM
formulations was under development, European classification system and related
standards were still in the final harmonization, thus, all the experimental work was
conducted according to French normalization.
Table 6.1. Euro classification criteria for fire reaction.
Classes Levels Classification according to EN 13501-1
A1 - - d0 d1 s1 d2 d0 d1 s2 d2 d0 d1
A2
B
C
D s3
d2 E - d2 F - -
The fire classification of a product is expressed as per the following example:
A2 – s3, d0
(i.e.: a product only moderately combustible, with significant
smoke emission, but without burning particles or droplets)

VI. FIRE PERFORMANCE OF POLYMER MORTAR FORMULATIONS
VI-8
As Euro-classification try to reflect the safety concept developed in each country, it is
possible to foresee the fire performance of materials from former classifications, (British,
German and French ones), to European classification taking only into account the fire
contribution of each class. It must be remarked that no official decision have been
achieved by any states regarding this issue, and the work is still in progress. This
approach is presented in Table 6.2.
Table 6.2. Conversion trial from the German, British and French fire classification to European classification in terms of flame spread contribution (SpecialChem 2005).
Contribution to fire
No contibution
Quasi no-contibution
Very limited Limited Medium High
European A1 A2 B C D E
French M0 M0 M1 M2 M3 M4 German A1 A2 B1 B2 B2 B3 British 0 0 0-1 1 3 4
6.1.4 Flame and Fire Retardant Additives
The fire safety of composite materials can be significantly enhanced by increased ignition
resistance, reduced flame spread rates, reduced heat release rates, and reduced amounts of
toxic and smoke products, preferably simultaneously (Kashiwagi et al. 1997).
The most common approach to improve fire safety performance is the use of flame
retardant chemicals. The role of these modifiers is to slow down polymer combustion and
degradation (fire extinction), to reduce smoke emission, and to avoid dripping.
There are two basic types of flame retardant chemicals: reactive flame retardants, which
are usually introduced during the polymerization stage and copolymerized, together with
other monomers; and additive flame retardants, which are introduced during a subsequent
compounding stage.
Reactive flame-retardants are chemically linked to the resin matrix, so that mechanical
and chemical properties are not usually affected. The main drawback lies on the higher
cost associated to the flame retardancy process itself.

VI. FIRE PERFORMANCE OF POLYMER MORTAR FORMULATIONS
VI-9
Additive flame-retardants are more frequently used and are very numerous, depending on
the precise conditions in which the additive is expected to operate (and the desired cost
level). However, the addition of a flame retardant additive into a polymer generally leads
to a reduction of its mechanical properties and particularly, of impact resistance. The
main challenge during the selection of a flame retardant additive system is to minimize
the loss of properties at optimized cost, taking into account other performances such as
mechanical resistance, UV stability, heat resistance and processability.
To understand the role of flame retardant additives on fire retardancy of polymer
composites, the mechanism of fire action must be previously understood.
Fire is the result of three ingredients: heat, fuel and oxygen. Heat produces flammable
gases from the pyrolysis1 of polymer. Then, an adequate ratio between these gases and
oxygen leads to ignition of the polymer. The combustion leads to a production of heat
that is spread out and fed back. This heat feedback increases even more the pyrolysis of
polymer and keeps the combustion going.
To limit the establishment of this combustion circle, one (or more) ingredient must to be
removed. Several techniques are available in order to break down this combustion circle.
Depending on the type of polymer, flame-retardants interfere into one or several stages of
the combustion process: heating, decomposition, ignition, flame spread and smoke
process (Hernangil et al. 2000).
6.1.4.1 Mechanism of action of flame-retardants additives
Flame-retardants can act chemically and/or physically in the condensed (solid) phase
and/or in the gas phase. However, both of them occur during a complex process with
many simultaneous reactions.
The main mechanisms of action of flame-retardants can be grouped into the following
processes: (i) production of a protective layer, (ii) consummation of high-reactive free
radicals, and (iii) release of water. All processes lead to the elimination or reduction of
flammable gases.
1 The part of the irreversible chemical decomposition caused exclusively by a rise in temperature.

VI. FIRE PERFORMANCE OF POLYMER MORTAR FORMULATIONS
VI-10
i) Production of a protective layer
Flame-retardants can cause a layer of carbon (charring) on the polymer’s surface. It
constitutes a two-way barrier, both for the hindering of the passage of the combustible
gases and molten polymer to the flame, as well as the shielding of the polymer from the
heat of the flame. Some polymers, such as phenolic resins, have a natural capacity to
char, thus reducing the formation of volatiles and so they extinguish if the ignition source
is removed. The high nitrogen content of urea and melamine resins also acts as an
inherent flame retardant.
Intumescence’s processes can also form a protective barrier. Flame retardant intumescent
materials form, by heat action, foamed cellular charred layers on the surface, which
protects the underlying material from the action of the heat flux or the flame. The
mechanism is based on the charred layer acting as a physical barrier, which slows down
heat and mass transfer between gas and condensed phase (Bourbigot et al. 1998).
Generally, intumescent formulations contain three active ingredients: an acid source, a
carbonization compound, and a blowing agent. First, the acid source breaks down to yield
a mineral acid, then, it takes a part in the dehydration of the carbonization compound to
yield the carbon char, and finally, the blowing agent decomposes leading to the release of
gaseous products. These latter, cause the char to swell providing the insulating material.
Another type of shield, a vitreous type, can be produced by certain flame-retardants.
Their pyrolysis leads to thermally stable compounds, which form a protective vitreous
barrier with low thermal conductivity. Heat transfer from the heat source to the material
is reduced, which decreases the degradation rate of the polymer and the ‘fuel flow’ that
feeds the flame.
ii) Consummation of high-reactive free radicals:
Certain flame-retardants or their degradation products, stop the radical mechanism of the
combustion process that takes place in the gaseous phase. The high-reactive radicals HO־
and H־ can react in the gas phase with other radicals resulted from flame retardant
degradation, creating less reactive radicals that decrease the kinetics of the combustion.
The exothermic processes, which occur in the flame, are thus stopped, the system cools
down, and the supply of flammable gases is reduced and eventually, completely
suppressed.

VI. FIRE PERFORMANCE OF POLYMER MORTAR FORMULATIONS
VI-11
iii) Release of water:
Some flame retardant additives, when subject to high temperatures, decompose leading to
an endothermic release of water. The endothermic decomposition acts as a ‘heat pump’
that cools the substrate and decreases the pyrolysis of the polymer. The release of water
dilutes the amount of fuel. Both essentially fight against ignition.
6.1.4.2 Families of Flame Retardants:
Currently used flame retardants (FR) in polymers can be classified into the following
main families:
Halogenated additives and antimony trioxide;
Phosphate-based materials (not halogenated).
Metal Hydroxides
Melanine based;
Zinc Borate
i) Halogenated based FRs and Antimony Trioxide:
Halogenated compounds, such as chlorinated and brominated based materials, are usually
introduced to increase the total halogen concentration. The mode of action is based on
radical trap mechanism. Fire retarding action takes place in the gas phase by the
interception of highly reactive free radicals (OH־, H־) by halogenated organic compounds
(Br־, Cl־). Antimony trioxide (Sb2 O3) is often used as a synergist together with the
halogen containing flame-retardants.
Halogenated additives in resins show a remarkable efficiency as flame-retardants and do
not seriously impact the mechanical, thermal, ultraviolet thermo stability or electric
properties of the polymers (SpecialChem 2003). Although halogenated flame retardants
are highly effective for reducing the heat release rate of common polymers, public
perception of the environmental impact of recycling and incineration of certain
halogenated products has become an issue in Europe (Nelson 1994). There are increasing
concerns over environmental and toxicological impacts of the decomposition products
formed when the blended polymer is disposed off or burned. Furthermore, halogenated

VI. FIRE PERFORMANCE OF POLYMER MORTAR FORMULATIONS
VI-12
flame-retardants also generate a great quantity of smoke and toxic fumes, which are
unacceptable for many applications in public areas (Hillado 1998).
ii) Phosphate based FRs :
Phosphate derivatives are well known as flame-retardants for a long time and already
used for wood, paper and cotton fibers. Nowadays, in the fire protection of plastics,
phosphates and their derivatives are getting more and more importance (SpecialChem
2003). Non-halogenated phosphorous-based flame retardants influence the reaction
taking place in the condensed phase, generally, by an intumescent process. Their
efficiency depends on the chemical structure of the polymer, being particularly successful
in materials with high oxygen content like polyesters, polyurethanes, epoxies or cellulose
(Horold 1999). In non-halogenated phosphate compounds, we meet insoluble ammonium
phosphates, water-soluble inorganic phosphates, polyphosphates and red phosphorous.
One of the most establish products, because of its versatility is ammonium polyphosphate
(APP). Ammonium polyphosphate or APP based systems can be used in thermoplastics,
rubbers and thermosets such as polyurethane, unsaturated polyester, epoxy and phenolic
resins. APP is a non-toxic inorganic material, environmentally friendly and it does not
generate additional quantities of smoke due to the unique mechanism of intumescence.
Compared to other halogen free systems, requiring higher loadings, FR materials
containing APP exhibit good process ability, good mechanical properties retention and
excellent electrical properties. The addition of synergetic products like pentaerythritol
derivatives, carbohydrates and foaming agents will significantly improve the flame
retardant performance of APP. In thermosets, APP can be used in combination with
aluminum trihydroxide (ATH), which allows a significant reduction of the total FR filler
(SpecialChem 2003). The main drawback appears to be the increase amount of carbon
monoxide generated during the combustion (by five to ten times).
iii) Metal Hydroxide based FRs :
Metal hydroxide is among the most used flame-retardants. This is due to its low cost
when compared to halogen systems and phosphorous-based flame-retardants. Inorganic
hydroxides are easily handled and relatively non-toxic, producing combustion products
with low opacity, low toxicity and minimal corrosivity.

VI. FIRE PERFORMANCE OF POLYMER MORTAR FORMULATIONS
VI-13
Metal hydroxides contribute to several flame-retardant actions. The main mechanism is
based on the endothermic release of water at higher temperatures. Additionally, after
degradation, a ceramic-based-protective layer is created, improving the insulating
property and revealing a smoke suppressant effect.
Aluminum trihydroxide (ATH), also known by hydrated alumina, is the most widely used
flame retardant additive in volume terms. It is suitable for elastomers, thermosetting
resins and thermoplastics processed below 200ºC. As well as flame retarding and smoke
suppressing, it is an economical filler/extender. Further, ATH is very easy to recycle, do
not has impact on color, presents excellent weatherability, and as inert, it rarely interferes
with the polymer or with other additives (SpecialChem 2000).
Attending to the above benefits, ATH is often used in building and construction products.
Most of unsaturated polyester resins applications, such as laminated countertops and wall
covering, sheet and bulk moulding compounds, are fire-protected with ATH. Epoxy and
phenolic resins often use ATH in electrical/electronic and construction applications like
lavatories, bathroom panels, decorative surrounds and wall panels. Pultruded products
also use ATH as flame retardant for producing profiles for construction applications.
However, as very high loadings of ATH (40%-70%) are required for effective levels of
fire retardancy, processability and mechanical properties of final product are
compromised, restricting the application field of this kind of flame retardants.
Magnesium hydroxide (MH) is a more thermally stable inorganic flame retardant and can
be used in many elastomers and resins processed at higher temperatures (above 300ºC).
Like ATH, MH requires high loading levels, usually between 50% and 70%. As its price
is higher than ATH, MH application is practically restricted to materials that are
processed to temperatures above 200ºC.
iv) Melamine based FRs :
Melamine based FRs represent a small but fast growing segment in the flame retardant
market. In this family of non-halogenated flame-retardants, three chemical groups can be
distinguished: pure melamine, melamine derivatives (salts with organic or inorganic
acids), and melamine homologues such as melam, melem and melon. The latter finding
only in experimental use at this stage.
VI. FIRE PERFORMANCE OF POLYMER MORTAR FORMULATIONS
VI-14
Melamine based FRs show excellent fire retardancy properties and versatility in use, due
to their ability to interfere with the combustion process in all stages and in many different
ways. In the initial stage, melamine can retard ignition by causing a heat sink through
endothermic processes of decomposition and sublimation. Melamine can also show
considerable contribution to the formation of a char layer in the intumescent process. In
combination with phosphorous, due to a synergistic effect, melamine can further increase
char stability through formation of nitrogen-phosphorous substances. Last but not least
melamine can act as blowing or swelling agent, enhancing the heat barrier functionality
of the char layer.
The growing interest for melamine-based flame-retardants is furthermore driven by
particular advantages that these products offer over existing flame-retardants, namely:
cost effective, low smoke density and toxicity, low corrosion, safe handling and
environmental friendliness. Currently, main areas of application are flexible polyurethane
foams, intumescent coatings, polyamides and thermoplastic polyurethanes (SpecialChem
2003).
v) Zinc Borate based FRs :
Zinc borate is a boron-based fire retardant normally used jointly with other flame-
retardant systems (APP, MH or red phosphorous). It functions mainly in the condensed
phase, promoting the formation of a vitreous layer, which can be enhanced by the finer
particle size. Zinc borate can be used in PVC, elastomers polyamides and epoxy resins
and it is thermally stable up to 290ºC. Grades are also suitable for use in translucent
polyester resin systems, to improve fire performance, while retaining clarity
(SpecialChem 2000).
6.1.4.3 New flame-retardants: Silicon based FRs and Nanocomposites:
Silicon-based FRs constitute a new family of flame and fire retardants. Silicon-based
materials are potential flame-retardants as they produce protective surface coatings
during a fire, caused by a low rate of heat release. Almost forms of silicon-based
materials have been investigated as flame-retardants: silicones, silicas, organosilanes,

VI. FIRE PERFORMANCE OF POLYMER MORTAR FORMULATIONS
VI-15
silicates and nanoclays (Beyer 2002; Gilman et al. 1999; Gilman et al. 1997; Kashiwagi
and Gilman 2000; Lichtenhan and Gilman 1997).
The most common flame-retardant based on silicon is in the form of polyorganosiloxane,
in particular polydimethylsiloxane. Low levels of this silicon compound in certain
organic polymer systems, as low as 1 to 3 %, reduce the heat release rate by 30 to 50 %
(Kashiwagi and Gilman 2000).
Inorganic silicon additives such as silica have been used as filler instead of as flame
retardant, but under certain cases, the addition of silica affects the thermal stability and
the flammability properties of materials. Talc, a silicate compound, can also introduce the
same features. Levchik and co-workers (1994) reported the effect of talc on the
flammability properties of polyamide flame retarded with APP. Fire-reaction
classification improved from ‘Non-classified’, for the talc-free formulation, to the best
classification (V-0), for an APP/talc ratio of 2:1.
A ‘giant’ world has been opened with the recent advances on the new class of polymer
systems: the nanocomposites. Gilman et al. (1997) reported on the promising
flammability properties of polymer layered silicate nanocomposites. Polymer clay
nanocomposites are hybrid organic polymer-inorganic materials that consist of
alternating, nanometer-thick layers of polymer and mica-type silicate. In the last years,
several groups have developed the most recent methods of preparing polymer clay
nanocomposites (Giannelis 1996; Hasegawa et al. 2005; Kojima et al. 1993; Usuki et al.
1997). In general, these methods achieve molecular-level incorporation of the layered
silicate (e.g. montmorillonite) into the polymer by the addition of a modified silicate.
Polymer clay nanocomposites have unique properties when compared to conventional
filled polymers: modified layered silicates as fillers are dispersed at a nanometer-level
within a polymer matrix and new extraordinary properties are observed.
The main improvements are in mechanical properties such as tension, compression,
bending and fracture; barrier properties such as permeability and solvent resistance;
optical properties and ionic conductivity (SpecialChem 2002). For example, the
mechanical properties of a nylon-6 layered-silicate nanocomposite, with only a silicate
mass of 5%, show excellent improvement over those for the pure nylon: 40% higher

VI. FIRE PERFORMANCE OF POLYMER MORTAR FORMULATIONS
VI-16
tensile strength, 68% greater tensile modulus, 60% higher flexural strength, and 126%
increase flexural modulus (Gilman et al. 1997).
Other interesting properties exhibited by polymer layered silicate nanocomposites include
their increased thermal stability, and ability to promote flame retardancy at very low
filling levels (2-10 wt.%). The formation of a thermal insulating and low permeability
char caused by polymer degradation during a fire is responsible for these improved
properties. For illustration, in the above reported research work, the peak heat release rate
of the nylon-6 clay-nanocomposite was reduced by 63%, containing only a clay content
of 5%.
Nanoclays are thus the basis for improved flame-retardants systems for polymer
composites. Not only are very efficient in fire retardancy, but they do not have the usual
shortcomings associated with other flame retardant additives. Their properties are not
degraded by the additive (clay), they are greatly improved instead. Furthermore, the
system does not increase the carbon monoxide or soot produced during the combustion,
as many commercial fire retardants do.
6.1.5 Research Objective
The present study aims to analyze and classify fire reaction of both PMs formulations.
For this purpose two types of tests were carried on: the cone calorimeter test and the
radiation or epirradiador test. Jointly, both tests allow the determination of the main
parameters to classify fire reaction of combustible materials: time to ignition, heat and
smoke release rate, and flame spread (Wittbecker 2004).
The cone calorimeter test provides means for determining the ignitability, heat and visible
smoke release rates. As stated earlier, heat release rate constitutes the single most
important variable in fire hazard. It gives an indication of the size of the fire and the rate
of fire growth, and as a result, the fire rating. Smoke and toxic gases emission also
constitute important indexes of fire hazard. Density and opacity of fumes are parameters
to take into account because of disorientation suffered by the victims. On the other hand,
emission of toxic gases, such as carbon dioxide and carbon monoxide are also important

VI. FIRE PERFORMANCE OF POLYMER MORTAR FORMULATIONS
VI-17
factors as both are responsible for displacing the oxygen from the air, and the latter, in
addition, is highly toxic due to an even greater affinity with hemoglobin than oxygen.
The epirradiador test allows the determination of the ignition times, spread flame and
variation of the thermal balance, which are parameters required to classify the materials
according their reaction to fire. By means of this classification, intended use and
application of polymer mortars, as building materials, will be conditioned according to
the present regulations.
In the second phase of this experimental program, an attempt was made in order to
improve fire behavior of epoxy PM formulation. For this purpose, three additional series
of epoxy PM specimens, modified with two different types of flame-retardants systems,
were manufactured and tested for fire reaction. Obtained results were compared with
those obtained for plain PMs.
Both type of fire tests were carried on in the ‘Laboratório de Fumo e Fogo’, which is a
certified Fire Laboratory at INEGI. The cooperation and knowledge of Dr. João
Rodrigues, who is in charge of this laboratory, was essential for the accomplishment of
the present research work.

VI. FIRE PERFORMANCE OF POLYMER MORTAR FORMULATIONS
VI-18
6.2 Heat and Smoke Release Rates
6.2.1 General
In the last years, developments in fire research and understanding of fire dynamics have
highlighted the importance of heat release rate as the primary fire hazard indicator
(Babrauskas and Peacock 1992; Sorathia and Ohlemiller 1997).
The rate of heat release constitutes the main characteristic determining the size, growth,
and suppression requirements of a fire environment. Determination of the quantity of heat
evolved per unit time allows an estimation of the potential hazard posed by a product: if
the heat release rate is small, fire spread can be controlled, but if it is large, this is no
longer possible as flashover is quickly reached (Wittbecker 2004).
As an indicator of the size of the fire and the rate of fire growth, heat release rate provides
as a result, the fire rating, the type of suppression action that are likely to be effective,
and other features that define the fire hazard. Fire hazard under a given set of
circumstances of fuel load, geometric configurations, and ventilation conditions can be
expressed, as this way, in terms of heat release rate, and the fire hazard analysis should
include the relevant fire response parameters.
Smoke and toxic gases emission also constitute important indexes of fire hazard. They
occur alongside the fire development as the rate of flame spread and heat released
increases. Together with radiant heat and lack of oxygen, they represent the severest
hazard concerning escape and rescue.
Thus, heat and visible smoke release rates have been the most widely used parameters for
the assessment of a fire hazard or a fire risk, as they take into account all the factors that
are pertinent for the evaluation of the fire hazard or fire risk of a particular end use.
In this subchapter, heat release rate properties of epoxy and polyester PM formulations in
study are analyzed. For this purpose, heat release rate, effective heat of combustion, time
to ignition, total heat released, mass loss rate, mean of monoxide and dioxide of carbon
yield and mean specific extinction area for smoke, were measured and/or determined.

VI. FIRE PERFORMANCE OF POLYMER MORTAR FORMULATIONS
VI-19
6.2.2 Experimental Program
6.2.2.1 Test apparatus, measured parameters and their significance.
Heat release rates of PM formulations, were determined by means of the cone calorimeter
test performed according to ASTM standard E 1354 (2004). This test method measures
the response of a small sample of material exposed to controlled levels of radiant heating
and is used to determine not only the heat release rates, but also the ignitability, mass loss
rates, effective heat of combustion, and visible smoke development.
The heat release rate, understood as the heat evolved from the specimen per unit of time,
is determined with basis on oxygen consumption principle. This states that there is a
constant relationship between the mass of oxygen consumed from the air and the amount
of heat released during the material degradation. Approximately, 13.1 x 10³ KJ of heat
are released per 1 kg of oxygen consumed (Huggett 1980).
The effective heat of combustion is determined from a concomitant measurement of
specimen mass loss rate, in combination with the heat release rate. It is determined by
dividing the measured heat release by the mass loss for a specified time period.
Time to ignition, or ignitability, is determined as a measurement of time from initial
exposure to time of sustained flame. It is considered sustained flame the existence of
flame on or over most of the specimen for periods of at least four seconds.
Smoke development is measured by obscuration of light by the combustion product
stream, which can be assessed by the specific extinction area. This parameter indicates
the concentration of soot particles generated by the combustion, and it can be defined as
the smoke that is produced per unit mass of material being volatized. Monoxide and
dioxide of carbon release can also be determined by means of infrared gas analyzers.
To measure all the above parameters, the cone calorimeter apparatus is provided with the
following components: a conical shaped radiant electric heater, capable of horizontal or
vertical orientation; specimen holders, different for the two orientations; an exhaust gas
system with an oxygen and flow measuring monitoring; an electric spark igniter; a data
collection and analysis gas system; and a load cell for measuring specimen mass loss. An
overall view of the cone calorimeter apparatus and the scheme of its main components
are shown Figs. 6.1 and 6.2, respectively.

VI. FIRE PERFORMANCE OF POLYMER MORTAR FORMULATIONS
VI-20
Fig. 6.1. Oxygen consumption calorimeter apparatus used to perform heat release tests.
Fig. 6.2. A schematic view of the cone calorimeter showing its main components.

VI. FIRE PERFORMANCE OF POLYMER MORTAR FORMULATIONS
VI-21
6.2.2.2 Test specimens and test procedure
Two specimens of each PM formulation, with 100 by 100 mm in area and 15 mm
thickness, were casted. Silicon moulds were used for this purpose. The specimens, after
being submitted to the usual curing treatment, were conditioned to moisture equilibrium
(constant weight) at an ambient of 23ºC and a relative humidity of 50%, before being
tested for heat and smoke release rate.
All the tests in the oxygen consumption calorimeter were carried out under the following
conditions: horizontal orientation of the specimens, heat flux of 50.0 kW/m2 and exhaust
duct flow rate of 25 m3/s.
The tests were performed according to the following steps. After calibration procedure of
test apparatus, as specified in the norm, each test specimen, which weight was previously
recorded, was held in the appropriate holder and the data collection and spark igniter
were then turned on. When a sustained flaming appeared the spark was turned off, and
the correspondent ignition time was recorded. After this point, the tests and the collection
data did go on until one of the following situations has occurred: 2 minutes have passed
after any flaming or signs of combustion have ceased; the average mass loss over a 1
minute period has dropped below 150 g/m2, or until 60 minutes have elapsed.
In Fig. 6.3, some of different test steps are illustrated.
6.2.3 Test Results and Discussion
6.2.3.1 Experimental results
Performed tests on cone calorimeter apparatus allowed determining the values for the
following parameters: heat release rate; carbon monoxide and carbon dioxide release
rates; time to ignition; mass loss; effective heat of combustion; and specific extinction
area.
Obtained results for these parameters (mean and peak values, when applied) are shown in
Tables 6.3 for polyester and epoxy PM specimens. Figures 6.4 and 6.5 represent the
variation of the main parameters as function of time. Shown results represent the average
values of two specimens tested for each composition.

VI. FIRE PERFORMANCE OF POLYMER MORTAR FORMULATIONS
VI-22
Fig. 6.3. Some sequential images taken off during the cone calorimeter test: a) Placement of test specimen on apparatus holder; b) Beginning of combustion reaction when a sustainable flame appeared; c) Maximum reaction intensity; d) Specimen appearance at the end of the test.
Table 6.3. Experimental results obtained from cone calorimeter tests performed on polyester and epoxy PM specimens.
Polyester PM Epoxy PM Parameters
Peak Mean Peak Mean
Heat release rate [kW/m2] 210.2 134.6 325.2 158.5 Effective heat of combustion [MJ/m2] 29.6 20.6 34.2 24.5 Specific extinction area [m2/kg] 1146.5 1003.8 1170.7 965.0 Carbon monoxide [kg/kg] 0.6606 0.0502 0.9640 0.0700 Carbon dioxide [kg/kg] 2.66 1.75 3.20 1.81 Total heat evolved [kJ] 1149.1 1280.4 Time to ignition [s] 84 82 Mass loss [%] 19.1 18.8
a) b)
c) d)

VI. FIRE PERFORMANCE OF POLYMER MORTAR FORMULATIONS
VI-23
Fig. 6.4. Heat release rate, effective heat of combustion and specific extinction area as function of time, for both epoxy and polyester PM formulations.
0
50
100
150
200
250
300
350
0 100 200 300 400 500 600 700 800 900 1000
Time (s)
Hea
t Rel
ease
Rat
e ( K
J/m
^2 )
Epoxy PM
Polyester PM
Heat Release Rate
0
5
10
15
20
25
30
35
0 100 200 300 400 500 600 700 800 900 1000
Time (s)
Effe
ct. H
eat o
f Com
b. (M
J/K
g)
Epoxy PM
Polyester PM
Effective Heat of
Combustion
0
300
600
900
1200
1500
0 100 200 300 400 500 600 700 800 900
Time (s)
Spec
ific
Extin
ctio
n A
rea
(m2/
Kg)
Epoxy PM
Polyester PM
Specific Extinction Area

VI. FIRE PERFORMANCE OF POLYMER MORTAR FORMULATIONS
VI-24
Fig. 6.5. Mass loss, carbon dioxide and carbon monoxide release as function of time, for both epoxy and polyester PM formulations.
0
50
100
150
200
250
300
350
0 100 200 300 400 500 600 700 800 900 1000
Time (s)
Mas
s (g
)
Epoxy PM
Polyester PM
Mass Loss
0
0.5
1
1.5
2
2.5
3
3.5
0 100 200 300 400 500 600 700 800 900 1000
Time (s)
CO
2 (k
g/kg
)
Epoxy PM
Polyester PM
Carbon Dioxide Release
0
0.15
0.3
0.45
0.6
0.75
0.9
1.05
0 100 200 300 400 500 600 700 800 900 1000
Time (s)
CO
(kg/
kg)
Epoxy PM
Polyester PM
Carbon Monoxide Release
VI. FIRE PERFORMANCE OF POLYMER MORTAR FORMULATIONS
VI-25
6.2.3.2 Analysis of results and discussion
The comparative analysis of obtained results, from cone calorimeter tests performed on
epoxy and polyester PM formulations, shows that epoxy PM specimens present in
general, a worse behavior under fire conditions.
The mean heat release rate of epoxy-based mortars is 18% higher than polyester based
ones. The weak fire performance of epoxy specimens is more notorious taking into
account the difference between the peak values obtained for this parameter for both PM
formulations - peak heat release rate of epoxy mortars is 55% superior than correspondent
value of polyester mortars-.
The mean effective heat of combustion and total heat evolved, as parameters related with
heat release rate, also present higher values for epoxy-based mortars.
The higher flammability of epoxy-based mortars is likely due to a poor thermal stability
of epoxy resin when compared to unsaturated polyester resin. The general reduced
tendency of epoxy resins to char could be another feature contributing for the worst
performance of epoxy PMs under fire.
For both formulations, heat release-time profiles are very similar. There is an initial delay
period before the specimen releases heat, as the temperature of the material is below the
pyrolisis temperature of the organic matrices. After this induction period, there is a rapid
rise in the heat release rate due to combustion of volatiles near to the specimen/fire
interface, until a first peak is reached. Following this first peak, heat release rate
decreases slightly, during a few seconds, to rise again, until a second peak, faintly larger,
is attained. After this point, heat release rate decreases progressively with time as a result
of the declining resin content in the sample and, eventually, due to the formation of a
surface char layer that slows the decomposition reaction rate in the underlying material.
Specimens were placed in the cone calorimeter holder with the moulding surface in the
upwards position. Due to migration phenomenon, this surface usually presents higher
resin content, which explains the first peak. After the superficial layer has been
decomposed, the underlying material, richer in sand was exposed, leading to a slight
decrease in heat release rate. The second peak is attributed to the increasing amount of
heat released by molten polymer as temperature of deeper underlying material reach
pyrolisis temperature of organic matrix.

VI. FIRE PERFORMANCE OF POLYMER MORTAR FORMULATIONS
VI-26
In hazard fire, epoxy PMs are also most problematic due to their higher toxic gas release:
this material yields more 40% of carbon monoxide than polyester PM, exhibiting a peak
value of 0.964 kg/kg against the comparative value of 0.661 kg/kg correspondent to
polyester PM.
Based on the mass loss data, it is estimated that both epoxy and polyester PM specimens
yield about 19% of their original mass as gas products, leaving 1% as char. The matrix
content of both formulations was 20%, which demonstrates that these resins undergo
substantial volatilization.
With respect to the other parameters, ignitability, smoke and carbon dioxide release rates,
obtained results are very similar for both PM formulations.
There is a considerable amount of information concerning heat release rates of different
types of polymers and composites materials but, as far as this investigation is concerned,
no relevant information was found regarding heat release properties of polymer concretes
or mortars. The lack of available data hinders any comparison with analogous concrete
based materials, however, some considerations can be done relating other polymer
composite materials.
Sorathia et al. (1999) studied the fire performance of several glass-reinforced vinyl-
ester/epoxy composites commonly used for marine applications, with and without fire
retardant additives or reactives. The composites were made with a glass fiber content of
70% by weight, which allowed a rude comparison with PM formulations in study (as the
percentage of non-combustible reinforcement material is almost the same). Tests
performed on the cone calorimeter apparatus were made according to the same conditions
as these ones. Obtained results, jointly with those of the present research, are presented in
Table 6.4.
For the assessment, average heat release rate during the first 180 seconds was considered
instead the peak or the mean over the entire test period. Previous researches undertaken
on prediction of real-scale fire hazard from brench-scale tests showed that, due to the
physics of burning, an average rather than the peak of heat release rate is needed in
predicting the peak hazard. Statistical considerations led to 180 seconds as a useful length
of the averaging period (Babrauskas and Peacock 1992).
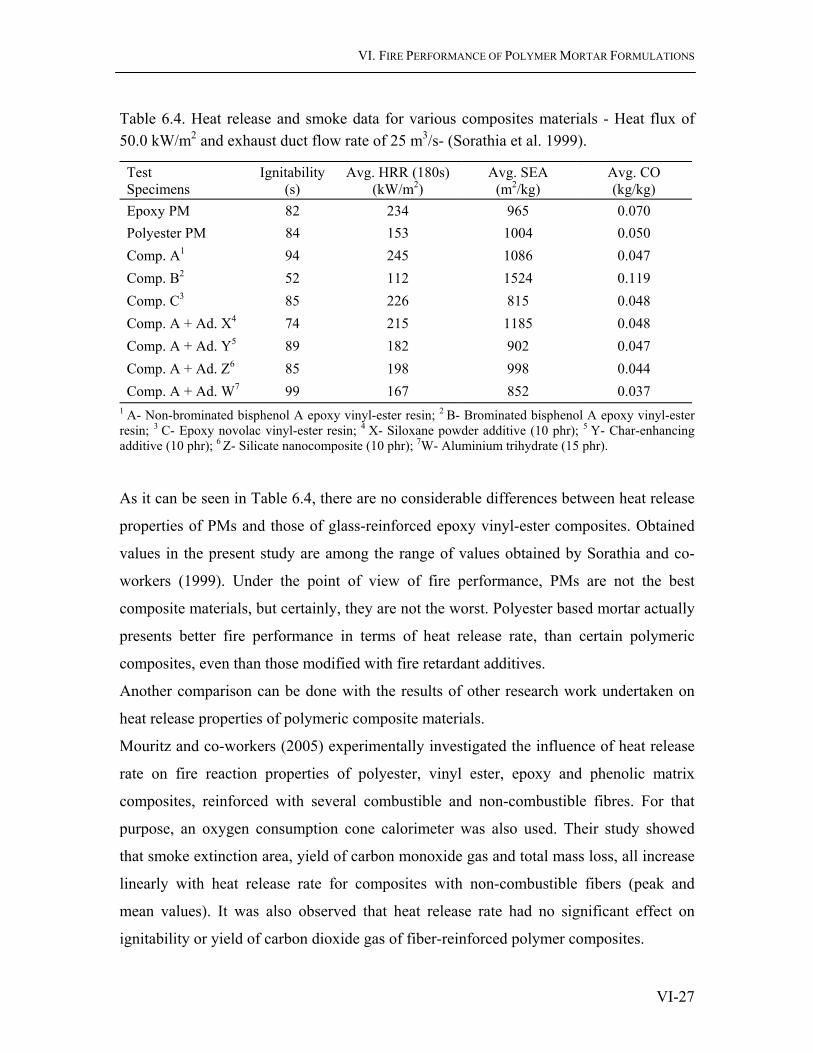
VI. FIRE PERFORMANCE OF POLYMER MORTAR FORMULATIONS
VI-27
Table 6.4. Heat release and smoke data for various composites materials - Heat flux of 50.0 kW/m2 and exhaust duct flow rate of 25 m3/s- (Sorathia et al. 1999).
Test Specimens
Ignitability (s)
Avg. HRR (180s) (kW/m2)
Avg. SEA (m2/kg)
Avg. CO (kg/kg)
Epoxy PM 82 234 965 0.070 Polyester PM 84 153 1004 0.050 Comp. A1 94 245 1086 0.047 Comp. B2 52 112 1524 0.119 Comp. C3 85 226 815 0.048 Comp. A + Ad. X4 74 215 1185 0.048 Comp. A + Ad. Y5 89 182 902 0.047 Comp. A + Ad. Z6 85 198 998 0.044 Comp. A + Ad. W7 99 167 852 0.037
1 A- Non-brominated bisphenol A epoxy vinyl-ester resin; 2 B- Brominated bisphenol A epoxy vinyl-ester resin; 3 C- Epoxy novolac vinyl-ester resin; 4 X- Siloxane powder additive (10 phr); 5 Y- Char-enhancing additive (10 phr); 6 Z- Silicate nanocomposite (10 phr); 7W- Aluminium trihydrate (15 phr).
As it can be seen in Table 6.4, there are no considerable differences between heat release
properties of PMs and those of glass-reinforced epoxy vinyl-ester composites. Obtained
values in the present study are among the range of values obtained by Sorathia and co-
workers (1999). Under the point of view of fire performance, PMs are not the best
composite materials, but certainly, they are not the worst. Polyester based mortar actually
presents better fire performance in terms of heat release rate, than certain polymeric
composites, even than those modified with fire retardant additives.
Another comparison can be done with the results of other research work undertaken on
heat release properties of polymeric composite materials.
Mouritz and co-workers (2005) experimentally investigated the influence of heat release
rate on fire reaction properties of polyester, vinyl ester, epoxy and phenolic matrix
composites, reinforced with several combustible and non-combustible fibres. For that
purpose, an oxygen consumption cone calorimeter was also used. Their study showed
that smoke extinction area, yield of carbon monoxide gas and total mass loss, all increase
linearly with heat release rate for composites with non-combustible fibers (peak and
mean values). It was also observed that heat release rate had no significant effect on
ignitability or yield of carbon dioxide gas of fiber-reinforced polymer composites.

VI. FIRE PERFORMANCE OF POLYMER MORTAR FORMULATIONS
VI-28
In the present research, within the uncertainty of the data, no correlation or reliable
relationships were found between the former parameters and the main indicator of fire
hazard. In fact, smoke extinction area and mass loss values show a slight tendency to
decline for increasing values of heat release rate. Instead, only a strong correlation was
observed between carbon monoxide yield and the average of heat release rate during the
first 180 seconds. Likewise, the expected high relationship between the peak and the
average of heat release rate is stronger, if the average during the first 180 seconds is
considered instead of the mean over the entire test period. Such relationships are
represented in Fig. 6.6.
Fig. 6.6. Plot of carbon monoxide yield and peak of heat release rate against both averages of heat release rate: average during the first 180 seconds and average over the entire test period. Reported data are referred to all PM test specimens.
Despite the observed, attending to the reduced number of test specimens, no feasible
considerations can be done regarding the distinct behavior of fire reaction properties of
polymer mortars relatively to composites reinforced with non-combustible fibers.
6.2.4 Conclusions
Heat release rate constitute the single most important variable in a fire situation and can
be considered as the driving force of the fire. In order to assess heat and smoke release
rate properties of PM formulations in study, cone calorimeter tests were performed on
R2 = 0.91
R2 = 0.56
0
0.01
0.02
0.03
0.04
0.05
0.06
0.07
0.08
0 50 100 150 200 250 300
Heat Release Rate (kW/m^2)
CO
Yie
ld (k
g/kg
)
AHRR (first 180 s)
AHRR (test period)
R2 = 0.91
R2 = 0.98
0
50
100
150
200
250
300
350
400
0 50 100 150 200 250 300
Average Heat Release Rate (kW/m^2)
0
50
100
150
200
250
300
350
400
Peak
Hea
t Rel
ease
Rat
e (k
W/^
2)
AHRR (first 180 s)AHRR (test period)

VI. FIRE PERFORMANCE OF POLYMER MORTAR FORMULATIONS
VI-29
specimens of both types of mortars. Attending to obtained results the following
conclusions can put forth.
• Under a fire situation, epoxy-based mortar presents a worst behavior than
polyester based one, especially in terms of heat release rate and carbon monoxide
yield. Poor thermal stability and the weak tendency to char of epoxy resin seem to
be the main reasons for this feature.
• Yield of carbon monoxide increases linearity with the average of heat release rate
(180 s). No correlations were found between both mass loss and smoke
development, and the later parameter; contrarily to what that was reported by
other researchers. Reduced number of tests specimens does not allow however
being preemptory in this statement.
• Heat and smoke release properties of epoxy and polyester PM are among usual
values found for other polymeric composites, commonly used in the navy
industry, reinforced with non-combustible materials and containing similar resin
contents.
Although test results revealed that polyester PM is less-prone material than epoxy-based
mortar, fire behavior of both formulations is not satisfactory for some intended uses. In
those cases, in order to observe fire regulations, flame retardant additives will be needed
to enhance fire behavior of these polymer mortar formulations.

VI. FIRE PERFORMANCE OF POLYMER MORTAR FORMULATIONS
VI-30
6.3 Flame Spread Rate.
Reaction to Fire: Classification
6.3.1 General
The classification systems often used to grading building materials according to their
reaction to fire, are based either on radiant panels or in the epirradiator test. Ignitability,
flame spread rate and variation of the thermal balance are the parameters controlled in
these type of tests. Obtained results allow the classification of the materials into classes,
according to their higher or lower contribute to the development of a fire. A material or
product is allowed to be used if it complies, in terms of its classification index, with the
fire safety regulatory requirements, which differ from country to country and from
application to application.
The flame spread contribution constitutes the main criterion of almost all of the fire
reaction classification systems developed in each country, but even so, correlation
between them is hardly assessed. Despite the fact that flame spread over solid surfaces
have been a research topic in combustion and fire science for more than thirty years, the
observed phenomenon often differ from test to test and may not give any consist results
(T'ien 2002).
Recently, in order to remove barriers to trade between the countries of European Union, a
harmonized approach was developed by CEN (European Committee for Standardization)
following a mandate from the European Commission. Today, this has resulted in a new
and uniform classification system of reaction to fire performance of construction
products, the Euroclasses. Unfortunately, when the present study was under development,
national regulations taking into account the new European classification system were still
in the final harmonization, therefore all the experimental work was conducted according
the French normalization.
Fire radiation tests were performed in order to classify reaction to fire performance of
epoxy and polyester PM in study. Additionally, three different formulations of epoxy

VI. FIRE PERFORMANCE OF POLYMER MORTAR FORMULATIONS
VI-31
PMs were developed aiming to improve fire performance of this kind of mortars, which
showed the weakest behavior in the first part of this study. For this purpose, two different
flame retardant systems were added to original formulation. Fire reaction of modified
epoxy PMs was analyzed and compared with correspondent performance of unmodified
formulation.
Finally, an approach was made in order to predict fire reaction classifications of PM
formulations according to the new European system, with basis on obtained results by the
French classification method.
6.3.2 Experimental Program
Flammability properties of PM formulations, in terms of ignitability, flame spread and
growth, were determined by means of the epirradiator test method performed according
the French norm NF P 92-501 (1995). This standard is applied to building products: rigid
materials, whatever their thickness, or flexible materials thicker than 5 mm.
The test method consists to submit the specimens to a constant source of radiant heat in a
controlled chamber, during a certain period of time, in order to promote the ignition of
yielded gases and observing the propagation of the combustion. Ignition times, flame
lengths and total times of combustion are some of the measured parameters.
PM formulations were classified according to their fire reaction in accordance with the
French norm NF P 92-507 (2004). This classification system is based on obtained results
of fire radiation tests performed on the epirradiator apparatus. Measured parameters
during the epirradiator test allow the determination of the classification index, the ‘key
parameter’ to identify the combustibility class to which the specific material belongs.
6.3.2.1 Test specimens
Four specimens of epoxy and polyester PM formulations, with 300 x 400 mm in area and
10 mm in thickness were casted. Above dimensions were in accordance with those
prescribed by the norm. Wood moulds were specially conceived for this purpose, as no
standard steel moulds were available with the required dimensions (see Fig. 6.7 a).

VI. FIRE PERFORMANCE OF POLYMER MORTAR FORMULATIONS
VI-32
Additionally, in order to assess fire behavior improvement, three extra batches of epoxy
based mortar specimens modified with flame retardant additives, were also casted. The
additives were previously added to the epoxy resin system prior to mixture with the sand
aggregates. Two different flame retardancy systems were applied:
• Ammonium Polyphosphate (APP) based FR system (20% in weight of resin
content);
• And Aluminum Trihydroxide (ATH) based FR system (40% and 80% in weight
of resin content).
The APP based flame retardant system, acting as an intumescent process, was further
complemented with pure melamine and pentaerythritol additives. The APP initiates the
intumescent process functioning as an acid source when thermal decomposition starts.
The pentaerythritol acts as a carbon supplier while the melamine works rather as a
blowing agent. Through the exact interaction of these three components, the system leads
to an expansion process in which a large volume high-carbon protective layer is built up
that protects the substrate below from the attack of the heat.
The main mechanism of action of ATH based flame retardant system is based on the
endothermic release of water at higher temperatures. The endothermic decomposition
cools the substrate, reducing the pyrolysis of the polymer, and the release of water dilutes
the amount of fuel, fighting against ignition. Further, together with charring products, the
Al2O3 formed on the surface of the substrate acts as an insulating protective layer. This
kind of flame retardant system, requiring very high loadings for effective levels of fire
retarding, was applied with two different contents.
Characteristics and mechanisms of action of both flame retardant systems were already
described and can be found in the first part of this chapter. Performance-cost ratio and
compatibility with epoxy resins were the main criteria took into account for the selection
of both flame-retardants systems.
All flame retardant modified epoxy PM formulations are described in Table 6.5, and the
main physical/chemical characteristics of each flame retardant compound are presented in
Table 6.6.

VI. FIRE PERFORMANCE OF POLYMER MORTAR FORMULATIONS
VI-33
In order to assess mechanical properties degradation of modified epoxy based mortars,
three prismatic specimens (100x40x40 mm) of each modified formulation were also
casted for posterior flexural strength analysis.
Flexural tests were performed according the customary procedure in compliance with
RILEM PCM-8 standard (1995).
All the specimens, after being submitted to the usual curing treatment, were conditioned
in a climatic chamber at temperature of 23ºC (± 2) and relative humidity of 50% (± 5),
during one week, prior to radiation fire tests.
Fig. 6.7. a) Epoxy PM test specimens for fire radiation tests after casting process; b) Epirradiator test equipment used to perform fire radiation tests.
Table 6.5. Epoxy PM formulations modified with flame retardant systems (mass percentages).
Epoxy PM Ep-APP Ep-ATH1 Ep ATH2
Epoxy Resin (%) 19.23 18.52 17.20 Foundry Sand (%) 76.92 74.07 69.00 FR System (%) 3.85 7.41 13.80
FR Compounds APP (60%)
Melamine (20%)
Pentaerythritol (20%)
ATH (100%) ATH (100%)
a) b)

VI. FIRE PERFORMANCE OF POLYMER MORTAR FORMULATIONS
VI-34
Table 6.6. Physical and chemical characteristics of flame retardant compounds.
FR Compounds Molecular Formula
Bulk density (g/cm3)
d50a)
(µm) ATH (Hymod SB336CM) Al2 O3 1.36 15.7 APP: Crystal phase II (Budenheim FR CROS484) [NH4 PO3] n 0.60 18.0 Melamine: 2,4,6-Triamino-1,3,5-Triazine (Merk) C3 H6 N6 1.57 - Pentaerythrytol (FenChem) C5 H12 O4 0.80 <10.0
a) d50- Average particle size.
6.3.2.2 Epirradiator test method: Test procedure and equipment
i) Test equipment
The epirradiator test equipment, shown in Figs. 6.7 b) and 6.8, includes:
• A test chamber, commonly known as epirradiator, provided with a chimney for
smoke evacuation and an extractor fan;
• A specimen frame holder, provided with a steel grate, placed at a 45º angle above
to the horizontal and at a distance of 250 mm of the bottom of the test chamber;
• A radiation heating source of 500 W with a radiant surface of 100 mm diameter,
placed parallel to the frame holder at 30 mm of its upper surface;
• Two gas burners: one in the lower part and the other in the upper. The burners
must be movable and able to be controlled from the outside;
• A measuring device to control the difference of the temperature between
incoming and outgoing gases (for calibration).
Prior to testing, test chamber must be previously calibrated and thermally balanced.
ii) Test procedure
The tests in the epirradiator apparatus were performed according to the following steps.
After calibration procedure and checking of thermal balance of test chamber, each test
specimen, which weight was previously recorded, was placed in the frame holder and the
chronometer was then turned on. Chamber door was closed, in less than 10 seconds, and
it remained locked until the end of the test (20 minutes later).
Next, both inferior and superior inflammation devices (gas burners) were placed, as fast
as possible, in position against lower and upper surfaces of the specimen.

VI. FIRE PERFORMANCE OF POLYMER MORTAR FORMULATIONS
VI-35
Fig. 6.8. Schematic view of epirradiator apparatus showing its main components.
As soon as an effective inflammation occurred in the material surface, correspondent
inflammation device was removed and ignition time was recorded. Inflammation was
considered effective if it remained for periods of at least 5 seconds.
Throughout the test, the length of flames in each surface was measured (by means of the
reference points existing in the frame holder), and periodically recorded at each 30
seconds. Complementary phenomena, such as fusion or drops falling from the specimen
(flaming or not) or, eventually, strong release of smoke and soot particles, were also
Chimney
Specimen
Dimmensions: mm
Burner
Regulation device
Regulationdevice
Burner
Flames
Flames
Concrete coating
Support of frame holder
RadiationHeating source
5 termocouples
5 termocouples
Air inlet
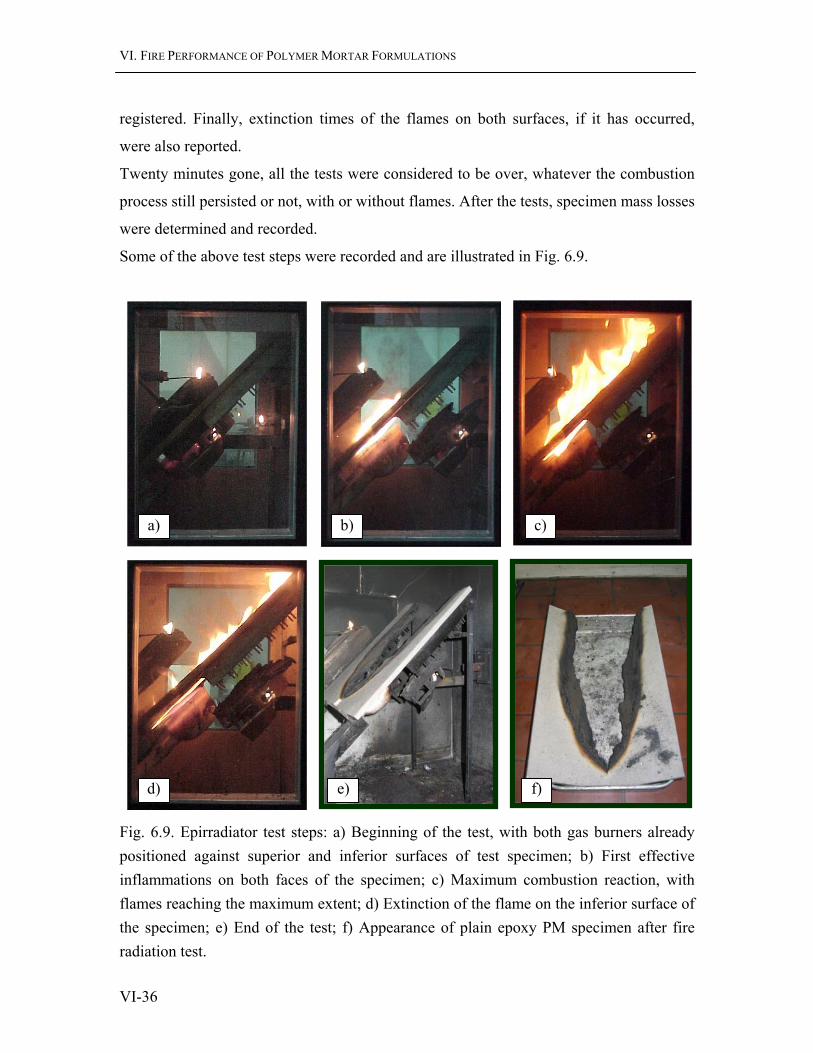
VI. FIRE PERFORMANCE OF POLYMER MORTAR FORMULATIONS
VI-36
registered. Finally, extinction times of the flames on both surfaces, if it has occurred,
were also reported.
Twenty minutes gone, all the tests were considered to be over, whatever the combustion
process still persisted or not, with or without flames. After the tests, specimen mass losses
were determined and recorded.
Some of the above test steps were recorded and are illustrated in Fig. 6.9.
Fig. 6.9. Epirradiator test steps: a) Beginning of the test, with both gas burners already positioned against superior and inferior surfaces of test specimen; b) First effective inflammations on both faces of the specimen; c) Maximum combustion reaction, with flames reaching the maximum extent; d) Extinction of the flame on the inferior surface of the specimen; e) End of the test; f) Appearance of plain epoxy PM specimen after fire radiation test.
a) b) c)
d) e) f)

VI. FIRE PERFORMANCE OF POLYMER MORTAR FORMULATIONS
VI-37
6.3.2.3 Reaction to fire classification
The classification of PM formulations into one of the categories M0 to M4 was
determined based on epirradiator test results, according to the French norm NF P 92-507
(2004).
The classification criteria are based on the following indexes collected and/or determined
during the fire radiation tests: ti, td1, td2, e1, e2, Σ h and ∆ T:
• ti – Time, in seconds (ti1 for the lower surface of the specimen and ti2 for the
upper surface), between the placement of test specimen in the frame holder and
the first effective inflammation (sustained flame for periods of at least 5 seconds);
• td – Delay in seconds, until the flames exceed the upper edge of radiant surface,
for the lower surface of the specimen (td1), or the equivalent reference point
‘zero’, for the upper surface of the specimen (td2);
• e – Extinction time of the flames (e1 for the lower surface of the specimen and e2
for the upper surface), or the time in seconds until the flames no more exceed the
above reference points, whatever occurs first;
• Σ h – Sum, in centimeters, of maximum lengths of the flames on both surfaces
exceeding the reference points, measured at each 30 seconds;
• ∆ T – Entire period of time, in seconds, during which the effective combustion
occurs. This parameter is calculated as follows:
o If effective inflammation occurs only on one of the surfaces:
∆ T = e 1 - td 1 or ∆ T = e 2 - td 2 (6.1)
o If effective inflammation occurs on both surfaces without interruption:
∆ T = e – td (6.2)
with e = maximum (e1, e2) and td = minimum (td1, td2).
o If there are several periods of effective combustion, on both surfaces, with
intercalated interruptions:
∆ T = Σ (e 1 - td 1) + Σ (e 2 - td 2) (6.3)
Note: simultaneous inflammation on both surfaces is computed only once.

VI. FIRE PERFORMANCE OF POLYMER MORTAR FORMULATIONS
VI-38
With basis on the above parameters, the index classification ‘q’ is calculated according to
the following formula:
100 hq = ti T
∑∆
(6.4)
with ti = minimum (ti 1, ti 2).
Material classification is dictated by the average of ‘q’ index determined for all test
specimens. In the particular cases of test materials that do not present any inflammation,
or if the flames do not exceed the superior edge of radiant surface, it is considered that
index classification is null.
The material classification according to ‘q’ index value is schematized in Table 6.7, for
rigid materials, whatever their thickness, or flexible materials thicker than 5 mm. The
significance of each class, in terms of combustibility, as well as some representative
examples of building materials belonging to those classes are presented in Table 6.8.
Table 6.7. Summary of classification of building materials according to their reaction to fire (rigid materials or flexible materials thicken than 5 mm).
Classification criteria Flame spread rate Heat of combustion
q Index Class < 2 mm/s > 2 mm/s < 2.5 MJ/kg > 2.5 MJ/kg 0 M0 - - M0 M1 < 2.5 M1 - - - - < 15 M2 - - - - < 50 M3 - - - - ≥ 50 M4 M4 NC* - -
* Not classifiable.
Table 6.8. Combustibility of building materials according to fire reaction classification.
Class Combustibility General Examples
M0 Not combustible Glass; iron; steel; stone; cement concrete and mortars. M1 Combustible, not flammable Painted paper; phenolic resins M2 Moderately flammable Plastic coatings; rigid PVC. M3 Medially flammable Non-resinous wood (thick >14mm); Resinous wood
and plywood (thick >18mm). M4 Highly flammable Non-resinous wood (thick ≤14mm); Resinous wood
and plywood (thick ≤18mm).

VI. FIRE PERFORMANCE OF POLYMER MORTAR FORMULATIONS
VI-39
6.3.3 Experimental Results
6.3.3.1 Radiation fire test results
Parameters measured during epirradiator tests, for all test specimens, and correspondent
index classification are presented in Tables 6.9 to 6.11. With the exception of epoxy PM
specimens modified with ATH (80% of resin content), td1 and td2 parameters were
always equal, respectively, to ti1 and ti2. For this reason, the former parameters are not
presented for the other formulations.
Table 6.12 presents the final fire reaction classification obtained for each PM
formulation, plain epoxy and polyester PM, and flame retardant modified epoxy PMs.
Specific phenomena that occurred during the burning process of some particular test
specimens are also illustrated in Figs. 6.10 and 6.11.
Table 6.9. Epirradiator test results and classification index of plain polyester and epoxy PM formulations.
Polyester PM Specimen A Specimen B Specimen C Specimen D
∆ m (%) 37.0 35.3 39.8 35.4 ti 1 (s) 187 184 193 211 e 1 (s) 1200 1200 1200 1200 ti 2 (s) 323 374 333 407 e 2 (s) 1200 1200 1200 1200 Σ h (cm) 2116 1893 2029 1739 ∆ T (s) 1013 1016 1007 989 q (cm.s-3/2) 35.55 32.28 33.13 26.21
Epoxy PM Specimen A Specimen B Specimen C Specimen D
∆ m (%) 34.6 34.8 33.6 31.4 ti 1 (s) 147 158 165 160 e 1 (s) 936 1176 1200 1200 ti 2 (s) 251 278 322 333 e 2 (s) 1006 1150 1171 1200 Σ h (cm) 1580 1945 1924 1802 ∆ T (s) 859 1018 1035 1040 q (cm.s-3/2) 36.67 38.58 36.24 34.92

VI. FIRE PERFORMANCE OF POLYMER MORTAR FORMULATIONS
VI-40
Table 6.10. Epirradiator test results and classification index of epoxy PM formulation modified with APP flame retardant system (20% in weight of resin content).
Epoxy/APP PM Specimen A Specimen B Specimen C Specimen D
∆ m (%) ti 1 (s) 184 170 199 207 e 1 (s) 1123 1123 1200 1200 ti 2 (s) 301 393 560 585 e 2 (s) 1118 1143 1200 1200 Σ h (cm) 1252 1387 1522 1399 ∆ T (s) 939 973 1001 993 q (cm.s-3/2) 22.20 26.16 24.17 21.45
Table 6.11. Epirradiator test results and classification index of epoxy PM formulation modified with ATH flame retardant systems: ATH-I and ATH-II (40% and 80%, respectively, in weight of resin content).
Epoxy/ATH-I PM Specimen A Specimen B Specimen C Specimen D
∆ m (%) 5.3 4.8 7.5 5.5 ti 1 (s) 179 / 198 / 217 261 176 160 e 1 (s) 188 / 209 / 1001 1200 1200 973 ti 2 (s) 287 365 276 283 e 2 (s) 991 1200 1200 971 Σ h (cm) 1248 1524 1761 1351 ∆ T (s) 804 939 1024 813 q (cm.s-3/2) 24.59 19.06 31.27 29.61
Epoxy/ATH-II PM Specimen A Specimen B Specimen C Specimen D
∆ m (%) 2.1 2.3 2.5 2.3 ti 1 (s) 166 162 196 164 td 1 210 210 229 164 e 1 (s) 925 1037 1200 889 ti 2 (s) 271 326 328 260 td 2 271 326 328 260 e 2 (s) 787 928 1200 954 Σ h (cm) 464 521 985 840 ∆ T (s) 715 827 971 790 q (cm.s-3/2) 10.45 11.18 16.13 18.22

VI. FIRE PERFORMANCE OF POLYMER MORTAR FORMULATIONS
VI-41
Table 6.12. Fire reaction classification of all PM formulations in study.
PM formulations Classification Index* Class Combustibility
Polyester PM 31.8 M3 Medially flammable Epoxy PM 36.6 M3 Medially flammable Epoxy/APP PM 23.5 (-36%) M3 Medially flammable Epoxy/ATH-I PM 26.1 (-29%) M3 Medially flammable Epoxy/ATH-II PM 14.0 (-62%) M2 Moderatly flammable
* Average of four specimens.
Fig. 6.10. Intumescent process occurring during fire radiation tests of epoxy PM specimens modified with APP flame retardant system.

VI. FIRE PERFORMANCE OF POLYMER MORTAR FORMULATIONS
VI-42
Fig. 6.11. Final appearance of PM specimens after fire radiation tests: a) Epoxy PM specimen: b) Polyester PM specimen; c) APP modified epoxy PM specimen; and d) ATH-II modified epoxy PM specimen, where is visible a white vitreous layer caused by FR system.
A very large quantity of black smoke was produced during all the tests, but no burning
droplets were observed. The occurrence of burning droplets would require, additionally,
the performance of other kind of fire test, the ‘dripping test’, regulated by French norm
NF P 92-505 (1995).
6.3.3.2 Flexural test results
Results of flexural tests performed on epoxy PM specimens, in terms of maximum load
and flexural strength average values, are presented in Table 6.13.
a) b)
c)
d)

VI. FIRE PERFORMANCE OF POLYMER MORTAR FORMULATIONS
VI-43
In order to assess the influence of flame retardant additives on stiffness material, load-
deflection curves are also plotted in Fig. 6.12.
Table 6.13. Flexural test results (average values) of all epoxy PM specimens (modified and not modified with flame retardant additives).
Epoxy PM formulations Max. Load [kN]
Max. Deflection [mm]
Flex. Strength / St. Deviat. [MPa]
Epoxy PM 17.54 0.83 41.11 / 0.41 Epoxy/APP PM 17.63 0.81 41.33 / 0.71 Epoxy/ATH-I PM 17.47 0.78 40.95 / 3.96 Epoxy/ATH-II PM 15.04 0.67 35.26 / 3.44
Fig. 6.12. Load-deflection curves obtained from flexural tests performed on plain epoxy PM specimens and epoxy PM specimens modified with flame retardant systems: APP, ATH-I and ATH-II.
Epoxy / ATH-II PM
0
4
8
12
16
20
0 0.2 0.4 0.6 0.8 1
Deflection (mm)
Epoxy / ATH-I PM
0
4
8
12
16
20
0 0.2 0.4 0.6 0.8 1Deflection (mm)
Flex
ural
Loa
d (K
N)
Plain Epoxy PM
0
4
8
12
16
20
0 0.2 0.4 0.6 0.8 1Deflection (mm)
Flex
ural
Loa
d (k
N)
Epoxy / APP PM
0
4
8
12
16
20
0 0.2 0.4 0.6 0.8 1
Deflection (mm)
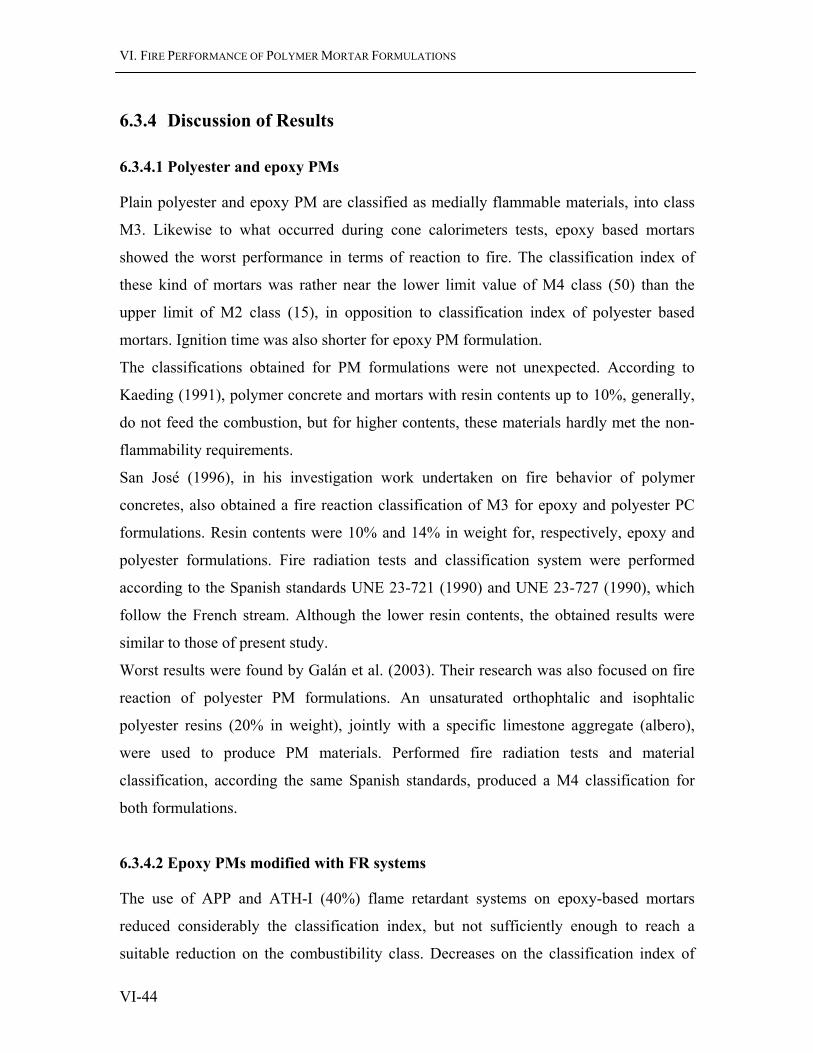
VI. FIRE PERFORMANCE OF POLYMER MORTAR FORMULATIONS
VI-44
6.3.4 Discussion of Results
6.3.4.1 Polyester and epoxy PMs
Plain polyester and epoxy PM are classified as medially flammable materials, into class
M3. Likewise to what occurred during cone calorimeters tests, epoxy based mortars
showed the worst performance in terms of reaction to fire. The classification index of
these kind of mortars was rather near the lower limit value of M4 class (50) than the
upper limit of M2 class (15), in opposition to classification index of polyester based
mortars. Ignition time was also shorter for epoxy PM formulation.
The classifications obtained for PM formulations were not unexpected. According to
Kaeding (1991), polymer concrete and mortars with resin contents up to 10%, generally,
do not feed the combustion, but for higher contents, these materials hardly met the non-
flammability requirements.
San José (1996), in his investigation work undertaken on fire behavior of polymer
concretes, also obtained a fire reaction classification of M3 for epoxy and polyester PC
formulations. Resin contents were 10% and 14% in weight for, respectively, epoxy and
polyester formulations. Fire radiation tests and classification system were performed
according to the Spanish standards UNE 23-721 (1990) and UNE 23-727 (1990), which
follow the French stream. Although the lower resin contents, the obtained results were
similar to those of present study.
Worst results were found by Galán et al. (2003). Their research was also focused on fire
reaction of polyester PM formulations. An unsaturated orthophtalic and isophtalic
polyester resins (20% in weight), jointly with a specific limestone aggregate (albero),
were used to produce PM materials. Performed fire radiation tests and material
classification, according the same Spanish standards, produced a M4 classification for
both formulations.
6.3.4.2 Epoxy PMs modified with FR systems
The use of APP and ATH-I (40%) flame retardant systems on epoxy-based mortars
reduced considerably the classification index, but not sufficiently enough to reach a
suitable reduction on the combustibility class. Decreases on the classification index of

VI. FIRE PERFORMANCE OF POLYMER MORTAR FORMULATIONS
VI-45
36% and 29% were achieved, respectively with the APP and ATH-I flame retardant
additives, but even so, the M3 classes were maintained.
However, these flame retardant systems, with the applied contents, were effective in
enhancing material fire behavior without significant losses on flexural mechanical
properties. Flexural strength and stiffness of epoxy formulations were not affected by the
modifications introduced by these flame retardant additives.
APP-based flame retardant system was more efficient in fire retardancy than ATH
compound, especially taking into account the content levels applied of each additive
system. Even so, intumescent flame retardant system did not work out as well as it was
expected. The inclusion of chlorinated paraffin compound in the APP flame retardant
system could be an efficient solution to improve retardancy capacity of intumescent
process. The main drawback of this flame retardant system is associated to its cost, which
is substantially higher than ATH compound (approximately four times higher).
The use of ATH flame retardant system, with a higher content (80% in weight of resin
content), was effective in reducing the material combustibility class. However, the larger
amount of this filler additive also led to a slight decrease on flexural strength of the final
product. Classification index dropped 62%, which allowed classifying the material within
M2 class, as a hardly flammable material. Flexural stiffness was not significantly
affected, (it was actually slightly enhanced, as shown in Fig. 6.13), but a decrease of 14%
on maximum load bearing capacity occurred.
Flame retardant additives are expected to be effective in improving fire performance
without excessive loss of other important performance characteristics. The main question
consists in defining what is acceptable in terms of properties’ loss. San José (1996), in his
investigation work on fire behavior improvement of PC modified with ATH flame
retardant systems, established as a mark, neither increase the final cost of the product nor
deteriorate its mechanical properties, both on more than 10%. As well as the present
research, that goal was not achieved for the formulations in study.
Both ATH modified epoxy PM formulations show a large scatter of results, either in
terms of flexural tests or in terms of fire radiation tests. Standard deviations of 3.96 and
5.50 for ATH-I formulation, and standard deviations of 3.44 and 3.80 for ATH-II
formulation, were found, respectively, for the average values of flexural strength and

VI. FIRE PERFORMANCE OF POLYMER MORTAR FORMULATIONS
VI-46
classification index. Data scattering was probably due to an insufficient mixture of ATH
filler with the resin matrix, which resulted on a non-homogenized mortar material.
The mixture procedure must be improved in order to minimize this feature. Automatic
mixing technique instead of manual process could be an efficient solution for this issue.
A last remark must be done concerning mass losses during fire radiation tests. For all
ATH modified epoxy PM specimens, mass variation was very low, especially for those
containing the higher content of ATH additive. Mass losses were in fact lower than the
correspondent organic matrix contents, which allowed sand aggregates to remain
conglomerated in an whole piece (average mass variations of 5.8 % and 2.3 % were
found, respectively, for ATH-I and ATH-II formulations). On the other hand, large mass
losses occurred for the other formulations. However, these amounts are not meaningful
and do not correspond to the effective mass loss of the specimens due to burning process.
Large quantities of broken pieces of the specimens stayed behind in the test chamber, as
shown in Fig. 6.9 e), and they were not computed for the final weight.
Nonetheless, the low mass losses suffered by ATH modified PM specimens were
effective, as test specimens remained intact at the end of the tests, and constitute another
feature that reinforce even more the suitability of this kind of flame retardant system for
polymer mortars and concretes.
6.3.4.3 Restrictions to end-use
According to the present national regulations of fire safety in housing buildings, RSCIEH
(D.L.64/90 1990), allowed applications of construction materials classified into M3 and
M2 combustibility classes, are restricted to the following areas discriminated in Table
6.14.
According to the present regulation, epoxy and polyester PM formulations without any
flame retardant additives, cannot be applied for cladding (or surface coating) of walls and
ceilings in common areas of multifamily buildings, such as corridors, staircases, lifts or
areas included in fire evacuation paths. But in the same regulation, no restrictions are
given neither for cladding materials in other interior areas of the building, nor for linear
elements such as corner brackets, joint caps, strips, banisters, or skirting boards.

VI. FIRE PERFORMANCE OF POLYMER MORTAR FORMULATIONS
VI-47
If it is intended to use these materials in the mentioned restricted areas, or in even more
demanding places (e.g. hospitals, hotels, schools, public buildings, etc) the constraints are
very clear. But for the rest, PM formulations in analysis can be applied without
modifications, as there are not higher requirements for coating and finishing materials.
The most popular building applications of polymer mortars and concretes, such as wall
panels, floor tiles, window-sills, ornamental and architectural shapes, etc., may consider
the use of present formulations.
Table 6.14. Summary of regulatory requirements for materials used on constructive elements of housing buildings.
Application Class Article
One-family buildings: - Cladding / coating of exterior walls; - Window frames; - Roof coverings; - Interior staircases (if provided of inferior coating of class M1); - Roof linings
M3 M3 M3 M3 M2
Part II 16.1 16.1 17.1 18.2 17.3
Multifamily buildings with less than 28 m height: - Cladding / coating of exterior walls (if building height ≤ 9 m); - Cladding / coating of exterior walls (if building height > 9 m); - Window frames; - Roof coverings (if not accessible); - Floor coatings of CHC1 - Ceiling and wall coatings of CHC1; - Floor coating of interior staircases.
M3 M2 M3 M3 M3 M2 M2
Part III 37.1 37.1 37.2 38.1 30.5.b) 30.5.b) 32.7 a)
Multifamily buildings with more than 28 m height: - Window frames; - Floor coatings of CHC1; - Floor coating of interior staircases; - Floor coating of fire-resistive chambers;
M2 M2 M2 M2
Part IV 67.2 58.5 b) 60.7 a) 56.3 e)
1 Common areas with horizontal circulation (halls, corridors..)
Taking into account the new classification system, the Euroclasses, new versions of
RSCIEH and related regulations are foreseen. Nevertheless, it is expected that no deep
modifications will be made on their basic structures. The present fire reaction classes will
be replaced by the Euroclasses, and for the conversion trial, the characteristics of each
material class in terms of flame spread contribution will be preponderant.

VI. FIRE PERFORMANCE OF POLYMER MORTAR FORMULATIONS
VI-48
At this moment, only an approach can be done regarding the expected Euroclassifications
of PM formulations in study. According to the conversion approach presented in Table
6.2, only based on fire contribution of each class, M2 and M3 classes will correspond,
respectively, to C and D Euroclasses. However, other features such as intensity of smoke
and occurrence of burning droplets are also parameters that will affect the classification
into the Euro-subclasses. Regarding this subject, another attempt was made in order to
arrive at a comparison between the French classification and the Euroclasses, including
the subclasses (Collignon 2004). This approach is presented at Table 6.15.
Table 6.15. Comparison table between the French and the European classifications (Collignon 2004).
A1 A2 A2 B C D D E F s1 s1 / s2 / s3 s1 / s2 / s3 s1 / s2 / s3 Europe
d0 d0 / d1 d0 / d1 d0 d2 France M0 M0 M1 M2 M3 M4 NB* M4
* NB- No burning droplets.
According to this last approach, and taking into account to what that was observed during
the epirradiator tests, a classification of D-s3;d0 is expected for epoxy and polyester PM
formulations, (e.g. materials medially combustibles, with significant smoke emission, but
without burning particles or droplets). Likewise, a C-s3;d0 classification is expected for
epoxy PM formulation modified with ATH flame retardant system (with 80% in weight
of resin content).
6.3.5 Conclusions
Fire reaction classification is the single common index used by the different fire safety
regulatory systems to ascertain the possible applications of building materials. Within this
scope, in the present work, fire radiations tests were conducted in order to determine
flame spread rate of epoxy and polyester PM formulations, and accordingly, their
reaction-to-fire classifications and allowable applications. Three additional epoxy based
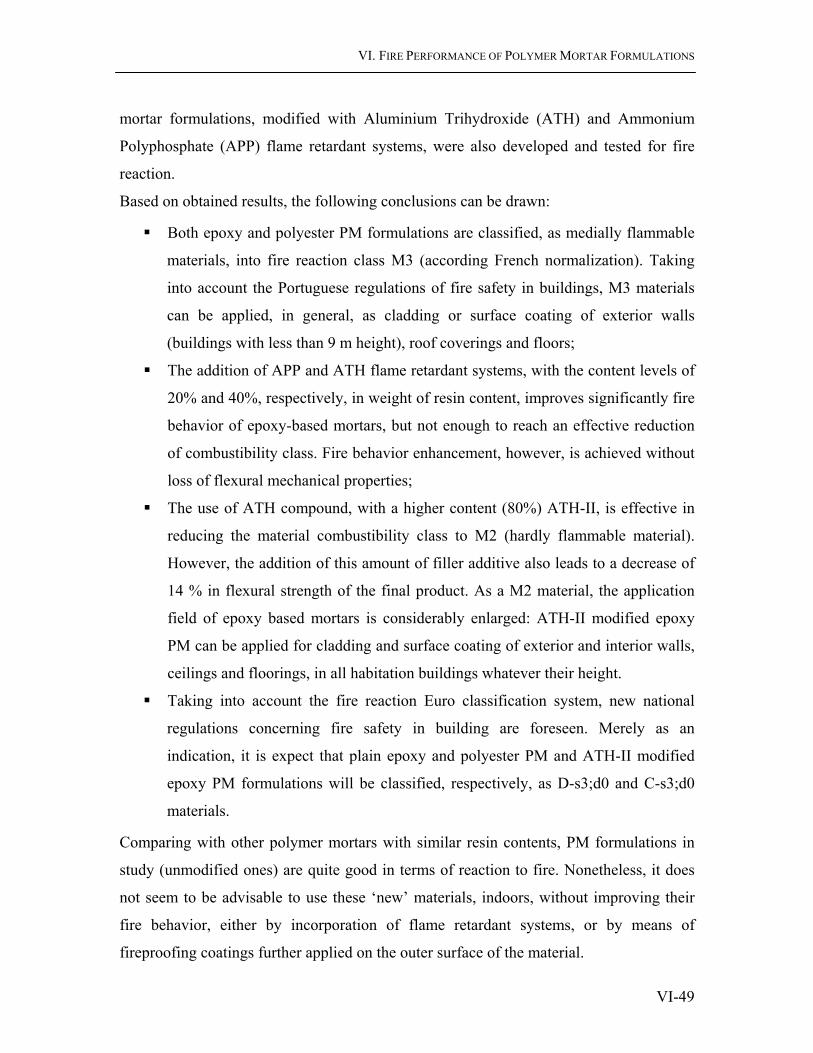
VI. FIRE PERFORMANCE OF POLYMER MORTAR FORMULATIONS
VI-49
mortar formulations, modified with Aluminium Trihydroxide (ATH) and Ammonium
Polyphosphate (APP) flame retardant systems, were also developed and tested for fire
reaction.
Based on obtained results, the following conclusions can be drawn:
Both epoxy and polyester PM formulations are classified, as medially flammable
materials, into fire reaction class M3 (according French normalization). Taking
into account the Portuguese regulations of fire safety in buildings, M3 materials
can be applied, in general, as cladding or surface coating of exterior walls
(buildings with less than 9 m height), roof coverings and floors;
The addition of APP and ATH flame retardant systems, with the content levels of
20% and 40%, respectively, in weight of resin content, improves significantly fire
behavior of epoxy-based mortars, but not enough to reach an effective reduction
of combustibility class. Fire behavior enhancement, however, is achieved without
loss of flexural mechanical properties;
The use of ATH compound, with a higher content (80%) ATH-II, is effective in
reducing the material combustibility class to M2 (hardly flammable material).
However, the addition of this amount of filler additive also leads to a decrease of
14 % in flexural strength of the final product. As a M2 material, the application
field of epoxy based mortars is considerably enlarged: ATH-II modified epoxy
PM can be applied for cladding and surface coating of exterior and interior walls,
ceilings and floorings, in all habitation buildings whatever their height.
Taking into account the fire reaction Euro classification system, new national
regulations concerning fire safety in building are foreseen. Merely as an
indication, it is expect that plain epoxy and polyester PM and ATH-II modified
epoxy PM formulations will be classified, respectively, as D-s3;d0 and C-s3;d0
materials.
Comparing with other polymer mortars with similar resin contents, PM formulations in
study (unmodified ones) are quite good in terms of reaction to fire. Nonetheless, it does
not seem to be advisable to use these ‘new’ materials, indoors, without improving their
fire behavior, either by incorporation of flame retardant systems, or by means of
fireproofing coatings further applied on the outer surface of the material.

VI. FIRE PERFORMANCE OF POLYMER MORTAR FORMULATIONS
VI-50
Bibliography
ASTM. (1988). Fire Test Standards, American Society for Testing and Materials, Philadelphia.
ASTM:E662-03e1. (2003). "Standard Test Method for Specific Optical Density of Smoke Generated by Solid Materials." Annual Book of ASTM Standards, 04(07).
ASTM:E1354-04a. (2004). "Standard Test Method for Heat and Visible Smoke Release Rates for Materials and Products Ussing an Axigen Consumption Calorimeter." Annual Book of ASTM Standards, 04(07).
Babrauskas, V., and Peacock, R. D. (1992). "Heat Release Rate: The single most important variable in fire hazard." Fire Safety Journal, 18(1992), 255-272.
Beyer, G. (2002). "Nanocomposites: a new classe of flame retardants for polymers." www.specialchem4polymers.com.
Bourbigot, S., Le Bras, M., Bugajny, M., and Dabrowski, F. "Intumescence and polymer blending: An approach for fire retardancy?" NIST- Annual Conference on Fire Research, 2-5 November 1998, Gaithersburg, 43-44.
Browne, R. D., Adams, M., and Frech, E. L. "Experience in the use of polymer concrete in the building and construction industry." 1st International congress on Polymers in Concrete - ICPIC, 1975, Lancaster, UK, 433-447.
BS:476-4. (1970). "Fire tests of building materials and structures. Non combustibility test for materials." British Standard Institution.
BS:476-7. (1997). "Fire tests on building materials and structures. Method of test to determine the classification of the surface spread of flame products." British Standard Institution.
Collignon, A. (2004). "Fire! - Reaction?" EuroASTRONews, 10, 7-8, ASTRON BUILDINGS S.A Publisher.
D.L.64/90. (1990). "RSCIEH - Regulamento de Segurança contra Incêndio em Edifícios de Habitação." Diário da República.
VI. FIRE PERFORMANCE OF POLYMER MORTAR FORMULATIONS
VI-51
DIN:4102-1. (1998). "Fire Behaviour of Building Materials. Part 1: Building naterials, concepts, requirements and tests." Deutsches Institut fur Normung.
EN-ISO:1182. (2002). "Reaction to fire tests for building products. Non-combustibility test." European Norm, TC-127, European Committee for Standardization.
EN-ISO:1716. (2002). "Reaction to fire tests for building products. Determination of the heat of combustion." European Norm, TC -127, European Committee for Standardization.
EN-ISO:11925-2. (2002). "Reaction to fire tests. Ignitability of buiding products subjected to direct impingement of flame. Part 2- Single-flame source test." European Norm, TC -127, European Committee for Standardization.
EN:13501-1. (2002). "Fire classification of construction products and building elements. Part 1: Classification using test data from reaction to fire tests." European Norm, TC -127, European Committee for Standardization.
EN:13823. (2002). "Reaction to fire tests for building products. Building products excluding floorings exposed to the thermal attack by a single burning item." European Norm, TC -127, European Committee for Standardization.
Galán, C. M., Santiago, M. O., Fernández, J. R., and Garcia, R. R. (2003). "Fire tests on polyester polymer mortars." Journal of Polymer Engineering, 23(5), 353-368.
Giannelis, E. P. (1996). "Polymer layered silicate nanocomposites." Advanced Materials, 8(1), 29-35.
Gilman, J. W., Kashiwagi, T., Brown, J. E. T., Jackson, C. L., Lomakin, S., Giannelis, E. P., and Manias, E. (1999). "Flammability studies of polymer layered silicate nanocomposites: polyolefin, epoxy, and vynil ester resins." Chesmistry and Tecnhology of Polymer Additives, C. A. Wilkie, ed., Blackwell Science Inc., 249-265.
Gilman, J. W., Kashiwagi, T., and Lichtenhan, J. D. (1997). "Nanocomposites: A revolutionary new flame retardant approach." SAMPE Journal, 33(4), 40-46.
Hasegawa, N., Okamoto, H., and Usuki, A. (2005). "Silicate layer dispersion in copolymer/clay nanocomposites." Journal of Applied Polymer Science, 98(4), 1554-1557.
Hernangil, A., Ballestero, J., Rodriguez, M., Alonso, J. R., and León, L. M. (2000). "Experimental design of halogenated polyester resins. Zinc compounds as fire
VI. FIRE PERFORMANCE OF POLYMER MORTAR FORMULATIONS
VI-52
retardants and as fume and smoke suppressants." Plastics, Rubbers and Composites, 29(5), 216-223.
Hillado, C. J. (1998). Flammability Handbook for Plastics, TECHNOMIC Publication.
Horold, S. (1999). "Phosphorous flame retardants in thermoset resins." Polymer Degradation and Stability, 64(1999), 427-431.
Huggett, C. (1980). "Estimation of rate of heat release by means of oxygen consumption measurements." Fire and Materials, 4(1980), 61-65.
Kaeding, A. O. "Design criteria for precast polymer concrete." ICPIC North American Workshop, San Francisco, USA, 24-27 Setember, 1991.
Kashiwagi, T., and Gilman, J. W. (2000). "Silicon-based flame retardants." Fire Retardancy of Polymeric Materials, C. A. Wilkie, ed., Marcel Dekker, Inc., New York, 353-389.
Kashiwagi, T., Gilman, J. W., and Nyden, M. R. "New flame retardant additives." 6th European Meeting on Fire Retardancy of Polymeric Materials, Lille, France, September 24-26, 1997, 4-8.
Kojima, Y., Usuki, A., Kawasumi, M., Okada, A., Fukushima, Y., Kurauchi, T., and Kamigaito, O. (1993). "Mechanical properties of nylon-6 clay hybrid." Journal of Materials Research, 8(5), 1185-1189.
Levchik, G. F., Selevich, A. F., Levchik, S. V., and Lesnikovich, A. I. (1994). "Thermal behavior of Ammonium polyphosphate inorganic compound mixtures. Part I: Talc." Termochemica acta(239), 41-49.
Lichtenhan, J. D., and Gilman, J. W. (1997). "Preceramic additives as fire retardants for plastics." NIST-National Institute of Standards and Technology, Patent Application, USA.
Mouritz, A. P., Mathys, Z., and Gibson, A. G. (2005). "Heat release of polymer composites in fire." Composites: Part A, (in press).
Nelson, G. L. "Recycling of plastics: A new flame retardant challenge." FRCA Fall 1994 Conference - The Future of Fire Retarded Materials: Applications & Regulations, Williamsburg, USA, October 9-12, 1994, 135.
NF:F92-505. (1995). "Safety against fire Building Materials -Reaction to fire tests - Test used for thermalmelting materials: Drippling test." AFNOR- Association Française de Normalisation.
VI. FIRE PERFORMANCE OF POLYMER MORTAR FORMULATIONS
VI-53
NF:F:16-101. (1988). "Rolling stock - Fire behaviour - Materials choosing." French Norm, AFNOR- Association Française de Normalisation.
NF:P:92-501. (1995). "Safety against fire - Building Materials - Reaction to fire tests - Radiation test used for rigid materials, or for materials on rigid substractes (flooring and finishes) of all thicknesses, and for materials thicker than 5 mm." AFNOR- Association Française de Normalisation.
NF:P:92-507. (2004). "Fire Safety - Building:Interior fitting materials - Classification according to their reaction to fire." French Norm, AFNOR- Association Française de Normalisation.
NF:X10-702. (1994). "Fire test methods - Determination of the opacity of the fumes in an atmospher without air renewal." French Norm, AFNOR- Association Française de Normalisation.
NF:X:70-100-1. (2001). "Fire tests - Analysis of gaseous effluents. Part 1: Methods for analysing gases stemming from thermal degradation." French Norm, AFNOR- Association Française de Normalisation.
NF:X:70-100-2. (2001). "Fire tests - Analysis of gaseous effluents. Part 2: Tubular furnace thermal degradation method." French Norm, AFNOR- Association Française de Normalisation.
RILEM. (1995). "PCM-8: Method of test for flexural strength and deflection of polymer-modified mortar." Technical Committee TC-113 'Test Methods for Concrete-Polymer Composites' (CPT), International Union of Testing and Research Laboratories for Materials and Structures.
San José, J. T. (1996). "Hormigon polimero estructural y decorativo. Aplicacion a composites para la construccion," Ph. D., Universidad del Pais Vasco, Bilbao.
Sorathia, U., Ness, J., and Blum, M. (1999). "Fire safety of composites in th US Navy." Composites: Part A, 30, 707-713.
Sorathia, U., and Ohlemiller, T. (1997). "A Review of Fire Test Methods and Criteria for Composites." SAMPE Journal, 33(4), 23-31.
SpecialChem. (2000). "Burning issues: Choosing the right flame retardant." December 2000, www.specialchem4polymers.com.
SpecialChem. (2002). "Nanocomposites: A new class of flame retardants for polymers." www.specialchem4polymers.com.

VI. FIRE PERFORMANCE OF POLYMER MORTAR FORMULATIONS
VI-54
SpecialChem. (2003). "New developments of intumescent phosphorous based flame retardants." September 2003, www.specialchem4polymers.com.
SpecialChem, S. A. (2005). "Flame retardants regulation. Building&Construction." SpecialChem - Polymers Additives&Colors. www.specialchem4polymers.com.
T'ien, J. S. "Detailed modeling of flame spread processes over solid: Progress and prospect." Fire Spread and Growth on Objects Workshop.
Troitzsch, J. (1990). International Plastics Flammability Handbook - Principles, Regulations, Testing and Approval, Hanser Publisher, Munich, Germany.
UNE:23-721. (1990). "Fire reaction tests for rigid or similar materials (coating materials), of any thickness and flexible materials over 5 mm thick." AENOR Associación Española de Normalización y Certificación.
UNE:23-727. (1990). "Fire reaction tests for construction materials. Classification of materials used in building construction." AENOR Associación Española de Normalización y Certificación.
Usuki, A., Kato, M., Okada, A., and Kurauchi, T. (1997). "Synthesis of polypropylene oligomer-clay intercalation compounds." Journal of Applied Polymer Science, 66(9), 1781-1785.
Wittbecker, F. W. (2004). "Methodology of Fire Testing." Plastics Flammability Handbook: Principles, Regulations, Testing and Approval, J. Troitzsch, ed., Hanser Gardner, Munich, 748.

VII-1
VII. CONCLUSIONS AND
RECOMMENDATIONS 7.1 Synopsis
In this thesis work two PM formulations were developed and optimized regarding
flexural strength property. For that purpose, Taguchi method and the analysis of variance
were applied, respectively, for the planning of the experiments and for the analysis of the
results.
Obtained optimized formulations were thoroughly characterized in terms of physical and
static mechanical properties. Fresh state properties, setting shrinkage, specific gravity, air
content, coefficient of thermal expansion, mechanical strength in compression, bending
and tension, deformability properties and stress-strain relationships were determined and
compared with the general properties of conventional concrete materials. A special
emphasis was given to characteristics addressed to durability issue. Chemical resistance
tests to several aggressive agents were performed, mechanical performances under
different environment temperatures were investigated, resistances to thermal fatigue
cycles and to freeze-thaw cycles were analysed and the weatherability, either by means of
natural weathering tests or by accelerated and/or artificial weathering tests, was assessed.
Behavior under fire, as an important shortcoming associated to these materials, was also
analysed and discussed. Heat release, ignition time, flame spread, smoke and toxic gases
release rates were some of the parameters determined, which allowed the assessment of
fire performance of PM formulations. The effect of different flame retardant systems on
material’s fire reaction was also investigated.
VII. CONCLUSIONS AND RECOMMENDATIONS
VII-2
Finally, two different applications for the developed PM formulations were approached:
i) composites structural beams made with GFRP (Glass Fibre Reinforced Plastics)
profiles filled with a PM material, and ii) lightweight structural concretes based on PM
materials modified with lightweight natural aggregates, such as cork granules and wood
shavings. For both foreseen applications, the first investigation steps were performed.
Models were conceived and produced, mechanical performances were analysed and the
viability of their appliances was evaluated.
As the same time as the above tasks were developed, another goal aimed for this thesis
work was attained: to make a state of the art review on PC materials, helping to fill the
still existing gaps in certain issues addressed to these materials, and contributing for a
better bridge between polymer technology and construction materials’ science.
7.2 Main Conclusions
In the following sections, the main conclusions inferred from the studies carried out
throughout this thesis are compiled and briefly discussed.
i) Optimization process of PM formulations:
Within the range of variables investigated in this study, the following can be concluded:
• For the same processing conditions, the most influencing factor on bending
strength of PM formulations is the resin type, followed by resin content and filler
content;
• Curing treatment by seven days at room temperature has the same effect on
flexural strength of PMs than one day at room temperature followed by three
hours at 80ºC;
• The optimal combination that leads to the most flexural resistant PM results of the
mixture of foundry sand (80% by weight) with epoxy resin binder (20% by
weight), without filler addition. However, the combination that leads to the best
relationship between cost and flexural performance is achieved by using
unsaturated polyester as binder, instead of epoxy resin system, while keeping the
other material factors (binder content, filler content and sand type).

VII. CONCLUSIONS AND RECOMMENDATIONS
VII-3
Taguchi methodology, and the analysis of variance ANOVA, can be applied with success
to PC material’s design. With these techniques, the experimental plan is significantly
reduced and the influence of several material factors and their interactions on a certain
desirable or undesirable feature can be easily assessed. Care should be taken, however, in
selecting the most representative material factors, with adequate levels, and the most
convenient Taguchi orthogonal array. Insensate choices may result on poor results.
Special care should also be put on the number and type of interaction to study, as masked
interactions, not considered in the orthogonal array, may confuse excessively the plan
leading to erroneous conclusions.
ii) Physical and short term mechanical properties:
Physical and mechanical properties of both PM formulations obtained on all tests
performed are summarized in Table 7.1. Some comments concerning obtained results and
observed behavior during testing are depicted in what follows:
Physical properties:
• Both PM formulations present good workability, especially, epoxy based one.
However mixture workability and consistency are considerably time-dependent.
At room temperature, 15–20 minutes after mixing, polyester PM formulation is no
more workable, whereas epoxy mortar formulation shows a considerable decrease
on workability; 35-40 minutes after this point, epoxy formulation cannot also be
casted. Polyester based formulation, with a shorter working life, is more sensitive
to environment temperature, catalyst content and total amount of mass produced
by batch.
• Final setting shrinkage (24 hours) of polyester PM formulation is up to two times
higher than epoxy-based formulation and almost eighteen times higher than
Portland cement concrete. However, shrinkage phenomenon occurs quickly and
after 24 hours or less is negligible due to relaxation.
• Both PM formulations can be classified into the category of structural lightweight
concrete materials, as their densities are lower than 1.9 kg/dm3 and their
compressive strengths are higher than 17 MPa.

VII. CONCLUSIONS AND RECOMMENDATIONS
VII-4
Table 7.1. Summary of physical and short-term mechanical properties of PM formulations.
Physical Properties Test Method Sample size
Epoxy PM Average | St. Dev.
Polyester PM Average | St. Dev.
Slump Test RILEM PC-3 2 56 mm 52 mm
Flow Test RILEM PC-3 2 128 mm 125 mm
Working Life RILEM PC-4 2 42 min 18 min
Setting Shrinkage Int. Method 2 2.24 ‰ 5.99 ‰
Specific Gravity RILEM PCM-4 41 1.80 ± 0.02 kg/dm3 1.88 ± 0.02 kg/dm3
Air Content RILEM PCM-4 41 15.21 ± 0.98 % 8.33 ± 1.10 %
Coef. Thermal Expansion [-15ºC, +23ºC] [+23ºC, +60ºC]
Int. Method 3 27 µm/m.ºC 46 µm/m.ºC
25 µm/m.ºC 34 µm/m.ºC
Coef. Water Absorpa) RILEM PC-11 3 0.023 ± 0.004 % 0.070 ± 0.007 %
Mechanical Properties
Flex. Strength (3-Point) RILEM PCM-8 114 - 66 40.40 ± 3.18 MPa 22.10 ± 1.76 MPa
Comp. Strength (prism.) UNE 83821 18 73.23 ± 3.15 MPa 65.03 ± 3.09 MPa
Comp. Strength (cyl.) RILEM PC-5 9 70.16 ± 6.74 MPa 64.13 ± 1.43 MPa
Comp. Secant ElasticityModulus
RILEM PC-8 ASTM C 469
3 12.60 ± 0.32 GPa 11.57 ± 0.17 GPa
Máx. Comp. Strainb) RILEM PC-8 ASTM C 469
3 10.45 ± 0.24 ‰ 15.99 ± 0.35 ‰
Ultimate Comp. Strainc) - 3 30 ‰ to 35 ‰ 25 ‰ to 30 ‰
Poisson Ratio ASTM C 469 1 0.26 0.22
Flex. Strength (4-Point) RILEM PC-7 3 25.82 ± 1.07 MPa 16.99 ± 0.81 MPa
Flex. Elast. Modulus Int. Method 3 9.82 ± 0.48 GPa 9.74 ± 0.51 GPa
Máx. Tensile. Strainb) - 3 3.08 ± 0.08 ‰ 3.74 ± 0.22 ‰
Splinting Tensile Strength RILEM PC-6 3 17.44 ± 0.53 MPa 12.07 ± 0.37 MPa
Direct Tensile Strengthd) - 3 18.1 to 18.7 MPa 12.2 to 12.6 MPa
Charpy Impact Strengthe) ISO 179-1 10 1.82 ± 0.13 kJ/m2 1.06 ± 0.11 kJ/m2 a) Determined with basis on water uptake of specimens immersed during 48 hours in water; b) Strain at peak stress; c) Strain at failure; d) Estimated with basis on splitting tensile and four-point bending strength; e) Charpy impact tests performed on the Department of Polymer Engineering (University of Minho) by courtesy of Dt. Paulo Nóvoa.

VII. CONCLUSIONS AND RECOMMENDATIONS
VII-5
• Although the lower density of polyester resin, polyester based mortars present
higher density than epoxy mortars. The high value of air content present on epoxy
PMs, almost twice of polyester PM, is surely the responsible factor for this
feature. The higher values found for slump and flow of epoxy PM formulation, in
spite of the higher viscosity of its resin binder, are certainly due to this great
amount of air content. Other mixture process for the resin and hardener
components of epoxy resin system must be though in order to decrease accidental
air entrainment into the mixture.
• Coefficients of thermal expansion of both PM formulations vary continuously
within the temperature range of –15ºC to +60ºC, presenting higher coefficients at
higher temperatures than at lower temperatures. The variation of thermal
expansion with temperature, follow rather a polynomial law than a bilinear law.
However, for practical use, when a higher precision is not required, it may be
considered a bilinear law with transition points at room temperature (see Table
7.1).
The method applied to determine the coefficient of thermal expansion, (-thermal strains
measured by means of self-temperature compensated strain gages, indicated for test
materials without thermal expansion-), is quite precise with excellent accuracy for
practical purposes, does not require any specific devices or special equipment and it is
very simple to implement, which make it a good alternative to conventional methods.
Short-term compressive properties:
• Epoxy PMs present higher compressive strength than polyester based mortars.
However, this difference (9% and 15% higher for, respectively, cylinder and
prismatic specimens) is not as outstanding as in the case of flexural strength,
which is almost two times higher. This is in accordance with the assumed premise
that flexural resistance is a better parameter for the mechanical assessment of PC
materials. Obtained compressive strengths of PM formulations were within the
usual range of values obtained for polyester and epoxy PMs.
• Secant compressive elasticity modulus of epoxy PM specimens is slight higher
than polyester based mortars. The same pattern is observed for initial tangent

VII. CONCLUSIONS AND RECOMMENDATIONS
VII-6
elastic modulus. Both obtained values are closer to the lower limit of the common
range of values found for PC materials.
• A higher stiffness is shown by epoxy PM specimens than by polyester based
mortars and the determined secant elasticity modulus (at 40% of peak stress) does
not reflect this large difference in stiffness of the two materials. The ascending
branch of stress-strain curves of epoxy PM specimens is not only steeper, but also
almost linear up to 60% of maximum stress; whereas polyester based mortars
present rather a more ductile behavior, with corresponding ascending branches
approximately linear only up to 40% of peak stress.
Post-peak behavior is also very distinct for both PM formulations. Descending
branch of polyester PM formulation is almost symmetric to the ascending part,
but it has a limited extension as a brittle failure occurs at compressive strains
around 25‰ to 30‰ (approximately at 80% of maximum capacity load).
Conversely, softening branch of epoxy PM specimens is less steep than the
ascending part and greatly larger than in the case of polyester based mortars.
Furthermore, failure is not brittle. Instead, a progressive and steady loss of load
capacity occurs as compressive strain increases.
• The two-parameter relationship purposed by Sargin, defined by Eq. (4.18), shows
a good agreement with the experimental data, for both types of PM specimens,
and can be applied with success to modelling compressive stress-strain behavior
of PM formulations.
Short-term flexural properties:
• Average three-point flexural strength of epoxy PM formulation is rather near the
upper limit of the common values found for this type of mortar (usually within the
range of 15 MPa to 45 MPa, as function of binder content). Relatively to polyester
PM formulation, average flexural strength is within the range of values commonly
found for these types of resin-based mortars. With 95% confidence, it may be
predicted that the correct estimates of the mean flexural strength, f fl, are in the
range of 39.7 to 41.0 MPa for epoxy PM formulation, and between 21.5 and 22.6
MPa for polyester based formulation.

VII. CONCLUSIONS AND RECOMMENDATIONS
VII-7
• Flexural elasticity modulus of PM formulations cannot be assessed by load-
deflection curves obtained from three-point bending tests performed on prismatic
specimens, with a height to span ratio of 0.4. Even considering shear effect on
calculation procedure, through Timoshenko simplified approach for the deflection
at mid-span of a rectangular bar with allowance for shear, introduced
simplifications on calculation of elasticity modulus lead to rough and large errors.
• Flexural to cylinder compressive strength ratios of 0.57 and 0.34 were found for,
respectively, epoxy and polyester PM formulations. These ratios are much higher
than similar parameters found for conventional cement concretes (around 0.2),
mainly due to the great flexural resistance of PMs, especially of epoxy based
ones.
Short-term tensile properties:
• Average direct tensile strength, estimated with basis on splitting tensile strength
and modulus of rupture, results on values around 18 MPa and 12 MPa for,
respectively, epoxy and polyester PM formulations. Obtained results are within
the range of values commonly found for these materials.
• Flexural-tensile elasticity modulus values, directly obtained for both formulations
by means of stress-strain curves (four-point bending tests), are also within the
common range of values found for these materials, and are coherent with material
composition.
• Like in compression, a higher stiffness is shown by epoxy PM specimens than by
polyester based mortars, and the determined flexural-tensile elasticity modulus
does not reflect this distinct behavior. Departure from linearity of the stress-strain
relations occurs at similar stress/strength ratios for both formulations, between
45% and 50%, but after this point, the stress-strain curves of polyester based
mortars bend drastically comparing with those of epoxy PMs. In spite of the
higher modulus of rupture reached by epoxy mortars, a higher tensile strain is
sustained by polyester based mortars until failure.
• Tensile to cylinder compressive strength ratios of 0.26 and 0.18 were found for,
respectively, epoxy and polyester PM formulations. These ratios are much higher
VII. CONCLUSIONS AND RECOMMENDATIONS
VII-8
than similar parameters found for conventional cement concretes (around 0.1).
This feature is mainly due to the tighter bonding between the polymeric binders
and the aggregates, since the cracking of ordinary concretes is usually initiated
from the interfaces of cement paste and aggregates.
Making an overall comparison, similarities in fact exist between static mechanical
behavior of PC materials and conventional cement concretes. However, significant and
considerable differences also coexist. PC materials withstand much more strain during
mechanical loading than ordinary concretes do, and this feature is greater the lower the
loading rate. Compressive and tensile strains at peak stress four to seven times higher
than the usual values observed in ordinary concretes are commonly found in PC
materials. This implies that polymer based concrete is a more ductile material than
portland cement concrete. This characteristic arises from the viscoelastic nature of matrix
binder. Higher bond capacity of polymer binders also justify the higher flexural/tensile to
compressive strength ratios found for PC materials
Thus, some of the PC material’s behavior can be understood by considering the known
behavior of regular concrete, and some of its behavior can be understood by examining
the behavior of polymers.
ii) Durability properties:
Durability properties of PM formulations in terms of chemical resistance, thermal
durability and weatherability are summarized in Table 7.2. Main conclusions obtained
with durability experimental program are described in the following:
Chemical durability:
• Epoxy PM mortars are hardly affected by immersion in water, sulphuric acid and
sodium chloride solutions, which is a good indicator of the excellent chemical
resistance of this material to acids and salts. On the other hand, polyester based
mortars are fairly affected by immersion in the same solutions, showing some
sensitivity to these chemicals (reductions in the range of 16% to 31% were
observed).
Both PM formulations are markedly attacked by sodium hydroxide solution, but
even so, retained flexural strength after 84 immersion days in the alkalis solution

VII. CONCLUSIONS AND RECOMMENDATIONS
VII-9
is in the same magnitude (polyester PM) or much higher (epoxy PM) than that of
ordinary concretes without any degradation process.
• There is a positive correlation between water uptake and flexural strength
reduction of PMs immersed in water, alkalis and acid solutions. This correlation is
stronger for epoxy than for polyester PMs. Similar correlations were found in
other studies undertaken chemical resistance of PC materials. Hence, it is
reasonable to presume that the most likely factor causing the reduction in strength
is the deterioration of the interface matrix/aggregate due to water diffusion into
PM.
Thermal durability:
• Flexural properties of both PM formulations are strongly affected by environment
temperature. Except within a narrow temperature range, (between 10ºC and 25ºC
for epoxy mortars, and between -20ºC and 30ºC for polyester mortars), flexural
strength of these mortar formulations decreases drastically with raising test
temperatures, especially in the case of epoxy based mortars. Loss of loading
bearing capacity with increasing temperatures is accompanied with a progressive
loss of material stiffness. The inflection points, where temperature dependency
becomes notorious, are related to the heat distortional temperatures of the resins
used rather than the glass transition temperatures. The ‘heat distortional
temperatures’ of both formulations (approximately at 25ºC and 30ºC for,
respectively, epoxy and polyester PMs) are both located around 10ºC lower than
the HDT of resin binders.
For temperatures lower than +10 ºC, flexural behavior of epoxy mortars improves
with further decreases in temperature, while polyester mortars present rather stable
values.
• Exposure to constant or changing temperatures (thermal fatigue cycles) has no
significant influence on flexural properties of both formulations of PM, as long as
specimens are taken back to their initial environmental conditions. However,
recovering capacity of epoxy mortars is gradually reduced by repeated exposure
to high temperatures.

VII. CONCLUSIONS AND RECOMMENDATIONS
VII-10
Both PM formulations show an excellent resistance to freeze-thaw cycles and
frost attack. One hundred freeze-thaw cycles, between –10 ºC and +10 ºC,
produce very little damage on both epoxy and polyester PMs, due to a reduced
degree of water absorption.
With basis on obtained results, it can be concluded that the use of epoxy PMs is restricted
to lower temperature environments in order to benefit from its total potential in strength.
In the case of higher temperatures, care should be taken in both formulations as properties
may drop significantly.
Weatherability:
• PM formulations are sensitive to degradation effects of natural weathering. One-
year outdoor exposure to natural maritime environment has a moderate
deleterious effect on flexural strength of both types of PMs. Epoxy based mortars
are in general more weather resistant than polyester based ones.
• Spring/Summer outdoor exposure is more prone to PM specimens than equivalent
exposure time in Fall/Winter period. Higher intensities of sunlight radiation,
especially in the UV region, combined with quite higher levels of temperature,
seem to be the major reasons for the superior degradation rates observed.
• Beyond yellowing and staining processes, relative short-term exposures to arc-
xenon artificial light source (up to 3000 hours) has no noticeable deleterious
effects on both types of PM formulations. Instead, slight increases on mechanical
flexural strength were in fact observed. Lack of agreement between the solar
spectrum and that of the artificial light source, especially in the infrared and UV
region, appears to be the main reason for the differentiated behavior of natural and
artificially exposed specimens.
• Both types of PMs are severely affected by exposure to salt-fog spray artificial
weathering, specially epoxy based ones. The strength decrease rates presented a
non-linear evolution with a tendency to stabilization. Mechanical cyclic loading
induced by moisture cycling, leading to fatigue processes, is likely the major
cause responsible for the strong degradation rates occurred during salt-fog
artificial exposure.
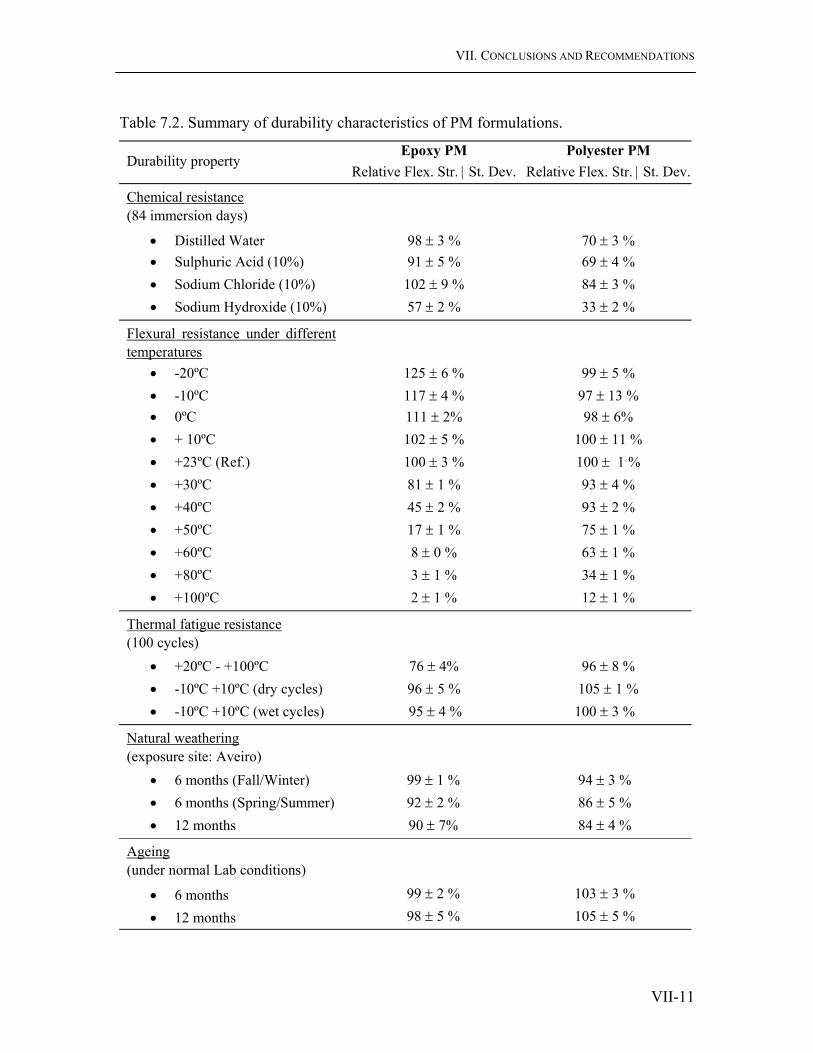
VII. CONCLUSIONS AND RECOMMENDATIONS
VII-11
Table 7.2. Summary of durability characteristics of PM formulations.
Durability property Epoxy PM
Relative Flex. Str. | St. Dev.Polyester PM
Relative Flex. Str. | St. Dev.
Chemical resistance (84 immersion days)
• Distilled Water 98 ± 3 % 70 ± 3 % • Sulphuric Acid (10%) 91 ± 5 % 69 ± 4 % • Sodium Chloride (10%) 102 ± 9 % 84 ± 3 % • Sodium Hydroxide (10%) 57 ± 2 % 33 ± 2 %
Flexural resistance under different temperatures
• -20ºC 125 ± 6 % 99 ± 5 % • -10ºC 117 ± 4 % 97 ± 13 % • 0ºC 111 ± 2% 98 ± 6% • + 10ºC 102 ± 5 % 100 ± 11 % • +23ºC (Ref.) 100 ± 3 % 100 ± 1 % • +30ºC 81 ± 1 % 93 ± 4 % • +40ºC 45 ± 2 % 93 ± 2 % • +50ºC 17 ± 1 % 75 ± 1 % • +60ºC 8 ± 0 % 63 ± 1 % • +80ºC 3 ± 1 % 34 ± 1 % • +100ºC 2 ± 1 % 12 ± 1 %
Thermal fatigue resistance (100 cycles)
• +20ºC - +100ºC 76 ± 4% 96 ± 8 % • -10ºC +10ºC (dry cycles) 96 ± 5 % 105 ± 1 % • -10ºC +10ºC (wet cycles) 95 ± 4 % 100 ± 3 %
Natural weathering (exposure site: Aveiro)
• 6 months (Fall/Winter) 99 ± 1 % 94 ± 3 % • 6 months (Spring/Summer) 92 ± 2 % 86 ± 5 % • 12 months 90 ± 7% 84 ± 4 %
Ageing (under normal Lab conditions)
• 6 months 99 ± 2 % 103 ± 3 %
• 12 months 98 ± 5 % 105 ± 5 %

VII. CONCLUSIONS AND RECOMMENDATIONS
VII-12
Table 7.2 (cont.). Summary of durability characteristics of PM formulations.
Durability property Epoxy PM
Relative Flex. Str. | St. Dev.Polyester PM
Relative Flex. Str. | St. Dev.
Salt Fog resistance (16h: 50g/l NaCl ; 8h: drying 35ºC)
• 1000 hours 92 ± 10 % 94 ± 8 % • 1350 hours 86 ± 6 % 87 ± 11 % • 3000 hours 79 ± 4 % 85 ± 3 % • 5000 hours 65 ± 1 % 64 ± 11 % • 10000 hours 52 ± 4 % 62 ± 3 %
Arc Xenon rays resistance (Int: 550W/m2 ; Band.: 300-800 nm)
• 500 hours 102 ± 3 % 99 % • 1000 hours 105 ± 2 % 96 % • 2000 hours 106 ± 6 % 102 % • 3000 hours 111 ± 1 % 105 %
• Regarding the correlation between salt-fog artificial weathering test results and
data obtained with natural exposure, with basis on one-year time-scale, it can be
stated that the former tests accelerate 7.80 and 3.97 times the natural weathering
degradation processes that occur, respectively, on epoxy and polyester PM
formulations. Obtained acceleration factors can only be applied relatively to
maritime sites, with similar latitudes as Aveiro, and to salt-fog artificial
environments with the same set points used in this study.
• Previsions regarding the long-term behavior of PM formulations with outdoor
exposure time can be attempted, but only with a merely indicative value. Within
the uncertainty of the data, maximum flexural strength decreases of 50% and 35%
will be expected, respectively for epoxy and polyester PMs. It is estimated that
predicted residual flexural strengths, which constitute the long-term stable values,
will be attained, respectively, after 10 and 4 years of outdoor exposure.
It must be pointed out that prediction models based on short-term values of acceleration
factors only give rough indications about the relationship between natural and artificial

VII. CONCLUSIONS AND RECOMMENDATIONS
VII-13
weathering, representing, eventually, the worst scenario that could be encountered in a
real situation of long-term outdoor exposure.
Since major deleterious effects of weathering are confined to superior layers of the
material, another point that should be realized is the fact that damage magnitude becomes
size piece dependent. The larger the element, the minor the importance of the damage. It
is not reasonable to expect that a larger element of PM material would loss the same load
bearing capacity as a standard prismatic specimen. Nevertheless, estimated residual
flexural strengths of PM formulations after long-term outdoor exposure are, even so, still
competitive with those presented by ordinary cement concrete materials (not exposed to
weathering processes).
iv) Fire Performance:
Major conclusions obtained from cone calorimeter and radiation tests conducted on both
PM formulations and on epoxy PMs modified with flame retardant systems are
summarized in the following:
• Under a fire situation, epoxy-based mortar presents a worst behavior than
polyester based one, especially in terms of heat release rate and carbon monoxide
yield. Poor thermal stability and the weak tendency to char of epoxy resin seem to
be the main reasons for this feature.
• Both epoxy and polyester PM formulations are classified, as medially flammable
materials, into fire reaction class M3 (according French normalization). Taking
into account the Portuguese regulations of fire safety in buildings, M3 materials
can be applied, in general, as cladding or surface coating of exterior walls
(buildings with less than 9 m height), roof coverings and floors.
• The addition of APP (Ammonium Polyphosphate) and ATH (Aluminium
Trihydroxide) flame retardant systems, with the content levels of 20% and 40%,
respectively, in weight of resin content, improves significantly fire behavior of
epoxy-based mortars, but not enough to reach an effective reduction of
combustibility class. Fire behavior enhancement, however, is achieved without
loss of flexural mechanical properties.

VII. CONCLUSIONS AND RECOMMENDATIONS
VII-14
• The use of ATH compound, with a higher content (80%) ATH-II, is effective in
reducing the material combustibility class to M2 (hardly flammable material).
However, the addition of this amount of filler additive also leads to a decrease of
14 % in flexural strength of the final product. As a M2 material, the application
field of epoxy based mortars is considerably enlarged: ATH-II modified epoxy
PM can be applied for cladding and surface coating of exterior and interior walls,
ceilings and floorings, in all habitation buildings whatever their height.
• Taking into account the fire reaction Euro classification system, new national
regulations concerning fire safety in building are foreseen. Merely as an
indication, it is expect that plain epoxy and polyester PM and ATH-II modified
epoxy PM formulations will be classified, respectively, as D-s3;d0 and C-s3;d0
materials (i.e., materials medially -D- or limitedly –C- combustibles, with
significant smoke emission –s3-, but without burning particles or droplets –d0-).
Comparing with other polymer mortars with similar resin contents, PM formulations in
study (unmodified ones) are quite good in terms of reaction to fire. Nonetheless, and
although test results revealed that polyester PM is less-prone material than epoxy-based
mortar, fire behavior of both formulations is not satisfactory for some intended uses.
Therefore, it does not seem to be advisable to use these ‘new’ materials, indoors, without
improving their fire behavior, either by incorporation of flame retardant systems, or by
means of fireproofing coatings further applied on the outer surface of the material.
7.2 Recommendations
A number of future investigations could be attributed as an extension or complement to
the present work. Also some gaps were detected, demanding further analysis.
For that propose, the following complementary studies are strongly recommended:
• Analysis of the effect of an intermediate level of filling or charge, between 5% to
20%, on flexural and compressive performance of epoxy and polyester PM
formulations;

VII. CONCLUSIONS AND RECOMMENDATIONS
VII-15
• Accurate statistical analysis of compressive and tensile properties of PM
formulations with basis on a more representative sample size; Additionally,
determination of tensile strength through performance of direct tensile tests;
• Development and improvement of embedding process of Fibre Bragg Grating
(FBG) sensors into PMs for in-time real monitoring;
• Determination of acceleration factors between natural and artificial weathering
tests with basis on a longer time-scale;
As an extension of the present work the following studies are suggested:
• Investigation of long-term mechanical properties of PM formulations: flexural
fatigue performance and accelerate flexural creep behavior under high
temperatures;
• Development of hybrid composite structures based on the assembly of GFRP
pultrusion profiles and precast PC materials;
• Analysis of thermal and acoustic characteristics of PMs modified with lightweight
organic aggregates;
• Development of ultra-lightweight PMs, with densities lower than water, with
basis on polyester ‘polychips’ and cork aggregates;
• Improvement of fire performance and thermal resistance of PMs through the use
of matrix binders modified with nanoclays.
It is believed that with the progress in polymer technology and continuing research in PC
materials, it will be able to develop composite materials that can benefit from the
advantages that the polymer-concrete matrix offers, such as versatility, rapid cure,
excellent mechanical strength and durability, and avoid the drawbacks of polymers, such
as high creep and shrinkage, sensitivity to temperature, and vulnerability to fire.
This composite is not intended to replace conventional concrete, but its field of
application should be where other materials would provide less than satisfactory or
adequate performance.

VII. CONCLUSIONS AND RECOMMENDATIONS
VII-16
APPENDIX A
GFRP-Polymer Concrete Hybrid Beams
i) ‘Analysis of hybrid beams composed of GFRP profiles and polymer concrete’, International Journal of Mechanical and Materials and Mechanics in Design, Vol.1 (2004), 143-155. .................................................. A-3
ii) ‘Flexural behaviour of GFRP-polymer concrete hybrid structural systems’, 6th International Symposium on FRP Reinforcement for Concrete Structures -FRPRCS-6, July 8-11, 2003, Singapore, 695-704 ........ A-17
iii) Development of composite hybrid structures based on polymer concrete – GFRP pultrusion profiles assembly system, 3rd International Conference on Composites in Construction, July 11-13, 2005, Lyon, France ................... A-27

APPENDIXES
A-2

Analysis of hybrid beams composed of GFRP profiles
and polymer concrete
A. J. MENDES FERREIRA*, M. C. S. RIBEIRO, and A. TORRES MARQUES
Departamento de Engenharia Mecanica e Gestao Industrial, Faculdade de Engenharia da Universidade do Porto, Rua
Dr. Roberto Frias, 4200-465 Porto, Portugal
*Author for correspondence (E-mail: [email protected])
Received 24 May 2003; accepted in revised form 20 May 2004
Abstract. In this paper, a numerical approach for the analysis of a new type of hybrid composite beams is presented.
Such beams are composed of composite materials that resist shear and tensile stresses, and polymer concrete acom-
modating compression stresses.The beams offer an optimized configuration in terms of stiffness and strength, with much
potential for mechanical and civil engineering structures.The current numerical model is based on a finite element
formulation for layered shell-like structures. The model accounts for a polymer concrete material model, orthotropic
material model, and considers the analysis of geometric and material nonlinearities. The first-order shear deformation
theory is used in order to describe the shell deformation under a total Lagrangian formulation. The model is validated
experimentally and a close agreement with experimental results makes this model an attractive solution method for this
type of composite hybrid beams.
Key words: polymer matrix composites, polymer concrete, FRP composite materials, hybrid beam, FEA
1. Introduction
1.1. FRP–POLYMER CONCRETE HYBRID SYSTEMS
Research in polymer concrete has initiated interest amongst the scientific community in recent
years (American Concrete Institute, 1986; Dikeou, 1986; Fowler 1997 and 1999; Chawalwala,
1999). Polymer concrete is made from thermoset resins and natural aggregates. This type of
concrete has very high compressive strength, good chemical resistance, and relatively low elastic
modulus. The good characteristics of this material did promote its industrial production, which
is already established in the market, mainly in the field of precast components for the building.
The use of steel or fiber reinforced plastics (FRP) allowed the application and growth of
polymer concrete as structural elements.
In recent years, an innovative structural concept was developed involving a combination of
FRP pultruded profiles with conventional cement concrete to produce lightweight, corrosion-
free and yet inexpensive hybrid systems, see Deskovic et al. (1995), Sekijima et al. (2001) and
Hall and Mottram (1998). According to this new concept, a FRP profile beam is combined
with a concrete layer cast onto the top flange, which replaces the thick FRP compressive
flange of traditional pultruded profiles. The method maximizes system performance using
materials by combination, and can be thought of as a better way of producing structural
members based on the pultrusion process. Interestingly, FRP researchers have developed a
number of hybrid systems either by simply replacing steel with FRP pultruded profiles in
International Journal of Mechanics and Materials in Design 1: 143–155, 2004.
� 2004 Kluwer Academic Publishers. Printed in the Netherlands.

conventional steel-concrete composite constructions or by developing new structural systems
(Mirmiran, 2001).
This paper is concerned with the analysis of hybrid structures composed of GFRP profiles
and polymer concrete. Exploiting the better performance of resin concrete, it is believed that
hybrid systems can lead to:
(a) section reduction and reduced weight as a result of higher compressive and flexural strength
of polymer concrete,
(b) use in highly corrosive environments, as a result of their enhanced chemical resistance,
(c) easier production of precast components and site applications as a result of faster curing
time.
In a previous investigation (Ribeiro et al., 2001), small-scale models of four different hybrid
beams were designed, manufactured and tested in four-point bending test. Flexural behaviour of
such composite structures, in terms of load–deflection history, load capacity and failure mode
was analyzed and compared with the flexural behaviour of its material constituents. The four
hybrid beam models were designed considering a GFRP pultrusion profile that works in ten-
sion, and an epoxy polymer concrete filling, that works mainly in compression. Experimental
results showed the high potential of these hybrid systems, revealing a pronounced synergetic
effect associated with the assembly of polymer concrete and GFRP profiles. However, some
strength problems were detected. Interface debonding provoked premature failure. Further
studies were necessary in order to improve bond strength between polymer concrete and the
GFRP profiles.
In this paper, we report our findings of new experiments considering GFRP-polymer concrete
hybrid beams, with improved adherence between the different material components. Three new
series of small-scale hybrid beam specimens were manufactured and tested in bending. A special
treatment was given to GFRP profile internal surfaces to promote the adhesion to epoxy
polymer concrete. A significant improvement of flexural performance of the hybrid beams is
observed.
1.2. NUMERICAL MODEL
Early studies showed that cracking, deflection and ultimate load behaviour of FRP–reinforced
concrete beams could be predicted with the same degree of accuracy as the behaviour of regular
steel reinforced concrete beams and that a theoretical correlation is possible, see Nawy and
Neuwert (1977), Saadmatmanesh and Ehsani (1991) and Al–Salloum et al. (1996).
The present work reports a numerical model for the analysis of concrete with arbitrary shell
structures reinforced with composite materials, particularly with FRP pultruded materials. The
proposed model is capable of predicting deflections and stresses in concrete and in FRP rein-
forcement for geometrical and material nonlinear behaviour. The model makes use of constit-
utive laws for concrete material, based on smeared crack concepts, and high-strength composite
materials. The model is implemented in a degenerated shell element as proposed by Ahmad
et al. (1970), Owen and Figueiras (1984), and more recently by Ferreira et al. (2001). In order to
check the model applicability, it was applied to predict the flexural behaviour of GFRP-polymer
concrete hybrid beams. A good agreement between experimental and numerical results was
found. The tests were only performed in beams, but the model is generally applicable to plates
or shells of arbitrary shape.
144 M. Ferreira et al.
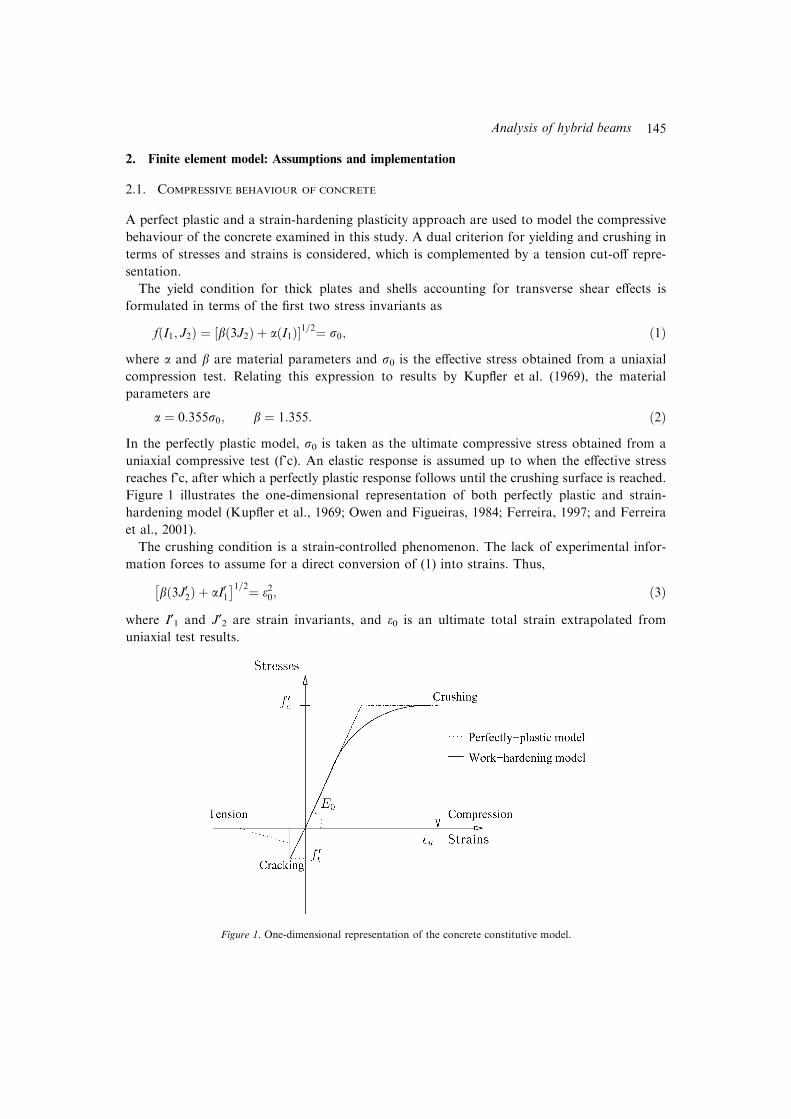
2. Finite element model: Assumptions and implementation
2.1. COMPRESSIVE BEHAVIOUR OF CONCRETE
A perfect plastic and a strain-hardening plasticity approach are used to model the compressive
behaviour of the concrete examined in this study. A dual criterion for yielding and crushing in
terms of stresses and strains is considered, which is complemented by a tension cut-off repre-
sentation.
The yield condition for thick plates and shells accounting for transverse shear effects is
formulated in terms of the first two stress invariants as
fðI1; J2Þ ¼ bð3J2Þ þ aðI1Þ½ �1=2¼ r0; ð1Þwhere a and b are material parameters and r0 is the effective stress obtained from a uniaxial
compression test. Relating this expression to results by Kupfler et al. (1969), the material
parameters are
a ¼ 0:355r0; b ¼ 1:355: ð2ÞIn the perfectly plastic model, r0 is taken as the ultimate compressive stress obtained from a
uniaxial compressive test (f’c). An elastic response is assumed up to when the effective stress
reaches f’c, after which a perfectly plastic response follows until the crushing surface is reached.
Figure 1 illustrates the one-dimensional representation of both perfectly plastic and strain-
hardening model (Kupfler et al., 1969; Owen and Figueiras, 1984; Ferreira, 1997; and Ferreira
et al., 2001).
The crushing condition is a strain-controlled phenomenon. The lack of experimental infor-
mation forces to assume for a direct conversion of (1) into strains. Thus,
bð3J02Þ þ aI01� �1=2¼ e20; ð3Þ
where I¢1 and J¢2 are strain invariants, and e0 is an ultimate total strain extrapolated from
uniaxial test results.
Figure 1. One-dimensional representation of the concrete constitutive model.
Analysis of hybrid beams 145

Crushing or compressive type of fracture is assumed to occur when the effective total strain
reaches the limit value, which is usually taken as the maximum compressive strain in a uniaxial
compression test. Once crushing occurred, the concrete is assumed to lose all its characteristics
of stiffness at the point under consideration. Therefore, the corresponding elasticity matrix D is
taken as a null matrix and the vector of total stresses is reduced to zero.
2.2. TENSILE BEHAVIOUR OF CONCRETE
The relative weakness of concrete in tension and the resulting cracking is a fundamental factor
affecting the nonlinear behaviour of reinforced concrete plates and shells. It is assumed that
when concrete is subjected to a tensile stress it behaves in a semi elastic-brittle material. For-
mation of cracks can be considered as in other materials a brittle process. In our model we
assume for simplicity that the concrete strength in the tension-loading direction decreases to
zero after such cracks have formed (Figure 2).
2.3. SMEARED CRACK MODEL
In our analysis, we are not interested in the tensile strength of concrete, but in the influence of
the cracked concrete zones on the structural behaviour. A simplified averaging procedure for
finite element representation is adopted, based on smeared cracked concrete, which assumes that
cracks are distributed across a region of the finite element (Kupfler et al., 1969; Owen and
Figueiras, 1984; Ferreira, 1997; Ferreira et al., 2001).
In this model, cracked concrete is supposed to remain a continuum and the material prop-
erties are then modified to account for the damage induced in the material. After the first crack
has occurred, the model assumes that concrete becomes orthotropic with the material axes
oriented along the directions of cracking (Figure 3).
The response of concrete under tensile stresses is assumed to be linear elastic until the fracture
surface is reached. This tensile type of fracture or cracking is governed by a maximum tensile
stress criterion (tension cut-off). Cracks are assumed to form in planes perpendicular to the
direction of maximum tensile stress, as soon as this stress reaches the specified concrete tensile
strength (f¢t). A sudden and total release of the normal stress in the affected direction, or its
gradual relaxation according to a tension-stiffening diagram is adopted after cracking has oc-
curred. The elasticity modulus and the Poisson’s ratio are reduced to zero in the direction
perpendicular to the cracked plane, and a reduced shear modulus is employed (Kupfler et al.,
Stress release
Tensile strain, e
Ten
sile
str
ain,
s
et
Ec
ft' Cracking
Figure 2. Linear elastic-brittle behaviour of concrete in tension.
146 M. Ferreira et al.

1969; Owen and Figueiras, 1984; and Ferreira, 1997; Ferreira et al., 2001;). Prior to cracking,
concrete is assumed to be an isotropic material, with the following stress strain relationship:
rxrysxysxzsyz
8>>>><>>>>:
9>>>>=>>>>;
¼
E1�m2
mE1�m2 0 0 0
mE1�m2
E1�m2
0 0 0
0 0 G 0 00 0 0 aG 00 0 0 0 aG
266664
377775
exeycxycxzcyz
8>>>><>>>>:
9>>>>=>>>>;
ð4Þ
with x and y being the axes in the plane of the structure and E the elasticity modulus, m the
Poisson’s ratio, G the shear modulus, G=E/2(1+m) and a the shear correction factor, a ¼ 5/6.
Taking 1 and 2 as the two principal stress directions in the plane of the structure (see Figure 3),
the stress-strain relationship for concrete cracked in the 1-direction (crack plane normal to 1-
direction) is
r1r2s12s13s23
8>>>><>>>>:
9>>>>=>>>>;
¼
0 0 0 0 00 E 0 0 00 0 Gc
12 0 00 0 0 Gc
13 00 0 0 0 aG
266664
377775
e1e2c12c13c23
8>>>><>>>>:
9>>>>=>>>>;; ð5Þ
where Gcij are the reduced shear modulus of cracked concrete (Kupfler et al., 1969; Owen and
Figueiras, 1984; Ferreira, 1997; Ferreira et al., 2001). When the tensile stress in the 2-direction
reaches the value (f¢t), a second cracked plane perpendicular to the first one is assumed to form
and the stress-strain relationship for concrete cracked in two directions becomes
r1r2s12s13s23
8>>>><>>>>:
9>>>>=>>>>;
¼
0 0 0 0 00 0 0 0 00 0
Gc12
2 0 00 0 0 Gc
13 00 0 0 0 Gc
23
266664
377775
e1e2c12c13c23
8>>>><>>>>:
9>>>>=>>>>;; ð6Þ
In this case, cracked concrete becomes anisotropic and these relations must be transformed to
the reference axes, similarly as done with composite materials.
Figure 3. Smeared crack model and the corresponding material axes for concrete.
Analysis of hybrid beams 147

2.4. FINITE ELEMENT IMPLEMENTATION
The formulation presented so far was implemented in the Ahmad shell element, in the same
format as in (Kupfler et al., 1969; Owen and Figueiras, 1984; Ferreira, 1997; Ferreira et al.,
2001). For the sake of completeness, the basic formulation is here presented.
Two basic assumptions are employed in the Ahmad shell element. Firstly, it is assumed that
‘normals’ to the mid-surface remain practically straight after deformation. Secondly, the stress
component normal to the shell mid-surface is constrained to be zero in the constitutive equa-
tions. When applied to plates this formulation is equivalent to that developed by Mindlin (1951)
in that it accounts for transverse shear deformation effects. The element displacement field is
expressed in terms of three displacements of the reference (mid) surface and two rotations of the
‘normal’, defined at each element node, and appropriate shape functions, see Zienkiewicz (1991)
and Bathe (1982).
Ahmad degenerated a three-dimensional brick element to a curved shell element, which has
nodes at the mid-surface (Ahmad et al., 1970), (see Figure 4). This element is capable of layer
definition and is able to model laminates either of composite materials or reinforced concrete
strengthened with composite laminates.
The coordinates x of a point within the element are obtained as
x ¼ ½x; y; z�T ¼Xnk¼1
Nkðn; gÞ xmidk þ hkf=2�v3k
� � ð7Þ
and the displacements by
u ¼Xnk¼1
Nkðn; gÞ umidk þ hkf=2 �v1k � �v2k½ � b1k
b2k
� �� �; ð8Þ
where n is the number of nodes per element, hk is the shell thickness at node k, i.e., the respective
‘normal’ length, umidk and xmid
k are, respectively, the displacements and the global coordinates at
the mid-surface, b1k and b2k are the rotations about local axes, Nkðn; gÞ are the element shape
functions and n; g are curvilinear coordinates (see Figure 4).
The strain vector, e0, is expressed in the local coordinate system, through the derivatives of the
local displacements, u0; v0 and w0 in order to x0; y0 and w0. These local derivatives are obtained
from the curvilinear derivatives of u, v and w as (Ahmad et al., 1970; Bathe, 1982; Owen and
Figueiras, 1984; Ferreira, 1997); where h is a matrix of transformation of coordinates.
u0;x0 v0;x0 w0;x0
u0;y0 v0;y0 w0;z0
u0;z0 u0;z0 u0;z0
24
35 ¼ hT
x;n y;n z;nx;g y;g z;gx;f y;f z;f
24
35�1
u;n v;n w;n
u;g v;g w;g
u;f v;f w;f
24
35h: ð9Þ
Taking the assumption rz0 ¼ 0 into consideration, the stress vector r0 in the local coordinate
system is obtained from e0
The constitutive equations are derived for an orthotropic material with the material axes 1
and 2 parallel to the plane x–y, and rotated by some h in relation to the axes x and y, being the
material axe 3 parallel to z. Taking into account that rz ¼ 0, the stresses r at a layer of the
element are related to the deformations e by (Ahmad et al., 1970; Bathe, 1982; Ferreira, 1997;
Owen and Figueiras, 1984)
r ¼ rx; ry; sxy; sxz; syz� �T ¼ De ¼ T 0T �DT 0e; ð10Þ
148 M. Ferreira et al.
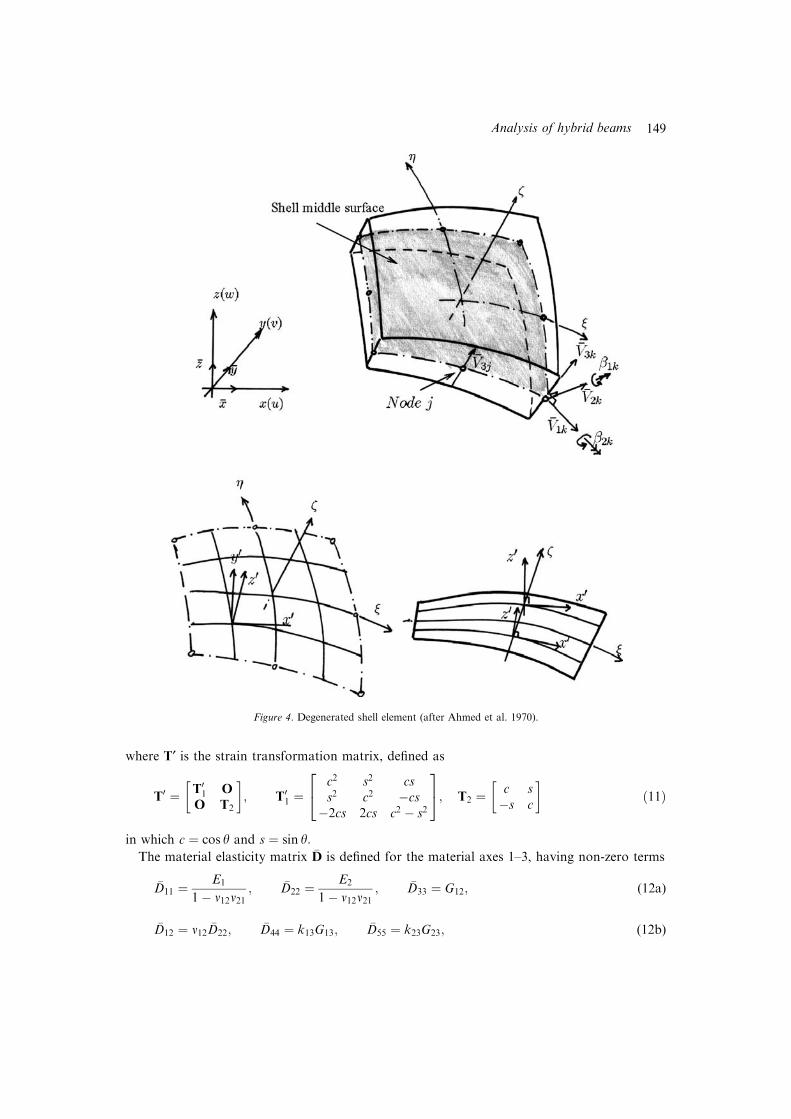
where T¢ is the strain transformation matrix, defined as
T0 ¼ T01 O
O T2
� �; T0
1 ¼c2 s2 css2 c2 �cs
�2cs 2cs c2 � s2
24
35; T2 ¼ c s
�s c
� �ð11Þ
in which c ¼ cos h and s ¼ sin h:The material elasticity matrix �D is defined for the material axes 1–3, having non-zero terms
�D11 ¼ E1
1� m12m21; �D22 ¼ E2
1� m12m21; �D33 ¼ G12; (12a)
�D12 ¼ m12 �D22; �D44 ¼ k13G13; �D55 ¼ k23G23; (12b)
Figure 4. Degenerated shell element (after Ahmed et al. 1970).
Analysis of hybrid beams 149

in which E1 and E2 are the Young’s moduli in the 1 and 2 directions, respectively, mij is Poisson’sratio for transverse strain in the i-direction when stressed in the j-direction and G13 and G23 are
the shear moduli in the 1–3 and 2–3 planes, respectively; the terms k13 and k23 are shear
correction factors in the 1–3 and 2–3 planes, respectively (Ahmad et al., 1970; Bathe, 1982;
Ferreira, 1997; Owen and Figueiras, 1984).
2.5. ASSUMPTIONS MADE IN NUMERIC MODEL APPLICATION
The approach used for the hybrid beams relies on a homogenization procedure of the distinct
zones of their cross-sections, both for stiffness and strength. In Figure 5, these zones are
identified.
In Zone 1, the equivalent material is considered to be a composite laminate only, due to the
laminate construction (Ferreira et al., 2000, 2001). The equivalent material follows the law of
mixtures.
In Zone 2, FRP walls are taken in account. Due to the shell formulation, an equivalent
material in stiffness and strength is considered.
In Zone 3, a combination of FRP and polymer concrete occurs. In this case, it is assumed that
no contribution is given by FRP walls to support compressive solicitations. Therefore, com-
pressive strength of the assembly layer is the compressive strength of the concrete, while tensile
strength and elasticity modulus follows a law of mixtures:
Keq ¼ ðKPC : kPC þ KFRP : kFRPÞ=kTOT; ð13Þ
where KPC;KFRP are the strength or stiffness, of polymer concrete and FRP material, respec-
tively; Keq is the equivalent strength or stiffness of the layer; kPC; kFRPare the thickness of
polymer concrete and FRP material in the layer, respectively and kTOT is the total thickness of
the layer.
3. Experimental work
3.1. COMPONENT MATERIALS OF HYBRID BEAMS
Low viscosity epoxy resin, and foundry sand with a very uniform and fine grain (d50 of 342 lm)
were used for the polymer concrete mixture. Resin content, without any other chemical additive,
was 20% in mass. This formulation corresponds to an optimized result from previous research
(Tavares et al., 2000; Ribeiro et al., 2002; Tavares et al., 2002), and its mechanical properties
PC
GFRPZone 3
Zone 2Zone 1
Figure 5. Layered system used for finite element model.
150 M. Ferreira et al.
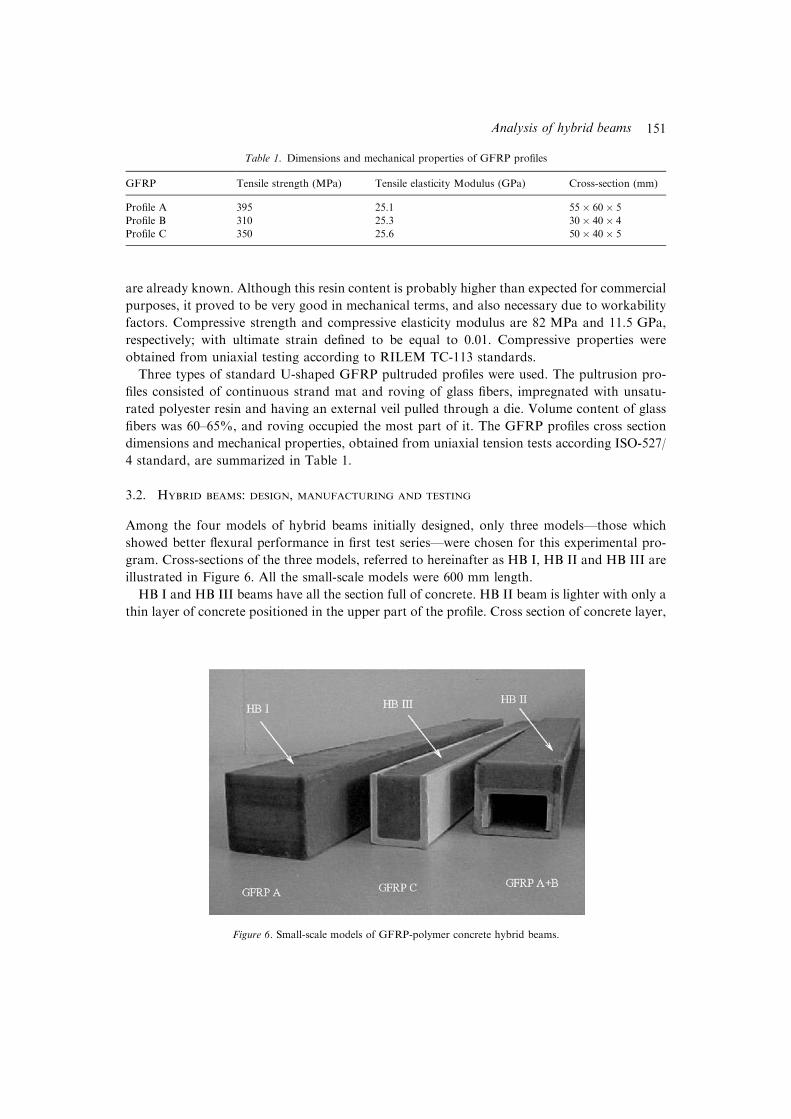
are already known. Although this resin content is probably higher than expected for commercial
purposes, it proved to be very good in mechanical terms, and also necessary due to workability
factors. Compressive strength and compressive elasticity modulus are 82 MPa and 11.5 GPa,
respectively; with ultimate strain defined to be equal to 0.01. Compressive properties were
obtained from uniaxial testing according to RILEM TC-113 standards.
Three types of standard U-shaped GFRP pultruded profiles were used. The pultrusion pro-
files consisted of continuous strand mat and roving of glass fibers, impregnated with unsatu-
rated polyester resin and having an external veil pulled through a die. Volume content of glass
fibers was 60–65%, and roving occupied the most part of it. The GFRP profiles cross section
dimensions and mechanical properties, obtained from uniaxial tension tests according ISO-527/
4 standard, are summarized in Table 1.
3.2. HYBRID BEAMS: DESIGN, MANUFACTURING AND TESTING
Among the four models of hybrid beams initially designed, only three models—those which
showed better flexural performance in first test series—were chosen for this experimental pro-
gram. Cross-sections of the three models, referred to hereinafter as HB I, HB II and HB III are
illustrated in Figure 6. All the small-scale models were 600 mm length.
HB I and HB III beams have all the section full of concrete. HB II beam is lighter with only a
thin layer of concrete positioned in the upper part of the profile. Cross section of concrete layer,
Table 1. Dimensions and mechanical properties of GFRP profiles
GFRP Tensile strength (MPa) Tensile elasticity Modulus (GPa) Cross-section (mm)
Profile A 395 25.1 55� 60� 5
Profile B 310 25.3 30� 40� 4
Profile C 350 25.6 50� 40� 5
Figure 6. Small-scale models of GFRP-polymer concrete hybrid beams.
Analysis of hybrid beams 151

in this model, was designed in order to support only compressive stresses in the elastic range.
The neutral axis was determined using a homogenization of the hybrid cross-section of the
GFRP material.
In order to prevent premature failure due to interface debonding, adhesion between GFRP
profiles and polymer concrete was improved through both mechanical and chemical pro-
cesses. Internal surfaces of GFRP profiles were previously sandpapered and a layer of silane
adhesion promoter was applied before concrete casting. In addition, in HB II specimens,
profile ‘B’ was bonded to profile ‘A’ with a special epoxy adhesive. In the first specimen’s
series, the resin of concrete that drained during casting process assured junction between
these two profiles.
For each hybrid model, three specimens were manufactured. All specimens, before being
tested, were allowed to cure for seven days at room temperature, and postcured at 80�C for
3 h.
Four-point bending tests on three specimens of each type of hybrid beams were per-
formed. The specimens were loaded with a span of 510 mm and a constant moment zone of
100 mm. Load was gradually increased up to failure at a rate of 1mm/min under dis-
placement control. Test procedures were identical to those applied to perform flexural tests
of first series of GFRP-polymer concrete hybrid beams. Four-point bending tests were also
performed to evaluate the synergetic effect of the assembly on each constituent material of
each hybrid beam.
4. Validation of model
For each type of beam, the average of maximum load capacity and the related synergetic effects
are summarized in Table 2. Synergetic effect was calculated by dividing the capacity load of the
assembly by the sum of capacity load of each of its two elements. In order to evaluate the
improvement of flexural strength reached through profiles surface treatment, experimental re-
sults obtained in first specimen’s series are also presented.
Load deflection curves, obtained from both 1st and 2nd test series of composite beams and
correspondent components, are illustrated in Figure 7. Numerical results obtained by finite
element modeling are also plotted.
Numerical predictions agree quite well with experimental. The accuracy of the model is very
good in most of the load range examined. At this stage, the model can predict with reasonable
accuracy the load–displacement curves. Near the ultimate load range, the model fails to predict
accurately due to difficulty in modeling complex failure modes, such as web shear failure,
buckling failure or bond failure.
Table 2. Summarized flexural tests results
Hybrid beam type Max. capacity load (kN) Synergetic effect (%)
1st series 2nd series 1st series 2nd series
HB I 38.07 46.30 233 284
HB II 26.96 43.09 203 319
HB III 32.06 32.96 258 266
152 M. Ferreira et al.
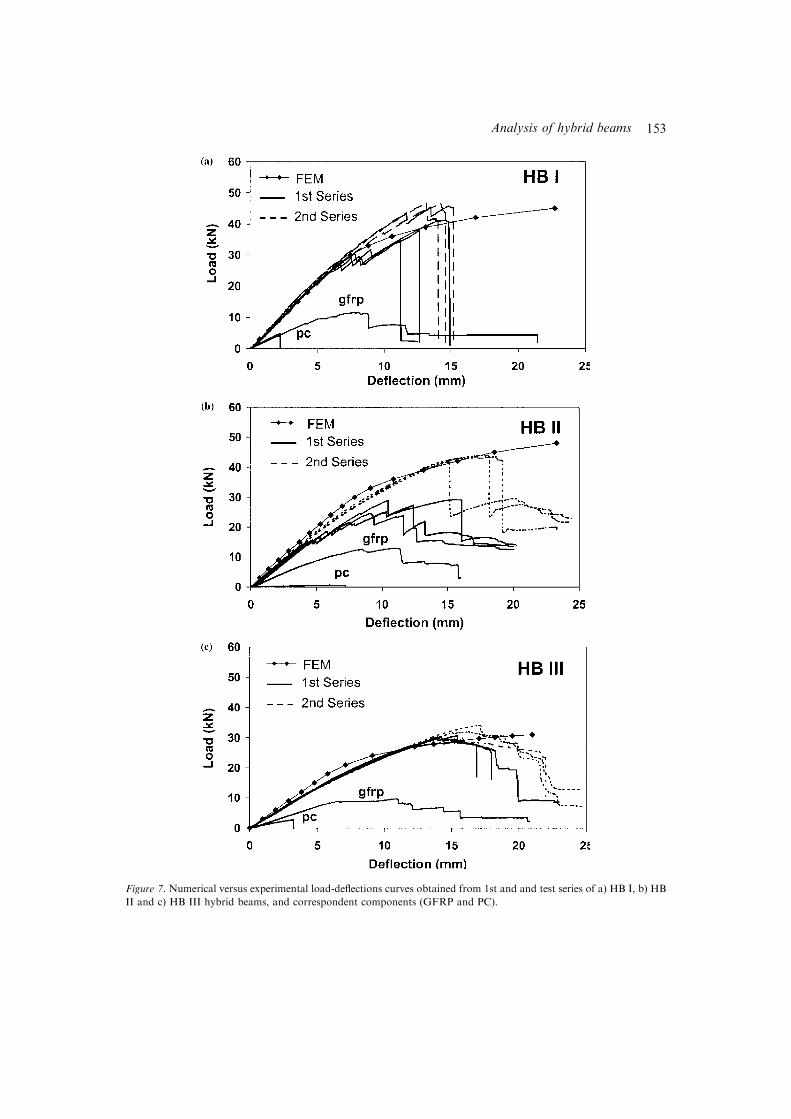
Figure 7. Numerical versus experimental load-deflections curves obtained from 1st and and test series of a) HB I, b) HB
II and c) HB III hybrid beams, and correspondent components (GFRP and PC).
Analysis of hybrid beams 153

5. Conclusions
Hybrid rectangular beams were designed, manufactured and tested. The assembly allows for a
critical combination of polymer concrete and composite pultruded materials. A better flexural
performance was reached with the improved interface bonding between material components.
This innovative design produces highly optimized behaviour with a pronounced synergetic
effect. The highest strength to mass ratio and the highest synergetic effect associated to HB II
beams, due to a more precise placement of material in stress zones, make this design model very
promising for further investigations on large-scale GFRP-polymer concrete hybrid beams.
The numerical model used for flexural behaviour analysis of hybrid systems was implemented
in a finite element code. The material and geometrical nonlinearity for reinforced concrete
strengthened with FRP composite materials was considered. The material model for concrete
was implemented using Ahmad’s degenerated shell element with a layered approach to account
for a laminated material organization through the shell thickness. The model predictions agree
reasonably well with the experimental results.
Acknowledgements
The support of Fundacao para a Ciencia e Tecnologia under POCTI/EME/42820/2001, ‘‘De-
senvolvimento de estruturas hıbridas betao polimerico/compositos’’ is gratefully acknowledged.
References
American Concrete Institute Committee 548, (1986), Guide for the Use of Polymers in Concrete, American Concrete
Institute, Detroit.
Ahmad, S., Irons, B. and Zienkiewicz, O.C. (1970). Analysis of thick and thin structures by curved finite elements,
International Journal for Numerical Methods in Engineering 2, 419–451.
Al-Salloum, Y.A.; Al-Sayed, S.H.; Almusallam, T.H. and Amjad, M.A., (1996), Evaluation of service load deflection for
beams reinforced by GFRP bars, 2nd Int. Conf. Adv. Composite Mat. in Bridges and Struc., Montreal, Canada,
pp. 165–172.
Bathe, K.-J, (1982). Finite Element Procedures in Engineering Analysis, Prentice-Hall.
Chawalwala, A.J, (1999). Material Characteristics of Polymer Concrete, M.S. Thesis, University of Delaware Center for
Composite Materials.
Deskovic, N., Meier, U. and Triantafillou, T. (1995). Innovative design of FRP combined with concrete: Short term
behaviour’’, Journal of Structural Engineering 121(7), 1069–1078.
Dikeou, J. (1986). Precast polymer concrete in the United States, 5th Int. Congress of Polymers in Concrete, Brighton,
England.
Ferreira, A.J.M. (1997). Numerical Models for the Analysis of Laminated Composite and Sandwich Structures, Ph.D.
Thesis, Faculdade de Engenharia da Universidade do Porto (in Portuguese).
Ferreira, A.J.M., Marques, A.T.M. and Sa, J.C. (2000). Analysis of reinforced concrete with external composite
strengthening, Composites: Part B, 31 (6–7), 527–534.
Ferreira, A.J.M., Camanho, P.P., Marques, A.T.M. and Fernandes, A.A. (2001). Modelling of concrete beams rein-
forced with frp re-bars, Composite Structures 53(1), 107–116.
Fowler, D.W. (1997). Structural design of polymer concrete, 3th Southern African Conference on Polymer in Concrete,
Johannesburg, South Africa.
Fowler, D.W. (1999). Polymer in concrete: a vision for the 21st century. Cement and concrete Composites 21, 449–452.
Hall, J.E. and Mottram, J.T. (1998). Combined FRP reinforcement and permanent formwork for concrete members,
Journal of Composites for Construction, ASCE 2(2), 78–86.
Kupfler, H., Hilsdorf, K.H. and Rush, H. (1969). Behaviour of concrete under biaxial stresses, Proceedings, American
Concrete Institute 66(8), 656–666.
154 M. Ferreira et al.

Mindlin, R.D. (1951). Influence of Rotary Inertia and Shear on Flexural Motions of Isotropic Elastic Plates. J. Appl.
Mech. 18(1), Trans. Asme 73, 31–38.
Mirmiran, A. (2001). Innovative combinations of FRP and traditional materials, Int. Conference on FRP Composites in
Civil Engineering (CICE-2001), Hong Kong, China, Vol. II, pp. 1289–1298.
Nawy, E.G. and Neuwert, G.E. (1977). Fiberglass reinforced concrete slabs and beams, J. Struct. Div., ASCE, 103(2),
421–440.
Owen, D.R.J. and Figueiras, J.A. 1984, Ultimate load analysis of reinforced concrete plates and shells, in Finite Element
Software for Plates and Shells, E. Hinton and D.R.J. Owen (Eds.), Pineridge Press.
Ribeiro, M.C.S., Tavares, C.M.L. and Ferreira, A.J.M. (2002). Chemical resistance of epoxy and polyester polymer
concrete to acids and salts, Journal of Polymer Engineering 22(1), 27–44.
Ribeiro, M.C.S. Ferreira, A.J.M. and Marques, A.T. (2001) Static flexural performance of gfrp-polymer concrete hybrid
beams, Int. Conference on FRP Composites in Civil Engineering (CICE-2001), Hong Kong, China, Vol. II, pp. 1355–
1362.
Saadmatmanesh, H. and Ehsani, M.R. (1991). Fiber composite bar for reinforced concrete construction, J. Compos.
Mat. 25(2), 188–203.
Sekijima, K., Ogisako, E., Miyata, K. and Hayashi, K. (2001). Analytical study on flexural behavior of GFRP-concrete
composite beam, Int. Conference on FRP Composites in Civil Engineering (CICE-2001), Hong Kong, China, Vol. II,
pp. 1363–1370.
Tavares, C.M., Ribeiro, M.C., Figueiredo, M., Ferreira, A.J.M. and Fernandes, A.A. (2000). Influence of material
parameters in the mechanical behaviour of polymer concrete, Mechanics and Materials in Design (MD3), S. Meguid
(ed.), Orlando, USA, pp. 239–240.
Tavares, C.M.L., Ribeiro, M.C.S. Ferreira, A.J.M. and Guedes, R.M. (2002). Creep behaviour of frp-reinforced
polymer concrete, Composite Structures 57, 47–51.
Zienkiewicz, O.C. (1991). The Finite Element Method, McGraw-Hill.
Analysis of hybrid beams 155

FLEXURAL BEHAVIOUR OF GFRP-POLYMER CONCRETE HYBRID STRUCTURAL SYSTEMS
M. C. S. RIBEIRO, A. J. M. FERREIRA AND A. T. MARQUES INEGl, Faculdade de Engenharia da Universidade do Porto
Rua do Barroco, 174-214, 4465-591, Leça do Balio, Portugal In this paper it is reported the development of a research work undertaken in hybrid structural systems, where GFRP pultruded profiles are assembled, in an innovative way, with a layer of polymer concrete. Several beams, with three different hybrid designs, were tested in four-point bending and the flexural behaviour of such structures was analyzed. Model designs produced a highly optimized flexural behaviour, with a pronounced synergetic effect. A new finite element model for gfrp-polymer concrete hybrid beams was also developed. Due to non-linearity of polymer concrete and the need to account for interaction aspects, a geometric and material nonlinear analysis was performed. A thick shell element was considered, incorporating a layered approach for laminated composite modeling.
INTRODUCTION
FRP-Polymer Concrete Hybrid Systems
In the last years, an innovative structural concept was developed involving the combination of FRP pultruded profiles with conventional cement concrete, to produce lightweight, corrosion-free and yet inexpensive hybrid systems 1, 2. According to this new concept, a FRP profile beam is combined with a concrete layer, cast onto the top flange, which replaces the thick FRP compressive flange of traditional pultruded profiles. The method maximizes system performance using materials by combination, and can be thought as a better way of producing structural members based on pultrusion process. In the last decade, FRP researchers have developed a number of hybrid systems, either by simply replacing steel with FRP pultruded profiles in conventional steel-concrete composite construction, or by developing new structural systems 3.
Following these studies, this paper presents the development of a research work undertaken with hybrid structures composed by GFRP profiles and polymer concrete. Polymer concrete is a mixture of mineral aggregates and a polymer binder in which the polymeric resin replaces the
1

2
Portland cement-water binder of hydraulic concrete. This type of concrete has very high compressive strength, good chemical resistance, and relatively low elasticity modulus 4, 5. Since the 50’s, when it was initially applied to produce synthetic marble, its applications have increased tremendously, mainly in the field of precast components for building industry 6, 7. Exploiting the better performances of resin concretes, it is believed that the potential of the hybrid systems can be improved:
(a) The higher compressive and flexural strength of polymer concrete allow a cross-section reduction and, therefore, a lightweight beam;
(b) The better chemical resistance enlarge the application field of these structural systems to highly corrosive environments;
(c) The faster curing time, early high strength and good workability of resin concrete make it suitable, either for production of precast components, either for an easier in site application.
In a previous investigation work 8, small-scale models of four different hybrid beams were designed, manufactured and tested in four-point bending test. Flexural behaviour of such composite structures, in terms of load-deflection history, load capacity and failure mode was analyzed and compared with the flexural behaviour of its material constituents. The four hybrid beams models were designed considering a GFRP pultrusion profile that works in tension, and an epoxy polymer concrete filling, that works mainly in compression. Experimental results showed the high potential of these hybrid systems, reveling a pronounced synergetic effect associated to the assembly of polymer concrete and GFRP profiles. However, some technical problems were detected. Interface debonding promoted premature failure, hindering the maximum of load bearing capacity to be reached. Further studies were necessary in order to improve bond strength between polymer concrete and GFRP profiles.
In this paper it is reported some new experiments done on GFRP-polymer concrete hybrid beams, with improved adherence between material components. Three new series of small-scale hybrid beam specimens were manufactured and tested in bending. A special treatment was given to GFRP profile internal surfaces to promote the adhesion to epoxy polymer concrete. A significant improvement on flexural performance of the hybrid beams was reached.
Numerical Modelling
Past studies showed that cracking, deflection and ultimate load behaviour of FRP-reinforced concrete beams could be predicted with the same degree of accuracy as the behaviour of regular steel reinforced concrete beams, and
3
that a theoretical correlation is therefore possible 9. Theriault and Benmokrane 10 proposed alternative formulas for prediction of deflection. They concluded that usual formulas for such prediction were misleading. Most of these previous studies are related to concrete beams. Very few studies of FRP reinforced plates or shells have been proposed, if any.
The present work reports a numerical model for the analysis of concrete arbitrary shell structures reinforced with composite materials, particularly with FRP pultruded materials. The proposed model is capable of predicting deflections and stresses in concrete and in FRP reinforcement, for geometrical and material non-linear behaviour. The model includes constitutive laws for concrete material, based on smeared crack concepts and is applicable for high-strength composite materials. The model is implemented in a degenerated shell element as proposed by Ahmad et al.11, Owen and Figueiras 12, and more recently by Ferreira and Barbosa 13. In order to check the model capacities, the model was applied to predict the flexural behaviour of GFRP-polymer concrete hybrid beams. A good agreement between experimental and numerical results was found. The tests were only performed in beams, but the model is generally applicable to plates or shells of arbitrary shape.
EXPERIMENTAL PROGRAM
Component Materials
Low viscosity epoxy resin, and foundry sand with a very uniform and fine grain (d50 of 342 microns) were used for the polymer concrete mixture. Resin content, without charge, was 20% in weight. This formulation corresponds to an optimized result from previous research 5, 14, and its mechanical properties are already known. Compressive strength and compression elasticity modulus are 82 MPa and 11.5 GPa, respectively; with ultimate strain defined to be equal to 0.01. Compression properties were obtained from uniaxial testing according to RILEM TC-113 standards.
Three types of standard U-shaped GFRP pultruded profiles were used. The pultrusion profiles consisted of continuous strand mat and roving of glass fibers, impregnated with unsaturated polyester resin and having an external veil pulled through a die. Volume content of glass fibers was 50% to 55%, and roving occupied the most part of it. The GFRP profiles cross-section dimensions and mechanical properties, obtained from uniaxial tension tests according ISO-527/4 standard, are summarized in Table 1.

4
Table 1. Dimensions and mechanical properties of GFRP profiles
GFRP Tensile Strength (Mpa)
Tensile Elasticity Modulus (GPa)
Cross Section (mm)
Profile A 395 25.1 55 * 60 * 5 Profile B 310 25.3 30 * 40 * 4 Profile C 350 25.6 50 * 40 * 5
Hybrid Beams: Design and Manufacturing
Among the four models of hybrid beams initially designed, only three models, - those that showed better flexural performance in first test series-, were chosen for this experimental program. Cross-sections of the three models, hereinafter referred as HB I, HB II and HB III, are illustrated in Figure 1. All the small-scale models were 600 mm length.
Gfrp A+BGfrp CGfrp A
HB IIHB IIIHB I
Figure 1. Small scale models of GFRP-polymer concrete hybrid beams analyzed.
HB I and HB III beams have all the section full of concrete, with the profiles behaving, simultaneously, as reinforcement and as permanent formwork. HB II type beam is lighter, with only a thin layer of concrete positioned in the upper part of the profile. Cross-section of concrete layer, in this model, was designed in order to support only compressive stresses in the elastic range. Neutral axis was determined through the homogenization of the hybrid cross-section on GFRP material.
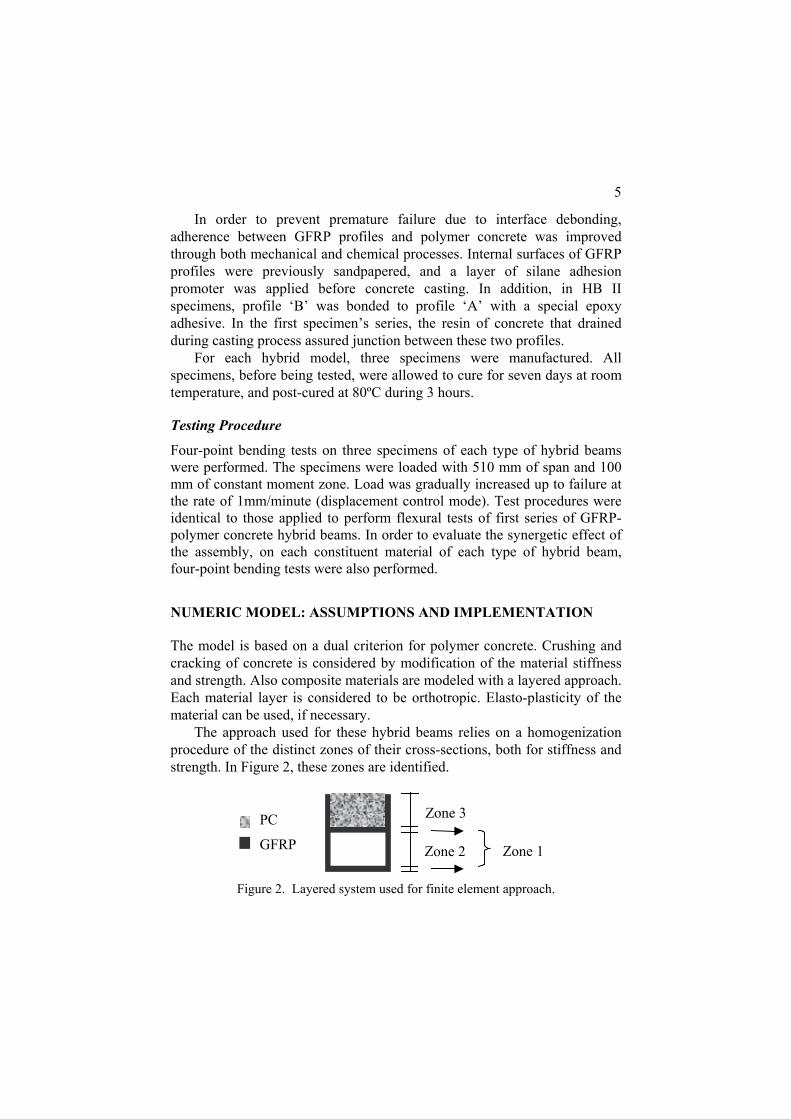
5
In order to prevent premature failure due to interface debonding, adherence between GFRP profiles and polymer concrete was improved through both mechanical and chemical processes. Internal surfaces of GFRP profiles were previously sandpapered, and a layer of silane adhesion promoter was applied before concrete casting. In addition, in HB II specimens, profile ‘B’ was bonded to profile ‘A’ with a special epoxy adhesive. In the first specimen’s series, the resin of concrete that drained during casting process assured junction between these two profiles.
For each hybrid model, three specimens were manufactured. All specimens, before being tested, were allowed to cure for seven days at room temperature, and post-cured at 80ºC during 3 hours.
Testing Procedure
Four-point bending tests on three specimens of each type of hybrid beams were performed. The specimens were loaded with 510 mm of span and 100 mm of constant moment zone. Load was gradually increased up to failure at the rate of 1mm/minute (displacement control mode). Test procedures were identical to those applied to perform flexural tests of first series of GFRP-polymer concrete hybrid beams. In order to evaluate the synergetic effect of the assembly, on each constituent material of each type of hybrid beam, four-point bending tests were also performed.
NUMERIC MODEL: ASSUMPTIONS AND IMPLEMENTATION
The model is based on a dual criterion for polymer concrete. Crushing and cracking of concrete is considered by modification of the material stiffness and strength. Also composite materials are modeled with a layered approach. Each material layer is considered to be orthotropic. Elasto-plasticity of the material can be used, if necessary.
The approach used for these hybrid beams relies on a homogenization procedure of the distinct zones of their cross-sections, both for stiffness and strength. In Figure 2, these zones are identified.
PC
GFRP
Zone 3
Zone 1 Zone 2
Figure 2. Layered system used for finite element approach.

6
In zone 1, the equivalent material is considered to be a composite laminate only. Therefore, a typical FRP material formulation is considered 13, 15.
In zone 2, FRP walls are taken in account. Due to the shell formulation, an equivalent material in stiffness and strength is considered.
In zone 3, a combination of FRP and polymer concrete occurs. In this case, it is assumed that no contribution is given by FRP walls to support compressive solicitations. Therefore, compressive strength of the assembly layer is the compressive strength of the concrete, while tensile strength and elasticity modulus follows a law of mixtures:
Λeq = ( ΛPC. λ PC + ΛFRP. λFRP ) / λTOT (1)
where ΛPC, ΛFRP = stength or stiffness, of polymer concrete and FRP material, respectively; Λeq = equivalent strength or stiffness of the layer; λPC,λFRP = thickness of polymer concrete and FRP material in the layer, respectively; λTOT = total thickness of the layer.
EXPERIMENTAL VERSUS NUMERICAL RESULTS
For each type of beam, the average of maximum load capacity and the related synergetic effects are summarized in Table 2. Synergetic effect was calculated by dividing the capacity load of the assembly by the sum of capacity load of each of its two elements. In order to evaluate the improvement of flexural strength reached through profiles surface treatment, experimental results obtained in first specimen’s series are also presented.
Table 2. Summarized flexural tests results
Max. Capacity Load (kN) Synergetic Effect (%) Hybrid Beam Type 1st Series 2nd Series 1st Series 2nd Series
HB I 38.07 46.30 233 284 HB II 26.96 43.09 203 319 HB III 32.06 32.96 258 266
Load deflection curves, obtained from both 1st and 2nd test series of
composite beams and correspondent components, are illustrated in Figure 3. Numerical results obtained by finite element modeling are also plotted.

7
0
10
20
30
40
50
60
0 5 10 15 20 25Deflection (mm)
Load
(kN
)
HB IFEM
gfrp
pc
1ªSeries
2ªSeries
0
10
20
30
40
50
60
0 5 10 15 20 25Deflection (mm)
Load
(kN
)
HB II 2ªSeries
1ªSeries
FEM
gfrp
pc
0
10
20
30
40
50
0 5 10 15 20 25Deflection (mm)
Load
(kN
)
HB III
1ªSeries
2ªSeriesFEM
gfrp
pc
Figure 3. Numerical versus experimental load-deflections curves obtained from 1st and 2nd test series of hybrid beams, and correspondent components (GFRP and PC).
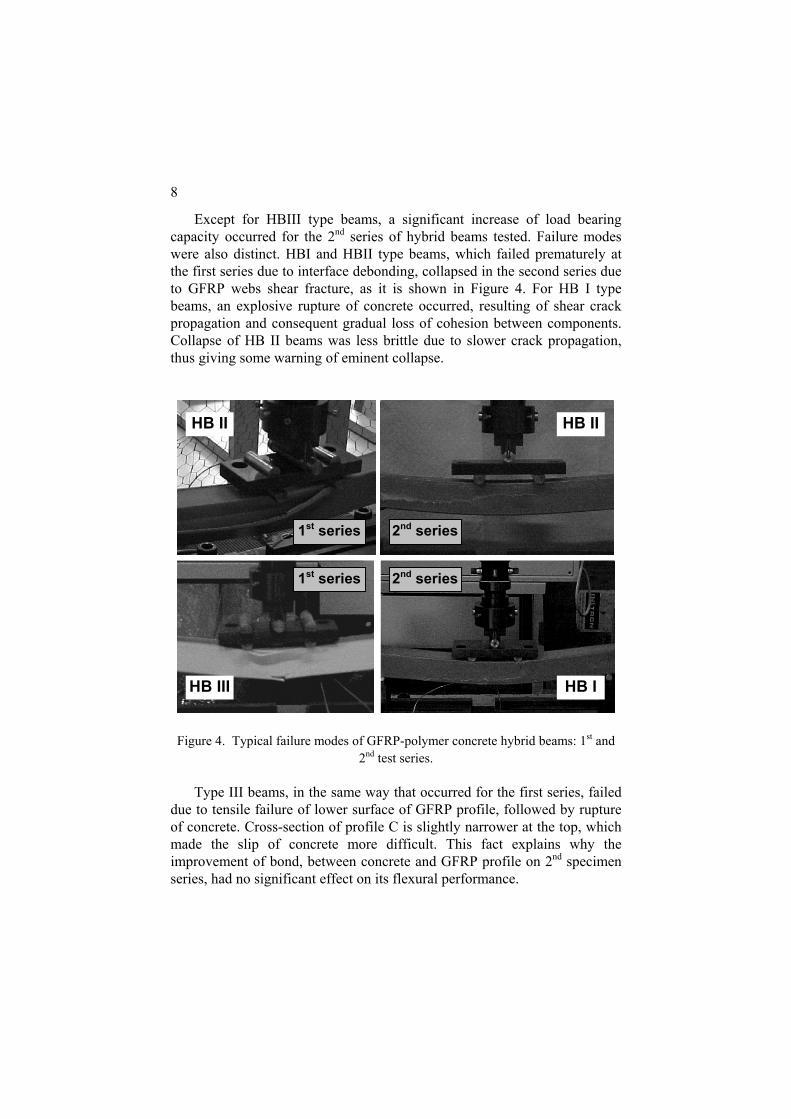
8
Except for HBIII type beams, a significant increase of load bearing capacity occurred for the 2nd series of hybrid beams tested. Failure modes were also distinct. HBI and HBII type beams, which failed prematurely at the first series due to interface debonding, collapsed in the second series due to GFRP webs shear fracture, as it is shown in Figure 4. For HB I type beams, an explosive rupture of concrete occurred, resulting of shear crack propagation and consequent gradual loss of cohesion between components. Collapse of HB II beams was less brittle due to slower crack propagation, thus giving some warning of eminent collapse.
HB II HB II
HB III HB I
1st series
1st series
2nd series
2nd series
Figure 4. Typical failure modes of GFRP-polymer concrete hybrid beams: 1st and
2nd test series. Type III beams, in the same way that occurred for the first series, failed
due to tensile failure of lower surface of GFRP profile, followed by rupture of concrete. Cross-section of profile C is slightly narrower at the top, which made the slip of concrete more difficult. This fact explains why the improvement of bond, between concrete and GFRP profile on 2nd specimen series, had no significant effect on its flexural performance.

9
Numerical results agree quite well with experimental results, according to the modeling hypothesis. At this stage, the model can already predict with reasonable accuracy the load-displacement curves. Although predicted initial stiffness and failure loads are reasonably modeled, the model has still to be improved to account for web shear failure and other failure mechanisms.
CONCLUSIONS
Hybrid rectangular beams were designed, manufactured and tested. The assembly allows for a critical combination of polymer concrete and composite pultruded materials. A better flexural performance was reached with the improved interface bonding between material components. This innovative design produces highly optimized behaviour with a pronounced synergetic effect. The highest strength to weight ratio and the highest synergetic effect associated to HB II beams, due to a more precise placement of material in stress zones, make this design model very promising for further investigations on large scale GFRP-polymer concrete hybrid beams.
The numerical model used for flexural behaviour analysis of hybrid systems was implemented in a finite element code. The model predicts with very reasonable accuracy the load-displacement curves for all tested type beams. This model is still in progress. The results so far allow for a very interesting expectation in terms of a finite element code for the analysis of this kind of hybrid systems.
ACKNOWLEDGMENTS
The support of Fundação para a Ciência e Tecnologia under POCTI/EME/42820/2001, ‘Desenvolvimento de estruturas híbridas betão polimérico/compósitos’ is gratefully acknowledged.
REFERENCES
1. Deskovic, N.; Meier, U. and Triantafillou, T., “Innovative design of FRP combined with concrete: Short term behaviour”, Journal of Structural Engineering, July (1995), pp. 1069-1078.
2. Hall, J.E. and Mottram, J.T., “Combined FRP reinforcement and permanent formwork for concrete members”, Journal of Composites for Construction, ASCE, 2(2), (1998), pp.78-86.

10
3. Mirmiran, A., “Innovative combinations of FRP and traditional materials”, Int. Conference on FRP Composites in Civil Engineering (CICE-2001), Hong Kong, China, December 12-15, 2001, Vol. II, pp. 1289-1298.
4. Chawalwala, A.J., “Material characteristics of polymer concrete”, M.S. Thesis, University of Delaware Center for Composite Materials, 1999.
5. Ribeiro, M.C.S.; Tavares, C.M.L. and Ferreira, A.J.M., “Chemical resistance of epoxy and polyester polymer concrete to acids and salts”, Journal of Polymer Engineering, 22(1), 2002, pp. 27-44.
6. Fowler, D.W., “Polymer in concrete: a vision for the 21st century”, Cement & Concrete Composites, 21 (1999), pp 449-452.
7. Dikeou, J., “Precast polymer concrete in the United States”, 5th Int. Congress of Polymers in Concrete, Brighton, England, 1986.
8. Ribeiro, M.C.S., Ferreira, A.J.M. and Marques, A.T., “Static flexural performance of gfrp-polymer concrete hybrid beams”, Int. Conference on FRP Composites in Civil Engineering (CICE-2001), Hong Kong, China, December 12-15, 2001, Vol.II, pp. 1355-1362.
9. Saadmatmanesh, H. and Ehsani, M.R., “Fiber composite bar for reinforced concrete construction”, J. Compos. Mat., 25 (2), 1991, pp.188-203.
10. Theriault, M. and Benmokrane, B., “Effects of FRP reinforcement ratio and concrete strength on flexural behaviour of concrete beams”, Journal of Composites for Construction, 2 (1), 1988, pp.7-16.
11. Ahmad, S., Irons, B. and Zienkiewicz, O.C., “Analysis of thick and thin structures by curved finite elements”, Int. J. Num. Meth.Engng., 2 (1970), pp. 419-451.
12. Owen, D.R.J. and Figueiras, J.A., Ultimate load analysis of reinforced concrete plates and shells, in Finite Element Software for Plates and Shells, E. Hinton and D.R.J. Owen (Eds.), Pineridge Press, 1984.
13. Ferreira, A.J.M. and Barbosa, J.T., “Buckling behaviour of composite shells”, Composite Structures, 50 (2000), pp.93-98.
14. Tavares, C.M.L.; Ribeiro, M.C.S.; Ferreira, A.J.M. and Guedes, R.M., “Creep behaviour of frp-reinforced polymer concrete”, Composite Structures, 57 (2002), pp. 47-51.
15. Ferreira, A.J.M.; Camanho, P.P.; Marques, A.T.M. and Fernandes, A.A., “Modelling of concrete beams reinforced with frp re-bars”, Composite structures, 53(1), 2001, pp. 107-116.

Composites in Construction 2005 – Third International Conference, Hamelin et al (eds) © 2005 ISBN xxxxx Lyon, France, July 11 – 13, 2005
1
DEVELOPMENT OF COMPOSITE HYBRID STRUCTURES BASED ON POLYMER CONCRETE – GFRP PULTRUSION PROFILES ASSEMBLY SYSTEM
M.C.S. Ribeiro, A.J.M. Ferreira and A.T. Marques
INEGI – FEUP – Faculty of Engineering of University of Porto Rua Roberto Frias, s/n, 4200-465, Porto, Portugal
[email protected] [email protected] [email protected]
ABSTRACT: In this paper, the development of a research work undertaken in hybrid structural systems, where GFRP pultruded profiles are assembled with a layer of polymer concrete (PC), is reported. PC is a material where a thermoset resin binds together natural or artificial aggregates. The main advantages of polymer or resin concrete over ordinary Portland cement concrete are higher mechanical strength, lower permeability and improved chemical resistance. The combination of PC with GFRP composite materials can profit from the best characteristics of each class of materials. Small-scale beams, with two different hybrid designs (reinforced and un-reinforced for shear), were tested on four-point bending and the flexural behaviour of such structures was analysed. Model designs were made considering an h-shape pultrusion profile that will work mainly in tension, and a u-channel profile, filled with a high strength epoxy PC, that will work in compression. Experimental results showed the high potential of this new concept, which leads to a pronounced synergistic effect due to an optimal combination of materials.
1. INTRODUCTION
One of the most effective uses of FRP is in the form of composite or hybrid construction with concrete, in which the FRP is the load-carrying partner and protective measure for concrete. The main advantage of such system lies in the optimal use of materials based on their mechanical properties and resistance to corrosive environments [1]. In the last decade, FRP researchers have developed a number of hybrid systems, either by replacing steel with FRP profiles in conventional steel-concrete composite construction, or by developing new structural systems [1-4]. Following these studies, this paper presents the development of hybrid structures composed by GFRP profiles and epoxy PC. PC is a mixture of mineral aggregates and a polymer binder, in which the resin replaces the Portland cement-water binder of hydraulic concrete. PC has very high compressive strength, good chemical resistance and relatively low elasticity modulus [5,6]. Since the 50’s, when it was initially applied to produce synthetic marble, its applications have increased tremendously, mainly in the field of precast components for building industry [7]. Exploiting the better performances of resin concretes, it is believed that the potential of the hybrid systems can be improved: • The higher compressive and flexural strength of PC allow a cross-section reduction and, therefore,
a lightweight structure; • The better chemical resistance extends the application field of these structural systems to highly
corrosive environments; • The problem of alkalis attack of glass fibres by the concrete is avoided; • The shorter curing time, early high strength and good workability of resin concrete make it suitable,
either for precast components or for an easier in site application. Small-scale models, with two different model designs, were manufactured and tested in bending. Model designs considered an h-shape pultrusion profile working mainly in tension, and a u-channel
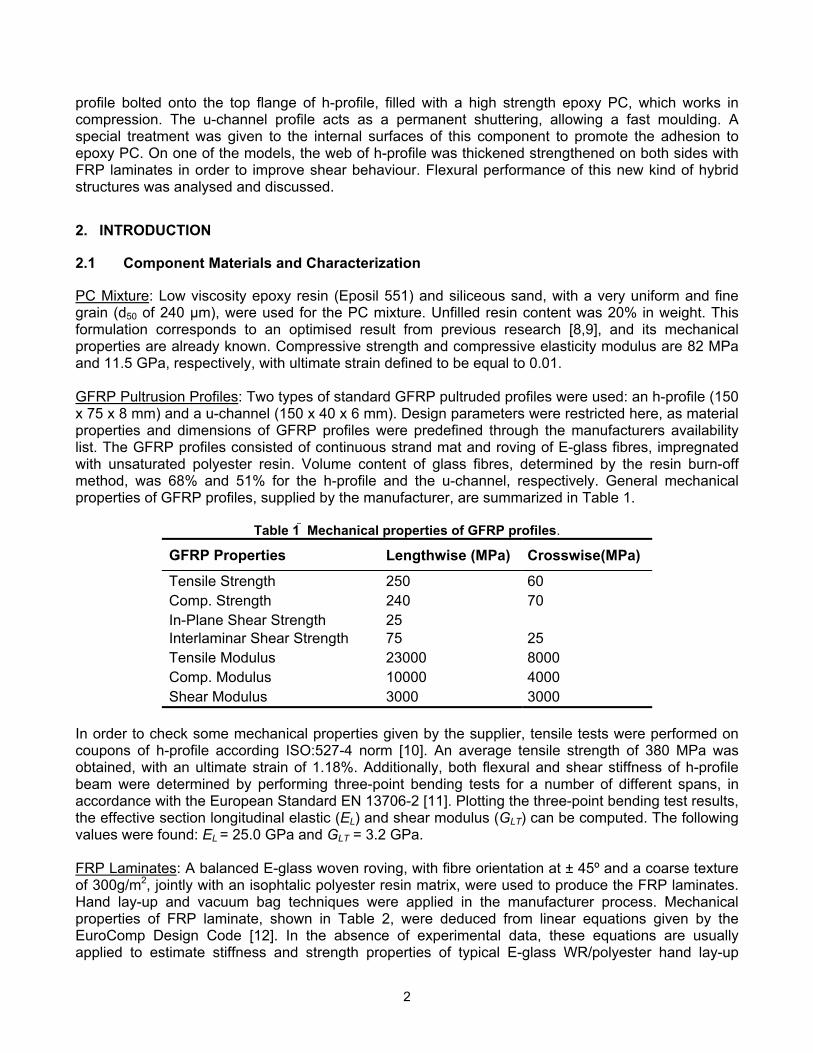
2
profile bolted onto the top flange of h-profile, filled with a high strength epoxy PC, which works in compression. The u-channel profile acts as a permanent shuttering, allowing a fast moulding. A special treatment was given to the internal surfaces of this component to promote the adhesion to epoxy PC. On one of the models, the web of h-profile was thickened strengthened on both sides with FRP laminates in order to improve shear behaviour. Flexural performance of this new kind of hybrid structures was analysed and discussed.
2. INTRODUCTION
2.1 Component Materials and Characterization
PC Mixture: Low viscosity epoxy resin (Eposil 551) and siliceous sand, with a very uniform and fine grain (d50 of 240 µm), were used for the PC mixture. Unfilled resin content was 20% in weight. This formulation corresponds to an optimised result from previous research [8,9], and its mechanical properties are already known. Compressive strength and compressive elasticity modulus are 82 MPa and 11.5 GPa, respectively, with ultimate strain defined to be equal to 0.01. GFRP Pultrusion Profiles: Two types of standard GFRP pultruded profiles were used: an h-profile (150 x 75 x 8 mm) and a u-channel (150 x 40 x 6 mm). Design parameters were restricted here, as material properties and dimensions of GFRP profiles were predefined through the manufacturers availability list. The GFRP profiles consisted of continuous strand mat and roving of E-glass fibres, impregnated with unsaturated polyester resin. Volume content of glass fibres, determined by the resin burn-off method, was 68% and 51% for the h-profile and the u-channel, respectively. General mechanical properties of GFRP profiles, supplied by the manufacturer, are summarized in Table 1.
Table 1 Mechanical properties of GFRP profiles.
GFRP Properties Lengthwise (MPa) Crosswise(MPa)
Tensile Strength 250 60 Comp. Strength 240 70 In-Plane Shear Strength Interlaminar Shear Strength
25 75
25
Tensile Modulus 23000 8000 Comp. Modulus 10000 4000 Shear Modulus 3000 3000
In order to check some mechanical properties given by the supplier, tensile tests were performed on coupons of h-profile according ISO:527-4 norm [10]. An average tensile strength of 380 MPa was obtained, with an ultimate strain of 1.18%. Additionally, both flexural and shear stiffness of h-profile beam were determined by performing three-point bending tests for a number of different spans, in accordance with the European Standard EN 13706-2 [11]. Plotting the three-point bending test results, the effective section longitudinal elastic (EL) and shear modulus (GLT) can be computed. The following values were found: EL = 25.0 GPa and GLT = 3.2 GPa. FRP Laminates: A balanced E-glass woven roving, with fibre orientation at ± 45º and a coarse texture of 300g/m2, jointly with an isophtalic polyester resin matrix, were used to produce the FRP laminates. Hand lay-up and vacuum bag techniques were applied in the manufacturer process. Mechanical properties of FRP laminate, shown in Table 2, were deduced from linear equations given by the EuroComp Design Code [12]. In the absence of experimental data, these equations are usually applied to estimate stiffness and strength properties of typical E-glass WR/polyester hand lay-up

3
systems. In order to determine accurate values for shear strength and shear modulus, posterior in-plane shear tests were performed on coupons of FRP laminate according ASTM D3518M [13].
Table 2 Mechanical properties of FRP laminates
Properties Estimated values (MPa) Experimental values (MPa)
Tensile Strength 54.6 – 111.6 - In-plane Shear Strength 42.8 40.5 Tensile Modulus 6200 - 10200 - Shear Modulus 3600 1900
2.2 Hybrid Beams Manufacturing
The two 1.5 m length beams (HB1 and HB2) were manufacture by stages: a) Preparation of GFRP profile surfaces; b) Application of FRP plate reinforcements on web of h-profile; c) Assembly of u-channel profiles with h-section beams; d) Casting of PC into u-channels and curing. Details of all these steps are detailed in the next paragraphs. a) Internal surfaces of u-channel profiles were previously brushed and sandpapered in order to remove the resin surface veil, and hence, to promote adhesion to PC. In addition, a layer of silane adhesion promoter (2% Silane A174 aqueous solution) was applied before concrete casting. Web surfaces of h-profile corresponding to shear reinforced beam also received the same treatment. b) FRP laminates for web shear reinforcement were directed moulded onto the web surfaces of h-profile using hand lay-up and vacuum bag moulding techniques. Only one of the beams was reinforced, herein designated by HB2. Both shear spans on both sides of the web were reinforced, one side at a time. The positioning and dimensions of FRP laminates are shown in Fig. 1. A rubber dam-like sealing line was initially applied around the area where the laminates were to be applied, to form a seal for the vacuum bagging process (Fig. 2a). A layer of unsaturated polyester resin was then applied with a brush, after which the first layers of woven roving were laid down, one on each shear span (Fig. 2b). The woven roving was impregnated with further resin and then rolled with a ‘split washer’ roller to consolidate the laminate and remove entrapped air (Fig. 2c and 2d). The second layers of fibre reinforcement were applied and the above steps were repeated. A porous release fabric and a bleeder/breather layer were finally applied to the lay-up, to allow the air and the excess of resin to be drawn from the laminate when the vacuum (0.2 bar) is applied. A vacuum bag material was then placed over the laminate, sealed down, and the vacuum was applied during 30 minutes (Fig. 2e). The laminate was cured at room temperature during 48 hours and then post cured at 80ºC, after concrete casting, during 5 hours. Laminates with a final thickness of 1mm were obtained. c) The fastener connection between u-channels and h-profiles was attained through bolted mechanical joints. A methacrylate adhesive was initially applied in the joint surfaces to seal the assembled parts. Two rows of 8 mm diameters bolts, at a uniform spacing of 85 mm throughout the span, were applied. The height of the bolts inside PC was 20 mm. At loading points, spacing between bolts was reduced and, furthermore, four 3 mm thick wood stiffeners were mounted on both sides of the web. Dimensions and cross-section of hybrid beams are also illustrated in Fig. 1. d) After the assembly of the pultruded beams, mixing and casting process PC took place. Epoxy resin was initially mixed with the hardener, poured into an automatic mixer together with the sand aggregates, which had been previously dried, and the paste was thoroughly mixed until the aggregates were fully ‘wetted’. PC was then directly cast into the u-channel profiles. Additionally, six control prismatic specimens (40 x 40 x 160 mm) were also cast. Hybrid beams and control specimens were allowed to cure at room temperature during 24 hours, before being submitted to thermal treatment in an autoclave (5 hours at 80ºC). Final weight of the hybrid beams per unit length was 152.2 N/m and 153.7 N/m, respectively for the HB1 and HB2 test specimens.

4
Figure 1 – Dimensions and cross-section of hybrid beams (not at scale). Positioning of FRP laminates (HB2).
Figure 2 – Main steps of manufacturing process of FRP laminates for shear reinforcement.
Figure 3 – aspect of HB2 composite beam after curing of PC. Test set-up used for bending tests.
40 mm 85mm
a) b)
c) d)
e)
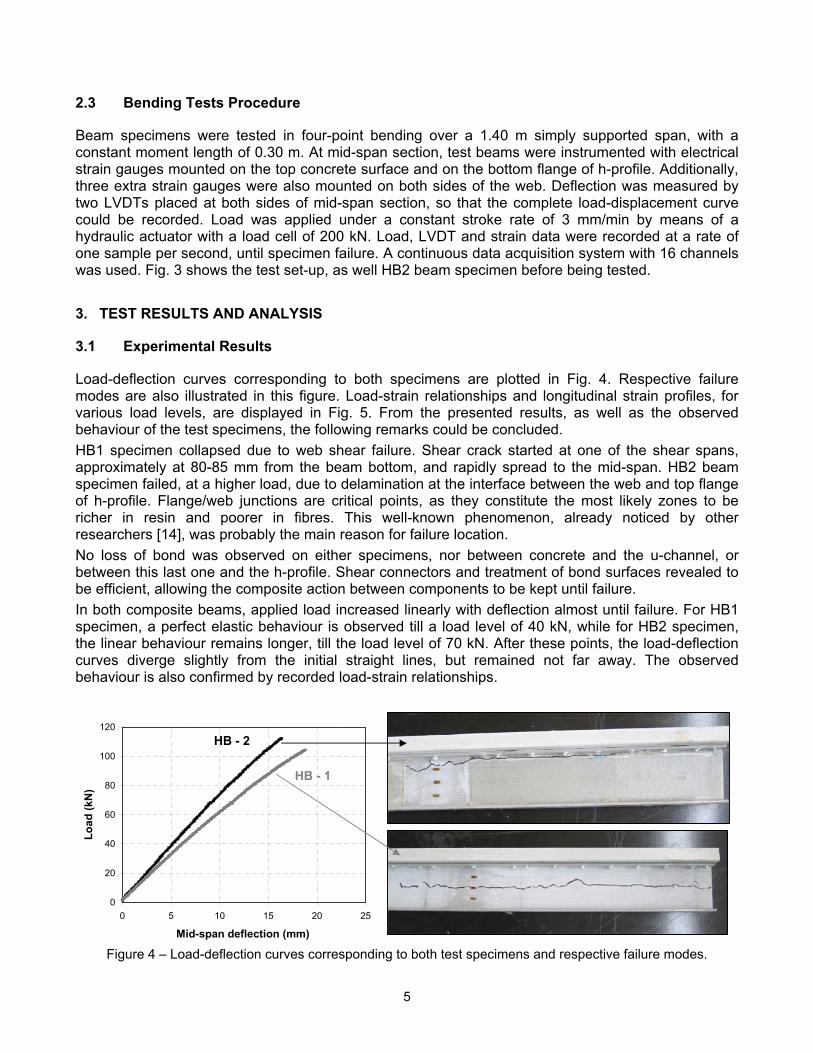
5
2.3 Bending Tests Procedure
Beam specimens were tested in four-point bending over a 1.40 m simply supported span, with a constant moment length of 0.30 m. At mid-span section, test beams were instrumented with electrical strain gauges mounted on the top concrete surface and on the bottom flange of h-profile. Additionally, three extra strain gauges were also mounted on both sides of the web. Deflection was measured by two LVDTs placed at both sides of mid-span section, so that the complete load-displacement curve could be recorded. Load was applied under a constant stroke rate of 3 mm/min by means of a hydraulic actuator with a load cell of 200 kN. Load, LVDT and strain data were recorded at a rate of one sample per second, until specimen failure. A continuous data acquisition system with 16 channels was used. Fig. 3 shows the test set-up, as well HB2 beam specimen before being tested.
3. TEST RESULTS AND ANALYSIS
3.1 Experimental Results
Load-deflection curves corresponding to both specimens are plotted in Fig. 4. Respective failure modes are also illustrated in this figure. Load-strain relationships and longitudinal strain profiles, for various load levels, are displayed in Fig. 5. From the presented results, as well as the observed behaviour of the test specimens, the following remarks could be concluded. HB1 specimen collapsed due to web shear failure. Shear crack started at one of the shear spans, approximately at 80-85 mm from the beam bottom, and rapidly spread to the mid-span. HB2 beam specimen failed, at a higher load, due to delamination at the interface between the web and top flange of h-profile. Flange/web junctions are critical points, as they constitute the most likely zones to be richer in resin and poorer in fibres. This well-known phenomenon, already noticed by other researchers [14], was probably the main reason for failure location. No loss of bond was observed on either specimens, nor between concrete and the u-channel, or between this last one and the h-profile. Shear connectors and treatment of bond surfaces revealed to be efficient, allowing the composite action between components to be kept until failure. In both composite beams, applied load increased linearly with deflection almost until failure. For HB1 specimen, a perfect elastic behaviour is observed till a load level of 40 kN, while for HB2 specimen, the linear behaviour remains longer, till the load level of 70 kN. After these points, the load-deflection curves diverge slightly from the initial straight lines, but remained not far away. The observed behaviour is also confirmed by recorded load-strain relationships.
Figure 4 – Load-deflection curves corresponding to both test specimens and respective failure modes.
0
20
40
60
80
100
120
0 5 10 15 20 25
Mid-span deflection (mm)
Load
(kN
)
HB - 2
HB - 1

6
Figure 5 – Load-strain relationships and longitudinal strain profiles at mid-span section.
At all loading stages, the web shear reinforced beam, HB2, is stiffer than the un-reinforced one, HB1. This is due to the composite action between the FRP laminates and the h-profile, which improved the strength and the stiffness of the beam. This is also confirmed by load-strain curves. This reduction in strain, corresponding to a higher load capacity, arises from the already mentioned composite action. In both specimens, the neutral axis remains practically at the same location (at the web of h-profile near the upper flange), until failure took place. 3.2 Analytical Analysis
The hybrid section loaded in bending can fail in a number of possible ways. However, the theoretical analysis herein presented only considers two failure modes: flexural failure and web shear failure. In the analytical analysis the following assumptions were considered: • Navier-Bernouilli hypothesis is assumed; • Material behaviour of both FRPs (pultrusion profiles and laminates) is assumed to be linear elastic
up to failure, while for PC, the non-linearity is considered for compressive strains beyond 5‰; • Flexural failure prediction is defined by the maximum strain criterion (10‰ for both PC and GFRP) • Shear connectors provide both a complete shear interaction and a full shear connection. • A perfect bond is assumed between FRP laminate and the web of h-profile. Flexural Failure Analysis: Hybrid beam sections were homogenised with respect to the stiffness of GFRP profile Egfrp.(25 GPa) This methodology allowed a simplified calculation of the neutral axis position and the value of second moment of area. The ultimate flexural capacity was dependent on the two possible failure modes: PC crushing due to compression or tensile fracture of GFRP profile flange. However, attending to both estimated position of neutral axis and strain compatibility equations, failure due to PC crushing was eliminated. Hence, flexural capacity was calculated assuming GFRP tensile fracture. A triangular stress block was assumed under the constraint that PC was still working in the elastic zone. Contribution of u-channel’s walls was ignored in the theoretical analysis. The effective depth of neutral axis was then established from internal force equilibrium and strain compatibility equations, using an iterative process. Finally, ultimate flexural capacity was given by the moment equilibrium equation. FRP laminate properties were taken into account on the theoretical analysis of HB2 beam, through its homogenisation on GFRP material and considering the web of h-profile with an equivalent thickness. Obtained results are presented in Table 4.
0
20
40
60
80
100
120
140
160
180
200
-4000 -2000 0 2000 4000 6000 8000Micro strains (HB-1 beam)
Bea
m d
epth
(mm
)
15 kN30 kN60 kN90 kNMax. Load
Top of Concrete
Bottom of Flange
Web 1
Web 2
Web 3
0
20
40
60
80
100
120
140
160
180
200
-4000 -2000 0 2000 4000 6000 8000Micro strains (HB-2 beam)
15 kN30 kN60 kN90 kNMax. Load
Top of Concrete
Bottom of Flange
Web 1
Web 2
Web 3

7
Web Shear Failure Analysis: As the neutral axis lies within the web, maximum shear stress occurs at the neutral axis level. Maximum shear stress in the web may be taken, approximately, to be equal to 1.5 times the average shear stress. Shear fracture occurs when the maximum shear stress equals the shear strength of the webs. EuroComp Design Code recommends that the in-plane shear strength should be considered to characterize web shear strength of pultrusion profiles. However, resin burn-off process showed that continuous strand mat layers in the web of h-profile were insignificant when compared to roving. Moreover, E-glass roving arrangement in the web could be considered as preferentially positioned by longitudinal layers perpendicular to the load plan. Under this point of view, it seems to be more reasonable to consider the interlaminar shear strength of h-profile as the effective shear resistance of the web, instead of the in-plane shear strength. Attending to the above, during the analytical analysis, the interlaminar shear strength of h-profile was considered to estimate the shear load capacity. Obtained results are also shown in Table 4. Web shear strength of reinforced beam ( τ comp ) was determined considering a simple weighed average of shear strengths for both materials involved (FRP laminate and web of h-profile) by the respective thickness (t i), as showed by the following equation:
τ + ττ =
+lam lam web web
complam web
t tt t
(1)
where τ lam is the experimentally determined in-plane shear strength of FRP laminate; τ web is the web shear strength of h-profile; and lamt , webt are the respective thickness.
Table 4. Analytical results versus experimental results. Neutral Axis Deptha (mm)
Ultimate Moment (kN.m) Failure mode Beam
Type Anal. Exp. Anal. Flb Anal. Sh c Exp. Pred. Exp.
HB 1 124.9 125.2 38.50 27.51 28.32 Web shear failure Web shear failure
HB 2 124.5 124.0 39.05 31.49 31.08 Web shear failure Web/flange junction shear failure
a) Measured from beam bottom; b) Bottom flange tensile failure; c) Web shear failure Theoretical versus Experimental Results: Being aware of the lack of knowledge on result’s reproducibility, due to the reduced number of tested specimens, as well as the difficulty in controlling GFRP properties, the analysis of obtained results will be generic. A very good agreement was found between analytical and experimental values. The analytical method seems to be efficient in predicting failure mode and ultimate capacity load of hybrid composite beams. The use of interlaminar shear strength as the effective shear resistance of the web revealed to be wise. If the in-plane shear strength had been used, the shear load capacity of web’s composite beams would have been underestimated. Ultimate moments of 9.82 and 13.80 kN.m would be obtained, respectively, for the HB1 and HB2 beams. It is believed that shear failure of reinforced beam was due to a weak point in the web/flange interface, and therefore, providing an h-profile with homogenized distribution of fibers, a higher ultimate load should be expected. A larger anchorage of FRP laminates in width could be a solution to prevent this kind of failure.
4. CONCLUSIONS
GFRP-PC hybrid beams, with two different model designs, reinforced and un-reinforced for shear, were manufactured and tested in four-point bending. Flexural behaviour of such structures was analysed and discussed. Based on experimental results, the following conclusions are put forth:

8
• GFRP-PC hybrid beams have a high potential as structural members, presenting an excellent load bearing capacity to self-weight ratio. Brittle failure and relative low stiffness are negative points associated.
• Web shear reinforcement with FRP laminates provides a significant extra stiffness. This parameter and load capacity can still be improved using a thicker laminate.
• Shear connectors and treatment of bond surfaces are an efficient method to ensure a full composite action between components.
• Web shear resistance of pultrusion profiles cannot be systematically assessed by the in-plane shear strength. Layer arrangement within the web must be firstly evaluated.
• The used analytical method can be applied with success to predict load capacity of this new type of hybrid beams.
It is realized, that the present work forms a promising feasibility study but has not considered a number of important issues that should be addressed before the hybrid systems can have engineering applications. Significant future work will be needed to develop GFRP-PC hybrid beams that are efficient, cost-effective and reliable structural members.
5. ACKNOWLEDGEMENTS
The support of ‘Fundação e Ciência e Tecnologia’ under POCTI/EME/42820/2001 is gratefully acknowledged.
6. REFERENCES
[1] Mirmiran A. Innovative combinations of FRP and traditional materials. Int. Conference on FRP Composites in Civil Engineering, Hong-Kong, 12-15 December 2001; Vol. II: 1289-1298. [2] Deskovic N; Meier U, Triantafillou T. Innovative design of FRP combined with concrete: Short-term behavior. Journal of Structural Engineering 1995;121: 1069-1078. [3] Hall JE, Mottram JT. Combined FRP reinforcement and permanent formwork for concrete members. Journal of Composites for Construction 1998;2: 78-86. [4] Farm AZ, Rizkalla SH. Flexural behavior of concrete-filled fiber-reinforced polymer circular tubes. Journal of Composites for Construction 2002; 6: 123-132. [5] Chawalwala AJ. Material characteristics of polymer concrete. M.S. Thesis. University of Delaware, Center of Composite Materials; 1999. [6] Ribeiro MCS, Tavares CML, Ferreira AJM. Chemical resistance of epoxy and polyester polymer concrete to acids and salts. Journal of Polymer Engineering 2002; 22: 27-44. [7] Fowler DW. Polymers in concrete: A vision for the 21st century. Cement & Concrete Composites 1999; 21: 449-452. [8] Ribeiro MCS, Tavares CML, Figueiredo M, Ferreira AJM, Fernandes AA. Bending characteristics of resin concretes. Materials Research 2003; 6 (2): 247-254. [9] Ribeiro MCS, Nóvoa PR, Ferreira AJM, Marques AT. Flexural performance of polyester and epoxy polymer mortars under severe thermal conditions. Cement & Concrete Composites 2004; 26: 803-809. [10] ISO 527. Plastics-Determination of tensile properties. ISO/TC 61, 1997. [11] EN 13706-2. Reinforced plastics composites – Specifications for pultruded profiles. CEN/TC 249, 2002. [12] Clark JL. Structural design of polymer composites: EUROCOMP Design Code and Handbook. London: E & F.N. Spon; 1996. [13] ASTM D3518M. Standard Practice for in-plane shear response of polymer matrix composite materials by tensile test of a ± 45º Laminate. 1994; 15.03: 139-145. [14] Hutchinson AR. Joining of fibre-reinforced polymer composite materials. CIRIA Report 46. Nov. 1997.

APPENDIX B
PC Modified with Natural Lightweight Aggregates
i) ‘Mechanical characterization of lightweight wood-modified polymer concrete’, Ciência & Tecnologia dos Materiais, Vol. 16, n.º 2-3, 2004, 81-87.................................................................................................................. B-3
ii) Mechanical characterization of lightweight polymer mortar modified with cork granules’, Composites Science and Technology, Vol. 64, Issues 13-14 (2004), 2197-2205 ..................................................................................... B-11

APPENDIXES
B-2
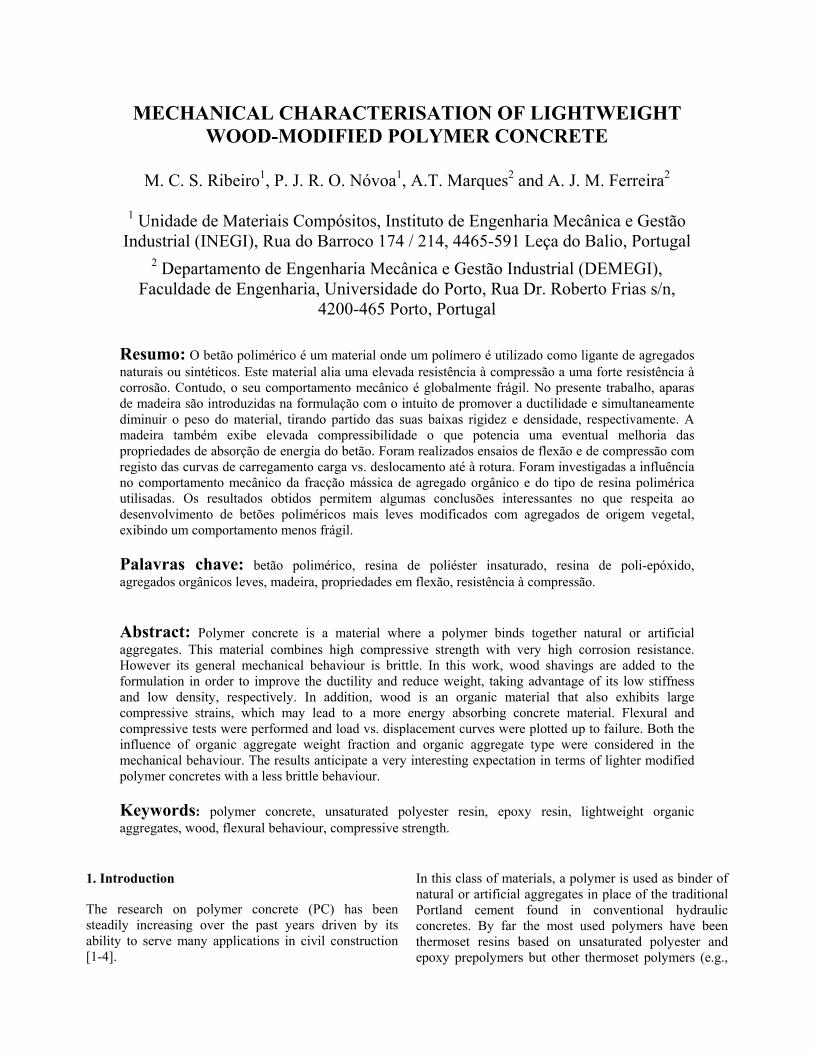
MECHANICAL CHARACTERISATION OF LIGHTWEIGHT WOOD-MODIFIED POLYMER CONCRETE
M. C. S. Ribeiro1, P. J. R. O. Nóvoa1, A.T. Marques2 and A. J. M. Ferreira2
1 Unidade de Materiais Compósitos, Instituto de Engenharia Mecânica e Gestão
Industrial (INEGI), Rua do Barroco 174 / 214, 4465-591 Leça do Balio, Portugal 2 Departamento de Engenharia Mecânica e Gestão Industrial (DEMEGI),
Faculdade de Engenharia, Universidade do Porto, Rua Dr. Roberto Frias s/n, 4200-465 Porto, Portugal
Resumo: O betão polimérico é um material onde um polímero é utilizado como ligante de agregados naturais ou sintéticos. Este material alia uma elevada resistência à compressão a uma forte resistência à corrosão. Contudo, o seu comportamento mecânico é globalmente frágil. No presente trabalho, aparas de madeira são introduzidas na formulação com o intuito de promover a ductilidade e simultaneamente diminuir o peso do material, tirando partido das suas baixas rigidez e densidade, respectivamente. A madeira também exibe elevada compressibilidade o que potencia uma eventual melhoria das propriedades de absorção de energia do betão. Foram realizados ensaios de flexão e de compressão com registo das curvas de carregamento carga vs. deslocamento até à rotura. Foram investigadas a influência no comportamento mecânico da fracção mássica de agregado orgânico e do tipo de resina polimérica utilisadas. Os resultados obtidos permitem algumas conclusões interessantes no que respeita ao desenvolvimento de betões poliméricos mais leves modificados com agregados de origem vegetal, exibindo um comportamento menos frágil. Palavras chave: betão polimérico, resina de poliéster insaturado, resina de poli-epóxido, agregados orgânicos leves, madeira, propriedades em flexão, resistência à compressão. Abstract: Polymer concrete is a material where a polymer binds together natural or artificial aggregates. This material combines high compressive strength with very high corrosion resistance. However its general mechanical behaviour is brittle. In this work, wood shavings are added to the formulation in order to improve the ductility and reduce weight, taking advantage of its low stiffness and low density, respectively. In addition, wood is an organic material that also exhibits large compressive strains, which may lead to a more energy absorbing concrete material. Flexural and compressive tests were performed and load vs. displacement curves were plotted up to failure. Both the influence of organic aggregate weight fraction and organic aggregate type were considered in the mechanical behaviour. The results anticipate a very interesting expectation in terms of lighter modified polymer concretes with a less brittle behaviour. Keywords: polymer concrete, unsaturated polyester resin, epoxy resin, lightweight organic aggregates, wood, flexural behaviour, compressive strength.
1. Introduction
The research on polymer concrete (PC) has been steadily increasing over the past years driven by its ability to serve many applications in civil construction [1-4].
In this class of materials, a polymer is used as binder of natural or artificial aggregates in place of the traditional Portland cement found in conventional hydraulic concretes. By far the most used polymers have been thermoset resins based on unsaturated polyester and epoxy prepolymers but other thermoset polymers (e.g.,
vinyl esters and polyurethanes) have also been tested as binder alternatives. The first applications of PC in the late 50’s were the production of building cladding and cultured marble, but its excellent properties lead to its widespread use in other fields. The fast cure characteristics, excellent bonding to concrete and steel reinforcement, high strength, and durability made it a very attractive choice as a repair material. Overlays in PC, for bridge surfaces and industrial floors, have also become widely used due to the ability to use thin layers combined with low curing time, very low permeability, and high resistance to chemical and frost attacks. Precast components are another excellent use of the material. The high strength to weight ratio, good damping properties, moldability and ability to form complex shapes make PC particularly suitable for these applications [1]. The main limitation of concrete-polymer materials lies in their cost. Even considering that the density of cement is about 2 ½ times that of most polymers, the cost per unit volume of polymer concretes is still higher than Portland cement concrete. The higher cost of polymer concrete makes its use almost prohibitive for high volume applications, except in specialty ones where durability is paramount and renders cement concrete unusable. One way to minimize this limitation is the development of a lighter polymer concrete. In addition to lower dead load, insulating properties are also improved. The two traditional ways for the development of a lightweight concrete material involve the use of: (i) an alternative binder to cement and (ii) lightweight aggregates. In the case of PC, we are already in presence of an alternative binder with weight savings with respect to cement. So, in order to further weight reduction we are essentially limited to the second option: the use of lighter aggregates. The general class of lightweight aggregates encloses a wide range of products. From natural products, either organic (e.g., wood, cork or rice husk) or mineral (e.g., products from volcanic source), to artificial products specially manufactured for the effect (e.g., expanded clay, shale or slate), as well as industrial sub-products and wastes (e.g., fly ashes, expanded slag and civil construction debris), a large spectrum of lightweight aggregates has been produced and/or applied in the last years for construction purposes. The use of lightweight aggregates in building construction is not a recent practice as shown by the Basilica of Saint Sophie in Constantinople, made with diatomite. Artificial lightweight aggregates have been produced since the beginning of the 20th century in the U.S, and from the 60’s onward examples of concrete structures made with light aggregates have multiplied throughout the world [5]. But it was only in the 70’s that
a significant research effort in lightweight aggregate concrete was achieved [6-8]. Since then, several investigations on Portland cement concrete and mortars with lightweight aggregates have been reported and there are worldwide environmental, economic and technical impetuses to encourage the structural use of these materials [9-13]. In this study, an effort is undertaken to develop a new type of polymer concrete material, being both lighter and with improved ductility. Previous work on polymer concretes, where polyester and epoxy concrete behaviour was measured under various chemical and mechanical conditions [14-16], was the basis for this research. The strategy in the present work consisted in keeping the binder-to-sand weight ratio and adding increasing amounts of wood shavings resulting in a series of formulations with changing aggregate composition, characterized by the organic aggregate-to-sand weight ratio. Considering the low density and low stiffness of wood [17,18], its introduction in the concrete formulation was expected to reduce the material weight and brittleness, respectively. The light organic aggregate also exhibits large compressive strains, which may lead to a more energy-absorbing material. The low thermal conductivity and high sound absorbing properties of wood may also introduce these features in the modified polymer concrete. These features are expected to be the subject of a future work. The main challenge consists in developing a material with the above benefits while minimizing strength and cost changes. The wood shavings used in this work are a by-product in the wood industry. They are produced from scrap of cutting and trimming operations, and are subsequently used in the production of agglomerated products, hence its cost is considerably lower compared with that of virgin wood. The mechanical performance of polymer concrete modified with wood was evaluated by flexural and compressive tests performed at room temperature. The influences of both organic aggregate weight fraction and resin type were considered in the analysis of results. 2. Experimental Program
Polymer concrete formulations were prepared by mixing an epoxy or polyester resin with foundry sand, which had been previously mixed with the wood shavings. The polyester resin used in this investigation, designated by S226E (NESTE®), is a low viscosity mixture of an orthophtalic unsaturated polyester prepolymer and styrene (44% by weight), which acts both as solvent and reactive monomer. The resin system is pre-accelerated by the manufacturer with a cobalt (II) salt and the

catalyst used consisted of a methyl ethyl ketone peroxide solution (2 phr). The chosen epoxy resin, EPOSIL 551 (SILICEM®), is based on a diglycidil ether of bisphenol A and an aliphatic amine hardener. This resin system is processed with a weight mix ratio to the hardener of 2:1. The foundry sand is of siliceous nature, with rather fine uniform granulometry and a mean diameter, (D50), of 242 µm. The wood shavings, a by-product of the planed lumber industry, resulted from pine timber and had the appearance of small flakes (Fig.1). Physical properties of the aggregate materials are presented in Table 1. Both aggregates, mineral and organic, were previously dried before being added to polyester or epoxy resin in an automatic mixer. Table 1. Physical properties of aggregates
Aggregates Density [g.cm-3]
Bulk Density [g.cm-3]
Average Particle Dimensions [mm]
Sand 2.65 1.56 0.24 (Ø)
Wood 0.55 0.08 15 : 7.5 : 0.3 (l:w:t)*
* - Length, width and thickness Two series of lightweight polymer concrete formulations modified with pine wood shavings were studied: (i) series ‘EW’, wood-modified epoxy concrete formulations, and (ii) series ‘PW’, wood-modified polyester concrete formulations. In each series, sand was partially replaced by equivalent weights of wood shavings, ranging from 0% (unmodified formulation) up to 6% of total aggregate weight. Previous works by the authors, on lightweight polymer concretes modified with cork granules [19, 20], established the different amounts of wood shavings used in the present work – i.e., the organic aggregate mass fraction was kept in the formulations. Mix proportions of polymer concrete formulations are presented in Table 2. Table 2. Weight mix proportions of concrete formulations
Resin Type
Test Series
Resin : Sand [w:w]
Wood : Sand [w:w]
EW-0 0 : 100 EW-1 2.6 : 97.4 EW-2 4.2 : 95.8 Epoxy
EW-3
20 : 80
6.2 : 93.8 PW-0 0 : 100 PW-1 2.6 : 97.4 PW-2 4.2 : 95.8 Polyester
PW-3
20 : 80
6.2 : 93.8 With the above formulations and mix proportions, polymer concretes were mixed and moulded to prismatic specimens (4 x 40 x 160 mm), as illustrated in Fig.1, according to RILEM standard CPT PC-2 [21].
Fig. 1. Some examples of prismatic specimens of polyester PC modified with wood aggregates. Pine wood shavings used in this investigation work. Fig. 2. Flexural (a) and compressive (b) test set-up. Bending and compression failure of one specimen of wood-modified PC (EW-3). For each formulation 5 prismatic specimens were cast. All specimens were allowed to cure for seven days at room temperature and then post-cured at 80ºC for three hours before being tested in bending and compression.
PW-0 PW-1 PW-2 PW-3
a)
b)

Prismatic polymer concrete specimens were tested in bending up to failure at the loading rate of 1 mm.min-1, according to RILEM CPT PCM-8 standard test method [22]. The two parts, of each broken specimen in bending, were tested afterwards in compression at the loading rate of 1.25 mm.min-1, following the procedure described in UNE 83821:1992 test standard [23]. Both, flexural and compressive testing set-up, are presented in Fig. 2. 3. Test Results and Discussion
Mechanical properties obtained from flexural and compressive tests performed on specimens of all formulations of wood-modified polymer concrete are presented in Table 3. In order to better compare mechanical behaviour of both test series, retained compressive and flexural strengths are plotted against wood content in Fig. 3. For better visualization, trend lines are shown on the right side of the figure. Table 3. Mechanical properties of wood-modified PC formulations. Average values and standard deviation.
Test Series
Density [g.cm-3]
Flexural Strength [MPa]
Compressive Strength [MPa]
EW-0 1.832 45.52 (1.68) 76.19 (0.85) EW-1 1.779 39.37 (1.59) 71.94 (0.69) EW-2 1.695 34.08 (2.14) 54.97 (0.96) EW-3 1.593 24.87 (0.40) 43.32 (1.36) PW-0 1.846 22.44 (0.19) 61.72 (0.90) PW-1 1.803 18.83 (0.68) 55.78 (2.41) PW-2 1.690 14.78 (0.69) 41.43 (2.67) PW-3 1.516 5.21 (0.13) 10.68 (0.54)
It is clear from the experimental results that both compressive and flexural strength of wood-modified polymer concrete formulations decrease with increasing addition of wood shavings. Since resin-sand ratio was kept constant and increasing amounts of wood aggregates were added throughout each test series, the effective resin volume content was successively reduced. Insufficient binder to wet increasing amounts of wood shavings exhibiting high specific surface, together with the relative low resistance of wood, appear to be the most relevant factors leading to the above trend in properties. For both test series, the decay of mechanical properties with the increasing amounts of wood shavings follows similar trends in compression and bending. In general, compressive resistance is somewhat less affected with regard to the first addition of wood shavings. Further
incorporation of wood leads to similar relative behaviour in both properties. Polyester resin based formulations are more sensitive to the incorporation of wood aggregate than those with epoxy resin binder. Strength properties decrease is particularly impressive for the last formulation in the series of polyester based concretes. Decreases of 77% and 83% occurred for bending and compression, respectively. For epoxy formulations the observed values were less pronounced: strength decreases of 45% and 43% were obtained. In an attempt to explain this behaviour, void contents were determined for all formulations. Calculation procedure took into consideration the difference between expected densities, based on the density of individual constituents, and experimentally measured concrete densities. An unexpected high void content was found for the last polyester based formulation, which corresponds to an increase of 56% relatively to the previous formulation in the test series. By contrast an increase of only 11% was found for the epoxy based formulations. This observation is consistent with, and may explain, the steeper loss of properties between W-2 and W-3 for polyester formulations. Since the mixing procedure and casting process were rigorously the same for all test formulations, an insufficient adhesion between polyester binder and wood aggregate could be the cause for the unusual high void content found in PW-3 formulation, and, globally, for the higher sensibility of this test series to wood incorporation. In order to access the effect of binder type and wood organic aggregate content on ductility and stiffness of polymer concretes, typical shapes of the obtained stress-deflections curves were determined and plotted in Figs. 4 and 5. From the experimental curves it seems clear there is no significant gain in strain to failure in the case of wood-modified polyester PCs, particularly in bending. In compression, a higher ultimate strain occurs for the first formulation, PW-1, with lowest wood content. However, this increase declines throughout the other formulations, as wood content rises and ultimate load capacity drops off. Opposite behaviour is shown by epoxy resin based formulations. In fact, except for the first formulation that presents equal ultimate compressive strain as the unmodified one, all other wood-modified epoxy PCs yield higher ultimate strain values, presenting an improved ductility. A less brittle failure was observed for both test series, either in compression or in bending, in particular for the last formulations with higher content of organic aggregate.

Fig. 3. Retained flexural and compressive strength of both test series as function of wood aggregate weight fraction. In order to verify if there is some benefit in mechanical performance, considering the reduction in density as light aggregate weight fraction rises along test series, specific properties should be examined. In Fig. 6, both specific and absolute values of mechanical strengths are plotted against wood aggregate weight fraction. While it is true that even specific strengths decrease with wood content, the density factor smoothes the loss in resistance when specific values are considered. As a consequence, plot lines can be extrapolated beyond interception points, where specific properties will exceed absolute ones, or put in another way, where PC formulations with sub-unitary density will be achieved. Wood content values corresponding to the interception points are around 6.6 to 6.9% and 8.8 to 9.2% for polyester and epoxy resin based formulations, respectively. It is, however, not certain if those points can be attained in practice, as larger amounts of wood may result in unworkable mixes. In particular, in the case of polyester test series, where bond between wood
and resin is less efficient, such increase in wood content will lead to a concrete material with no significant load carrying capacity (1.5 MPa and 3.0 MPa, respectively, for bending and compressive resistance). So far, the lack of binder, the low resistance of wood shavings and the relative weak adhesion between this organic aggregate and the resin binder, appear to be the main causes for loss in resistance.It is, nevertheless, clear that the observed mechanical strengths are globally still higher than those shown by an ordinary Portland cement concrete prepared with the same siliceous size aggregate (commonly named by mortars). Compressive and flexural strength of normal cement mortars usually range from 10 to 35 MPa and from 4 to 7 MPa, respectively, as function of cement type, cement dosage and water-cement ratio [24].Higher resin content and/or the use of interfacial modifiers that promote organic aggregate/resin adhesion might be the solution to improve the mechanical behaviour of this new class of lightweight polymer concretes.
Wood aggregate weight fraction (%)
0 2 4 6
Ret
aine
d fle
xura
l stre
ngth
(%)
0
20
40
60
80
100
120
Epoxy PC Polyester PC
0 2 4 60
20
40
60
80
100
120
100%
87 %
75 %
55 %
84 %
66 %
23 %
Wood aggregate weight fraction (%)
0 2 4 6
Ret
aine
d co
mpr
essi
ve s
treng
th (%
)
0
20
40
60
80
100
120Epoxy PC Polyester PC
0 2 4 60
20
40
60
80
100
120
100 % 94 %
72 %
57 %
90 %
67 %
17 %

.
Fig. 4. Representative stress-deflection curves obtained from flexural tests performed on specimens of epoxy and polyester PC modified with wood organic aggregate.
Fig. 5. Representative stress-displacement curves obtained from compressive tests performed on specimens of epoxy and polyester PC modified with wood organic aggregate.
Fig. 6. Absolute and specific mechanical strengths of both series of polymer concrete formulations as function of wood aggregate weight fraction
4. Conclusions
0
10
20
30
40
50
0 0.2 0.4 0.6 0.8 1 1.2 1.4 1.6
Deflection (mm)
Flex
ural
Str
ess
(MPa
) EW-0
EW-1
EW-2
EW-3
Wood-modified Epoxy PC
0
10
20
30
40
50
0 0.2 0.4 0.6 0.8 1 1.2 1.4 1.6
Deflection (mm)
PW-0 PW-1
PW-2
PW-3
Wood-modified Polyester PC
0
20
40
60
80
-1 0 1 2 3 4 5 6 7
Wood aggregate weight fraction (%)
Fle
xura
l Str
engt
h (M
Pa) Absolute values
Specific values - Epoxy PC- Polyester PC
0
20
40
60
80
-1 0 1 2 3 4 5 6 7
Wood aggregate weight fraction (%)
Com
pres
sive
Str
engt
h (M
Pa)
Specific values
Absolute values
- Epoxy PC- Polyester PC
0
20
40
60
80
0 1 2 3 4 5 6
Displacement (mm)
Com
pres
sive
Str
ess
(MPa
)
EW-0Wood-modified Epoxy PC EW-1
EW-3
EW-2
0
20
40
60
80
0 1 2 3 4 5 6
Displacement (mm)
W-0Wood-modified Polyester PC
W-1
W-3
W-2
PW-0 PW-1
PW-2
PW-3
The following conclusions can be drawn considering the mechanical behaviour of epoxy and polyester polymer concretes modified with wood shavings.
• Compression and bending strengths are both adversely affected by the introduction of any level of wood organic aggregate.
• Some of the main factors responsible for the decay in properties are the insufficient binder, the low resistance of wood shavings and the relative weak adhesion between this organic aggregate and the resin binder.
• Polyester based concretes are more sensitive to the incorporation of wood aggregate than epoxy based formulations due to a poorer interface between resin and wood.
• Wood-modified epoxy concretes yield higher ultimate strain values, presenting an improved ductility. • A less brittle failure occurs for both resin based concretes, either in compression or in bending, in particular for the last formulations with higher content of organic aggregate.
• Low material density with good retention of properties is achieved for epoxy based concrete (EW-3).
The results of the present work anticipate interesting developments in research of lighter polymer concretes modified with organic aggregates. Other works on PC modified with wood are foreseen, in order to exploit other features brought by the incorporation of organic aggregate such as improved thermal and acoustic isolation properties. Acknowledgement
The authors are grateful to Jomar Lda., for supplying the wood shavings. References
1. D.W. Fowler, “Polymers in concrete: a vision for the 21st century”, Cement & Concrete Composites, 21 (1999), 449-452. 2. L. Czarnecki, “Polymers in concrete on the edge of the millennium”, 10th International Conference on Polymers in Concrete, Honululu, Hawaii, U.S.A., May 2001, paper 93. 3. R. Letsh, “Polymer concrete properties and structural applications”, International Conference on Polymer concretes, Mortars and Asphalts, Oporto, Portugal, October 2002, p. 31-43.
4. K.S. Rebeiz, A.P. Craft, “Polymer Concrete using coal fly ash”, Journal Energy Engineering, 128 (2002), 62-73. 5. M. Arnould, M. Virlogeux, “Granulats et Betons Legers – Bilan de dix ans de recherches”, Presse de l’école nationale des Ponts et Chaussés, 1986. 6. “Guide for structural lightweight aggregate concrete”, ACI Committee 213, 1970. 7. “Les bétons legers de structure”, Vade Mecum – Centre Nationale de Recherches Scientifiques et Techniques pour l’Industrie Cimentière, Rapport de recherché, 1974. 8. “Lightweight aggregate concrete”, CEB-FIP Manual, The Construction Press, 1977. 9. J. Trinh, M. Virlogeux, “Etude expérimentale du comportement du béton léger sous charge concentrées”, VIIIe Congrès de la FIP, London, 1978, p. 360-369. 10. F.O. Slate, A.H. Nilson, S. Martínez, “Mechanical properties of high-strength lightweight concrete”, ACI Journal Proceedings; 83(1986), 606-613. 11. T.A. Holm, T.W. Bremner, “High strength lightweight aggregate concrete”, In: Shah SP, Ahmad SH, editors. High performance concrete: properties and applications. New York: McGraw-Hill, 1994, p. 341-374. 12. M.N. Haque, H. Al-Khaiat, “Strength and durability of lightweight concrete in hot marine exposure conditions” Materials Structures, 32 (1999), 533-541. 13. J.A. Rossignolo, M.V.C. Agnesini, J.A. Morais, “Properties of high-performance LWAC for precast structures with Brazilian lightweight aggregates”, Cement & Concrete Composites, 25 (2003), 77-82. 14. M.C.S. Ribeiro, C.M.L. Tavares, M. Figueiredo, A.A. Fernandes, A.J.M. Ferreira, “Bending characteristics of resin concretes”, Materials Research –Revista Ibero Americana, 6(2003), 247-254. 15. M.C.S. Ribeiro, C.M.L. Tavares, A.J.M. Ferreira, “Chemical resistance of epoxy and polyester polymer concrete to acids and salts”, Journal of Polymer Engineering, 22 (2002), 27-44. 16. C.M.L. Tavares, M.C.S. Ribeiro, A.J.M. Ferreira, R.M. Guedes, “Creep Behaviour of FRP-reinforced polymer concrete”, Composites Structures, 57 (2002), 47-51. 17. L.J. Gibson, M.F. Ashby, “Cellular Solids, Structure and Properties”, Cambridge University Press, UK, 1997. 18. J.M. Dinwoodie, “Wood: Nature’s Cellular, Polymeric Fibre-Composite”, The Institute of Metals, 1989. 19. Paulo R.O. Nóvoa, Maria C.S. Ribeiro, António J.M. Ferreira, ‘Mechanical behaviour of cork-modified polymer concrete’, II International Materials

Symposium – Materials’2003, Caparica, Portugal, 11-14 April 2003, pg. 280. 20. M.C.S. Ribeiro, P.R.O. Nóvoa, A.J.M. Ferreira, A.T. Marques, ‘Mechanical behaviour of polymer concrete modified with light organic aggregates’, 2nd International Conference on Eco-Composites, 1-2 September 2003, Queen Mary, University of London, UK. 21. CPT PC-2: ‘Method of Making Polymer Concrete and Mortar Specimens’, TC 113, RILEM, UK, 1995 22. CPT PCM-8: ‘ Method of Test for Flexural Strength and Deflection of Polymer-Modified Mortar’, TC 113, RILEM, UK, 1995. 23. UNE 83821: 1992, ‘Morteros. Métodos de ensayo. Morteros endurecidos. Determinación de las resistencias a flexión y a compressión.’, UNE, Spain, 1992. 24. A.S. Coutinho, ‘Fabrico e propriedades do betão’, LNEC: Laboratório Nacional de Engenharia Civil, 1977, Vol 1 (in portuguese).

COMPOSITESSCIENCE AND
Composites Science and Technology 64 (2004) 2197–2205
www.elsevier.com/locate/compscitech
TECHNOLOGY
Mechanical characterization of lightweight polymer mortarmodified with cork granulates
P.J.R.O. N�ovoa a, M.C.S. Ribeiro a, A.J.M. Ferreira b,*, A.T. Marques b
a Composite Materials Unit, Institute of Mechanical Engineering and Industrial Management (INEGI), Rua do Barroco 174,
4465-591 Lec�a do Balio, Portugalb Department of Mechanical Engineering and Industrial, Management (DEMEGI), Faculty of Engineering, University of Porto,
Rua Dr. Roberto Frias, w/n�, 4200-465 Porto, Portugal
Received 4 August 2003; received in revised form 15 March 2004; accepted 27 March 2004
Available online 20 May 2004
Abstract
The mechanical behaviour of a cork modified polymer mortar was investigated. Two series of mortar formulations were studied,
with different resin/sand (i.e., binder/fine aggregate) weight ratios. In each series, cork ranged from 0% to 45% of the total aggregate
volume. Flexural and compressive tests were performed at room temperature and load vs. displacement curves were plotted up to
failure. In the study, both the influence of the cork volume fraction and the resin/sand weight ratio were considered relative to the
mechanical behaviour of the cork-modified polymer mortars. A linear decrease in properties was observed as function of cork
volume content. When specific properties were considered, this tendency was kept. However, the lower density of the cork-modified
mortars lead to a smoother loss in specific properties. The modified mortar properties seem to follow a rule of mixtures in terms of
their components. The overall results anticipate interesting expectations in terms of lighter modified polymer concretes.
� 2004 Elsevier Ltd. All rights reserved.
Keywords: A. Polymer–matrix composites; Cork; B. Mechanical properties; C. Elastic properties; E. Casting
1. Introduction
Polymer concrete (PC) and mortars (PM) have
gained an increasing research interest due to their wide
range of possible applications in civil construction [1–4].
In this class of materials, a thermoset resin is used as
binder of natural or artificial aggregates, replacing the
paste of Portland cement/water of conventional hy-
draulic concretes. The most commonly used resins have
been unsaturated polyesters, acrylics and epoxies, butvinyl ester, furan and urethane, have also been applied.
The initial applications of PC, in the late 1950s, were
the production of building cladding and cultured marble,
but its excellent properties rapidly widespread its appli-
cation fields. Its rapid curing, excellent bond to concrete
and steel reinforcement, high strength and durability
* Corresponding author. Tel.: +351-22-957-8713; fax: +351-22-953-
7352.
E-mail address: [email protected] (A.J.M. Ferreira).
0266-3538/$ - see front matter � 2004 Elsevier Ltd. All rights reserved.
doi:10.1016/j.compscitech.2004.03.006
made it a very attractive repair material. As a mortar it
can be placed with thickness less than 10 mm. Overlaysin PC, for bridge surfaces and floors, have also become
widely used because of the ability to use thin layers, fast
curing time, very low permeability, and high resistance
to chemical and frost attack. Precast components are
another excellent use of the material. The high strength
to weight ratio, good damping properties, moldability
and ability to form complex shapes make PC and PMs
particularly attractive for these applications [1].The main limitation of concrete polymer materials is
their cost. Even considering that the specific gravity of
cement is about 21/2 times that of polymer, the cost per
unit volume of polymer concretes is still significantly
higher than Portland cement concrete. The higher cost
of polymer concretes makes its use almost forbidden for
high volume applications except in cases where dura-
bility renders cement concrete unusable. One way tominimize this limitation is the development of a lighter
polymer concrete.
2198 P.J.R.O. N�ovoa et al. / Composites Science and Technology 64 (2004) 2197–2205
The two traditional ways for the development of a
lightweight concrete material involve the use of:
(i) an alternative binder to cement,
(ii) lightweight aggregates.
An example of the first option is the use of fly ash as areplacement for cement. It is an attractive solution since
it consists of an inexpensive pozzolanic material that can
reach half the density of cement. Its use in concrete in-
dustry is currently common practice and well docu-
mented [5]. Besides lowering cost and density of concrete
it can lead to improved strength, durability and corro-
sion resistance.
In the case of polymer concrete and mortars, we arealready in presence of an alternative binder with weight
savings with respect to cement. So, in order to further
weight reduction we are somewhat limited to the second
option: the use of lighter aggregates.
The general class of lightweight aggregates encloses
a wide range of products. From natural organic/min-
eral products (wood, cork, rice husk and products
from volcanic source), to artificial products speciallymanufactured for the effect (expanded clay, shale or
slate), as well as industrial sub-products and wastes
(expanded slags and civil construction debris), a large
spectrum of lightweight aggregates has been produced
and/or applied in the last years for construction
purposes.
The use of lightweight aggregates in building con-
struction is not a recent practice as shown by the Ba-silica of Saint Sophie in Constantinople, made with
diatomite. Artificial lightweight aggregates have been
produced since the beginning of the 20th century in the
US, and since the 1960s, the examples of concrete
structures made with lightweight aggregates have mul-
tiplied throughout the world [6]. But only in the 1970s,
a broad research effort in lightweight aggregate con-
crete was achieved [7–9]. Since then, several investiga-tions on Portland cement concrete and mortars with
lightweight aggregates have been reported and there are
worldwide environmental, economic and technical im-
petuses to encourage the structural use of these
materials [10–14].
A recent example of lighter aggregate substitute is a
study by McBride and Shukla [15] where porous thin-
walled particles called cenospheres, a byproduct duringfly ash formation, are used in the development of
lightweight concrete material. A 22% reduction in con-
crete density, while maintaining acceptable strength
values, was obtained. A significant improvement on the
mechanical behaviour was reached using interfacial
modifiers.
1.1. Research significance
In this study an effort is undertaken to develop a new
type of polymer mortar material, being both lighter and
with improved ductility. Previous work on polymer
mortars where polyester and epoxy mortar behaviour
was measured under various chemical and mechanical
conditions [16–18] was the basis for this research.
The strategy in the present work consisted in keepingthe binder-to-sand weight ratio and adding increasing
amounts of cork granulate resulting in a series of for-
mulations with changing aggregate composition, char-
acterized by the cork-to-sand volume ratio. With this
procedure, it is clear that the binder-to-total aggregate
ratio will decrease as we proceed along the series. For
this reason, in addition to a series of formulations based
on a binder-to-sand ratio optimized for unmodifiedpolymer mortars determined in previous work [16], a
higher ratio was also used.
Considering the low density and low stiffness of cork
[19], its introduction in the mortar formulation was ex-
pected to reduce the material weight and brittleness,
respectively. Cork also exhibits low strength, and large
compressive strains, which may lead to a more energy-
absorbing material. The low thermal conductivity andhigh sound absorbing properties of cork may also in-
troduce these features in the cork-modified polymer
mortar. These features are expected to be the subject of
a future work.
The main challenge consists in developing a material
with the above benefits while minimizing strength and
cost changes. The cork granules used in this work are a
by-product in the cork industry. They are producedfrom scrap of cutting and trimming operations, and are
subsequently used in the production of agglomerated
products; hence its cost is considerably lower compared
with that of virgin cork.
The mechanical performance of the cork-modified
polymer mortar was evaluated by flexural and com-
pressive tests performed at room temperature. The in-
fluence of both cork volume fraction and resin/sandweight ratio was considered in the analysis of results.
2. Experimental program
2.1. Materials and mortar formulations
Polymer mortar formulations were prepared bymixing an epoxy resin with a siliceous sand with rather
fine uniform granulometry and granulated cork. The
chosen epoxy resin (Eposil-552), based on a diglycidil
ether of bisphenol A and an aliphatic amine hardener,
has low viscosity (500–600 mPa s) and flexural strength
of 70� 5 MPa. Physical properties of the aggregate
materials are shown in Table 1. Both aggregates, sand
and cork granulates, were previously dried before theaddition to epoxy resin in an automatic mixer.
Two series of mortar formulations were studied,
where different resin/sand weight ratio values were used.

Table 1
Physical properties of aggregates
Aggregate Density
(g cm�3)
Apparent density
(g cm�3)
Average particle
diameter (mm)
Sand 2.65 1.56 0.24
Cork 0.22 0.12 2.75
P.J.R.O. N�ovoa et al. / Composites Science and Technology 64 (2004) 2197–2205 2199
In each series, sand was partially replaced by equivalent
volumes of cork, ranging from 0% to 45% of aggregate
volume. Mix proportions of polymer mortar formula-
tions are presented in Table 2.
With these binder formulations and mix proportions,
polymer mortars were mixed and moulded to prismatic
(40� 40� 160 mm) and cylinder (£ 50� 100 mm)
specimens, as illustrated in Fig. 1, according to the RI-LEM standard CPT PC-2 [20]. For each formulation
five prismatic and three cylinder specimens were cast.
All specimens were allowed to cure for 7 days at room
temperature and then post-cured at 70 �C for 3 h, before
being tested in bending and compression.
2.2. Flexural and compressive testing procedures
Prismatic polymer mortar specimens were tested in
three-point bending up to failure at the loading rate of
1 mmmin�1, with a span length of 100 mm, according to
RILEM CPT PCM-8 standard test method [21]. The
specifications of this standard, in terms of specimen
geometry and span length, are similar to those specified
in ASTM C348-02, standard test method for flexural
Table 2
Mix proportions of mortar formulations
Test series Resin:sand
(m/m)
Cork:sand
(v/v)
Resin:sand:cork
(v/v/v)
A A-0 20:80 0:100 36.0:64.0:0.0
A-25 25:75 29.8:52.9:17.3
A-35 35:65 26.8:47.7:25.5
A-45 45:55 23.8:42.3:33.9
B B-0 25:75 0:100 42.8:57.2:0.0
B-25 25:75 36.1:48.2:15.7
B-35 35:65 32.8:43.8:23.4
B-45 45:55 29.4:39.2:31.4
Fig. 1. Some examples of cylinder and prismatic specim
strength of hydraulic cement mortars [22]. In both
mentioned standards, shear effect is not taken into ac-
count on calculation procedure of flexural strength.
Despite the very short span length compared with
specimen thickness, shear effect is disregarded and it isnot considered. Mortar is assumed as an isotropic ma-
terial and the theory of plane cross-sections is used.
Flexural strength, considered as the strength under
normal stresses, was determined applying the following
equation known from the strength of materials:
rf ¼3Pl2bh2
; ð1Þ
where rf is the flexural strength; P is the maximum
load recorded; l is the span length; and b and h are,respectively, the width and the height of the prismatic
specimens.
Cylinder polymer mortar specimens were tested in
compression at the loading rate of 1.25 mmmin�1 ac-
cording to ASTM C469-94 standard [23]. All specimens
were instrumented with wire strain gages bonded to two
diametrically opposite gage lines parallel to the axis of
the specimen. In order to obtain Poisson’s ratio, onespecimen of each series was also instrumented with two
bonded strain gages mounted circumferentially at dia-
metrically opposite points at the specimen mid-height.
Longitudinal and circumferential strains, as well as
LVDT data, were recorded continuously using a data
logger with a continuous acquisition system.
Compressive strength, chord modulus of elasticity in
compression and Poisson’s ratio were calculated ac-cording the following equations:
rc ¼PA; ð2Þ
where rc is the compressive strength; P is the maximum
load recorded; and A is the cross-sectional area of cyl-
inder specimens.
E ¼ S2 � S1�2 � 0:000050
; ð3Þ
where E is the chord elasticity modulus; S2 is the stress
corresponding to 40% of maximum load; S1 is the stresscorresponding to a longitudinal strain of 50 millionths;
and �2 is the longitudinal strain produced by S2.
ens produced of cork-modified polymer mortars.
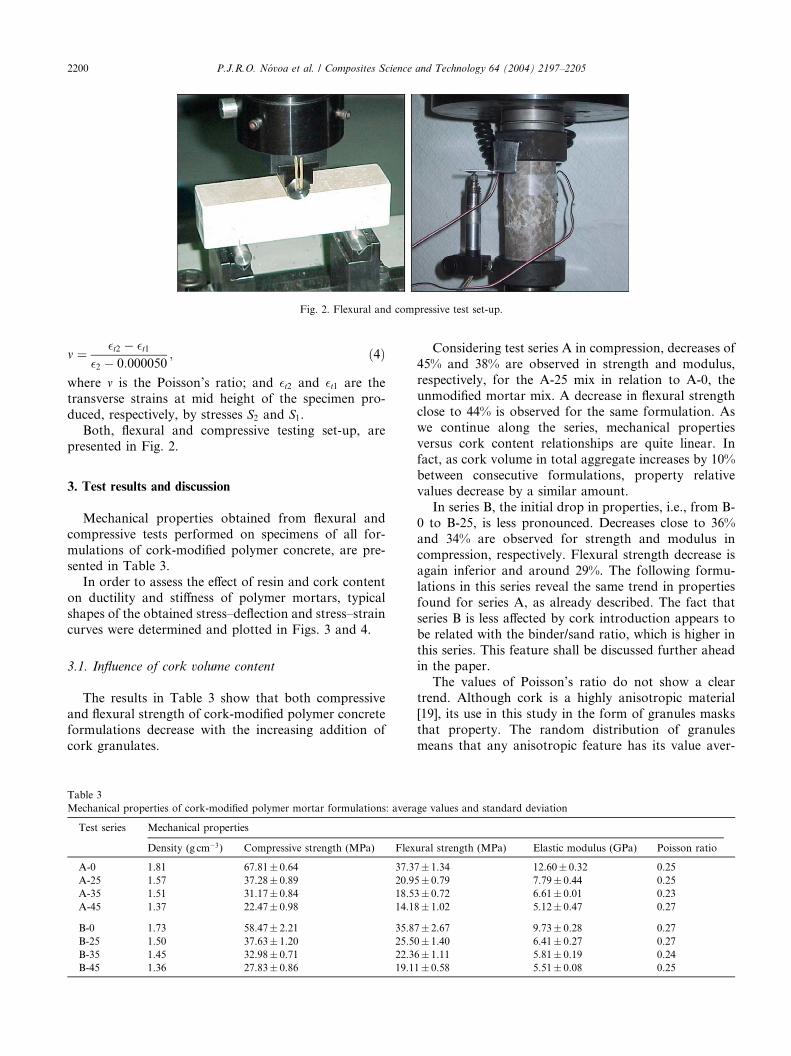
Fig. 2. Flexural and compressive test set-up.
2200 P.J.R.O. N�ovoa et al. / Composites Science and Technology 64 (2004) 2197–2205
m ¼ �t2 � �t1�2 � 0:000050
; ð4Þ
where m is the Poisson’s ratio; and �t2 and �t1 are the
transverse strains at mid height of the specimen pro-
duced, respectively, by stresses S2 and S1.Both, flexural and compressive testing set-up, are
presented in Fig. 2.
3. Test results and discussion
Mechanical properties obtained from flexural and
compressive tests performed on specimens of all for-
mulations of cork-modified polymer concrete, are pre-sented in Table 3.
In order to assess the effect of resin and cork content
on ductility and stiffness of polymer mortars, typical
shapes of the obtained stress–deflection and stress–strain
curves were determined and plotted in Figs. 3 and 4.
3.1. Influence of cork volume content
The results in Table 3 show that both compressive
and flexural strength of cork-modified polymer concrete
formulations decrease with the increasing addition of
cork granulates.
Table 3
Mechanical properties of cork-modified polymer mortar formulations: avera
Test series Mechanical properties
Density (g cm�3) Compressive strength (MPa) Flex
A-0 1.81 67.81� 0.64 37.3
A-25 1.57 37.28� 0.89 20.9
A-35 1.51 31.17� 0.84 18.5
A-45 1.37 22.47� 0.98 14.1
B-0 1.73 58.47� 2.21 35.8
B-25 1.50 37.63� 1.20 25.5
B-35 1.45 32.98� 0.71 22.3
B-45 1.36 27.83� 0.86 19.1
Considering test series A in compression, decreases of
45% and 38% are observed in strength and modulus,
respectively, for the A-25 mix in relation to A-0, the
unmodified mortar mix. A decrease in flexural strengthclose to 44% is observed for the same formulation. As
we continue along the series, mechanical properties
versus cork content relationships are quite linear. In
fact, as cork volume in total aggregate increases by 10%
between consecutive formulations, property relative
values decrease by a similar amount.
In series B, the initial drop in properties, i.e., from B-
0 to B-25, is less pronounced. Decreases close to 36%and 34% are observed for strength and modulus in
compression, respectively. Flexural strength decrease is
again inferior and around 29%. The following formu-
lations in this series reveal the same trend in properties
found for series A, as already described. The fact that
series B is less affected by cork introduction appears to
be related with the binder/sand ratio, which is higher in
this series. This feature shall be discussed further aheadin the paper.
The values of Poisson’s ratio do not show a clear
trend. Although cork is a highly anisotropic material
[19], its use in this study in the form of granules masks
that property. The random distribution of granules
means that any anisotropic feature has its value aver-
ge values and standard deviation
ural strength (MPa) Elastic modulus (GPa) Poisson ratio
7� 1.34 12.60� 0.32 0.25
5� 0.79 7.79� 0.44 0.25
3� 0.72 6.61� 0.01 0.23
8� 1.02 5.12� 0.47 0.27
7� 2.67 9.73� 0.28 0.27
0� 1.40 6.41� 0.27 0.27
6� 1.11 5.81� 0.19 0.24
1� 0.58 5.51� 0.08 0.25

0
5
10
15
20
25
30
35
40
Deflection (mm)
Fle
xura
l Str
ess
(MP
a) Test Series A
A- 25
A- 35
A- 45
A- 0
0
5
10
15
20
25
30
35
40
0 0.2 0.4 0.6 0.8 10 0.2 0.4 0.6 0.8 1
Deflection (mm)
Test Series B
B- 25
B- 35
B- 45
B- 0
Fig. 4. Some representative stress–deflection curves obtained from flexural tests performed on cork-modified polymer mortar specimens.
0
10
20
30
40
50
60
70
80
Strain (o/oo)
Co
mp
ress
ive
Str
ess
(MP
a)
A- 45
A- 0
A- 25
A- 35
Test Series A
0
10
20
30
40
50
60
70
80
0 10 20 30 40 50 60 70 80 900 10 20 30 40 50 a 60 70 80 90
Strain (o/oo)
B- 25
B- 45
B- 35
Test Series BB- 0
Fig. 3. Some representative stress–strain curves obtained from compressive tests performed on cork-modified polymer mortar specimens.
0
10
20
30
40
50
60
70
0 10 20 30 40
Corkvolume content (%)
Mec
han
ical
Str
eng
th (
MP
a) Compressive Strength
Flexural Strength
Series A
Series B
Fig. 5. Compressive and flexural strengths of both series of polymer
mortar formulations as function of cork volume content.
P.J.R.O. N�ovoa et al. / Composites Science and Technology 64 (2004) 2197–2205 2201
aged through all possible orientations. This explains
why Poisson’s ratio is randomly affected by the inclusion
of cork.
From the experimental curves in Figs. 3 and 4 it
seems clear that there is no gain in strain to failure. The
main difference in behaviour is in compression, where a
smaller drop in resistance occurs after maximum load
capacity is overcome, followed by a very smooth de-crease in resistance, and this clearly relates to cork
content. In bending, failure also becomes less brittle as
cork content is progressively increased in the series
formulations.
In order to better understand the influence of cork,
mechanical properties of polymer mortar formulations
are plotted as function of cork content in Figs. 5 and 6,
respectively, for compressive and bending strength, andfor elasticity modulus. In addition Fig. 6 also includes
the predicted elasticity modulus based on the Kelvin–
Voigt model for the rule of mixtures:
Ecomp ¼ EcVc þ EmVm; ð5Þ
where E and V refer to elasticity modulus and volume
fraction; and the indexes comp, c and m, are relative to
final composite, cork and matrix (unmodified mortar
formulations). Elasticity modulus values obtained

0
3
6
9
12
15
18
0 10 20 30 40
Cork volume content (%)
Ela
stic
ity
Mo
du
lus
(GP
a)
Series A
Series B
Experimental
Kelvin-Voigt Model E=EcVc+EmVm
Fig. 6. Experimental and predicted elasticity modulus (by Kelvin–
Voigt Model) of both series of polymer mortar formulations as func-
tion of cork volume content.
2202 P.J.R.O. N�ovoa et al. / Composites Science and Technology 64 (2004) 2197–2205
experimentally for the unmodified mortar formulations,
A-0 and B-0, were assumed for Em values.
It is clear that concrete strength and modulus are
quite linear with respect to cork volume content. In
addition to confirming the trends stated initially, these
plots clearly show that the loss in properties is more
pronounced in series A, where binder volume fraction iscomparatively smaller, leading to poorer inter-particle
bonding.
It seems likely there is a critical point beyond which,
further additions of cork, promoting an increase on
total specific surface 1 of aggregates, leads to an insuf-
ficient wetting ability by the available binder. This fea-
ture had already been noticed during the casting
process.The predicted values given by the simple Kelvin–
Voigt model constitute only an upper bound for the
composite modulus variation. A possible source of dis-
crepancy could be the occurrence of premature micro-
cracking starting at matrix/cork interface.
In order to verify if there is some benefit in me-
chanical performance, considering the reduction in
density when cork is used, specific properties shouldbe examined. In Fig. 7, both specific and absolute
values of mechanical strengths are plotted against cork
volume in aggregate. While it is true that even specific
strengths decrease with cork content, the density fac-
tor smoothes the loss in resistance when specific values
are considered. As a consequence, plot lines can be
extrapolated beyond interception points, where specific
properties will exceed absolute ones, or put in anotherway, where mortar formulations with sub-unitary
density will be achieved. Cork content values corre-
sponding to the interception points are around 40%
and 42% for series A and B, respectively, which cor-
1 Ratio between total surface and volume of aggregate particles.
respond to cork volume fraction on aggregate of 55%
and 64%. It is, however, not certain if those points
can be attained in practice, as larger amounts of cork
may result in unworkable mixes, particularly in the
case of series A, where binder relative content issmaller.
Observing the lines for specific mechanical strengths
of both series in Fig. 7, other theoretical conclusions can
be drawn:
(i) For polymer mortar mixes with cork volume con-
tents above 17% (cross-point lines), the higher re-
sin–sand ratio of series B matrix is always
preferable, as a higher strength to weight ratio is ex-pected to be achieved by resultant mortar formula-
tions.
(ii) For cork contents below that value, the option be-
tween series A or B matrix, will depend of which me-
chanical behaviour (in compression or bending) is
intended to be improved.
3.2. Influence of effective resin volume content
Since resin–sand ratio was kept constant and in-
creasing amounts of granulate cork were added
throughout each test series, the effective resin volume
content was successively reduced. In an attempt to as-
sess the influence of binder content, the mechanical
properties were plotted against binder effective volume
content in each formulation (Fig. 8).The binder content values were corrected for void
content in the specimens, taking into consideration the
material densities (Table 1), and the experimentally de-
termined densities of mix formulations presented in
Table 3. The following expression was used to determine
the effective resin volume contents:
Vrð%Þ ¼ ðmr=qrÞP3
i¼1 mi=qexp
� 100; ð6Þ
where Vr is the effective resin volume fraction; mr and qr
are, respectively, the resin mass and the resin density
(qr ¼ 1:18); mi is the mass of constituent materials (resin,sand and cork granules); and qexp refers to experimen-
taly determined density of mix formulations.
Again, it seems reasonable to assume a linear trend in
the plots. The main observations seem to be
(i) Series A is more sensitive to effective resin volume
content, i.e., mechanical properties variation with
effective resin volume content is higher.
(ii) Series B exhibits an overall smaller change in prop-erty absolute values.
(iii) In both series, compressive strength is more affected
by resin volume content than flexural strength.
The lack of binder and the very low resistance of cork,
appear to be the most relevant factors of the above trend

0
10
20
30
40
50
60
70
15 20 25 30 35 40
Effective resin vol. content (%)
Mec
han
ical
Str
eng
th (
MP
a) Compr. Strength
Series A
Series B
Flexural Strength
0
2
4
6
8
10
12
14
15 20 25 30 35 40
Effective resin vol. content (%)
Ela
stic
ity
Mo
du
lus
(GP
a)
Elasticity Modulus
Series A
Series B
Fig. 8. Compressive and flexural properties of both series of polymer mortar formulations as function of effective resin volume fraction.
0
10
20
30
40
50
60
70
0 10 20 30 40
Cork volume content (%)
Co
mp
ress
ive
Str
eng
th (
MP
a)
0
10
20
30
40
50
60
70
Absolute Strength
Specific Strength
Series A
Series B
0
10
20
30
40
50
60
70
0 10 20 30 40
Cork volume content (%)
Sp
ecif
ic S
tren
gth
(M
Pa.
dm
3 / Kg
)
0
10
20
30
40
50
60
70
Fle
xura
l Str
eng
th (
MP
a)
Absolute Strength
Specific Strength
Series A
Series B
Fig. 7. Absolute and specific mechanical strengths of both series of polymer mortar formulations as function of cork volume content.
P.J.R.O. N�ovoa et al. / Composites Science and Technology 64 (2004) 2197–2205 2203
in properties. Higher resin content and the use of in-
terfacial modifiers that promote cork/resin adhesionmight be the solution to improve the mechanical be-
haviour of cork-modified polymer mortars.
It is, nevertheless, clear that the observed mechan-
ical strengths are globally still higher than those
shown by an ordinary Portland cement mortar,
particullary in bending. Compressive and flexural
strength of cement mortars range from 10 to 35 MPa,
and 4 to 7 MPa, respectively, as function ofcement type, cement dosage and water/cement ratio
[24].
3.3. Flexural strength and compressive elasticity modulus
vs compressive strength
Two important design parameters for concrete and
mortars are both the flexural tensile strength and com-pressive modulus to compressive strength, relationships.
These are depicted in Fig. 9. For comparison, similar
relationships for normal weight Portland cement con-
crete were also included. These last ones were derived
from empirical relationships, given by Eurocode 2,
which are usually applied for design data of normalweight concrete with strength classes between C12/15
(cylinder average compressive strength of 20 MPa) and
C50/60 (cylinder average compressive strength of
58 MPa) [25].
As can be seen from Fig. 9, flexural tensile/compres-
sive strength ratio values found for both series of
lightweight polymer mortars modified with cork exceed
largely those of normal weight cement concrete. On theother hand, mainly due to viscoelasticity properties of
polymers, elastic modulus of cork-modified polymer
mortars is less than that of conventional material, for
the same compressive strength.
Comparing the two series of cork-modified formula-
tions, the highest flexural tensile/compressive strength
ratio is presented by series B, while series A, with lower
resin content, shows a higher elasticity modulus/com-pressive strength ratio. For both series, the above
relationships are linear with cork content, i.e., the ra-
tio values are kept constant for the cork-modified
formulations.
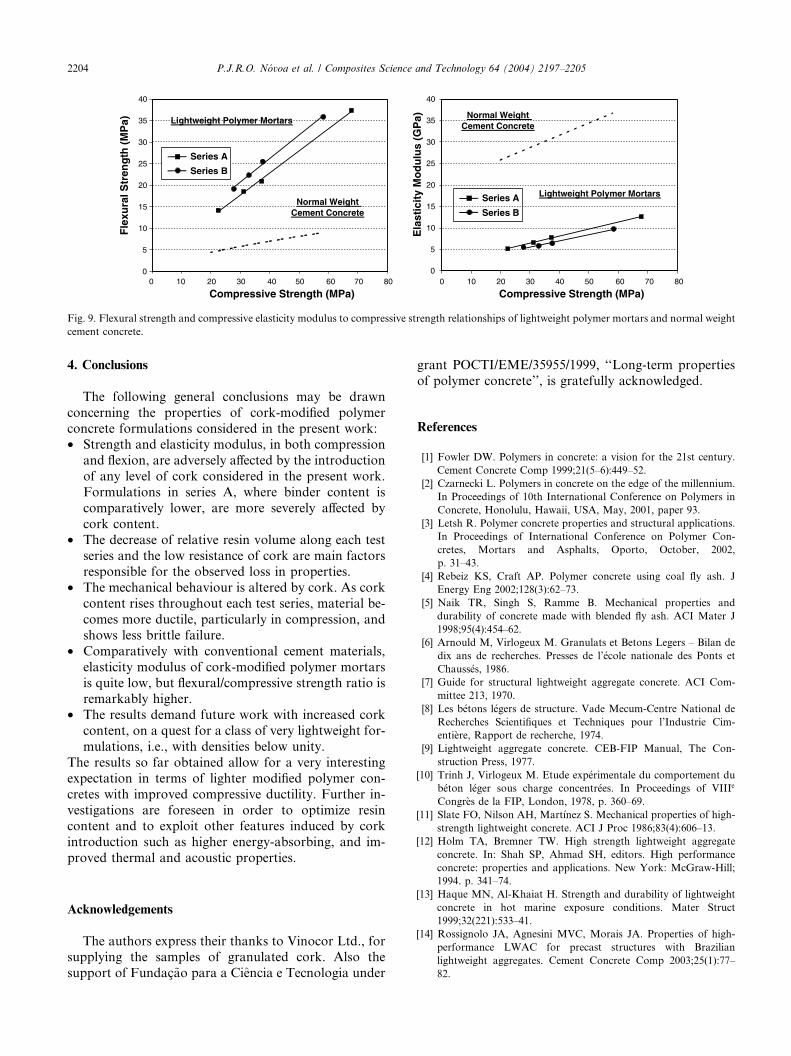
0
5
10
15
20
25
30
35
40
Compressive Strength (MPa)
Fle
xura
l Str
eng
th (
MP
a)
Normal WeightCement Concrete
Normal WeightCement Concrete
Lightweight Polymer Mortars
Series A
Series B
0
5
10
15
20
25
30
35
40
0 10 20 30 40 50 60 70 800 10 20 30 40 50 60 70 80
Compressive Strength (MPa)
Ela
stic
ity
Mo
du
lus
(GP
a)
Lightweight Polymer MortarsSeries A
Series B
Fig. 9. Flexural strength and compressive elasticity modulus to compressive strength relationships of lightweight polymer mortars and normal weight
cement concrete.
2204 P.J.R.O. N�ovoa et al. / Composites Science and Technology 64 (2004) 2197–2205
4. Conclusions
The following general conclusions may be drawn
concerning the properties of cork-modified polymer
concrete formulations considered in the present work:• Strength and elasticity modulus, in both compression
and flexion, are adversely affected by the introduction
of any level of cork considered in the present work.
Formulations in series A, where binder content is
comparatively lower, are more severely affected by
cork content.
• The decrease of relative resin volume along each test
series and the low resistance of cork are main factorsresponsible for the observed loss in properties.
• The mechanical behaviour is altered by cork. As cork
content rises throughout each test series, material be-
comes more ductile, particularly in compression, and
shows less brittle failure.
• Comparatively with conventional cement materials,
elasticity modulus of cork-modified polymer mortars
is quite low, but flexural/compressive strength ratio isremarkably higher.
• The results demand future work with increased cork
content, on a quest for a class of very lightweight for-
mulations, i.e., with densities below unity.
The results so far obtained allow for a very interesting
expectation in terms of lighter modified polymer con-
cretes with improved compressive ductility. Further in-
vestigations are foreseen in order to optimize resincontent and to exploit other features induced by cork
introduction such as higher energy-absorbing, and im-
proved thermal and acoustic properties.
Acknowledgements
The authors express their thanks to Vinocor Ltd., forsupplying the samples of granulated cork. Also the
support of Fundac�~ao para a Ciencia e Tecnologia under
grant POCTI/EME/35955/1999, ‘‘Long-term properties
of polymer concrete’’, is gratefully acknowledged.
References
[1] Fowler DW. Polymers in concrete: a vision for the 21st century.
Cement Concrete Comp 1999;21(5–6):449–52.
[2] Czarnecki L. Polymers in concrete on the edge of the millennium.
In Proceedings of 10th International Conference on Polymers in
Concrete, Honolulu, Hawaii, USA, May, 2001, paper 93.
[3] Letsh R. Polymer concrete properties and structural applications.
In Proceedings of International Conference on Polymer Con-
cretes, Mortars and Asphalts, Oporto, October, 2002,
p. 31–43.
[4] Rebeiz KS, Craft AP. Polymer concrete using coal fly ash. J
Energy Eng 2002;128(3):62–73.
[5] Naik TR, Singh S, Ramme B. Mechanical properties and
durability of concrete made with blended fly ash. ACI Mater J
1998;95(4):454–62.
[6] Arnould M, Virlogeux M. Granulats et Betons Legers – Bilan de
dix ans de recherches. Presses de l’�ecole nationale des Ponts et
Chauss�es, 1986.[7] Guide for structural lightweight aggregate concrete. ACI Com-
mittee 213, 1970.
[8] Les b�etons l�egers de structure. Vade Mecum-Centre National de
Recherches Scientifiques et Techniques pour l’Industrie Cim-
enti�ere, Rapport de recherche, 1974.
[9] Lightweight aggregate concrete. CEB-FIP Manual, The Con-
struction Press, 1977.
[10] Trinh J, Virlogeux M. Etude exp�erimentale du comportement du
b�eton l�eger sous charge concentr�ees. In Proceedings of VIIIe
Congr�es de la FIP, London, 1978, p. 360–69.
[11] Slate FO, Nilson AH, Mart�ınez S. Mechanical properties of high-
strength lightweight concrete. ACI J Proc 1986;83(4):606–13.
[12] Holm TA, Bremner TW. High strength lightweight aggregate
concrete. In: Shah SP, Ahmad SH, editors. High performance
concrete: properties and applications. New York: McGraw-Hill;
1994. p. 341–74.
[13] Haque MN, Al-Khaiat H. Strength and durability of lightweight
concrete in hot marine exposure conditions. Mater Struct
1999;32(221):533–41.
[14] Rossignolo JA, Agnesini MVC, Morais JA. Properties of high-
performance LWAC for precast structures with Brazilian
lightweight aggregates. Cement Concrete Comp 2003;25(1):77–
82.

P.J.R.O. N�ovoa et al. / Composites Science and Technology 64 (2004) 2197–2205 2205
[15] McBride SP, Shukla A. Processing and characterization of a
lightweight concrete using cenospheres. J Mater Sci 2002;37(19):
4217–25.
[16] Ribeiro MCS, Tavares CML, Figueiredo M, Fernandes AA,
Ferreira AJM. Bending characteristics of resin concretes. Mate-
rials Research–Revista Ibero Americana 2003;6(2):247–54.
[17] Ribeiro MCS, Tavares CML, Ferreira AJM. Chemical resistance
of epoxy and polyester polymer concrete to acids and salts. J
Polym Eng 2002;22(1):27–44.
[18] Tavares CML, Ribeiro MCS, Ferreira AJM, Guedes RM. Creep
behaviour of FRP-reinforced polymer concrete. Comp Struct
2002;57(1–4):47–51.
[19] Gibson LJ, Ashby MF. Cellular solids, structure and properties.
Cambridge (UK): Cambridge University Press; 1997.
[20] CPT PC-2: Method of making polymer concrete and mortar
specimens. TC 113, RILEM, UK, 1995.
[21] CPT PCM-8: Method of test for flexural strength and deflection of
polymer-modified mortar. TC 113, RILEM, UK, 1995.
[22] ASTM C 348-02: Standard test method for flexural strength and
modulus of hydraulic cement mortars. ASTM, USA, 2002.
[23] ASTM C 469-94: Standard test method for static modulus of
elasticity and poisson’s ratio of concrete in compression. ASTM,
USA, 1997.
[24] Coutinho AS. Fabrico e propriedades do bet~ao. LNEC –
Laborat�orio Nacional de Engenharia Civil, vol. 1, Portugal,
1997 (in portuguese).
[25] DD ENV 1992-1-1: Eurocode 2 Part 1: General rules and rules for
building. European Committee for Standardization, 1992.