new option in hotel appraisals: quantifying the … option in hotel...new option in hotel...
TRANSCRIPT
New Option in Hotel Appraisals: Quantifying the Revenue Enhancement Value of Hotel Brandsby A. Scruggs Love, MAI, SRA, Bruce H. Walker, and Douglas W. Sutton
Practitioners generally agree that intangible value exists in hotels. However, there is no general agreement regarding how to estimate the intangible value. O’Neill and Belfrage assert that most of the intangible value in a hotel is based on the brand name and the authors agree.1
This article describes a new system that proves hotel brands contribute to hotel revenues, but with major differences in the degree of contribution by each brand. The system quantifies the income attributable to each brand, relative to the market average. O’Neill and Xiao analyzed sale transactions to show that a hotel’s brand contributes significantly to the property’s market value.2 The study presented here uses a distinctly different approach.
Overview of Hotel Brand Value StudyThis study measures a brand’s contribution to a hotel’s performance by quantify-ing the change in revenue that occurs when a brand is added or removed from the same hotel. The brand is typically the most important variable in the success of most hotels. This study quantifies the typical change in revenue performance that occurs when a hotel’s brand changes. The change is calculated on an index basis versus the local market, comparing pre- and post-change periods. The change in revenue per available room (RevPAR)3 per day is measured on an index basis, compared to the local market, to eliminate any influence on results from changes impacting the overall market area. Consequently, the only variable measured by the system is the effect of the specific brand itself and then its removal.
1. John W. O’Neill and Eric E. Belfrage, “A Strategy for Estimating Identified Intangible Asset Value: Hotel Affiliation Contribution,” The Appraisal Journal (Winter 2005): 78.
2. John W. O’Neill and Qu Xiao, “The Role of Brand Affiliation in Hotel Market Value,” Cornell Hotel and Restaurant Administration Quarterly 47, no. 3 (2006): 1–14.
3. The critical statistic used in this study is revenue per available room, or RevPAR. RevPAR reflects the average daily room revenue yield of every room in a property or market (not just occupied rooms). RevPAR is generated by multiplying occupancy times rate (i.e., RevPAR = % occupancy × average daily rate), and it is the most effec-tive and important tool in the evaluation of the success of any lodging concern.
New Option in Hotel Appraisals The Appraisal Journal, Summer 2012 223
AbSTrAcTThe revenue Per
Available room
(revPAr) Index can be
used as an accurate
method for estimating
the major component
of a hotel’s intangible
business value. The
brand contribution
to revenue for six
prominent hotel brands
was estimated by
comparing the revPAr
Index for the same
hotels before and after
a brand change. Hotel
properties performed
significantly better in
revPAr Index when
operating under an
upper-tier brand than
they did when operat-
ing as independent
or marginally branded
properties. This shows
brand value can be
proven and is an accu-
rate way to estimate
the intangible value in
a hotel property.
Reprinted with permission from The Appraisal Journal (2012, Summer) ©2012 by the Appraisal Institute, Chicago, Illinois. All Rights Reserved.
4. See Source Strategies, Inc. at http://www.sourcestrategies.org for database methodology.
5. Arguably, the data is much more accurate than voluntarily reported hotel data.
6. While the authors would like to present the study in its entirety, it is simply not possible due to the volume of research (6 brands and 148 individual case studies to date, covering over 4.5 million consumer purchases, with over 500 pages of documentation). The term consumer purchases is used interchangeably with room nights sold; however, consumer purchases emphasizes the predominant consumer mass-marketing nature of the hotel industry.
Other performance variables include the market average RevPAR, subject location, average age of the brand’s hotel stock, property size, property age, and other influences. The data used in this study is extracted from Source Strategies’ extensive, proprietary database of the revenue history of all Texas hotels (initially reported to the Texas State Comptroller and subject to their audit).4 In this database, data is tracked for virtually every hotel property in Texas and is available on a quarterly basis from 1980 to the present. This database is a proven and highly accurate source of hotel revenue information and is relied upon by hoteliers, financial institutions, appraisers, appraisal districts, and state agencies within Texas.
In this study, properties were selected from prominent, upper-, middle-, and lower-tier limited-service brands. The intent is to quantify actual revenue disparity between selected brands, determining the revenue impact varying brands have on their properties. The intent also is to ultimately expand this research to include virtually every brand where a sample of properties with brand changes is available. If an adequate historical sample is unavailable, properties can be assigned a value based upon the most similar hotel brands where data is available.
The findings and conclusions presented herein are based on a rigorous, scientific research and statistical procedure, and are based on audited, state-enforced tax collection data of the highest accuracy.5
This system measures the revenue impact of brand name change in three circumstances:
•Droppinganexistingbrandandbecomingunaf-filiated (i.e., an independent)
•Addingabrandtoanunaffiliated,independenthotel
•Droppingonebrandandreplacingitwithanotherbrand
The study results were found to be statistically very reliable and the full range of brands can now be developed based on Texas market data (about 8.5% of US lodging). So far, for six hotel brands every instance has been identified from 1990 through 2010
where a Texas hotel changed its brand name to another brand or to an independent name. RevPAR performance was measured for each selected hotel versus its local market, both before and after the change. This effectively isolates the hotel’s brand as a unique, key variable and the revenue that the specific brand typically generates.
The article includes a section dedicated to each brand’s specific revenue-generating benefit, with exhibits detailing the individual case studies. Later in the article, brand averages are summarized, combining all selected case studies for the brand. Findings for all brands studied thus far are then presented and compared.6
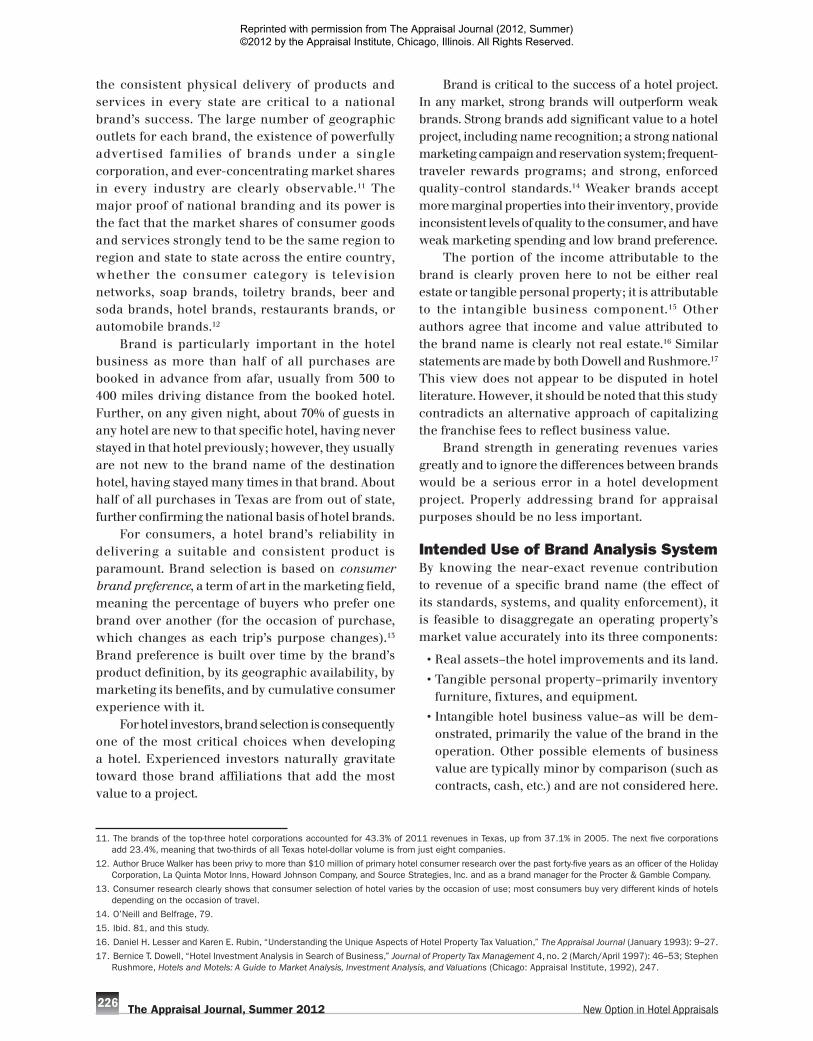
To illustrate the study approach and how each hotel case has been quantified, a sample individual hotel case study is shown in Table 1. This hotel case isaformerHamptonInnlocatedindowntownDallasthat became an independent hotel in the third quarter of 2007. The property generated a RevPAR Index of 73 as a Hampton Inn in the twelve months ending the second quarter of 2006 (the pre-period), dropping 36% to a 47 RevPAR Index in the twelve months through the second quarter of 2008 (the post-period) after it was no longer a Hampton Inn affiliate.
Overview of Key FindingsEach brand generates its own level of revenue to a hotel. The higher-tier brand conversion cases that were examined performed significantly better in RevPAR Index when operating under a major brand than they did when operating as independent or marginally branded properties. Conversely, marginal brands contributed far less in revenue generation, with nominal, if any, RevPAR Index changes noted for brands that are considered bottom tier. Naturally, a number of middle-tier brand names are distributed along the hierarchy between upper-tier and marginal hotel brands. Furthermore, the changes in RevPAR Index for upper-tier and middle-tier brands could be understated by a modest amount because the samples included many properties that converted not only from/to independent status, but also from/to marginal brands and did not entirely bottom out to independent status.
The Appraisal Journal, Summer 2012 New Option in Hotel Appraisals224
Reprinted with permission from The Appraisal Journal (2012, Summer) ©2012 by the Appraisal Institute, Chicago, Illinois. All Rights Reserved.
7. The limited-service segment is one of the major segments as defined by the Hotel Brand Report; a free, recent issue defines all segments and is available at http://www.sourcestrategies.org. The limited-service segment is characterized as offering a high-quality room with the only food service, generally a complimentary breakfast. It includes major brands such as Best Western, Hampton Inn, Holiday Express, La Quinta, and others.
8. Residence Inn performance is likely understated due to anomalies within the identified sample and the notable scarcity of recent conversions within the brand. Hoteliers are extremely reluctant to lose the brand, a further indication of high brand value.
9. Source Strategies, Inc., “Brand Performance Results,” Hotel Brand Report no. 105 (March 2011): 19–20, covering the 78 million room nights sold in Texas in the past 12 months; available at http://www.sourcestrategies.org.
10. Ibid.
In the study, the top tier of limited-service brands7 (Residence Inn, Hampton Inn, Holiday Inn Express8) were found to enhance a hotel’s revenue performance. Removing the brand name and becoming an independent dropped the revenue index by 39% or more. This indicated change in revenue (measured in terms of RevPAR Index) is directly attributable to the intangible value of the brand.
The Comfort Inn brand was also analyzed as representative of a popular mid-tier brand. Removing the Comfort Inn brand and becoming an independent was found to drop the revenue index by 25%.
The data also shows that the conversion from a marginal brand hotel (here Howard Johnson and America’s Best Value) caused more nominal shifts in RevPAR Index of less than 10%.
Importance of Brand Name in Hotel IndustryHotel business value incorporates all the aspects of the operation, including the effect of brand name. A brand name is a complex and comprehensive, mass-marketed system of identification and operation. A brand is of very high value as supported by the fact that hotels with significant brand names accounted for about 85% of Texas hotel room revenues in 2010 versus only 15% of revenues for hotels operating independently.9 Further, independent hotels gener-ate RevPAR at only 74% of the rate generated by branded hotels.10
It is inarguable that US consumer market demands are highly ubiquitous from area to area, with brand success usually nationally based, rather than based on divergent local or regional tastes. Strong national advertising and promotion, and
Table 1 A Sample case: branded Hotel converted to Independent
city/Zip: Dallas/75202
Year-Qtr Market revPAr Subject revPArSubject/Market revPAr Index*
12-Month revPAr Index brand
2005-3 $65.36 $49.44 76 Hampton2005-4 $73.44 $49.56 67 Hampton2006-1 $91.72 $69.76 76 Hampton2006-2 $81.42 $59.28 73 73 Hampton2006-3 $74.25 $58.91 N/A Hampton2006-4 $75.25 $56.61 N/A Hampton2007-1 $93.35 $69.97 N/A Hampton2007-2 $78.31 $53.94 N/A N/A† Hampton2007-3 $72.33 $31.53 44 None2007-4 $76.68 $32.17 42 None2008-1 $95.65 $51.76 54 None2008-2 $87.06 $43.79 50 47 None
Difference: –36%
* The RevPAR Index is calculated by extracting the weighted RevPAR mean of the local market (all nearby hotels), before and after the name change. The ratio between the individual subject property’s RevPAR and its corresponding local market RevPAR is the RevPAR Index.
† To make the comparisons more consistent and reliable, data from the year of conversion is not used in this analysis. In many cases, there will be notable disruptions in operation as a brand is being dropped (discontinued national reservations, signage changes, mid-quarter conversions, etc.).
New Option in Hotel Appraisals The Appraisal Journal, Summer 2012 225
Reprinted with permission from The Appraisal Journal (2012, Summer) ©2012 by the Appraisal Institute, Chicago, Illinois. All Rights Reserved.
11. The brands of the top-three hotel corporations accounted for 43.3% of 2011 revenues in Texas, up from 37.1% in 2005. The next five corporations add 23.4%, meaning that two-thirds of all Texas hotel-dollar volume is from just eight companies.
12. Author Bruce Walker has been privy to more than $10 million of primary hotel consumer research over the past forty-five years as an officer of the Holiday Corporation, La Quinta Motor Inns, Howard Johnson Company, and Source Strategies, Inc. and as a brand manager for the Procter & Gamble Company.
13. Consumer research clearly shows that consumer selection of hotel varies by the occasion of use; most consumers buy very different kinds of hotels depending on the occasion of travel.
14. O’Neill and Belfrage, 79.
15. Ibid. 81, and this study.
16. Daniel H. Lesser and Karen E. Rubin, “Understanding the Unique Aspects of Hotel Property Tax Valuation,” The Appraisal Journal (January 1993): 9–27.
17. Bernice T. Dowell, “Hotel Investment Analysis in Search of Business,” Journal of Property Tax Management 4, no. 2 (March/April 1997): 46–53; Stephen Rushmore, Hotels and Motels: A Guide to Market Analysis, Investment Analysis, and Valuations (Chicago: Appraisal Institute, 1992), 247.
the consistent physical delivery of products and services in every state are critical to a national brand’s success. The large number of geographic outlets for each brand, the existence of powerfully advertised families of brands under a single corporation, and ever-concentrating market shares in every industry are clearly observable.11 The major proof of national branding and its power is the fact that the market shares of consumer goods and services strongly tend to be the same region to region and state to state across the entire country, whether the consumer category is television networks, soap brands, toiletry brands, beer and soda brands, hotel brands, restaurants brands, or automobile brands.12
Brand is particularly important in the hotel business as more than half of all purchases are booked in advance from afar, usually from 300 to 400 miles driving distance from the booked hotel. Further, on any given night, about 70% of guests in any hotel are new to that specific hotel, having never stayed in that hotel previously; however, they usually are not new to the brand name of the destination hotel, having stayed many times in that brand. About half of all purchases in Texas are from out of state, further confirming the national basis of hotel brands.
For consumers, a hotel brand’s reliability in delivering a suitable and consistent product is paramount. Brand selection is based on consumer brand preference, a term of art in the marketing field, meaning the percentage of buyers who prefer one brand over another (for the occasion of purchase, which changes as each trip’s purpose changes).13 Brand preference is built over time by the brand’s product definition, by its geographic availability, by marketing its benefits, and by cumulative consumer experience with it.
For hotel investors, brand selection is consequently one of the most critical choices when developing a hotel. Experienced investors naturally gravitate toward those brand affiliations that add the most value to a project.
Brand is critical to the success of a hotel project. In any market, strong brands will outperform weak brands. Strong brands add significant value to a hotel project, including name recognition; a strong national marketing campaign and reservation system; frequent-traveler rewards programs; and strong, enforced quality-control standards.14 Weaker brands accept more marginal properties into their inventory, provide inconsistent levels of quality to the consumer, and have weak marketing spending and low brand preference.
The portion of the income attributable to the brand is clearly proven here to not be either real estate or tangible personal property; it is attributable to the intangible business component.15 Other authors agree that income and value attributed to the brand name is clearly not real estate.16 Similar statementsaremadebybothDowellandRushmore.17 This view does not appear to be disputed in hotel literature. However, it should be noted that this study contradicts an alternative approach of capitalizing the franchise fees to reflect business value.
Brand strength in generating revenues varies greatly and to ignore the differences between brands would be a serious error in a hotel development project. Properly addressing brand for appraisal purposes should be no less important.
Intended Use of Brand Analysis SystemBy knowing the near-exact revenue contribution to revenue of a specific brand name (the effect of its standards, systems, and quality enforcement), it is feasible to disaggregate an operating property’s market value accurately into its three components:
•Realassets–thehotelimprovementsanditsland.
•Tangiblepersonalproperty–primarilyinventoryfurniture, fixtures, and equipment.
•Intangiblehotelbusinessvalue–aswillbedem-onstrated, primarily the value of the brand in the operation. Other possible elements of business value are typically minor by comparison (such as contracts, cash, etc.) and are not considered here.
The Appraisal Journal, Summer 2012 New Option in Hotel Appraisals226
Reprinted with permission from The Appraisal Journal (2012, Summer) ©2012 by the Appraisal Institute, Chicago, Illinois. All Rights Reserved.
18. In Texas and many other states, only tangible personal property and real property are taxed.
19. We did not study lateral shifts of hotels within the marginal brands grouping.
With that in mind, the intended use of this analysis system is to assist in estimating the amount of intangible value attributable to a hotel’s brand affiliation. It is strongly contended that each brand carries its own value, and a simple appraisal classification of branded versus unbranded hotels is woefully inadequate and inherently inequitable to hoteliers. Critically, when assessing a hotel’s property tax valuation (less its franchise value and other intangible value), the contribution of the hotel brand must, in good faith, be accurately measured and credited to the property.18 Using a table of specific brand valuations could be one appraisal valuation approach, but tiered groupings of like hotels with similar brand values would be an acceptable alternative.
Because the system used here showed extremely high statistical stability, with individual case results grouped quite tightly around the different brand average values, there is a high probability that similar analysis can be conducted for virtually all established hotel brands.
Brand Analysis Case StudiesObtaining Cases for Brand SamplesThe initial step in the research was a careful search of the database to identify all properties within a list of target brands that had converted brands as follows:
•Converted to/from an independent propertydirectly from/to one of the six subject brands; and
•Convertedto/fromamarginalbranddirectly to/from one of the four mid-tier or upper-tier brands.19
Essentially, the study looks at the same property, affected only by a minor passage of time and difference in brand affiliation. A number of strong brands are examined, including Residence Inn, Hampton Inn, and Holiday Express, as well as the mid-level Comfort Inn brand. An examination of marginal brands was also conducted; these included America’s Best Value Inn and Howard Johnson.
For these six brands, all individual properties that had undergone a brand conversion since 1990 were examined. Importantly, any hotels among these identified conversions that did not meet specifically defined criteria were excluded. These criteria were strictly adhered to, eliminating any and all factors
other than brand conversion from consideration. The hotels that remained became samples for each studied brand. The established selection criteria included the following:
1. Brand change occurred since 1990
2. Independent (or marginal brand) for at least one year
3. Subject brand for at least 2 years (to allow ramp-ing up)
4. No periods of closure upon brand change
5. No extensive remodeling or renovations (nor-mal, routine renovations only)
6. No lateral conversions to similar/parallel brands
7. No conversions to more prominent budget brands(Super8,DaysInn,Motel6,etc.)
8. No major change in room counts or splitting of properties
9. Absence of long-term contracts that would impact the conversion data
10. No estimated data within studied periods (tax reports to the state only)
Financial performance was not examined or consid-ered in any way in the selection process.
It became apparent in the gathering of sample properties that those brands that added the most value to a property also tended to have far less volatility, with owners making greater efforts to retain the brand and brand swapping occurring only when mandated by the franchisor. Conversely, owners of properties with more marginal brand affiliations were frequently brand shopping, looking to trade or drop a brand in an attempt to find a market position that would improve their hotel’s performance, or allow financing or tax benefits. Naturally, brands with minimal brand swapping had fewer properties in their identified samples. The respective levels of brand volatility are not quantified but are an additional indicator of brand value.
By carefully selecting hotel samples for each brand studied, it was possible to isolate “brand” as the sole contributing factor in any identified shift in revenue performance. By tracking the revenue shift over a significant sampling of hotels that meet the established criteria, the brand values are accurately isolated and quantified.
New Option in Hotel Appraisals The Appraisal Journal, Summer 2012 227
Reprinted with permission from The Appraisal Journal (2012, Summer) ©2012 by the Appraisal Institute, Chicago, Illinois. All Rights Reserved.
20. Local markets include every nearby hotel and motel without exception, are geographically contiguous, and typically range from 15 to 35 properties in order to ensure stable relationships between the brands in the area and a stable market RevPAR. All properties in the market are included: the existing, the new, and the closures. Note that 15 to 35 properties is a sizeable if not very large market. Only Source Strategies’ database provides property-by-property results.
21. Conversely, a simple shift in revenues could be attributed to other factors, including added supply pressures, a change in local demand generators (military; oil and gas; hurricane impact; etc.), the general economy, or other market conditions.
Using revPAr Index for case StudiesThis study identified changes in a specific hotel’s RevPAR Index when the hotel either converted from a national brand to an independent or a marginal-brand property, or vice-versa. RevPAR was extracted on a quarterly basis from Source Strategies’ database for each hotel in the samples for the period surround-ing each conversion, along with the matching-period RevPAR for each hotel’s local market. The ratio between the subject’s RevPAR and the corresponding local market RevPAR is the RevPAR Index, or
RevPAR Index = Subject Hotel RevPAR LocalMarketRevPAR
The following shows examples of below-average, average, and above-average indices:
Subject Local Hotel Market RevPAR RevPAR / RevPAR = Index
$40 / $50 = .80 Below average
$50 / $50 = 1.00 Average
$60 / $50 = 1.20 Above average
Note that each local market defined in the study includes all nearby hotels and motels20 and thus eliminates the major bias that any selection of competitive sets would generate. Competitive sets are useful to judge operational efficiency but can be highly misleading when judging consumer acceptance because consumer hotel selection is strongly affected by the traveler’s changing and occasion-based need.
Since a hotel’s revenues or RevPAR can change due to economic and other market conditions, it is critical to measure a property’s RevPAR Index change over time, rather than dollar RevPAR or revenues, to quantify the subject hotel’s performance. Since local, regional, and even national events should affect all hotels within the given market to a similar degree, using a RevPAR Index provides an accurate measure of a hotel’s position versus its local competition (i.e., the market average).21 Tracking the RevPAR Index for the selected case studies effectively isolates the brand as the contributing factor to the subject brand change.
To maintain a consistent measure of performance shift, the difference going from the subject brand’s index to the independent or marginal brand’s index was always measured regardless of whether it was a conversion to or from the lesser product type. This measures, on a RevPAR Index basis, how much better or worse a hotel performed as the national brand than as an independent or marginally branded operation.
For example, if a hotel’s RevPAR Index versus its local market is 120 (20% above average) in the local market as the given brand, but immediately falls to 90 (10% below average) when the brand is dropped, there is a revenue decline of approximately 25% that can be attributed to the removal of the brand from that property (120 – 90) / 120 = .25). Conversely, if an independent property has an index of 90, and increases to 120 after 2 years ramping up as a subject brand, there is a 30-point RevPAR Index change. This approach keeps the statistics consistent across the entire sample, and it produces one set of numbers comparing the subject to the independent/marginal brand performance, rather than having separate sets of results for adding and dropping a brand.
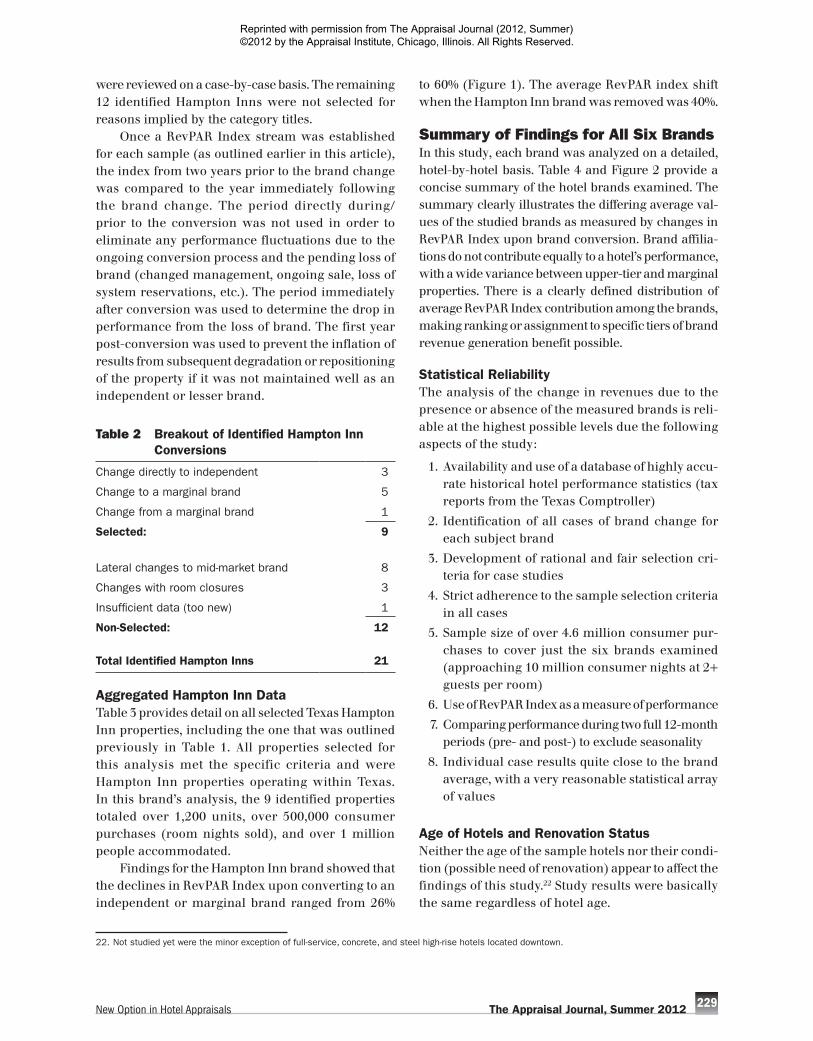
Case Study Example—Hampton Inn BrandIn an examination of brand changes involving the Hampton Inn brand, 21 separate properties operat-ing in the Texas market were identified that either added or dropped the Hampton Inn brand name since 1990. The detailed breakout of these properties and their selection status for use in this research is shown in Table 2, Breakout of Identified Hampton Inn Conversions.
In all 21 cases, the revenues for the hotel increased significantly if the Hampton Inn brand was added and dropped significantly if the Hampton Inn brand was lost. This was a consistent indicator of the brand’s high value in relation to an independent name or a marginal brand name.
Of the cases listed in Table 2, the first three categories were selected for review. There were 9 cases of Hampton Inns changing directly to an independent or to/from a marginal brand, which is the basic target of the research. These 9 examples
The Appraisal Journal, Summer 2012 New Option in Hotel Appraisals228
Reprinted with permission from The Appraisal Journal (2012, Summer) ©2012 by the Appraisal Institute, Chicago, Illinois. All Rights Reserved.
22. Not studied yet were the minor exception of full-service, concrete, and steel high-rise hotels located downtown.
were reviewed on a case-by-case basis. The remaining 12 identified Hampton Inns were not selected for reasons implied by the category titles.
Once a RevPAR Index stream was established for each sample (as outlined earlier in this article), the index from two years prior to the brand change was compared to the year immediately following the brand change. The period directly during/prior to the conversion was not used in order to eliminate any performance fluctuations due to the ongoing conversion process and the pending loss of brand (changed management, ongoing sale, loss of system reservations, etc.). The period immediately after conversion was used to determine the drop in performance from the loss of brand. The first year post-conversion was used to prevent the inflation of results from subsequent degradation or repositioning of the property if it was not maintained well as an independent or lesser brand.
Table 2 breakout of Identified Hampton Inn conversions
Change directly to independent 3
Change to a marginal brand 5
Change from a marginal brand 1
Selected: 9
Lateral changes to mid-market brand 8
Changes with room closures 3
Insufficient data (too new) 1
Non-Selected: 12
Total Identified Hampton Inns 21
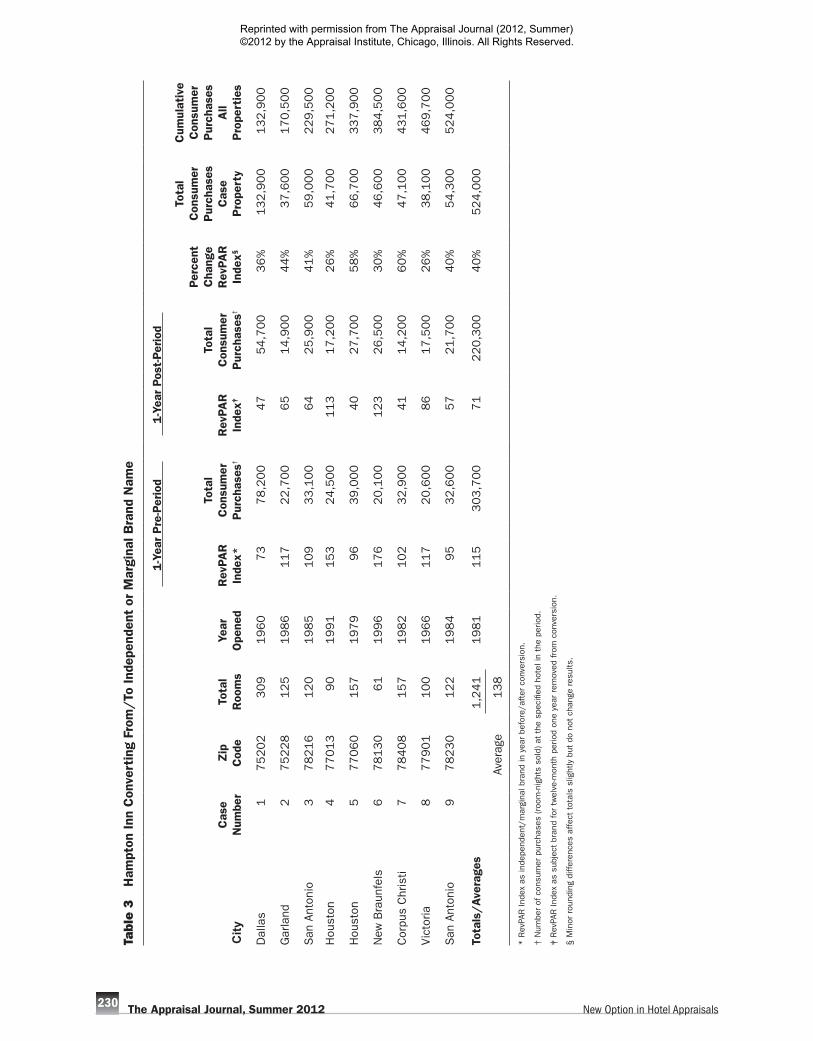
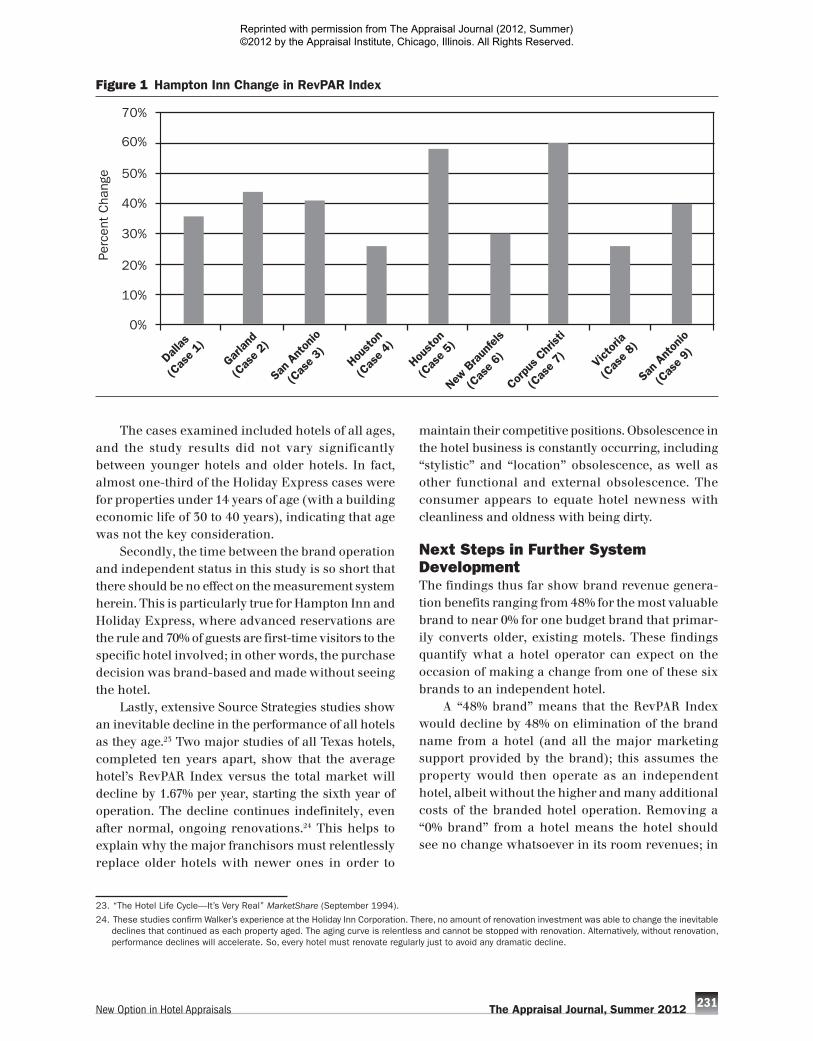
Aggregated Hampton Inn Data Table 3 provides detail on all selected Texas Hampton Inn properties, including the one that was outlined previously in Table 1. All properties selected for this analysis met the specific criteria and were Hampton Inn properties operating within Texas. In this brand’s analysis, the 9 identified properties totaled over 1,200 units, over 500,000 consumer purchases (room nights sold), and over 1 million people accommodated.
Findings for the Hampton Inn brand showed that the declines in RevPAR Index upon converting to an independent or marginal brand ranged from 26%
to 60% (Figure 1). The average RevPAR index shift when the Hampton Inn brand was removed was 40%.
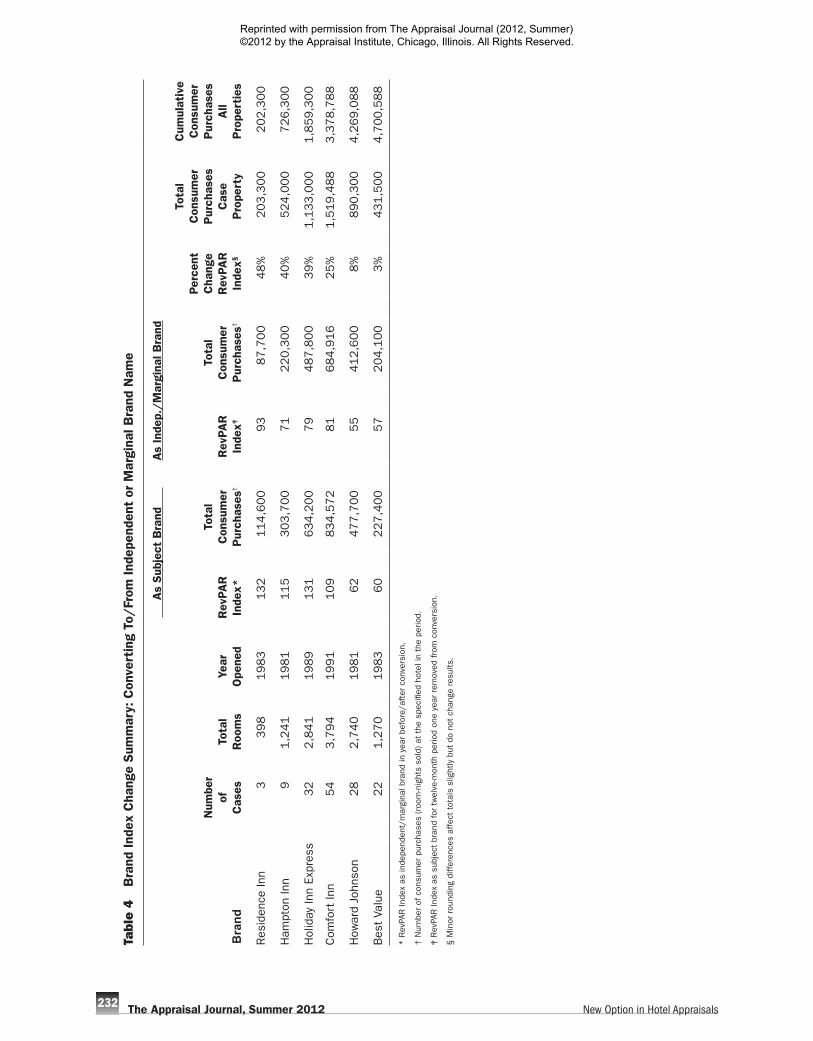
Summary of Findings for All Six BrandsIn this study, each brand was analyzed on a detailed, hotel-by-hotel basis. Table 4 and Figure 2 provide a concise summary of the hotel brands examined. The summary clearly illustrates the differing average val-ues of the studied brands as measured by changes in RevPAR Index upon brand conversion. Brand affilia-tions do not contribute equally to a hotel’s performance, with a wide variance between upper-tier and marginal properties. There is a clearly defined distribution of average RevPAR Index contribution among the brands, making ranking or assignment to specific tiers of brand revenue generation benefit possible.
Statistical reliabilityThe analysis of the change in revenues due to the presence or absence of the measured brands is reli-able at the highest possible levels due the following aspects of the study:
1. Availability and use of a database of highly accu-rate historical hotel performance statistics (tax reports from the Texas Comptroller)
2. Identification of all cases of brand change for each subject brand
3.Developmentofrationalandfairselectioncri-teria for case studies
4. Strict adherence to the sample selection criteria in all cases
5. Sample size of over 4.6 million consumer pur-chases to cover just the six brands examined (approaching 10 million consumer nights at 2+ guests per room)
6. Use of RevPAR Index as a measure of performance
7. Comparing performance during two full 12-month periods (pre- and post-) to exclude seasonality
8. Individual case results quite close to the brand average, with a very reasonable statistical array of values
Age of Hotels and renovation StatusNeither the age of the sample hotels nor their condi-tion (possible need of renovation) appear to affect the findings of this study.22 Study results were basically the same regardless of hotel age.
New Option in Hotel Appraisals The Appraisal Journal, Summer 2012 229
Reprinted with permission from The Appraisal Journal (2012, Summer) ©2012 by the Appraisal Institute, Chicago, Illinois. All Rights Reserved.
Tabl
e 3
H
ampt
on Inn
con
vert
ing
From
/To
Ind
epen
dent
or
Mar
gina
l bra
nd N
ame
1-Y
ear
Pre
-Per
iod
1-Y
ear
Pos
t-Per
iod
City
cas
e N
umbe
rZ
ip
cod
eTo
tal
roo
ms
Year
O
pene
dr
evPA
r
Inde
x*
Tota
l c
onsu
mer
P
urch
ases
†r
evPA
r
Inde
x‡
Tota
l c
onsu
mer
P
urch
ases
†
Per
cent
c
hang
e r
evPA
r
Inde
x§
Tota
l c
onsu
mer
P
urch
ases
c
ase
Pro
pert
y
cum
ulat
ive
con
sum
er
Pur
chas
es
All
Pro
pert
ies
Dal
las
175202
309
1960
73
78,2
00
47
54
,70
03
6%
13
2,9
00
13
2,9
00
Gar
land
275228
125
1986
117
22,7
00
65
14
,90
04
4%
37
,60
01
70
,50
0
San
Ant
onio
378216
120
1985
109
33,1
00
64
25
,90
04
1%
59
,00
02
29
,50
0
Hou
ston
477013
90
1991
153
24,5
00
113
17
,20
02
6%
41
,70
02
71
,20
0
Hou
ston
577060
157
1979
96
39,0
00
40
27
,70
05
8%
66
,70
03
37
,90
0
New
Bra
unfe
ls6
78130
61
1996
176
20,1
00
123
26
,50
03
0%
46
,60
03
84
,50
0
Cor
pus
Chr
isti
778408
157
1982
102
32,9
00
41
14
,20
06
0%
47
,10
04
31
,60
0
Vic
toria
877901
100
1966
117
20,6
00
86
17
,50
02
6%
38
,10
04
69
,70
0
San
Ant
onio
978230
122
1984
95
32,6
00
57
21
,70
04
0%
54
,30
05
24
,00
0
Tota
ls/
Ave
rage
s1,2
41
1981
115
303,7
00
71
22
0,3
00
40
%5
24
,00
0
Aver
age
138
* R
evPA
R In
dex
as in
depe
nden
t/m
argi
nal b
rand
in y
ear
befo
re/a
fter
con
vers
ion.
† N
umbe
r of
con
sum
er p
urch
ases
(ro
om-n
ight
s so
ld) at
the
spe
cifie
d ho
tel i
n th
e pe
riod.
‡ R
evPA
R In
dex
as s
ubje
ct b
rand
for
tw
elve
-mon
th p
erio
d on
e ye
ar r
emov
ed f
rom
con
vers
ion.
§ M
inor
rou
ndin
g di
ffer
ence
s af
fect
tot
als
slig
htly
but
do
not
chan
ge r
esul
ts.
The Appraisal Journal, Summer 2012 New Option in Hotel Appraisals230
Reprinted with permission from The Appraisal Journal (2012, Summer) ©2012 by the Appraisal Institute, Chicago, Illinois. All Rights Reserved.
23. “The Hotel Life Cycle—It’s Very Real” MarketShare (September 1994).
24. These studies confirm Walker’s experience at the Holiday Inn Corporation. There, no amount of renovation investment was able to change the inevitable declines that continued as each property aged. The aging curve is relentless and cannot be stopped with renovation. Alternatively, without renovation, performance declines will accelerate. So, every hotel must renovate regularly just to avoid any dramatic decline.
The cases examined included hotels of all ages, and the study results did not vary significantly between younger hotels and older hotels. In fact, almost one-third of the Holiday Express cases were for properties under 14 years of age (with a building economic life of 30 to 40 years), indicating that age was not the key consideration.
Secondly, the time between the brand operation and independent status in this study is so short that there should be no effect on the measurement system herein. This is particularly true for Hampton Inn and Holiday Express, where advanced reservations are the rule and 70% of guests are first-time visitors to the specific hotel involved; in other words, the purchase decision was brand-based and made without seeing the hotel.
Lastly, extensive Source Strategies studies show an inevitable decline in the performance of all hotels as they age.23 Two major studies of all Texas hotels, completed ten years apart, show that the average hotel’s RevPAR Index versus the total market will decline by 1.67% per year, starting the sixth year of operation. The decline continues indefinitely, even after normal, ongoing renovations.24 This helps to explain why the major franchisors must relentlessly replace older hotels with newer ones in order to
maintain their competitive positions. Obsolescence in the hotel business is constantly occurring, including “stylistic” and “location” obsolescence, as well as other functional and external obsolescence. The consumer appears to equate hotel newness with cleanliness and oldness with being dirty.
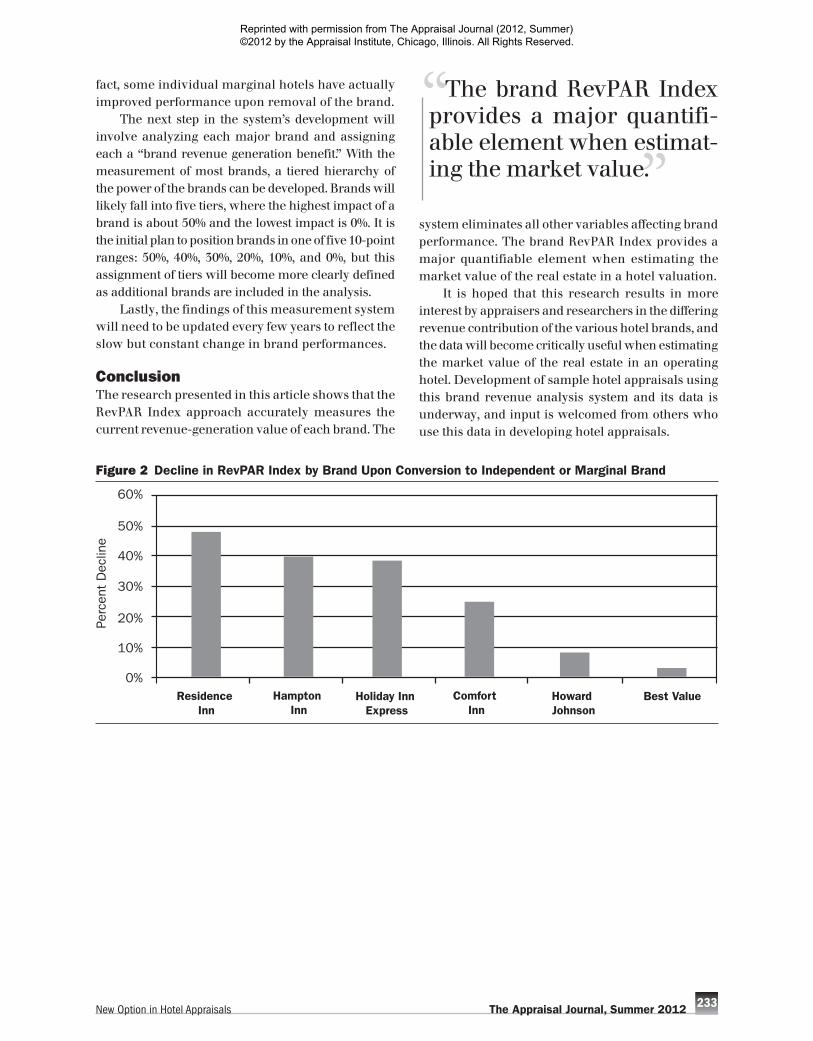
Next Steps in Further System DevelopmentThe findings thus far show brand revenue genera-tion benefits ranging from 48% for the most valuable brand to near 0% for one budget brand that primar-ily converts older, existing motels. These findings quantify what a hotel operator can expect on the occasion of making a change from one of these six brands to an independent hotel.
A “48% brand” means that the RevPAR Index would decline by 48% on elimination of the brand name from a hotel (and all the major marketing support provided by the brand); this assumes the property would then operate as an independent hotel, albeit without the higher and many additional costs of the branded hotel operation. Removing a “0% brand” from a hotel means the hotel should see no change whatsoever in its room revenues; in
Figure 1 Hampton Inn change in revPAr Index
70%Pe
rcen
t C
hang
e
60%
50%
40%
30%
20%
10%
0%
Dallas
(Cas
e 1)
Garlan
d
(Cas
e 2)
San Ant
onio
(Cas
e 3)
Houst
on
(Cas
e 4)
Houst
on
(Cas
e 5)
New B
raun
fels
(Cas
e 6)
Corpu
s Chr
isti
(Cas
e 7) Vi
ctor
ia
(Cas
e 8)
San Ant
onio
(Cas
e 9)
New Option in Hotel Appraisals The Appraisal Journal, Summer 2012 231
Reprinted with permission from The Appraisal Journal (2012, Summer) ©2012 by the Appraisal Institute, Chicago, Illinois. All Rights Reserved.
Tabl
e 4
b
rand
Ind
ex c
hang
e Sum
mar
y: c
onve
rtin
g To
/Fr
om Ind
epen
dent
or
Mar
gina
l bra
nd N
ame
As
Sub
ject
bra
ndA
s In
dep.
/M
argi
nal b
rand
Bra
nd
Num
ber
of
cas
esTo
tal
roo
ms
Year
O
pene
dr
evPA
r
Inde
x*
Tota
l c
onsu
mer
P
urch
ases
†r
evPA
r
Inde
x‡
Tota
l c
onsu
mer
P
urch
ases
†
Per
cent
c
hang
e r
evPA
r
Inde
x§
Tota
l c
onsu
mer
P
urch
ases
c
ase
Pro
pert
y
cum
ulat
ive
con
sum
er
Pur
chas
es
All
Pro
pert
ies
Res
iden
ce In
n3
398
1983
132
114,6
00
93
87
,70
04
8%
20
3,3
00
20
2,3
00
Ham
pton
Inn
91,2
41
1981
115
303,7
00
71
220
,30
04
0%
52
4,0
00
72
6,3
00
Hol
iday
Inn
Expr
ess
32
2,8
41
1989
131
634,2
00
79
487
,80
03
9%
1,1
33,0
00
1,8
59,3
00
Com
fort
Inn
54
3,7
94
1991
109
834,5
72
81
684
,91
62
5%
1,5
19,4
88
3,3
78,7
88
How
ard
John
son
28
2,7
40
1981
62
477,7
00
55
412
,60
08
%8
90
,30
04,2
69,0
88
Bes
t Va
lue
22
1,2
70
1983
60
227,4
00
57
204
,10
03
%4
31
,50
04,7
00,5
88
* R
evPA
R In
dex
as in
depe
nden
t/m
argi
nal b
rand
in y
ear
befo
re/a
fter
con
vers
ion.
† N
umbe
r of
con
sum
er p
urch
ases
(ro
om-n
ight
s so
ld) at
the
spe
cifie
d ho
tel i
n th
e pe
riod.
‡ R
evPA
R In
dex
as s
ubje
ct b
rand
for
tw
elve
-mon
th p
erio
d on
e ye
ar r
emov
ed f
rom
con
vers
ion.
§ M
inor
rou
ndin
g di
ffer
ence
s af
fect
tot
als
slig
htly
but
do
not
chan
ge r
esul
ts.
The Appraisal Journal, Summer 2012 New Option in Hotel Appraisals232
Reprinted with permission from The Appraisal Journal (2012, Summer) ©2012 by the Appraisal Institute, Chicago, Illinois. All Rights Reserved.
fact, some individual marginal hotels have actually improved performance upon removal of the brand.
The next step in the system’s development will involve analyzing each major brand and assigning each a “brand revenue generation benefit.” With the measurement of most brands, a tiered hierarchy of the power of the brands can be developed. Brands will likely fall into five tiers, where the highest impact of a brand is about 50% and the lowest impact is 0%. It is the initial plan to position brands in one of five 10-point ranges: 50%, 40%, 30%, 20%, 10%, and 0%, but this assignment of tiers will become more clearly defined as additional brands are included in the analysis.
Lastly, the findings of this measurement system will need to be updated every few years to reflect the slow but constant change in brand performances.
ConclusionThe research presented in this article shows that the RevPAR Index approach accurately measures the current revenue-generation value of each brand. The
system eliminates all other variables affecting brand performance. The brand RevPAR Index provides a major quantifiable element when estimating the market value of the real estate in a hotel valuation.
It is hoped that this research results in more interest by appraisers and researchers in the differing revenue contribution of the various hotel brands, and the data will become critically useful when estimating the market value of the real estate in an operating hotel.Developmentofsamplehotelappraisalsusingthis brand revenue analysis system and its data is underway, and input is welcomed from others who use this data in developing hotel appraisals.
Figure 2 Decline in revPAr Index by brand Upon conversion to Independent or Marginal brand
60%
50%
40%
30%
Perc
ent
Dec
line
20%
10%
0%Residence
InnHampton
InnHoliday Inn
ExpressComfort
InnHoward Johnson
Best Value
New Option in Hotel Appraisals The Appraisal Journal, Summer 2012 233
The brand RevPAR Index provides a major quantifi-able element when estimat- ing the market value.
Reprinted with permission from The Appraisal Journal (2012, Summer) ©2012 by the Appraisal Institute, Chicago, Illinois. All Rights Reserved.
A. Scruggs Love, MAI, SrA, crE, ASA, is an independent real estate appraiser at Love and Associates in Hondo, Texas. He is a certified gen-eral real estate appraiser in Texas. He specializes
in appraising commercial and rural property, and in litigation support. Love has been involved in the
development and review of many appraisal courses and was a frequent national teacher of many
Appraisal Institute courses. He has been awarded the Harold D. Albritton Award by the American Institute of Real Estate Appraisers and served as the 1990
president of the Institute. Love attended Texas A&M University, received a BBA from Texas A&I (now Texas
A&M–Kingsville), and attended graduate business school at the University of Texas–Austin.
contact: [email protected]
bruce H. Walker is president of Source Strategies, Inc., a Texas hotel consultancy and publisher in the
lodging industry, which has developed over 1,000 hotel financial feasibility studies. Since 1988, Walker
has written the quarterly Texas Hotel Performance
Report for the Governor’s Office of Tourism and Economic Development, the Hotel Brand Report news-
letter, and the Texas Hotel Performance Factbook, he has been published in The Cornell Quarterly. He has
created and maintains a database on 4,800+ indi-vidual Texas hotels, from 1980 to present, based on Texas tax records, and he testifies regularly. Walker
previously served as brand manager for Procter & Gamble, and as senior vice president of marketing and strategic planning for the Holiday Corporation
and for La Quinta Motor Inns. Walker holds an MBA from Harvard and a BA in economics from Amherst
College. contact: [email protected]
Douglas W. Sutton is executive vice president of Source Strategies, Inc., specializing in development of
hotel feasibility studies, database software devel-opment, and special studies. His articles on hotel
brands have appeared in the Hotel Brand Report. He provides litigation support, analysis, and strategy for hotel litigation and testimony. He served as a
captain and as information officer for the Directorate of Special Weapons at Kelly Air Force Base in Texas.
Sutton received a BS in computer and information sciences from Troy State University.
contact: [email protected]
Web ConnectionsInternet resources suggested by the Y. T. and Louise Lee Lum Library
Appraisal Institute—Guide Note 5: Appraisals of Real Estate with Related Personal Property, Business Property, or Intangible Assets
http://www.appraisalinstitute.org/PPC/downloads/guide_note_5.pdf
PKF Hospitality Research—Hotel Financial Reports and Forecastshttp://www.pkfc.com/store/
Source Strategies, Inc.—Hotel Brand Reporthttp://www.sourcestrategies.org/hotelbrandreport.html
STR Global/Smith Travel Research—HOST Studyhttp://www.strglobal.com/
—Hotel News Nowhttp://www.hotelnewsnow.com
The Appraisal Journal, Summer 2012 New Option in Hotel Appraisals234
Reprinted with permission from The Appraisal Journal (2012, Summer) ©2012 by the Appraisal Institute, Chicago, Illinois. All Rights Reserved.