new mexico standards based assessment (nmsba) technical ... · new mexico standards based...
TRANSCRIPT
New Mexico Standards Based Assessment (NMSBA)
Technical Report: 2006 Spring Administration
Psychometric and Research Services
Harcourt Assessment, Inc.
San Antonio, TX
2006 NMSBA Technical Report Page 2
Prepared by Harcourt Assessment, Inc for the New Mexico Public Education Department
Forward
The 2006 New Mexico Standard Based Assessment (NMSBA) Technical Report provides summaries and documentation of the development, scoring, and psychometric activities for Mathematics, Reading, and Science in 2006 Spring Administration.
This report was prepared by Dr. Gerald W. Griph, Senior Psychometrician. Ms. Holly Zhang, Senior Statistical Analyst provided invaluable assistance with the statistical analyses.
2006 NMSBA Technical Report Page 3
Prepared by Harcourt Assessment, Inc for the New Mexico Public Education Department
Table of Contents
1.Introduction .................................................................................................................................12
2. Test Development ......................................................................................................................13
2.1 Test Design ...................................................................................................................... 14
2.2 Item Development............................................................................................................ 16
2.3 Field Test and Item Analysis ........................................................................................... 18
2.4 Data Review and Item Selection for Operational Use ..................................................... 22 3. Scoring Procedures.....................................................................................................................25
3.1 Processing for Student Documents .................................................................................. 25
3.2 Scoring Constructed Response Items............................................................................... 28 4. Calibration, Scaling, and Equating Procedures ..........................................................................34
4.1 Introduction...................................................................................................................... 34
4.2 IRT Calibration Model and Equating .............................................................................. 34
4.2 Developing the Vertical Scale ......................................................................................... 39
4.3 Final Reporting Scale Results.......................................................................................... 40 5. Standard Setting .........................................................................................................................43
5.1 Standard Setting Procedures ............................................................................................ 43
5.2 Smoothing procedures and Final Results......................................................................... 45 6. Reliability...................................................................................................................................51
6.1 Coefficient Alpha and CTT SEM .................................................................................... 51
6.2 IRT Conditional SEMs .................................................................................................... 54
6.3 Decision Consistency and Accuracy................................................................................ 54
6.4 Interrater Reliability......................................................................................................... 60 7. Validity.......................................................................................................................................64
7.1 Internal Structure Evidence.............................................................................................. 64
7.2 External Validity Evidence .............................................................................................. 74 References ......................................................................................................................................76
Appendix A. Item Number and Score Points for Standards and Benchmarks ...............................78
Appendix B. Raw Score, Scale Score, and IRT SEM....................................................................88
Appendix C. Raw Score and Scale Score Frequency Tables .......................................................160
Appendix D. Performance Level Percentages by Subgroups.......................................................229
Appendix E. Interrater Reliability (Agreement)..........................................................................254
Appendix F. Item statistics and IRT Item Location Parameter (Rasch Difficulty) Estimates with Item
Fit Measures.................................................................................................................................268
2006 NMSBA Technical Report Page 4
Prepared by Harcourt Assessment, Inc for the New Mexico Public Education Department
List of Figures & Tables
Figure 2.1 Schematic of the 2006 NMSBA ..................................................................................13
Figure 2.2 Overview of test development process .....................................................................14
Table 2.1-1 Summary of Number of items and Points for NMSBA English Test .....................15
Table 2.1-2 Summary of Number of Items and Points for NMSBA Spanish Test ...................16
Table 2.3-1 2 × T Contingency Table at theth
k level ................................................................20
Table 2.3-3 DIF Classification for MC Items .............................................................................22
Table 4.2-1 Criteria to Evaluate Mean-Square Fit Statistics ....................................................36
Table 4.1-2 Average and Standard Deviation of Item Fit Statistics .........................................37
Table 4.1-3 Item Fit Classification Frequencies for NMSBA English Test ..............................38
Table 4.1-4 Item Fit Classification Frequencies for NMSBA Spanish Test .............................39
Table 4.3-1 Scale Score Summary for NMSBA English Test (Non-BIA Schools) ....................40
Table 4.3-2 Scale Score Summary for NMSBA Spanish Test ....................................................41
Table 4.3-3 Scale Score Summary for NMSBA English Test (BIA Schools).............................42
Figure 5.1-1. Performance Levels and Cut Scores .......................................................................43
Table 5.2-1 Performance Level Scale Score Intervals for NMSBA English Test ......................45
Table 5.2-2 Performance Level Scale Score Intervals for NMSBA Spanish Test .....................46
Table 5.2-3 Percentages at Each Performance Level (NMSBA English Test, non-BIA schools)47
Table 5.2-4 Percentages at Each Performance Level (NMSBA English Test, BIA schools) ...48
Table 5.2-5 Percentages at Each Performance Levels (NMSBA Spanish Test, All schools [no non-
BIA schools]).................................................................................................................................49
Table 6.1-1 Coefficient Alpha, CTT Standard Error of Measurement, and Raw Score Summary for
NMSBA English Test (Non-BIA Schools) ..................................................................................52
Figure 6.3-1. Classification Accuracy ..........................................................................................56
Figure 6.3-2. Classification Consistency ....................................................................................56
Table 6.3-1 Classification Accuracy for NMSBA English Test (Percentage) ...........................57
2006 NMSBA Technical Report Page 5
Prepared by Harcourt Assessment, Inc for the New Mexico Public Education Department
Table 6.3-2 Classification Consistency for NMSBA English Test (Percentage) .....................58
Table 6.3-3 Classification Accuracy for NMSBA Spanish Test (Percentage)..........................59
Table 6.3-4 Classification Consistency for NMSBA Spanish Test (Percentage) ....................60
Figure 6.4-1 Interrater Agreement Indices for an Open-Ended Item.......................................61
Table 6.4-1 Summary of Interrater Reliabilities for NMSBA English Test ..............................62
Table 7.1-1 Eigenvalues for First and Second Principle Components and Ratio. ....................66
Table 7.1-2 Summary of the item-total correlations ..................................................................67
Table 7.1-3 Reporting Category Correlations for English Mathematics..................................68
Table 7.1-4 Reporting Category Correlations for English Reading..........................................69
Table 7.1-5 Reporting Category Correlations for English Science ...........................................70
Table 7.1-6 Reporting Category Correlations for Spanish Mathematics .................................71
Table 7.1-7 Reporting Category Correlations for Spanish Reading .........................................72
Table 7.1-8 Reporting Category Correlations for Spanish Science...........................................73
Table 7.2-1 Correlations Among the Content Areas ..................................................................75
Table A.1.1 English Mathematics Items & Points by Standard/Benchmark (Grades 3-5) .....78
Table A.1.2 English Mathematics Items & Points by Standard/Benchmark (Grades 6-8) ....79
Table A.1.3 English Mathematics Items & Points by Standard/Benchmark (Grade 9)..........80
Table A.2.1 English Reading Items & Points by Standard/Benchmark (Grades 3-6).............80
Table A.2.2 English Reading Items & Points by Standard/Benchmark (Grades 7-9) ............81
Table A.3.1 English Science Items & Points by Standard/Benchmark (Grades 3-6) ..............81
Table A.3.2 English Science Items & Points by Standard/Benchmark (Grades 7-9)..............82
Table A.4.1 Spanish Mathematics Items & Points by Standard/Benchmark (Grades 3-5)....83
Table A.4.2 Spanish Mathematics Items & Points by Standard/Benchmark (Grades 6-8)...84
Table A.4.3 Spanish Mathematics Items & Points by Standard/Benchmark (Grade 9) ........85
Table A.5.1 Spanish Reading Items & Points by Standard/Benchmark (Grades 3-6) ............85
Table A.5.2 Spanish Reading Items & Points by Standard/Benchmark (Grades 7-9) ...........86
2006 NMSBA Technical Report Page 6
Prepared by Harcourt Assessment, Inc for the New Mexico Public Education Department
Table A.6.1 Spanish Science Items & Points by Standard/Benchmark (Grades 3-6) .............86
Table A.6.2 Spanish Science Items & Points by Standard/Benchmark (Grades 7-9).............87
Table B.1 Raw Score, Scale Score, SEM, and Scale Score ± 1 SEM (English Grade 3 Math) ...88
Table B.2 Raw Score, Scale Score, SEM, and Scale Score ± 1 SEM (English Grade 4 Math) ..89
Table B.3 Raw Score, Scale Score, SEM, and Scale Score ± 1 SEM (English Grade 5 Math)...91
Table B.4 Raw Score, Scale Score, SEM, and Scale Score ± 1 SEM (English Grade 6 Math) ..93
Table B.5 Raw Score, Scale Score, SEM, and Scale Score ± 1 SEM (English Grade 7 Math)...95
Table B.6 Raw Score, Scale Score, SEM, and Scale Score ± 1 SEM (English Grade 8 Math) ..97
Table B.7 Raw Score, Scale Score, SEM, and Scale Score ± 1 SEM (English Grade 9 Math)...99
Table B.8 Raw Score, Scale Score, SEM, and Scale Score ± 1 SEM (English Grade 3 Reading)101
Table B.9 Raw Score, Scale Score, SEM, and Scale Score ± 1 SEM (English Grade 4 Reading)103
Table B.10 Raw Score, Scale Score, SEM, and Scale Score ± 1 SEM (English Grade 5 Reading)105
Table B.11 Raw Score, Scale Score, SEM, and Scale Score ± 1 SEM (English Grade 6 Reading)106
Table B.12 Raw Score, Scale Score, SEM, and Scale Score ± 1 SEM (English Grade 7 Reading)108
Table B.13 Raw Score, Scale Score, SEM, and Scale Score ± 1 SEM (English Grade 8 Reading)109
Table B.14 Raw Score, Scale Score, SEM, and Scale Score ± 1 SEM (English Grade 9 Reading)111
Table B.15 Raw Score, Scale Score, SEM, and Scale Score ± 1 SEM (English Grade 3 Science)113
Table B.16 Raw Score, Scale Score, SEM, and Scale Score ± 1 SEM (English Grade 4 Science)114
Table B.17 Raw Score, Scale Score, SEM, and Scale Score ± 1 SEM (English Grade 5 Science)116
Table B.18 Raw Score, Scale Score, SEM, and Scale Score ± 1 SEM (English Grade 6 Science)117
Table B.19 Raw Score, Scale Score, SEM, and Scale Score ± 1 SEM (English Grade 7 Science)119
Table B.20 Raw Score, Scale Score, SEM, and Scale Score ± 1 SEM (English Grade 8 Science)120
Table B.21 Raw Score, Scale Score, SEM, and Scale Score ± 1 SEM (English Grade 9 Science)122
Table B.22 Raw Score, Scale Score, SEM, and Scale Score ± 1 SEM (Spanish Grade 3 Math)124
Table B.23 Raw Score, Scale Score, SEM, and Scale Score ± 1 SEM (Spanish Grade 4 Math)125
Table B.24 Raw Score, Scale Score, SEM, and Scale Score ± 1 SEM (Spanish Grade 5 Math)127
2006 NMSBA Technical Report Page 7
Prepared by Harcourt Assessment, Inc for the New Mexico Public Education Department
Table B.25 Raw Score, Scale Score, SEM, and Scale Score ± 1 SEM (Spanish Grade 6 Math)129
Table B.26 Raw Score, Scale Score, SEM, and Scale Score ± 1 SEM (Spanish Grade 7 Math)131
Table B.27 Raw Score, Scale Score, SEM, and Scale Score ± 1 SEM (Spanish Grade 8 Math)133
Table B.28 Raw Score, Scale Score, SEM, and Scale Score ± 1 SEM (Spanish Grade 9 Math)135
Table B.29 Raw Score, Scale Score, SEM, and Scale Score ± 1 SEM (Spanish Grade 3 Reading)
......................................................................................................................................................137
Table B.30 Raw Score, Scale Score, SEM, and Scale Score ± 1 SEM (Spanish Grade 4 Reading)
......................................................................................................................................................139
Table B.31 Raw Score, Scale Score, SEM, and Scale Score ± 1 SEM (Spanish Grade 5 Reading)141
Table B.32 Raw Score, Scale Score, SEM, and Scale Score ± 1 SEM (Spanish Grade 6 Reading)
......................................................................................................................................................142
Table B.33 Raw Score, Scale Score, SEM, and Scale Score ± 1 SEM (Spanish Grade 7 Reading) 144
Table B.34 Raw Score, Scale Score, SEM, and Scale Score ± 1 SEM (Spanish Grade 8 Reading)
......................................................................................................................................................146
Table B.35 Raw Score, Scale Score, SEM, and Scale Score ± 1 SEM (Spanish Grade 9 Reading)
......................................................................................................................................................147
Table B.36 Raw Score, Scale Score, SEM, and Scale Score ± 1 SEM (Spanish Grade 3 Science)149
Table B.37 Raw Score, Scale Score, SEM, and Scale Score ± 1 SEM (Spanish Grade 4 Science)151
Table B.38 Raw Score, Scale Score, SEM, and Scale Score ± 1 SEM (Spanish Grade 5 Science)152
Table B.39 Raw Score, Scale Score, SEM, and Scale Score ± 1 SEM (Spanish Grade 6 Science)154
Table B.40 Raw Score, Scale Score, SEM, and Scale Score ± 1 SEM (Spanish Grade 7 Science)155
Table B.41 Raw Score, Scale Score, SEM, and Scale Score ± 1 SEM (Spanish Grade 8 Science)156
Table B.42 Raw Score, Scale Score, SEM, and Scale Score ± 1 SEM (Spanish Grade 9 Science)158
Table C.1 Raw/Scale Score Simple & Cumulative Frequencies (English Grade 3 Math).....160
Table C.2 Raw/Scale Score Simple & Cumulative Frequencies (English Grade 4 Math)....161
Table C.3 Raw/Scale Score Simple & Cumulative Frequencies (English Grade 5 Math) ....163
2006 NMSBA Technical Report Page 8
Prepared by Harcourt Assessment, Inc for the New Mexico Public Education Department
Table C.4 Raw/Scale Score Simple & Cumulative Frequencies (English Grade 6 Math)....165
Table C.5 Raw/Scale Score Simple & Cumulative Frequencies (English Grade 7 Math) ....167
Table C.6 Raw/Scale Score Simple & Cumulative Frequencies (English Grade 8 Math) ....169
Table C.7 Raw/Scale Score Simple & Cumulative Frequencies (English Grade 9 Math) ....171
Table C.8 Raw/Scale Score Simple & Cumulative Frequencies (English Grade 3 Reading)173
Table C.9 Raw/Scale Score Simple & Cumulative Frequencies (English Grade 4 Reading)174
Table C.10 Raw/Scale Score Simple & Cumulative Frequencies (English Grade 5 Reading)176
Table C.11 Raw/Scale Score Simple & Cumulative Frequencies (English Grade 6 Reading)177
Table C.12 Raw/Scale Score Simple & Cumulative Frequencies (English Grade 7 Reading)179
Table C.13 Raw/Scale Score Simple & Cumulative Frequencies (English Grade 8 Reading)181
Table C.14 Raw/Scale Score Simple & Cumulative Frequencies (English Grade 9 Reading)182
Table C.15 Raw/Scale Score Simple & Cumulative Frequencies (English Grade 3 Science)184
Table C.16 Raw/Scale Score Simple & Cumulative Frequencies (English Grade 4 Science)185
Table C.17 Raw/Scale Score Simple & Cumulative Frequencies (English Grade 5 Science)187
Table C.18 Raw/Scale Score Simple & Cumulative Frequencies (English Grade 6 Science)188
Table C.19 Raw/Scale Score Simple & Cumulative Frequencies (English Grade 7 Science)189
Table C.20 Raw/Scale Score Simple & Cumulative Frequencies (English Grade 8 Science)191
Table C.21 Raw/Scale Score Simple & Cumulative Frequencies (English Grade 9 Science)192
Table C.22 Raw/Scale Score Simple & Cumulative Frequencies (Spanish Grade 3 Math) .194
Table C.23 Raw/Scale Score Simple & Cumulative Frequencies (Spanish Grade 4 Math) .196
Table C.24 Raw/Scale Score Simple & Cumulative Frequencies (Spanish Grade 5 Math) .197
Table C.25 Raw/Scale Score Simple & Cumulative Frequencies (Spanish Grade 6 Math) .199
Table C.26 Raw/Scale Score Simple & Cumulative Frequencies (Spanish Grade 7 Math) .201
Table C.27 Raw/Scale Score Simple & Cumulative Frequencies (Spanish Grade 8 Math) .203
Table C.28 Raw/Scale Score Simple & Cumulative Frequencies (Spanish Grade 9 Math) .205
Table C.29 Raw/Scale Score Simple & Cumulative Frequencies (Spanish Grade 3 Reading)207
2006 NMSBA Technical Report Page 9
Prepared by Harcourt Assessment, Inc for the New Mexico Public Education Department
Table C.30 Raw/Scale Score Simple & Cumulative Frequencies (Spanish Grade 4 Reading)209
Table C.31 Raw/Scale Score Simple & Cumulative Frequencies (Spanish Grade 5 Reading)210
Table C.32 Raw/Scale Score Simple & Cumulative Frequencies (Spanish Grade 6 Reading)212
Table C.33 Raw/Scale Score Simple & Cumulative Frequencies (Spanish Grade 7 Reading)213
Table C.34 Raw/Scale Score Simple & Cumulative Frequencies (Spanish Grade 8 Reading)215
Table C.35 Raw/Scale Score Simple & Cumulative Frequencies (Spanish Grade 9 Reading)217
Table C.36 Raw/Scale Score Simple & Cumulative Frequencies (Spanish Grade 3 Science)218
Table C.37 Raw/Scale Score Simple & Cumulative Frequencies (Spanish Grade 4 Science)220
Table C.38 Raw/Scale Score Simple & Cumulative Frequencies (Spanish Grade 5 Science)221
Table C.39 Raw/Scale Score Simple & Cumulative Frequencies (Spanish Grade 6 Science)223
Table C.40 Raw/Scale Score Simple & Cumulative Frequencies (Spanish Grade 7 Science)224
Table C.41 Raw/Scale Score Simple & Cumulative Frequencies (Spanish Grade 8 Science)225
Table C.42 Raw/Scale Score Simple & Cumulative Frequencies (Spanish Grade 9 Science)227
Table D.1 Performance Level Classification Percentages for Selected Demographic Subgroups
(English Math, non-BIA schools)..............................................................................................229
Table D.2 Performance Level Classification Percentages for Selected Demographic Subgroups
(English Reading, non-BIA schools) .........................................................................................232
Table D.4 Performance Level Classification Percentages for Selected Demographic Subgroups
(Spanish Math, non-BIA schools) .............................................................................................239
Table D.5 Performance Level Classification Percentages for Selected Demographic Subgroups
(Spanish Reading, non-BIA schools) ........................................................................................242
Table D.6 Performance Level Classification Percentages for Selected Demographic Subgroups
(Spanish Science, non-BIA schools)..........................................................................................244
Table D.7 Performance Level Classification Percentages for Selected Demographic Subgroups
(English Math, BIA schools)......................................................................................................246
2006 NMSBA Technical Report Page 10
Prepared by Harcourt Assessment, Inc for the New Mexico Public Education Department
Table D.8 Performance Level Classification Percentages for Selected Demographic Subgroups
(English Reading, BIA schools) .................................................................................................249
Table D.9 Performance Level Classification Percentages for Selected Demographic Subgroups
(English Science, BIA schools) ..................................................................................................251
Table E.1 Interrater Agreement (English Math) ......................................................................254
Table E.2 Interrater Agreement (English Reading).................................................................257
Table E.3 Interrater Agreement (English Science) ..................................................................259
Table E.4 Interrater Agreement (Spanish Math).....................................................................260
Table E.5 Interrater Agreement (Spanish Reading) ................................................................263
Table E.6 Interrater Agreement (Spanish Science) .................................................................265
Table F.1 Item Statistics for Operational Items (English Grade 3 Math) ..............................268
Table F.2 Item Statistics for Operational Items (English Grade 4 Math) .............................269
Table F.3 Item Statistics for Operational Items (English Grade 5 Math) .............................270
Table F.4 Item Statistics for Operational Items (English Grade 6 Math) .............................272
Table F.5 Item Statistics for Operational Items (English Grade 7 Math)..............................273
Table F.6 Item Statistics for Operational Items (English Grade 8 Math) .............................275
Table F.7 Item Statistics for Operational Items (English Grade 9 Math) .............................276
Table F.8 Item Statistics for Operational Items (English Grade 3 Reading).........................277
Table F.9 Item Statistics for Operational Items (English Grade 4 Reading) ........................279
Table F.10 Item Statistics for Operational Items (English Grade 5 Reading) .......................280
Table F.11 Item Statistics for Operational Items (English Grade 6 Reading)........................281
Table F.12 Item Statistics for Operational Items (English Grade 7 Reading) .......................282
Table F.13 Item Statistics for Operational Items (English Grade 8 Reading) .......................283
Table F.14 Item Statistics for Operational Items (English Grade 9 Reading) .......................284
Table F.15 Item Statistics for Operational Items (English Grade 3 Science).........................285
Table F.16 Item Statistics for Operational Items (English Grade 4 Science) ........................287
2006 NMSBA Technical Report Page 11
Prepared by Harcourt Assessment, Inc for the New Mexico Public Education Department
Table F.17 Item Statistics for Operational Items (English Grade 5 Science).........................288
Table F.18 Item Statistics for Operational Items (English Grade 6 Science).........................289
Table F.19 Item Statistics for Operational Items (English Grade 7 Science).........................290
Table F.20 Item Statistics for Operational Items (English Grade 8 Science)........................291
Table F.21 Item Statistics for Operational Items (English Grade 9 Science) ........................292
Table F.22 Item Statistics for Operational Items (Spanish Grade 3 Math)...........................293
Table F.23 Item Statistics for Operational Items (Spanish Grade 4 Math) ..........................295
Table F.24 Item Statistics for Operational Items (Spanish Grade 5 Math) ..........................296
Table F.25 Item Statistics for Operational Items (Spanish Grade 6 Math)...........................297
Table F.26 Item Statistics for Operational Items (Spanish Grade 7 Math)...........................299
Table F.27 Item Statistics for Operational Items (Spanish Grade 8 Math)...........................300
Table F.28 Item Statistics for Operational Items (Spanish Grade 9 Math) ..........................302
Table F.29 Item Statistics for Operational Items (Spanish Grade 3 Reading)......................303
Table F.30 Item Statistics for Operational Items (Spanish Grade 4 Reading)......................304
Table F.31 Item Statistics for Operational Items (Spanish Grade 5 Reading) ......................305
Table F.32 Item Statistics for Operational Items (Spanish Grade 6 Reading)......................306
Table F.33 Item Statistics for Operational Items (Spanish Grade 7 Reading) ......................308
Table F.34 Item Statistics for Operational Items (Spanish Grade 8 Reading)......................309
Table F.35 Item Statistics for Operational Items (Spanish Grade 9 Reading)......................310
Table F.36 Item Statistics for Operational Items (Spanish Grade 3 Science) .......................311
Table F.37 Item Statistics for Operational Items (Spanish Grade 4 Science) .......................312
Table F.38 Item Statistics for Operational Items (Spanish Grade 5 Science) .......................313
Table F.39 Item Statistics for Operational Items (Spanish Grade 6 Science) .......................315
Table F.40 Item Statistics for Operational Items (Spanish Grade 7 Science) .......................316
Table F.41 Item Statistics for Operational Items (Spanish Grade 8 Science)........................317
Table F.42 Item Statistics for Operational Items (Spanish Grade 9 Science) .......................318
2006 NMSBA Technical Report Page 12
Prepared by Harcourt Assessment, Inc for the New Mexico Public Education Department
1.Introduction
The New Mexico Standards Based Assessment (NMSBA) is a criterion-referenced test (CRT) created to measure mastery of the state’s curriculum for grades 3, 4, 5, 6, 7, 8, and 9. The test is designed to measure performance in the areas of Mathematics, Reading and Science. The NMSBA is a dual language test offered in both English and Spanish.
In 2003 the New Mexico Public Education Department (NMPED) took an important step toward raising the learning expectations for all students in public schools and to meet the requirements imposed by the No Child Left Behind Act (NCLB), creating a new set of academic standards for K-12 schools. The new academic standards were designed to inform parents, teachers, and educators of what students actually learned in schools and to make schools accountable. This major change in the state standards necessitated a matching revision of the assessments used to measure their mastery, and to this end, NMPED, in collaboration with educators across the state and Harcourt Assessment, Inc. (Harcourt), developed the NMSBA to measure students’ achievement against the new academic standards.
The purpose of the NMSBA technical report is to provide users and other interested parties with a general overview of and technical characteristics of the 2006 NMSBA.
The 2006 technical report contains the following information:
• Test development
• Scoring procedures
• Calibration, scaling, and equating procedures
• Standard setting
• Reliability
• Validity
The 2006 technical report is accompanied by six appendices providing additional statistical information for the spring 2006 administration. Appendix A provides the number of items and points addressing each of the New Mexico Standards and Benchmarks. Appendix B contains raw score to scale score conversion tables and standard errors of measurement. Appendix C contains the raw and scale score frequency distributions. Appendix D contains performance level percentages by subgroups. Appendix E contains inter-rater reliability information. Appendix F contains both classical test theory item statistics and item response theory model parameter estimates with fit indices.
2006 NMSBA Technical Report Page 13
Prepared by Harcourt Assessment, Inc for the New Mexico Public Education Department
2. Test Development
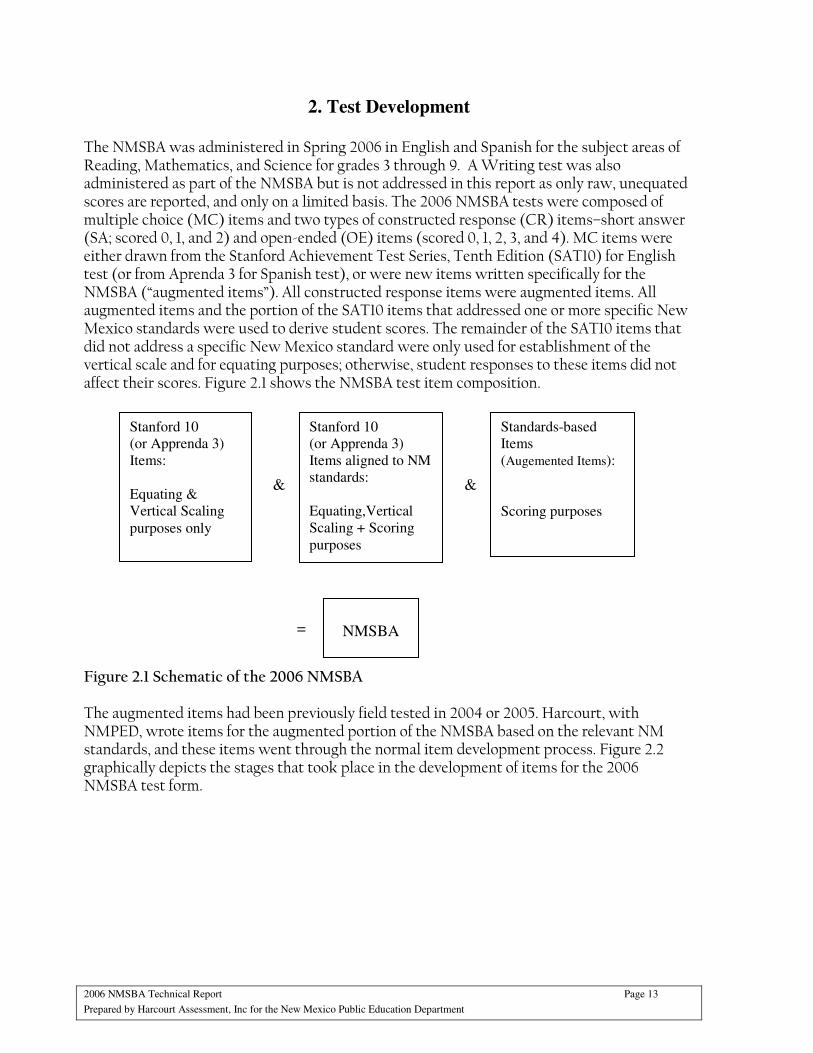
The NMSBA was administered in Spring 2006 in English and Spanish for the subject areas of Reading, Mathematics, and Science for grades 3 through 9. A Writing test was also administered as part of the NMSBA but is not addressed in this report as only raw, unequated scores are reported, and only on a limited basis. The 2006 NMSBA tests were composed of multiple choice (MC) items and two types of constructed response (CR) items–short answer (SA; scored 0, 1, and 2) and open-ended (OE) items (scored 0, 1, 2, 3, and 4). MC items were either drawn from the Stanford Achievement Test Series, Tenth Edition (SAT10) for English test (or from Aprenda 3 for Spanish test), or were new items written specifically for the NMSBA (“augmented items”). All constructed response items were augmented items. All augmented items and the portion of the SAT10 items that addressed one or more specific New Mexico standards were used to derive student scores. The remainder of the SAT10 items that did not address a specific New Mexico standard were only used for establishment of the vertical scale and for equating purposes; otherwise, student responses to these items did not affect their scores. Figure 2.1 shows the NMSBA test item composition.
+
Figure 2.1 Schematic of the 2006 NMSBA
The augmented items had been previously field tested in 2004 or 2005. Harcourt, with NMPED, wrote items for the augmented portion of the NMSBA based on the relevant NM standards, and these items went through the normal item development process. Figure 2.2 graphically depicts the stages that took place in the development of items for the 2006 NMSBA test form.
Stanford 10
(or Apprenda 3)
Items:
Equating &
Vertical Scaling
purposes only
Standards-based
Items
(Augemented Items):
Scoring purposes
Stanford 10
(or Apprenda 3)
Items aligned to NM
standards:
Equating,Vertical
Scaling + Scoring
purposes
NMSBA
& &
=

2006 NMSBA Technical Report Page 14
Prepared by Harcourt Assessment, Inc for the New Mexico Public Education Department
Figure 2.2 Overview of test development process
The “acquired items” in the first circle in the left was a set of items that Harcourt developed initially following the test specifications and the blueprint. These candidate items for 2006 live administration were reviewed by NMPED and panels of NM teachers to ensure that they addressed the content that they were intended to address and that they did not mention or portray any specific demographic group in a stereotypical or demeaning fashion. Items that were flagged at this point were generally sent back to the item authors along with relevant feedback for revision, after which they were scheduled for inclusion in the next round of item reviews (as though they were newly written items). Items that successfully passed this initial stage of review were then presented to a representative sample of the target population to allow the statistical properties of the item to be assessed—this is referred to as “field testing”. After field testing a “data review” meeting was held to review all field tested items. In this meeting item statistics and item bias analyses results were used to identify items with content flaws that led to anomalous statistical results. Items that were accepted at this stage were retained in an item “bank” for possible inclusion in future forms of the exam. The final test form was then constructed using items in the bank and from the previous year’s form (the 2006 form included approximately 70% of the augmented items from the 2005 form) and was forwarded to NMPED for approval. After NMPED approval was secured, the test form was put into production for administration in 2006.
The two points of attrition are identified in the red circles. Each circle is indicative of the number of viable items at that point. The number of items decreases as the test development process proceeds. Items are lost at the item review process (content and bias review). Some field-tested items are lost at data review. Finally, a subset of the items accepted at data review become operational items. The remaining items are kept in the bank for future operational use.
2.1 Test Design
Types of Items
The NMSBA contains three types of items: multiple choice (MC), short answer (SA) and open-ended (OE) items. The MC items required students to select a correct answer from several alternatives and had a maximum possible score of 1. The SA item required students to answer a question with a couple of words or a few sentences, and had a maximum possible score of 2. The OE items required student to answer with a paragraph or two, and had a maximum possible score of 4.
For mathematics and science, items in the Spanish test were trans-adapted (i.e., translated with an emphasis on capturing the meaning within the item, rather than a simple word-for-word translation) from the English language test items. For reading, items and reading passages for Spanish and English tests were separately and independently developed
Acquired
Items
Data Review (Field-
Tested Item Items)
Items to
Bank
Core Item
Item
Review
2006 NMSBA Technical Report Page 15
Prepared by Harcourt Assessment, Inc for the New Mexico Public Education Department
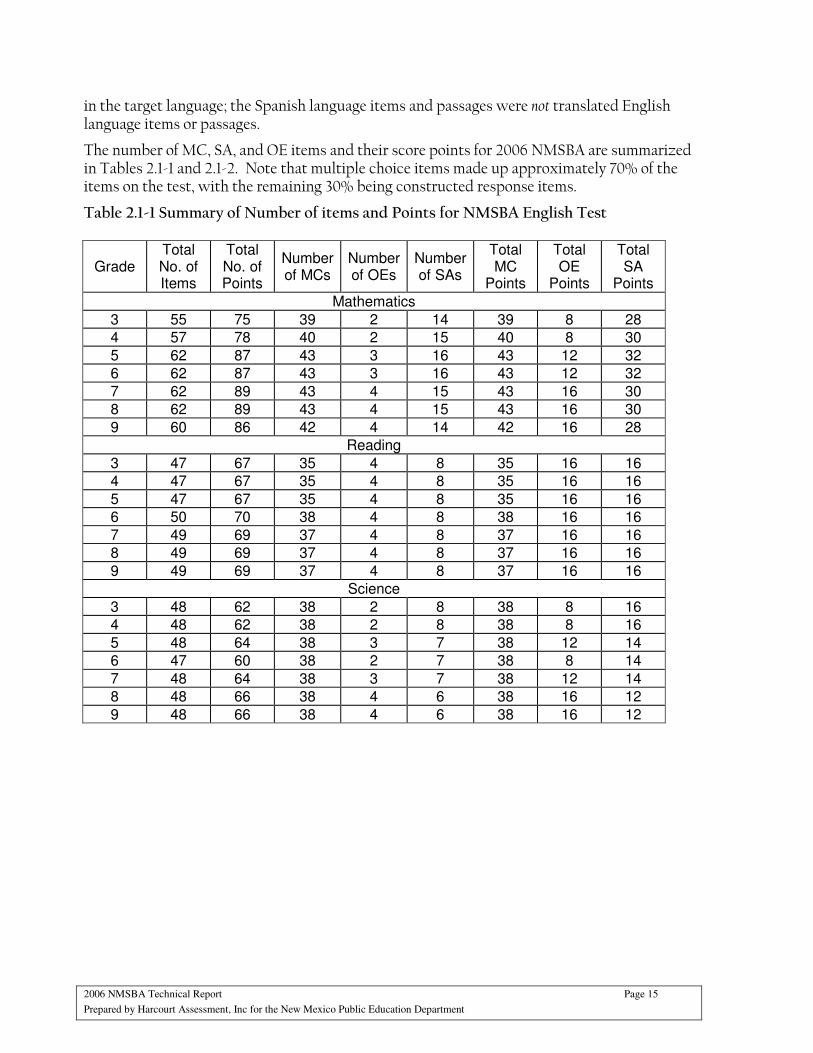
in the target language; the Spanish language items and passages were not translated English language items or passages.
The number of MC, SA, and OE items and their score points for 2006 NMSBA are summarized in Tables 2.1-1 and 2.1-2. Note that multiple choice items made up approximately 70% of the items on the test, with the remaining 30% being constructed response items.
Table 2.1-1 Summary of Number of items and Points for NMSBA English Test
Grade Total No. of Items
Total No. of Points
Number of MCs
Number of OEs
Number of SAs
Total MC
Points
Total OE
Points
Total SA
Points
Mathematics
3 55 75 39 2 14 39 8 28
4 57 78 40 2 15 40 8 30
5 62 87 43 3 16 43 12 32
6 62 87 43 3 16 43 12 32
7 62 89 43 4 15 43 16 30
8 62 89 43 4 15 43 16 30
9 60 86 42 4 14 42 16 28
Reading
3 47 67 35 4 8 35 16 16
4 47 67 35 4 8 35 16 16
5 47 67 35 4 8 35 16 16
6 50 70 38 4 8 38 16 16
7 49 69 37 4 8 37 16 16
8 49 69 37 4 8 37 16 16
9 49 69 37 4 8 37 16 16
Science
3 48 62 38 2 8 38 8 16
4 48 62 38 2 8 38 8 16
5 48 64 38 3 7 38 12 14
6 47 60 38 2 7 38 8 14
7 48 64 38 3 7 38 12 14
8 48 66 38 4 6 38 16 12
9 48 66 38 4 6 38 16 12
2006 NMSBA Technical Report Page 16
Prepared by Harcourt Assessment, Inc for the New Mexico Public Education Department
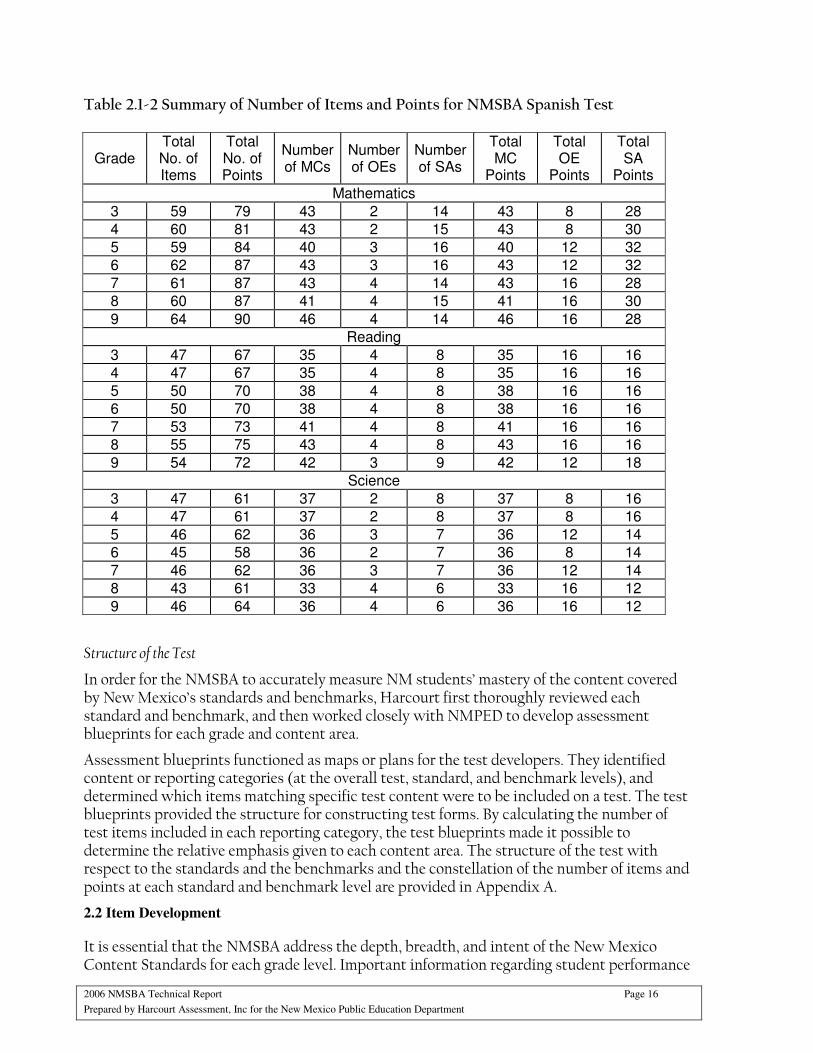
Table 2.1-2 Summary of Number of Items and Points for NMSBA Spanish Test
Grade Total No. of Items
Total No. of Points
Number of MCs
Number of OEs
Number of SAs
Total MC
Points
Total OE
Points
Total SA
Points
Mathematics
3 59 79 43 2 14 43 8 28
4 60 81 43 2 15 43 8 30
5 59 84 40 3 16 40 12 32
6 62 87 43 3 16 43 12 32
7 61 87 43 4 14 43 16 28
8 60 87 41 4 15 41 16 30
9 64 90 46 4 14 46 16 28
Reading
3 47 67 35 4 8 35 16 16
4 47 67 35 4 8 35 16 16
5 50 70 38 4 8 38 16 16
6 50 70 38 4 8 38 16 16
7 53 73 41 4 8 41 16 16
8 55 75 43 4 8 43 16 16
9 54 72 42 3 9 42 12 18
Science
3 47 61 37 2 8 37 8 16
4 47 61 37 2 8 37 8 16
5 46 62 36 3 7 36 12 14
6 45 58 36 2 7 36 8 14
7 46 62 36 3 7 36 12 14
8 43 61 33 4 6 33 16 12
9 46 64 36 4 6 36 16 12
Structure of the Test
In order for the NMSBA to accurately measure NM students’ mastery of the content covered by New Mexico’s standards and benchmarks, Harcourt first thoroughly reviewed each standard and benchmark, and then worked closely with NMPED to develop assessment blueprints for each grade and content area.
Assessment blueprints functioned as maps or plans for the test developers. They identified content or reporting categories (at the overall test, standard, and benchmark levels), and determined which items matching specific test content were to be included on a test. The test blueprints provided the structure for constructing test forms. By calculating the number of test items included in each reporting category, the test blueprints made it possible to determine the relative emphasis given to each content area. The structure of the test with respect to the standards and the benchmarks and the constellation of the number of items and points at each standard and benchmark level are provided in Appendix A.
2.2 Item Development
It is essential that the NMSBA address the depth, breadth, and intent of the New Mexico Content Standards for each grade level. Important information regarding student performance
2006 NMSBA Technical Report Page 17
Prepared by Harcourt Assessment, Inc for the New Mexico Public Education Department
must be derived from the standards-based portion of the test. The standards-based (criterion-referenced) items developed for NMSBA as well as the Stanford 10 items identified as assessing New Mexico content standards must align to the New Mexico Academic Standards in order to provide a valid assessment. Item and test development activities extend beyond the item writing process itself to include:
• revising and maintaining test specifications and blueprints
• conducting item reviews for alignment to the content standards, for bias, and for technical quality
• conducting field tests and analyzing field test data
• constructing new operational tests
• ongoing data analyses to ensure a valid and reliable assessment
The item development process began with a thorough review of the New Mexico content standards, the test specifications, and blueprints by Harcourt’s assessment specialists. A sufficient number of new items were written to each standard to allow for the attrition inherent in the review and field testing process.
Once the item development plan has been reviewed and approved by the New Mexico Department of Education, item development assignments and support materials were provided to Harcourt’s staff of trained, professional item writers. The item writers then wrote and submitted their items to the assessment specialists who conducted a thorough quality review of items using criteria such as:
• Does the item measure the standard it intends to measure?
• Does the item conform to best practices in item design?
• Is the content of the item accurate?
• Is the item unique?
• Is the language of the item clear and concise?
• Are the multiple choice item distractors plausible?
• Does the item have only one correct answer?
• Is the language of the item simple and concise?
The initial review was followed by an additional review in which a senior assessment specialist analyzed the item for accurate content and best testing practices. Thereafter, the items went through an editorial review to make sure that proper vocabulary, spelling, and grammar were used.
There was an intentional parallelism among all items, art, and passages in phraseology, sentence structure, and stimulus attributes. Edited items were then passed back to the lead assessment specialist, who conducted an additional review. Prior to committee review, a random sample of items were reviewed by national content consultants for best practice in item development.
Items that were not acceptable were returned to the item writer with feedback and suggestions for rewriting the item. Feedback about accepted items was also frequently supplied to writers. Edits were explained and suggestions were given on how to improve
2006 NMSBA Technical Report Page 18
Prepared by Harcourt Assessment, Inc for the New Mexico Public Education Department
future work. This feedback process allowed the item writers to create higher-quality items with each new iteration.
All items went through an internal review process at Harcourt before they were deemed suitable for external committee reviews. This internal review phase allowed the items to be refined and aligned with content standards before they were presented to New Mexico educators and the Public Education Department. The additional series of reviews continued to add value to the items as they were scrutinized for alignment to the content standards and the absence of bias and stereotyping.
2.3 Field Test and Item Analysis
Field Test
In 2003, Harcourt developed the initial set of candidate items with NMPED for 2006 live administration. The items were reviewed by NMPED throughout the item review process. During this item review process, each item was evaluated on its acceptability regarding subject content and potential bias against cultural or ethnic groups in the NM student population. In Spring 2004, the items that were judged acceptable by Harcourt and the content committee in NMPED were field tested on a representative sample of New Mexico students to gather item level data. In subsequent years, new items were embedded within the operational test form (but were not distinguishable by examinees) for field testing. Responses to embedded field test items were used only to derive statistics for the items—student scores were dependent solely on their responses to items that had been accepted at a past data review, not the items that were being field tested.
Field-Test Item Analysis.
Results from past field test administrations were reviewed at data review meetings (as described earlier) and provided the basis for including items in the 2006 operational test. The statistics calculated for MC, SA, and OE items included:
• Numbers of students tested
• Item difficulties (p-values) or item mean (for SA and OE items)
• Item-option response distributions for all respondents, for high-, middle-, and low-ability groups
• Point-biserial correlation (for MC items) or item-total test correlation (for SA and OE items).
Differential item functioning (DIF) analysis results for gender and selected ethinc groups.
Numbers of students tested
The number of students tested was the number of students who had the opportunity to answer the test item, regardless of whether or not they actually responded. Students who took the Braille form of the test or whose test was invalidated for any reason were not included in this number.
Item difficulties (p-values) or item mean (for SA and OE items)
Item Difficulty (p-value) represents the percentage of students who answered the question correctly, while the item mean for SA and OE items represents the average of the student scores on the item. In general, items for which students will choose the correct answer more
2006 NMSBA Technical Report Page 19
Prepared by Harcourt Assessment, Inc for the New Mexico Public Education Department
than 70 percent of the time are considered easy. Items for which students will choose the correct answer 40–70 percent of the time are considered to be of average difficulty. Items for which students will choose the correct answer less than 40 percent of the time are considered difficult. A test item should not be so easy that virtually all students answer it correctly, nor so difficult that virtually all students answer it incorrectly. Although the results from such items might provide useful information for a handful of students, they would not provide a useful level of detail on overall student achievement at the aggregate school, district, or state levels. The test was constructed with items from a mix of difficulty levels to provide information about the examinees from across the ability continuum with a reasonable degree of accuracy.
Item-option response distributions for all respondents, for high-, middle-, and low-ability groups
For each item, the percent of students who selected each option (for MC items) or who achieved each valid score point (for SA and OE items) was given, along with the percentage of students who did not answer the item, and the percentage who gave an invalid response. These percentages were shown both for the group as a whole, as well as for three subgroups, broken down by total test score.
Point-biserial correlation (for MC items) or item-total test correlation (for SA and OE items).
Point-biserial/item-total test correlation is a measure of how well an item discriminates between high and low scoring students. For an item to be useful on a test there must be a positive correlation between students’ success on an item and their success on the test as a whole. In other words, students who succeed on a given item should exhibit greater success on the test as a whole than students who do not succeed on that item. That is, students with relatively higher achievement on the test as a whole should exhibit greater success on any given item than students with relatively lower achievement. Items with correlations near or below zero are likely to be excluded from use as operational items.
Differential item functioning (DIF) analysis results for gender and selected ethic groups.
DIF analyses were conducted to identify items that are potentially more difficult for one demographic group as compared with another. It is important to realize that while items that are differentially difficult for two identifiable groups can be identified using statistical methods, further review by educators is required to definitely identify items that should be excluded as being unfair. Items can be flagged when no differences exist (due to random variations in the data), or when those differences are related to the construct being measured (e.g., an item measuring English grammar skills may be more difficult on average for Hispanic students as compared to Caucasian students due to the higher proportion of LEP students within the Hispanic population as compared to the Caucasian population). Items should be excluded for DIF only after further review has identified features within the item that are causing the difference in difficulties, and those features have been confirmed to be unrelated to the constructs being measured by the item. Often referred to as “item bias” analyses, the more morally neutral term “DIF” has become preferred as it more accurately describes the underlying processes. The DIF procedures used were Mantel’s (1963) extension of the Mantel-Haenszel procedure (the Mantel Chi-square) for the CR items and the Mantel-Haenszel procedure (Mantel & Haenszel, 1959) for the MC items. To help interpret the Mantel Chi-
square (Mantel 2χ ), the Mantel statistic is used in conjunction with the standardized mean
difference (SMD). The Mantel 2χ is simply a conditional mean comparison of the ordered
response categories for reference and focal groups combined over values of a matching variable score. By “ordered” we mean that a response of 1 on an item is better than 0, 2 is better than 1,
2006 NMSBA Technical Report Page 20
Prepared by Harcourt Assessment, Inc for the New Mexico Public Education Department
and so on. “Conditional,” on the other hand, refers to the comparison of members from the two groups who received the same score on the matching variable, i.e., the total test score in our analysis.
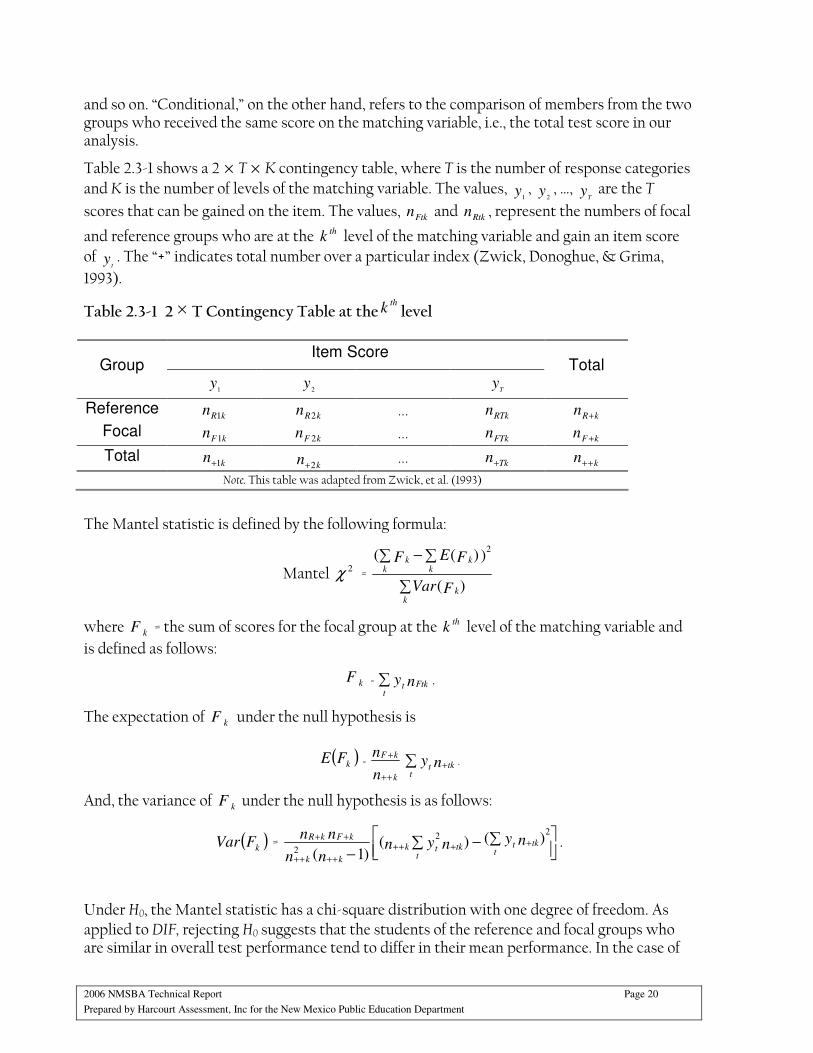
Table 2.3-1 shows a 2 × T × K contingency table, where T is the number of response categories and K is the number of levels of the matching variable. The values,
1y ,
2y , …,
Ty are the T
scores that can be gained on the item. The values, Ftkn and Rtkn , represent the numbers of focal
and reference groups who are at the thk level of the matching variable and gain an item score
of t
y . The “+” indicates total number over a particular index (Zwick, Donoghue, & Grima,
1993).
Table 2.3-1 2 × T Contingency Table at theth
k level
Item Score Group
1y
2y
Ty
Total
Reference kRn 1 kRn 2 … RTkn kRn +
Focal kFn 1 kFn 2 … FTkn kFn +
Total kn 1+ kn 2+ … Tkn+ kn ++
Note. This table was adapted from Zwick, et al. (1993)
The Mantel statistic is defined by the following formula:
Mantel 2χ = ∑
∑−∑
kk
kk
kk
FVar
FEF
)(
))((2
where kF = the sum of scores for the focal group at the thk level of the matching variable and
is defined as follows:
kF = ny Ftkt
t∑ ,
The expectation of kF under the null hypothesis is
( )kFE =
n
n
k
kF
++
+ny tk
tt +∑ .
And, the variance of kF under the null hypothesis is as follows:
( )kFVar =
∑ ∑−
−++++
++++
++
t ttkttktk
kk
kFkR nynynnn
nn )()()1(
22
2.
Under H0, the Mantel statistic has a chi-square distribution with one degree of freedom. As applied to DIF, rejecting H0 suggests that the students of the reference and focal groups who are similar in overall test performance tend to differ in their mean performance. In the case of
2006 NMSBA Technical Report Page 21
Prepared by Harcourt Assessment, Inc for the New Mexico Public Education Department
dichotomous items the statistic is identical to the Mantel-Haenszel (1959) statistic without the continuity correction (Zwick, Donoghue, & Grima, 1993).
Standardized Mean Difference (SMD) is a summary statistic to accompany the Mantel approach (Dorans and Schmitt, 1991). This statistic compares the means of the reference and focal groups, adjusting for differences in the distribution of the reference and focal group members across the values of the matching variable,
SMD = ∑ ∑−k k
RkFkFkFk mpmp
where
n
np
F
kF
Fk
++
+=
is the proportion of the focal group members who are at the thk level of the matching variable
and
∑=
+t
FtktkF
Fk
nynm
)(
1
is the mean item score of the focal group members at the thk level, and mRk is the analogous
value for the reference group. As can be seen from the equation above, the SMD is the difference between the unweighted item mean of the focal group and the weighted item mean of the reference group. The weights for the reference group are applied to compensate for differences in the number of students in the reference and focal groups (within each level of ability). A negative SMD value implies that the focal group has a lower mean item score than the reference group, conditional on the matching variable.
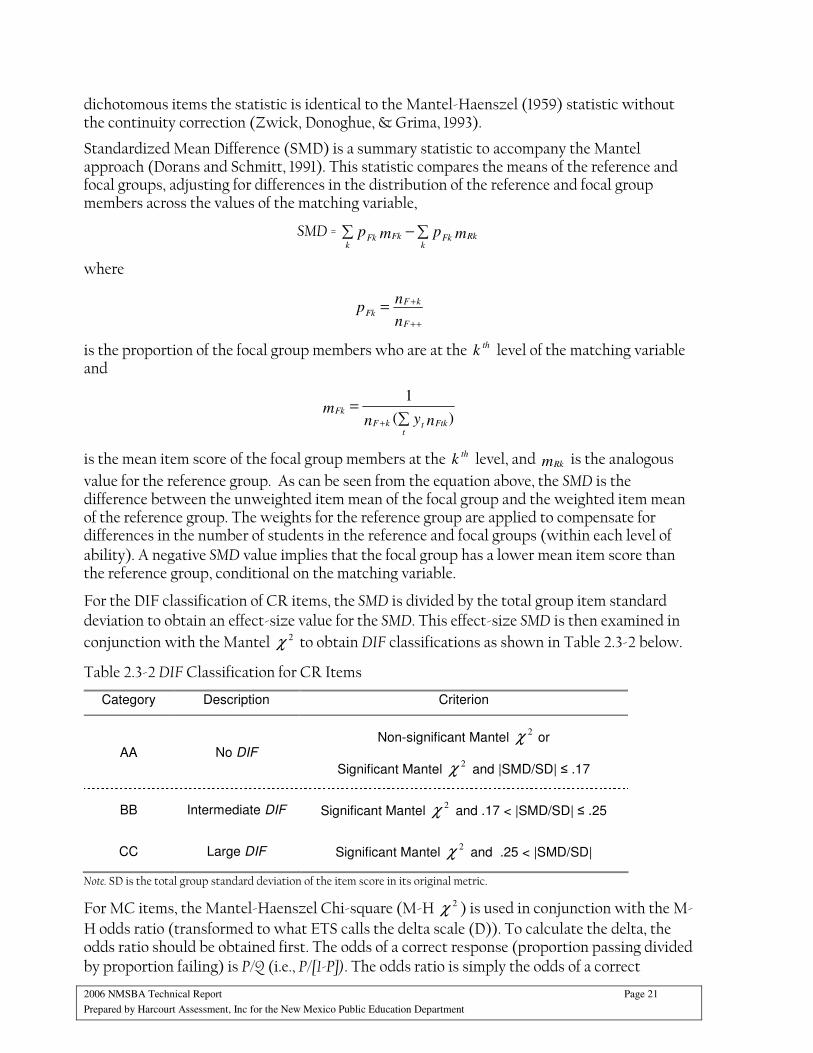
For the DIF classification of CR items, the SMD is divided by the total group item standard deviation to obtain an effect-size value for the SMD. This effect-size SMD is then examined in
conjunction with the Mantel 2χ to obtain DIF classifications as shown in Table 2.3-2 below.
Table 2.3-2 DIF Classification for CR Items
Category Description Criterion
AA No DIF Non-significant Mantel
2χ or
Significant Mantel 2χ and |SMD/SD| ≤ .17
BB Intermediate DIF Significant Mantel
2χ and .17 < |SMD/SD| ≤ .25
CC Large DIF Significant Mantel
2χ and .25 < |SMD/SD|
Note. SD is the total group standard deviation of the item score in its original metric.
For MC items, the Mantel-Haenszel Chi-square (M-H 2χ ) is used in conjunction with the M-
H odds ratio (transformed to what ETS calls the delta scale (D)). To calculate the delta, the odds ratio should be obtained first. The odds of a correct response (proportion passing divided by proportion failing) is P/Q (i.e., P/[1-P]). The odds ratio is simply the odds of a correct
2006 NMSBA Technical Report Page 22
Prepared by Harcourt Assessment, Inc for the New Mexico Public Education Department
response of the reference group divided by the odds of a correct response of the focal group. For a given item, the odds ratio is defined as follows:
HM −α = QfP
QP
f
rr
/
/.
The corresponding null hypothesis is that the odds of getting the item correct are equal for the two groups (the odds ratio is equal to 1):
H0: HM −α = QfP
QP
f
rr
/
/ = 1.
In order to make the odds ratio symmetrical around zero with its range being in the interval ∞− to ∞+ , the odds ratio is transformed into a log odds ratio as per the following:
HM −β = )ln( H-Mα .
The simple natural logarithm transformation of this odds ratio is symmetrical about zero (zero has the interpretation of equal odds). This DIF measure is a signed index where a positive value signifies DIF in favor of the reference group while a negative value indicates DIF in favor of the focal group. HM −β is amenable to linear transformations to other interval scale metrics
(Camilli & Shepard, 1994). This fact is utilized by ETS to transform HM −β to their delta scale
metric (D), via:
D = .35.2 HM −⋅− β
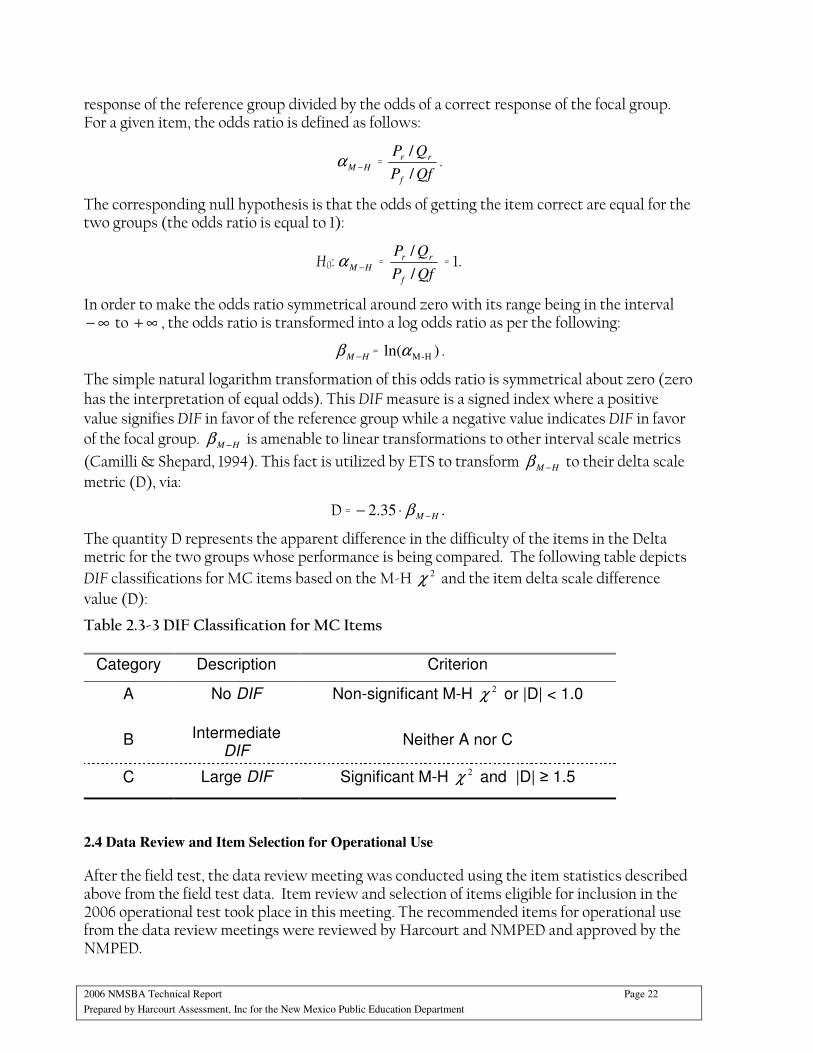
The quantity D represents the apparent difference in the difficulty of the items in the Delta metric for the two groups whose performance is being compared. The following table depicts
DIF classifications for MC items based on the M-H 2χ and the item delta scale difference
value (D):
Table 2.3-3 DIF Classification for MC Items
Category Description Criterion
A No DIF Non-significant M-H 2χ or |D| < 1.0
B Intermediate
DIF Neither A nor C
C Large DIF Significant M-H 2χ and |D| ≥ 1.5
2.4 Data Review and Item Selection for Operational Use
After the field test, the data review meeting was conducted using the item statistics described above from the field test data. Item review and selection of items eligible for inclusion in the 2006 operational test took place in this meeting. The recommended items for operational use from the data review meetings were reviewed by Harcourt and NMPED and approved by the NMPED.
2006 NMSBA Technical Report Page 23
Prepared by Harcourt Assessment, Inc for the New Mexico Public Education Department
Selection of the operational items in the data review meeting and during final test form construction was based on both content expertise and the psychometric properties of the item being considered. The psychometric guidelines used to choose the items for the 2006 final test form were as follows:
• Avoid the use of items with p-values less than .10 and greater than .90.
• Avoid the use of items with point-serial or item-total test correlation less than .10
• Avoid the inclusion of items with DIF classifications “C” for MC items and “CC” for CR items
So that the first guideline would be applicable to CR items, CR item means were normalized such that their scale was on a zero to one interval (as in the p-value).
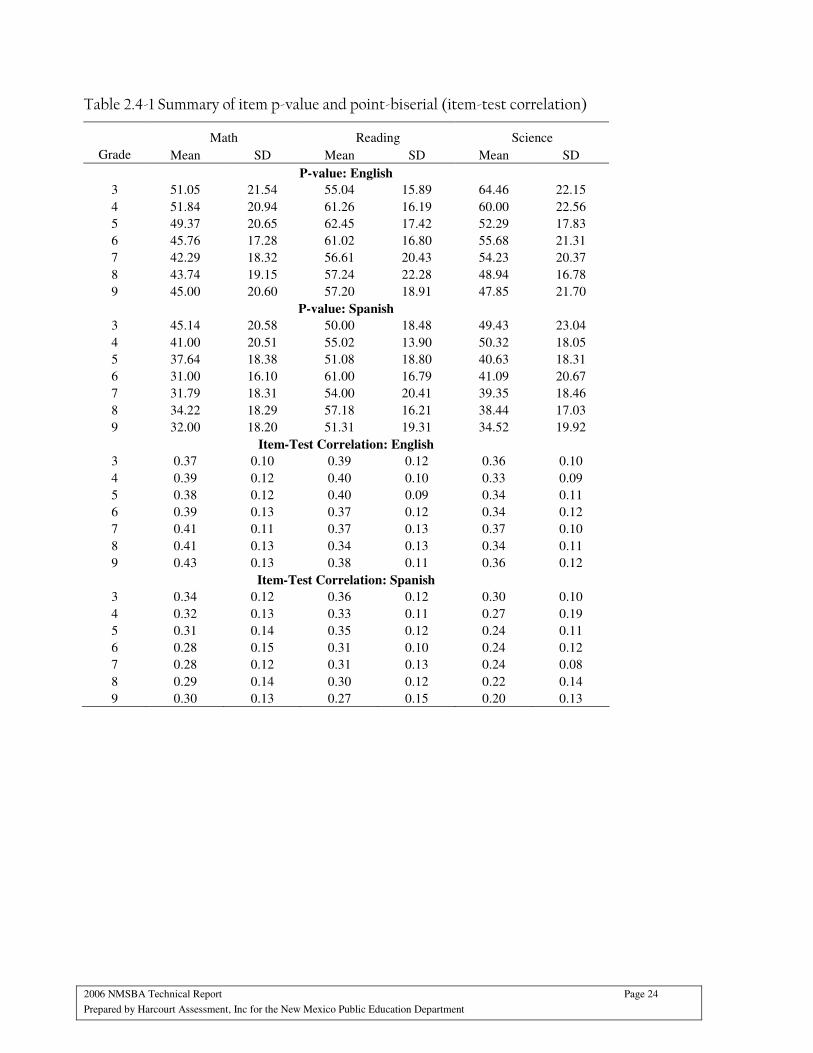
The p-value and the point-biserial (or item-total test correlation) for the 2006 operational test items are provided in Appendix F. The summaries of the p-value and the point-biserial (or item-total test correlation) of the 2006 operational items are shown in Table 2.4-1.
2006 NMSBA Technical Report Page 24
Prepared by Harcourt Assessment, Inc for the New Mexico Public Education Department
Table 2.4-1 Summary of item p-value and point-biserial (item-test correlation)
Math Reading Science
Grade Mean SD Mean SD Mean SD
P-value: English
3 51.05 21.54 55.04 15.89 64.46 22.15
4 51.84 20.94 61.26 16.19 60.00 22.56
5 49.37 20.65 62.45 17.42 52.29 17.83
6 45.76 17.28 61.02 16.80 55.68 21.31
7 42.29 18.32 56.61 20.43 54.23 20.37
8 43.74 19.15 57.24 22.28 48.94 16.78
9 45.00 20.60 57.20 18.91 47.85 21.70
P-value: Spanish
3 45.14 20.58 50.00 18.48 49.43 23.04
4 41.00 20.51 55.02 13.90 50.32 18.05
5 37.64 18.38 51.08 18.80 40.63 18.31
6 31.00 16.10 61.00 16.79 41.09 20.67
7 31.79 18.31 54.00 20.41 39.35 18.46
8 34.22 18.29 57.18 16.21 38.44 17.03
9 32.00 18.20 51.31 19.31 34.52 19.92
Item-Test Correlation: English
3 0.37 0.10 0.39 0.12 0.36 0.10
4 0.39 0.12 0.40 0.10 0.33 0.09
5 0.38 0.12 0.40 0.09 0.34 0.11
6 0.39 0.13 0.37 0.12 0.34 0.12
7 0.41 0.11 0.37 0.13 0.37 0.10
8 0.41 0.13 0.34 0.13 0.34 0.11
9 0.43 0.13 0.38 0.11 0.36 0.12
Item-Test Correlation: Spanish
3 0.34 0.12 0.36 0.12 0.30 0.10
4 0.32 0.13 0.33 0.11 0.27 0.19
5 0.31 0.14 0.35 0.12 0.24 0.11
6 0.28 0.15 0.31 0.10 0.24 0.12
7 0.28 0.12 0.31 0.13 0.24 0.08
8 0.29 0.14 0.30 0.12 0.22 0.14
9 0.30 0.13 0.27 0.15 0.20 0.13
2006 NMSBA Technical Report Page 25
Prepared by Harcourt Assessment, Inc for the New Mexico Public Education Department
3. Scoring Procedures
3.1 Processing for Student Documents
Harcourt implemented an established process that enabled the Harcourt Scoring Center to accurately process the NMSBA student response documents. These proven processes include the use of a control document called a Master File Sheet (MFS), which is completed by the test administrator at the building or district level and on which each order is defined and structured. An additional document, completed by the teacher, is a school-based classroom- or grade-level header sheet (the Universal Identification Document, or UID). Comparing the information provided on the UID and the MFS with the actual number of documents scanned for the NMSBA served as a quality checkpoint to see if any student documents are missing at a district or school level. If students’ documents are indeed missing, the order can be flagged with a processing alert. To process student response documents, Harcourt uses a proprietary system known as SCORFLOW®. Descriptions of the SCORFLOW workstations follow.
Receiving
The Receiving workstation accepts and counts cartons as they are delivered and sorts them by district. This is the first quality checkpoint in the receiving process; tracking can begin immediately if it is discovered that only a partial shipment was received. Cartons are palletized, with each pallet receiving a unique identification code. At this point, pallets move to a queue in Document Staging to await processing. Meanwhile, a pallet folder containing all documentation for schools represented on that pallet goes to Order ID, where the schools are logged into SCORFLOW® and associated with an order number. An order is the basic processing unit of documents as they move through all operational workstations. Documents that are received late or separately from the main shipment can be merged with the rest of the shipment using the order number. As an additional quality checkpoint in the receiving process, each shipment is checked for complete documentation, such as a Master File Sheet or an Order for Scoring Services. If a shipment is missing boxes or documentation, it is placed on alert and the school district’s test coordinator is contacted.
Structure Definition and Order Entry
From the Order ID station, the pallet folder moves to Structure Definition. The information on the MFS is verified against the data that were pre-loaded from LADS. If there is a discrepancy, both SCORFLOW and LADS are updated to conform to the MFS. The student n-count, grade level, and number of groups in the order are entered by hand. If the school or district has requested optional services, Order Entry will update the customer record. Order Entry also inputs the type of reports the customer has requested, as well as information regarding number of copies and packaging requirements. Once the order has been entered, the pallet folder is released to Document Staging.
Document Staging
When Document Staging receives the pallet folder from Structure Definition and Order Entry, employees called “stagers” match the unique pallet identifier to the appropriate pallet in the holding queue. This serves as the first quality checkpoint within Document Staging. Once the folder and pallet have been matched up, the pallet is released for processing and moved to its assigned staging line. Every stager on the line follows a detailed checklist of quality and security procedures. Examples of these procedures follow.
2006 NMSBA Technical Report Page 26
Prepared by Harcourt Assessment, Inc for the New Mexico Public Education Department
As the contents of each carton are removed, the Scoring Services Identification (SSID) sheet is reviewed. The answer documents received must match the program type listed on the Master File Sheet (MFS) or the Order for Scoring Services (OSS). The number of answer documents recorded on each SSID is matched with the number of documents recorded on the MFS.
The stagers check for loose papers and non-scannable documents.
Next, the documents are assembled onto carts, which will be used to transport documents through all operational areas.
Control documents are placed with each unique group of documents to facilitate control and quality checks throughout the subsequent processes.
The MFS or OSS now contains SCORFLOW control information consisting of the receiving number, SCORFLOW order number, and cart number. This information provides fast, accurate access to group and individual documents.
When the stagers have completed their work, the cart moves to the Document Staging Quality Control area, where staff members commonly called “QCers” validate the completeness of the cart’s contents. Once the QCer has verified the accuracy of the stagers’ work, the cart is delivered to the release station, where orders are logged out of Document Staging and the cart is released to Scanning.
Scanning
All documents are maintained in a temperature- and humidity-controlled environment for at least 24 hours prior to scanning. This quality step allows the moisture content of the paper to normalize. Properly stabilized paper improves scan reliability and quality. Booklets and answer folders are then released for slitting, where their spines are sliced off, turning them into stacks of single sheets of paper. Specially-designed calibration sheets are inserted at random intervals into each stack. These sheets will be used to conduct Statistical Process Maintenance on the scanning equipment. After the documents are slit, the cart is moved to the scanning area. Harcourt uses two types of scanners: OMR (Optical Mark Read) and image. Documents are assigned to a scanner type based on the type of document and the output required. A complete scanner diagnostic test is executed prior to scanning the documents on each cart, and a calibration check is run prior to scanning each stack. The scanning process first deciphers grayscale-captured information that includes document identification and all information gridded by the test-taker. If the document is image-scanned, a full-page bi-tonal image is saved for human-scoring requirements. The scanning program checks the validity of the document ID via skunk codes or module codes to ensure that the booklet is the correct booklet. The program also compares the actual number of pages scanned to the number of pages for that unique document ID. Scanners are routinely checked and calibrated based on the Statistical Process Maintenance feedback generated by the calibration sheets inserted during slitting. Imaged information is subsequently sent to the Reader database, where it is organized by student, subject area, and program, ensuring proper distribution of the image when rating is required. Those images are then distributed to Harcourt’s Performance Assessment Scoring Center (PASC), while hex values are accumulated on the network to await scoring. A more detailed description of PASC and its capabilities as they relate to the scoring of constructed-response items for the NMSBA follows at the end of this section. At this point, the cart is logged out of the Scanning workstation and moves to Scoring Editing. The data collected from the OMR and image scanners are embedded into a scan file, which will be used to generate an edit report.
2006 NMSBA Technical Report Page 27
Prepared by Harcourt Assessment, Inc for the New Mexico Public Education Department
Scoring Editing
The editing group is responsible for the quality and accuracy of the data submitted for scoring. The first step in this process is to run the scan file produced by Scanning, which compares the data to the customer’s unique program specifications. The output is used to generate an edit report listing of documents needing correction or validation. The editor uses the report to pull from the cart the documents requiring edit resolution. Using the editing rules and alert conditions established for the program, the scoring editor outputs cleaned data. To reach that point the editor must review and resolve entries on the edit report. The edit report is a listing of records flagged as having suspect fields. A flag simply means that the data field did not match program specifications. Typical flags that editors must resolve include:
• Incorrect gridding or double gridding
• Wrong dates
• Gridding current year for birth year
• Mismatch between gridded name and pre-ID label
• Partial name
A scoring editor reviews every flag by referencing the source answer document and validating or correcting the field. As an example, if the edit report flags a student document as being gridded with the current year rather than the student’s birth year, the scoring editor will attempt to resolve the error using information hand-printed on the document. If the editor cannot resolve the error, the order will go on alert and the customer will be contacted for resolution. When all edits have been resolved, corrections are incorporated into the document file containing student records. Once all corrections have been made, the edit routine is rerun to ensure data validity. When no fields are flagged as suspect, all the records for that order are considered “clean” and the order proceeds to Job Submission. The actual physical documents marked by the students are no longer needed in the scoring process and move to the Archiving workstation.
Archiving
At the Archiving workstation, student documents are banded and palletized in sequence. This sequencing allows for an individual student document to be quickly retrieved should it be requested. Pallets are placed in secure storage for the period defined in the program’s retention guidelines. At the end of the retention period, documents are shredded in a secure environment and then recycled.
Job Submission.
Once the Editing group has cleared a program, Job Submission releases the program to the mainframe for scoring.
Computer Operations
This group is responsible for printing pre-ID labels, pack lists and reports, as well as for electronic report services, such as CDs, diskettes and FTP files. Working directly from the Harcourt mainframe, Computer Operations will generate the student and summary files that will be sent to Harcourt’s subcontractor, Grow Network, for reporting. Grow Network was responsible for all printed reports. After the files for printing have been generated and forwarded to Grow Networks, a list of electronic report services goes to Production Control, a group within Computer Operations. Here, data files are downloaded to generate CDs,
2006 NMSBA Technical Report Page 28
Prepared by Harcourt Assessment, Inc for the New Mexico Public Education Department
diskettes, cartridges, or FTP files. Depending on the electronic medium requested by the client, the files are shipped or are posted to the designated website.
Alerts and Research.
Our program management staff works directly with our large scale program clients to resolve alerts and order entry discrepancies as quickly as possible. An alert is any situation that needs resolution, such as missing information on a document. As needed, calls are placed to test coordinators to get resolutions to problem situations. All alert information is entered into the SCORFLOW record for the order, including the type of alert, the date it was initiated, and any other relevant information. SCORFLOW also prevents the scoring and reporting processes from being activated until the test result reports requested have been key-entered and verified. Any discrepancies are resolved with the customer before the services are verified in the system.
3.2 Scoring Constructed Response Items
Harcourt’s Performance Assessment Scoring Center (PASC) was responsible for scoring the constructed-response items (short answers scored 0, 1, and 2 and open-ended items scored 0, 1, 2, 3, and 4) on the NMSBA. PASC currently maintains qualified pools of trained, professional readers who are well-experienced in scoring a wide range of writing assessments and open-ended assessments in reading, mathematics, science, social science, etc. PASC readers underwent an extensive training process. Candidates who wish to qualify as bilingual scorers for Spanish language assessments must pass the screening process in English and in Spanish. These experts then applied the scoring criteria to responses in the language, which they were qualified to score.
Harcourt developed all anchors and training materials with New Mexico prior to the live administration and scoring, sending those to the New Mexico Public Education Department for final review and sign-off. The general processes of PASC scoring are detailed in the following section.
For all large-scale scoring projects scored at PASC, each domain/level has a room director (Scoring Director). The room director works closely with the Training Supervisor and the content Training Specialist to conduct training to ensure that readers become expert with a specific project. A trainer must be, first and foremost, a good teacher, capable of recognizing the question behind the question and able to present the response in a variety of ways until it is fully understood by all. He or she must encourage readers to abandon preconceived notions they may have about the scoring procedures and to align their thinking and judgment to the procedures and to the scoring scale defined by the specific project. The room director’s main job is to oversee the actual scoring of the papers, acting as the decision maker for situations or questions that may arise during the scoring process. All invalid (i.e., unscorable) papers are reviewed by the room director who must confirm any such decision and ensure consistency of decisions. The room director is also responsible for the quality of the scoring within the room. For our custom large-scale programs, those who will be serving as room directors are active members of the training materials development team, often traveling to work with state departments and teacher committees to finalize scoring guides and training procedures.
Room directors are selected for a given project from among those who have successfully served as team leaders for many previous projects. They have been team leaders in large scale projects where training is conducted for an entire room by the scoring director and they must have served as team leaders in small-scale projects where team leaders act as trainer. They have

2006 NMSBA Technical Report Page 29
Prepared by Harcourt Assessment, Inc for the New Mexico Public Education Department
been evaluated on their ability to train readers as well as to monitor readers’ scoring accuracy and consistency.
Team leaders are experienced, proficient readers who have successfully completed a two-day general team leader training workshop at PASC. That workshop prepares some of our best readers to assume the role of team leader and gives them the initial training needed to assume greater levels of responsibility within our training and scoring process. Team leaders assist the room director, certify that readers on their team are qualified and are scoring accurately, and may retrain individual readers when necessary.
Developing Scoring Materials for Constructed Response Items
Before anchor pulling can take place, experienced PASC Room Directors and Team Leaders take several preliminary steps. For a given prompt or item they must know the prompt and the rubric thoroughly. Then their directions are to proceed as follows:
• Look for responses that seem to represent the full range of quality as described in the rubric.
• Include not only papers that are homogeneous in their level of quality but also papers that differ in quality from variable to variable and can be given an overall classification (as below).
• Use notes to mark High, Medium, and Low papers, marking especially good ones (e.g., the potentially top scores).
• Separate any problem papers—off-topic, off-task, verbatim copying, strange, potential teacher interference, etc.
• Mark flagged papers with the score range or the nature of the problem and paper ID. (ID is retained in case copy proves to be unreadable; in case original must be examined again for some reason; and to be sure that, after copying, the original is returned to its proper packet and box.)
• Next copies are made of each flagged paper, transferring the flag to the copy.
• These copies are sorted into piles, reflecting the nature of the flag; i.e., all potential “high” papers are together, all potential “medium” papers are together, etc., with all problem papers grouped together. For “problem” or “decision” papers, duplicates of types of problems are culled. The best example of each problem type is retained; the rest are discarded.
• Then the expert scoring team must decide which particular papers from the sorted piles should go into which range set for anchor pulling – High, Medium, Low. For example, a particular paper marked “medium” could go into the Medium set.
During final anchor pulling, the procedure used for assigning scores to the papers in each set is as follows. The procedure is followed for each set successively.
• Range papers are read and scored by the anchor-pulling team.
• Charts are made showing each score for each paper. Tentative scores are assigned to each paper on which there seems to be consensus. However, all assigned scores at this point—even those on papers for which there is complete agreement—are tentative and subject to change based on later considerations. Decisions are made about each of the problems in the Decision set.
2006 NMSBA Technical Report Page 30
Prepared by Harcourt Assessment, Inc for the New Mexico Public Education Department
• Each set is read and scored, using the tentative scores on the previous sets as guidelines. After each set has been read, the results are charted and discussed.
• Each score point for which there is less than unanimous agreement is discussed starting with the lowest score point and also beginning with the least controversial of these. The papers that had the widest discrepancies of assigned scores around this lowest score point are discussed next before moving to the papers whose assigned scores are in the next higher range. There may be frequent reference back to previous sets to make sure that decisions on score points are consistent.
• This iterative process of reading, charting, and discussing successive sets has three goals: First, it establishes scores on papers for which there is virtual agreement; second, it identifies papers that are on the line between two adjacent scores, forcing the clarification of that line; and, third, it allows readers to adjust their scoring to better conform or agree with one another. During this process, the tentative scores assigned to papers in earlier sets become firm.
When the reading and charting is finished and decisions have been made and scores assigned to all the papers, the anchor-pulling phase is finished. However, the development of training material is just beginning.
From these responses, the team must now pull together the following sets for each prompt or item group:
• Anchor set
At least two examples of each score point, depending upon the score scale (no invalids). These should be “clean” papers but should illustrate different types of the same score point, if there are such clear differences. Once completed, this set is submitted to the Training Supervisor for review.
• Decision set
This should be a set of whatever size necessary to illustrate the various kinds of problems that might arise with this prompt. If the number of such papers is small, these may be incorporated into the first training set instead of being grouped into a separate additional set.
• Training sets
These are two sets of up to 20 papers each (again, this will vary according to the score point scale). They should contain a range of papers including “clean” papers, “line” papers, and “problem” papers. The papers should be in random order of quality and unmarked.
• Qualifying sets
There should be four sets of these with up to 10 papers each. These should consist heavily of “clean” papers but not exclusively so. One of the sets may include an example of an invalid paper, but it should be clearly so.
• Calibration sets (validity sets)
These are composed of 5 papers of mixed quality, arranged in random order. We would create as many different sets as there are expected to be scoring days on a single prompt or group of items—minus one or two for the training day and the initial scoring day.
2006 NMSBA Technical Report Page 31
Prepared by Harcourt Assessment, Inc for the New Mexico Public Education Department
The next step is a review of the anchors and practice sets across all items in a domain to ensure consistent decisions and consistent application of the rubrics. This is followed by an across-grades review by domain, again, to ensure consistent decisions have been made.
Monitoring for scoring accuracy/reliability
The key to accurate scoring of writing and open-ended items is proper training of the readers. The following procedures are routinely employed by the PASC for training readers before scoring each new prompt or set of items.
Project-specific Training
Project-specific team leader training is conducted in the days immediately preceding scoring. It consists of training and qualifying which is substantially like the readers’ training except that the emphasis is on problem issues.
Team leaders are experienced in the scoring process and will help train and retrain their team members. In addition, the logistics of the scoring sessions, and the routines for resolution reading are discussed. All team leaders must also meet the qualifying standards set for the given project. For large-scale, custom projects, the standards are determined in conjunction with Harcourt and the client.
Training for project-specific holistic scoring of constructed responses takes approximately one full day. It begins with an overview of the project. A trainer may present some of the history and purpose of the specific performance assessment, including such things as how the prompts were administered, test security, how the results will be used, and the proposed method for communicating results to the student, parent, school, and district. In addition, at the start of any individual project, readers must reconfirm their commitment to security and confidentiality by signing a project specific Security Agreement. Training continues with a reading and discussion of the student responses in the anchor set. In this set the scores have been recorded with the student responses, and the responses are arranged in ascending point-scale order. Emphasis is placed on the reader’s understanding of how the responses differ from one another in incremental quality and how each response reflects the description of its score point as generalized in the scoring guidelines.
Once readers feel comfortable with the anchor set, they begin to score the first training set, which consists of previously-scored student responses arranged in random order. Each reader reads and scores the responses in the training set. The correct scores are then revealed. At this point, using our central scoring model, readers interact with the trainer in discussing the characteristics of each response that earned it the assigned score point. The same format is followed for each training set. During this process, the reader’s job is not to justify his or her own scoring but to internalize the scale and adjust his or her individual scoring to conform to that scale.
Readers who qualify on the first set are permitted to start scoring immediately. Generally more than 75 percent of our readers qualify on the first set, and by the end of the second set, more than 95 percent of the readers have qualified. The few readers who still have not qualified after the second qualifying set, work with a trainer to review the anchors and clarify perceptual discrepancies before being considered for scoring the third qualifying set. Any reader who fails to qualify following this training is dismissed from the project.
All readers are trained to score to the same scale to ensure accurate, consistent, reliable scoring. The PASC adheres to stringent criteria in its general screening, training, and
2006 NMSBA Technical Report Page 32
Prepared by Harcourt Assessment, Inc for the New Mexico Public Education Department
qualifying procedures as preliminary measures for obtaining high levels of consistency and reliability. Nevertheless, in any large group of potential readers, some individuals are not suited to conduct holistic scoring. Some readers may be systematically too lenient in their ratings, others too harsh. Still others may vary unsystematically and unpredictably from other scorers and deviate from the training standards. The Performance Assessment Scoring Center’s quality control program can easily identify readers who may need to be retrained, or possibly eliminated from the scoring project or reader pool, or who are not suited for scoring a specific test.
While the first step in ensuring accuracy of scoring is to adhere to a rigorous training and qualifying process for all readers, ongoing monitoring is also critical. During the scoring process, in addition to regular student responses, readers score a set of calibration (validity) responses each day. Calibration sets consist of five student papers that have been pre-scored by expert team leaders who are familiar with the project’s scoring parameters.
The reader does a blind scoring of the responses. The reader’s scores are compared with the known scores and a Calibration Report is prepared. Readers score a different calibration set each day. The distribution of calibration responses is controlled through the distribution of responses to readers, allowing calibrations to be “slipped in” at various times during the day. The results from the scoring of calibration sets are kept separate from the ongoing flow of actual scores and are reported to team leaders, room directors, and the training supervisor.
Calibration and reliability standards are set for each custom large-scale project in conjunction with the client and for Harcourt products by an internal team. Any reader who fails to meet the standards is immediately scheduled for retraining. As we have described, each reader scores at least one calibration set each day. For the New Mexico constructed response items, we conducted a single reading; however, a minimum of a random sample of 10 percent of readers’ scoring output was routed for a second scoring by a qualified team leader as a means of tracking inter-rater reliabilities. This check scoring is done for monitoring purposes only. There is no resolution of discrepant scores. Acceptable agreement rates (matching or exact + adjacent scores) vary from project to project, depending upon the score scale, the number of items in a scoring subset and the “open-ness” of the response possibilities.
Once a reader falls below the standard, retraining is conducted. Repeated failure to meet the standard resulted in dismissal from the NMSBA project.
In addition to the use of calibration sets and the use of recalibration/retraining activities, all readers undergo group retraining every Monday (or following an extended break) during the scoring project. Individual readers receive retraining during the scoring, as deemed necessary by team leader and room director observations and results from daily monitoring reports. Team leaders must document all retraining.
Read Behinds
Harcourt’s system allows team leaders and/or room directors to conduct random read behinds as an additional monitoring method. When conducting read behinds, the team leader (or room director) receives student responses and the scores assigned by the reader. Responses selected for read behinds may be randomly selected or may be targeted read behinds (i.e., responses receiving specific scores, etc.). These read behinds are very useful in tracking specific areas of confusion for a given reader or group of readers and assist the team leader in knowing just how to direct retraining activities.

2006 NMSBA Technical Report Page 33
Prepared by Harcourt Assessment, Inc for the New Mexico Public Education Department
Overall Scoring Process
For our readers, a work day at the PASC consists of seven hours of directed activity, two breaks, and an hour for lunch. After the readers leave for the day, the readers’ aides remove all materials from the scoring rooms and return them to the storeroom for locked storage overnight. Scoring directors and team leaders review the day’s activities and the various monitoring reports, and plan any retraining or recalibration work that may be required the following day.
Readers have a reader number and are assigned to teams. The reader number and team identification are linked to all documents the reader scores. This ensures that subsequent readings of student papers will be directed to different readers from different teams. No identifying information about the student is available to scorers.
Harcourt’s on-line scoring system routs selected items to readers who have trained and qualified to score those items. Items may be single items (as with writing) or groups of items (as with math and science, for example). Whether an item or an item subset, the system recognizes each as a separate work unit and distributes work units only to the reader scorer who is qualified to score that work unit. All PASC readers have individual reader number and individual password for the system.
Using the unique reader number, PASC also tracks how readers are scoring and the rates of agreement between readers.
As indicated, when a reader’s performance falls below acceptable parameters for a project, indicated either through his or her scores on the daily calibration sets or through the many monitoring activities we employ, the reader is retrained. In those instances where the retraining does not correct the discrepant scoring, the reader will be dismissed from the scoring project.
The number of readers and the number of teams needed for a specific project are determined by the number of forms and items to be scored, the length of the scoring window, and the average reader rate for each type of response to be scored. We generally assign teams of six to eight readers for short-answer assessment. Each team has a team leader. Room directors are assigned for each content area.
When readers are assigned to a specific scoring project, their attendance is monitored, and readers who fail to commit to the full project may be dismissed. Our experience has shown an average attrition rate for long-term projects to be approximately 20 percent, which is factored in when we determine the number of readers to be called.
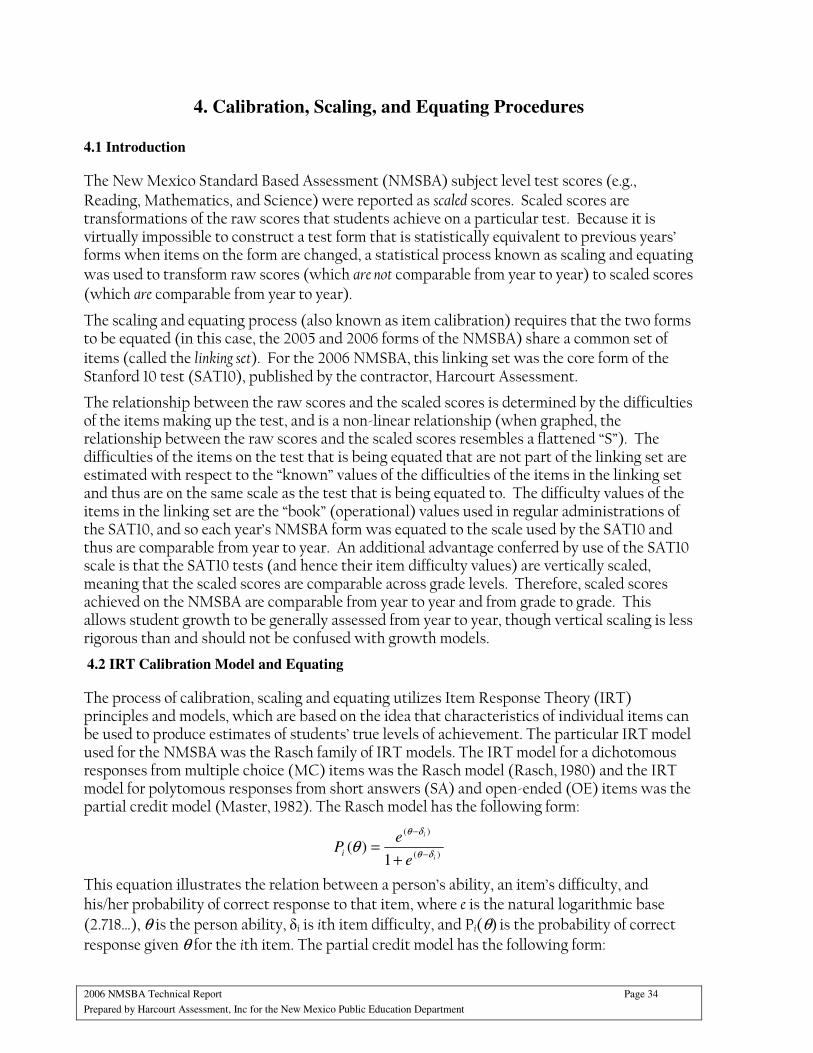
2006 NMSBA Technical Report Page 34
Prepared by Harcourt Assessment, Inc for the New Mexico Public Education Department
4. Calibration, Scaling, and Equating Procedures
4.1 Introduction
The New Mexico Standard Based Assessment (NMSBA) subject level test scores (e.g., Reading, Mathematics, and Science) were reported as scaled scores. Scaled scores are transformations of the raw scores that students achieve on a particular test. Because it is virtually impossible to construct a test form that is statistically equivalent to previous years’ forms when items on the form are changed, a statistical process known as scaling and equating was used to transform raw scores (which are not comparable from year to year) to scaled scores (which are comparable from year to year).
The scaling and equating process (also known as item calibration) requires that the two forms to be equated (in this case, the 2005 and 2006 forms of the NMSBA) share a common set of items (called the linking set). For the 2006 NMSBA, this linking set was the core form of the Stanford 10 test (SAT10), published by the contractor, Harcourt Assessment.
The relationship between the raw scores and the scaled scores is determined by the difficulties of the items making up the test, and is a non-linear relationship (when graphed, the relationship between the raw scores and the scaled scores resembles a flattened “S”). The difficulties of the items on the test that is being equated that are not part of the linking set are estimated with respect to the “known” values of the difficulties of the items in the linking set and thus are on the same scale as the test that is being equated to. The difficulty values of the items in the linking set are the “book” (operational) values used in regular administrations of the SAT10, and so each year’s NMSBA form was equated to the scale used by the SAT10 and thus are comparable from year to year. An additional advantage conferred by use of the SAT10 scale is that the SAT10 tests (and hence their item difficulty values) are vertically scaled, meaning that the scaled scores are comparable across grade levels. Therefore, scaled scores achieved on the NMSBA are comparable from year to year and from grade to grade. This allows student growth to be generally assessed from year to year, though vertical scaling is less rigorous than and should not be confused with growth models.
4.2 IRT Calibration Model and Equating
The process of calibration, scaling and equating utilizes Item Response Theory (IRT) principles and models, which are based on the idea that characteristics of individual items can be used to produce estimates of students’ true levels of achievement. The particular IRT model used for the NMSBA was the Rasch family of IRT models. The IRT model for a dichotomous responses from multiple choice (MC) items was the Rasch model (Rasch, 1980) and the IRT model for polytomous responses from short answers (SA) and open-ended (OE) items was the partial credit model (Master, 1982). The Rasch model has the following form:
)(
)(
1)(
i
i
e
ePi δθ
δθ
θ−
−
+=
This equation illustrates the relation between a person’s ability, an item’s difficulty, and his/her probability of correct response to that item, where e is the natural logarithmic base (2.718…), θ is the person ability, δi is ith item difficulty, and Pi(θ) is the probability of correct response given θ for the ith item. The partial credit model has the following form:
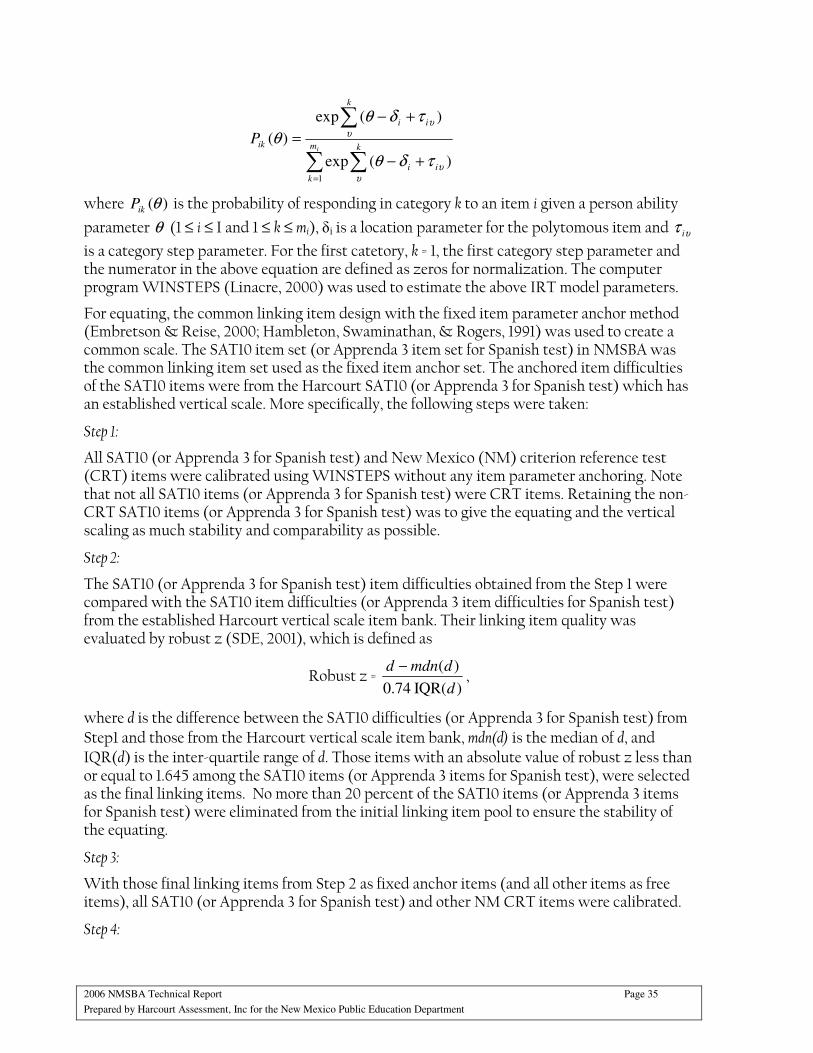
2006 NMSBA Technical Report Page 35
Prepared by Harcourt Assessment, Inc for the New Mexico Public Education Department
∑ ∑
∑
=
+−
+−
=im
k
k
ii
k
ii
ikP
1
)(exp
)(exp
)(
υυ
υυ
τδθ
τδθ
θ
where )(θikP is the probability of responding in category k to an item i given a person ability
parameter θ (1 ≤ i ≤ I and 1 ≤ k ≤ mi), δi is a location parameter for the polytomous item and υτ i
is a category step parameter. For the first catetory, k = 1, the first category step parameter and the numerator in the above equation are defined as zeros for normalization. The computer program WINSTEPS (Linacre, 2000) was used to estimate the above IRT model parameters.
For equating, the common linking item design with the fixed item parameter anchor method (Embretson & Reise, 2000; Hambleton, Swaminathan, & Rogers, 1991) was used to create a common scale. The SAT10 item set (or Apprenda 3 item set for Spanish test) in NMSBA was the common linking item set used as the fixed item anchor set. The anchored item difficulties of the SAT10 items were from the Harcourt SAT10 (or Apprenda 3 for Spanish test) which has an established vertical scale. More specifically, the following steps were taken:
Step 1:
All SAT10 (or Apprenda 3 for Spanish test) and New Mexico (NM) criterion reference test (CRT) items were calibrated using WINSTEPS without any item parameter anchoring. Note that not all SAT10 items (or Apprenda 3 for Spanish test) were CRT items. Retaining the non-CRT SAT10 items (or Apprenda 3 for Spanish test) was to give the equating and the vertical scaling as much stability and comparability as possible.
Step 2:
The SAT10 (or Apprenda 3 for Spanish test) item difficulties obtained from the Step 1 were compared with the SAT10 item difficulties (or Apprenda 3 item difficulties for Spanish test) from the established Harcourt vertical scale item bank. Their linking item quality was evaluated by robust z (SDE, 2001), which is defined as
Robust z = )IQR( 74.0
)(
d
dmdnd −,
where d is the difference between the SAT10 difficulties (or Apprenda 3 for Spanish test) from Step1 and those from the Harcourt vertical scale item bank, mdn(d) is the median of d, and IQR(d) is the inter-quartile range of d. Those items with an absolute value of robust z less than or equal to 1.645 among the SAT10 items (or Apprenda 3 items for Spanish test), were selected as the final linking items. No more than 20 percent of the SAT10 items (or Apprenda 3 items for Spanish test) were eliminated from the initial linking item pool to ensure the stability of the equating.
Step 3:
With those final linking items from Step 2 as fixed anchor items (and all other items as free items), all SAT10 (or Apprenda 3 for Spanish test) and other NM CRT items were calibrated.
Step 4:
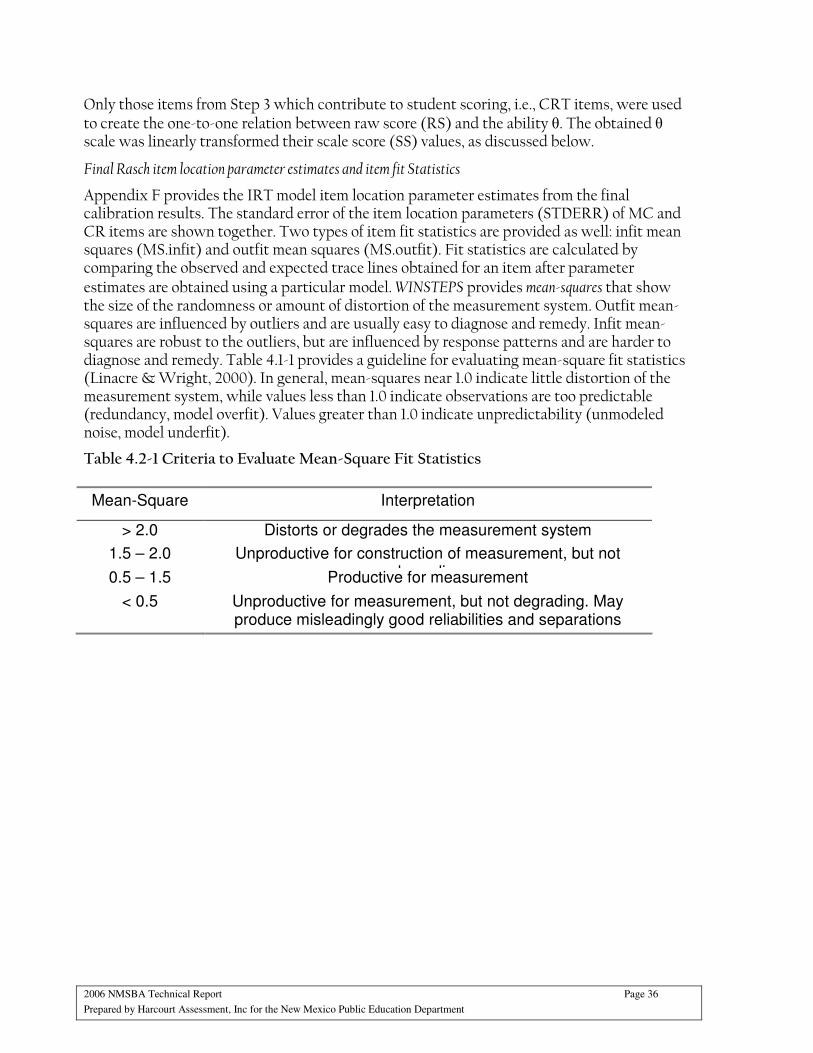
2006 NMSBA Technical Report Page 36
Prepared by Harcourt Assessment, Inc for the New Mexico Public Education Department
Only those items from Step 3 which contribute to student scoring, i.e., CRT items, were used to create the one-to-one relation between raw score (RS) and the ability θ. The obtained θ scale was linearly transformed their scale score (SS) values, as discussed below.
Final Rasch item location parameter estimates and item fit Statistics
Appendix F provides the IRT model item location parameter estimates from the final calibration results. The standard error of the item location parameters (STDERR) of MC and CR items are shown together. Two types of item fit statistics are provided as well: infit mean squares (MS.infit) and outfit mean squares (MS.outfit). Fit statistics are calculated by comparing the observed and expected trace lines obtained for an item after parameter estimates are obtained using a particular model. WINSTEPS provides mean-squares that show the size of the randomness or amount of distortion of the measurement system. Outfit mean-squares are influenced by outliers and are usually easy to diagnose and remedy. Infit mean-squares are robust to the outliers, but are influenced by response patterns and are harder to diagnose and remedy. Table 4.1-1 provides a guideline for evaluating mean-square fit statistics (Linacre & Wright, 2000). In general, mean-squares near 1.0 indicate little distortion of the measurement system, while values less than 1.0 indicate observations are too predictable (redundancy, model overfit). Values greater than 1.0 indicate unpredictability (unmodeled noise, model underfit).
Table 4.2-1 Criteria to Evaluate Mean-Square Fit Statistics
Mean-Square Interpretation
> 2.0 Distorts or degrades the measurement system
1.5 – 2.0 Unproductive for construction of measurement, but not degrading 0.5 – 1.5 Productive for measurement
< 0.5 Unproductive for measurement, but not degrading. May produce misleadingly good reliabilities and separations
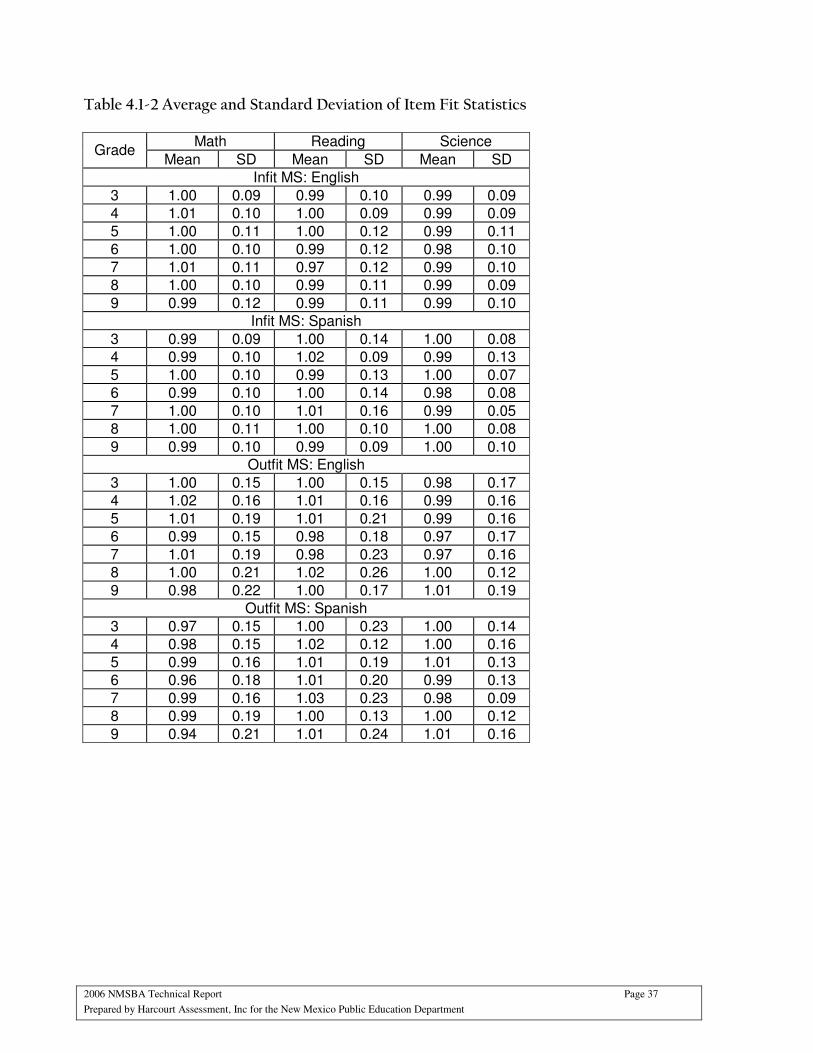
2006 NMSBA Technical Report Page 37
Prepared by Harcourt Assessment, Inc for the New Mexico Public Education Department
Table 4.1-2 Average and Standard Deviation of Item Fit Statistics
Math Reading Science Grade
Mean SD Mean SD Mean SD
Infit MS: English
3 1.00 0.09 0.99 0.10 0.99 0.09
4 1.01 0.10 1.00 0.09 0.99 0.09
5 1.00 0.11 1.00 0.12 0.99 0.11
6 1.00 0.10 0.99 0.12 0.98 0.10
7 1.01 0.11 0.97 0.12 0.99 0.10
8 1.00 0.10 0.99 0.11 0.99 0.09
9 0.99 0.12 0.99 0.11 0.99 0.10
Infit MS: Spanish
3 0.99 0.09 1.00 0.14 1.00 0.08
4 0.99 0.10 1.02 0.09 0.99 0.13
5 1.00 0.10 0.99 0.13 1.00 0.07
6 0.99 0.10 1.00 0.14 0.98 0.08
7 1.00 0.10 1.01 0.16 0.99 0.05
8 1.00 0.11 1.00 0.10 1.00 0.08
9 0.99 0.10 0.99 0.09 1.00 0.10
Outfit MS: English
3 1.00 0.15 1.00 0.15 0.98 0.17
4 1.02 0.16 1.01 0.16 0.99 0.16
5 1.01 0.19 1.01 0.21 0.99 0.16
6 0.99 0.15 0.98 0.18 0.97 0.17
7 1.01 0.19 0.98 0.23 0.97 0.16
8 1.00 0.21 1.02 0.26 1.00 0.12
9 0.98 0.22 1.00 0.17 1.01 0.19
Outfit MS: Spanish
3 0.97 0.15 1.00 0.23 1.00 0.14
4 0.98 0.15 1.02 0.12 1.00 0.16
5 0.99 0.16 1.01 0.19 1.01 0.13
6 0.96 0.18 1.01 0.20 0.99 0.13
7 0.99 0.16 1.03 0.23 0.98 0.09
8 0.99 0.19 1.00 0.13 1.00 0.12
9 0.94 0.21 1.01 0.24 1.01 0.16
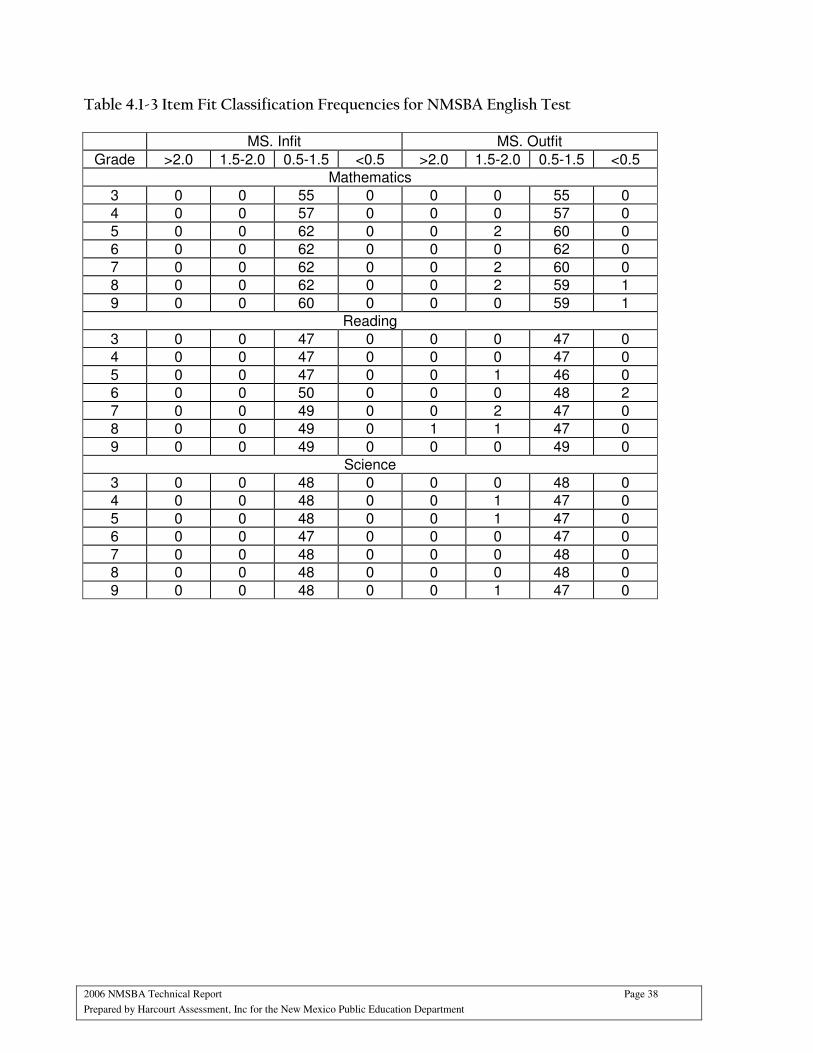
2006 NMSBA Technical Report Page 38
Prepared by Harcourt Assessment, Inc for the New Mexico Public Education Department
Table 4.1-3 Item Fit Classification Frequencies for NMSBA English Test
MS. Infit MS. Outfit
Grade >2.0 1.5-2.0 0.5-1.5 <0.5 >2.0 1.5-2.0 0.5-1.5 <0.5
Mathematics
3 0 0 55 0 0 0 55 0
4 0 0 57 0 0 0 57 0
5 0 0 62 0 0 2 60 0
6 0 0 62 0 0 0 62 0
7 0 0 62 0 0 2 60 0
8 0 0 62 0 0 2 59 1
9 0 0 60 0 0 0 59 1
Reading
3 0 0 47 0 0 0 47 0
4 0 0 47 0 0 0 47 0
5 0 0 47 0 0 1 46 0
6 0 0 50 0 0 0 48 2
7 0 0 49 0 0 2 47 0
8 0 0 49 0 1 1 47 0
9 0 0 49 0 0 0 49 0
Science
3 0 0 48 0 0 0 48 0
4 0 0 48 0 0 1 47 0
5 0 0 48 0 0 1 47 0
6 0 0 47 0 0 0 47 0
7 0 0 48 0 0 0 48 0
8 0 0 48 0 0 0 48 0
9 0 0 48 0 0 1 47 0
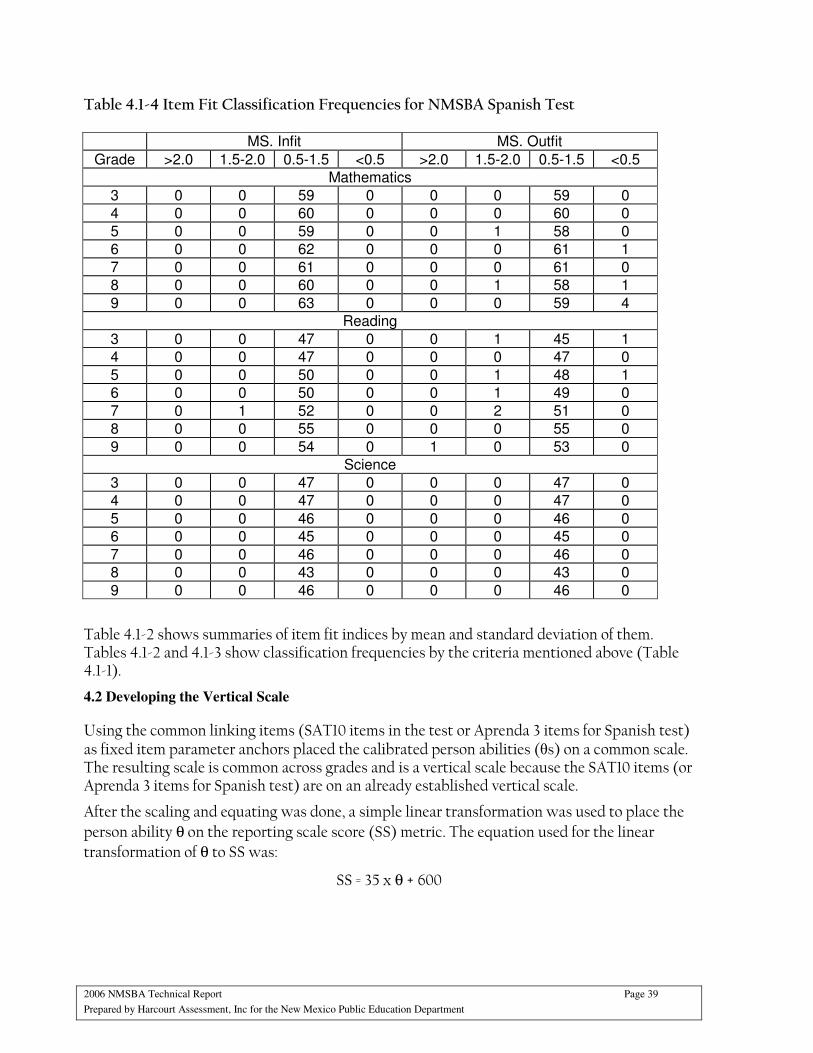
2006 NMSBA Technical Report Page 39
Prepared by Harcourt Assessment, Inc for the New Mexico Public Education Department
Table 4.1-4 Item Fit Classification Frequencies for NMSBA Spanish Test
MS. Infit MS. Outfit
Grade >2.0 1.5-2.0 0.5-1.5 <0.5 >2.0 1.5-2.0 0.5-1.5 <0.5
Mathematics
3 0 0 59 0 0 0 59 0
4 0 0 60 0 0 0 60 0
5 0 0 59 0 0 1 58 0
6 0 0 62 0 0 0 61 1
7 0 0 61 0 0 0 61 0
8 0 0 60 0 0 1 58 1
9 0 0 63 0 0 0 59 4
Reading
3 0 0 47 0 0 1 45 1
4 0 0 47 0 0 0 47 0
5 0 0 50 0 0 1 48 1
6 0 0 50 0 0 1 49 0
7 0 1 52 0 0 2 51 0
8 0 0 55 0 0 0 55 0
9 0 0 54 0 1 0 53 0
Science
3 0 0 47 0 0 0 47 0
4 0 0 47 0 0 0 47 0
5 0 0 46 0 0 0 46 0
6 0 0 45 0 0 0 45 0
7 0 0 46 0 0 0 46 0
8 0 0 43 0 0 0 43 0
9 0 0 46 0 0 0 46 0
Table 4.1-2 shows summaries of item fit indices by mean and standard deviation of them. Tables 4.1-2 and 4.1-3 show classification frequencies by the criteria mentioned above (Table 4.1-1).
4.2 Developing the Vertical Scale
Using the common linking items (SAT10 items in the test or Aprenda 3 items for Spanish test) as fixed item parameter anchors placed the calibrated person abilities (θs) on a common scale. The resulting scale is common across grades and is a vertical scale because the SAT10 items (or Aprenda 3 items for Spanish test) are on an already established vertical scale.
After the scaling and equating was done, a simple linear transformation was used to place the
person ability θ on the reporting scale score (SS) metric. The equation used for the linear
transformation of θ to SS was:
SS = 35 x θ + 600
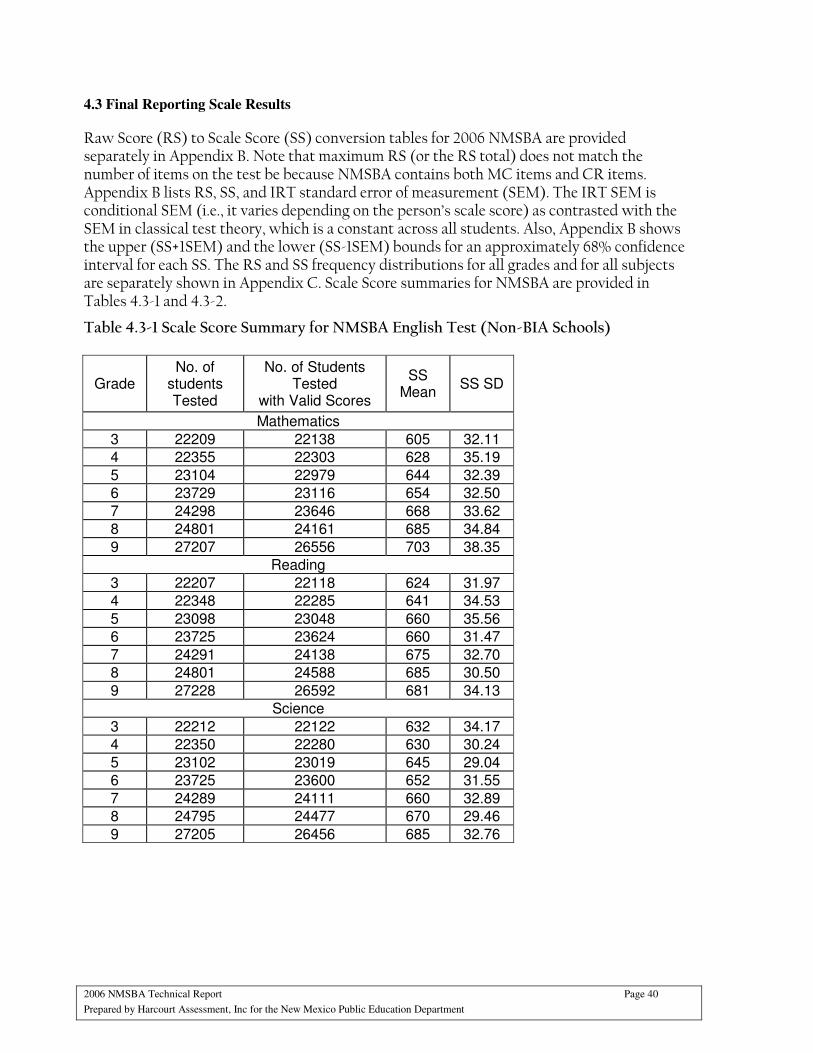
2006 NMSBA Technical Report Page 40
Prepared by Harcourt Assessment, Inc for the New Mexico Public Education Department
4.3 Final Reporting Scale Results
Raw Score (RS) to Scale Score (SS) conversion tables for 2006 NMSBA are provided separately in Appendix B. Note that maximum RS (or the RS total) does not match the number of items on the test be because NMSBA contains both MC items and CR items. Appendix B lists RS, SS, and IRT standard error of measurement (SEM). The IRT SEM is conditional SEM (i.e., it varies depending on the person’s scale score) as contrasted with the SEM in classical test theory, which is a constant across all students. Also, Appendix B shows the upper (SS+1SEM) and the lower (SS-1SEM) bounds for an approximately 68% confidence interval for each SS. The RS and SS frequency distributions for all grades and for all subjects are separately shown in Appendix C. Scale Score summaries for NMSBA are provided in Tables 4.3-1 and 4.3-2.
Table 4.3-1 Scale Score Summary for NMSBA English Test (Non-BIA Schools)
Grade No. of
students Tested
No. of Students Tested
with Valid Scores
SS Mean
SS SD
Mathematics
3 22209 22138 605 32.11
4 22355 22303 628 35.19
5 23104 22979 644 32.39
6 23729 23116 654 32.50
7 24298 23646 668 33.62
8 24801 24161 685 34.84
9 27207 26556 703 38.35
Reading
3 22207 22118 624 31.97
4 22348 22285 641 34.53
5 23098 23048 660 35.56
6 23725 23624 660 31.47
7 24291 24138 675 32.70
8 24801 24588 685 30.50
9 27228 26592 681 34.13
Science
3 22212 22122 632 34.17
4 22350 22280 630 30.24
5 23102 23019 645 29.04
6 23725 23600 652 31.55
7 24289 24111 660 32.89
8 24795 24477 670 29.46
9 27205 26456 685 32.76

2006 NMSBA Technical Report Page 41
Prepared by Harcourt Assessment, Inc for the New Mexico Public Education Department
Table 4.3-2 Scale Score Summary for NMSBA Spanish Test
Grade No. of
students Tested
No. of Students Tested
with Valid Scores
SS Mean
SS SD
Mathematics
3 1719 1711 593 29.66
4 1302 1298 602 27.83
5 897 894 610 26.51
6 692 686 627 24.25
7 688 677 628 23.73
8 653 648 643 25.46
9 641 618 641 25.81
Reading
3 1706 1698 600 30.71
4 1292 1287 615 27.74
5 895 891 621 31.03
6 683 677 644 26.64
7 679 673 669 26.45
8 645 641 662 25.07
9 640 627 649 24.30
Science
3 1718 1710 595 28.93
4 1301 1295 600 25.44
5 896 893 615 22.58
6 692 687 615 23.52
7 688 684 617 22.79
8 652 643 621 20.92
9 641 614 626 21.99
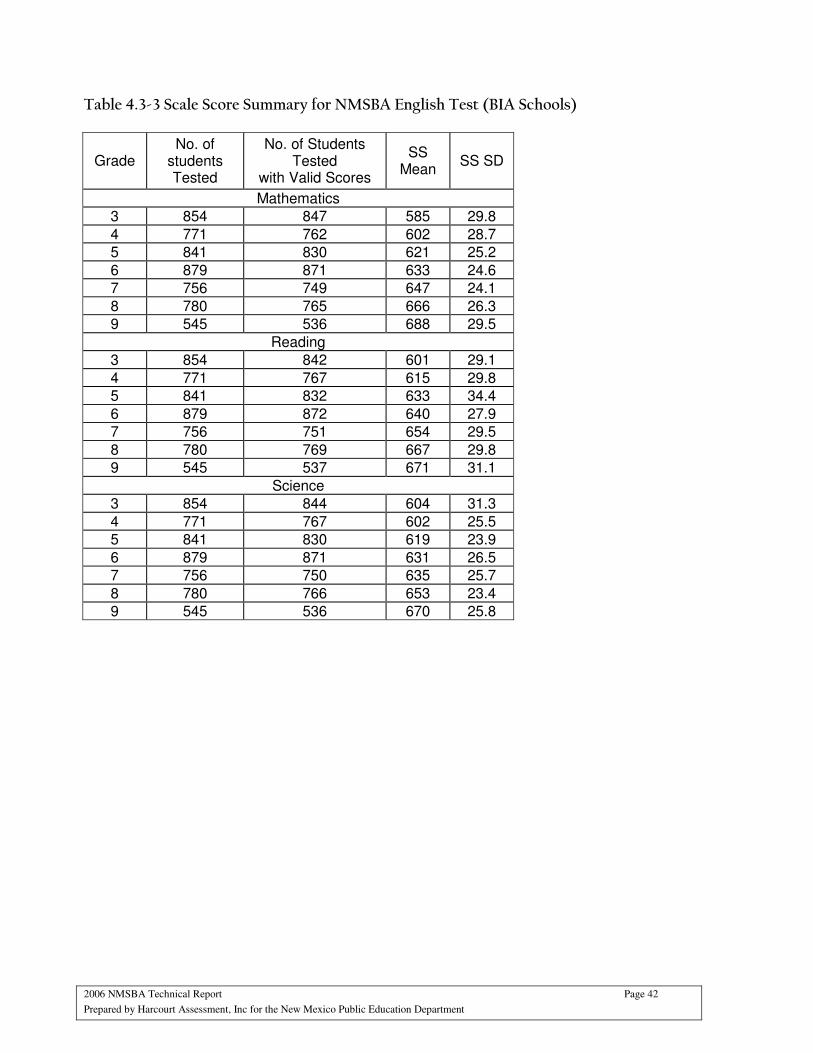
2006 NMSBA Technical Report Page 42
Prepared by Harcourt Assessment, Inc for the New Mexico Public Education Department
Table 4.3-3 Scale Score Summary for NMSBA English Test (BIA Schools)
Grade No. of
students Tested
No. of Students Tested
with Valid Scores
SS Mean
SS SD
Mathematics
3 854 847 585 29.8
4 771 762 602 28.7
5 841 830 621 25.2
6 879 871 633 24.6
7 756 749 647 24.1
8 780 765 666 26.3
9 545 536 688 29.5
Reading
3 854 842 601 29.1
4 771 767 615 29.8
5 841 832 633 34.4
6 879 872 640 27.9
7 756 751 654 29.5
8 780 769 667 29.8
9 545 537 671 31.1
Science
3 854 844 604 31.3
4 771 767 602 25.5
5 841 830 619 23.9
6 879 871 631 26.5
7 756 750 635 25.7
8 780 766 653 23.4
9 545 536 670 25.8
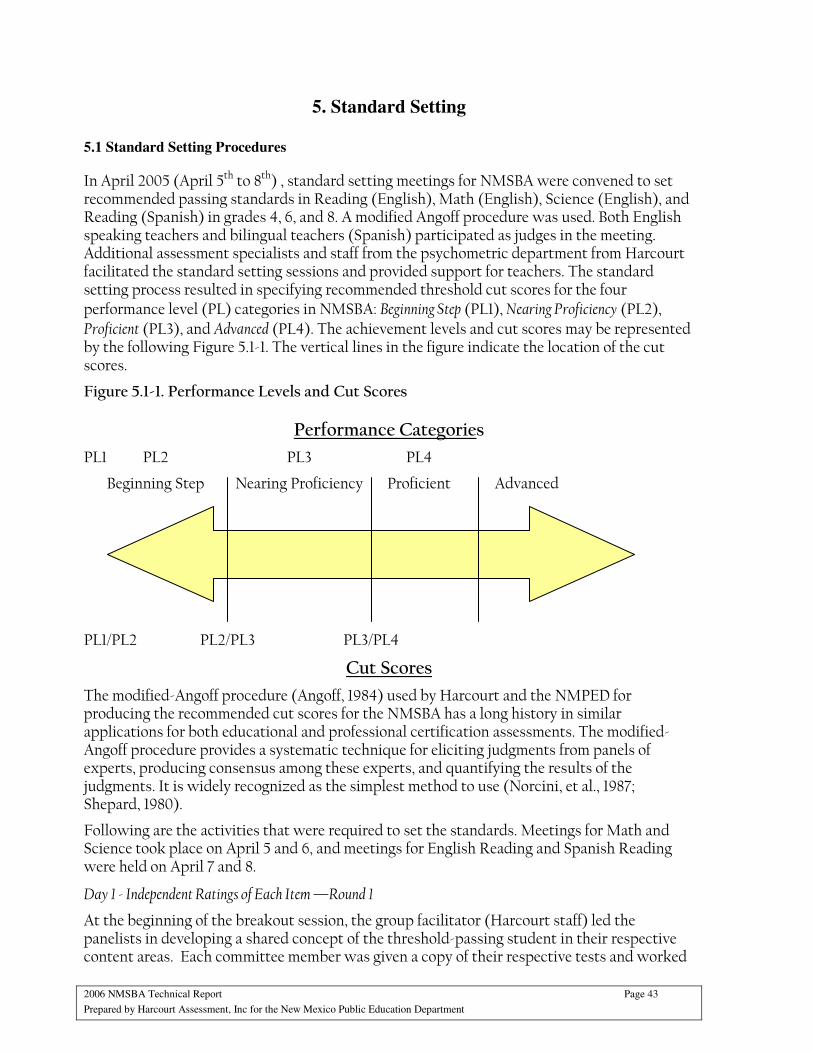
2006 NMSBA Technical Report Page 43
Prepared by Harcourt Assessment, Inc for the New Mexico Public Education Department
5. Standard Setting
5.1 Standard Setting Procedures
In April 2005 (April 5th to 8th) , standard setting meetings for NMSBA were convened to set recommended passing standards in Reading (English), Math (English), Science (English), and Reading (Spanish) in grades 4, 6, and 8. A modified Angoff procedure was used. Both English speaking teachers and bilingual teachers (Spanish) participated as judges in the meeting. Additional assessment specialists and staff from the psychometric department from Harcourt facilitated the standard setting sessions and provided support for teachers. The standard setting process resulted in specifying recommended threshold cut scores for the four performance level (PL) categories in NMSBA: Beginning Step (PL1), Nearing Proficiency (PL2), Proficient (PL3), and Advanced (PL4). The achievement levels and cut scores may be represented by the following Figure 5.1-1. The vertical lines in the figure indicate the location of the cut scores.
Figure 5.1-1. Performance Levels and Cut Scores
Performance Categories
PL1 PL2 PL3 PL4
Beginning Step Nearing Proficiency Proficient Advanced
PL1/PL2 PL2/PL3 PL3/PL4
Cut Scores
The modified-Angoff procedure (Angoff, 1984) used by Harcourt and the NMPED for producing the recommended cut scores for the NMSBA has a long history in similar applications for both educational and professional certification assessments. The modified-Angoff procedure provides a systematic technique for eliciting judgments from panels of experts, producing consensus among these experts, and quantifying the results of the judgments. It is widely recognized as the simplest method to use (Norcini, et al., 1987; Shepard, 1980).
Following are the activities that were required to set the standards. Meetings for Math and Science took place on April 5 and 6, and meetings for English Reading and Spanish Reading were held on April 7 and 8.
Day 1 - Independent Ratings of Each Item —Round 1
At the beginning of the breakout session, the group facilitator (Harcourt staff) led the panelists in developing a shared concept of the threshold-passing student in their respective content areas. Each committee member was given a copy of their respective tests and worked
2006 NMSBA Technical Report Page 44
Prepared by Harcourt Assessment, Inc for the New Mexico Public Education Department
individually to answer the items. Once all committee members completed the test, answer keys were provided and the judges scored their tests.
Next, each committee member was asked to rate each item. They were encouraged to read each item, consider the skills being assessed and the importance of those skills, thinking of 100 threshold-passing students across the state, and record an estimate of how many, or what percentage, of those 100 threshold-passing students should correctly answer the item. It should be noted that there are open-ended items for each subject area. For these items, the judges were asked to estimate the mean performance of threshold-passing students, since percent-correct estimates are not applicable with open-ended items. Upon completion of the first round of ratings, all secure materials were collected and inventoried before committee members were dismissed from the meeting.
During the evening, the individual ratings of the judges were aggregated. Statistics for each judge and for the entire panel also were computed. To obtain an overall estimate of the pass/fail cut score from the total group of judges, the initial item ratings provided by the judges were treated as p-values (proportions) and summed across items by level. The result of this summation is a number-correct value for each judge. The median of the number-correct value was calculated across judges to obtain the judges’ estimate of the standard for the pass/fail cut score.
Day 2 – Provision and Discussion of Data
The next morning, the judges’ rating sheets, test booklets, and handouts were returned to them. On an overhead projector, judges were shown the frequency distributions of their cut scores and the median cut score arrived at by their group. The results concerning their median item rating allowed judges to know how their individual ratings related to the overall standard that these ratings produce. After all the feedback data was provided, it was carefully explained by facilitators so that every judge understood what it showed.
Day 2 - Independent Ratings of Each Item —Round 2
Once discussion of the results of the initial ratings concluded, judges were asked to review the entire set of items that they rated in Round 1, to reconsider these ratings in light of the feedback they have been shown, and to revise any of their ratings, if necessary. The judges’ focus was again directed towards thinking about 100 threshold-passing students (or the mean performance of threshold-passing students for constructed response items) and how they should perform on the items. The Round 2 ratings were collected and inventoried along with the secure materials. The judges’ Round 2 ratings were aggregated. Statistics for each judge and for the entire panel were also computed.
Day2 - Adjustment of Judge’s Cut Scores —Round 3
The judges’ rating sheets, test booklets, and handouts were returned to them. On an overhead projector, judges were shown the frequency distributions of their Round 2 cut scores and the median Round 2 cut score. Judges were instructed to adjust their individual cut score if they desired. At this point, judges had the opportunity to alter their estimates of the round 2 cut point if they felt that their round 2 cut point was a little too high or low. The Round 3 cut scores were then collected and processed to produce the final results. The judges were then presented with the Round 3 cut points. A group discussion was held in order to compare and reflect upon the results.
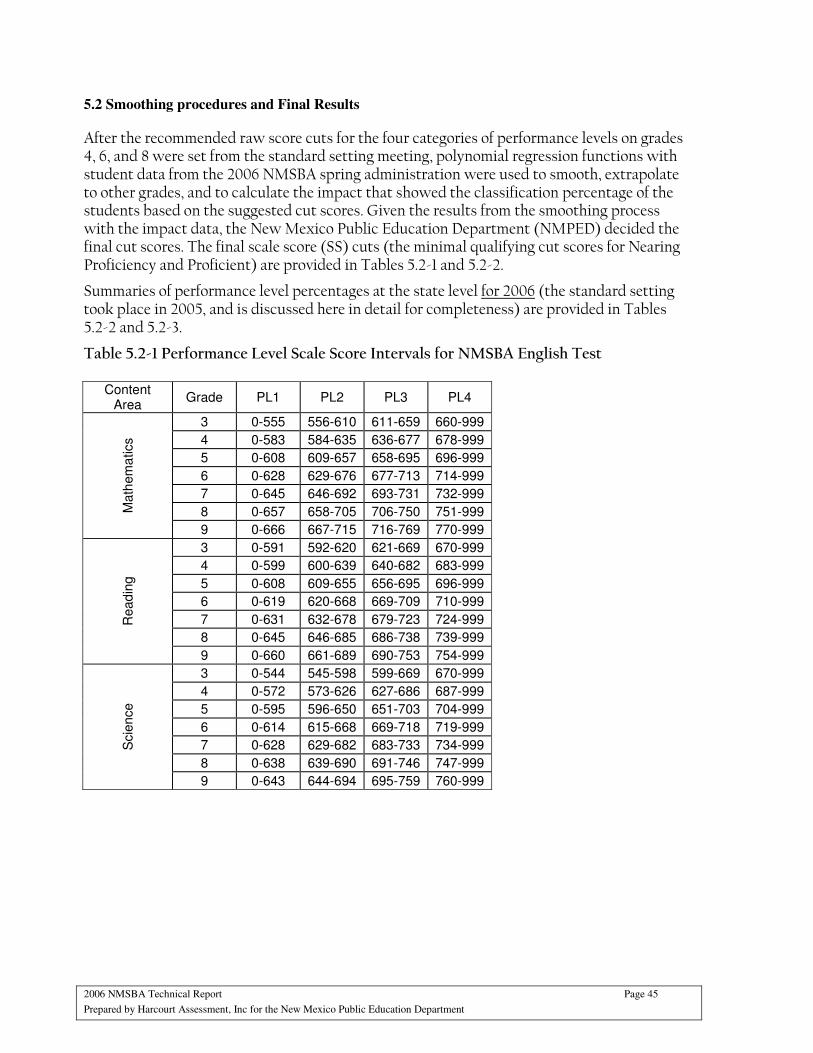
2006 NMSBA Technical Report Page 45
Prepared by Harcourt Assessment, Inc for the New Mexico Public Education Department
5.2 Smoothing procedures and Final Results
After the recommended raw score cuts for the four categories of performance levels on grades 4, 6, and 8 were set from the standard setting meeting, polynomial regression functions with student data from the 2006 NMSBA spring administration were used to smooth, extrapolate to other grades, and to calculate the impact that showed the classification percentage of the students based on the suggested cut scores. Given the results from the smoothing process with the impact data, the New Mexico Public Education Department (NMPED) decided the final cut scores. The final scale score (SS) cuts (the minimal qualifying cut scores for Nearing Proficiency and Proficient) are provided in Tables 5.2-1 and 5.2-2.
Summaries of performance level percentages at the state level for 2006 (the standard setting took place in 2005, and is discussed here in detail for completeness) are provided in Tables 5.2-2 and 5.2-3.
Table 5.2-1 Performance Level Scale Score Intervals for NMSBA English Test
Content Area
Grade PL1 PL2 PL3 PL4
3 0-555 556-610 611-659 660-999
4 0-583 584-635 636-677 678-999
5 0-608 609-657 658-695 696-999
6 0-628 629-676 677-713 714-999
7 0-645 646-692 693-731 732-999
8 0-657 658-705 706-750 751-999 Math
em
atics
9 0-666 667-715 716-769 770-999
3 0-591 592-620 621-669 670-999
4 0-599 600-639 640-682 683-999
5 0-608 609-655 656-695 696-999
6 0-619 620-668 669-709 710-999
7 0-631 632-678 679-723 724-999
8 0-645 646-685 686-738 739-999
Read
ing
9 0-660 661-689 690-753 754-999
3 0-544 545-598 599-669 670-999
4 0-572 573-626 627-686 687-999
5 0-595 596-650 651-703 704-999
6 0-614 615-668 669-718 719-999
7 0-628 629-682 683-733 734-999
8 0-638 639-690 691-746 747-999
Scie
nce
9 0-643 644-694 695-759 760-999
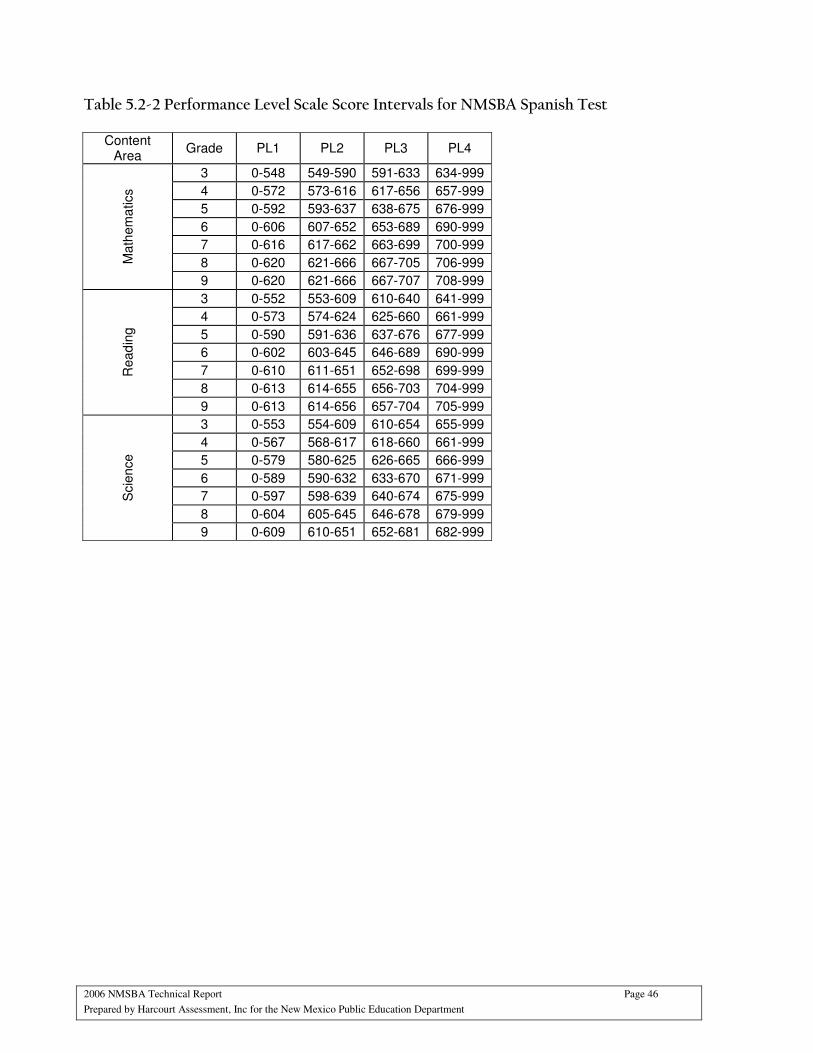
2006 NMSBA Technical Report Page 46
Prepared by Harcourt Assessment, Inc for the New Mexico Public Education Department
Table 5.2-2 Performance Level Scale Score Intervals for NMSBA Spanish Test
Content Area
Grade PL1 PL2 PL3 PL4
3 0-548 549-590 591-633 634-999
4 0-572 573-616 617-656 657-999
5 0-592 593-637 638-675 676-999
6 0-606 607-652 653-689 690-999
7 0-616 617-662 663-699 700-999
8 0-620 621-666 667-705 706-999 Math
em
atics
9 0-620 621-666 667-707 708-999
3 0-552 553-609 610-640 641-999
4 0-573 574-624 625-660 661-999
5 0-590 591-636 637-676 677-999
6 0-602 603-645 646-689 690-999
7 0-610 611-651 652-698 699-999
8 0-613 614-655 656-703 704-999
Read
ing
9 0-613 614-656 657-704 705-999
3 0-553 554-609 610-654 655-999
4 0-567 568-617 618-660 661-999
5 0-579 580-625 626-665 666-999
6 0-589 590-632 633-670 671-999
7 0-597 598-639 640-674 675-999
8 0-604 605-645 646-678 679-999
Scie
nce
9 0-609 610-651 652-681 682-999
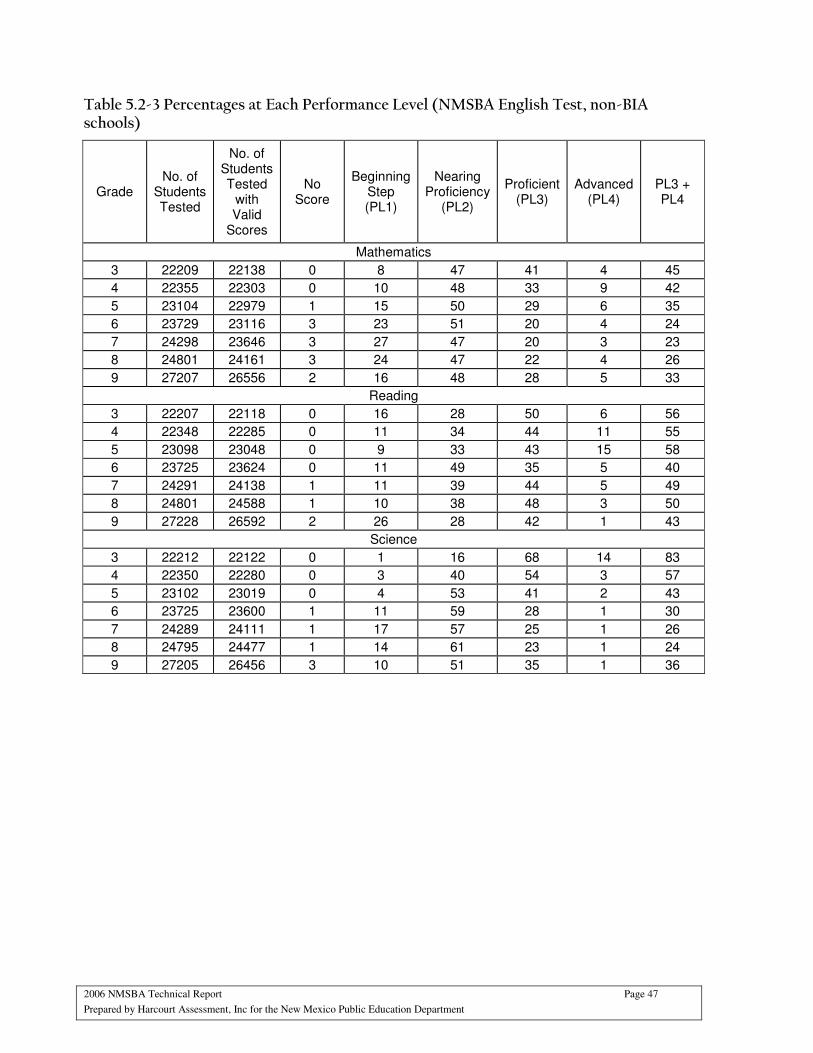
2006 NMSBA Technical Report Page 47
Prepared by Harcourt Assessment, Inc for the New Mexico Public Education Department
Table 5.2-3 Percentages at Each Performance Level (NMSBA English Test, non-BIA schools)
Grade No. of
Students Tested
No. of Students Tested
with Valid
Scores
No Score
Beginning Step (PL1)
Nearing Proficiency
(PL2)
Proficient (PL3)
Advanced (PL4)
PL3 + PL4
Mathematics
3 22209 22138 0 8 47 41 4 45
4 22355 22303 0 10 48 33 9 42
5 23104 22979 1 15 50 29 6 35
6 23729 23116 3 23 51 20 4 24
7 24298 23646 3 27 47 20 3 23
8 24801 24161 3 24 47 22 4 26
9 27207 26556 2 16 48 28 5 33
Reading
3 22207 22118 0 16 28 50 6 56
4 22348 22285 0 11 34 44 11 55
5 23098 23048 0 9 33 43 15 58
6 23725 23624 0 11 49 35 5 40
7 24291 24138 1 11 39 44 5 49
8 24801 24588 1 10 38 48 3 50
9 27228 26592 2 26 28 42 1 43
Science
3 22212 22122 0 1 16 68 14 83
4 22350 22280 0 3 40 54 3 57
5 23102 23019 0 4 53 41 2 43
6 23725 23600 1 11 59 28 1 30
7 24289 24111 1 17 57 25 1 26
8 24795 24477 1 14 61 23 1 24
9 27205 26456 3 10 51 35 1 36
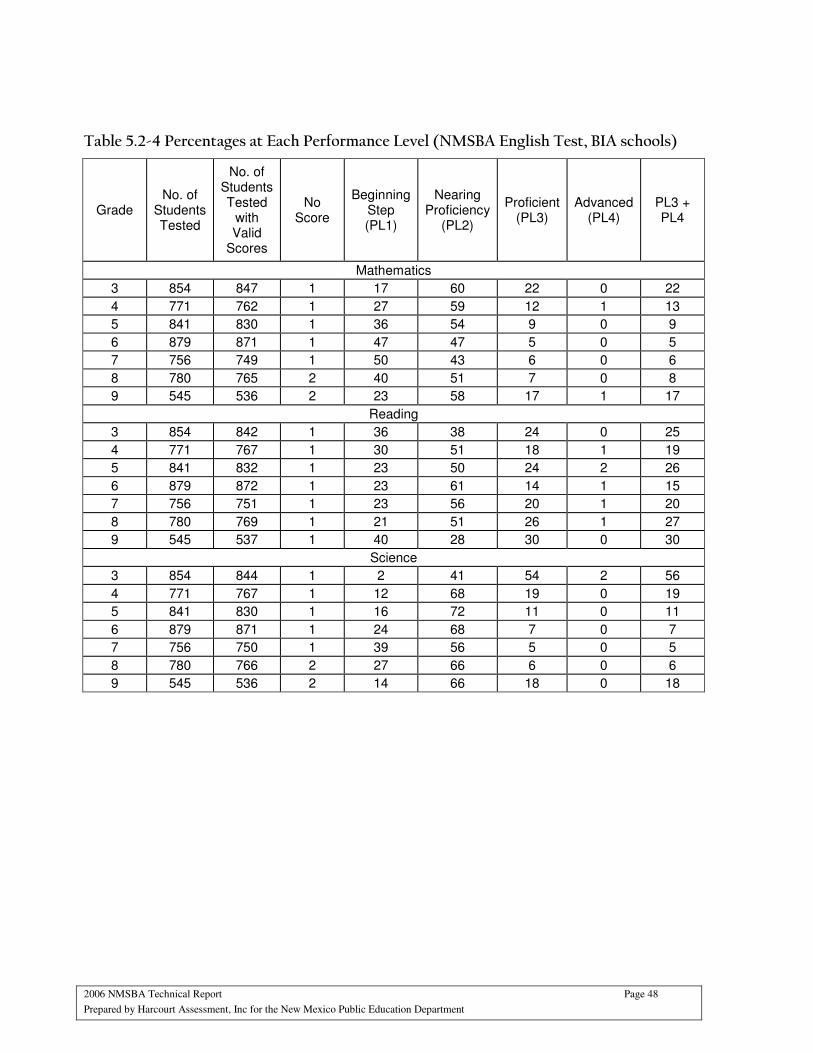
2006 NMSBA Technical Report Page 48
Prepared by Harcourt Assessment, Inc for the New Mexico Public Education Department
Table 5.2-4 Percentages at Each Performance Level (NMSBA English Test, BIA schools)
Grade No. of
Students Tested
No. of Students Tested
with Valid
Scores
No Score
Beginning Step (PL1)
Nearing Proficiency
(PL2)
Proficient (PL3)
Advanced (PL4)
PL3 + PL4
Mathematics
3 854 847 1 17 60 22 0 22
4 771 762 1 27 59 12 1 13
5 841 830 1 36 54 9 0 9
6 879 871 1 47 47 5 0 5
7 756 749 1 50 43 6 0 6
8 780 765 2 40 51 7 0 8
9 545 536 2 23 58 17 1 17
Reading
3 854 842 1 36 38 24 0 25
4 771 767 1 30 51 18 1 19
5 841 832 1 23 50 24 2 26
6 879 872 1 23 61 14 1 15
7 756 751 1 23 56 20 1 20
8 780 769 1 21 51 26 1 27
9 545 537 1 40 28 30 0 30
Science
3 854 844 1 2 41 54 2 56
4 771 767 1 12 68 19 0 19
5 841 830 1 16 72 11 0 11
6 879 871 1 24 68 7 0 7
7 756 750 1 39 56 5 0 5
8 780 766 2 27 66 6 0 6
9 545 536 2 14 66 18 0 18
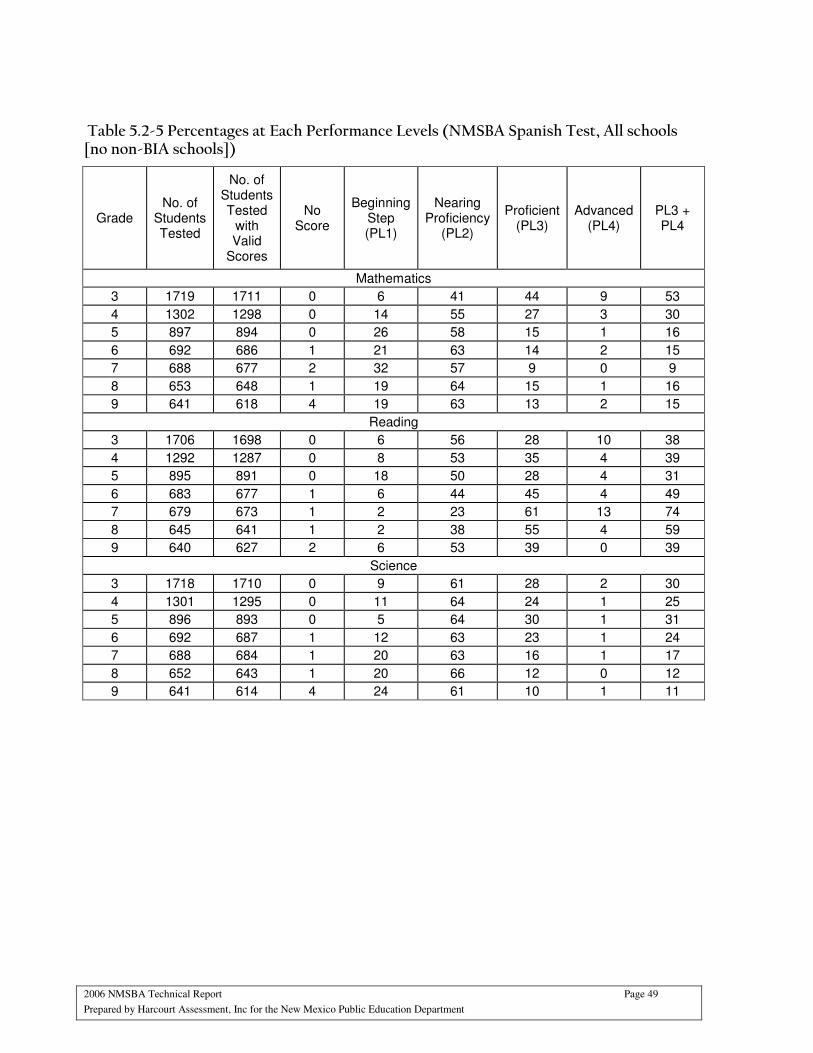
2006 NMSBA Technical Report Page 49
Prepared by Harcourt Assessment, Inc for the New Mexico Public Education Department
Table 5.2-5 Percentages at Each Performance Levels (NMSBA Spanish Test, All schools [no non-BIA schools])
Grade No. of
Students Tested
No. of Students Tested
with Valid
Scores
No Score
Beginning Step (PL1)
Nearing Proficiency
(PL2)
Proficient (PL3)
Advanced (PL4)
PL3 + PL4
Mathematics
3 1719 1711 0 6 41 44 9 53
4 1302 1298 0 14 55 27 3 30
5 897 894 0 26 58 15 1 16
6 692 686 1 21 63 14 2 15
7 688 677 2 32 57 9 0 9
8 653 648 1 19 64 15 1 16
9 641 618 4 19 63 13 2 15
Reading
3 1706 1698 0 6 56 28 10 38
4 1292 1287 0 8 53 35 4 39
5 895 891 0 18 50 28 4 31
6 683 677 1 6 44 45 4 49
7 679 673 1 2 23 61 13 74
8 645 641 1 2 38 55 4 59
9 640 627 2 6 53 39 0 39
Science
3 1718 1710 0 9 61 28 2 30
4 1301 1295 0 11 64 24 1 25
5 896 893 0 5 64 30 1 31
6 692 687 1 12 63 23 1 24
7 688 684 1 20 63 16 1 17
8 652 643 1 20 66 12 0 12
9 641 614 4 24 61 10 1 11

2006 NMSBA Technical Report Page 50
Prepared by Harcourt Assessment, Inc for the New Mexico Public Education Department
The Summary of performance level percentages by subgroups is provided separately in Appendix D. The following Table describes the subgroups reported in Appendix D.
Table 5.2-5 Subgroups Reported in Appendix D
Female Gender
Male
Native American / Alaskan Native
Asian / Pacific Islander
Black (Not Hispanic)
Hispanic
Ethnicity
White (Not Hispanic)”
Special Education (Not Gifted)
Gifted Educational Program
Non-Special Education/Non-Gifted
Title 1 Title 1
Non-Title 1
Enrolled in Bilingual Program Bilingual Education
Not Enrolled in Bilingual Program
Economically Disadvantaged Economic
Non-Economically Disadvantaged
Current ELL
Exited ELL English Language
Learners (ELL) Never ELL
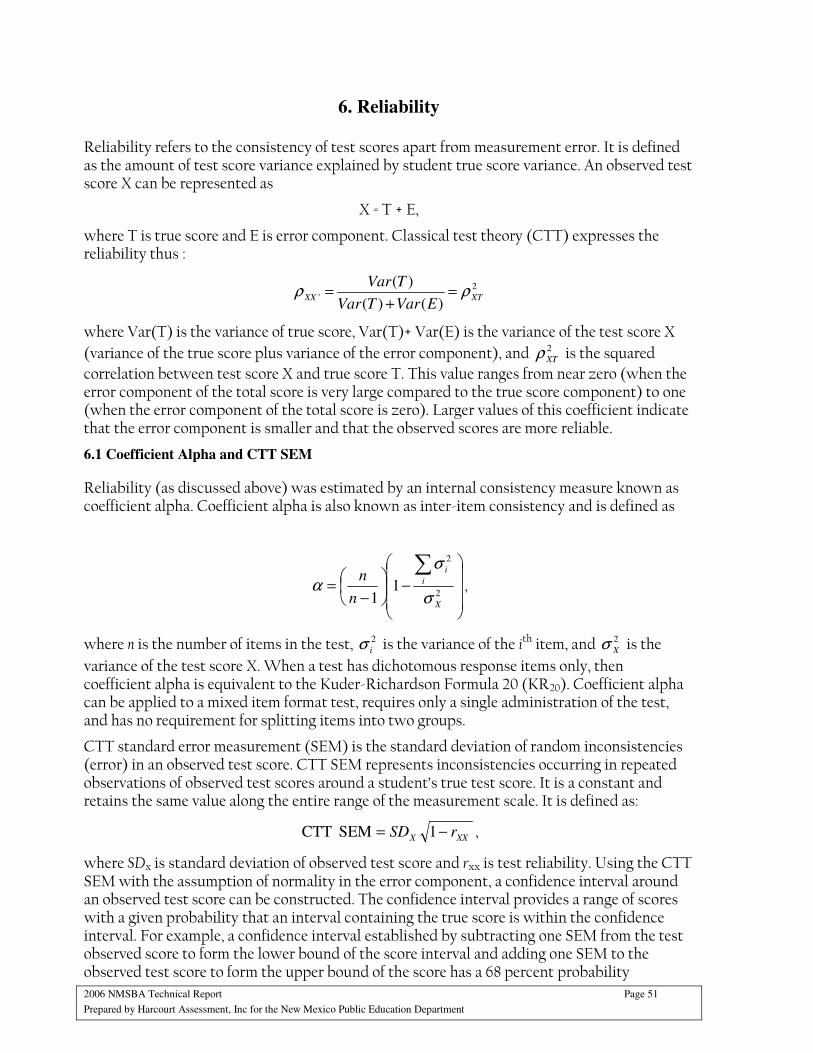
2006 NMSBA Technical Report Page 51
Prepared by Harcourt Assessment, Inc for the New Mexico Public Education Department
6. Reliability
Reliability refers to the consistency of test scores apart from measurement error. It is defined as the amount of test score variance explained by student true score variance. An observed test score X can be represented as
X = T + E,
where T is true score and E is error component. Classical test theory (CTT) expresses the reliability thus :
2
')()(
)(XTXX
EVarTVar
TVarρρ =
+=
where Var(T) is the variance of true score, Var(T)+ Var(E) is the variance of the test score X
(variance of the true score plus variance of the error component), and 2
XTρ is the squared
correlation between test score X and true score T. This value ranges from near zero (when the error component of the total score is very large compared to the true score component) to one (when the error component of the total score is zero). Larger values of this coefficient indicate that the error component is smaller and that the observed scores are more reliable.
6.1 Coefficient Alpha and CTT SEM
Reliability (as discussed above) was estimated by an internal consistency measure known as coefficient alpha. Coefficient alpha is also known as inter-item consistency and is defined as
−
−=
∑2
2
11
X
i
i
n
n
σ
σ
α ,
where n is the number of items in the test, 2
iσ is the variance of the ith item, and 2
Xσ is the
variance of the test score X. When a test has dichotomous response items only, then coefficient alpha is equivalent to the Kuder-Richardson Formula 20 (KR20). Coefficient alpha can be applied to a mixed item format test, requires only a single administration of the test, and has no requirement for splitting items into two groups.
CTT standard error measurement (SEM) is the standard deviation of random inconsistencies (error) in an observed test score. CTT SEM represents inconsistencies occurring in repeated observations of observed test scores around a student’s true test score. It is a constant and retains the same value along the entire range of the measurement scale. It is defined as:
XXX rSD −= 1SEM CTT ,
where SDx is standard deviation of observed test score and rxx is test reliability. Using the CTT SEM with the assumption of normality in the error component, a confidence interval around an observed test score can be constructed. The confidence interval provides a range of scores with a given probability that an interval containing the true score is within the confidence interval. For example, a confidence interval established by subtracting one SEM from the test observed score to form the lower bound of the score interval and adding one SEM to the observed test score to form the upper bound of the score has a 68 percent probability
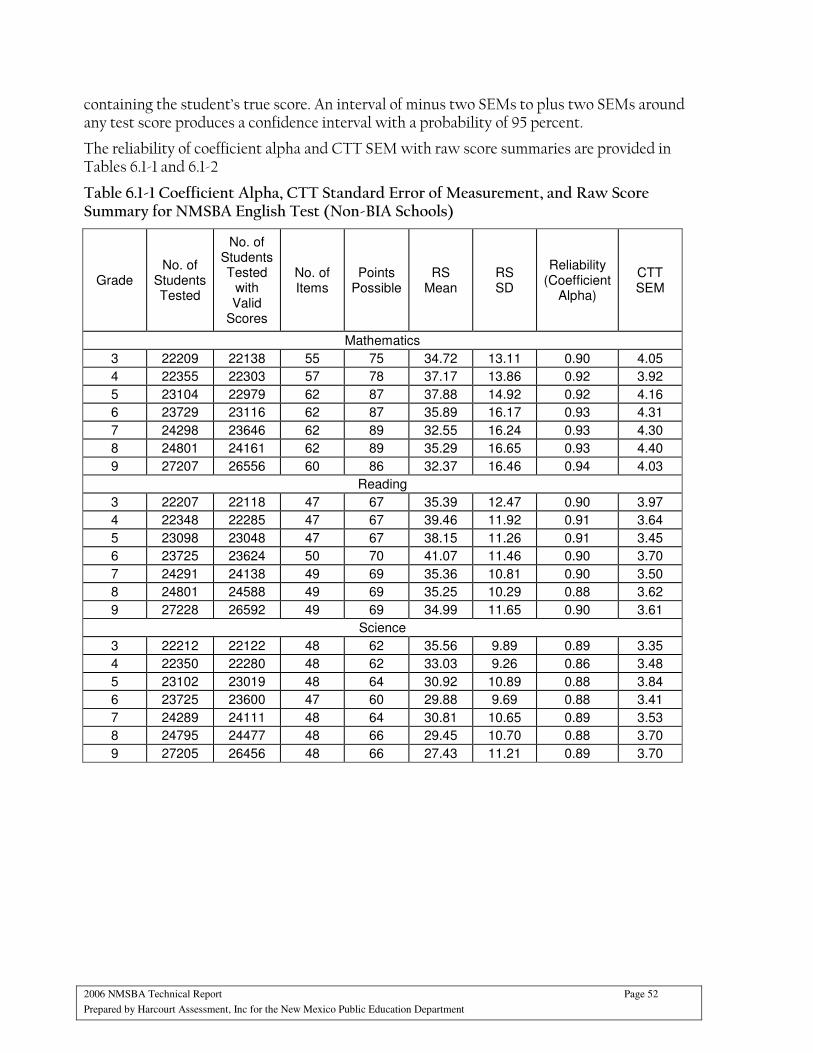
2006 NMSBA Technical Report Page 52
Prepared by Harcourt Assessment, Inc for the New Mexico Public Education Department
containing the student’s true score. An interval of minus two SEMs to plus two SEMs around any test score produces a confidence interval with a probability of 95 percent.
The reliability of coefficient alpha and CTT SEM with raw score summaries are provided in Tables 6.1-1 and 6.1-2
Table 6.1-1 Coefficient Alpha, CTT Standard Error of Measurement, and Raw Score Summary for NMSBA English Test (Non-BIA Schools)
Grade No. of
Students Tested
No. of Students Tested
with Valid
Scores
No. of Items
Points Possible
RS Mean
RS SD
Reliability (Coefficient
Alpha)
CTT SEM
Mathematics
3 22209 22138 55 75 34.72 13.11 0.90 4.05
4 22355 22303 57 78 37.17 13.86 0.92 3.92
5 23104 22979 62 87 37.88 14.92 0.92 4.16
6 23729 23116 62 87 35.89 16.17 0.93 4.31
7 24298 23646 62 89 32.55 16.24 0.93 4.30
8 24801 24161 62 89 35.29 16.65 0.93 4.40
9 27207 26556 60 86 32.37 16.46 0.94 4.03
Reading
3 22207 22118 47 67 35.39 12.47 0.90 3.97
4 22348 22285 47 67 39.46 11.92 0.91 3.64
5 23098 23048 47 67 38.15 11.26 0.91 3.45
6 23725 23624 50 70 41.07 11.46 0.90 3.70
7 24291 24138 49 69 35.36 10.81 0.90 3.50
8 24801 24588 49 69 35.25 10.29 0.88 3.62
9 27228 26592 49 69 34.99 11.65 0.90 3.61
Science
3 22212 22122 48 62 35.56 9.89 0.89 3.35
4 22350 22280 48 62 33.03 9.26 0.86 3.48
5 23102 23019 48 64 30.92 10.89 0.88 3.84
6 23725 23600 47 60 29.88 9.69 0.88 3.41
7 24289 24111 48 64 30.81 10.65 0.89 3.53
8 24795 24477 48 66 29.45 10.70 0.88 3.70
9 27205 26456 48 66 27.43 11.21 0.89 3.70
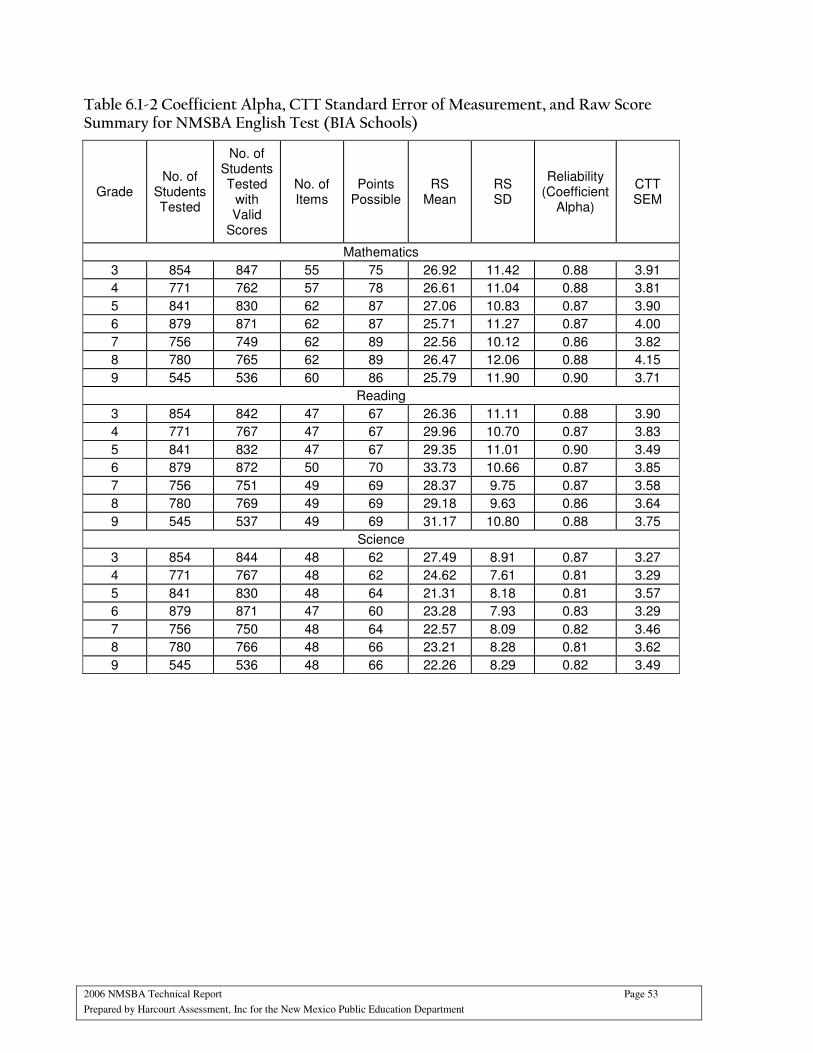
2006 NMSBA Technical Report Page 53
Prepared by Harcourt Assessment, Inc for the New Mexico Public Education Department
Table 6.1-2 Coefficient Alpha, CTT Standard Error of Measurement, and Raw Score Summary for NMSBA English Test (BIA Schools)
Grade No. of
Students Tested
No. of Students Tested
with Valid
Scores
No. of Items
Points Possible
RS Mean
RS SD
Reliability (Coefficient
Alpha)
CTT SEM
Mathematics
3 854 847 55 75 26.92 11.42 0.88 3.91
4 771 762 57 78 26.61 11.04 0.88 3.81
5 841 830 62 87 27.06 10.83 0.87 3.90
6 879 871 62 87 25.71 11.27 0.87 4.00
7 756 749 62 89 22.56 10.12 0.86 3.82
8 780 765 62 89 26.47 12.06 0.88 4.15
9 545 536 60 86 25.79 11.90 0.90 3.71
Reading
3 854 842 47 67 26.36 11.11 0.88 3.90
4 771 767 47 67 29.96 10.70 0.87 3.83
5 841 832 47 67 29.35 11.01 0.90 3.49
6 879 872 50 70 33.73 10.66 0.87 3.85
7 756 751 49 69 28.37 9.75 0.87 3.58
8 780 769 49 69 29.18 9.63 0.86 3.64
9 545 537 49 69 31.17 10.80 0.88 3.75
Science
3 854 844 48 62 27.49 8.91 0.87 3.27
4 771 767 48 62 24.62 7.61 0.81 3.29
5 841 830 48 64 21.31 8.18 0.81 3.57
6 879 871 47 60 23.28 7.93 0.83 3.29
7 756 750 48 64 22.57 8.09 0.82 3.46
8 780 766 48 66 23.21 8.28 0.81 3.62
9 545 536 48 66 22.26 8.29 0.82 3.49
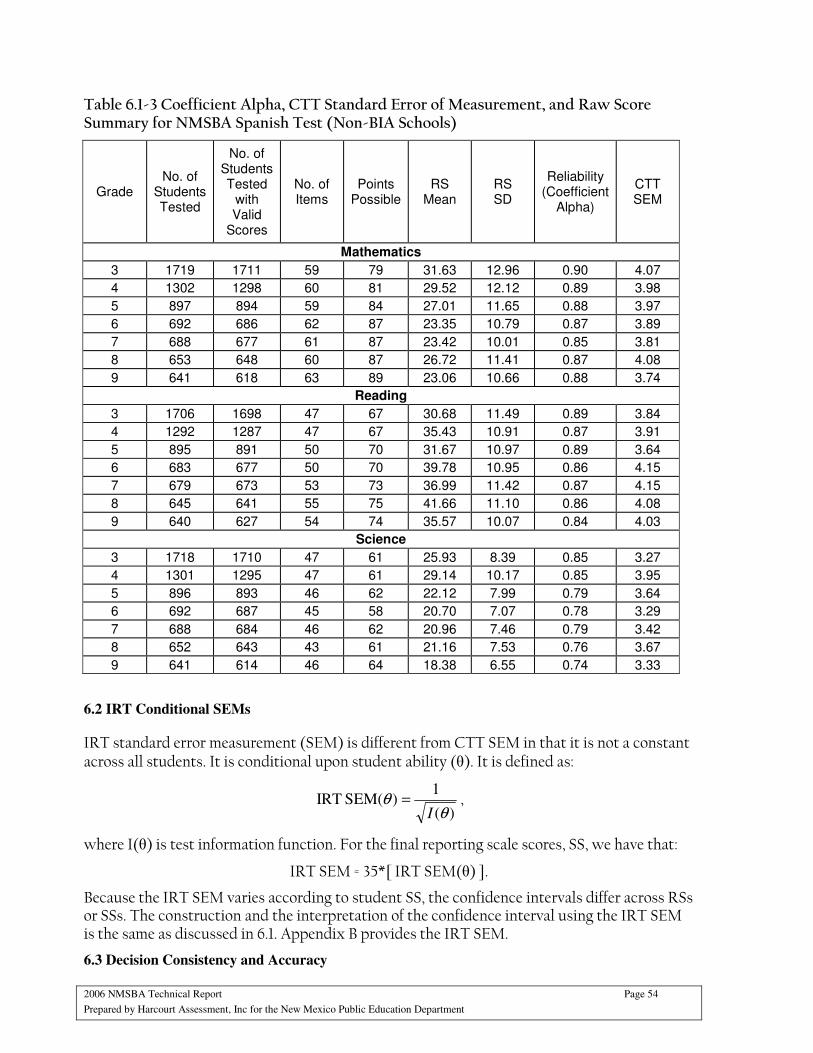
2006 NMSBA Technical Report Page 54
Prepared by Harcourt Assessment, Inc for the New Mexico Public Education Department
Table 6.1-3 Coefficient Alpha, CTT Standard Error of Measurement, and Raw Score Summary for NMSBA Spanish Test (Non-BIA Schools)
Grade No. of
Students Tested
No. of Students Tested
with Valid
Scores
No. of Items
Points Possible
RS Mean
RS SD
Reliability (Coefficient
Alpha)
CTT SEM
Mathematics
3 1719 1711 59 79 31.63 12.96 0.90 4.07
4 1302 1298 60 81 29.52 12.12 0.89 3.98
5 897 894 59 84 27.01 11.65 0.88 3.97
6 692 686 62 87 23.35 10.79 0.87 3.89
7 688 677 61 87 23.42 10.01 0.85 3.81
8 653 648 60 87 26.72 11.41 0.87 4.08
9 641 618 63 89 23.06 10.66 0.88 3.74
Reading
3 1706 1698 47 67 30.68 11.49 0.89 3.84
4 1292 1287 47 67 35.43 10.91 0.87 3.91
5 895 891 50 70 31.67 10.97 0.89 3.64
6 683 677 50 70 39.78 10.95 0.86 4.15
7 679 673 53 73 36.99 11.42 0.87 4.15
8 645 641 55 75 41.66 11.10 0.86 4.08
9 640 627 54 74 35.57 10.07 0.84 4.03
Science
3 1718 1710 47 61 25.93 8.39 0.85 3.27
4 1301 1295 47 61 29.14 10.17 0.85 3.95
5 896 893 46 62 22.12 7.99 0.79 3.64
6 692 687 45 58 20.70 7.07 0.78 3.29
7 688 684 46 62 20.96 7.46 0.79 3.42
8 652 643 43 61 21.16 7.53 0.76 3.67
9 641 614 46 64 18.38 6.55 0.74 3.33
6.2 IRT Conditional SEMs
IRT standard error measurement (SEM) is different from CTT SEM in that it is not a constant across all students. It is conditional upon student ability (θ). It is defined as:
)(
1)SEM( IRT
θθ
I= ,
where I(θ) is test information function. For the final reporting scale scores, SS, we have that:
IRT SEM = 35*[ IRT SEM(θ) ].
Because the IRT SEM varies according to student SS, the confidence intervals differ across RSs or SSs. The construction and the interpretation of the confidence interval using the IRT SEM is the same as discussed in 6.1. Appendix B provides the IRT SEM.
6.3 Decision Consistency and Accuracy
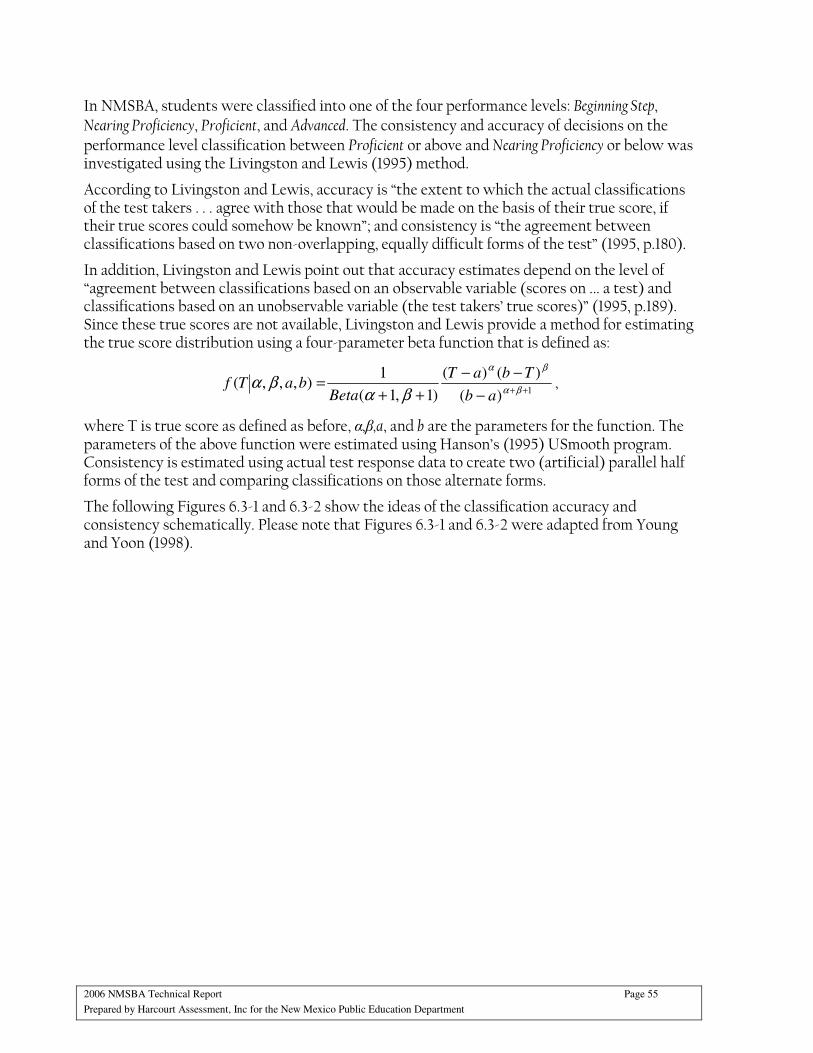
2006 NMSBA Technical Report Page 55
Prepared by Harcourt Assessment, Inc for the New Mexico Public Education Department
In NMSBA, students were classified into one of the four performance levels: Beginning Step, Nearing Proficiency, Proficient, and Advanced. The consistency and accuracy of decisions on the performance level classification between Proficient or above and Nearing Proficiency or below was investigated using the Livingston and Lewis (1995) method.
According to Livingston and Lewis, accuracy is “the extent to which the actual classifications of the test takers . . . agree with those that would be made on the basis of their true score, if their true scores could somehow be known”; and consistency is “the agreement between classifications based on two non-overlapping, equally difficult forms of the test” (1995, p.180).
In addition, Livingston and Lewis point out that accuracy estimates depend on the level of “agreement between classifications based on an observable variable (scores on ... a test) and classifications based on an unobservable variable (the test takers’ true scores)” (1995, p.189). Since these true scores are not available, Livingston and Lewis provide a method for estimating the true score distribution using a four-parameter beta function that is defined as:
1)(
)()(
)1,1(
1),,,(
++−
−−
++=
βα
βα
βαβα
ab
TbaT
BetabaTf ,
where T is true score as defined as before, α,β,a, and b are the parameters for the function. The parameters of the above function were estimated using Hanson’s (1995) USmooth program. Consistency is estimated using actual test response data to create two (artificial) parallel half forms of the test and comparing classifications on those alternate forms.
The following Figures 6.3-1 and 6.3-2 show the ideas of the classification accuracy and consistency schematically. Please note that Figures 6.3-1 and 6.3-2 were adapted from Young and Yoon (1998).
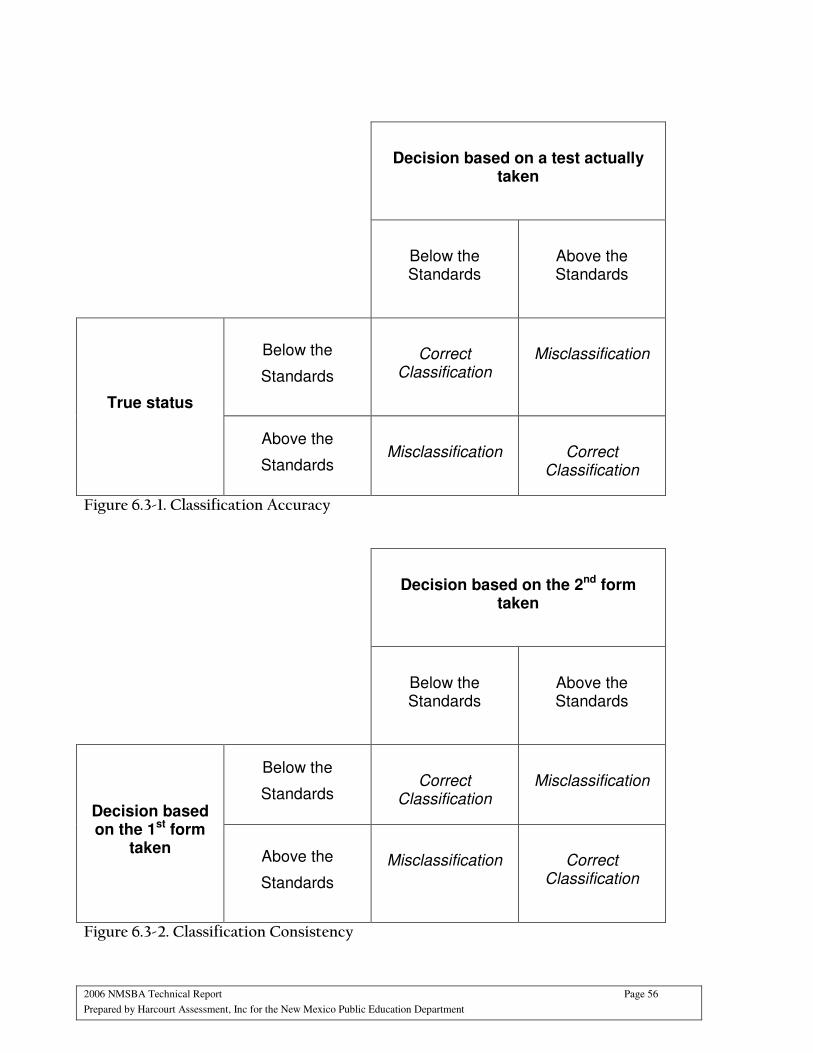
2006 NMSBA Technical Report Page 56
Prepared by Harcourt Assessment, Inc for the New Mexico Public Education Department
Decision based on a test actually taken
Below the Standards
Above the Standards
Below the
Standards
Correct
Classification
Misclassification
True status
Above the
Standards
Misclassification
Correct
Classification
Figure 6.3-1. Classification Accuracy
Decision based on the 2nd form taken
Below the Standards
Above the Standards
Below the
Standards
Correct
Classification
Misclassification
Decision based on the 1st form
taken Above the
Standards
Misclassification
Correct
Classification
Figure 6.3-2. Classification Consistency
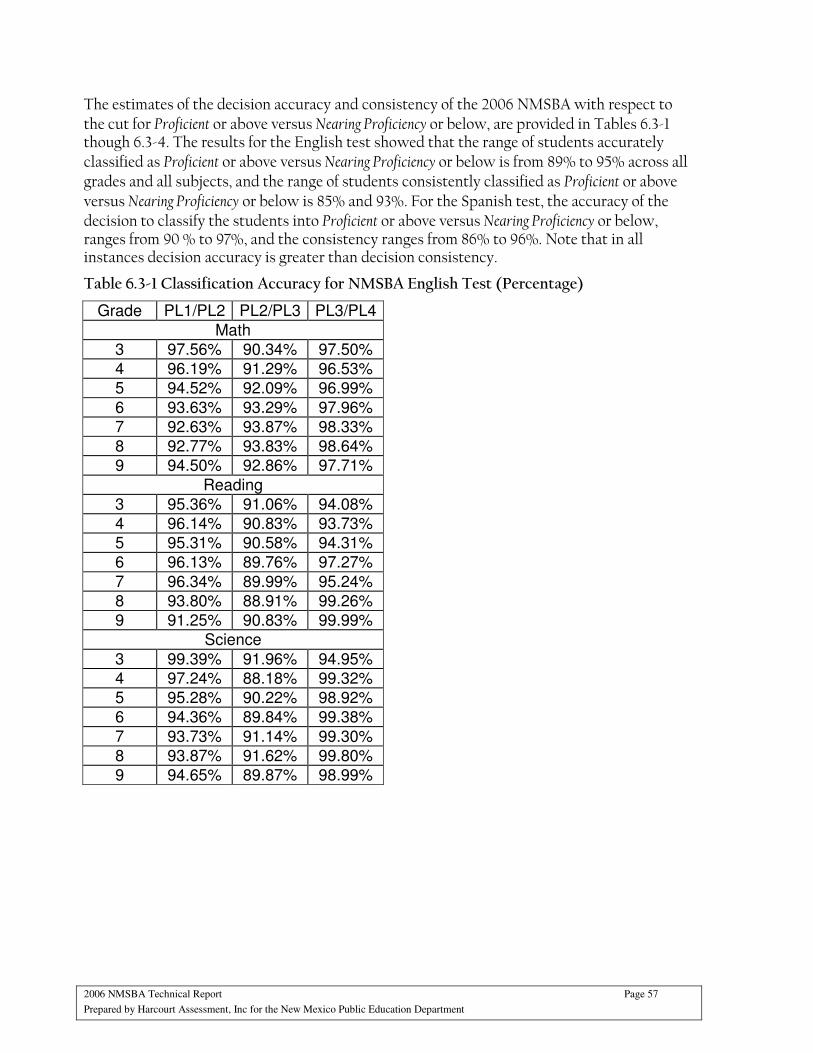
2006 NMSBA Technical Report Page 57
Prepared by Harcourt Assessment, Inc for the New Mexico Public Education Department
The estimates of the decision accuracy and consistency of the 2006 NMSBA with respect to the cut for Proficient or above versus Nearing Proficiency or below, are provided in Tables 6.3-1 though 6.3-4. The results for the English test showed that the range of students accurately classified as Proficient or above versus Nearing Proficiency or below is from 89% to 95% across all grades and all subjects, and the range of students consistently classified as Proficient or above versus Nearing Proficiency or below is 85% and 93%. For the Spanish test, the accuracy of the decision to classify the students into Proficient or above versus Nearing Proficiency or below, ranges from 90 % to 97%, and the consistency ranges from 86% to 96%. Note that in all instances decision accuracy is greater than decision consistency.
Table 6.3-1 Classification Accuracy for NMSBA English Test (Percentage)
Grade PL1/PL2 PL2/PL3 PL3/PL4
Math
3 97.56% 90.34% 97.50%
4 96.19% 91.29% 96.53%
5 94.52% 92.09% 96.99%
6 93.63% 93.29% 97.96%
7 92.63% 93.87% 98.33%
8 92.77% 93.83% 98.64%
9 94.50% 92.86% 97.71%
Reading
3 95.36% 91.06% 94.08%
4 96.14% 90.83% 93.73%
5 95.31% 90.58% 94.31%
6 96.13% 89.76% 97.27%
7 96.34% 89.99% 95.24%
8 93.80% 88.91% 99.26%
9 91.25% 90.83% 99.99%
Science
3 99.39% 91.96% 94.95%
4 97.24% 88.18% 99.32%
5 95.28% 90.22% 98.92%
6 94.36% 89.84% 99.38%
7 93.73% 91.14% 99.30%
8 93.87% 91.62% 99.80%
9 94.65% 89.87% 98.99%
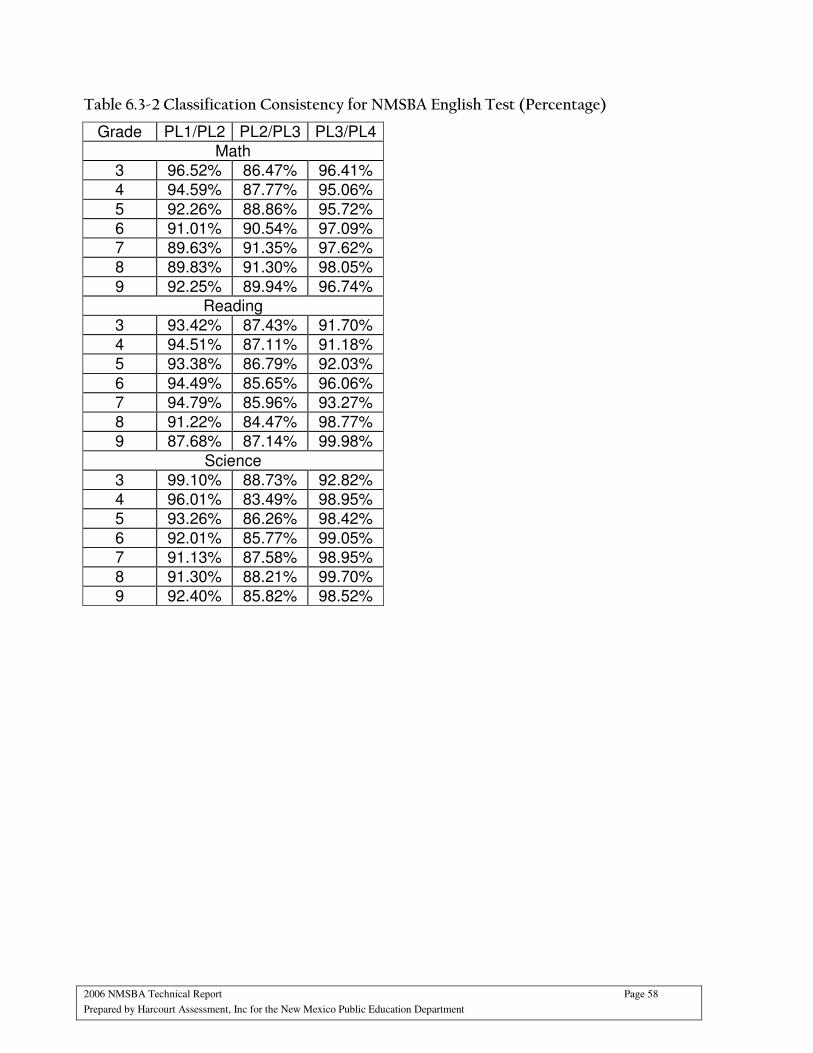
2006 NMSBA Technical Report Page 58
Prepared by Harcourt Assessment, Inc for the New Mexico Public Education Department
Table 6.3-2 Classification Consistency for NMSBA English Test (Percentage)
Grade PL1/PL2 PL2/PL3 PL3/PL4
Math
3 96.52% 86.47% 96.41%
4 94.59% 87.77% 95.06%
5 92.26% 88.86% 95.72%
6 91.01% 90.54% 97.09%
7 89.63% 91.35% 97.62%
8 89.83% 91.30% 98.05%
9 92.25% 89.94% 96.74%
Reading
3 93.42% 87.43% 91.70%
4 94.51% 87.11% 91.18%
5 93.38% 86.79% 92.03%
6 94.49% 85.65% 96.06%
7 94.79% 85.96% 93.27%
8 91.22% 84.47% 98.77%
9 87.68% 87.14% 99.98%
Science
3 99.10% 88.73% 92.82%
4 96.01% 83.49% 98.95%
5 93.26% 86.26% 98.42%
6 92.01% 85.77% 99.05%
7 91.13% 87.58% 98.95%
8 91.30% 88.21% 99.70%
9 92.40% 85.82% 98.52%

2006 NMSBA Technical Report Page 59
Prepared by Harcourt Assessment, Inc for the New Mexico Public Education Department
Table 6.3-3 Classification Accuracy for NMSBA Spanish Test (Percentage)
Grade PL1/PL2 PL2/PL3 PL3/PL4
Math
3 97.47% 90.10% 95.48%
4 93.55% 91.15% 98.31%
5 91.69% 92.07% 98.79%
6 91.12% 93.38% 99.23%
7 89.57% 94.43% 99.77%
8 90.87% 93.86% 99.63%
9 89.55% 93.19% 98.93%
Reading
3 94.58% 91.39% 97.71%
4 96.82% 88.63% 94.86%
5 93.45% 90.32% 98.88%
6 95.39% 88.09% 97.24%
7 99.25% 90.66% 91.56%
8 97.93% 88.65% 97.55%
9 97.09% 87.96% 99.55%
Science
3 92.27% 90.98% 99.64%
4 94.58% 88.10% 95.85%
5 94.22% 89.05% 99.66%
6 92.36% 87.67% 99.76%
7 88.25% 91.47% 99.53%
8 89.49% 91.54% 99.02%
9 87.58% 92.30% 99.99%
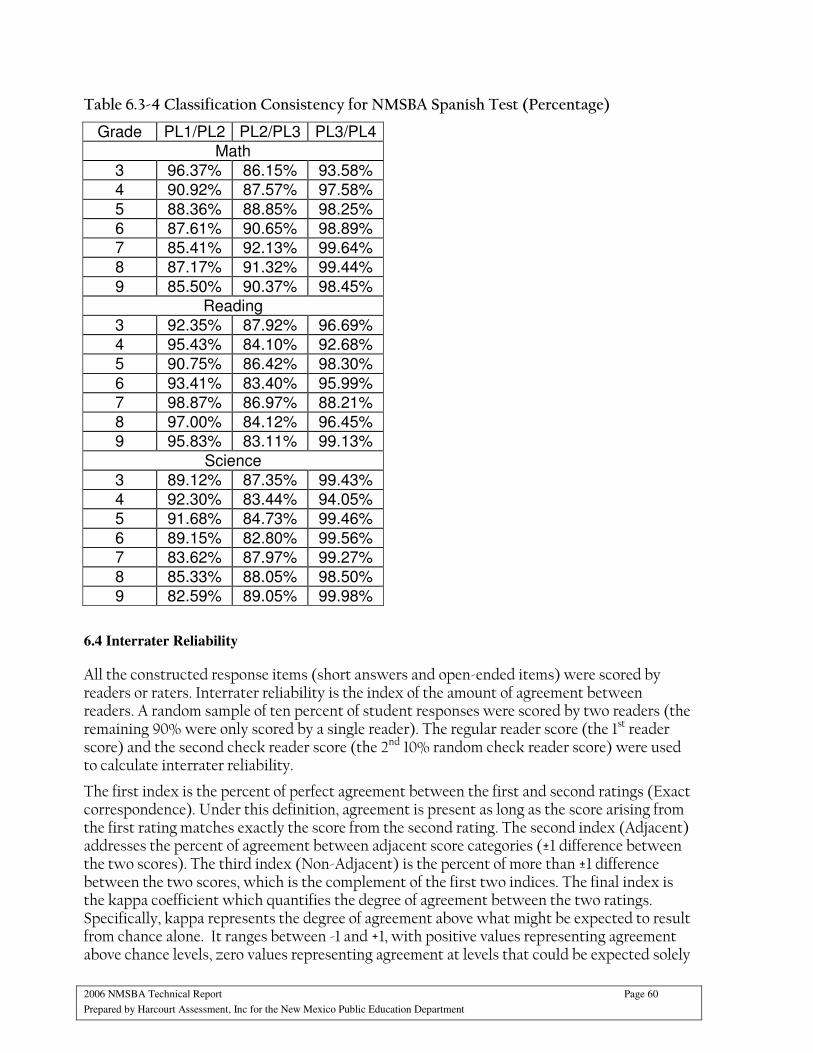
2006 NMSBA Technical Report Page 60
Prepared by Harcourt Assessment, Inc for the New Mexico Public Education Department
Table 6.3-4 Classification Consistency for NMSBA Spanish Test (Percentage)
Grade PL1/PL2 PL2/PL3 PL3/PL4
Math
3 96.37% 86.15% 93.58%
4 90.92% 87.57% 97.58%
5 88.36% 88.85% 98.25%
6 87.61% 90.65% 98.89%
7 85.41% 92.13% 99.64%
8 87.17% 91.32% 99.44%
9 85.50% 90.37% 98.45%
Reading
3 92.35% 87.92% 96.69%
4 95.43% 84.10% 92.68%
5 90.75% 86.42% 98.30%
6 93.41% 83.40% 95.99%
7 98.87% 86.97% 88.21%
8 97.00% 84.12% 96.45%
9 95.83% 83.11% 99.13%
Science
3 89.12% 87.35% 99.43%
4 92.30% 83.44% 94.05%
5 91.68% 84.73% 99.46%
6 89.15% 82.80% 99.56%
7 83.62% 87.97% 99.27%
8 85.33% 88.05% 98.50%
9 82.59% 89.05% 99.98%
6.4 Interrater Reliability
All the constructed response items (short answers and open-ended items) were scored by readers or raters. Interrater reliability is the index of the amount of agreement between readers. A random sample of ten percent of student responses were scored by two readers (the remaining 90% were only scored by a single reader). The regular reader score (the 1st reader score) and the second check reader score (the 2nd 10% random check reader score) were used to calculate interrater reliability.
The first index is the percent of perfect agreement between the first and second ratings (Exact correspondence). Under this definition, agreement is present as long as the score arising from the first rating matches exactly the score from the second rating. The second index (Adjacent) addresses the percent of agreement between adjacent score categories (±1 difference between the two scores). The third index (Non-Adjacent) is the percent of more than ±1 difference between the two scores, which is the complement of the first two indices. The final index is the kappa coefficient which quantifies the degree of agreement between the two ratings. Specifically, kappa represents the degree of agreement above what might be expected to result from chance alone. It ranges between -1 and +1, with positive values representing agreement above chance levels, zero values representing agreement at levels that could be expected solely
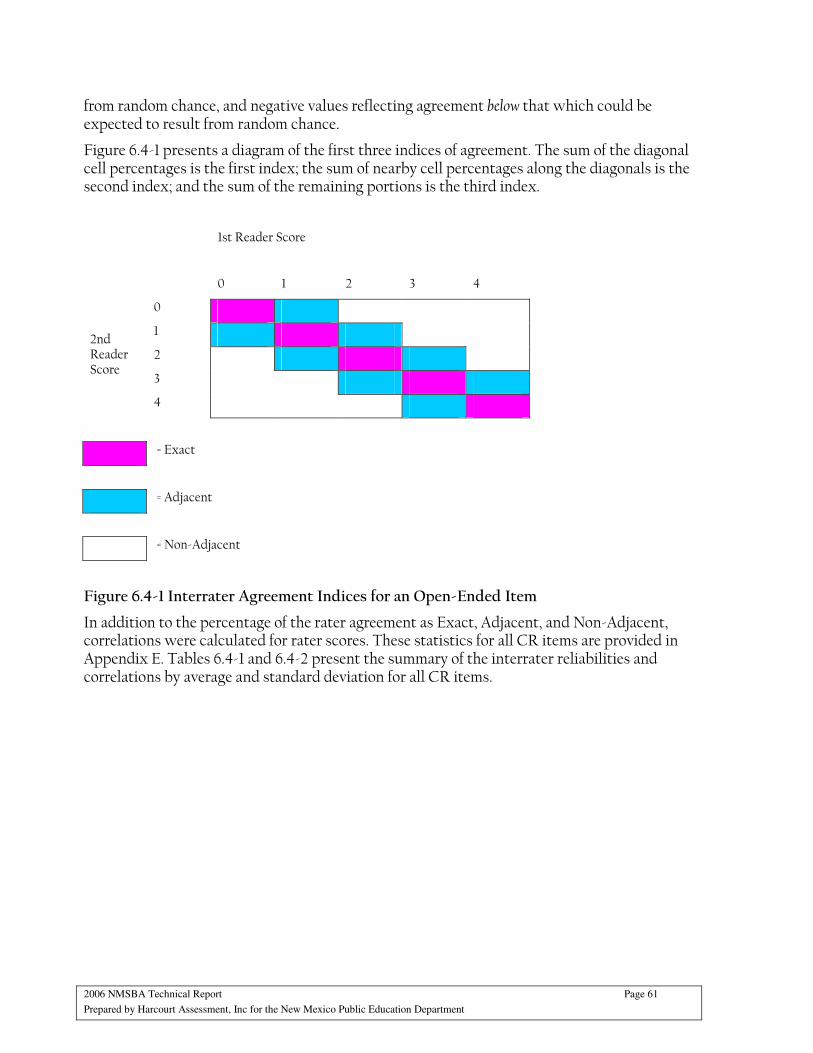
2006 NMSBA Technical Report Page 61
Prepared by Harcourt Assessment, Inc for the New Mexico Public Education Department
from random chance, and negative values reflecting agreement below that which could be expected to result from random chance.
Figure 6.4-1 presents a diagram of the first three indices of agreement. The sum of the diagonal cell percentages is the first index; the sum of nearby cell percentages along the diagonals is the second index; and the sum of the remaining portions is the third index.
1st Reader Score
0 1 2 3 4
0
1
2
3
2nd Reader Score
4
= Exact
= Adjacent
= Non-Adjacent
Figure 6.4-1 Interrater Agreement Indices for an Open-Ended Item
In addition to the percentage of the rater agreement as Exact, Adjacent, and Non-Adjacent, correlations were calculated for rater scores. These statistics for all CR items are provided in Appendix E. Tables 6.4-1 and 6.4-2 present the summary of the interrater reliabilities and correlations by average and standard deviation for all CR items.
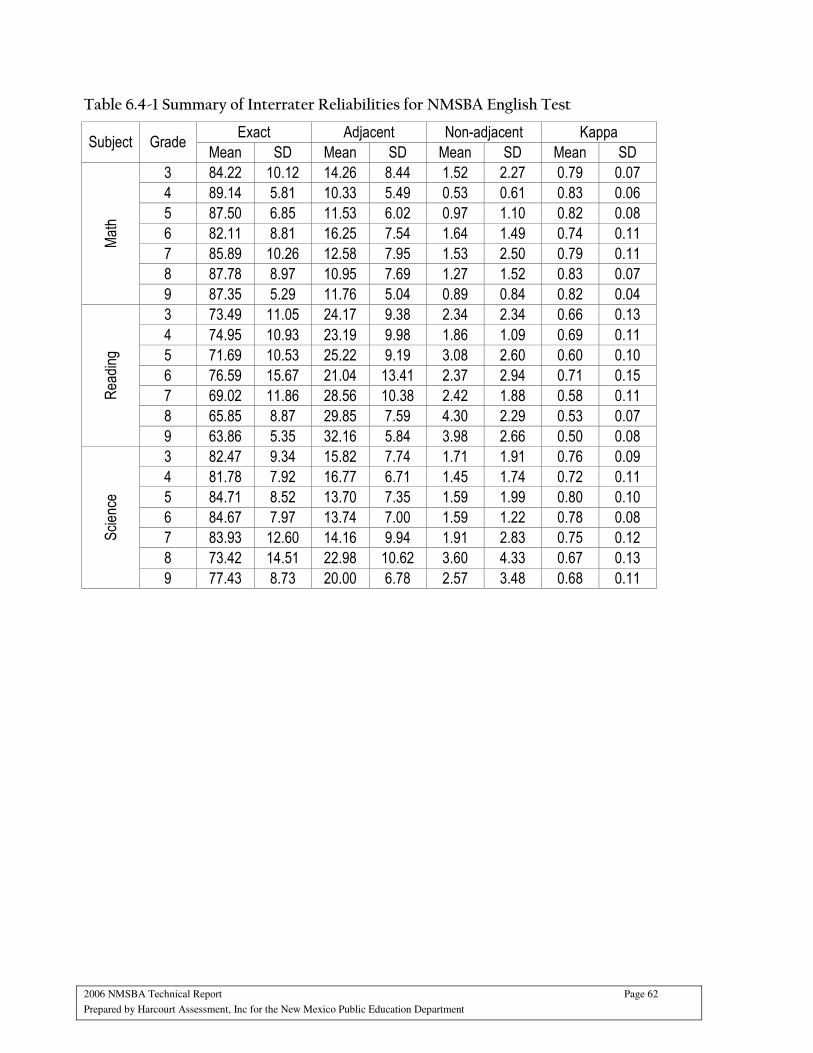
2006 NMSBA Technical Report Page 62
Prepared by Harcourt Assessment, Inc for the New Mexico Public Education Department
Table 6.4-1 Summary of Interrater Reliabilities for NMSBA English Test
Exact Adjacent Non-adjacent Kappa Subject Grade
Mean SD Mean SD Mean SD Mean SD
3 84.22 10.12 14.26 8.44 1.52 2.27 0.79 0.07
4 89.14 5.81 10.33 5.49 0.53 0.61 0.83 0.06
5 87.50 6.85 11.53 6.02 0.97 1.10 0.82 0.08
6 82.11 8.81 16.25 7.54 1.64 1.49 0.74 0.11
7 85.89 10.26 12.58 7.95 1.53 2.50 0.79 0.11
8 87.78 8.97 10.95 7.69 1.27 1.52 0.83 0.07
Math
9 87.35 5.29 11.76 5.04 0.89 0.84 0.82 0.04
3 73.49 11.05 24.17 9.38 2.34 2.34 0.66 0.13
4 74.95 10.93 23.19 9.98 1.86 1.09 0.69 0.11
5 71.69 10.53 25.22 9.19 3.08 2.60 0.60 0.10
6 76.59 15.67 21.04 13.41 2.37 2.94 0.71 0.15
7 69.02 11.86 28.56 10.38 2.42 1.88 0.58 0.11
8 65.85 8.87 29.85 7.59 4.30 2.29 0.53 0.07
Rea
ding
9 63.86 5.35 32.16 5.84 3.98 2.66 0.50 0.08
3 82.47 9.34 15.82 7.74 1.71 1.91 0.76 0.09
4 81.78 7.92 16.77 6.71 1.45 1.74 0.72 0.11
5 84.71 8.52 13.70 7.35 1.59 1.99 0.80 0.10
6 84.67 7.97 13.74 7.00 1.59 1.22 0.78 0.08
7 83.93 12.60 14.16 9.94 1.91 2.83 0.75 0.12
8 73.42 14.51 22.98 10.62 3.60 4.33 0.67 0.13
Scien
ce
9 77.43 8.73 20.00 6.78 2.57 3.48 0.68 0.11
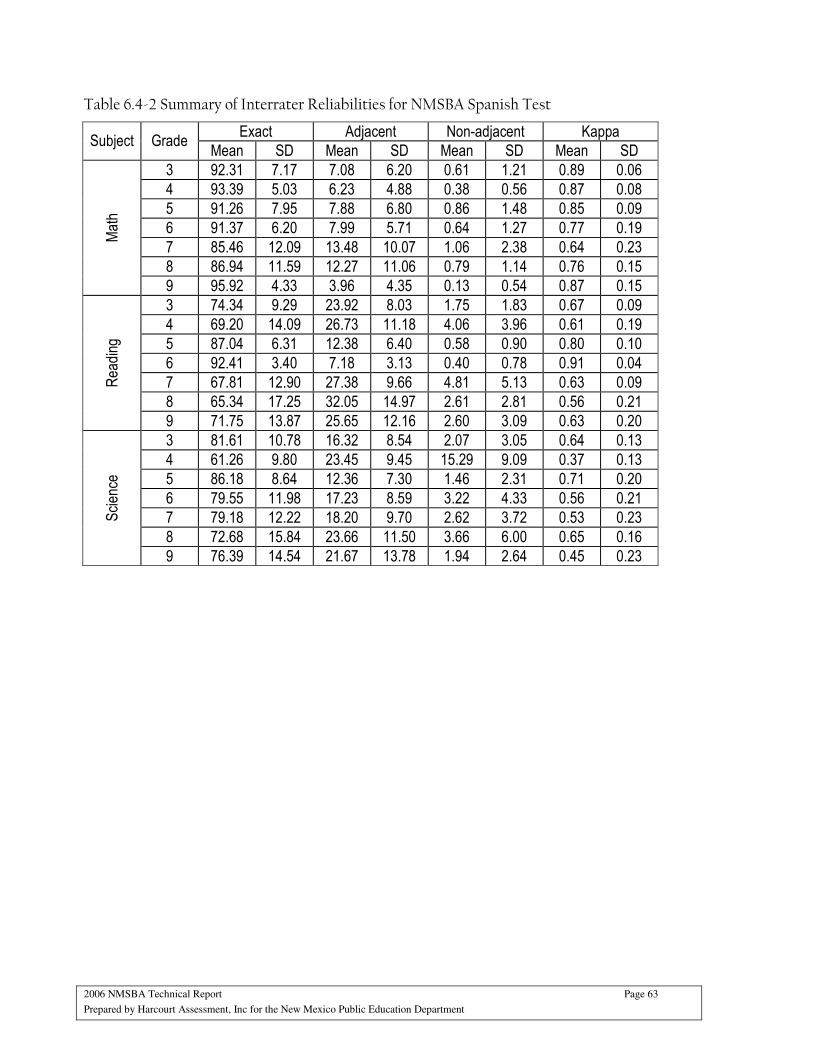
2006 NMSBA Technical Report Page 63
Prepared by Harcourt Assessment, Inc for the New Mexico Public Education Department
Table 6.4-2 Summary of Interrater Reliabilities for NMSBA Spanish Test
Exact Adjacent Non-adjacent Kappa Subject Grade
Mean SD Mean SD Mean SD Mean SD
3 92.31 7.17 7.08 6.20 0.61 1.21 0.89 0.06
4 93.39 5.03 6.23 4.88 0.38 0.56 0.87 0.08
5 91.26 7.95 7.88 6.80 0.86 1.48 0.85 0.09
6 91.37 6.20 7.99 5.71 0.64 1.27 0.77 0.19
7 85.46 12.09 13.48 10.07 1.06 2.38 0.64 0.23
8 86.94 11.59 12.27 11.06 0.79 1.14 0.76 0.15
Math
9 95.92 4.33 3.96 4.35 0.13 0.54 0.87 0.15
3 74.34 9.29 23.92 8.03 1.75 1.83 0.67 0.09
4 69.20 14.09 26.73 11.18 4.06 3.96 0.61 0.19
5 87.04 6.31 12.38 6.40 0.58 0.90 0.80 0.10
6 92.41 3.40 7.18 3.13 0.40 0.78 0.91 0.04
7 67.81 12.90 27.38 9.66 4.81 5.13 0.63 0.09
8 65.34 17.25 32.05 14.97 2.61 2.81 0.56 0.21
Rea
ding
9 71.75 13.87 25.65 12.16 2.60 3.09 0.63 0.20
3 81.61 10.78 16.32 8.54 2.07 3.05 0.64 0.13
4 61.26 9.80 23.45 9.45 15.29 9.09 0.37 0.13
5 86.18 8.64 12.36 7.30 1.46 2.31 0.71 0.20
6 79.55 11.98 17.23 8.59 3.22 4.33 0.56 0.21
7 79.18 12.22 18.20 9.70 2.62 3.72 0.53 0.23
8 72.68 15.84 23.66 11.50 3.66 6.00 0.65 0.16
Scien
ce
9 76.39 14.54 21.67 13.78 1.94 2.64 0.45 0.23
2006 NMSBA Technical Report Page 64
Prepared by Harcourt Assessment, Inc for the New Mexico Public Education Department
7. Validity
The validity of a test is concerned with how well the test measures what it is intended to measure. It is considered the most fundamental aspect of test development and evaluation (American Educational Research Association, 1999). In a sense, the test validity is an evolving process of validating the traits measured by a given test. There are numerous aspects of a test, but currently three types of validities are commonly assessed: content validity, criterion-related validity, and construct validity. Content validity does not involve any statistical computation. A test is considered to have content validity if it adequately and representatively covers relevant aspects of the construct being measured. A test is considered to have criterion-related validity if the test scores are shown to be related with the specified external criterion, such as performance or achievement on some other measure known to predict the criterion (criterion-related validity is also called predictive validity). However, if the test scores are compared to another measure used as evidence of the targeted attribute, then criterion-related validity is called concurrent validity. A test is considered to have construct validity when the trait presumed to be measured is reflected in the test performance. Construct validity evidence can come from diverse validation procedures and methods such as item analysis, correlation studies, factor analysis, or expert review. The current technical report focuses on the confirmation of constructs (traits) within NMSBA (that is, construct validity), utilizing dimensionality and correlation analyses.
7.1 Internal Structure Evidence
Dimensionality Analyses
One of the basic assumptions for most tests is that the test measures a single construct. Unidimensionality was assumed during the construction, calibration and equating of the NMSBA as discussed previously. The unidimensionality of the NMSBA tests was investigated using exploratory principal component analysis (EPCA) with polychoric correlation coefficients. Inter-item Pearson correlation coefficients are not the best basis for this analysis because of the ordered categorical nature of test item scores. This is especially true of dichotomous items. NMSBA is comprised of 70% dichotomous (multiple choice items) and 30% polytomous (SA and OE) items. However, polychoric correlation coefficients are computationally difficult to derive and few software packages have that capability; when they are not available Pearson correlation coefficients provide a reasonable approximation. SAS Proc Freq was used to produce polychoric correlations which were then read by Proc Princomp to run the EPCA (SAS Institute, 2003).
EPCA has two major aims: to uncover the one (or few) factors that explain the bulk of the variance underlying the input variables and to check the dimensionality of the input variables by comparing the relative strength of the dominant underlying factors. This analysis is intended primarily as a dimensionality check.
EPCA is a mathematical procedure that transforms a number of correlated variables into (usually) a smaller number of uncorrelated variables that are called principal components. Each component is a linear combination of the input variables. The first principal component explains as much variability as possible in the data, and each subsequent component explains as much variability as possible within the remaining unexplained variability in the data. Eigenvalues estimated from the EPCA analysis, without any rotation, were used for the dimensionality check. The eigenvalue is a number related to the amount of variation explained by each component. Conceptually it is a measure of the (relative) strength of a principal
2006 NMSBA Technical Report Page 65
Prepared by Harcourt Assessment, Inc for the New Mexico Public Education Department
component. Eigenvalues are also known as latent roots. Table 7.1-1 shows the results for the first and the second principle components.
As a rule of thumb, unidimensionality is assumed when the ratio of the first eigenvalue to the second eigenvalue is at least 3 (Alabama ARMT Technical Manual, 2004). All but the Spanish Science Grade 4 test met this criterion. The size of the eigenvalue ratio in Spanish Science Grade 4 was 1.94.
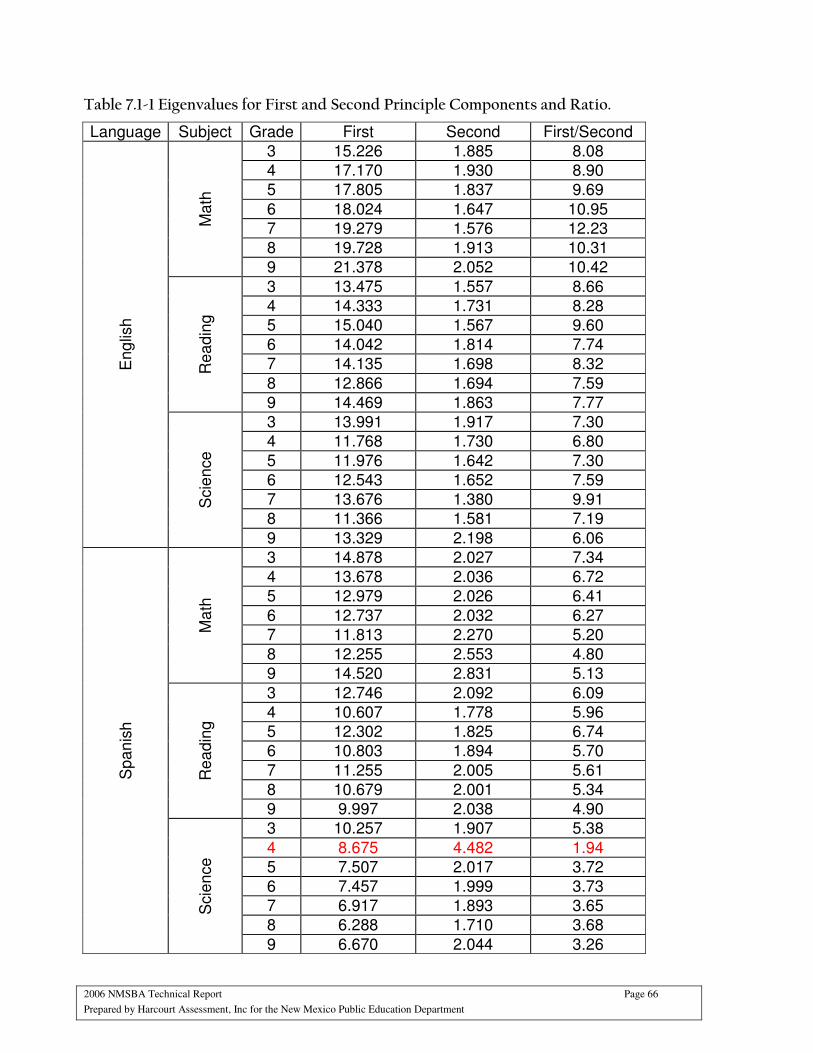
2006 NMSBA Technical Report Page 66
Prepared by Harcourt Assessment, Inc for the New Mexico Public Education Department
Table 7.1-1 Eigenvalues for First and Second Principle Components and Ratio.
Language Subject Grade First Second First/Second
3 15.226 1.885 8.08
4 17.170 1.930 8.90
5 17.805 1.837 9.69
6 18.024 1.647 10.95
7 19.279 1.576 12.23
8 19.728 1.913 10.31
Ma
th
9 21.378 2.052 10.42
3 13.475 1.557 8.66
4 14.333 1.731 8.28
5 15.040 1.567 9.60
6 14.042 1.814 7.74
7 14.135 1.698 8.32
8 12.866 1.694 7.59
Re
ad
ing
9 14.469 1.863 7.77
3 13.991 1.917 7.30
4 11.768 1.730 6.80
5 11.976 1.642 7.30
6 12.543 1.652 7.59
7 13.676 1.380 9.91
8 11.366 1.581 7.19
En
glis
h
Scie
nce
9 13.329 2.198 6.06
3 14.878 2.027 7.34
4 13.678 2.036 6.72
5 12.979 2.026 6.41
6 12.737 2.032 6.27
7 11.813 2.270 5.20
8 12.255 2.553 4.80
Ma
th
9 14.520 2.831 5.13
3 12.746 2.092 6.09
4 10.607 1.778 5.96
5 12.302 1.825 6.74
6 10.803 1.894 5.70
7 11.255 2.005 5.61
8 10.679 2.001 5.34
Re
ad
ing
9 9.997 2.038 4.90
3 10.257 1.907 5.38
4 8.675 4.482 1.94
5 7.507 2.017 3.72
6 7.457 1.999 3.73
7 6.917 1.893 3.65
8 6.288 1.710 3.68
Sp
an
ish
Scie
nce
9 6.670 2.044 3.26
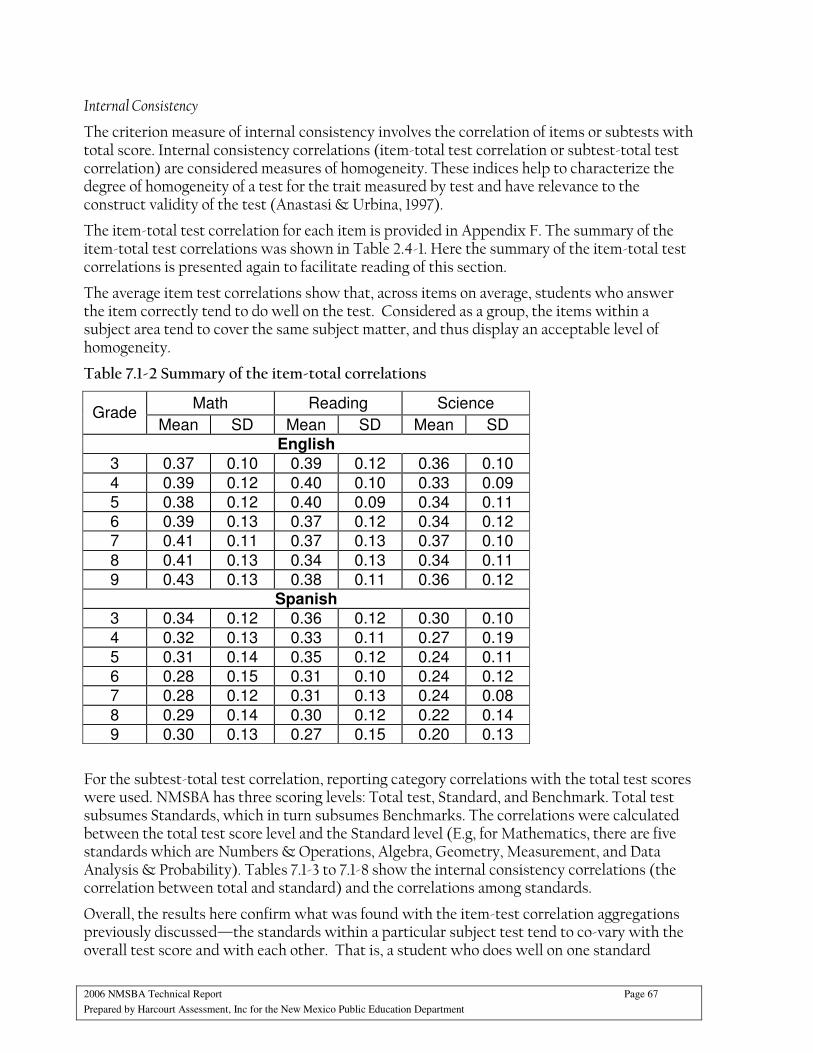
2006 NMSBA Technical Report Page 67
Prepared by Harcourt Assessment, Inc for the New Mexico Public Education Department
Internal Consistency
The criterion measure of internal consistency involves the correlation of items or subtests with total score. Internal consistency correlations (item-total test correlation or subtest-total test correlation) are considered measures of homogeneity. These indices help to characterize the degree of homogeneity of a test for the trait measured by test and have relevance to the construct validity of the test (Anastasi & Urbina, 1997).
The item-total test correlation for each item is provided in Appendix F. The summary of the item-total test correlations was shown in Table 2.4-1. Here the summary of the item-total test correlations is presented again to facilitate reading of this section.
The average item test correlations show that, across items on average, students who answer the item correctly tend to do well on the test. Considered as a group, the items within a subject area tend to cover the same subject matter, and thus display an acceptable level of homogeneity.
Table 7.1-2 Summary of the item-total correlations
Math Reading Science Grade
Mean SD Mean SD Mean SD
English
3 0.37 0.10 0.39 0.12 0.36 0.10
4 0.39 0.12 0.40 0.10 0.33 0.09
5 0.38 0.12 0.40 0.09 0.34 0.11
6 0.39 0.13 0.37 0.12 0.34 0.12
7 0.41 0.11 0.37 0.13 0.37 0.10
8 0.41 0.13 0.34 0.13 0.34 0.11
9 0.43 0.13 0.38 0.11 0.36 0.12
Spanish
3 0.34 0.12 0.36 0.12 0.30 0.10
4 0.32 0.13 0.33 0.11 0.27 0.19
5 0.31 0.14 0.35 0.12 0.24 0.11
6 0.28 0.15 0.31 0.10 0.24 0.12
7 0.28 0.12 0.31 0.13 0.24 0.08
8 0.29 0.14 0.30 0.12 0.22 0.14
9 0.30 0.13 0.27 0.15 0.20 0.13
For the subtest-total test correlation, reporting category correlations with the total test scores were used. NMSBA has three scoring levels: Total test, Standard, and Benchmark. Total test subsumes Standards, which in turn subsumes Benchmarks. The correlations were calculated between the total test score level and the Standard level (E.g, for Mathematics, there are five standards which are Numbers & Operations, Algebra, Geometry, Measurement, and Data Analysis & Probability). Tables 7.1-3 to 7.1-8 show the internal consistency correlations (the correlation between total and standard) and the correlations among standards.
Overall, the results here confirm what was found with the item-test correlation aggregations previously discussed—the standards within a particular subject test tend to co-vary with the overall test score and with each other. That is, a student who does well on one standard
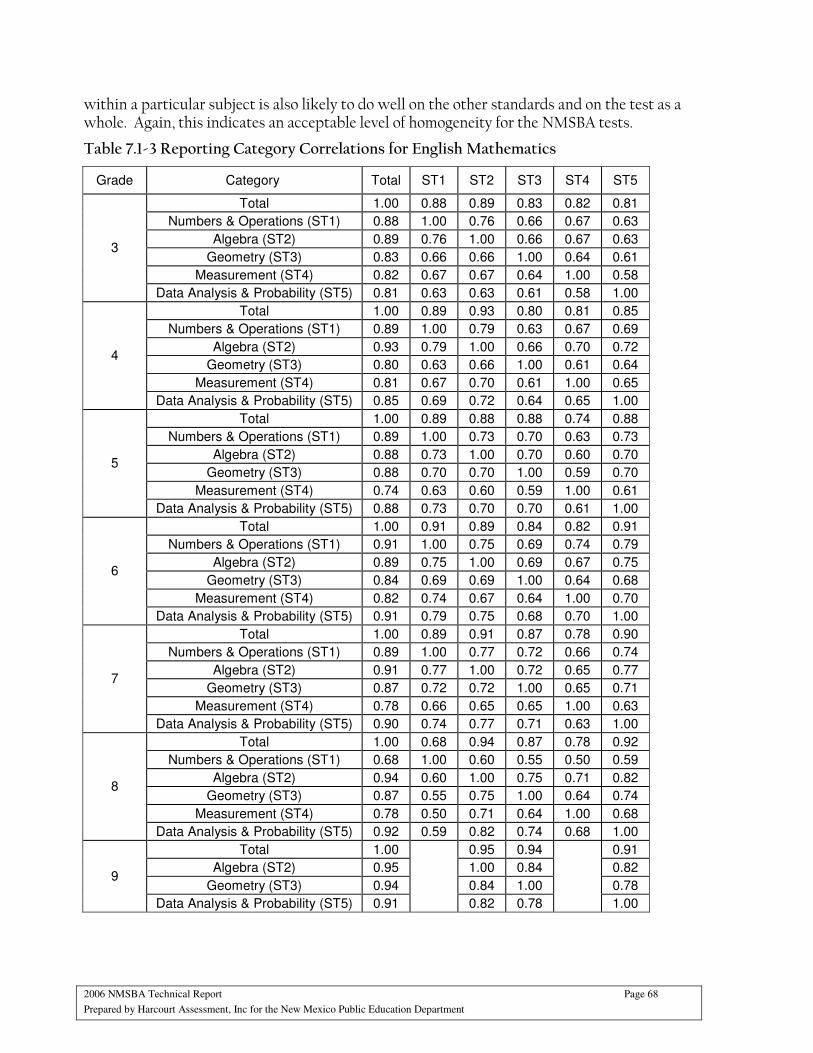
2006 NMSBA Technical Report Page 68
Prepared by Harcourt Assessment, Inc for the New Mexico Public Education Department
within a particular subject is also likely to do well on the other standards and on the test as a whole. Again, this indicates an acceptable level of homogeneity for the NMSBA tests.
Table 7.1-3 Reporting Category Correlations for English Mathematics
Grade Category Total ST1 ST2 ST3 ST4 ST5
Total 1.00 0.88 0.89 0.83 0.82 0.81
Numbers & Operations (ST1) 0.88 1.00 0.76 0.66 0.67 0.63
Algebra (ST2) 0.89 0.76 1.00 0.66 0.67 0.63
Geometry (ST3) 0.83 0.66 0.66 1.00 0.64 0.61
Measurement (ST4) 0.82 0.67 0.67 0.64 1.00 0.58
3
Data Analysis & Probability (ST5) 0.81 0.63 0.63 0.61 0.58 1.00
Total 1.00 0.89 0.93 0.80 0.81 0.85
Numbers & Operations (ST1) 0.89 1.00 0.79 0.63 0.67 0.69
Algebra (ST2) 0.93 0.79 1.00 0.66 0.70 0.72
Geometry (ST3) 0.80 0.63 0.66 1.00 0.61 0.64
Measurement (ST4) 0.81 0.67 0.70 0.61 1.00 0.65
4
Data Analysis & Probability (ST5) 0.85 0.69 0.72 0.64 0.65 1.00
Total 1.00 0.89 0.88 0.88 0.74 0.88
Numbers & Operations (ST1) 0.89 1.00 0.73 0.70 0.63 0.73
Algebra (ST2) 0.88 0.73 1.00 0.70 0.60 0.70
Geometry (ST3) 0.88 0.70 0.70 1.00 0.59 0.70
Measurement (ST4) 0.74 0.63 0.60 0.59 1.00 0.61
5
Data Analysis & Probability (ST5) 0.88 0.73 0.70 0.70 0.61 1.00
Total 1.00 0.91 0.89 0.84 0.82 0.91
Numbers & Operations (ST1) 0.91 1.00 0.75 0.69 0.74 0.79
Algebra (ST2) 0.89 0.75 1.00 0.69 0.67 0.75
Geometry (ST3) 0.84 0.69 0.69 1.00 0.64 0.68
Measurement (ST4) 0.82 0.74 0.67 0.64 1.00 0.70
6
Data Analysis & Probability (ST5) 0.91 0.79 0.75 0.68 0.70 1.00
Total 1.00 0.89 0.91 0.87 0.78 0.90
Numbers & Operations (ST1) 0.89 1.00 0.77 0.72 0.66 0.74
Algebra (ST2) 0.91 0.77 1.00 0.72 0.65 0.77
Geometry (ST3) 0.87 0.72 0.72 1.00 0.65 0.71
Measurement (ST4) 0.78 0.66 0.65 0.65 1.00 0.63
7
Data Analysis & Probability (ST5) 0.90 0.74 0.77 0.71 0.63 1.00
Total 1.00 0.68 0.94 0.87 0.78 0.92
Numbers & Operations (ST1) 0.68 1.00 0.60 0.55 0.50 0.59
Algebra (ST2) 0.94 0.60 1.00 0.75 0.71 0.82
Geometry (ST3) 0.87 0.55 0.75 1.00 0.64 0.74
Measurement (ST4) 0.78 0.50 0.71 0.64 1.00 0.68
8
Data Analysis & Probability (ST5) 0.92 0.59 0.82 0.74 0.68 1.00
Total 1.00 0.95 0.94 0.91
Algebra (ST2) 0.95 1.00 0.84 0.82
Geometry (ST3) 0.94 0.84 1.00 0.78 9
Data Analysis & Probability (ST5) 0.91
0.82 0.78
1.00
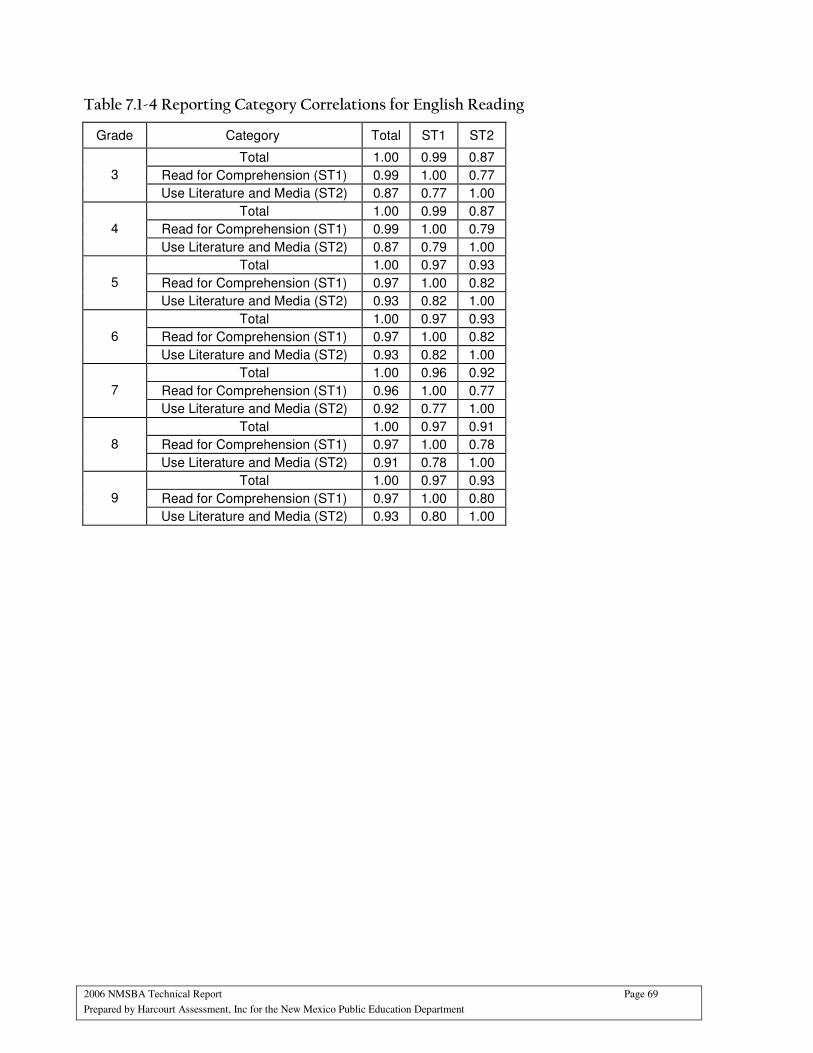
2006 NMSBA Technical Report Page 69
Prepared by Harcourt Assessment, Inc for the New Mexico Public Education Department
Table 7.1-4 Reporting Category Correlations for English Reading
Grade Category Total ST1 ST2
Total 1.00 0.99 0.87
Read for Comprehension (ST1) 0.99 1.00 0.77 3
Use Literature and Media (ST2) 0.87 0.77 1.00
Total 1.00 0.99 0.87
Read for Comprehension (ST1) 0.99 1.00 0.79 4
Use Literature and Media (ST2) 0.87 0.79 1.00
Total 1.00 0.97 0.93
Read for Comprehension (ST1) 0.97 1.00 0.82 5
Use Literature and Media (ST2) 0.93 0.82 1.00
Total 1.00 0.97 0.93
Read for Comprehension (ST1) 0.97 1.00 0.82 6
Use Literature and Media (ST2) 0.93 0.82 1.00
Total 1.00 0.96 0.92
Read for Comprehension (ST1) 0.96 1.00 0.77 7
Use Literature and Media (ST2) 0.92 0.77 1.00
Total 1.00 0.97 0.91
Read for Comprehension (ST1) 0.97 1.00 0.78 8
Use Literature and Media (ST2) 0.91 0.78 1.00
Total 1.00 0.97 0.93
Read for Comprehension (ST1) 0.97 1.00 0.80 9
Use Literature and Media (ST2) 0.93 0.80 1.00
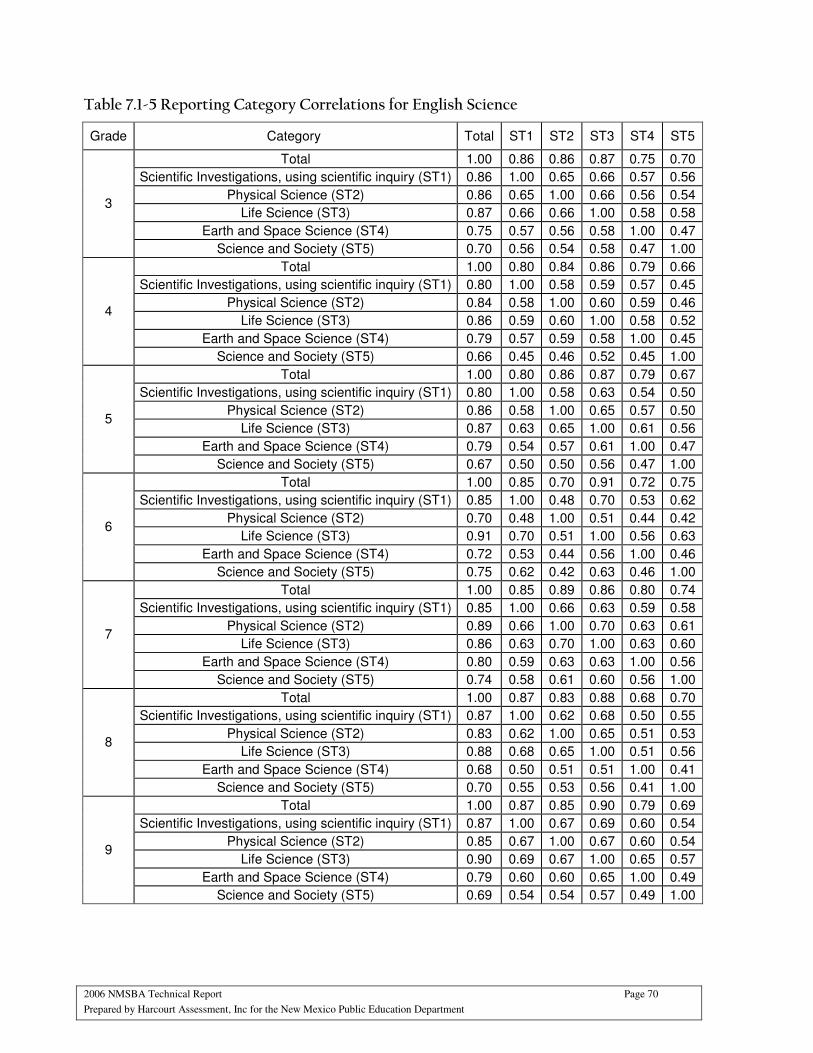
2006 NMSBA Technical Report Page 70
Prepared by Harcourt Assessment, Inc for the New Mexico Public Education Department
Table 7.1-5 Reporting Category Correlations for English Science
Grade Category Total ST1 ST2 ST3 ST4 ST5
Total 1.00 0.86 0.86 0.87 0.75 0.70
Scientific Investigations, using scientific inquiry (ST1) 0.86 1.00 0.65 0.66 0.57 0.56
Physical Science (ST2) 0.86 0.65 1.00 0.66 0.56 0.54
Life Science (ST3) 0.87 0.66 0.66 1.00 0.58 0.58
Earth and Space Science (ST4) 0.75 0.57 0.56 0.58 1.00 0.47
3
Science and Society (ST5) 0.70 0.56 0.54 0.58 0.47 1.00
Total 1.00 0.80 0.84 0.86 0.79 0.66
Scientific Investigations, using scientific inquiry (ST1) 0.80 1.00 0.58 0.59 0.57 0.45
Physical Science (ST2) 0.84 0.58 1.00 0.60 0.59 0.46
Life Science (ST3) 0.86 0.59 0.60 1.00 0.58 0.52
Earth and Space Science (ST4) 0.79 0.57 0.59 0.58 1.00 0.45
4
Science and Society (ST5) 0.66 0.45 0.46 0.52 0.45 1.00
Total 1.00 0.80 0.86 0.87 0.79 0.67
Scientific Investigations, using scientific inquiry (ST1) 0.80 1.00 0.58 0.63 0.54 0.50
Physical Science (ST2) 0.86 0.58 1.00 0.65 0.57 0.50
Life Science (ST3) 0.87 0.63 0.65 1.00 0.61 0.56
Earth and Space Science (ST4) 0.79 0.54 0.57 0.61 1.00 0.47
5
Science and Society (ST5) 0.67 0.50 0.50 0.56 0.47 1.00
Total 1.00 0.85 0.70 0.91 0.72 0.75
Scientific Investigations, using scientific inquiry (ST1) 0.85 1.00 0.48 0.70 0.53 0.62
Physical Science (ST2) 0.70 0.48 1.00 0.51 0.44 0.42
Life Science (ST3) 0.91 0.70 0.51 1.00 0.56 0.63
Earth and Space Science (ST4) 0.72 0.53 0.44 0.56 1.00 0.46
6
Science and Society (ST5) 0.75 0.62 0.42 0.63 0.46 1.00
Total 1.00 0.85 0.89 0.86 0.80 0.74
Scientific Investigations, using scientific inquiry (ST1) 0.85 1.00 0.66 0.63 0.59 0.58
Physical Science (ST2) 0.89 0.66 1.00 0.70 0.63 0.61
Life Science (ST3) 0.86 0.63 0.70 1.00 0.63 0.60
Earth and Space Science (ST4) 0.80 0.59 0.63 0.63 1.00 0.56
7
Science and Society (ST5) 0.74 0.58 0.61 0.60 0.56 1.00
Total 1.00 0.87 0.83 0.88 0.68 0.70
Scientific Investigations, using scientific inquiry (ST1) 0.87 1.00 0.62 0.68 0.50 0.55
Physical Science (ST2) 0.83 0.62 1.00 0.65 0.51 0.53
Life Science (ST3) 0.88 0.68 0.65 1.00 0.51 0.56
Earth and Space Science (ST4) 0.68 0.50 0.51 0.51 1.00 0.41
8
Science and Society (ST5) 0.70 0.55 0.53 0.56 0.41 1.00
Total 1.00 0.87 0.85 0.90 0.79 0.69
Scientific Investigations, using scientific inquiry (ST1) 0.87 1.00 0.67 0.69 0.60 0.54
Physical Science (ST2) 0.85 0.67 1.00 0.67 0.60 0.54
Life Science (ST3) 0.90 0.69 0.67 1.00 0.65 0.57
Earth and Space Science (ST4) 0.79 0.60 0.60 0.65 1.00 0.49
9
Science and Society (ST5) 0.69 0.54 0.54 0.57 0.49 1.00
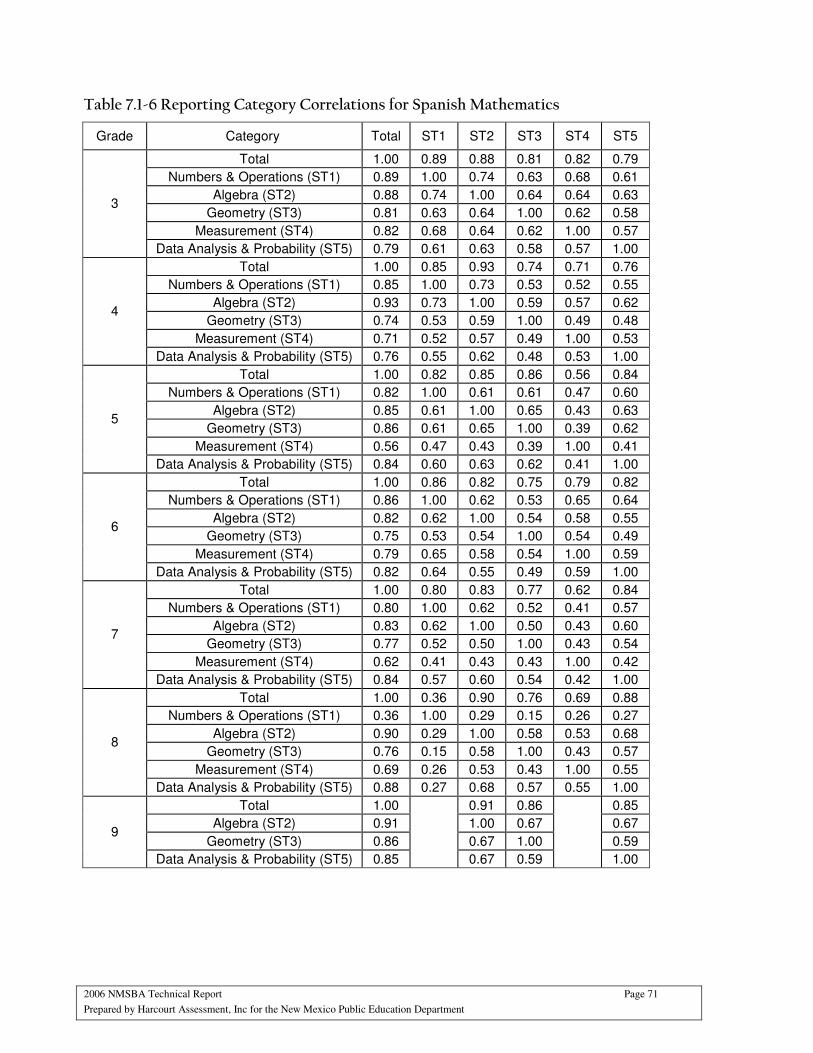
2006 NMSBA Technical Report Page 71
Prepared by Harcourt Assessment, Inc for the New Mexico Public Education Department
Table 7.1-6 Reporting Category Correlations for Spanish Mathematics
Grade Category Total ST1 ST2 ST3 ST4 ST5
Total 1.00 0.89 0.88 0.81 0.82 0.79
Numbers & Operations (ST1) 0.89 1.00 0.74 0.63 0.68 0.61
Algebra (ST2) 0.88 0.74 1.00 0.64 0.64 0.63
Geometry (ST3) 0.81 0.63 0.64 1.00 0.62 0.58
Measurement (ST4) 0.82 0.68 0.64 0.62 1.00 0.57
3
Data Analysis & Probability (ST5) 0.79 0.61 0.63 0.58 0.57 1.00
Total 1.00 0.85 0.93 0.74 0.71 0.76
Numbers & Operations (ST1) 0.85 1.00 0.73 0.53 0.52 0.55
Algebra (ST2) 0.93 0.73 1.00 0.59 0.57 0.62
Geometry (ST3) 0.74 0.53 0.59 1.00 0.49 0.48
Measurement (ST4) 0.71 0.52 0.57 0.49 1.00 0.53
4
Data Analysis & Probability (ST5) 0.76 0.55 0.62 0.48 0.53 1.00
Total 1.00 0.82 0.85 0.86 0.56 0.84
Numbers & Operations (ST1) 0.82 1.00 0.61 0.61 0.47 0.60
Algebra (ST2) 0.85 0.61 1.00 0.65 0.43 0.63
Geometry (ST3) 0.86 0.61 0.65 1.00 0.39 0.62
Measurement (ST4) 0.56 0.47 0.43 0.39 1.00 0.41
5
Data Analysis & Probability (ST5) 0.84 0.60 0.63 0.62 0.41 1.00
Total 1.00 0.86 0.82 0.75 0.79 0.82
Numbers & Operations (ST1) 0.86 1.00 0.62 0.53 0.65 0.64
Algebra (ST2) 0.82 0.62 1.00 0.54 0.58 0.55
Geometry (ST3) 0.75 0.53 0.54 1.00 0.54 0.49
Measurement (ST4) 0.79 0.65 0.58 0.54 1.00 0.59
6
Data Analysis & Probability (ST5) 0.82 0.64 0.55 0.49 0.59 1.00
Total 1.00 0.80 0.83 0.77 0.62 0.84
Numbers & Operations (ST1) 0.80 1.00 0.62 0.52 0.41 0.57
Algebra (ST2) 0.83 0.62 1.00 0.50 0.43 0.60
Geometry (ST3) 0.77 0.52 0.50 1.00 0.43 0.54
Measurement (ST4) 0.62 0.41 0.43 0.43 1.00 0.42
7
Data Analysis & Probability (ST5) 0.84 0.57 0.60 0.54 0.42 1.00
Total 1.00 0.36 0.90 0.76 0.69 0.88
Numbers & Operations (ST1) 0.36 1.00 0.29 0.15 0.26 0.27
Algebra (ST2) 0.90 0.29 1.00 0.58 0.53 0.68
Geometry (ST3) 0.76 0.15 0.58 1.00 0.43 0.57
Measurement (ST4) 0.69 0.26 0.53 0.43 1.00 0.55
8
Data Analysis & Probability (ST5) 0.88 0.27 0.68 0.57 0.55 1.00
Total 1.00 0.91 0.86 0.85
Algebra (ST2) 0.91 1.00 0.67 0.67
Geometry (ST3) 0.86 0.67 1.00 0.59 9
Data Analysis & Probability (ST5) 0.85
0.67 0.59
1.00

2006 NMSBA Technical Report Page 72
Prepared by Harcourt Assessment, Inc for the New Mexico Public Education Department
Table 7.1-7 Reporting Category Correlations for Spanish Reading
Grade Category Total ST1 ST2
Total 1.00 0.96 0.92
Read for Comprehension (ST1) 0.96 1.00 0.78 3
Use Literature and Media (ST2) 0.92 0.78 1.00
Total 1.00 0.96 0.91
Read for Comprehension (ST1) 0.96 1.00 0.76 4
Use Literature and Media (ST2) 0.91 0.76 1.00
Total 1.00 0.99 0.82
Read for Comprehension (ST1) 0.99 1.00 0.72 5
Use Literature and Media (ST2) 0.82 0.72 1.00
Total 1.00 0.99 0.71
Read for Comprehension (ST1) 0.99 1.00 0.62 6
Use Literature and Media (ST2) 0.71 0.62 1.00
Total 1.00 0.98 0.80
Read for Comprehension (ST1) 0.98 1.00 0.67 7
Use Literature and Media (ST2) 0.80 0.67 1.00
Total 1.00 0.98 0.83
Read for Comprehension (ST1) 0.98 1.00 0.70 8
Use Literature and Media (ST2) 0.83 0.70 1.00
Total 1.00 0.97 0.83
Read for Comprehension (ST1) 0.97 1.00 0.68 9
Use Literature and Media (ST2) 0.83 0.68 1.00
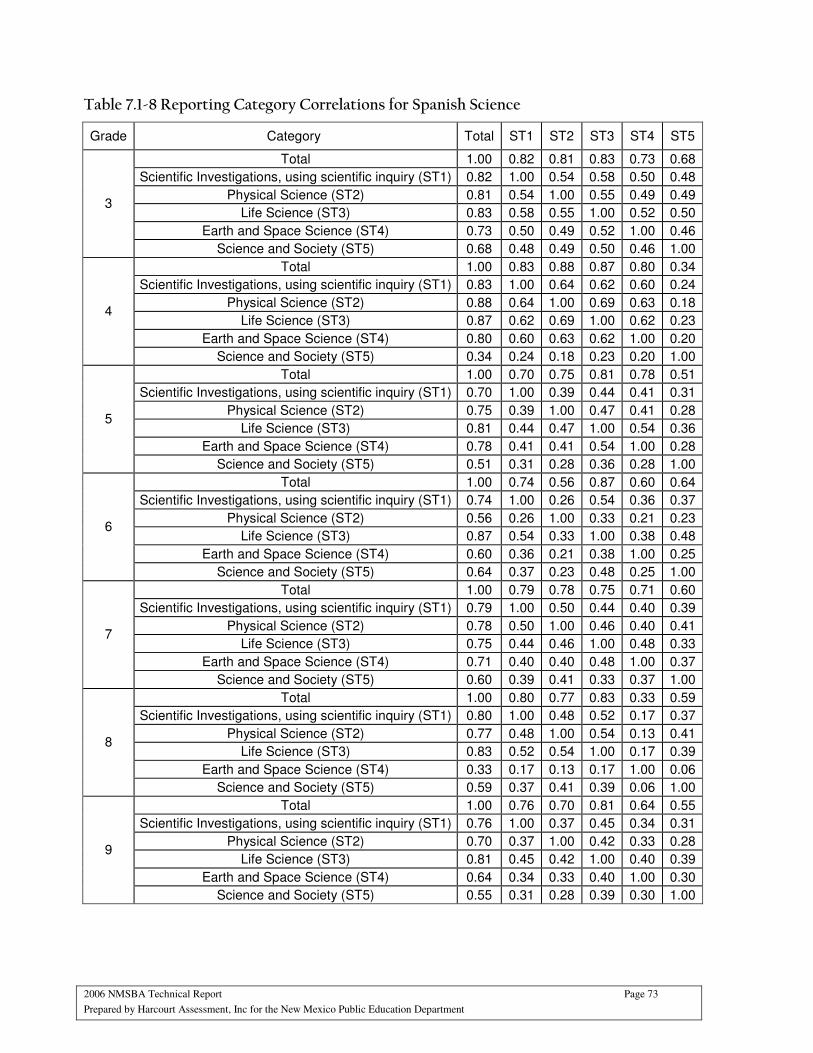
2006 NMSBA Technical Report Page 73
Prepared by Harcourt Assessment, Inc for the New Mexico Public Education Department
Table 7.1-8 Reporting Category Correlations for Spanish Science
Grade Category Total ST1 ST2 ST3 ST4 ST5
Total 1.00 0.82 0.81 0.83 0.73 0.68
Scientific Investigations, using scientific inquiry (ST1) 0.82 1.00 0.54 0.58 0.50 0.48
Physical Science (ST2) 0.81 0.54 1.00 0.55 0.49 0.49
Life Science (ST3) 0.83 0.58 0.55 1.00 0.52 0.50
Earth and Space Science (ST4) 0.73 0.50 0.49 0.52 1.00 0.46
3
Science and Society (ST5) 0.68 0.48 0.49 0.50 0.46 1.00
Total 1.00 0.83 0.88 0.87 0.80 0.34
Scientific Investigations, using scientific inquiry (ST1) 0.83 1.00 0.64 0.62 0.60 0.24
Physical Science (ST2) 0.88 0.64 1.00 0.69 0.63 0.18
Life Science (ST3) 0.87 0.62 0.69 1.00 0.62 0.23
Earth and Space Science (ST4) 0.80 0.60 0.63 0.62 1.00 0.20
4
Science and Society (ST5) 0.34 0.24 0.18 0.23 0.20 1.00
Total 1.00 0.70 0.75 0.81 0.78 0.51
Scientific Investigations, using scientific inquiry (ST1) 0.70 1.00 0.39 0.44 0.41 0.31
Physical Science (ST2) 0.75 0.39 1.00 0.47 0.41 0.28
Life Science (ST3) 0.81 0.44 0.47 1.00 0.54 0.36
Earth and Space Science (ST4) 0.78 0.41 0.41 0.54 1.00 0.28
5
Science and Society (ST5) 0.51 0.31 0.28 0.36 0.28 1.00
Total 1.00 0.74 0.56 0.87 0.60 0.64
Scientific Investigations, using scientific inquiry (ST1) 0.74 1.00 0.26 0.54 0.36 0.37
Physical Science (ST2) 0.56 0.26 1.00 0.33 0.21 0.23
Life Science (ST3) 0.87 0.54 0.33 1.00 0.38 0.48
Earth and Space Science (ST4) 0.60 0.36 0.21 0.38 1.00 0.25
6
Science and Society (ST5) 0.64 0.37 0.23 0.48 0.25 1.00
Total 1.00 0.79 0.78 0.75 0.71 0.60
Scientific Investigations, using scientific inquiry (ST1) 0.79 1.00 0.50 0.44 0.40 0.39
Physical Science (ST2) 0.78 0.50 1.00 0.46 0.40 0.41
Life Science (ST3) 0.75 0.44 0.46 1.00 0.48 0.33
Earth and Space Science (ST4) 0.71 0.40 0.40 0.48 1.00 0.37
7
Science and Society (ST5) 0.60 0.39 0.41 0.33 0.37 1.00
Total 1.00 0.80 0.77 0.83 0.33 0.59
Scientific Investigations, using scientific inquiry (ST1) 0.80 1.00 0.48 0.52 0.17 0.37
Physical Science (ST2) 0.77 0.48 1.00 0.54 0.13 0.41
Life Science (ST3) 0.83 0.52 0.54 1.00 0.17 0.39
Earth and Space Science (ST4) 0.33 0.17 0.13 0.17 1.00 0.06
8
Science and Society (ST5) 0.59 0.37 0.41 0.39 0.06 1.00
Total 1.00 0.76 0.70 0.81 0.64 0.55
Scientific Investigations, using scientific inquiry (ST1) 0.76 1.00 0.37 0.45 0.34 0.31
Physical Science (ST2) 0.70 0.37 1.00 0.42 0.33 0.28
Life Science (ST3) 0.81 0.45 0.42 1.00 0.40 0.39
Earth and Space Science (ST4) 0.64 0.34 0.33 0.40 1.00 0.30
9
Science and Society (ST5) 0.55 0.31 0.28 0.39 0.30 1.00
2006 NMSBA Technical Report Page 74
Prepared by Harcourt Assessment, Inc for the New Mexico Public Education Department
7.2 External Validity Evidence
We have discussed our investigation of the test validity that was conducted on the internal structure of the test, using exploratory principal component analysis, item-total test correlations, and correlations between subtest (standard) and total test scores. An analysis of the relation of the test with other tests will now be discussed. This use of the data external to the test itself can show more about what a test measures. Correlation with other tests is one of the typical methods of external validity investigation (Anastasi & Urbina, 1997). NMSBA has three content areas for each language: Mathematics, Reading, and Science. Given the traits that each test is thought to measure, a reasonable a priori hypothesis for the relation among the three content area tests is that correlation between Mathematics and Science would be higher than correlations between any pairs involving Reading. And the correlation between Mathematics and Science should be moderately high, signifying that the tests are related but not redundant. At the same time, one can expect that the correlation between Mathematics and Reading would be the lowest. Table 7.2-1 presents the correlations among the three content area tests.
For English test, the correlation between Mathematics and Reading was always the lowest across all grades, except at grade 4. The correlation between Mathematics and Science was the higher than or equal to the other correlations at all grades, except at grade 4 (where it was slightly lower than the other two correlations) and grade 7 (where the correlation between Reading and Science was the highest).
For the Spanish tests, the correlation between Mathematics and Reading was the lowest across all grades but grade 4 (where it was the highest and the correlation between Mathematics and Science was the lowest). The correlation between Mathematics and Science was higher than or equal to the other correlations in grades 3, 5, 8 and 9. The correlation between Reading and Science was higher than or equal to the other correlations in grades 3, 6, and 7.
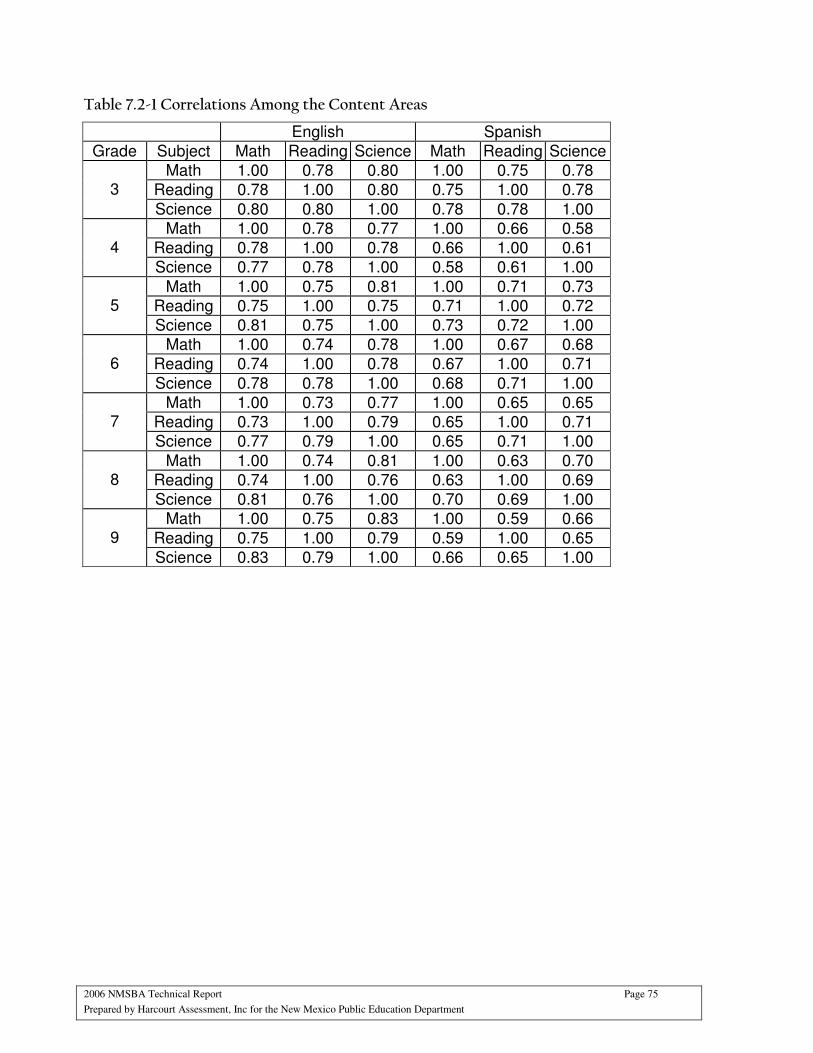
2006 NMSBA Technical Report Page 75
Prepared by Harcourt Assessment, Inc for the New Mexico Public Education Department
Table 7.2-1 Correlations Among the Content Areas
English Spanish
Grade Subject Math Reading Science Math Reading Science
Math 1.00 0.78 0.80 1.00 0.75 0.78
Reading 0.78 1.00 0.80 0.75 1.00 0.78 3
Science 0.80 0.80 1.00 0.78 0.78 1.00
Math 1.00 0.78 0.77 1.00 0.66 0.58
Reading 0.78 1.00 0.78 0.66 1.00 0.61 4
Science 0.77 0.78 1.00 0.58 0.61 1.00
Math 1.00 0.75 0.81 1.00 0.71 0.73
Reading 0.75 1.00 0.75 0.71 1.00 0.72 5
Science 0.81 0.75 1.00 0.73 0.72 1.00
Math 1.00 0.74 0.78 1.00 0.67 0.68
Reading 0.74 1.00 0.78 0.67 1.00 0.71 6
Science 0.78 0.78 1.00 0.68 0.71 1.00
Math 1.00 0.73 0.77 1.00 0.65 0.65
Reading 0.73 1.00 0.79 0.65 1.00 0.71 7
Science 0.77 0.79 1.00 0.65 0.71 1.00
Math 1.00 0.74 0.81 1.00 0.63 0.70
Reading 0.74 1.00 0.76 0.63 1.00 0.69 8
Science 0.81 0.76 1.00 0.70 0.69 1.00
Math 1.00 0.75 0.83 1.00 0.59 0.66
Reading 0.75 1.00 0.79 0.59 1.00 0.65 9
Science 0.83 0.79 1.00 0.66 0.65 1.00
2006 NMSBA Technical Report Page 76
Prepared by Harcourt Assessment, Inc for the New Mexico Public Education Department
References
Alabama Department of Education. (2004). Alabama ARMT Technical manual. Alabama: Alabama Department of Education.
American Educational Research Association. (1999). Standards for educational and psychological testing. Washington, DC: Author.
Anastasi, A., & Urbina, S. (1997). Psychological Testing (7th edition). Upper Saddle River, NJ: Prentice Hall.
Angoff, W.H. (1984). Scales, norms, and equivalent scores. Princeton, NJ: Educational Testing Service. (Reprint of chapter in R.L. Thorndike (Ed.), Educational Measurement (2nd ed.). Washington, DC: American Council on Education, 1971.
Camilli, G., & Shepard, L. A. (1994). Methods for identifying biased test items. Thousand Oaks, CA: SAGE Publications.
Dorans, N. J., & Schmitt, A. P. (1991). Constructed-response and differential item functioning: A pragmatic approach (ETS Research Report No. 91-49). Princeton, NJ: Educational Testing Service.
Embretson, S., & Reise, S. (2000). Item response theory for psychologists. New Jersey : Lawrence Erlbaum Associates, Publishers.
Hambleton, R. K., Swaminathan, H., & Rogers, H. J. (1991). Fundamentals of item response theory. Newbury Park, CA: SAGE Publications, Inc.
Hanson, B. A. (1995). USmooth: A program for smoothing univariate test score distribution (Version 1.5). Iowa City, IA: American College Testing.
Linacre, J. M., & Wright, B. D. (2000). A user’s guide to WINSTEPS: Rasch-model computer program. Chicago, IL: MESA Press.
Livingston, S. A., & Lewis, C. (1995). Estimating the consistency and accuracy of classifications based on test scores. Journal of Educational Measurement, 32, 179-197.
Masters, G. N. (1982). A Rasch model for partial credit scoring. Psychometrika, 47, 149-174.
Mantel, N. (1963). Chi-square tests with one degree of freedom: Extensions of the Mantel-Haenszel procedure. Journal of the American Statistical Association, 58, 690-700.
Mantel, N., & Haenszel, W. (1959). Statistical aspects of the analysis of data from retrospective studies of disease. Journal of the National Cancer Institute, 22, 719-748.
Norcini, J.J., Shea, J.A., and Kanya, D.J. (1988). “The effect of various factors on standard setting,” Journal of Educational Measurement, 25, 57-65.
Rasch, G. (1980). Probabilistic Models for Some Intelligence and Attainment Tests. Chicago: University of Chicago Press (original work published 1960).
SAS Institute (2003). SAS (Version 9.1). Cary, NC: SAS Institute, Inc.
South Carolina Department of Education. (2001). Technical documentation for the 2000 Palmetto achievement challenge tests of English language arts and mathematics (Technical Report). Columbia: South Carolina Department of Education.
2006 NMSBA Technical Report Page 77
Prepared by Harcourt Assessment, Inc for the New Mexico Public Education Department
Shepard, L.A. (1980). Standard setting issues and methods. Applied Psychological Measurement, 4, 447-467.
Young, M. J., & Yoon, B. H. (1998). Estimating the consistency and accuracy of classification in a standards-referenced assessment. CSE Technical Report 475 (April, 1998).
Zwick, R., Donoghue, J. R., & Grima, A. (1993). Assessment of differential item functioning for performance tasks. Journal of Educational Measurement, 30, 233-251.
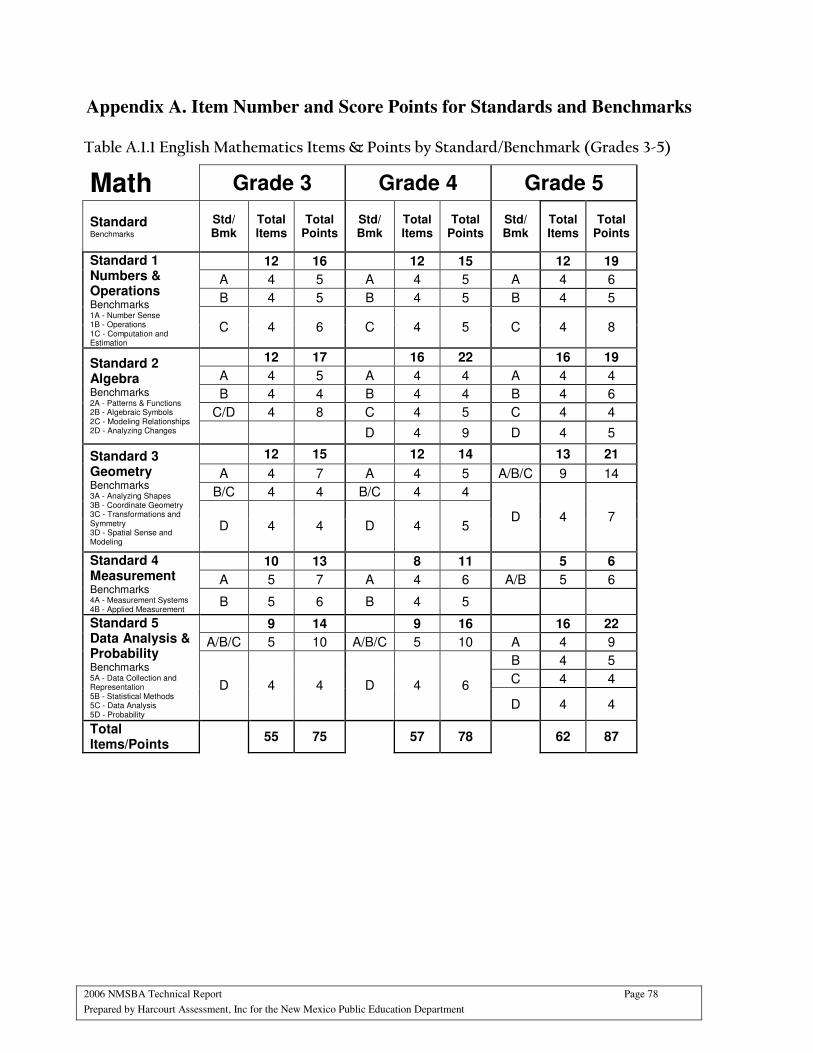
2006 NMSBA Technical Report Page 78
Prepared by Harcourt Assessment, Inc for the New Mexico Public Education Department
Appendix A. Item Number and Score Points for Standards and Benchmarks
Table A.1.1 English Mathematics Items & Points by Standard/Benchmark (Grades 3-5)
Math Grade 3 Grade 4 Grade 5
Standard Benchmarks
Std/ Bmk
Total Items
Total Points
Std/ Bmk
Total Items
Total Points
Std/ Bmk
Total Items
Total Points
12 16 12 15 12 19
A 4 5 A 4 5 A 4 6
B 4 5 B 4 5 B 4 5
Standard 1 Numbers & Operations
Benchmarks 1A - Number Sense 1B - Operations 1C - Computation and Estimation
C 4 6 C 4 5 C 4 8
12 17 16 22 16 19
A 4 5 A 4 4 A 4 4
B 4 4 B 4 4 B 4 6
C/D 4 8 C 4 5 C 4 4
Standard 2 Algebra
Benchmarks 2A - Patterns & Functions 2B - Algebraic Symbols 2C - Modeling Relationships 2D - Analyzing Changes D 4 9 D 4 5
12 15 12 14 13 21
A 4 7 A 4 5 A/B/C 9 14
B/C 4 4 B/C 4 4
Standard 3 Geometry
Benchmarks 3A - Analyzing Shapes 3B - Coordinate Geometry 3C - Transformations and Symmetry 3D - Spatial Sense and Modeling
D 4 4 D 4 5 D 4 7
10 13 8 11 5 6
A 5 7 A 4 6 A/B 5 6
Standard 4 Measurement Benchmarks 4A - Measurement Systems 4B - Applied Measurement B 5 6 B 4 5
9 14 9 16 16 22
A/B/C 5 10 A/B/C 5 10 A 4 9
B 4 5
C 4 4
Standard 5 Data Analysis & Probability
Benchmarks 5A - Data Collection and Representation 5B - Statistical Methods 5C - Data Analysis 5D - Probability
D 4 4 D 4 6
D 4 4
Total Items/Points
55 75 57 78 62 87
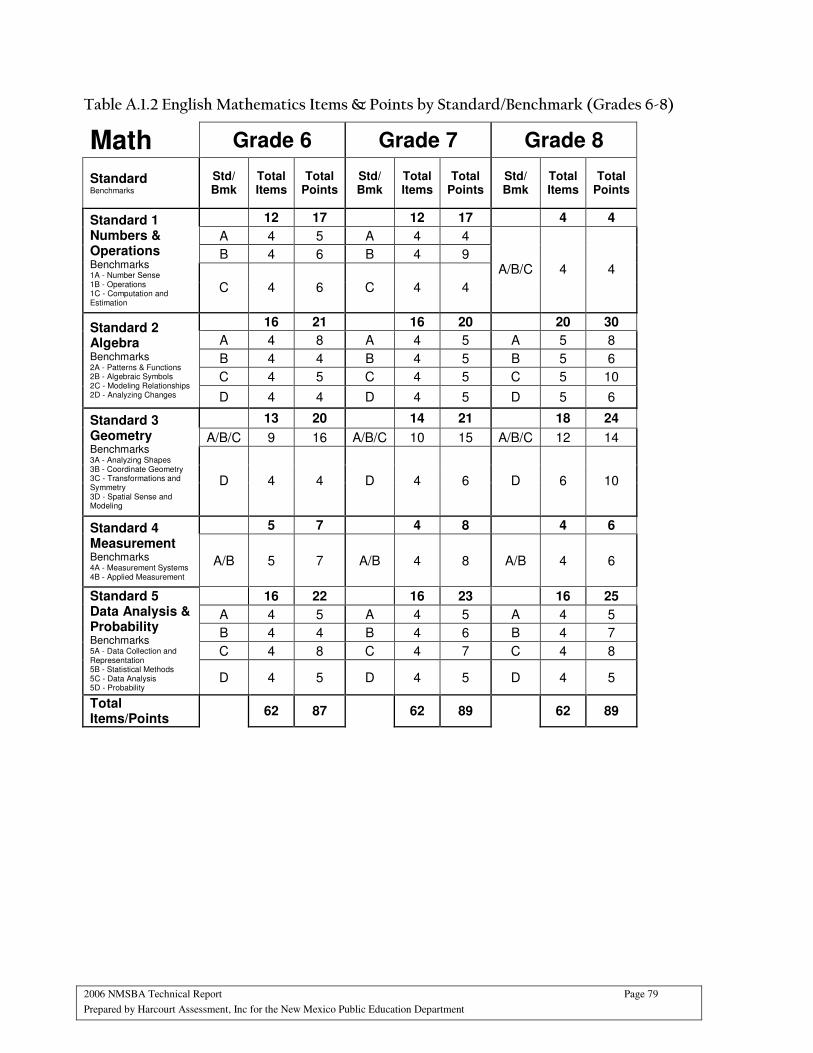
2006 NMSBA Technical Report Page 79
Prepared by Harcourt Assessment, Inc for the New Mexico Public Education Department
Table A.1.2 English Mathematics Items & Points by Standard/Benchmark (Grades 6-8)
Math Grade 6 Grade 7 Grade 8
Standard Benchmarks
Std/ Bmk
Total Items
Total Points
Std/ Bmk
Total Items
Total Points
Std/ Bmk
Total Items
Total Points
12 17 12 17 4 4
A 4 5 A 4 4
B 4 6 B 4 9
Standard 1 Numbers & Operations
Benchmarks 1A - Number Sense 1B - Operations 1C - Computation and Estimation
C 4 6 C 4 4
A/B/C 4 4
16 21 16 20 20 30
A 4 8 A 4 5 A 5 8
B 4 4 B 4 5 B 5 6
C 4 5 C 4 5 C 5 10
Standard 2 Algebra
Benchmarks 2A - Patterns & Functions 2B - Algebraic Symbols 2C - Modeling Relationships 2D - Analyzing Changes D 4 4 D 4 5 D 5 6
13 20 14 21 18 24
A/B/C 9 16 A/B/C 10 15 A/B/C 12 14
Standard 3 Geometry Benchmarks 3A - Analyzing Shapes 3B - Coordinate Geometry 3C - Transformations and Symmetry 3D - Spatial Sense and Modeling
D 4 4 D 4 6 D 6 10
5 7 4 8 4 6 Standard 4 Measurement Benchmarks 4A - Measurement Systems 4B - Applied Measurement
A/B 5 7 A/B 4 8 A/B 4 6
16 22 16 23 16 25
A 4 5 A 4 5 A 4 5
B 4 4 B 4 6 B 4 7
C 4 8 C 4 7 C 4 8
Standard 5 Data Analysis & Probability Benchmarks 5A - Data Collection and Representation 5B - Statistical Methods 5C - Data Analysis 5D - Probability
D 4 5 D 4 5 D 4 5
Total Items/Points
62 87 62 89 62 89
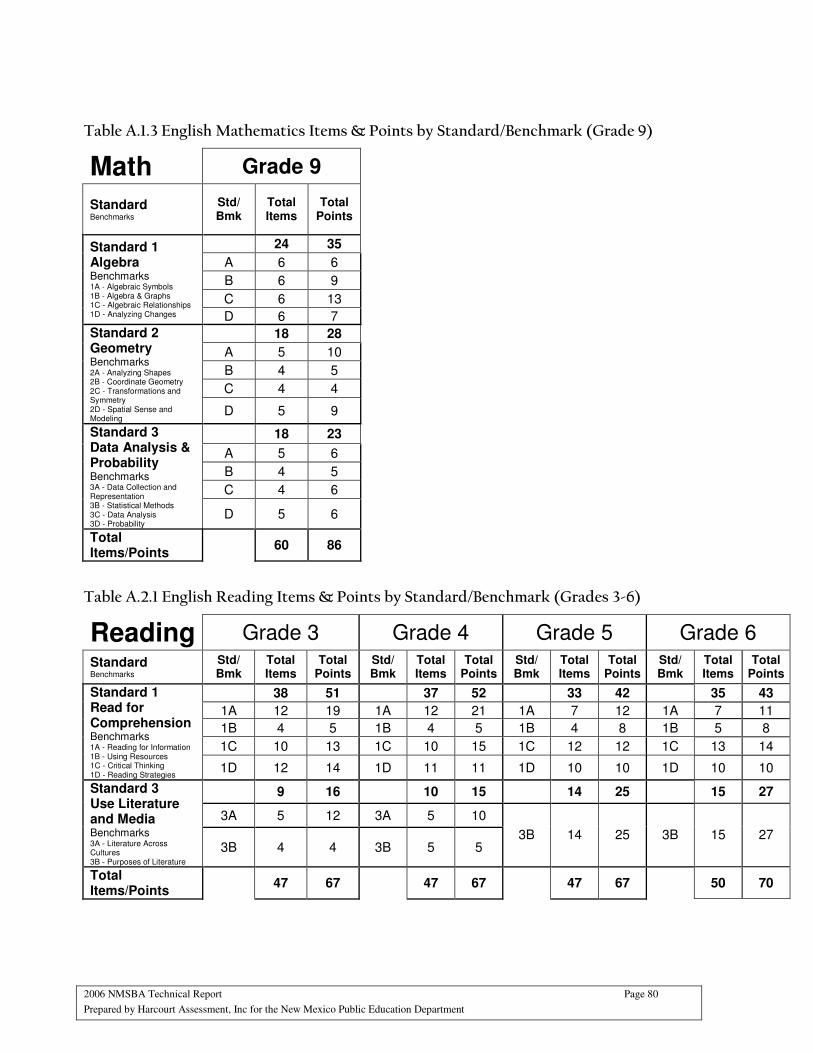
2006 NMSBA Technical Report Page 80
Prepared by Harcourt Assessment, Inc for the New Mexico Public Education Department
Table A.1.3 English Mathematics Items & Points by Standard/Benchmark (Grade 9)
Math Grade 9
Standard Benchmarks
Std/ Bmk
Total Items
Total Points
24 35
A 6 6
B 6 9
C 6 13
Standard 1 Algebra
Benchmarks 1A - Algebraic Symbols 1B - Algebra & Graphs 1C - Algebraic Relationships 1D - Analyzing Changes D 6 7
18 28
A 5 10
B 4 5
C 4 4
Standard 2 Geometry Benchmarks 2A - Analyzing Shapes 2B - Coordinate Geometry 2C - Transformations and Symmetry 2D - Spatial Sense and Modeling D 5 9
18 23
A 5 6
B 4 5
C 4 6
Standard 3 Data Analysis & Probability Benchmarks 3A - Data Collection and Representation 3B - Statistical Methods 3C - Data Analysis 3D - Probability
D 5 6
Total Items/Points
60 86
Table A.2.1 English Reading Items & Points by Standard/Benchmark (Grades 3-6)
Reading Grade 3 Grade 4 Grade 5 Grade 6
Standard Benchmarks
Std/ Bmk
Total Items
Total Points
Std/ Bmk
Total Items
Total Points
Std/ Bmk
Total Items
Total Points
Std/ Bmk
Total Items
Total Points
38 51 37 52 33 42 35 43
1A 12 19 1A 12 21 1A 7 12 1A 7 11
1B 4 5 1B 4 5 1B 4 8 1B 5 8
1C 10 13 1C 10 15 1C 12 12 1C 13 14
Standard 1 Read for Comprehension Benchmarks 1A - Reading for Information 1B - Using Resources 1C - Critical Thinking 1D - Reading Strategies 1D 12 14 1D 11 11 1D 10 10 1D 10 10
9 16 10 15 14 25 15 27
3A 5 12 3A 5 10
Standard 3 Use Literature and Media
Benchmarks
3A - Literature Across Cultures 3B - Purposes of Literature
3B 4 4 3B 5 5 3B 14 25 3B 15 27
Total Items/Points
47 67 47 67 47 67 50 70
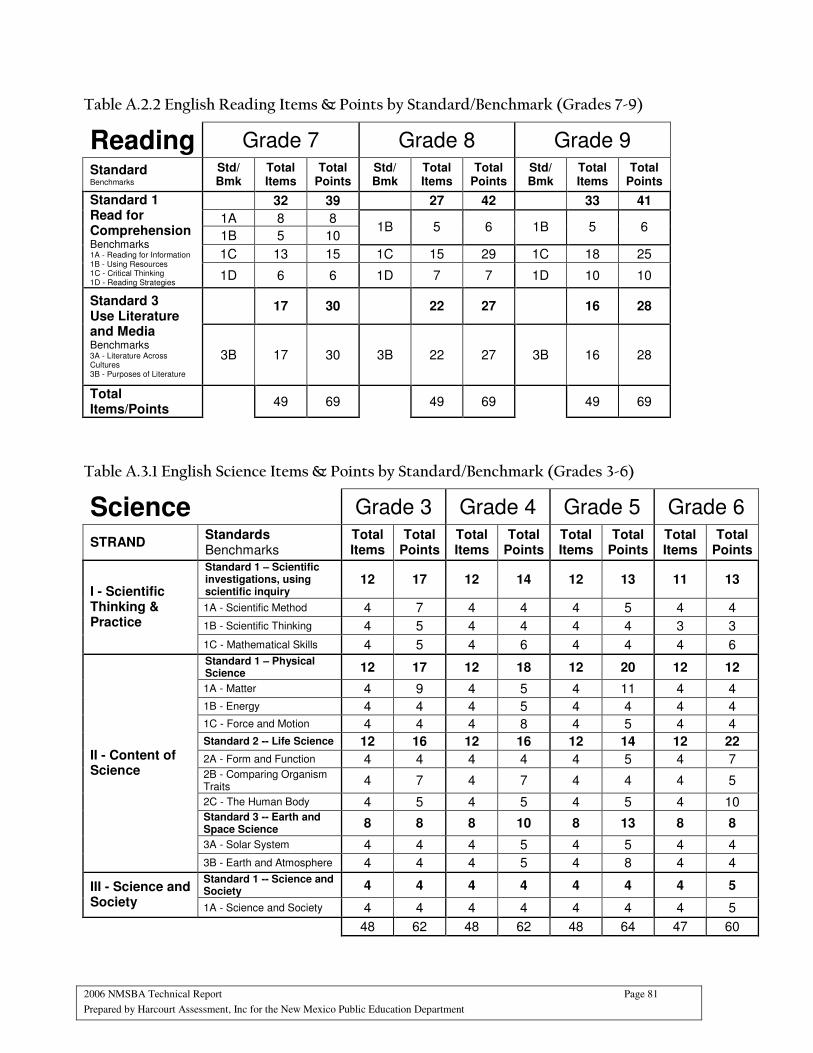
2006 NMSBA Technical Report Page 81
Prepared by Harcourt Assessment, Inc for the New Mexico Public Education Department
Table A.2.2 English Reading Items & Points by Standard/Benchmark (Grades 7-9)
Table A.3.1 English Science Items & Points by Standard/Benchmark (Grades 3-6)
Science Grade 3 Grade 4 Grade 5 Grade 6
STRAND Standards Benchmarks
Total Items
Total Points
Total Items
Total Points
Total Items
Total Points
Total Items
Total Points
Standard 1 – Scientific investigations, using scientific inquiry
12 17 12 14 12 13 11 13
1A - Scientific Method 4 7 4 4 4 5 4 4
1B - Scientific Thinking 4 5 4 4 4 4 3 3
I - Scientific Thinking & Practice
1C - Mathematical Skills 4 5 4 6 4 4 4 6 Standard 1 – Physical Science 12 17 12 18 12 20 12 12
1A - Matter 4 9 4 5 4 11 4 4
1B - Energy 4 4 4 5 4 4 4 4
1C - Force and Motion 4 4 4 8 4 5 4 4
Standard 2 -- Life Science 12 16 12 16 12 14 12 22
2A - Form and Function 4 4 4 4 4 5 4 7 2B - Comparing Organism Traits
4 7 4 7 4 4 4 5
2C - The Human Body 4 5 4 5 4 5 4 10 Standard 3 -- Earth and Space Science
8 8 8 10 8 13 8 8
3A - Solar System 4 4 4 5 4 5 4 4
II - Content of Science
3B - Earth and Atmosphere 4 4 4 5 4 8 4 4 Standard 1 -- Science and Society 4 4 4 4 4 4 4 5 III - Science and
Society 1A - Science and Society 4 4 4 4 4 4 4 5
48 62 48 62 48 64 47 60
Reading Grade 7 Grade 8 Grade 9
Standard Benchmarks
Std/ Bmk
Total Items
Total Points
Std/ Bmk
Total Items
Total Points
Std/ Bmk
Total Items
Total Points
32 39 27 42 33 41
1A 8 8
1B 5 10 1B 5 6 1B 5 6
1C 13 15 1C 15 29 1C 18 25
Standard 1 Read for Comprehension
Benchmarks 1A - Reading for Information 1B - Using Resources 1C - Critical Thinking 1D - Reading Strategies 1D 6 6 1D 7 7 1D 10 10
17 30 22 27 16 28 Standard 3 Use Literature and Media
Benchmarks
3A - Literature Across Cultures 3B - Purposes of Literature
3B 17 30 3B 22 27 3B 16 28
Total Items/Points
49 69 49 69 49 69
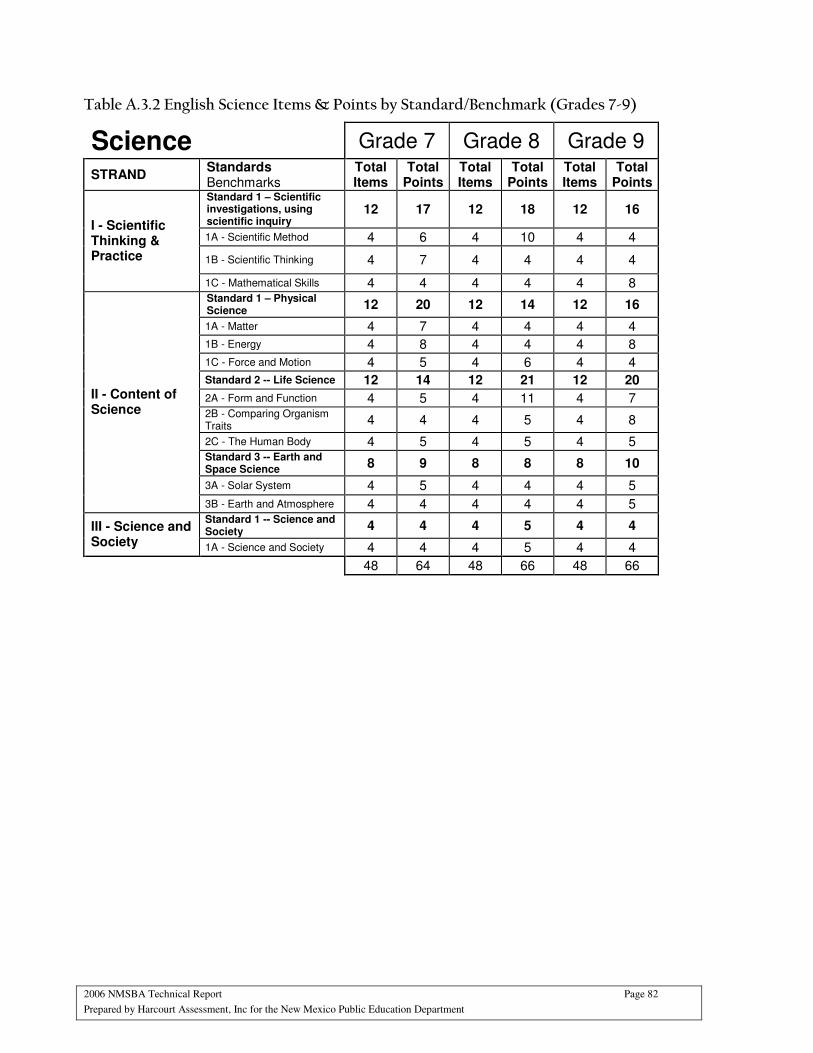
2006 NMSBA Technical Report Page 82
Prepared by Harcourt Assessment, Inc for the New Mexico Public Education Department
Table A.3.2 English Science Items & Points by Standard/Benchmark (Grades 7-9)
Science Grade 7 Grade 8 Grade 9
STRAND Standards Benchmarks
Total Items
Total Points
Total Items
Total Points
Total Items
Total Points
Standard 1 – Scientific investigations, using scientific inquiry
12 17 12 18 12 16
1A - Scientific Method 4 6 4 10 4 4
1B - Scientific Thinking 4 7 4 4 4 4
I - Scientific Thinking & Practice
1C - Mathematical Skills 4 4 4 4 4 8 Standard 1 – Physical Science 12 20 12 14 12 16
1A - Matter 4 7 4 4 4 4
1B - Energy 4 8 4 4 4 8
1C - Force and Motion 4 5 4 6 4 4
Standard 2 -- Life Science 12 14 12 21 12 20
2A - Form and Function 4 5 4 11 4 7 2B - Comparing Organism Traits 4 4 4 5 4 8
2C - The Human Body 4 5 4 5 4 5 Standard 3 -- Earth and Space Science 8 9 8 8 8 10
3A - Solar System 4 5 4 4 4 5
II - Content of Science
3B - Earth and Atmosphere 4 4 4 4 4 5 Standard 1 -- Science and Society 4 4 4 5 4 4 III - Science and
Society 1A - Science and Society 4 4 4 5 4 4
48 64 48 66 48 66
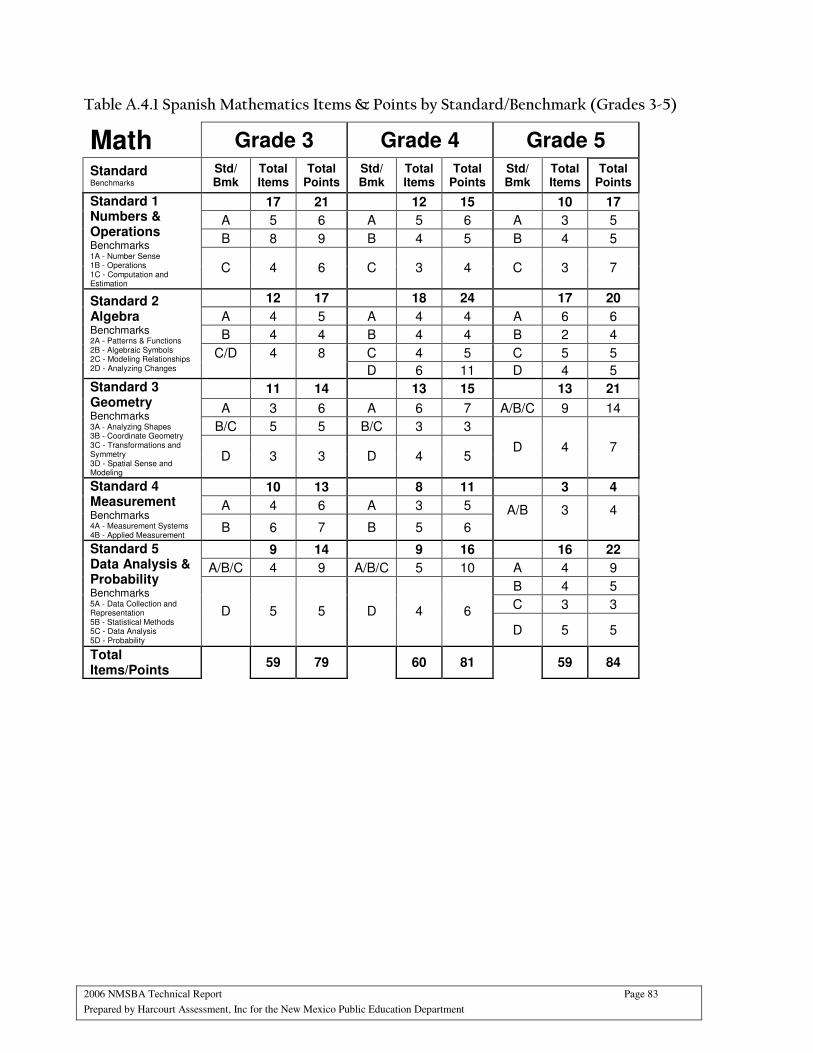
2006 NMSBA Technical Report Page 83
Prepared by Harcourt Assessment, Inc for the New Mexico Public Education Department
Table A.4.1 Spanish Mathematics Items & Points by Standard/Benchmark (Grades 3-5)
Math Grade 3 Grade 4 Grade 5
Standard Benchmarks
Std/ Bmk
Total Items
Total Points
Std/ Bmk
Total Items
Total Points
Std/ Bmk
Total Items
Total Points
17 21 12 15 10 17
A 5 6 A 5 6 A 3 5
B 8 9 B 4 5 B 4 5
Standard 1 Numbers & Operations
Benchmarks 1A - Number Sense 1B - Operations 1C - Computation and Estimation
C 4 6 C 3 4 C 3 7
12 17 18 24 17 20
A 4 5 A 4 4 A 6 6
B 4 4 B 4 4 B 2 4
C 4 5 C 5 5
Standard 2 Algebra
Benchmarks 2A - Patterns & Functions 2B - Algebraic Symbols 2C - Modeling Relationships 2D - Analyzing Changes
C/D
4
8 D 6 11 D 4 5
11 14 13 15 13 21
A 3 6 A 6 7 A/B/C 9 14
B/C 5 5 B/C 3 3
Standard 3 Geometry
Benchmarks 3A - Analyzing Shapes 3B - Coordinate Geometry 3C - Transformations and Symmetry 3D - Spatial Sense and Modeling
D 3 3 D 4 5 D 4 7
10 13 8 11 3 4
A 4 6 A 3 5
Standard 4 Measurement Benchmarks 4A - Measurement Systems 4B - Applied Measurement B 6 7 B 5 6
A/B
3
4
9 14 9 16 16 22
A/B/C 4 9 A/B/C 5 10 A 4 9
B 4 5
C 3 3
Standard 5 Data Analysis & Probability
Benchmarks 5A - Data Collection and Representation 5B - Statistical Methods 5C - Data Analysis 5D - Probability
D 5 5 D 4 6
D 5 5
Total Items/Points
59 79 60 81 59 84
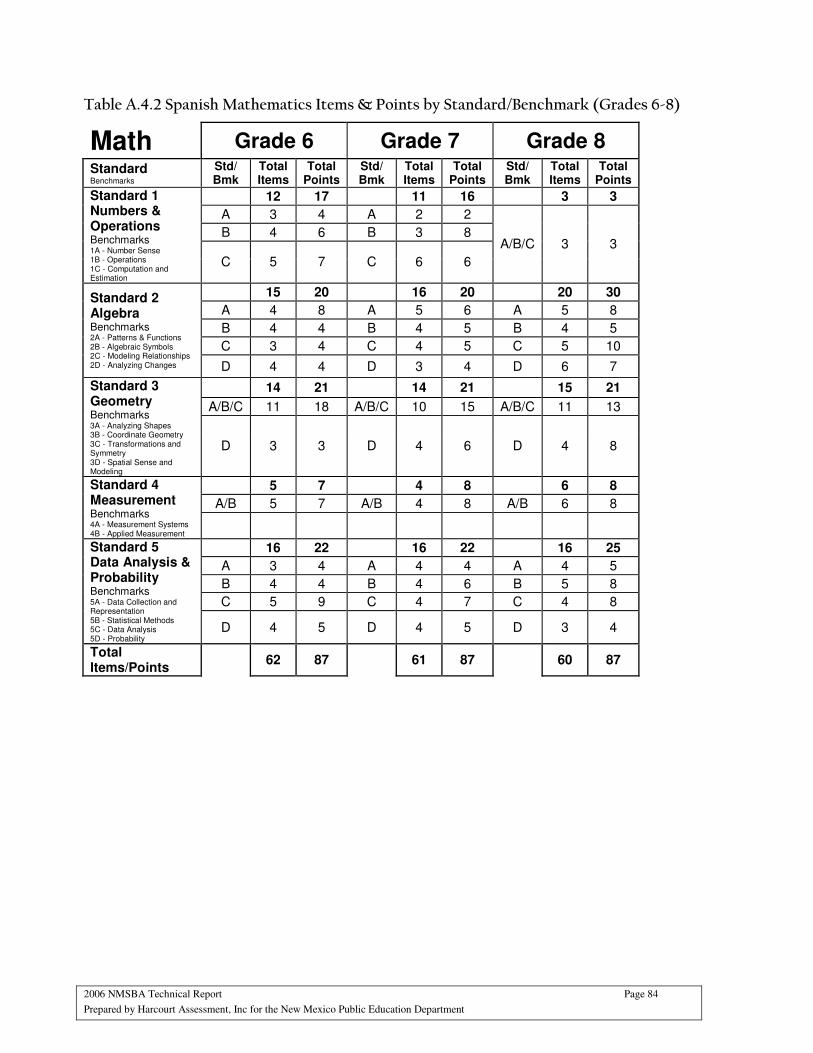
2006 NMSBA Technical Report Page 84
Prepared by Harcourt Assessment, Inc for the New Mexico Public Education Department
Table A.4.2 Spanish Mathematics Items & Points by Standard/Benchmark (Grades 6-8)
Math Grade 6 Grade 7 Grade 8 Standard Benchmarks
Std/ Bmk
Total Items
Total Points
Std/ Bmk
Total Items
Total Points
Std/ Bmk
Total Items
Total Points
12 17 11 16 3 3
A 3 4 A 2 2
B 4 6 B 3 8
Standard 1 Numbers & Operations
Benchmarks 1A - Number Sense 1B - Operations 1C - Computation and Estimation
C 5 7 C 6 6
A/B/C 3 3
15 20 16 20 20 30
A 4 8 A 5 6 A 5 8
B 4 4 B 4 5 B 4 5
C 3 4 C 4 5 C 5 10
Standard 2 Algebra
Benchmarks 2A - Patterns & Functions 2B - Algebraic Symbols 2C - Modeling Relationships 2D - Analyzing Changes D 4 4 D 3 4 D 6 7
14 21 14 21 15 21
A/B/C 11 18 A/B/C 10 15 A/B/C 11 13
Standard 3 Geometry
Benchmarks 3A - Analyzing Shapes 3B - Coordinate Geometry 3C - Transformations and Symmetry 3D - Spatial Sense and Modeling
D 3 3 D 4 6 D 4 8
5 7 4 8 6 8
A/B 5 7 A/B 4 8 A/B 6 8
Standard 4 Measurement Benchmarks 4A - Measurement Systems 4B - Applied Measurement
16 22 16 22 16 25
A 3 4 A 4 4 A 4 5
B 4 4 B 4 6 B 5 8
C 5 9 C 4 7 C 4 8
Standard 5 Data Analysis & Probability
Benchmarks 5A - Data Collection and Representation 5B - Statistical Methods 5C - Data Analysis 5D - Probability
D 4 5 D 4 5 D 3 4
Total Items/Points
62 87 61 87 60 87
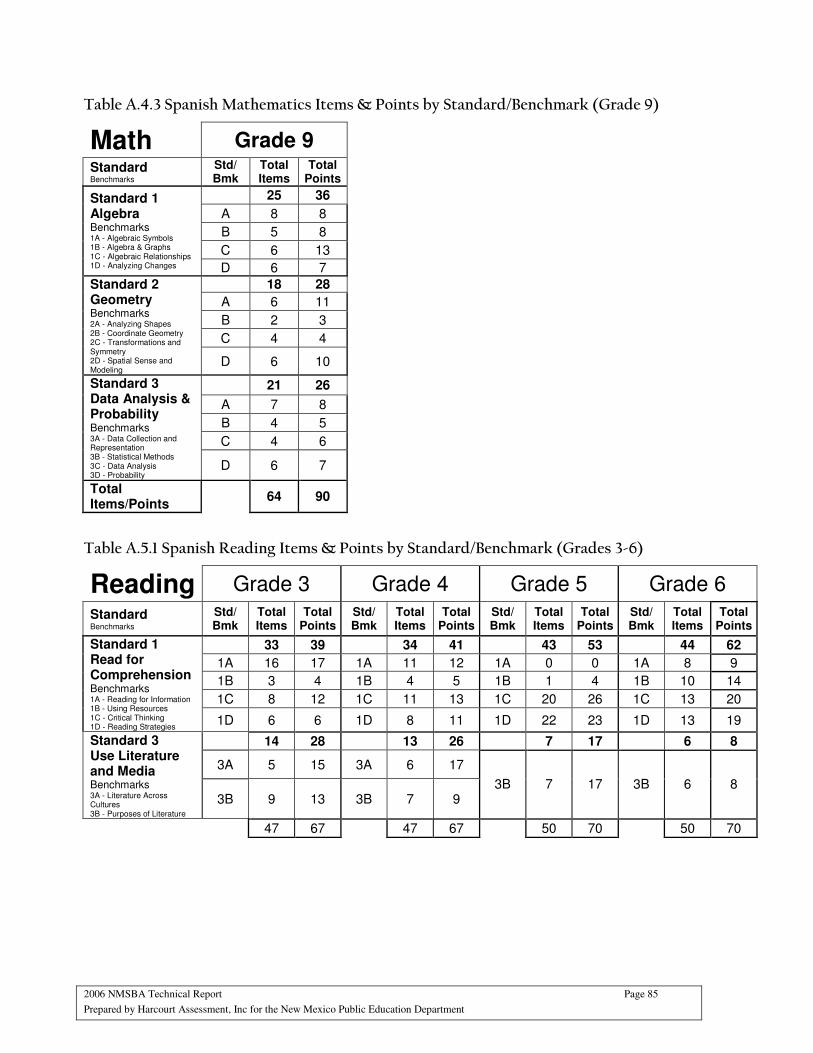
2006 NMSBA Technical Report Page 85
Prepared by Harcourt Assessment, Inc for the New Mexico Public Education Department
Table A.4.3 Spanish Mathematics Items & Points by Standard/Benchmark (Grade 9)
Math Grade 9 Standard Benchmarks
Std/ Bmk
Total Items
Total Points
25 36
A 8 8
B 5 8
C 6 13
Standard 1 Algebra
Benchmarks 1A - Algebraic Symbols 1B - Algebra & Graphs 1C - Algebraic Relationships 1D - Analyzing Changes D 6 7
18 28
A 6 11
B 2 3
C 4 4
Standard 2 Geometry Benchmarks 2A - Analyzing Shapes 2B - Coordinate Geometry 2C - Transformations and Symmetry 2D - Spatial Sense and Modeling
D 6 10
21 26
A 7 8
B 4 5
C 4 6
Standard 3 Data Analysis & Probability Benchmarks 3A - Data Collection and Representation 3B - Statistical Methods 3C - Data Analysis 3D - Probability
D 6 7
Total Items/Points
64 90
Table A.5.1 Spanish Reading Items & Points by Standard/Benchmark (Grades 3-6)
Reading Grade 3 Grade 4 Grade 5 Grade 6
Standard Benchmarks
Std/ Bmk
Total Items
Total Points
Std/ Bmk
Total Items
Total Points
Std/ Bmk
Total Items
Total Points
Std/ Bmk
Total Items
Total Points
33 39 34 41 43 53 44 62
1A 16 17 1A 11 12 1A 0 0 1A 8 9
1B 3 4 1B 4 5 1B 1 4 1B 10 14
1C 8 12 1C 11 13 1C 20 26 1C 13 20
Standard 1 Read for Comprehension
Benchmarks 1A - Reading for Information 1B - Using Resources 1C - Critical Thinking 1D - Reading Strategies 1D 6 6 1D 8 11 1D 22 23 1D 13 19
14 28 13 26 7 17 6 8
3A 5 15 3A 6 17
Standard 3 Use Literature and Media Benchmarks
3A - Literature Across Cultures 3B - Purposes of Literature
3B 9 13 3B 7 9 3B 7 17 3B 6 8
47 67 47 67 50 70 50 70
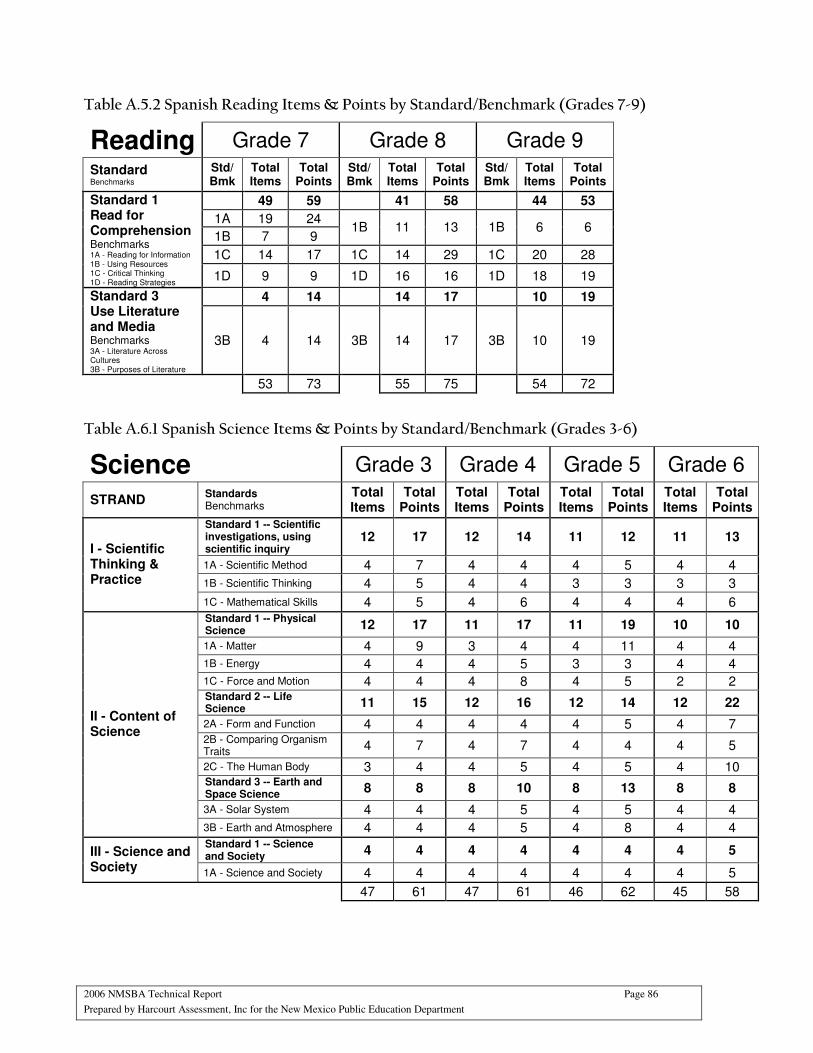
2006 NMSBA Technical Report Page 86
Prepared by Harcourt Assessment, Inc for the New Mexico Public Education Department
Table A.5.2 Spanish Reading Items & Points by Standard/Benchmark (Grades 7-9)
Reading Grade 7 Grade 8 Grade 9
Standard Benchmarks
Std/ Bmk
Total Items
Total Points
Std/ Bmk
Total Items
Total Points
Std/ Bmk
Total Items
Total Points
49 59 41 58 44 53
1A 19 24
1B 7 9 1B 11 13 1B 6 6
1C 14 17 1C 14 29 1C 20 28
Standard 1 Read for Comprehension
Benchmarks 1A - Reading for Information 1B - Using Resources 1C - Critical Thinking 1D - Reading Strategies 1D 9 9 1D 16 16 1D 18 19
4 14 14 17 10 19 Standard 3 Use Literature and Media
Benchmarks
3A - Literature Across Cultures 3B - Purposes of Literature
3B 4 14 3B 14 17 3B 10 19
53 73 55 75 54 72
Table A.6.1 Spanish Science Items & Points by Standard/Benchmark (Grades 3-6)
Science Grade 3 Grade 4 Grade 5 Grade 6
STRAND Standards Benchmarks
Total Items
Total Points
Total Items
Total Points
Total Items
Total Points
Total Items
Total Points
Standard 1 -- Scientific investigations, using scientific inquiry
12 17 12 14 11 12 11 13
1A - Scientific Method 4 7 4 4 4 5 4 4
1B - Scientific Thinking 4 5 4 4 3 3 3 3
I - Scientific Thinking & Practice
1C - Mathematical Skills 4 5 4 6 4 4 4 6 Standard 1 -- Physical Science 12 17 11 17 11 19 10 10
1A - Matter 4 9 3 4 4 11 4 4
1B - Energy 4 4 4 5 3 3 4 4
1C - Force and Motion 4 4 4 8 4 5 2 2 Standard 2 -- Life Science 11 15 12 16 12 14 12 22
2A - Form and Function 4 4 4 4 4 5 4 7 2B - Comparing Organism Traits 4 7 4 7 4 4 4 5
2C - The Human Body 3 4 4 5 4 5 4 10 Standard 3 -- Earth and Space Science
8 8 8 10 8 13 8 8
3A - Solar System 4 4 4 5 4 5 4 4
II - Content of Science
3B - Earth and Atmosphere 4 4 4 5 4 8 4 4 Standard 1 -- Science and Society 4 4 4 4 4 4 4 5 III - Science and
Society 1A - Science and Society 4 4 4 4 4 4 4 5
47 61 47 61 46 62 45 58
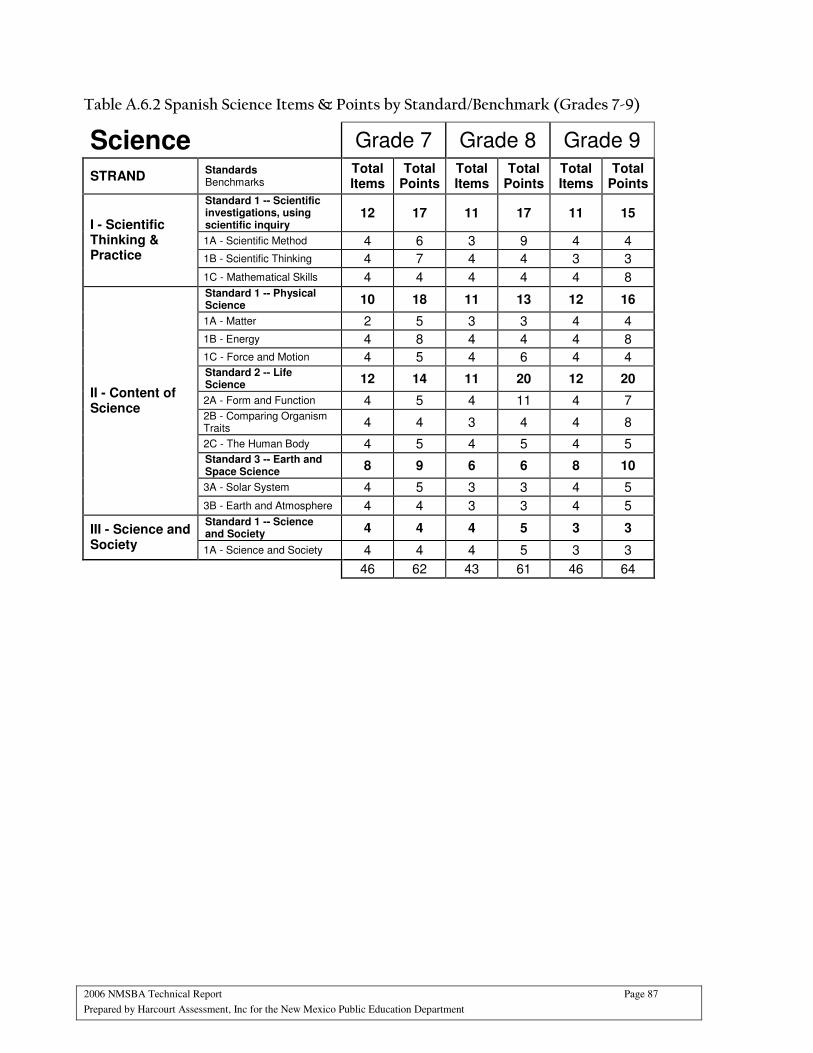
2006 NMSBA Technical Report Page 87
Prepared by Harcourt Assessment, Inc for the New Mexico Public Education Department
Table A.6.2 Spanish Science Items & Points by Standard/Benchmark (Grades 7-9)
Science Grade 7 Grade 8 Grade 9
STRAND Standards Benchmarks
Total Items
Total Points
Total Items
Total Points
Total Items
Total Points
Standard 1 -- Scientific investigations, using scientific inquiry
12 17 11 17 11 15
1A - Scientific Method 4 6 3 9 4 4
1B - Scientific Thinking 4 7 4 4 3 3
I - Scientific Thinking & Practice
1C - Mathematical Skills 4 4 4 4 4 8 Standard 1 -- Physical Science 10 18 11 13 12 16
1A - Matter 2 5 3 3 4 4
1B - Energy 4 8 4 4 4 8
1C - Force and Motion 4 5 4 6 4 4 Standard 2 -- Life Science 12 14 11 20 12 20
2A - Form and Function 4 5 4 11 4 7 2B - Comparing Organism Traits 4 4 3 4 4 8
2C - The Human Body 4 5 4 5 4 5 Standard 3 -- Earth and Space Science 8 9 6 6 8 10
3A - Solar System 4 5 3 3 4 5
II - Content of Science
3B - Earth and Atmosphere 4 4 3 3 4 5 Standard 1 -- Science and Society 4 4 4 5 3 3 III - Science and
Society 1A - Science and Society 4 4 4 5 3 3
46 62 43 61 46 64
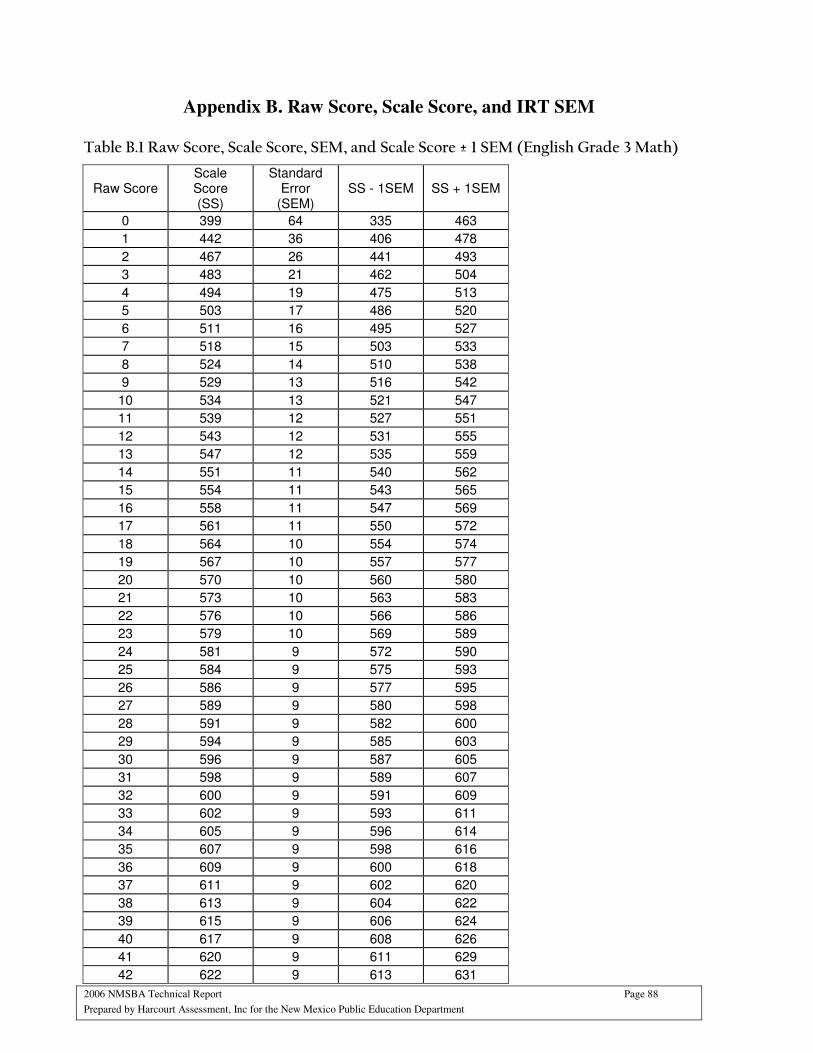
2006 NMSBA Technical Report Page 88
Prepared by Harcourt Assessment, Inc for the New Mexico Public Education Department
Appendix B. Raw Score, Scale Score, and IRT SEM
Table B.1 Raw Score, Scale Score, SEM, and Scale Score ± 1 SEM (English Grade 3 Math)
Raw Score Scale Score (SS)
Standard Error
(SEM) SS - 1SEM SS + 1SEM
0 399 64 335 463
1 442 36 406 478
2 467 26 441 493
3 483 21 462 504
4 494 19 475 513
5 503 17 486 520
6 511 16 495 527
7 518 15 503 533
8 524 14 510 538
9 529 13 516 542
10 534 13 521 547
11 539 12 527 551
12 543 12 531 555
13 547 12 535 559
14 551 11 540 562
15 554 11 543 565
16 558 11 547 569
17 561 11 550 572
18 564 10 554 574
19 567 10 557 577
20 570 10 560 580
21 573 10 563 583
22 576 10 566 586
23 579 10 569 589
24 581 9 572 590
25 584 9 575 593
26 586 9 577 595
27 589 9 580 598
28 591 9 582 600
29 594 9 585 603
30 596 9 587 605
31 598 9 589 607
32 600 9 591 609
33 602 9 593 611
34 605 9 596 614
35 607 9 598 616
36 609 9 600 618
37 611 9 602 620
38 613 9 604 622
39 615 9 606 624
40 617 9 608 626
41 620 9 611 629
42 622 9 613 631
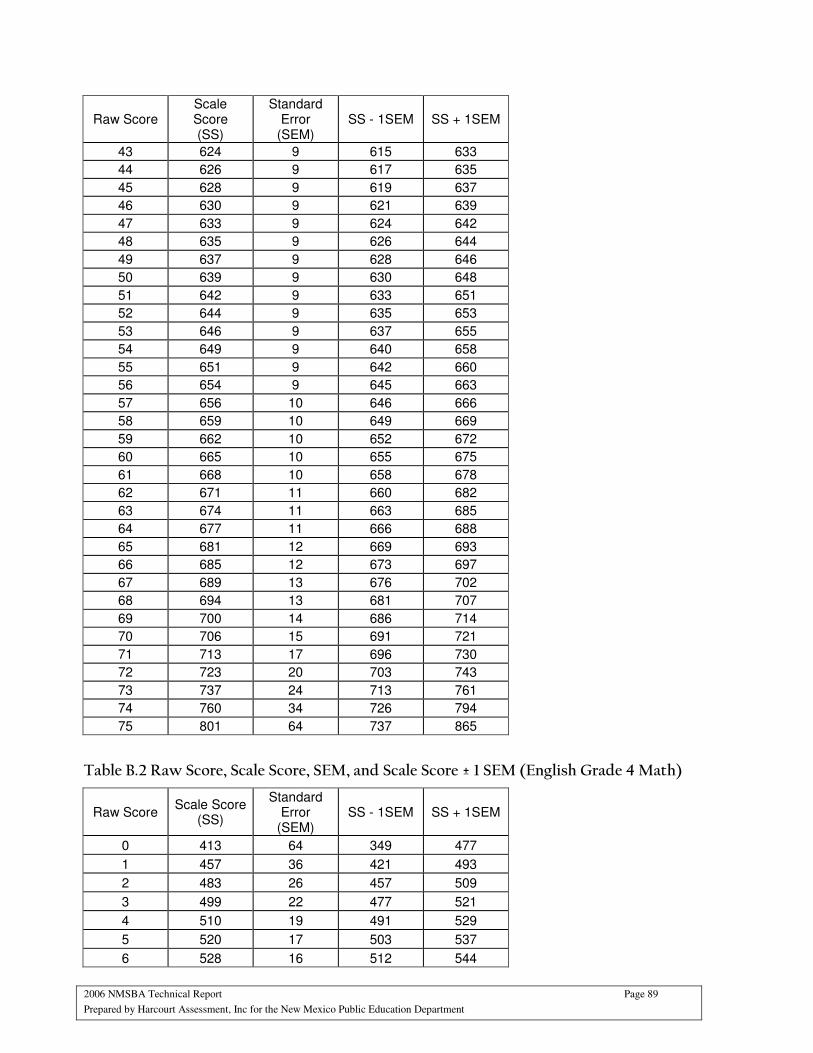
2006 NMSBA Technical Report Page 89
Prepared by Harcourt Assessment, Inc for the New Mexico Public Education Department
Raw Score Scale Score (SS)
Standard Error
(SEM) SS - 1SEM SS + 1SEM
43 624 9 615 633
44 626 9 617 635
45 628 9 619 637
46 630 9 621 639
47 633 9 624 642
48 635 9 626 644
49 637 9 628 646
50 639 9 630 648
51 642 9 633 651
52 644 9 635 653
53 646 9 637 655
54 649 9 640 658
55 651 9 642 660
56 654 9 645 663
57 656 10 646 666
58 659 10 649 669
59 662 10 652 672
60 665 10 655 675
61 668 10 658 678
62 671 11 660 682
63 674 11 663 685
64 677 11 666 688
65 681 12 669 693
66 685 12 673 697
67 689 13 676 702
68 694 13 681 707
69 700 14 686 714
70 706 15 691 721
71 713 17 696 730
72 723 20 703 743
73 737 24 713 761
74 760 34 726 794
75 801 64 737 865
Table B.2 Raw Score, Scale Score, SEM, and Scale Score ± 1 SEM (English Grade 4 Math)
Raw Score Scale Score
(SS)
Standard Error
(SEM) SS - 1SEM SS + 1SEM
0 413 64 349 477
1 457 36 421 493
2 483 26 457 509
3 499 22 477 521
4 510 19 491 529
5 520 17 503 537
6 528 16 512 544
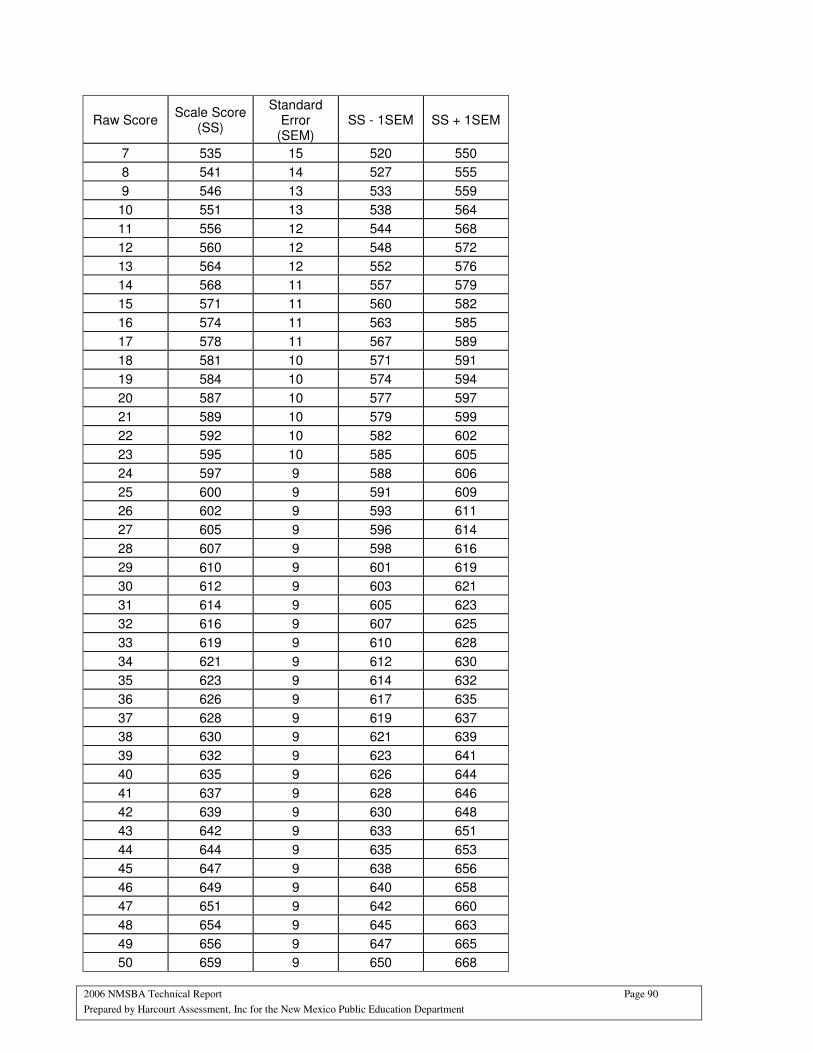
2006 NMSBA Technical Report Page 90
Prepared by Harcourt Assessment, Inc for the New Mexico Public Education Department
Raw Score Scale Score
(SS)
Standard Error
(SEM) SS - 1SEM SS + 1SEM
7 535 15 520 550
8 541 14 527 555
9 546 13 533 559
10 551 13 538 564
11 556 12 544 568
12 560 12 548 572
13 564 12 552 576
14 568 11 557 579
15 571 11 560 582
16 574 11 563 585
17 578 11 567 589
18 581 10 571 591
19 584 10 574 594
20 587 10 577 597
21 589 10 579 599
22 592 10 582 602
23 595 10 585 605
24 597 9 588 606
25 600 9 591 609
26 602 9 593 611
27 605 9 596 614
28 607 9 598 616
29 610 9 601 619
30 612 9 603 621
31 614 9 605 623
32 616 9 607 625
33 619 9 610 628
34 621 9 612 630
35 623 9 614 632
36 626 9 617 635
37 628 9 619 637
38 630 9 621 639
39 632 9 623 641
40 635 9 626 644
41 637 9 628 646
42 639 9 630 648
43 642 9 633 651
44 644 9 635 653
45 647 9 638 656
46 649 9 640 658
47 651 9 642 660
48 654 9 645 663
49 656 9 647 665
50 659 9 650 668

2006 NMSBA Technical Report Page 91
Prepared by Harcourt Assessment, Inc for the New Mexico Public Education Department
Raw Score Scale Score
(SS)
Standard Error
(SEM) SS - 1SEM SS + 1SEM
51 662 10 652 672
52 664 10 654 674
53 667 10 657 677
54 669 10 659 679
55 672 10 662 682
56 675 10 665 685
57 678 10 668 688
58 681 10 671 691
59 684 10 674 694
60 686 10 676 696
61 690 10 680 700
62 693 10 683 703
63 696 11 685 707
64 699 11 688 710
65 702 11 691 713
66 706 11 695 717
67 710 11 699 721
68 713 12 701 725
69 718 12 706 730
70 722 13 709 735
71 727 13 714 740
72 732 14 718 746
73 739 16 723 755
74 747 17 730 764
75 757 20 737 777
76 771 25 746 796
77 795 35 760 830
78 837 64 773 901
Table B.3 Raw Score, Scale Score, SEM, and Scale Score ± 1 SEM (English Grade 5 Math)
Raw Score Scale Score (SS)
Standard Error
(SEM) SS - 1SEM SS + 1SEM
0 436 64 372 500
1 480 36 444 516
2 505 26 479 531
3 521 21 500 542
4 532 19 513 551
5 541 17 524 558
6 549 16 533 565
7 556 15 541 571
8 561 14 547 575
9 567 13 554 580
10 571 13 558 584
11 576 12 564 588
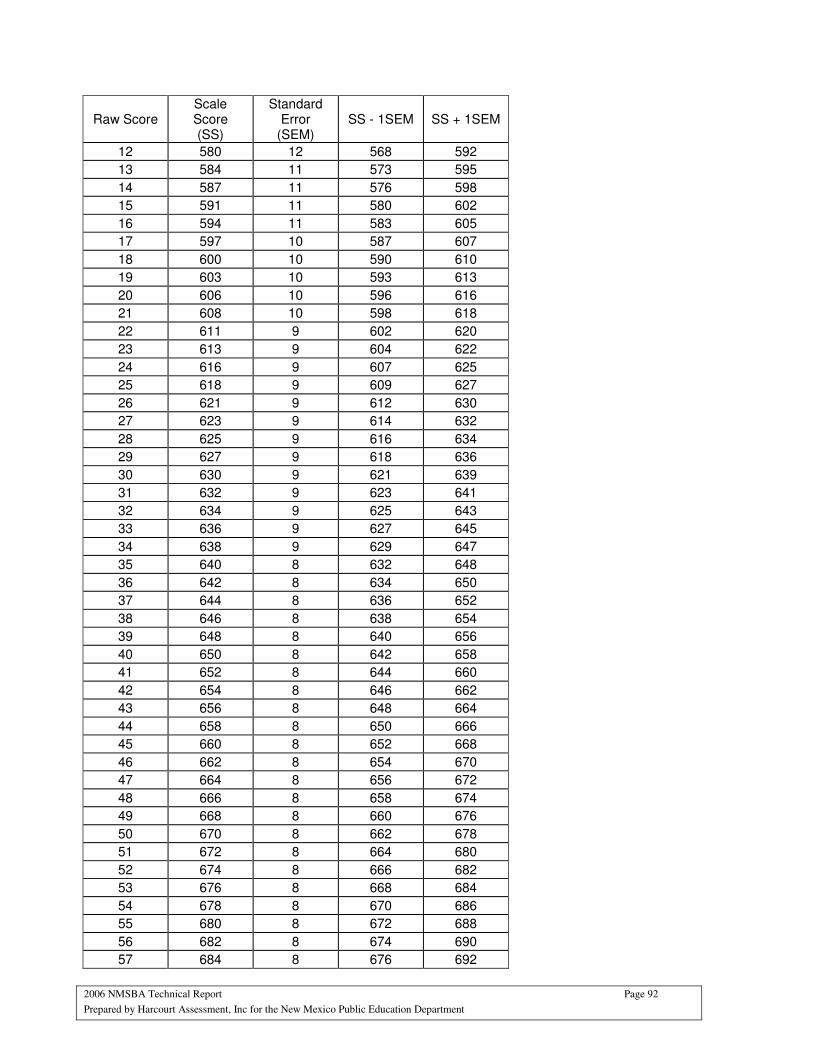
2006 NMSBA Technical Report Page 92
Prepared by Harcourt Assessment, Inc for the New Mexico Public Education Department
Raw Score Scale Score (SS)
Standard Error
(SEM) SS - 1SEM SS + 1SEM
12 580 12 568 592
13 584 11 573 595
14 587 11 576 598
15 591 11 580 602
16 594 11 583 605
17 597 10 587 607
18 600 10 590 610
19 603 10 593 613
20 606 10 596 616
21 608 10 598 618
22 611 9 602 620
23 613 9 604 622
24 616 9 607 625
25 618 9 609 627
26 621 9 612 630
27 623 9 614 632
28 625 9 616 634
29 627 9 618 636
30 630 9 621 639
31 632 9 623 641
32 634 9 625 643
33 636 9 627 645
34 638 9 629 647
35 640 8 632 648
36 642 8 634 650
37 644 8 636 652
38 646 8 638 654
39 648 8 640 656
40 650 8 642 658
41 652 8 644 660
42 654 8 646 662
43 656 8 648 664
44 658 8 650 666
45 660 8 652 668
46 662 8 654 670
47 664 8 656 672
48 666 8 658 674
49 668 8 660 676
50 670 8 662 678
51 672 8 664 680
52 674 8 666 682
53 676 8 668 684
54 678 8 670 686
55 680 8 672 688
56 682 8 674 690
57 684 8 676 692
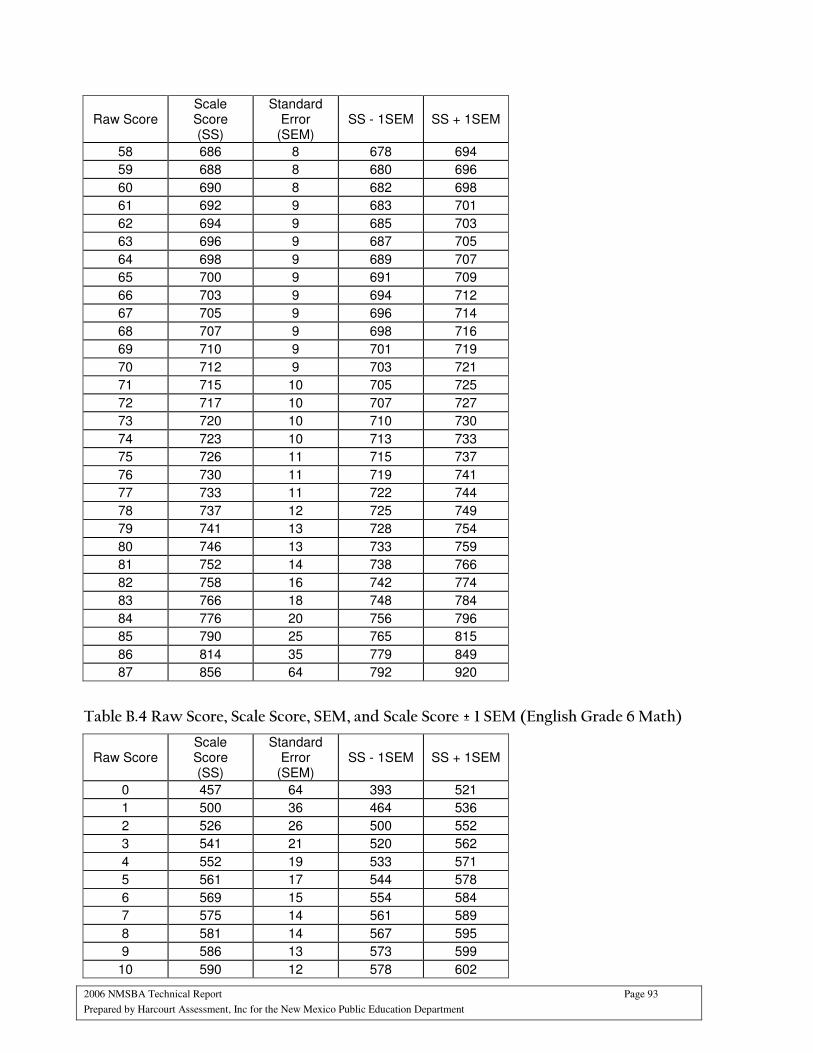
2006 NMSBA Technical Report Page 93
Prepared by Harcourt Assessment, Inc for the New Mexico Public Education Department
Raw Score Scale Score (SS)
Standard Error
(SEM) SS - 1SEM SS + 1SEM
58 686 8 678 694
59 688 8 680 696
60 690 8 682 698
61 692 9 683 701
62 694 9 685 703
63 696 9 687 705
64 698 9 689 707
65 700 9 691 709
66 703 9 694 712
67 705 9 696 714
68 707 9 698 716
69 710 9 701 719
70 712 9 703 721
71 715 10 705 725
72 717 10 707 727
73 720 10 710 730
74 723 10 713 733
75 726 11 715 737
76 730 11 719 741
77 733 11 722 744
78 737 12 725 749
79 741 13 728 754
80 746 13 733 759
81 752 14 738 766
82 758 16 742 774
83 766 18 748 784
84 776 20 756 796
85 790 25 765 815
86 814 35 779 849
87 856 64 792 920
Table B.4 Raw Score, Scale Score, SEM, and Scale Score ± 1 SEM (English Grade 6 Math)
Raw Score Scale Score (SS)
Standard Error
(SEM) SS - 1SEM SS + 1SEM
0 457 64 393 521
1 500 36 464 536
2 526 26 500 552
3 541 21 520 562
4 552 19 533 571
5 561 17 544 578
6 569 15 554 584
7 575 14 561 589
8 581 14 567 595
9 586 13 573 599
10 590 12 578 602

2006 NMSBA Technical Report Page 94
Prepared by Harcourt Assessment, Inc for the New Mexico Public Education Department
Raw Score Scale Score (SS)
Standard Error
(SEM) SS - 1SEM SS + 1SEM
11 595 12 583 607
12 599 12 587 611
13 602 11 591 613
14 606 11 595 617
15 609 11 598 620
16 612 10 602 622
17 615 10 605 625
18 618 10 608 628
19 621 10 611 631
20 623 9 614 632
21 626 9 617 635
22 628 9 619 637
23 631 9 622 640
24 633 9 624 642
25 635 9 626 644
26 637 9 628 646
27 639 9 630 648
28 641 8 633 649
29 644 8 636 652
30 646 8 638 654
31 647 8 639 655
32 649 8 641 657
33 651 8 643 659
34 653 8 645 661
35 655 8 647 663
36 657 8 649 665
37 659 8 651 667
38 660 8 652 668
39 662 8 654 670
40 664 8 656 672
41 666 8 658 674
42 667 8 659 675
43 669 8 661 677
44 671 8 663 679
45 672 8 664 680
46 674 8 666 682
47 676 8 668 684
48 678 8 670 686
49 679 8 671 687
50 681 8 673 689
51 683 8 675 691
52 684 8 676 692
53 686 8 678 694
54 688 8 680 696
55 689 8 681 697
56 691 8 683 699
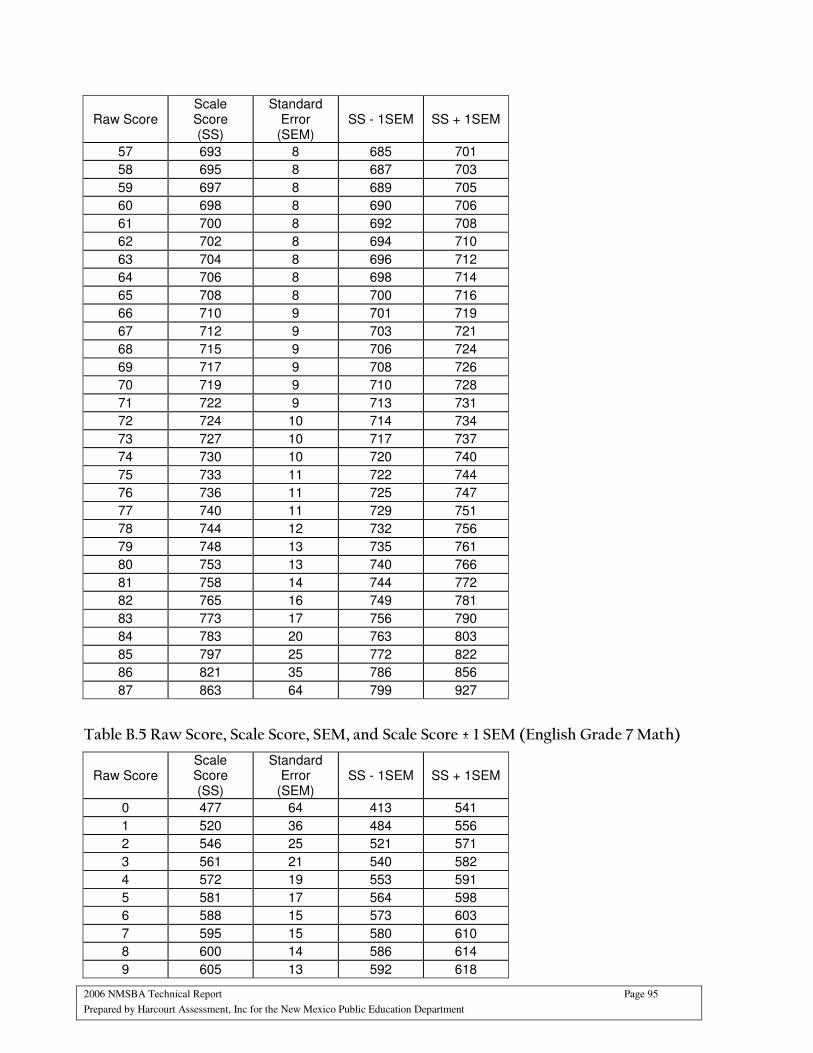
2006 NMSBA Technical Report Page 95
Prepared by Harcourt Assessment, Inc for the New Mexico Public Education Department
Raw Score Scale Score (SS)
Standard Error
(SEM) SS - 1SEM SS + 1SEM
57 693 8 685 701
58 695 8 687 703
59 697 8 689 705
60 698 8 690 706
61 700 8 692 708
62 702 8 694 710
63 704 8 696 712
64 706 8 698 714
65 708 8 700 716
66 710 9 701 719
67 712 9 703 721
68 715 9 706 724
69 717 9 708 726
70 719 9 710 728
71 722 9 713 731
72 724 10 714 734
73 727 10 717 737
74 730 10 720 740
75 733 11 722 744
76 736 11 725 747
77 740 11 729 751
78 744 12 732 756
79 748 13 735 761
80 753 13 740 766
81 758 14 744 772
82 765 16 749 781
83 773 17 756 790
84 783 20 763 803
85 797 25 772 822
86 821 35 786 856
87 863 64 799 927
Table B.5 Raw Score, Scale Score, SEM, and Scale Score ± 1 SEM (English Grade 7 Math)
Raw Score Scale Score (SS)
Standard Error
(SEM) SS - 1SEM SS + 1SEM
0 477 64 413 541
1 520 36 484 556
2 546 25 521 571
3 561 21 540 582
4 572 19 553 591
5 581 17 564 598
6 588 15 573 603
7 595 15 580 610
8 600 14 586 614
9 605 13 592 618

2006 NMSBA Technical Report Page 96
Prepared by Harcourt Assessment, Inc for the New Mexico Public Education Department
Raw Score Scale Score (SS)
Standard Error
(SEM) SS - 1SEM SS + 1SEM
10 610 13 597 623
11 615 12 603 627
12 619 12 607 631
13 622 11 611 633
14 626 11 615 637
15 629 11 618 640
16 633 11 622 644
17 636 10 626 646
18 639 10 629 649
19 641 10 631 651
20 644 10 634 654
21 647 10 637 657
22 649 9 640 658
23 652 9 643 661
24 654 9 645 663
25 657 9 648 666
26 659 9 650 668
27 661 9 652 670
28 664 9 655 673
29 666 9 657 675
30 668 9 659 677
31 670 8 662 678
32 672 8 664 680
33 674 8 666 682
34 676 8 668 684
35 678 8 670 686
36 679 8 671 687
37 681 8 673 689
38 683 8 675 691
39 685 8 677 693
40 687 8 679 695
41 688 8 680 696
42 690 8 682 698
43 692 8 684 700
44 693 8 685 701
45 695 8 687 703
46 697 7 690 704
47 698 7 691 705
48 700 7 693 707
49 701 7 694 708
50 703 7 696 710
51 704 7 697 711
52 706 7 699 713
53 708 7 701 715
54 709 7 702 716
55 711 7 704 718
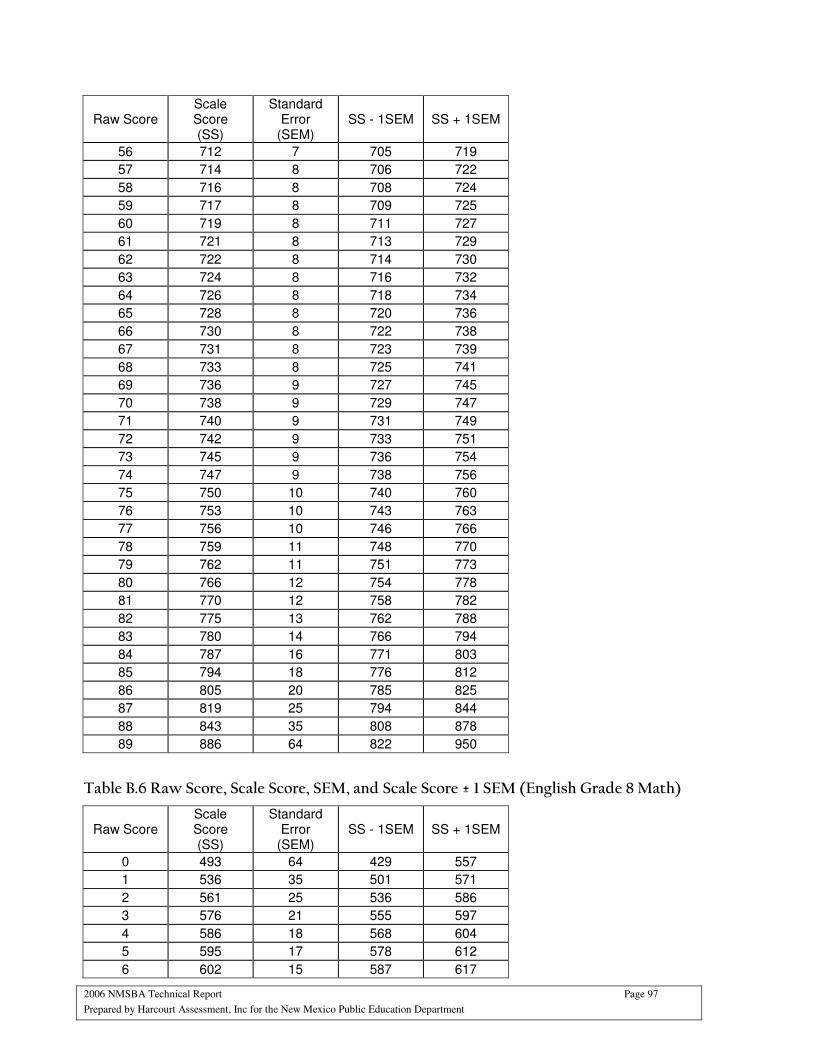
2006 NMSBA Technical Report Page 97
Prepared by Harcourt Assessment, Inc for the New Mexico Public Education Department
Raw Score Scale Score (SS)
Standard Error
(SEM) SS - 1SEM SS + 1SEM
56 712 7 705 719
57 714 8 706 722
58 716 8 708 724
59 717 8 709 725
60 719 8 711 727
61 721 8 713 729
62 722 8 714 730
63 724 8 716 732
64 726 8 718 734
65 728 8 720 736
66 730 8 722 738
67 731 8 723 739
68 733 8 725 741
69 736 9 727 745
70 738 9 729 747
71 740 9 731 749
72 742 9 733 751
73 745 9 736 754
74 747 9 738 756
75 750 10 740 760
76 753 10 743 763
77 756 10 746 766
78 759 11 748 770
79 762 11 751 773
80 766 12 754 778
81 770 12 758 782
82 775 13 762 788
83 780 14 766 794
84 787 16 771 803
85 794 18 776 812
86 805 20 785 825
87 819 25 794 844
88 843 35 808 878
89 886 64 822 950
Table B.6 Raw Score, Scale Score, SEM, and Scale Score ± 1 SEM (English Grade 8 Math)
Raw Score Scale Score (SS)
Standard Error
(SEM) SS - 1SEM SS + 1SEM
0 493 64 429 557
1 536 35 501 571
2 561 25 536 586
3 576 21 555 597
4 586 18 568 604
5 595 17 578 612
6 602 15 587 617
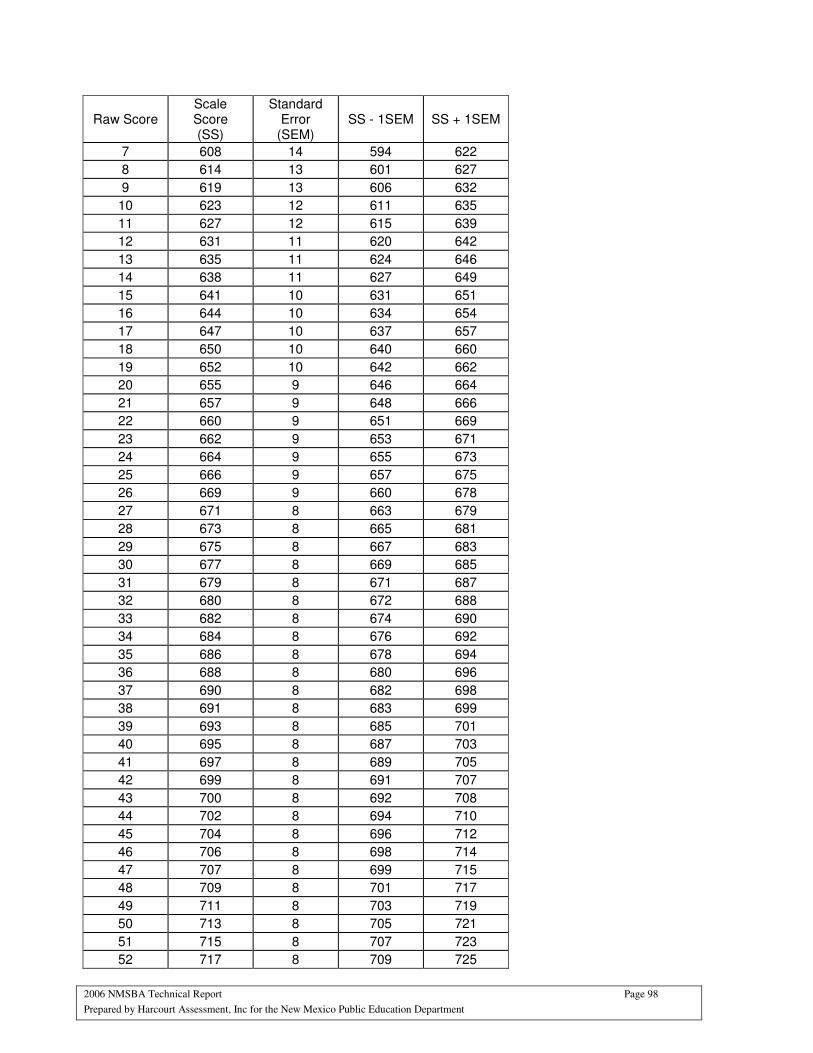
2006 NMSBA Technical Report Page 98
Prepared by Harcourt Assessment, Inc for the New Mexico Public Education Department
Raw Score Scale Score (SS)
Standard Error
(SEM) SS - 1SEM SS + 1SEM
7 608 14 594 622
8 614 13 601 627
9 619 13 606 632
10 623 12 611 635
11 627 12 615 639
12 631 11 620 642
13 635 11 624 646
14 638 11 627 649
15 641 10 631 651
16 644 10 634 654
17 647 10 637 657
18 650 10 640 660
19 652 10 642 662
20 655 9 646 664
21 657 9 648 666
22 660 9 651 669
23 662 9 653 671
24 664 9 655 673
25 666 9 657 675
26 669 9 660 678
27 671 8 663 679
28 673 8 665 681
29 675 8 667 683
30 677 8 669 685
31 679 8 671 687
32 680 8 672 688
33 682 8 674 690
34 684 8 676 692
35 686 8 678 694
36 688 8 680 696
37 690 8 682 698
38 691 8 683 699
39 693 8 685 701
40 695 8 687 703
41 697 8 689 705
42 699 8 691 707
43 700 8 692 708
44 702 8 694 710
45 704 8 696 712
46 706 8 698 714
47 707 8 699 715
48 709 8 701 717
49 711 8 703 719
50 713 8 705 721
51 715 8 707 723
52 717 8 709 725
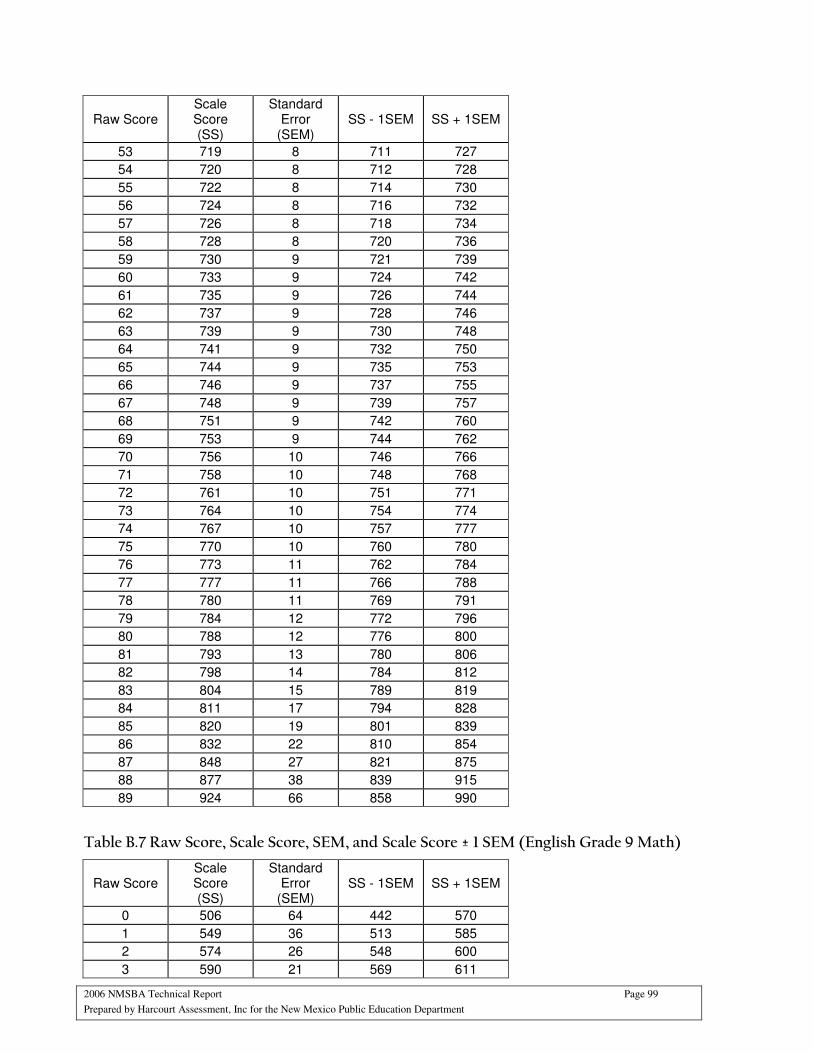
2006 NMSBA Technical Report Page 99
Prepared by Harcourt Assessment, Inc for the New Mexico Public Education Department
Raw Score Scale Score (SS)
Standard Error
(SEM) SS - 1SEM SS + 1SEM
53 719 8 711 727
54 720 8 712 728
55 722 8 714 730
56 724 8 716 732
57 726 8 718 734
58 728 8 720 736
59 730 9 721 739
60 733 9 724 742
61 735 9 726 744
62 737 9 728 746
63 739 9 730 748
64 741 9 732 750
65 744 9 735 753
66 746 9 737 755
67 748 9 739 757
68 751 9 742 760
69 753 9 744 762
70 756 10 746 766
71 758 10 748 768
72 761 10 751 771
73 764 10 754 774
74 767 10 757 777
75 770 10 760 780
76 773 11 762 784
77 777 11 766 788
78 780 11 769 791
79 784 12 772 796
80 788 12 776 800
81 793 13 780 806
82 798 14 784 812
83 804 15 789 819
84 811 17 794 828
85 820 19 801 839
86 832 22 810 854
87 848 27 821 875
88 877 38 839 915
89 924 66 858 990
Table B.7 Raw Score, Scale Score, SEM, and Scale Score ± 1 SEM (English Grade 9 Math)
Raw Score Scale Score (SS)
Standard Error
(SEM) SS - 1SEM SS + 1SEM
0 506 64 442 570
1 549 36 513 585
2 574 26 548 600
3 590 21 569 611
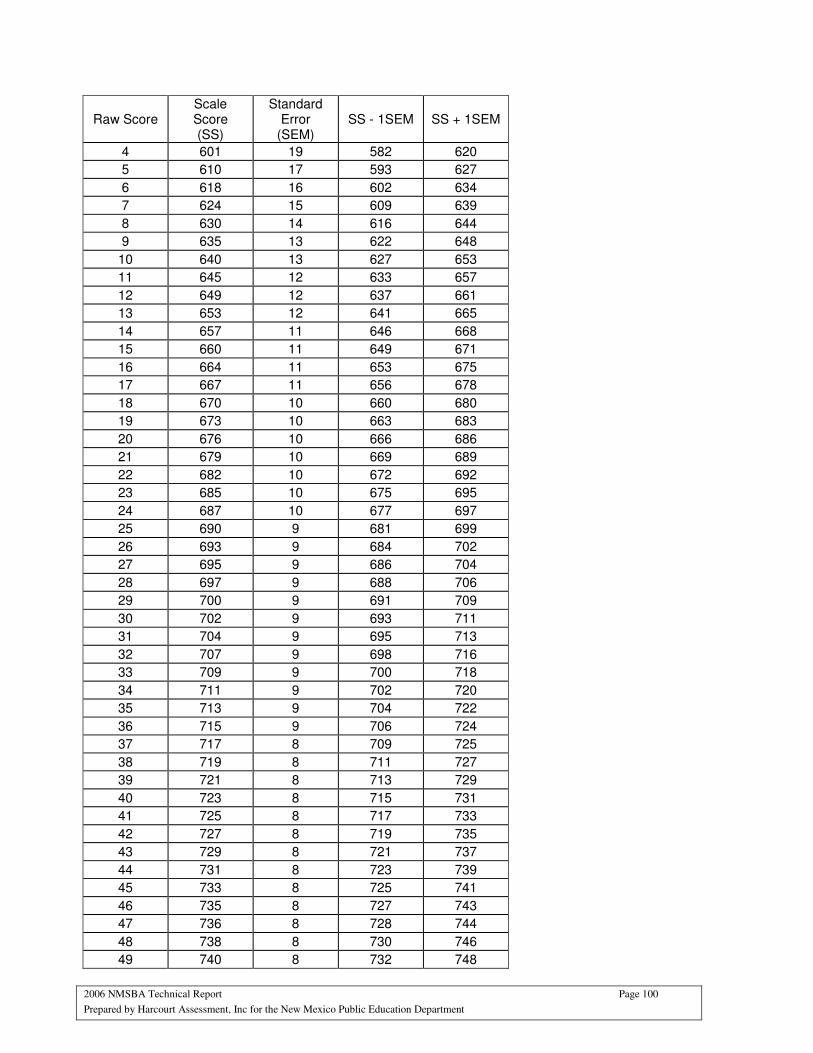
2006 NMSBA Technical Report Page 100
Prepared by Harcourt Assessment, Inc for the New Mexico Public Education Department
Raw Score Scale Score (SS)
Standard Error
(SEM) SS - 1SEM SS + 1SEM
4 601 19 582 620
5 610 17 593 627
6 618 16 602 634
7 624 15 609 639
8 630 14 616 644
9 635 13 622 648
10 640 13 627 653
11 645 12 633 657
12 649 12 637 661
13 653 12 641 665
14 657 11 646 668
15 660 11 649 671
16 664 11 653 675
17 667 11 656 678
18 670 10 660 680
19 673 10 663 683
20 676 10 666 686
21 679 10 669 689
22 682 10 672 692
23 685 10 675 695
24 687 10 677 697
25 690 9 681 699
26 693 9 684 702
27 695 9 686 704
28 697 9 688 706
29 700 9 691 709
30 702 9 693 711
31 704 9 695 713
32 707 9 698 716
33 709 9 700 718
34 711 9 702 720
35 713 9 704 722
36 715 9 706 724
37 717 8 709 725
38 719 8 711 727
39 721 8 713 729
40 723 8 715 731
41 725 8 717 733
42 727 8 719 735
43 729 8 721 737
44 731 8 723 739
45 733 8 725 741
46 735 8 727 743
47 736 8 728 744
48 738 8 730 746
49 740 8 732 748
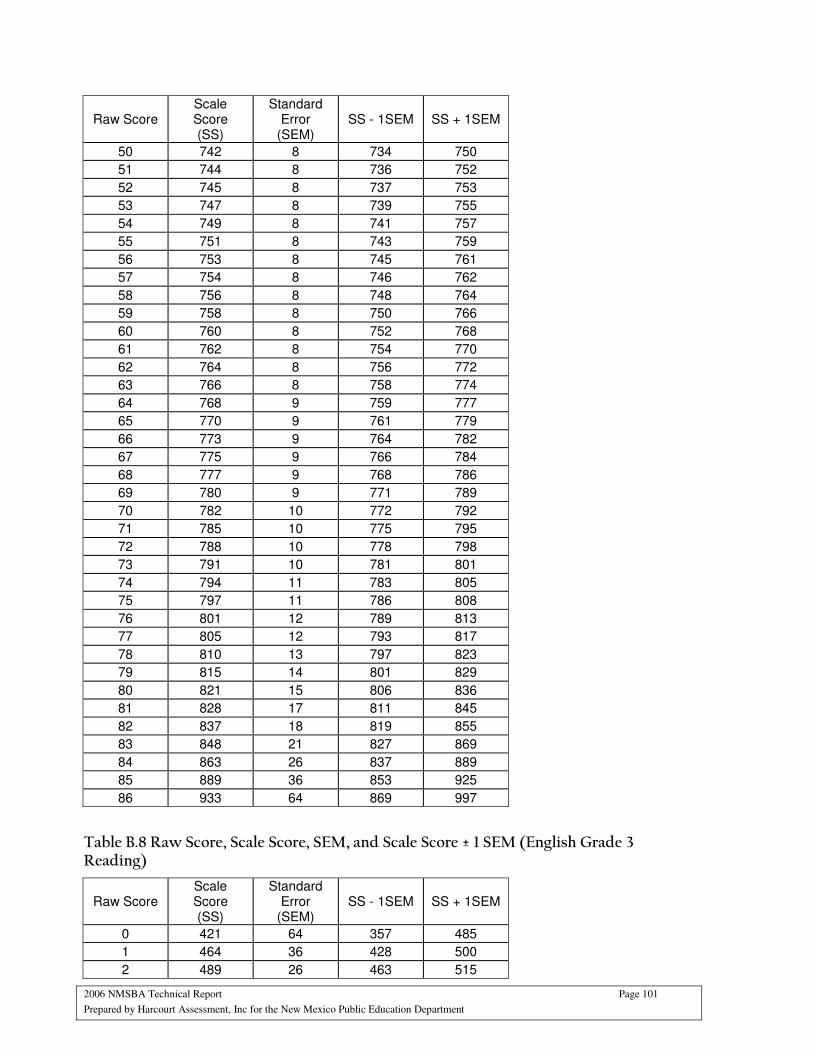
2006 NMSBA Technical Report Page 101
Prepared by Harcourt Assessment, Inc for the New Mexico Public Education Department
Raw Score Scale Score (SS)
Standard Error
(SEM) SS - 1SEM SS + 1SEM
50 742 8 734 750
51 744 8 736 752
52 745 8 737 753
53 747 8 739 755
54 749 8 741 757
55 751 8 743 759
56 753 8 745 761
57 754 8 746 762
58 756 8 748 764
59 758 8 750 766
60 760 8 752 768
61 762 8 754 770
62 764 8 756 772
63 766 8 758 774
64 768 9 759 777
65 770 9 761 779
66 773 9 764 782
67 775 9 766 784
68 777 9 768 786
69 780 9 771 789
70 782 10 772 792
71 785 10 775 795
72 788 10 778 798
73 791 10 781 801
74 794 11 783 805
75 797 11 786 808
76 801 12 789 813
77 805 12 793 817
78 810 13 797 823
79 815 14 801 829
80 821 15 806 836
81 828 17 811 845
82 837 18 819 855
83 848 21 827 869
84 863 26 837 889
85 889 36 853 925
86 933 64 869 997
Table B.8 Raw Score, Scale Score, SEM, and Scale Score ± 1 SEM (English Grade 3 Reading)
Raw Score Scale Score (SS)
Standard Error
(SEM) SS - 1SEM SS + 1SEM
0 421 64 357 485
1 464 36 428 500
2 489 26 463 515

2006 NMSBA Technical Report Page 102
Prepared by Harcourt Assessment, Inc for the New Mexico Public Education Department
Raw Score Scale Score (SS)
Standard Error
(SEM) SS - 1SEM SS + 1SEM
3 504 21 483 525
4 515 19 496 534
5 524 17 507 541
6 532 15 517 547
7 538 14 524 552
8 544 14 530 558
9 549 13 536 562
10 553 12 541 565
11 558 12 546 570
12 562 12 550 574
13 565 11 554 576
14 569 11 558 580
15 572 11 561 583
16 576 10 566 586
17 579 10 569 589
18 582 10 572 592
19 585 10 575 595
20 587 10 577 597
21 590 10 580 600
22 593 10 583 603
23 595 9 586 604
24 598 9 589 607
25 600 9 591 609
26 602 9 593 611
27 605 9 596 614
28 607 9 598 616
29 609 9 600 618
30 612 9 603 621
31 614 9 605 623
32 616 9 607 625
33 618 9 609 627
34 620 9 611 629
35 623 9 614 632
36 625 9 616 634
37 627 9 618 636
38 629 9 620 638
39 631 9 622 640
40 634 9 625 643
41 636 9 627 645
42 638 9 629 647
43 640 9 631 649
44 643 9 634 652
45 645 9 636 654
46 648 9 639 657
47 650 10 640 660
48 653 10 643 663
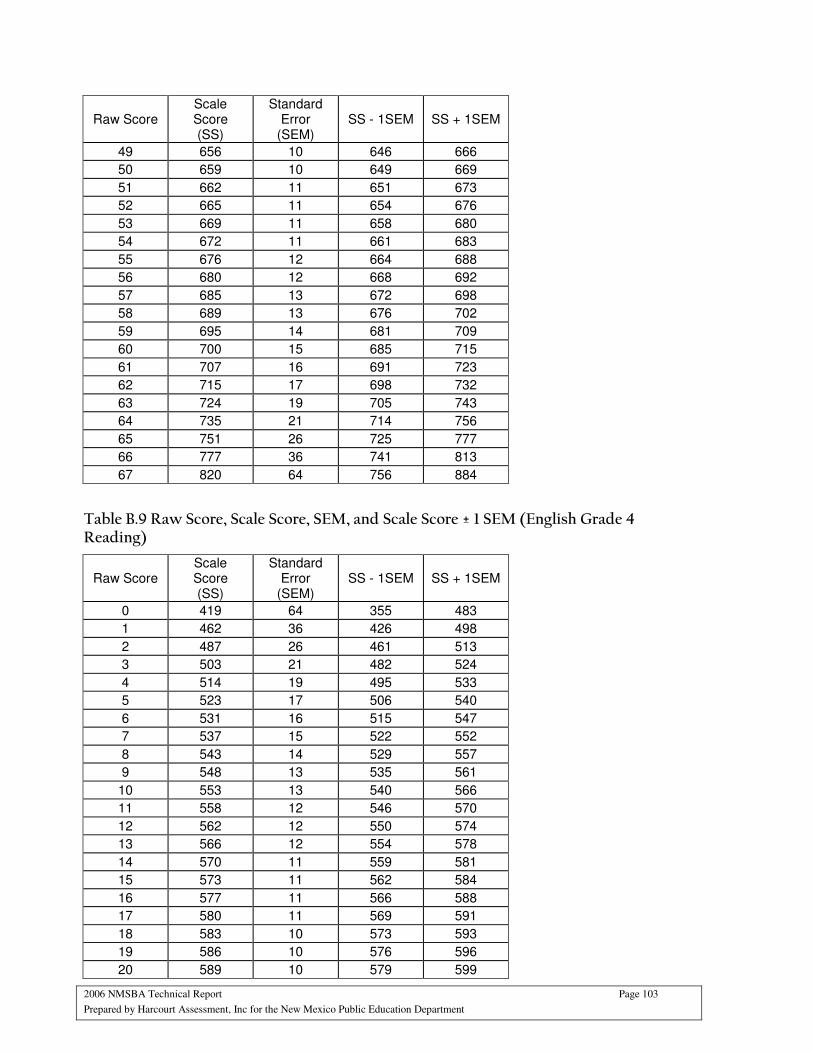
2006 NMSBA Technical Report Page 103
Prepared by Harcourt Assessment, Inc for the New Mexico Public Education Department
Raw Score Scale Score (SS)
Standard Error
(SEM) SS - 1SEM SS + 1SEM
49 656 10 646 666
50 659 10 649 669
51 662 11 651 673
52 665 11 654 676
53 669 11 658 680
54 672 11 661 683
55 676 12 664 688
56 680 12 668 692
57 685 13 672 698
58 689 13 676 702
59 695 14 681 709
60 700 15 685 715
61 707 16 691 723
62 715 17 698 732
63 724 19 705 743
64 735 21 714 756
65 751 26 725 777
66 777 36 741 813
67 820 64 756 884
Table B.9 Raw Score, Scale Score, SEM, and Scale Score ± 1 SEM (English Grade 4 Reading)
Raw Score Scale Score (SS)
Standard Error
(SEM) SS - 1SEM SS + 1SEM
0 419 64 355 483
1 462 36 426 498
2 487 26 461 513
3 503 21 482 524
4 514 19 495 533
5 523 17 506 540
6 531 16 515 547
7 537 15 522 552
8 543 14 529 557
9 548 13 535 561
10 553 13 540 566
11 558 12 546 570
12 562 12 550 574
13 566 12 554 578
14 570 11 559 581
15 573 11 562 584
16 577 11 566 588
17 580 11 569 591
18 583 10 573 593
19 586 10 576 596
20 589 10 579 599
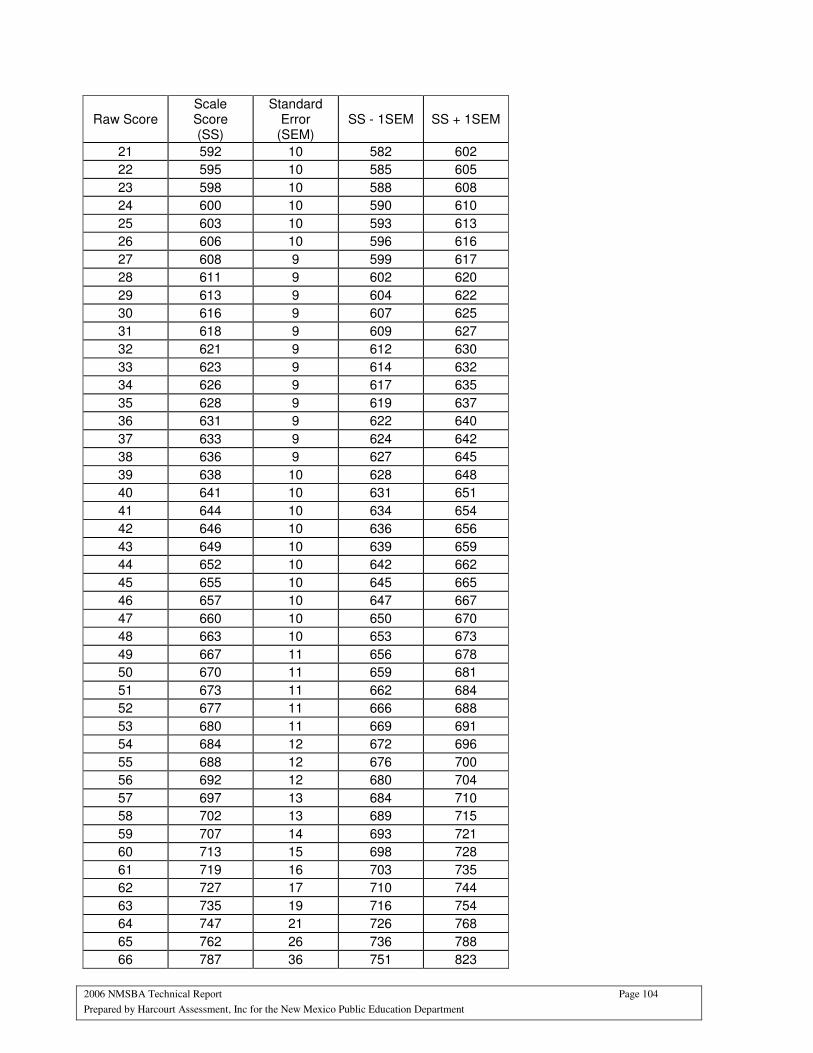
2006 NMSBA Technical Report Page 104
Prepared by Harcourt Assessment, Inc for the New Mexico Public Education Department
Raw Score Scale Score (SS)
Standard Error
(SEM) SS - 1SEM SS + 1SEM
21 592 10 582 602
22 595 10 585 605
23 598 10 588 608
24 600 10 590 610
25 603 10 593 613
26 606 10 596 616
27 608 9 599 617
28 611 9 602 620
29 613 9 604 622
30 616 9 607 625
31 618 9 609 627
32 621 9 612 630
33 623 9 614 632
34 626 9 617 635
35 628 9 619 637
36 631 9 622 640
37 633 9 624 642
38 636 9 627 645
39 638 10 628 648
40 641 10 631 651
41 644 10 634 654
42 646 10 636 656
43 649 10 639 659
44 652 10 642 662
45 655 10 645 665
46 657 10 647 667
47 660 10 650 670
48 663 10 653 673
49 667 11 656 678
50 670 11 659 681
51 673 11 662 684
52 677 11 666 688
53 680 11 669 691
54 684 12 672 696
55 688 12 676 700
56 692 12 680 704
57 697 13 684 710
58 702 13 689 715
59 707 14 693 721
60 713 15 698 728
61 719 16 703 735
62 727 17 710 744
63 735 19 716 754
64 747 21 726 768
65 762 26 736 788
66 787 36 751 823
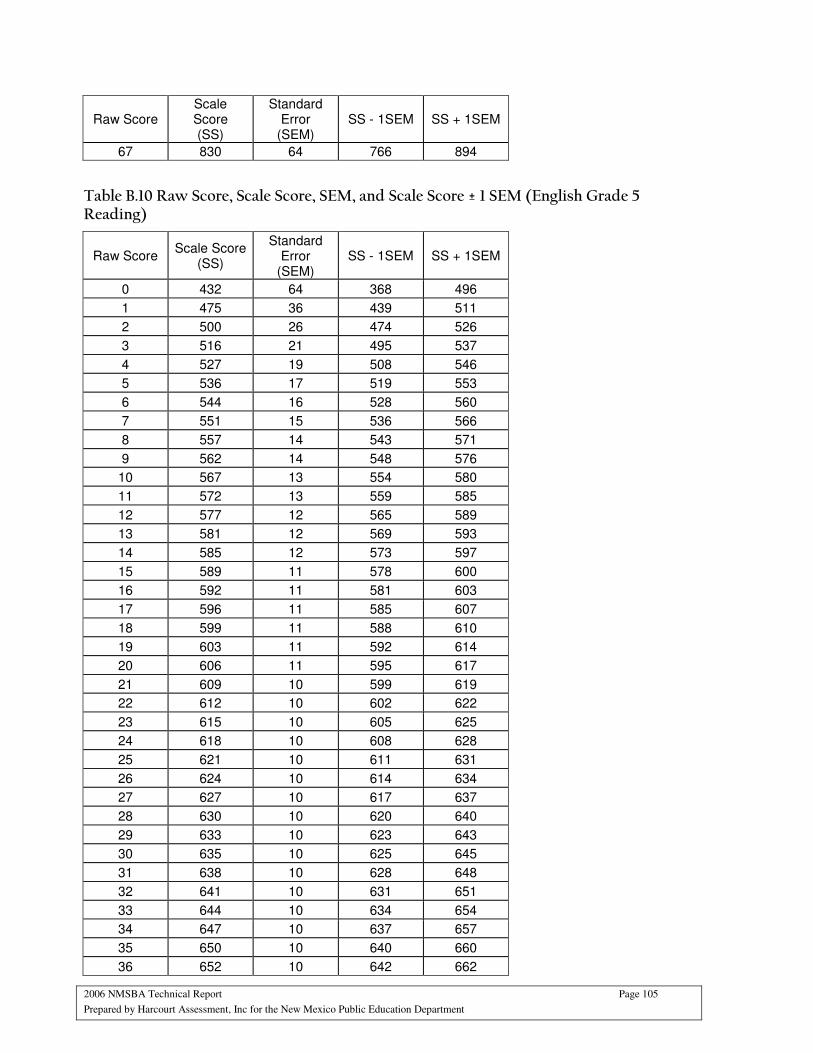
2006 NMSBA Technical Report Page 105
Prepared by Harcourt Assessment, Inc for the New Mexico Public Education Department
Raw Score Scale Score (SS)
Standard Error
(SEM) SS - 1SEM SS + 1SEM
67 830 64 766 894
Table B.10 Raw Score, Scale Score, SEM, and Scale Score ± 1 SEM (English Grade 5 Reading)
Raw Score Scale Score
(SS)
Standard Error
(SEM) SS - 1SEM SS + 1SEM
0 432 64 368 496
1 475 36 439 511
2 500 26 474 526
3 516 21 495 537
4 527 19 508 546
5 536 17 519 553
6 544 16 528 560
7 551 15 536 566
8 557 14 543 571
9 562 14 548 576
10 567 13 554 580
11 572 13 559 585
12 577 12 565 589
13 581 12 569 593
14 585 12 573 597
15 589 11 578 600
16 592 11 581 603
17 596 11 585 607
18 599 11 588 610
19 603 11 592 614
20 606 11 595 617
21 609 10 599 619
22 612 10 602 622
23 615 10 605 625
24 618 10 608 628
25 621 10 611 631
26 624 10 614 634
27 627 10 617 637
28 630 10 620 640
29 633 10 623 643
30 635 10 625 645
31 638 10 628 648
32 641 10 631 651
33 644 10 634 654
34 647 10 637 657
35 650 10 640 660
36 652 10 642 662
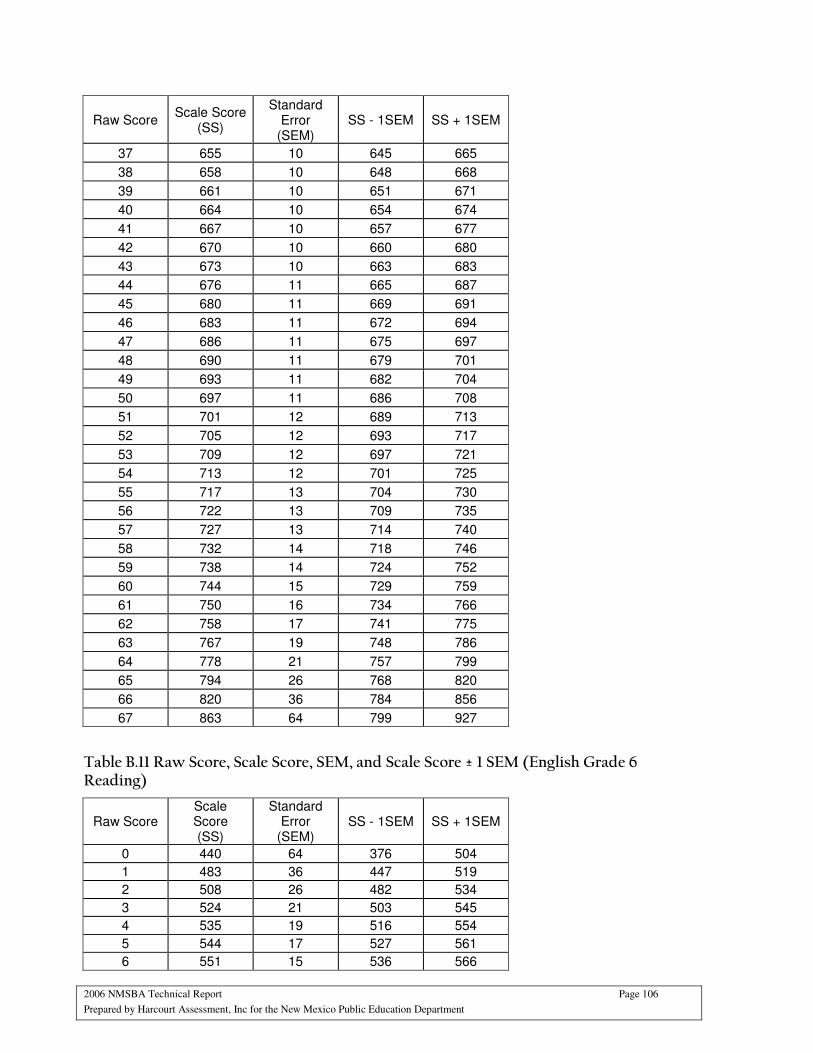
2006 NMSBA Technical Report Page 106
Prepared by Harcourt Assessment, Inc for the New Mexico Public Education Department
Raw Score Scale Score
(SS)
Standard Error
(SEM) SS - 1SEM SS + 1SEM
37 655 10 645 665
38 658 10 648 668
39 661 10 651 671
40 664 10 654 674
41 667 10 657 677
42 670 10 660 680
43 673 10 663 683
44 676 11 665 687
45 680 11 669 691
46 683 11 672 694
47 686 11 675 697
48 690 11 679 701
49 693 11 682 704
50 697 11 686 708
51 701 12 689 713
52 705 12 693 717
53 709 12 697 721
54 713 12 701 725
55 717 13 704 730
56 722 13 709 735
57 727 13 714 740
58 732 14 718 746
59 738 14 724 752
60 744 15 729 759
61 750 16 734 766
62 758 17 741 775
63 767 19 748 786
64 778 21 757 799
65 794 26 768 820
66 820 36 784 856
67 863 64 799 927
Table B.11 Raw Score, Scale Score, SEM, and Scale Score ± 1 SEM (English Grade 6 Reading)
Raw Score Scale Score (SS)
Standard Error
(SEM) SS - 1SEM SS + 1SEM
0 440 64 376 504
1 483 36 447 519
2 508 26 482 534
3 524 21 503 545
4 535 19 516 554
5 544 17 527 561
6 551 15 536 566
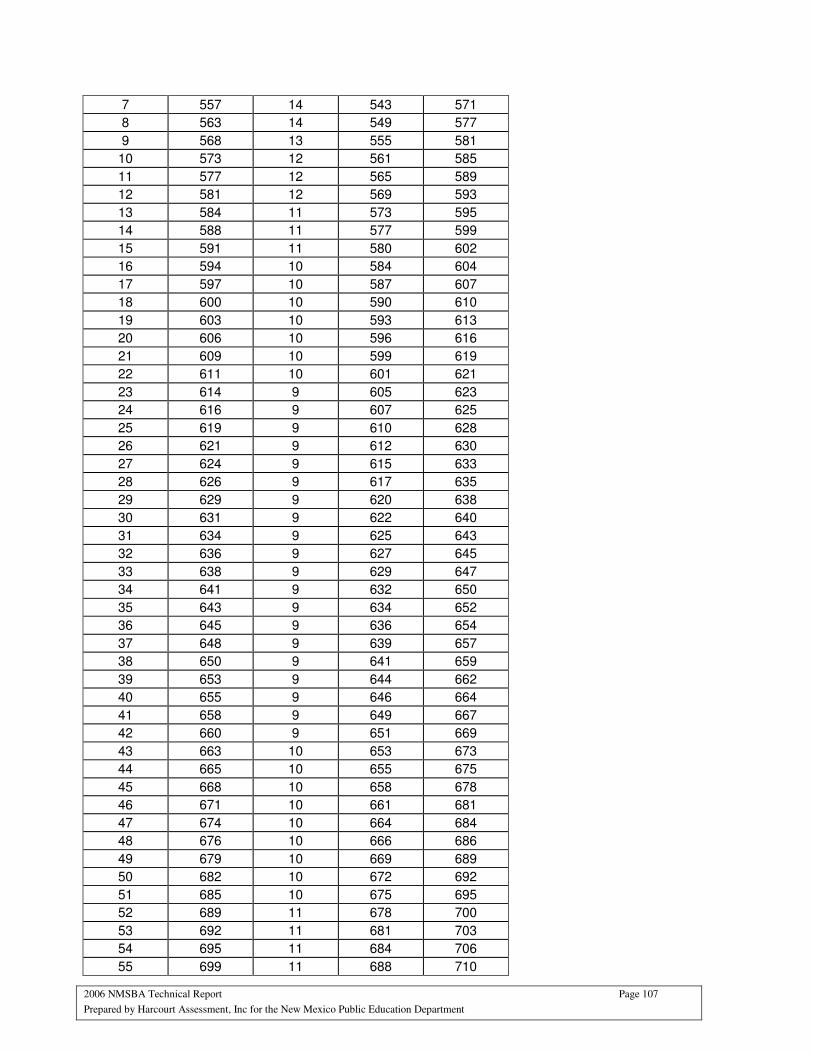
2006 NMSBA Technical Report Page 107
Prepared by Harcourt Assessment, Inc for the New Mexico Public Education Department
7 557 14 543 571
8 563 14 549 577
9 568 13 555 581
10 573 12 561 585
11 577 12 565 589
12 581 12 569 593
13 584 11 573 595
14 588 11 577 599
15 591 11 580 602
16 594 10 584 604
17 597 10 587 607
18 600 10 590 610
19 603 10 593 613
20 606 10 596 616
21 609 10 599 619
22 611 10 601 621
23 614 9 605 623
24 616 9 607 625
25 619 9 610 628
26 621 9 612 630
27 624 9 615 633
28 626 9 617 635
29 629 9 620 638
30 631 9 622 640
31 634 9 625 643
32 636 9 627 645
33 638 9 629 647
34 641 9 632 650
35 643 9 634 652
36 645 9 636 654
37 648 9 639 657
38 650 9 641 659
39 653 9 644 662
40 655 9 646 664
41 658 9 649 667
42 660 9 651 669
43 663 10 653 673
44 665 10 655 675
45 668 10 658 678
46 671 10 661 681
47 674 10 664 684
48 676 10 666 686
49 679 10 669 689
50 682 10 672 692
51 685 10 675 695
52 689 11 678 700
53 692 11 681 703
54 695 11 684 706
55 699 11 688 710
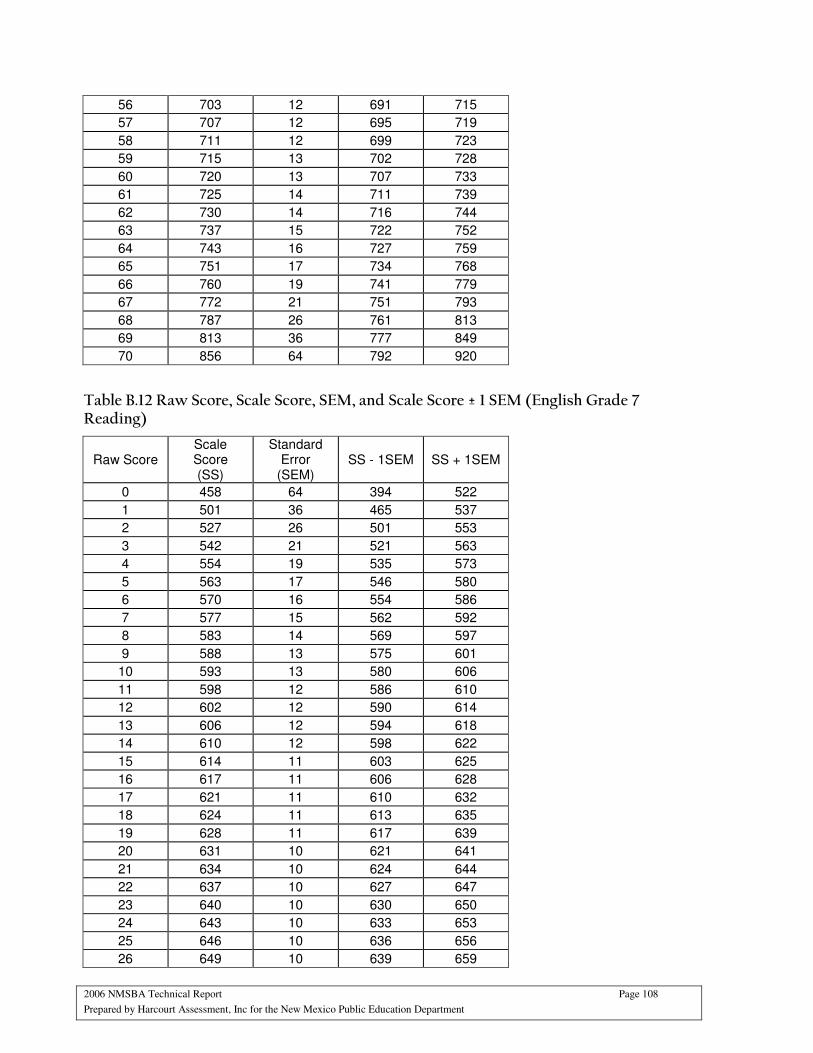
2006 NMSBA Technical Report Page 108
Prepared by Harcourt Assessment, Inc for the New Mexico Public Education Department
56 703 12 691 715
57 707 12 695 719
58 711 12 699 723
59 715 13 702 728
60 720 13 707 733
61 725 14 711 739
62 730 14 716 744
63 737 15 722 752
64 743 16 727 759
65 751 17 734 768
66 760 19 741 779
67 772 21 751 793
68 787 26 761 813
69 813 36 777 849
70 856 64 792 920
Table B.12 Raw Score, Scale Score, SEM, and Scale Score ± 1 SEM (English Grade 7 Reading)
Raw Score Scale Score (SS)
Standard Error
(SEM) SS - 1SEM SS + 1SEM
0 458 64 394 522
1 501 36 465 537
2 527 26 501 553
3 542 21 521 563
4 554 19 535 573
5 563 17 546 580
6 570 16 554 586
7 577 15 562 592
8 583 14 569 597
9 588 13 575 601
10 593 13 580 606
11 598 12 586 610
12 602 12 590 614
13 606 12 594 618
14 610 12 598 622
15 614 11 603 625
16 617 11 606 628
17 621 11 610 632
18 624 11 613 635
19 628 11 617 639
20 631 10 621 641
21 634 10 624 644
22 637 10 627 647
23 640 10 630 650
24 643 10 633 653
25 646 10 636 656
26 649 10 639 659
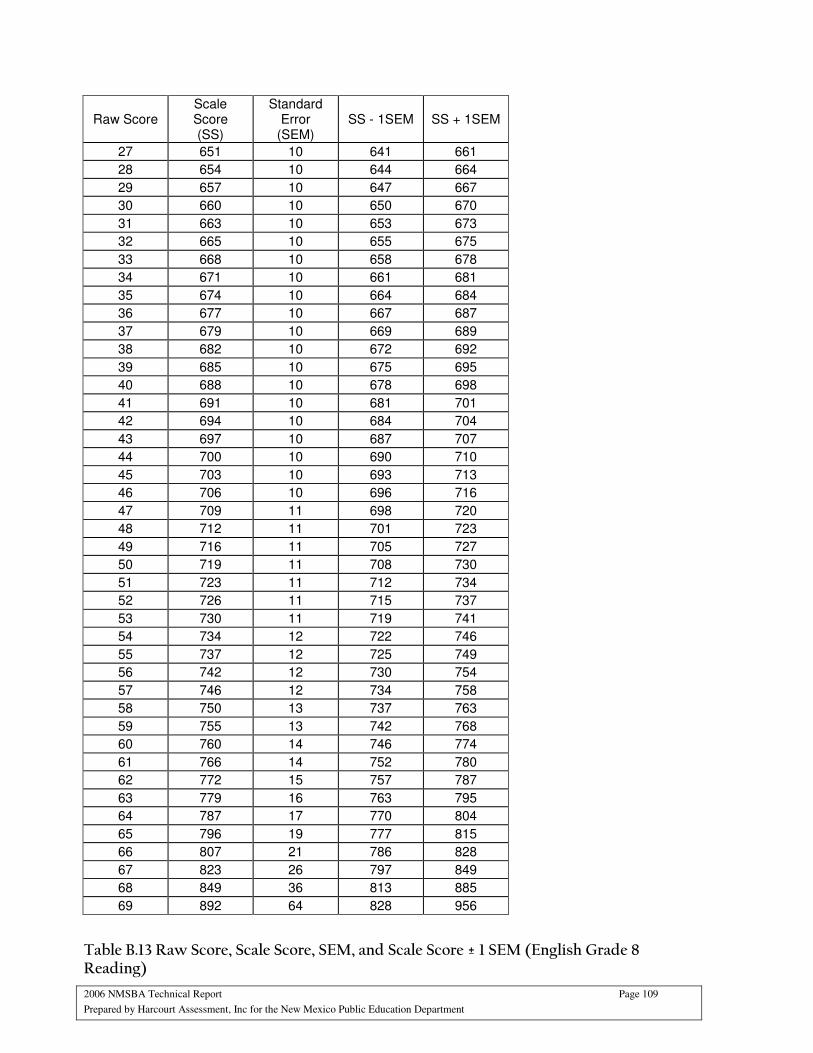
2006 NMSBA Technical Report Page 109
Prepared by Harcourt Assessment, Inc for the New Mexico Public Education Department
Raw Score Scale Score (SS)
Standard Error
(SEM) SS - 1SEM SS + 1SEM
27 651 10 641 661
28 654 10 644 664
29 657 10 647 667
30 660 10 650 670
31 663 10 653 673
32 665 10 655 675
33 668 10 658 678
34 671 10 661 681
35 674 10 664 684
36 677 10 667 687
37 679 10 669 689
38 682 10 672 692
39 685 10 675 695
40 688 10 678 698
41 691 10 681 701
42 694 10 684 704
43 697 10 687 707
44 700 10 690 710
45 703 10 693 713
46 706 10 696 716
47 709 11 698 720
48 712 11 701 723
49 716 11 705 727
50 719 11 708 730
51 723 11 712 734
52 726 11 715 737
53 730 11 719 741
54 734 12 722 746
55 737 12 725 749
56 742 12 730 754
57 746 12 734 758
58 750 13 737 763
59 755 13 742 768
60 760 14 746 774
61 766 14 752 780
62 772 15 757 787
63 779 16 763 795
64 787 17 770 804
65 796 19 777 815
66 807 21 786 828
67 823 26 797 849
68 849 36 813 885
69 892 64 828 956
Table B.13 Raw Score, Scale Score, SEM, and Scale Score ± 1 SEM (English Grade 8 Reading)

2006 NMSBA Technical Report Page 110
Prepared by Harcourt Assessment, Inc for the New Mexico Public Education Department
Raw Score Scale Score (SS)
Standard Error
(SEM) SS - 1SEM SS + 1SEM
0 462 64 398 526
1 505 36 469 541
2 531 26 505 557
3 547 22 525 569
4 558 19 539 577
5 568 17 551 585
6 576 16 560 592
7 583 15 568 598
8 589 14 575 603
9 595 14 581 609
10 600 13 587 613
11 605 13 592 618
12 610 13 597 623
13 614 12 602 626
14 618 12 606 630
15 623 12 611 635
16 626 12 614 638
17 630 11 619 641
18 634 11 623 645
19 637 11 626 648
20 641 11 630 652
21 644 11 633 655
22 647 11 636 658
23 651 11 640 662
24 654 10 644 664
25 657 10 647 667
26 660 10 650 670
27 663 10 653 673
28 666 10 656 676
29 669 10 659 679
30 671 10 661 681
31 674 10 664 684
32 677 10 667 687
33 680 10 670 690
34 683 10 673 693
35 685 10 675 695
36 688 10 678 698
37 691 10 681 701
38 693 10 683 703
39 696 10 686 706
40 699 10 689 709
41 702 10 692 712
42 704 10 694 714
43 707 10 697 717
44 710 10 700 720
45 713 10 703 723
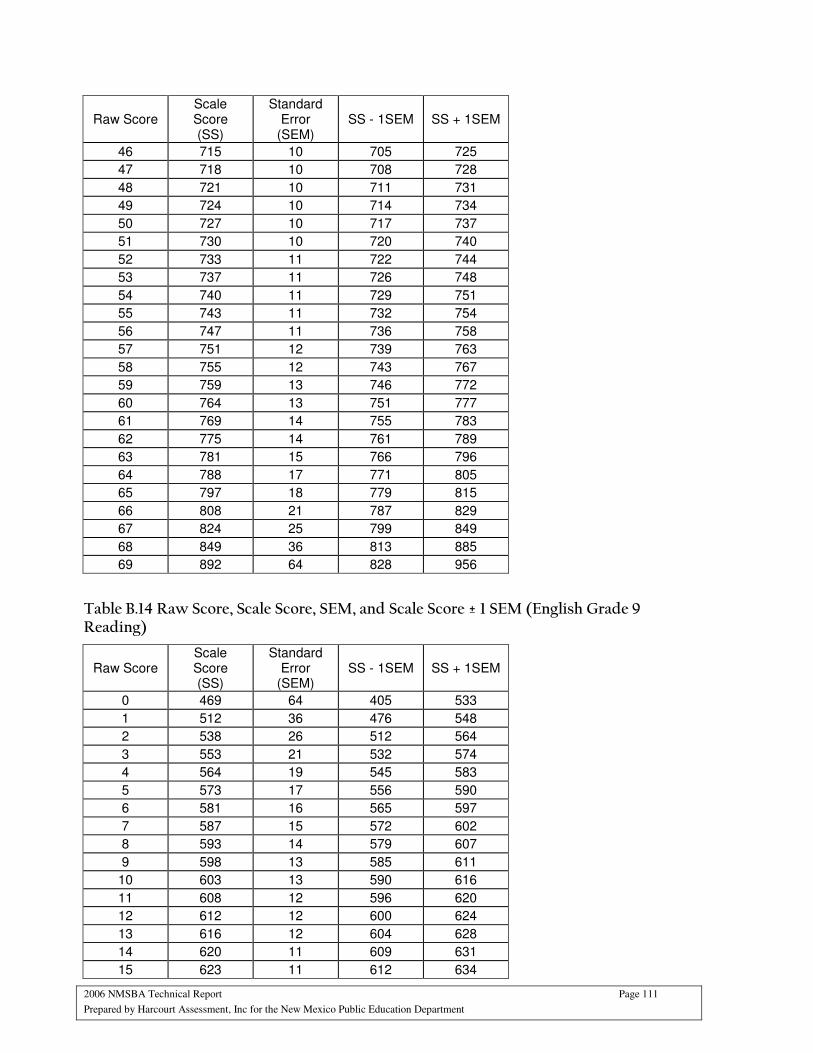
2006 NMSBA Technical Report Page 111
Prepared by Harcourt Assessment, Inc for the New Mexico Public Education Department
Raw Score Scale Score (SS)
Standard Error
(SEM) SS - 1SEM SS + 1SEM
46 715 10 705 725
47 718 10 708 728
48 721 10 711 731
49 724 10 714 734
50 727 10 717 737
51 730 10 720 740
52 733 11 722 744
53 737 11 726 748
54 740 11 729 751
55 743 11 732 754
56 747 11 736 758
57 751 12 739 763
58 755 12 743 767
59 759 13 746 772
60 764 13 751 777
61 769 14 755 783
62 775 14 761 789
63 781 15 766 796
64 788 17 771 805
65 797 18 779 815
66 808 21 787 829
67 824 25 799 849
68 849 36 813 885
69 892 64 828 956
Table B.14 Raw Score, Scale Score, SEM, and Scale Score ± 1 SEM (English Grade 9 Reading)
Raw Score Scale Score (SS)
Standard Error
(SEM) SS - 1SEM SS + 1SEM
0 469 64 405 533
1 512 36 476 548
2 538 26 512 564
3 553 21 532 574
4 564 19 545 583
5 573 17 556 590
6 581 16 565 597
7 587 15 572 602
8 593 14 579 607
9 598 13 585 611
10 603 13 590 616
11 608 12 596 620
12 612 12 600 624
13 616 12 604 628
14 620 11 609 631
15 623 11 612 634

2006 NMSBA Technical Report Page 112
Prepared by Harcourt Assessment, Inc for the New Mexico Public Education Department
Raw Score Scale Score (SS)
Standard Error
(SEM) SS - 1SEM SS + 1SEM
16 627 11 616 638
17 630 11 619 641
18 633 11 622 644
19 637 11 626 648
20 640 10 630 650
21 643 10 633 653
22 646 10 636 656
23 649 10 639 659
24 652 10 642 662
25 655 10 645 665
26 657 10 647 667
27 660 10 650 670
28 663 10 653 673
29 666 10 656 676
30 668 10 658 678
31 671 10 661 681
32 674 10 664 684
33 677 10 667 687
34 679 10 669 689
35 682 10 672 692
36 685 10 675 695
37 687 10 677 697
38 690 10 680 700
39 693 10 683 703
40 696 10 686 706
41 698 10 688 708
42 701 10 691 711
43 704 10 694 714
44 707 10 697 717
45 709 10 699 719
46 712 10 702 722
47 715 10 705 725
48 718 10 708 728
49 721 10 711 731
50 724 10 714 734
51 727 11 716 738
52 730 11 719 741
53 734 11 723 745
54 737 11 726 748
55 741 11 730 752
56 744 12 732 756
57 748 12 736 760
58 753 12 741 765
59 757 13 744 770
60 762 13 749 775
61 767 14 753 781
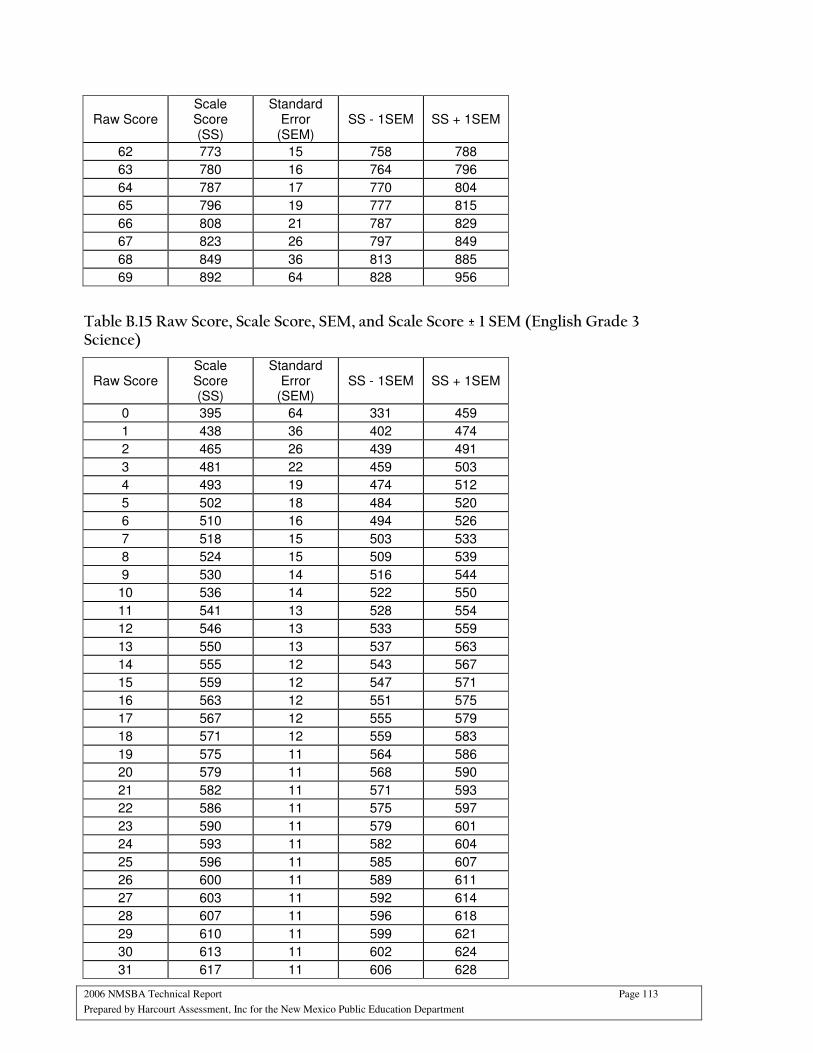
2006 NMSBA Technical Report Page 113
Prepared by Harcourt Assessment, Inc for the New Mexico Public Education Department
Raw Score Scale Score (SS)
Standard Error
(SEM) SS - 1SEM SS + 1SEM
62 773 15 758 788
63 780 16 764 796
64 787 17 770 804
65 796 19 777 815
66 808 21 787 829
67 823 26 797 849
68 849 36 813 885
69 892 64 828 956
Table B.15 Raw Score, Scale Score, SEM, and Scale Score ± 1 SEM (English Grade 3 Science)
Raw Score Scale Score (SS)
Standard Error
(SEM) SS - 1SEM SS + 1SEM
0 395 64 331 459
1 438 36 402 474
2 465 26 439 491
3 481 22 459 503
4 493 19 474 512
5 502 18 484 520
6 510 16 494 526
7 518 15 503 533
8 524 15 509 539
9 530 14 516 544
10 536 14 522 550
11 541 13 528 554
12 546 13 533 559
13 550 13 537 563
14 555 12 543 567
15 559 12 547 571
16 563 12 551 575
17 567 12 555 579
18 571 12 559 583
19 575 11 564 586
20 579 11 568 590
21 582 11 571 593
22 586 11 575 597
23 590 11 579 601
24 593 11 582 604
25 596 11 585 607
26 600 11 589 611
27 603 11 592 614
28 607 11 596 618
29 610 11 599 621
30 613 11 602 624
31 617 11 606 628

2006 NMSBA Technical Report Page 114
Prepared by Harcourt Assessment, Inc for the New Mexico Public Education Department
Raw Score Scale Score (SS)
Standard Error
(SEM) SS - 1SEM SS + 1SEM
32 620 11 609 631
33 623 11 612 634
34 626 11 615 637
35 630 11 619 641
36 633 11 622 644
37 636 11 625 647
38 640 11 629 651
39 643 11 632 654
40 646 11 635 657
41 649 11 638 660
42 653 11 642 664
43 656 11 645 667
44 660 11 649 671
45 663 11 652 674
46 666 11 655 677
47 670 11 659 681
48 674 11 663 685
49 677 11 666 688
50 681 12 669 693
51 685 12 673 697
52 689 12 677 701
53 694 13 681 707
54 698 13 685 711
55 704 14 690 718
56 709 15 694 724
57 716 16 700 732
58 724 17 707 741
59 734 20 714 754
60 747 24 723 771
61 771 34 737 805
62 812 64 748 876
Table B.16 Raw Score, Scale Score, SEM, and Scale Score ± 1 SEM (English Grade 4 Science)
Raw Score Scale Score (SS)
Standard Error
(SEM) SS - 1SEM SS + 1SEM
0 408 64 344 472
1 452 36 416 488
2 477 26 451 503
3 493 22 471 515
4 505 19 486 524
5 514 17 497 531
6 522 16 506 538
7 529 15 514 544
8 536 15 521 551

2006 NMSBA Technical Report Page 115
Prepared by Harcourt Assessment, Inc for the New Mexico Public Education Department
Raw Score Scale Score (SS)
Standard Error
(SEM) SS - 1SEM SS + 1SEM
9 541 14 527 555
10 547 13 534 560
11 552 13 539 565
12 556 13 543 569
13 561 12 549 573
14 565 12 553 577
15 569 12 557 581
16 573 12 561 585
17 577 12 565 589
18 581 11 570 592
19 585 11 574 596
20 588 11 577 599
21 592 11 581 603
22 595 11 584 606
23 598 11 587 609
24 602 11 591 613
25 605 11 594 616
26 608 11 597 619
27 612 11 601 623
28 615 10 605 625
29 618 10 608 628
30 621 10 611 631
31 624 10 614 634
32 627 10 617 637
33 630 10 620 640
34 633 10 623 643
35 636 10 626 646
36 639 10 629 649
37 642 10 632 652
38 645 10 635 655
39 648 10 638 658
40 651 10 641 661
41 654 10 644 664
42 657 11 646 668
43 661 11 650 672
44 664 11 653 675
45 667 11 656 678
46 671 11 660 682
47 675 11 664 686
48 678 12 666 690
49 682 12 670 694
50 687 12 675 699
51 691 13 678 704
52 696 13 683 709
53 701 14 687 715
54 707 14 693 721
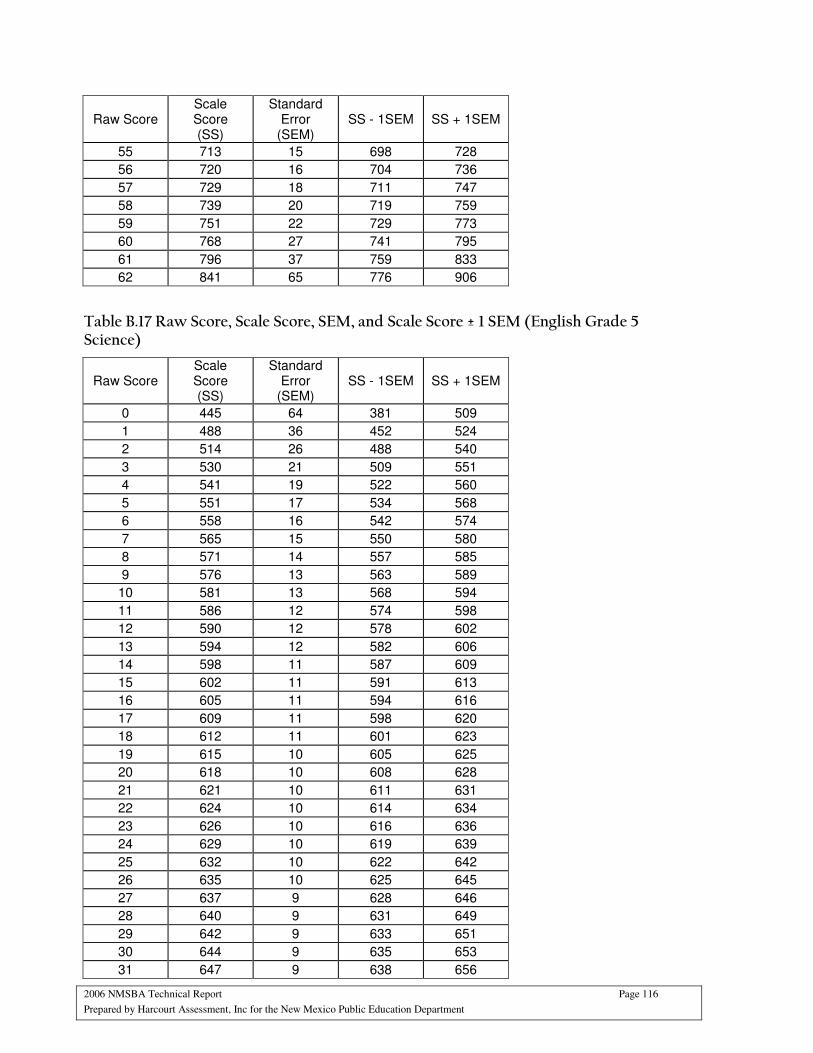
2006 NMSBA Technical Report Page 116
Prepared by Harcourt Assessment, Inc for the New Mexico Public Education Department
Raw Score Scale Score (SS)
Standard Error
(SEM) SS - 1SEM SS + 1SEM
55 713 15 698 728
56 720 16 704 736
57 729 18 711 747
58 739 20 719 759
59 751 22 729 773
60 768 27 741 795
61 796 37 759 833
62 841 65 776 906
Table B.17 Raw Score, Scale Score, SEM, and Scale Score ± 1 SEM (English Grade 5 Science)
Raw Score Scale Score (SS)
Standard Error
(SEM) SS - 1SEM SS + 1SEM
0 445 64 381 509
1 488 36 452 524
2 514 26 488 540
3 530 21 509 551
4 541 19 522 560
5 551 17 534 568
6 558 16 542 574
7 565 15 550 580
8 571 14 557 585
9 576 13 563 589
10 581 13 568 594
11 586 12 574 598
12 590 12 578 602
13 594 12 582 606
14 598 11 587 609
15 602 11 591 613
16 605 11 594 616
17 609 11 598 620
18 612 11 601 623
19 615 10 605 625
20 618 10 608 628
21 621 10 611 631
22 624 10 614 634
23 626 10 616 636
24 629 10 619 639
25 632 10 622 642
26 635 10 625 645
27 637 9 628 646
28 640 9 631 649
29 642 9 633 651
30 644 9 635 653
31 647 9 638 656
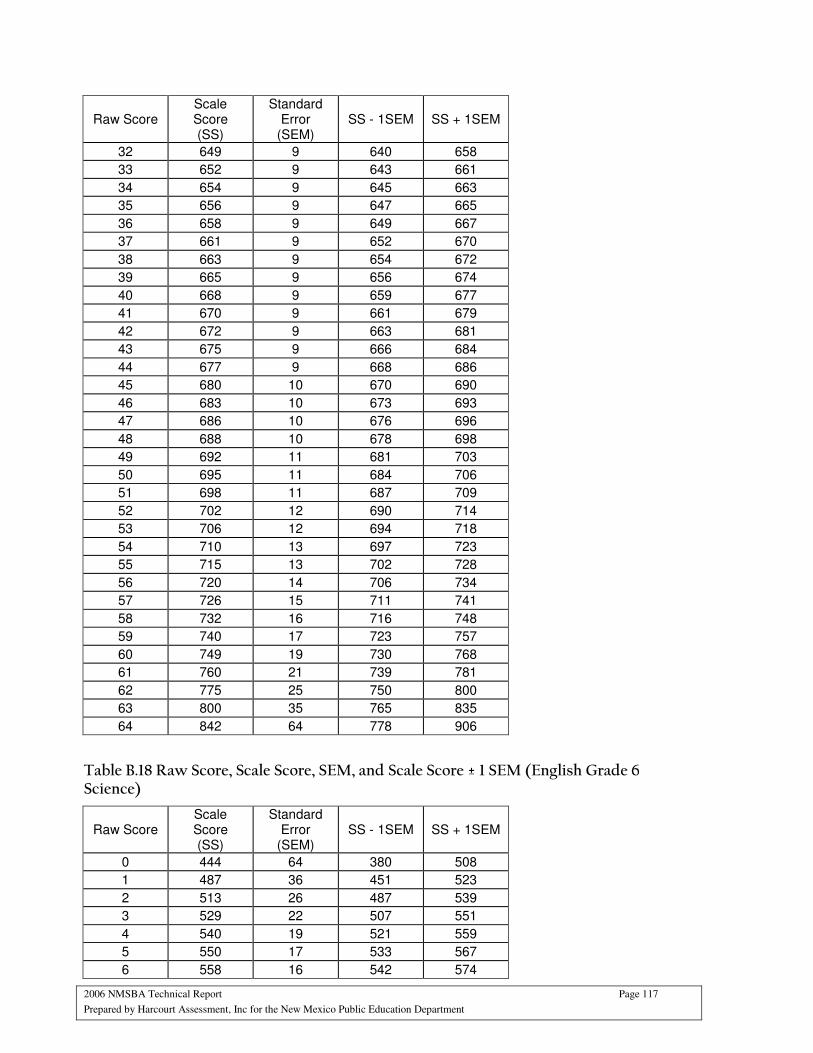
2006 NMSBA Technical Report Page 117
Prepared by Harcourt Assessment, Inc for the New Mexico Public Education Department
Raw Score Scale Score (SS)
Standard Error
(SEM) SS - 1SEM SS + 1SEM
32 649 9 640 658
33 652 9 643 661
34 654 9 645 663
35 656 9 647 665
36 658 9 649 667
37 661 9 652 670
38 663 9 654 672
39 665 9 656 674
40 668 9 659 677
41 670 9 661 679
42 672 9 663 681
43 675 9 666 684
44 677 9 668 686
45 680 10 670 690
46 683 10 673 693
47 686 10 676 696
48 688 10 678 698
49 692 11 681 703
50 695 11 684 706
51 698 11 687 709
52 702 12 690 714
53 706 12 694 718
54 710 13 697 723
55 715 13 702 728
56 720 14 706 734
57 726 15 711 741
58 732 16 716 748
59 740 17 723 757
60 749 19 730 768
61 760 21 739 781
62 775 25 750 800
63 800 35 765 835
64 842 64 778 906
Table B.18 Raw Score, Scale Score, SEM, and Scale Score ± 1 SEM (English Grade 6 Science)
Raw Score Scale Score (SS)
Standard Error
(SEM) SS - 1SEM SS + 1SEM
0 444 64 380 508
1 487 36 451 523
2 513 26 487 539
3 529 22 507 551
4 540 19 521 559
5 550 17 533 567
6 558 16 542 574
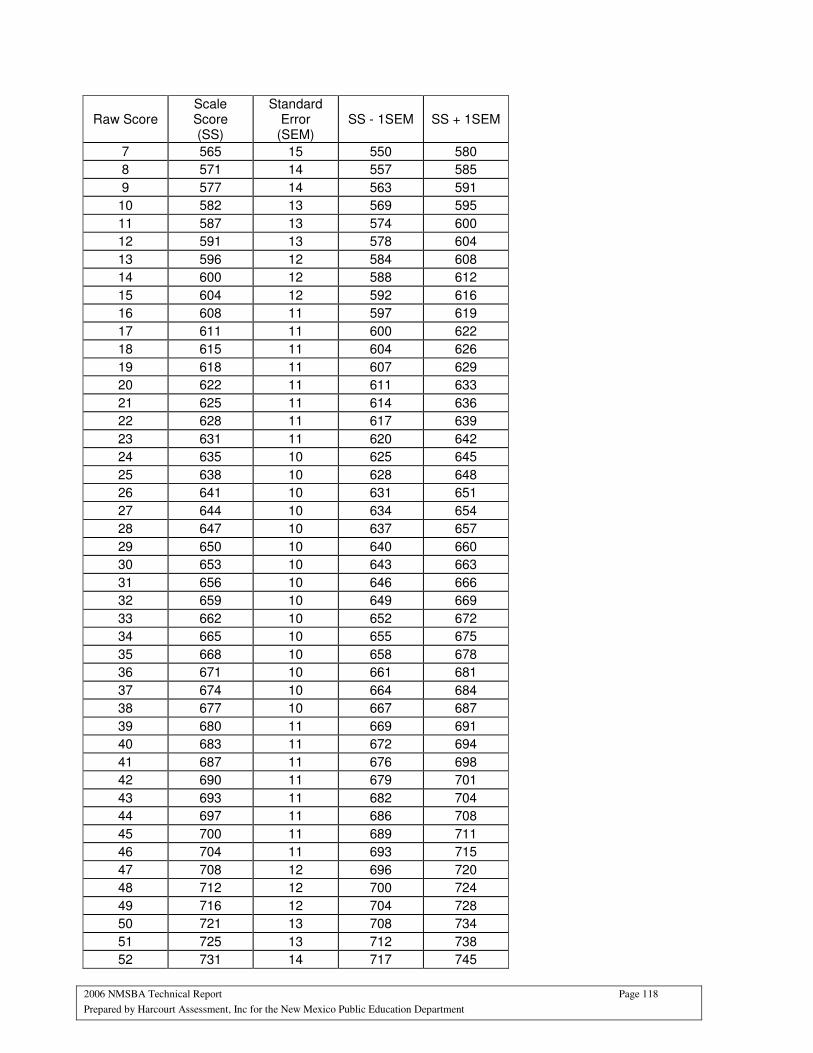
2006 NMSBA Technical Report Page 118
Prepared by Harcourt Assessment, Inc for the New Mexico Public Education Department
Raw Score Scale Score (SS)
Standard Error
(SEM) SS - 1SEM SS + 1SEM
7 565 15 550 580
8 571 14 557 585
9 577 14 563 591
10 582 13 569 595
11 587 13 574 600
12 591 13 578 604
13 596 12 584 608
14 600 12 588 612
15 604 12 592 616
16 608 11 597 619
17 611 11 600 622
18 615 11 604 626
19 618 11 607 629
20 622 11 611 633
21 625 11 614 636
22 628 11 617 639
23 631 11 620 642
24 635 10 625 645
25 638 10 628 648
26 641 10 631 651
27 644 10 634 654
28 647 10 637 657
29 650 10 640 660
30 653 10 643 663
31 656 10 646 666
32 659 10 649 669
33 662 10 652 672
34 665 10 655 675
35 668 10 658 678
36 671 10 661 681
37 674 10 664 684
38 677 10 667 687
39 680 11 669 691
40 683 11 672 694
41 687 11 676 698
42 690 11 679 701
43 693 11 682 704
44 697 11 686 708
45 700 11 689 711
46 704 11 693 715
47 708 12 696 720
48 712 12 700 724
49 716 12 704 728
50 721 13 708 734
51 725 13 712 738
52 731 14 717 745
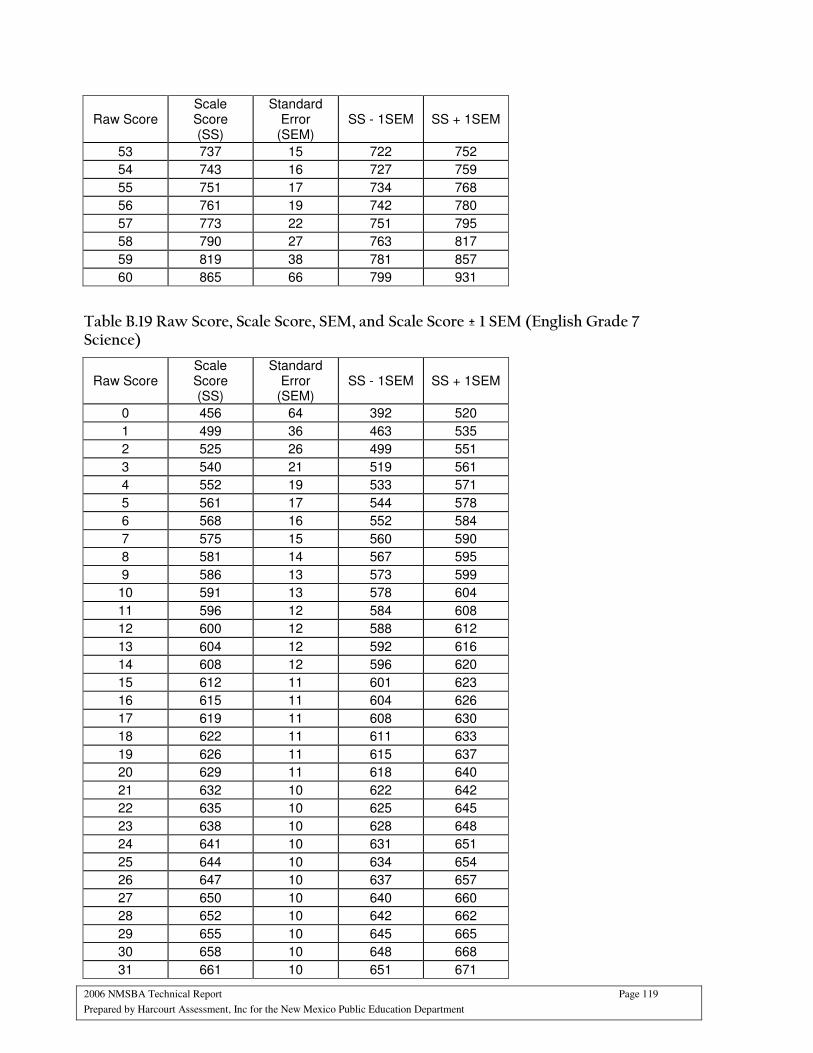
2006 NMSBA Technical Report Page 119
Prepared by Harcourt Assessment, Inc for the New Mexico Public Education Department
Raw Score Scale Score (SS)
Standard Error
(SEM) SS - 1SEM SS + 1SEM
53 737 15 722 752
54 743 16 727 759
55 751 17 734 768
56 761 19 742 780
57 773 22 751 795
58 790 27 763 817
59 819 38 781 857
60 865 66 799 931
Table B.19 Raw Score, Scale Score, SEM, and Scale Score ± 1 SEM (English Grade 7 Science)
Raw Score Scale Score (SS)
Standard Error
(SEM) SS - 1SEM SS + 1SEM
0 456 64 392 520
1 499 36 463 535
2 525 26 499 551
3 540 21 519 561
4 552 19 533 571
5 561 17 544 578
6 568 16 552 584
7 575 15 560 590
8 581 14 567 595
9 586 13 573 599
10 591 13 578 604
11 596 12 584 608
12 600 12 588 612
13 604 12 592 616
14 608 12 596 620
15 612 11 601 623
16 615 11 604 626
17 619 11 608 630
18 622 11 611 633
19 626 11 615 637
20 629 11 618 640
21 632 10 622 642
22 635 10 625 645
23 638 10 628 648
24 641 10 631 651
25 644 10 634 654
26 647 10 637 657
27 650 10 640 660
28 652 10 642 662
29 655 10 645 665
30 658 10 648 668
31 661 10 651 671
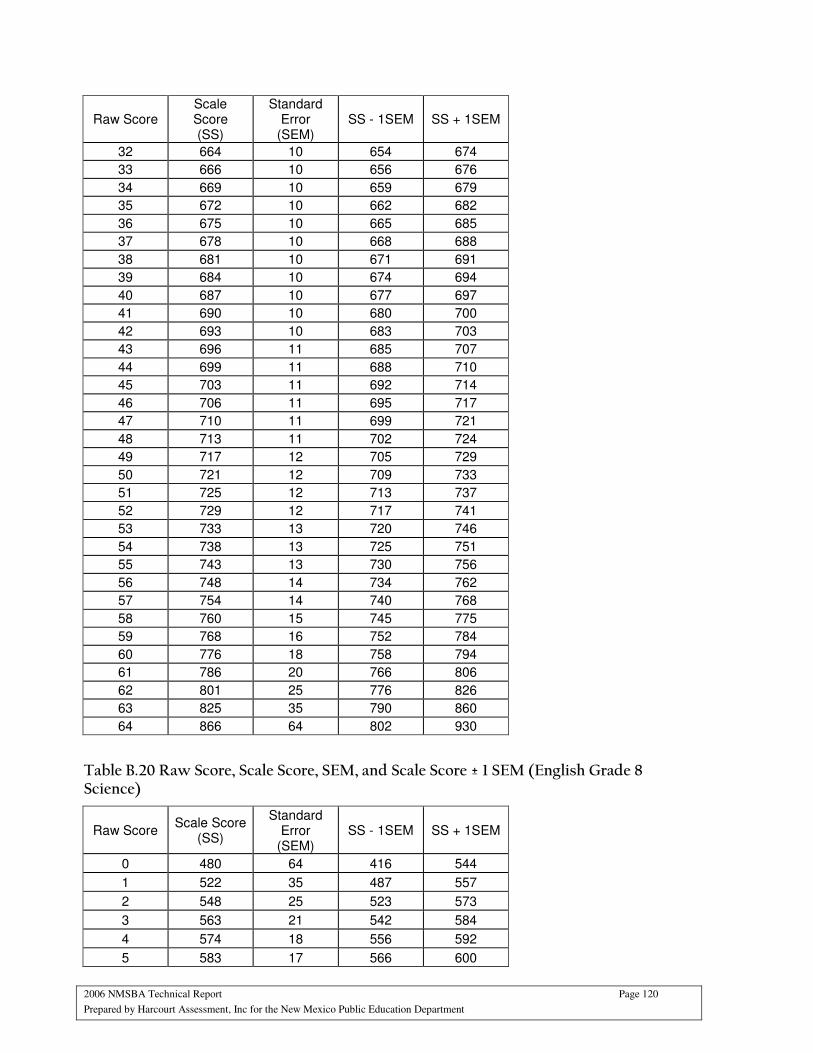
2006 NMSBA Technical Report Page 120
Prepared by Harcourt Assessment, Inc for the New Mexico Public Education Department
Raw Score Scale Score (SS)
Standard Error
(SEM) SS - 1SEM SS + 1SEM
32 664 10 654 674
33 666 10 656 676
34 669 10 659 679
35 672 10 662 682
36 675 10 665 685
37 678 10 668 688
38 681 10 671 691
39 684 10 674 694
40 687 10 677 697
41 690 10 680 700
42 693 10 683 703
43 696 11 685 707
44 699 11 688 710
45 703 11 692 714
46 706 11 695 717
47 710 11 699 721
48 713 11 702 724
49 717 12 705 729
50 721 12 709 733
51 725 12 713 737
52 729 12 717 741
53 733 13 720 746
54 738 13 725 751
55 743 13 730 756
56 748 14 734 762
57 754 14 740 768
58 760 15 745 775
59 768 16 752 784
60 776 18 758 794
61 786 20 766 806
62 801 25 776 826
63 825 35 790 860
64 866 64 802 930
Table B.20 Raw Score, Scale Score, SEM, and Scale Score ± 1 SEM (English Grade 8 Science)
Raw Score Scale Score
(SS)
Standard Error
(SEM) SS - 1SEM SS + 1SEM
0 480 64 416 544
1 522 35 487 557
2 548 25 523 573
3 563 21 542 584
4 574 18 556 592
5 583 17 566 600
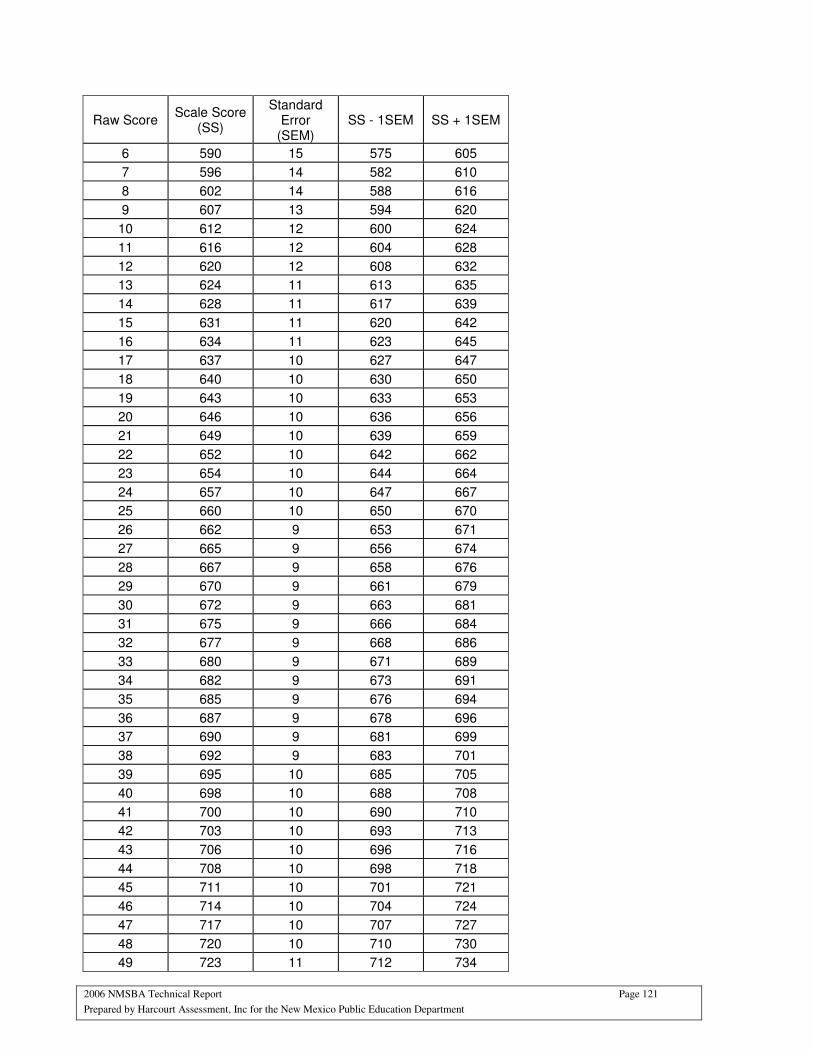
2006 NMSBA Technical Report Page 121
Prepared by Harcourt Assessment, Inc for the New Mexico Public Education Department
Raw Score Scale Score
(SS)
Standard Error
(SEM) SS - 1SEM SS + 1SEM
6 590 15 575 605
7 596 14 582 610
8 602 14 588 616
9 607 13 594 620
10 612 12 600 624
11 616 12 604 628
12 620 12 608 632
13 624 11 613 635
14 628 11 617 639
15 631 11 620 642
16 634 11 623 645
17 637 10 627 647
18 640 10 630 650
19 643 10 633 653
20 646 10 636 656
21 649 10 639 659
22 652 10 642 662
23 654 10 644 664
24 657 10 647 667
25 660 10 650 670
26 662 9 653 671
27 665 9 656 674
28 667 9 658 676
29 670 9 661 679
30 672 9 663 681
31 675 9 666 684
32 677 9 668 686
33 680 9 671 689
34 682 9 673 691
35 685 9 676 694
36 687 9 678 696
37 690 9 681 699
38 692 9 683 701
39 695 10 685 705
40 698 10 688 708
41 700 10 690 710
42 703 10 693 713
43 706 10 696 716
44 708 10 698 718
45 711 10 701 721
46 714 10 704 724
47 717 10 707 727
48 720 10 710 730
49 723 11 712 734
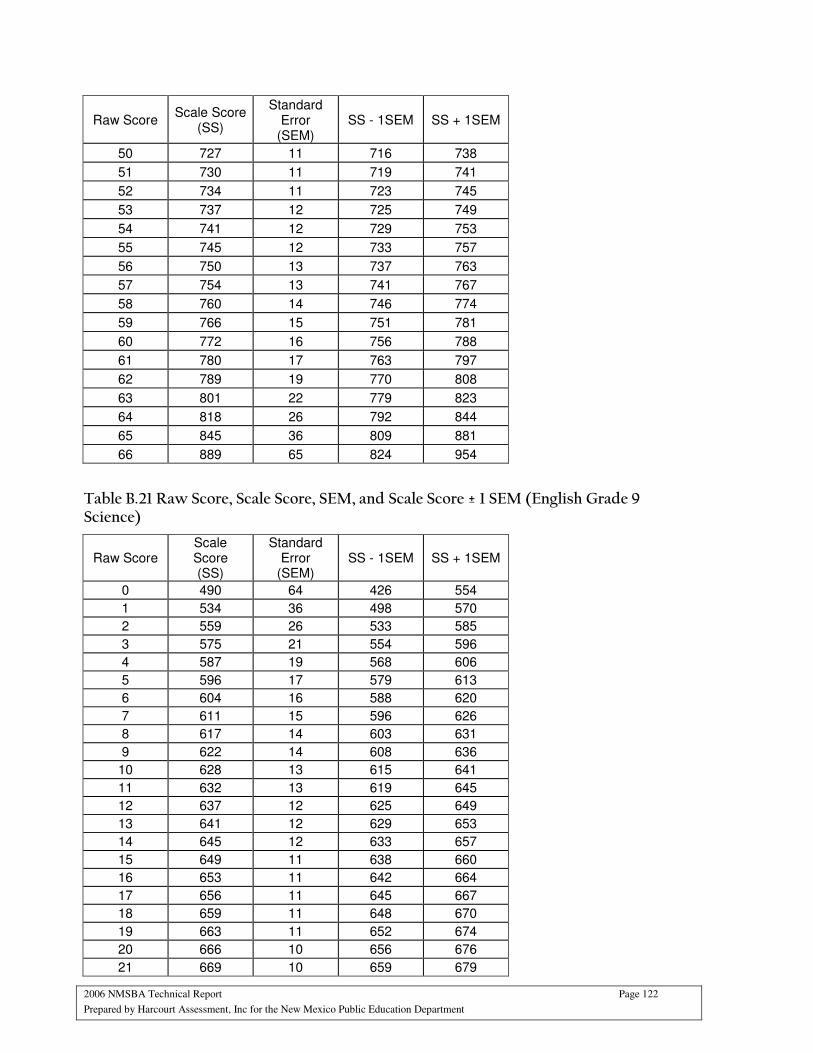
2006 NMSBA Technical Report Page 122
Prepared by Harcourt Assessment, Inc for the New Mexico Public Education Department
Raw Score Scale Score
(SS)
Standard Error
(SEM) SS - 1SEM SS + 1SEM
50 727 11 716 738
51 730 11 719 741
52 734 11 723 745
53 737 12 725 749
54 741 12 729 753
55 745 12 733 757
56 750 13 737 763
57 754 13 741 767
58 760 14 746 774
59 766 15 751 781
60 772 16 756 788
61 780 17 763 797
62 789 19 770 808
63 801 22 779 823
64 818 26 792 844
65 845 36 809 881
66 889 65 824 954
Table B.21 Raw Score, Scale Score, SEM, and Scale Score ± 1 SEM (English Grade 9 Science)
Raw Score Scale Score (SS)
Standard Error
(SEM) SS - 1SEM SS + 1SEM
0 490 64 426 554
1 534 36 498 570
2 559 26 533 585
3 575 21 554 596
4 587 19 568 606
5 596 17 579 613
6 604 16 588 620
7 611 15 596 626
8 617 14 603 631
9 622 14 608 636
10 628 13 615 641
11 632 13 619 645
12 637 12 625 649
13 641 12 629 653
14 645 12 633 657
15 649 11 638 660
16 653 11 642 664
17 656 11 645 667
18 659 11 648 670
19 663 11 652 674
20 666 10 656 676
21 669 10 659 679
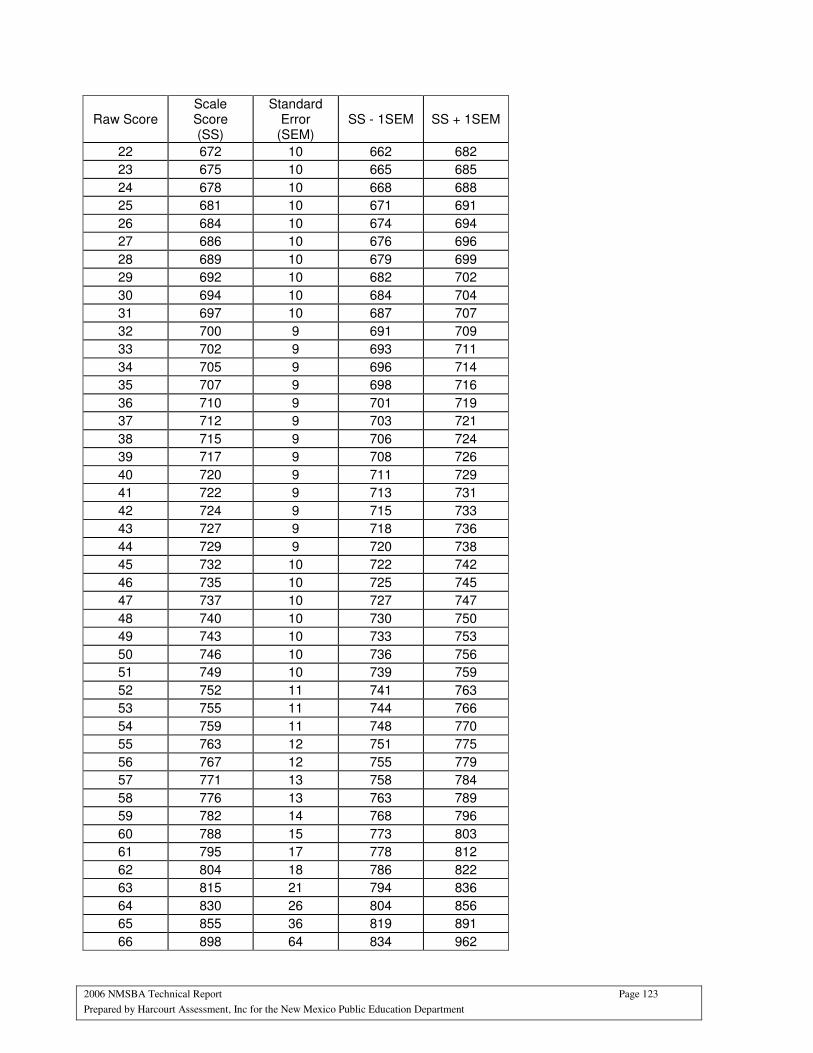
2006 NMSBA Technical Report Page 123
Prepared by Harcourt Assessment, Inc for the New Mexico Public Education Department
Raw Score Scale Score (SS)
Standard Error
(SEM) SS - 1SEM SS + 1SEM
22 672 10 662 682
23 675 10 665 685
24 678 10 668 688
25 681 10 671 691
26 684 10 674 694
27 686 10 676 696
28 689 10 679 699
29 692 10 682 702
30 694 10 684 704
31 697 10 687 707
32 700 9 691 709
33 702 9 693 711
34 705 9 696 714
35 707 9 698 716
36 710 9 701 719
37 712 9 703 721
38 715 9 706 724
39 717 9 708 726
40 720 9 711 729
41 722 9 713 731
42 724 9 715 733
43 727 9 718 736
44 729 9 720 738
45 732 10 722 742
46 735 10 725 745
47 737 10 727 747
48 740 10 730 750
49 743 10 733 753
50 746 10 736 756
51 749 10 739 759
52 752 11 741 763
53 755 11 744 766
54 759 11 748 770
55 763 12 751 775
56 767 12 755 779
57 771 13 758 784
58 776 13 763 789
59 782 14 768 796
60 788 15 773 803
61 795 17 778 812
62 804 18 786 822
63 815 21 794 836
64 830 26 804 856
65 855 36 819 891
66 898 64 834 962
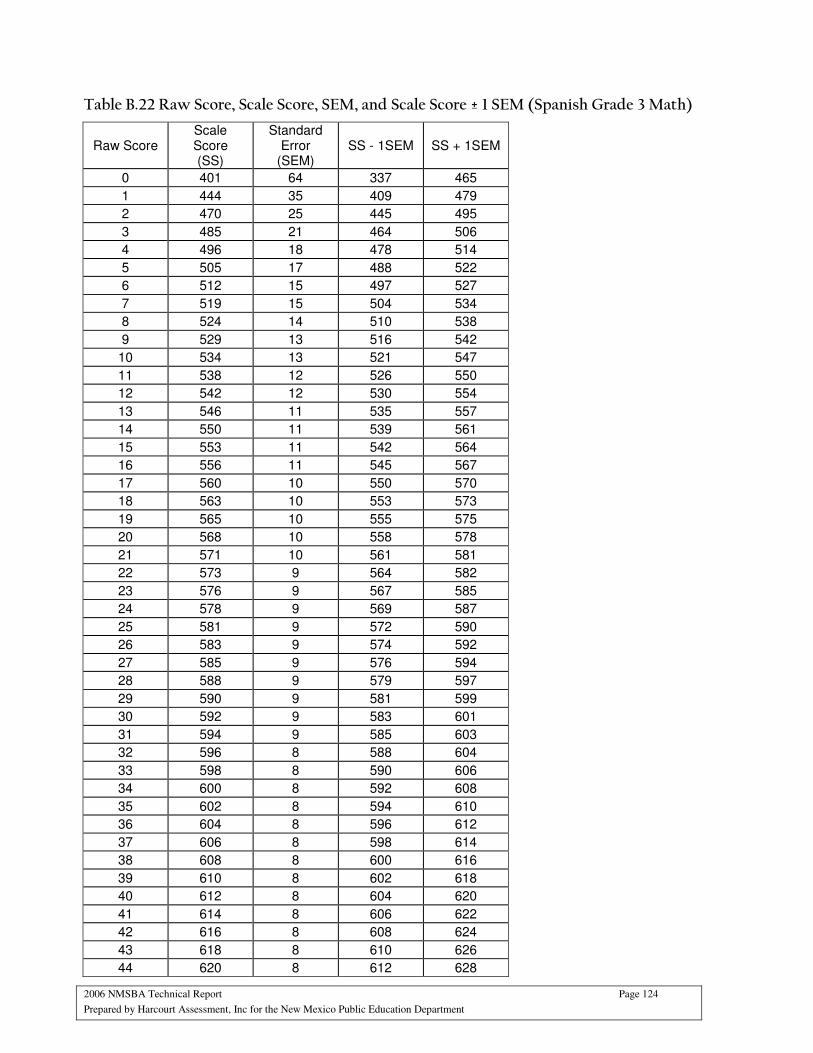
2006 NMSBA Technical Report Page 124
Prepared by Harcourt Assessment, Inc for the New Mexico Public Education Department
Table B.22 Raw Score, Scale Score, SEM, and Scale Score ± 1 SEM (Spanish Grade 3 Math)
Raw Score Scale Score (SS)
Standard Error
(SEM) SS - 1SEM SS + 1SEM
0 401 64 337 465
1 444 35 409 479
2 470 25 445 495
3 485 21 464 506
4 496 18 478 514
5 505 17 488 522
6 512 15 497 527
7 519 15 504 534
8 524 14 510 538
9 529 13 516 542
10 534 13 521 547
11 538 12 526 550
12 542 12 530 554
13 546 11 535 557
14 550 11 539 561
15 553 11 542 564
16 556 11 545 567
17 560 10 550 570
18 563 10 553 573
19 565 10 555 575
20 568 10 558 578
21 571 10 561 581
22 573 9 564 582
23 576 9 567 585
24 578 9 569 587
25 581 9 572 590
26 583 9 574 592
27 585 9 576 594
28 588 9 579 597
29 590 9 581 599
30 592 9 583 601
31 594 9 585 603
32 596 8 588 604
33 598 8 590 606
34 600 8 592 608
35 602 8 594 610
36 604 8 596 612
37 606 8 598 614
38 608 8 600 616
39 610 8 602 618
40 612 8 604 620
41 614 8 606 622
42 616 8 608 624
43 618 8 610 626
44 620 8 612 628

2006 NMSBA Technical Report Page 125
Prepared by Harcourt Assessment, Inc for the New Mexico Public Education Department
Raw Score Scale Score (SS)
Standard Error
(SEM) SS - 1SEM SS + 1SEM
45 622 8 614 630
46 624 8 616 632
47 626 8 618 634
48 628 8 620 636
49 630 8 622 638
50 632 8 624 640
51 634 8 626 642
52 636 9 627 645
53 638 9 629 647
54 640 9 631 649
55 642 9 633 651
56 644 9 635 653
57 647 9 638 656
58 649 9 640 658
59 651 9 642 660
60 654 9 645 663
61 656 10 646 666
62 659 10 649 669
63 662 10 652 672
64 665 10 655 675
65 668 10 658 678
66 671 11 660 682
67 674 11 663 685
68 677 11 666 688
69 681 11 670 692
70 685 12 673 697
71 689 12 677 701
72 694 13 681 707
73 699 14 685 713
74 705 15 690 720
75 712 17 695 729
76 722 19 703 741
77 735 24 711 759
78 757 34 723 791
79 798 63 735 861
Table B.23 Raw Score, Scale Score, SEM, and Scale Score ± 1 SEM (Spanish Grade 4 Math)
Raw Score Scale Score (SS)
Standard Error
(SEM) SS - 1SEM SS + 1SEM
0 416 64 352 480
1 459 35 424 494
2 484 25 459 509
3 499 21 478 520
4 510 18 492 528
5 519 17 502 536

2006 NMSBA Technical Report Page 126
Prepared by Harcourt Assessment, Inc for the New Mexico Public Education Department
Raw Score Scale Score (SS)
Standard Error
(SEM) SS - 1SEM SS + 1SEM
6 527 15 512 542
7 533 14 519 547
8 538 14 524 552
9 543 13 530 556
10 548 12 536 560
11 552 12 540 564
12 556 12 544 568
13 560 11 549 571
14 563 11 552 574
15 567 11 556 578
16 570 10 560 580
17 573 10 563 583
18 576 10 566 586
19 578 10 568 588
20 581 10 571 591
21 584 9 575 593
22 586 9 577 595
23 589 9 580 598
24 591 9 582 600
25 593 9 584 602
26 596 9 587 605
27 598 9 589 607
28 600 9 591 609
29 602 9 593 611
30 604 9 595 613
31 606 9 597 615
32 608 9 599 617
33 611 9 602 620
34 613 8 605 621
35 615 8 607 623
36 617 8 609 625
37 619 8 611 627
38 621 8 613 629
39 623 8 615 631
40 625 8 617 633
41 627 8 619 635
42 629 8 621 637
43 631 8 623 639
44 633 9 624 642
45 635 9 626 644
46 637 9 628 646
47 639 9 630 648
48 641 9 632 650
49 644 9 635 653
50 646 9 637 655
51 648 9 639 657

2006 NMSBA Technical Report Page 127
Prepared by Harcourt Assessment, Inc for the New Mexico Public Education Department
Raw Score Scale Score (SS)
Standard Error
(SEM) SS - 1SEM SS + 1SEM
52 650 9 641 659
53 652 9 643 661
54 655 9 646 664
55 657 9 648 666
56 659 9 650 668
57 662 9 653 671
58 664 9 655 673
59 666 9 657 675
60 669 9 660 678
61 671 9 662 680
62 674 10 664 684
63 676 10 666 686
64 679 10 669 689
65 682 10 672 692
66 685 10 675 695
67 688 10 678 698
68 691 11 680 702
69 694 11 683 705
70 698 11 687 709
71 701 12 689 713
72 705 12 693 717
73 710 13 697 723
74 715 13 702 728
75 720 14 706 734
76 726 15 711 741
77 734 17 717 751
78 744 20 724 764
79 757 24 733 781
80 781 34 747 815
81 822 63 759 885
Table B.24 Raw Score, Scale Score, SEM, and Scale Score ± 1 SEM (Spanish Grade 5 Math)
Raw Score Scale Score (SS)
Standard Error
(SEM) SS - 1SEM SS + 1SEM
0 430 64 366 494
1 473 36 437 509
2 498 26 472 524
3 514 21 493 535
4 525 19 506 544
5 534 17 517 551
6 541 16 525 557
7 548 15 533 563
8 553 14 539 567
9 559 13 546 572
10 563 13 550 576
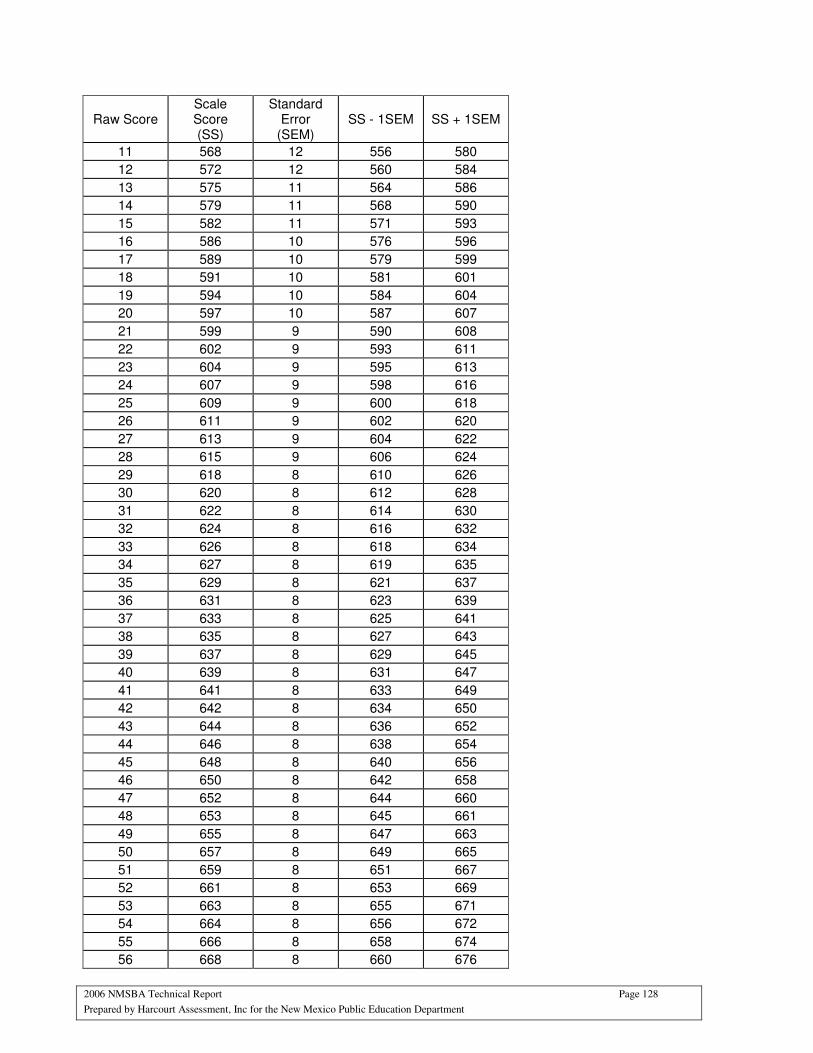
2006 NMSBA Technical Report Page 128
Prepared by Harcourt Assessment, Inc for the New Mexico Public Education Department
Raw Score Scale Score (SS)
Standard Error
(SEM) SS - 1SEM SS + 1SEM
11 568 12 556 580
12 572 12 560 584
13 575 11 564 586
14 579 11 568 590
15 582 11 571 593
16 586 10 576 596
17 589 10 579 599
18 591 10 581 601
19 594 10 584 604
20 597 10 587 607
21 599 9 590 608
22 602 9 593 611
23 604 9 595 613
24 607 9 598 616
25 609 9 600 618
26 611 9 602 620
27 613 9 604 622
28 615 9 606 624
29 618 8 610 626
30 620 8 612 628
31 622 8 614 630
32 624 8 616 632
33 626 8 618 634
34 627 8 619 635
35 629 8 621 637
36 631 8 623 639
37 633 8 625 641
38 635 8 627 643
39 637 8 629 645
40 639 8 631 647
41 641 8 633 649
42 642 8 634 650
43 644 8 636 652
44 646 8 638 654
45 648 8 640 656
46 650 8 642 658
47 652 8 644 660
48 653 8 645 661
49 655 8 647 663
50 657 8 649 665
51 659 8 651 667
52 661 8 653 669
53 663 8 655 671
54 664 8 656 672
55 666 8 658 674
56 668 8 660 676
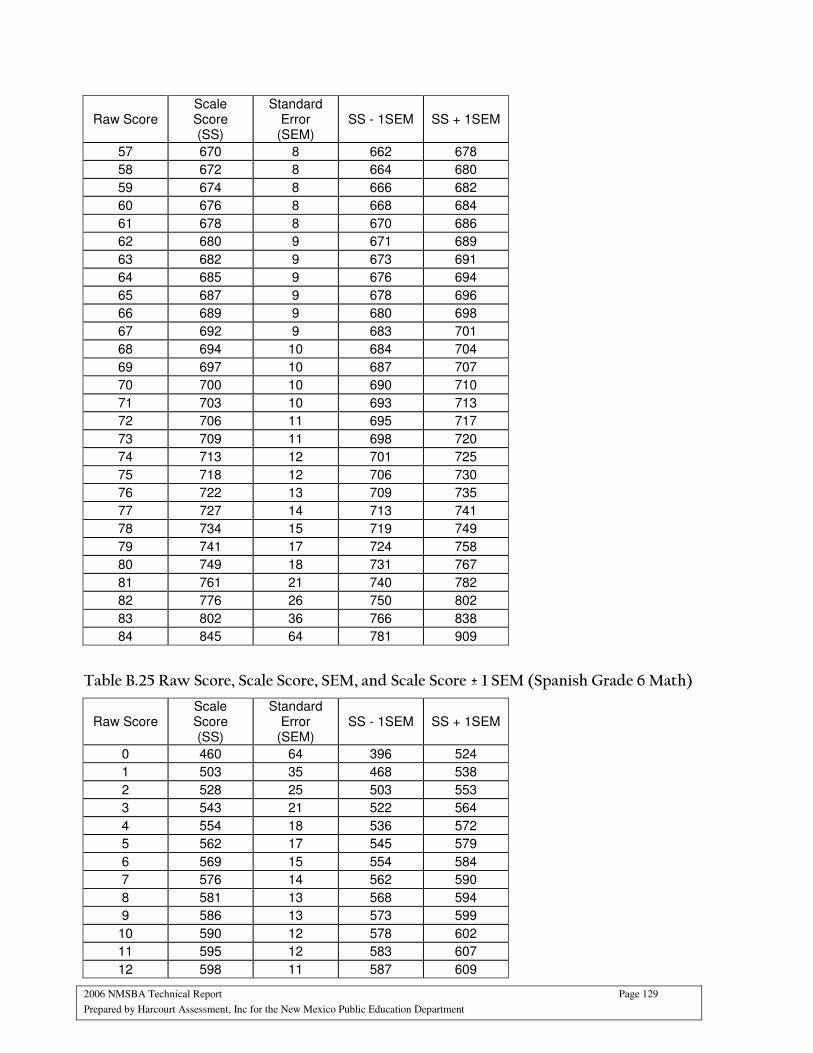
2006 NMSBA Technical Report Page 129
Prepared by Harcourt Assessment, Inc for the New Mexico Public Education Department
Raw Score Scale Score (SS)
Standard Error
(SEM) SS - 1SEM SS + 1SEM
57 670 8 662 678
58 672 8 664 680
59 674 8 666 682
60 676 8 668 684
61 678 8 670 686
62 680 9 671 689
63 682 9 673 691
64 685 9 676 694
65 687 9 678 696
66 689 9 680 698
67 692 9 683 701
68 694 10 684 704
69 697 10 687 707
70 700 10 690 710
71 703 10 693 713
72 706 11 695 717
73 709 11 698 720
74 713 12 701 725
75 718 12 706 730
76 722 13 709 735
77 727 14 713 741
78 734 15 719 749
79 741 17 724 758
80 749 18 731 767
81 761 21 740 782
82 776 26 750 802
83 802 36 766 838
84 845 64 781 909
Table B.25 Raw Score, Scale Score, SEM, and Scale Score ± 1 SEM (Spanish Grade 6 Math)
Raw Score Scale Score (SS)
Standard Error
(SEM) SS - 1SEM SS + 1SEM
0 460 64 396 524
1 503 35 468 538
2 528 25 503 553
3 543 21 522 564
4 554 18 536 572
5 562 17 545 579
6 569 15 554 584
7 576 14 562 590
8 581 13 568 594
9 586 13 573 599
10 590 12 578 602
11 595 12 583 607
12 598 11 587 609
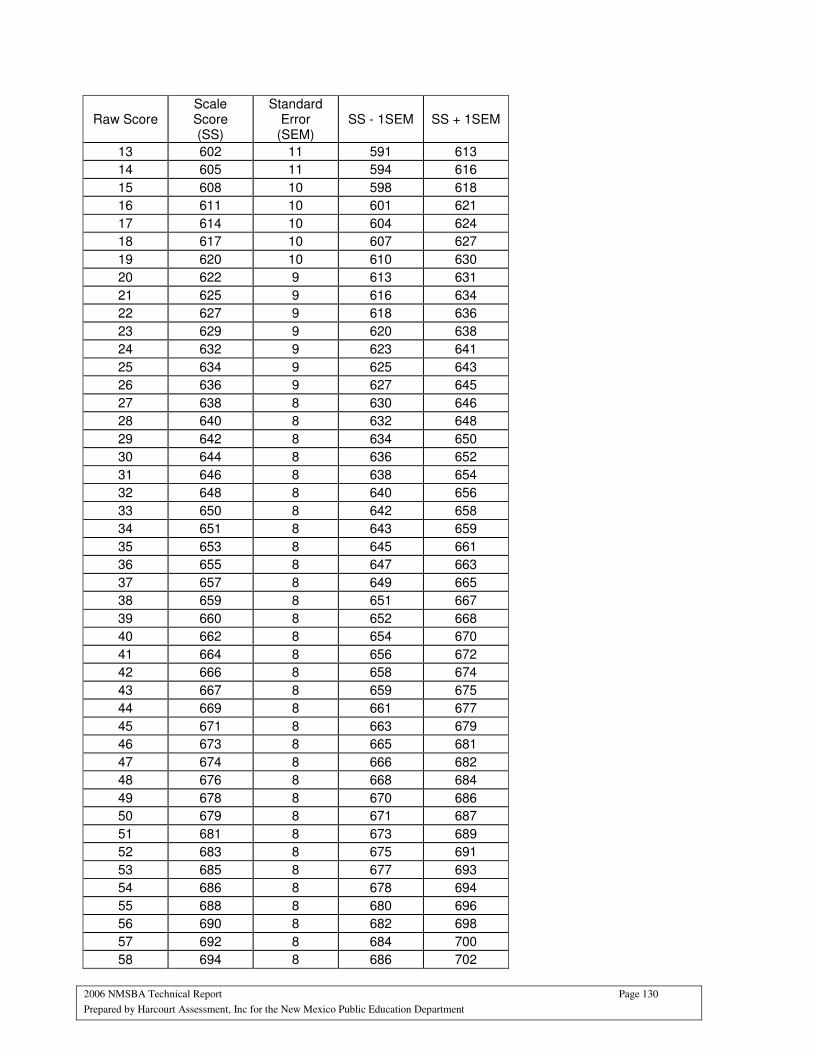
2006 NMSBA Technical Report Page 130
Prepared by Harcourt Assessment, Inc for the New Mexico Public Education Department
Raw Score Scale Score (SS)
Standard Error
(SEM) SS - 1SEM SS + 1SEM
13 602 11 591 613
14 605 11 594 616
15 608 10 598 618
16 611 10 601 621
17 614 10 604 624
18 617 10 607 627
19 620 10 610 630
20 622 9 613 631
21 625 9 616 634
22 627 9 618 636
23 629 9 620 638
24 632 9 623 641
25 634 9 625 643
26 636 9 627 645
27 638 8 630 646
28 640 8 632 648
29 642 8 634 650
30 644 8 636 652
31 646 8 638 654
32 648 8 640 656
33 650 8 642 658
34 651 8 643 659
35 653 8 645 661
36 655 8 647 663
37 657 8 649 665
38 659 8 651 667
39 660 8 652 668
40 662 8 654 670
41 664 8 656 672
42 666 8 658 674
43 667 8 659 675
44 669 8 661 677
45 671 8 663 679
46 673 8 665 681
47 674 8 666 682
48 676 8 668 684
49 678 8 670 686
50 679 8 671 687
51 681 8 673 689
52 683 8 675 691
53 685 8 677 693
54 686 8 678 694
55 688 8 680 696
56 690 8 682 698
57 692 8 684 700
58 694 8 686 702
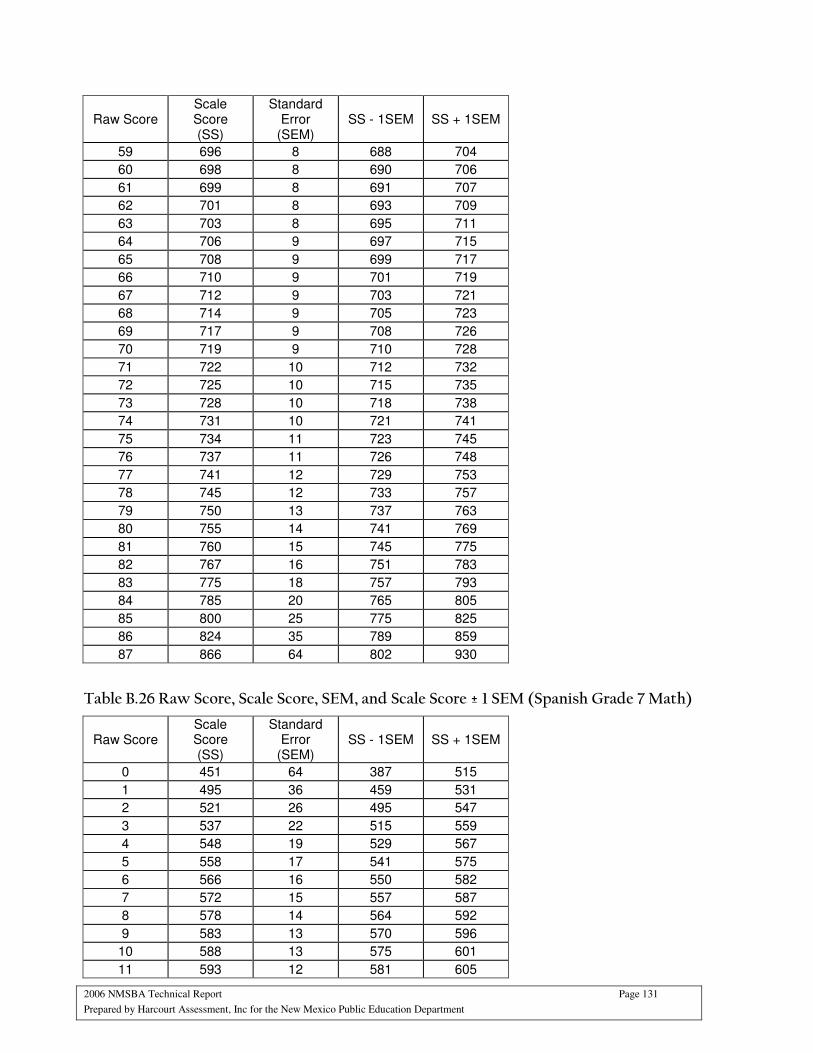
2006 NMSBA Technical Report Page 131
Prepared by Harcourt Assessment, Inc for the New Mexico Public Education Department
Raw Score Scale Score (SS)
Standard Error
(SEM) SS - 1SEM SS + 1SEM
59 696 8 688 704
60 698 8 690 706
61 699 8 691 707
62 701 8 693 709
63 703 8 695 711
64 706 9 697 715
65 708 9 699 717
66 710 9 701 719
67 712 9 703 721
68 714 9 705 723
69 717 9 708 726
70 719 9 710 728
71 722 10 712 732
72 725 10 715 735
73 728 10 718 738
74 731 10 721 741
75 734 11 723 745
76 737 11 726 748
77 741 12 729 753
78 745 12 733 757
79 750 13 737 763
80 755 14 741 769
81 760 15 745 775
82 767 16 751 783
83 775 18 757 793
84 785 20 765 805
85 800 25 775 825
86 824 35 789 859
87 866 64 802 930
Table B.26 Raw Score, Scale Score, SEM, and Scale Score ± 1 SEM (Spanish Grade 7 Math)
Raw Score Scale Score (SS)
Standard Error
(SEM) SS - 1SEM SS + 1SEM
0 451 64 387 515
1 495 36 459 531
2 521 26 495 547
3 537 22 515 559
4 548 19 529 567
5 558 17 541 575
6 566 16 550 582
7 572 15 557 587
8 578 14 564 592
9 583 13 570 596
10 588 13 575 601
11 593 12 581 605
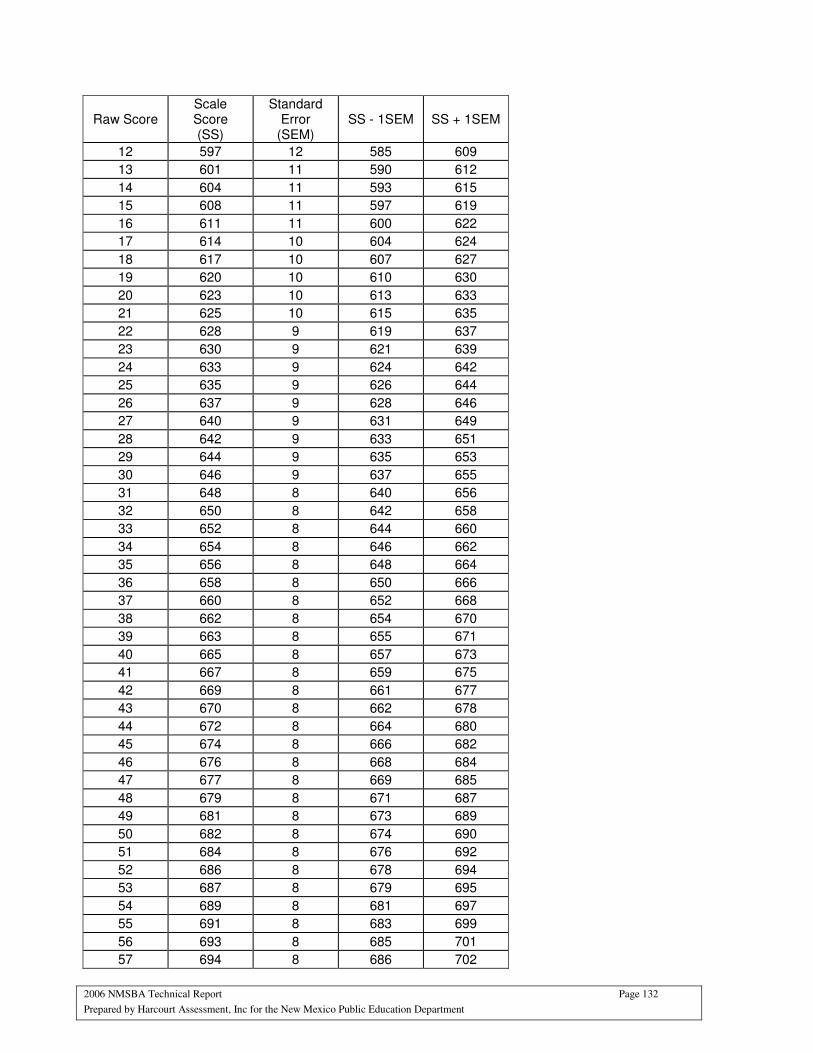
2006 NMSBA Technical Report Page 132
Prepared by Harcourt Assessment, Inc for the New Mexico Public Education Department
Raw Score Scale Score (SS)
Standard Error
(SEM) SS - 1SEM SS + 1SEM
12 597 12 585 609
13 601 11 590 612
14 604 11 593 615
15 608 11 597 619
16 611 11 600 622
17 614 10 604 624
18 617 10 607 627
19 620 10 610 630
20 623 10 613 633
21 625 10 615 635
22 628 9 619 637
23 630 9 621 639
24 633 9 624 642
25 635 9 626 644
26 637 9 628 646
27 640 9 631 649
28 642 9 633 651
29 644 9 635 653
30 646 9 637 655
31 648 8 640 656
32 650 8 642 658
33 652 8 644 660
34 654 8 646 662
35 656 8 648 664
36 658 8 650 666
37 660 8 652 668
38 662 8 654 670
39 663 8 655 671
40 665 8 657 673
41 667 8 659 675
42 669 8 661 677
43 670 8 662 678
44 672 8 664 680
45 674 8 666 682
46 676 8 668 684
47 677 8 669 685
48 679 8 671 687
49 681 8 673 689
50 682 8 674 690
51 684 8 676 692
52 686 8 678 694
53 687 8 679 695
54 689 8 681 697
55 691 8 683 699
56 693 8 685 701
57 694 8 686 702

2006 NMSBA Technical Report Page 133
Prepared by Harcourt Assessment, Inc for the New Mexico Public Education Department
Raw Score Scale Score (SS)
Standard Error
(SEM) SS - 1SEM SS + 1SEM
58 696 8 688 704
59 698 8 690 706
60 700 8 692 708
61 702 8 694 710
62 704 8 696 712
63 706 8 698 714
64 708 9 699 717
65 710 9 701 719
66 712 9 703 721
67 714 9 705 723
68 717 9 708 726
69 719 9 710 728
70 722 10 712 732
71 724 10 714 734
72 727 10 717 737
73 730 10 720 740
74 734 11 723 745
75 737 11 726 748
76 741 12 729 753
77 745 12 733 757
78 749 13 736 762
79 754 14 740 768
80 760 14 746 774
81 766 16 750 782
82 774 17 757 791
83 783 19 764 802
84 794 21 773 815
85 810 26 784 836
86 836 36 800 872
87 879 64 815 943
Table B.27 Raw Score, Scale Score, SEM, and Scale Score ± 1 SEM (Spanish Grade 8 Math)
Raw Score Scale Score (SS)
Standard Error
(SEM) SS - 1SEM SS + 1SEM
0 470 64 406 534
1 512 35 477 547
2 537 25 512 562
3 552 21 531 573
4 562 18 544 580
5 571 16 555 587
6 577 15 562 592
7 583 14 569 597
8 589 13 576 602
9 593 13 580 606
10 598 12 586 610

2006 NMSBA Technical Report Page 134
Prepared by Harcourt Assessment, Inc for the New Mexico Public Education Department
Raw Score Scale Score (SS)
Standard Error
(SEM) SS - 1SEM SS + 1SEM
11 602 12 590 614
12 605 11 594 616
13 609 11 598 620
14 612 11 601 623
15 616 10 606 626
16 619 10 609 629
17 622 10 612 632
18 624 10 614 634
19 627 10 617 637
20 630 10 620 640
21 632 9 623 641
22 635 9 626 644
23 637 9 628 646
24 640 9 631 649
25 642 9 633 651
26 644 9 635 653
27 646 9 637 655
28 648 9 639 657
29 651 8 643 659
30 653 8 645 661
31 655 8 647 663
32 656 8 648 664
33 658 8 650 666
34 660 8 652 668
35 662 8 654 670
36 664 8 656 672
37 666 8 658 674
38 668 8 660 676
39 669 8 661 677
40 671 8 663 679
41 673 8 665 681
42 675 8 667 683
43 676 8 668 684
44 678 8 670 686
45 680 8 672 688
46 682 8 674 690
47 684 8 676 692
48 685 8 677 693
49 687 8 679 695
50 689 8 681 697
51 691 8 683 699
52 693 8 685 701
53 695 8 687 703
54 697 8 689 705
55 699 8 691 707
56 701 8 693 709

2006 NMSBA Technical Report Page 135
Prepared by Harcourt Assessment, Inc for the New Mexico Public Education Department
Raw Score Scale Score (SS)
Standard Error
(SEM) SS - 1SEM SS + 1SEM
57 703 8 695 711
58 705 9 696 714
59 707 9 698 716
60 709 9 700 718
61 711 9 702 720
62 713 9 704 722
63 716 9 707 725
64 718 9 709 727
65 720 9 711 729
66 723 9 714 732
67 726 10 716 736
68 728 10 718 738
69 731 10 721 741
70 734 10 724 744
71 737 10 727 747
72 740 11 729 751
73 743 11 732 754
74 747 11 736 758
75 751 12 739 763
76 755 12 743 767
77 759 13 746 772
78 764 13 751 777
79 769 14 755 783
80 776 15 761 791
81 783 17 766 800
82 792 18 774 810
83 802 21 781 823
84 816 24 792 840
85 836 29 807 865
86 867 38 829 905
87 914 66 848 980
Table B.28 Raw Score, Scale Score, SEM, and Scale Score ± 1 SEM (Spanish Grade 9 Math)
Raw Score Scale Score
(SS)
Standard Error
(SEM) SS - 1SEM SS + 1SEM
0 472 64 408 536
1 514 35 479 549
2 539 25 514 564
3 554 21 533 575
4 565 18 547 583
5 574 17 557 591
6 581 15 566 596
7 587 14 573 601
8 593 14 579 607

2006 NMSBA Technical Report Page 136
Prepared by Harcourt Assessment, Inc for the New Mexico Public Education Department
Raw Score Scale Score
(SS)
Standard Error
(SEM) SS - 1SEM SS + 1SEM
9 598 13 585 611
10 603 12 591 615
11 607 12 595 619
12 611 12 599 623
13 615 11 604 626
14 618 11 607 629
15 621 11 610 632
16 625 11 614 636
17 628 10 618 638
18 631 10 621 641
19 634 10 624 644
20 636 10 626 646
21 639 10 629 649
22 642 10 632 652
23 644 9 635 653
24 647 9 638 656
25 649 9 640 658
26 652 9 643 661
27 654 9 645 663
28 657 9 648 666
29 659 9 650 668
30 661 9 652 670
31 663 9 654 672
32 666 9 657 675
33 668 9 659 677
34 670 9 661 679
35 672 8 664 680
36 674 8 666 682
37 676 8 668 684
38 678 8 670 686
39 680 8 672 688
40 682 8 674 690
41 684 8 676 692
42 685 8 677 693
43 687 8 679 695
44 689 8 681 697
45 691 8 683 699
46 692 8 684 700
47 694 8 686 702
48 696 8 688 704
49 698 8 690 706
50 699 8 691 707
51 701 8 693 709
52 703 8 695 711
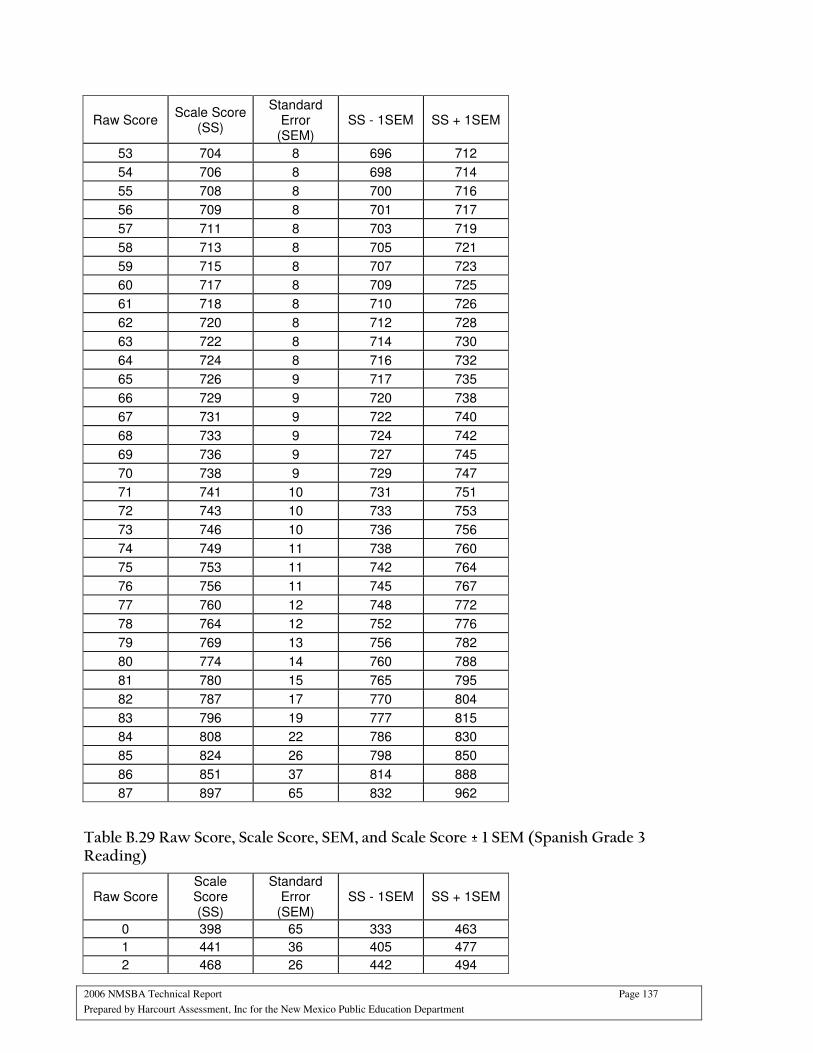
2006 NMSBA Technical Report Page 137
Prepared by Harcourt Assessment, Inc for the New Mexico Public Education Department
Raw Score Scale Score
(SS)
Standard Error
(SEM) SS - 1SEM SS + 1SEM
53 704 8 696 712
54 706 8 698 714
55 708 8 700 716
56 709 8 701 717
57 711 8 703 719
58 713 8 705 721
59 715 8 707 723
60 717 8 709 725
61 718 8 710 726
62 720 8 712 728
63 722 8 714 730
64 724 8 716 732
65 726 9 717 735
66 729 9 720 738
67 731 9 722 740
68 733 9 724 742
69 736 9 727 745
70 738 9 729 747
71 741 10 731 751
72 743 10 733 753
73 746 10 736 756
74 749 11 738 760
75 753 11 742 764
76 756 11 745 767
77 760 12 748 772
78 764 12 752 776
79 769 13 756 782
80 774 14 760 788
81 780 15 765 795
82 787 17 770 804
83 796 19 777 815
84 808 22 786 830
85 824 26 798 850
86 851 37 814 888
87 897 65 832 962
Table B.29 Raw Score, Scale Score, SEM, and Scale Score ± 1 SEM (Spanish Grade 3 Reading)
Raw Score Scale Score (SS)
Standard Error
(SEM) SS - 1SEM SS + 1SEM
0 398 65 333 463
1 441 36 405 477
2 468 26 442 494

2006 NMSBA Technical Report Page 138
Prepared by Harcourt Assessment, Inc for the New Mexico Public Education Department
Raw Score Scale Score (SS)
Standard Error
(SEM) SS - 1SEM SS + 1SEM
3 484 22 462 506
4 496 19 477 515
5 505 17 488 522
6 513 16 497 529
7 520 15 505 535
8 526 14 512 540
9 532 14 518 546
10 537 13 524 550
11 542 12 530 554
12 546 12 534 558
13 550 12 538 562
14 554 11 543 565
15 557 11 546 568
16 561 11 550 572
17 564 11 553 575
18 567 10 557 577
19 570 10 560 580
20 573 10 563 583
21 576 10 566 586
22 579 10 569 589
23 582 10 572 592
24 584 10 574 594
25 587 10 577 597
26 590 9 581 599
27 592 9 583 601
28 595 9 586 604
29 597 9 588 606
30 600 9 591 609
31 602 9 593 611
32 605 9 596 614
33 607 9 598 616
34 609 9 600 618
35 612 9 603 621
36 614 9 605 623
37 616 9 607 625
38 619 9 610 628
39 621 9 612 630
40 624 9 615 633
41 626 9 617 635
42 628 9 619 637
43 631 9 622 640
44 633 9 624 642
45 636 9 627 645
46 638 9 629 647
47 641 9 632 650
48 643 10 633 653
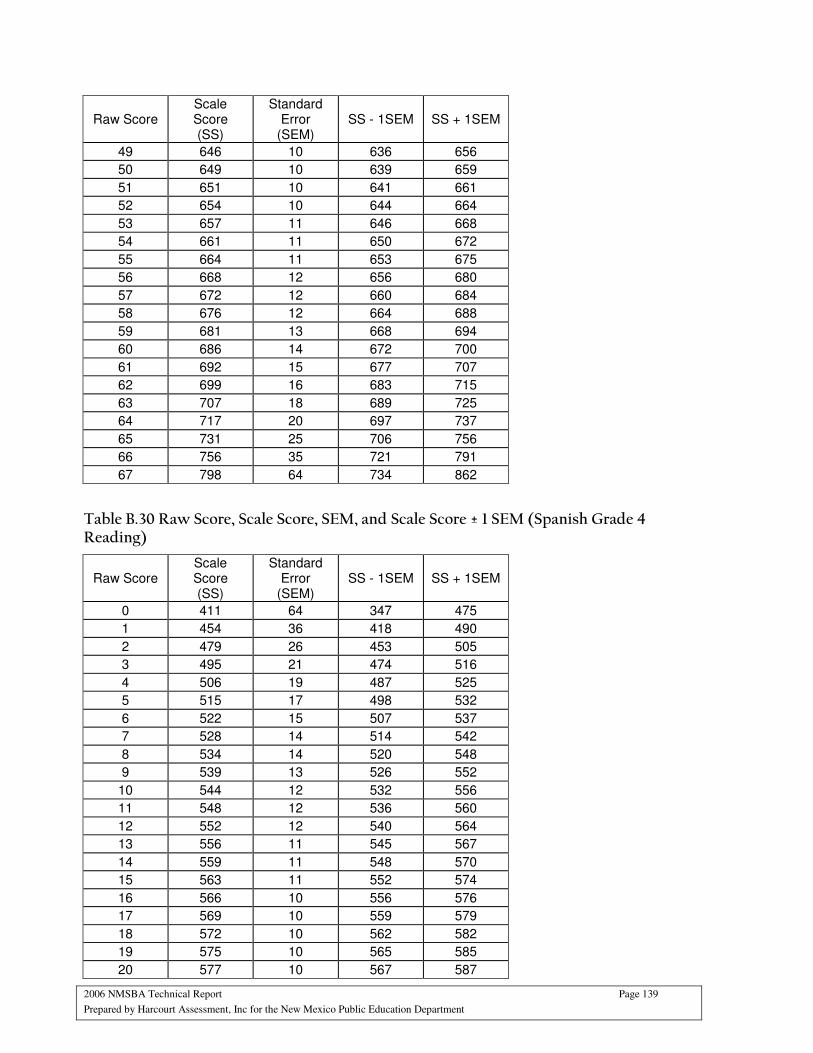
2006 NMSBA Technical Report Page 139
Prepared by Harcourt Assessment, Inc for the New Mexico Public Education Department
Raw Score Scale Score (SS)
Standard Error
(SEM) SS - 1SEM SS + 1SEM
49 646 10 636 656
50 649 10 639 659
51 651 10 641 661
52 654 10 644 664
53 657 11 646 668
54 661 11 650 672
55 664 11 653 675
56 668 12 656 680
57 672 12 660 684
58 676 12 664 688
59 681 13 668 694
60 686 14 672 700
61 692 15 677 707
62 699 16 683 715
63 707 18 689 725
64 717 20 697 737
65 731 25 706 756
66 756 35 721 791
67 798 64 734 862
Table B.30 Raw Score, Scale Score, SEM, and Scale Score ± 1 SEM (Spanish Grade 4 Reading)
Raw Score Scale Score (SS)
Standard Error
(SEM) SS - 1SEM SS + 1SEM
0 411 64 347 475
1 454 36 418 490
2 479 26 453 505
3 495 21 474 516
4 506 19 487 525
5 515 17 498 532
6 522 15 507 537
7 528 14 514 542
8 534 14 520 548
9 539 13 526 552
10 544 12 532 556
11 548 12 536 560
12 552 12 540 564
13 556 11 545 567
14 559 11 548 570
15 563 11 552 574
16 566 10 556 576
17 569 10 559 579
18 572 10 562 582
19 575 10 565 585
20 577 10 567 587
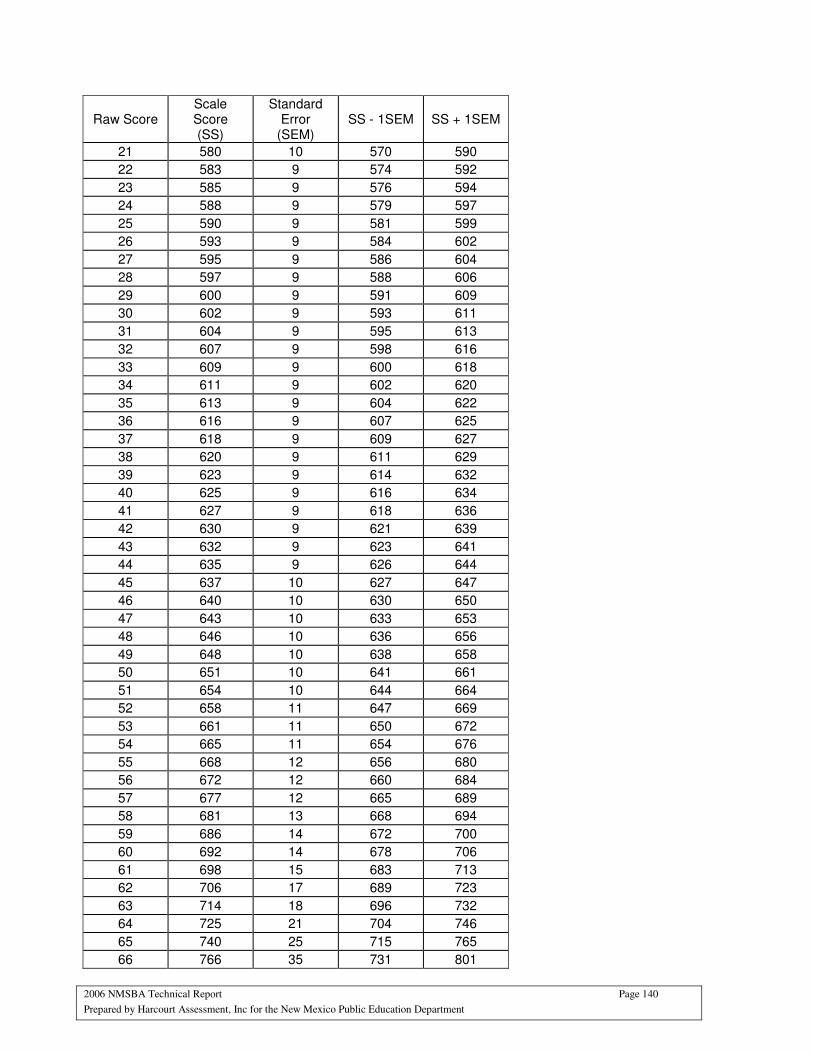
2006 NMSBA Technical Report Page 140
Prepared by Harcourt Assessment, Inc for the New Mexico Public Education Department
Raw Score Scale Score (SS)
Standard Error
(SEM) SS - 1SEM SS + 1SEM
21 580 10 570 590
22 583 9 574 592
23 585 9 576 594
24 588 9 579 597
25 590 9 581 599
26 593 9 584 602
27 595 9 586 604
28 597 9 588 606
29 600 9 591 609
30 602 9 593 611
31 604 9 595 613
32 607 9 598 616
33 609 9 600 618
34 611 9 602 620
35 613 9 604 622
36 616 9 607 625
37 618 9 609 627
38 620 9 611 629
39 623 9 614 632
40 625 9 616 634
41 627 9 618 636
42 630 9 621 639
43 632 9 623 641
44 635 9 626 644
45 637 10 627 647
46 640 10 630 650
47 643 10 633 653
48 646 10 636 656
49 648 10 638 658
50 651 10 641 661
51 654 10 644 664
52 658 11 647 669
53 661 11 650 672
54 665 11 654 676
55 668 12 656 680
56 672 12 660 684
57 677 12 665 689
58 681 13 668 694
59 686 14 672 700
60 692 14 678 706
61 698 15 683 713
62 706 17 689 723
63 714 18 696 732
64 725 21 704 746
65 740 25 715 765
66 766 35 731 801

2006 NMSBA Technical Report Page 141
Prepared by Harcourt Assessment, Inc for the New Mexico Public Education Department
Raw Score Scale Score (SS)
Standard Error
(SEM) SS - 1SEM SS + 1SEM
67 808 64 744 872
Table B.31 Raw Score, Scale Score, SEM, and Scale Score ± 1 SEM (Spanish Grade 5 Reading)
Raw Score Scale Score (SS)
Standard Error
(SEM) SS - 1SEM SS + 1SEM
0 419 64 355 483
1 462 36 426 498
2 488 26 462 514
3 503 21 482 524
4 514 19 495 533
5 523 17 506 540
6 531 16 515 547
7 537 15 522 552
8 543 14 529 557
9 548 13 535 561
10 553 13 540 566
11 558 12 546 570
12 562 12 550 574
13 566 12 554 578
14 570 11 559 581
15 573 11 562 584
16 577 11 566 588
17 580 11 569 591
18 583 11 572 594
19 587 10 577 597
20 590 10 580 600
21 593 10 583 603
22 595 10 585 605
23 598 10 588 608
24 601 10 591 611
25 604 10 594 614
26 607 10 597 617
27 609 10 599 619
28 612 10 602 622
29 615 10 605 625
30 617 10 607 627
31 620 10 610 630
32 622 10 612 632
33 625 10 615 635
34 628 10 618 638
35 630 10 620 640
36 633 10 623 643
37 635 10 625 645
38 638 10 628 648

2006 NMSBA Technical Report Page 142
Prepared by Harcourt Assessment, Inc for the New Mexico Public Education Department
Raw Score Scale Score (SS)
Standard Error
(SEM) SS - 1SEM SS + 1SEM
39 641 10 631 651
40 643 10 633 653
41 646 10 636 656
42 649 10 639 659
43 651 10 641 661
44 654 10 644 664
45 657 10 647 667
46 660 10 650 670
47 663 10 653 673
48 666 10 656 676
49 669 10 659 679
50 672 11 661 683
51 675 11 664 686
52 679 11 668 690
53 682 11 671 693
54 686 11 675 697
55 690 12 678 702
56 694 12 682 706
57 698 12 686 710
58 702 13 689 715
59 707 13 694 720
60 712 13 699 725
61 718 14 704 732
62 723 15 708 738
63 730 15 715 745
64 737 17 720 754
65 746 18 728 764
66 756 20 736 776
67 769 23 746 792
68 787 28 759 815
69 817 39 778 856
70 865 67 798 932
Table B.32 Raw Score, Scale Score, SEM, and Scale Score ± 1 SEM (Spanish Grade 6 Reading)
Raw Score Scale Score (SS)
Standard Error
(SEM) SS - 1SEM SS + 1SEM
0 428 64 364 492
1 471 36 435 507
2 496 26 470 522
3 512 21 491 533
4 523 19 504 542
5 532 17 515 549
6 539 16 523 555
7 546 15 531 561
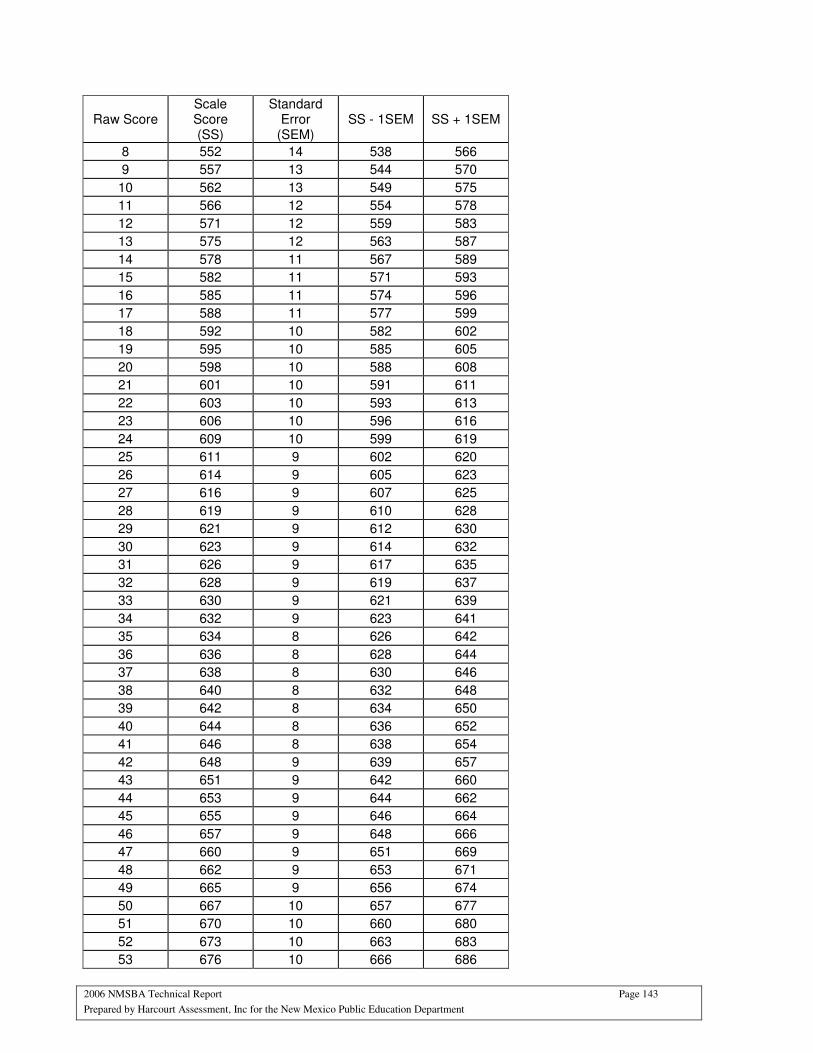
2006 NMSBA Technical Report Page 143
Prepared by Harcourt Assessment, Inc for the New Mexico Public Education Department
Raw Score Scale Score (SS)
Standard Error
(SEM) SS - 1SEM SS + 1SEM
8 552 14 538 566
9 557 13 544 570
10 562 13 549 575
11 566 12 554 578
12 571 12 559 583
13 575 12 563 587
14 578 11 567 589
15 582 11 571 593
16 585 11 574 596
17 588 11 577 599
18 592 10 582 602
19 595 10 585 605
20 598 10 588 608
21 601 10 591 611
22 603 10 593 613
23 606 10 596 616
24 609 10 599 619
25 611 9 602 620
26 614 9 605 623
27 616 9 607 625
28 619 9 610 628
29 621 9 612 630
30 623 9 614 632
31 626 9 617 635
32 628 9 619 637
33 630 9 621 639
34 632 9 623 641
35 634 8 626 642
36 636 8 628 644
37 638 8 630 646
38 640 8 632 648
39 642 8 634 650
40 644 8 636 652
41 646 8 638 654
42 648 9 639 657
43 651 9 642 660
44 653 9 644 662
45 655 9 646 664
46 657 9 648 666
47 660 9 651 669
48 662 9 653 671
49 665 9 656 674
50 667 10 657 677
51 670 10 660 680
52 673 10 663 683
53 676 10 666 686
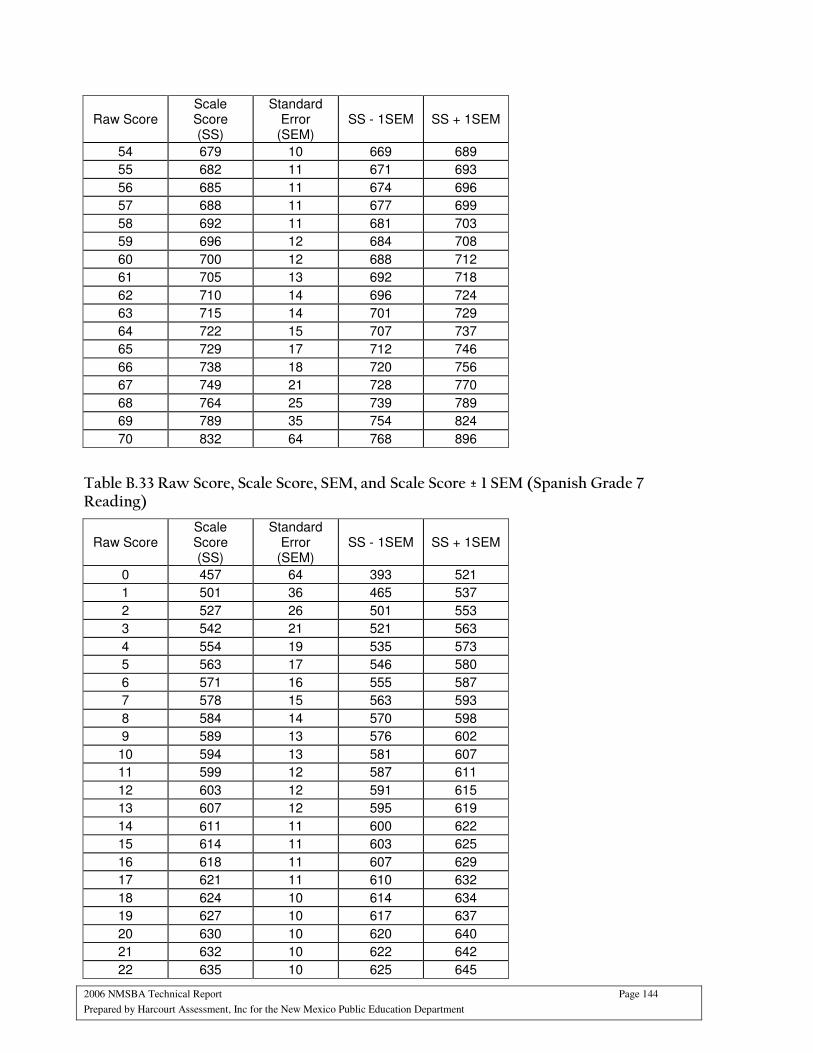
2006 NMSBA Technical Report Page 144
Prepared by Harcourt Assessment, Inc for the New Mexico Public Education Department
Raw Score Scale Score (SS)
Standard Error
(SEM) SS - 1SEM SS + 1SEM
54 679 10 669 689
55 682 11 671 693
56 685 11 674 696
57 688 11 677 699
58 692 11 681 703
59 696 12 684 708
60 700 12 688 712
61 705 13 692 718
62 710 14 696 724
63 715 14 701 729
64 722 15 707 737
65 729 17 712 746
66 738 18 720 756
67 749 21 728 770
68 764 25 739 789
69 789 35 754 824
70 832 64 768 896
Table B.33 Raw Score, Scale Score, SEM, and Scale Score ± 1 SEM (Spanish Grade 7 Reading)
Raw Score Scale Score (SS)
Standard Error
(SEM) SS - 1SEM SS + 1SEM
0 457 64 393 521
1 501 36 465 537
2 527 26 501 553
3 542 21 521 563
4 554 19 535 573
5 563 17 546 580
6 571 16 555 587
7 578 15 563 593
8 584 14 570 598
9 589 13 576 602
10 594 13 581 607
11 599 12 587 611
12 603 12 591 615
13 607 12 595 619
14 611 11 600 622
15 614 11 603 625
16 618 11 607 629
17 621 11 610 632
18 624 10 614 634
19 627 10 617 637
20 630 10 620 640
21 632 10 622 642
22 635 10 625 645

2006 NMSBA Technical Report Page 145
Prepared by Harcourt Assessment, Inc for the New Mexico Public Education Department
Raw Score Scale Score (SS)
Standard Error
(SEM) SS - 1SEM SS + 1SEM
23 638 10 628 648
24 640 9 631 649
25 643 9 634 652
26 645 9 636 654
27 648 9 639 657
28 650 9 641 659
29 652 9 643 661
30 655 9 646 664
31 657 9 648 666
32 659 9 650 668
33 661 9 652 670
34 663 9 654 672
35 666 9 657 675
36 668 9 659 677
37 670 9 661 679
38 672 9 663 681
39 674 9 665 683
40 676 8 668 684
41 678 8 670 686
42 680 8 672 688
43 682 8 674 690
44 684 9 675 693
45 686 9 677 695
46 689 9 680 698
47 691 9 682 700
48 693 9 684 702
49 695 9 686 704
50 697 9 688 706
51 699 9 690 708
52 702 9 693 711
53 704 9 695 713
54 707 9 698 716
55 709 10 699 719
56 712 10 702 722
57 715 10 705 725
58 718 10 708 728
59 721 11 710 732
60 724 11 713 735
61 728 11 717 739
62 732 12 720 744
63 736 12 724 748
64 741 13 728 754
65 746 14 732 760
66 751 15 736 766
67 758 16 742 774
68 766 17 749 783
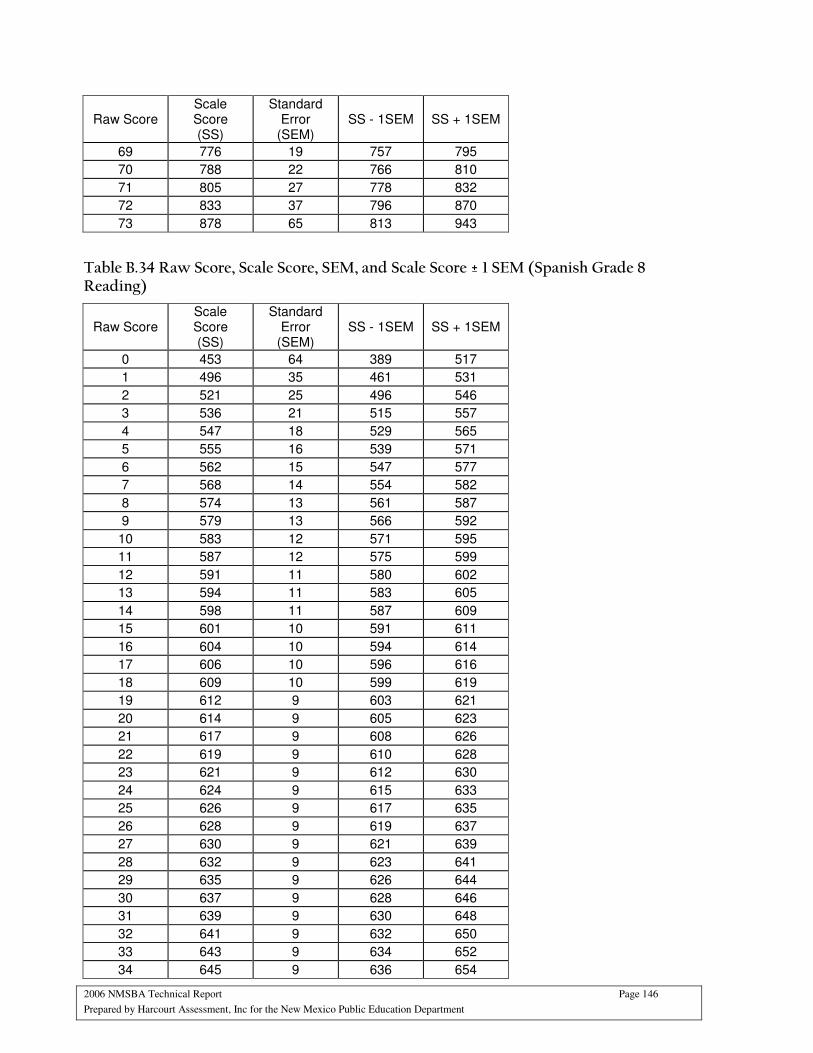
2006 NMSBA Technical Report Page 146
Prepared by Harcourt Assessment, Inc for the New Mexico Public Education Department
Raw Score Scale Score (SS)
Standard Error
(SEM) SS - 1SEM SS + 1SEM
69 776 19 757 795
70 788 22 766 810
71 805 27 778 832
72 833 37 796 870
73 878 65 813 943
Table B.34 Raw Score, Scale Score, SEM, and Scale Score ± 1 SEM (Spanish Grade 8 Reading)
Raw Score Scale Score (SS)
Standard Error
(SEM) SS - 1SEM SS + 1SEM
0 453 64 389 517
1 496 35 461 531
2 521 25 496 546
3 536 21 515 557
4 547 18 529 565
5 555 16 539 571
6 562 15 547 577
7 568 14 554 582
8 574 13 561 587
9 579 13 566 592
10 583 12 571 595
11 587 12 575 599
12 591 11 580 602
13 594 11 583 605
14 598 11 587 609
15 601 10 591 611
16 604 10 594 614
17 606 10 596 616
18 609 10 599 619
19 612 9 603 621
20 614 9 605 623
21 617 9 608 626
22 619 9 610 628
23 621 9 612 630
24 624 9 615 633
25 626 9 617 635
26 628 9 619 637
27 630 9 621 639
28 632 9 623 641
29 635 9 626 644
30 637 9 628 646
31 639 9 630 648
32 641 9 632 650
33 643 9 634 652
34 645 9 636 654
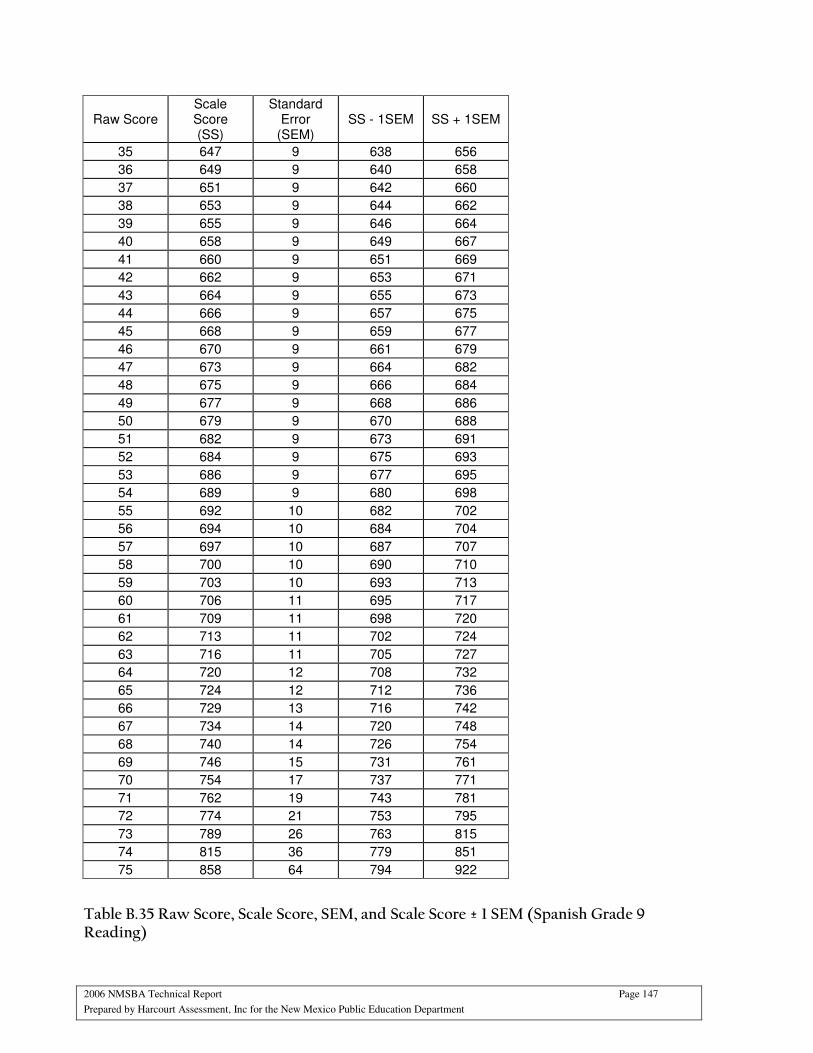
2006 NMSBA Technical Report Page 147
Prepared by Harcourt Assessment, Inc for the New Mexico Public Education Department
Raw Score Scale Score (SS)
Standard Error
(SEM) SS - 1SEM SS + 1SEM
35 647 9 638 656
36 649 9 640 658
37 651 9 642 660
38 653 9 644 662
39 655 9 646 664
40 658 9 649 667
41 660 9 651 669
42 662 9 653 671
43 664 9 655 673
44 666 9 657 675
45 668 9 659 677
46 670 9 661 679
47 673 9 664 682
48 675 9 666 684
49 677 9 668 686
50 679 9 670 688
51 682 9 673 691
52 684 9 675 693
53 686 9 677 695
54 689 9 680 698
55 692 10 682 702
56 694 10 684 704
57 697 10 687 707
58 700 10 690 710
59 703 10 693 713
60 706 11 695 717
61 709 11 698 720
62 713 11 702 724
63 716 11 705 727
64 720 12 708 732
65 724 12 712 736
66 729 13 716 742
67 734 14 720 748
68 740 14 726 754
69 746 15 731 761
70 754 17 737 771
71 762 19 743 781
72 774 21 753 795
73 789 26 763 815
74 815 36 779 851
75 858 64 794 922
Table B.35 Raw Score, Scale Score, SEM, and Scale Score ± 1 SEM (Spanish Grade 9 Reading)

2006 NMSBA Technical Report Page 148
Prepared by Harcourt Assessment, Inc for the New Mexico Public Education Department
Raw Score Scale Score (SS)
Standard Error
(SEM) SS - 1SEM SS + 1SEM
0 443 64 379 507
1 486 36 450 522
2 512 26 486 538
3 527 21 506 548
4 539 19 520 558
5 548 17 531 565
6 555 16 539 571
7 562 15 547 577
8 568 14 554 582
9 573 13 560 586
10 578 13 565 591
11 582 12 570 594
12 587 12 575 599
13 591 12 579 603
14 594 11 583 605
15 598 11 587 609
16 601 11 590 612
17 605 11 594 616
18 608 10 598 618
19 611 10 601 621
20 614 10 604 624
21 616 10 606 626
22 619 10 609 629
23 622 10 612 632
24 624 9 615 633
25 627 9 618 636
26 629 9 620 638
27 632 9 623 641
28 634 9 625 643
29 636 9 627 645
30 638 9 629 647
31 641 9 632 650
32 643 9 634 652
33 645 9 636 654
34 647 9 638 656
35 649 9 640 658
36 651 9 642 660
37 654 9 645 663
38 656 9 647 665
39 658 9 649 667
40 660 9 651 669
41 662 9 653 671
42 664 9 655 673
43 666 9 657 675
44 668 9 659 677
45 671 9 662 680
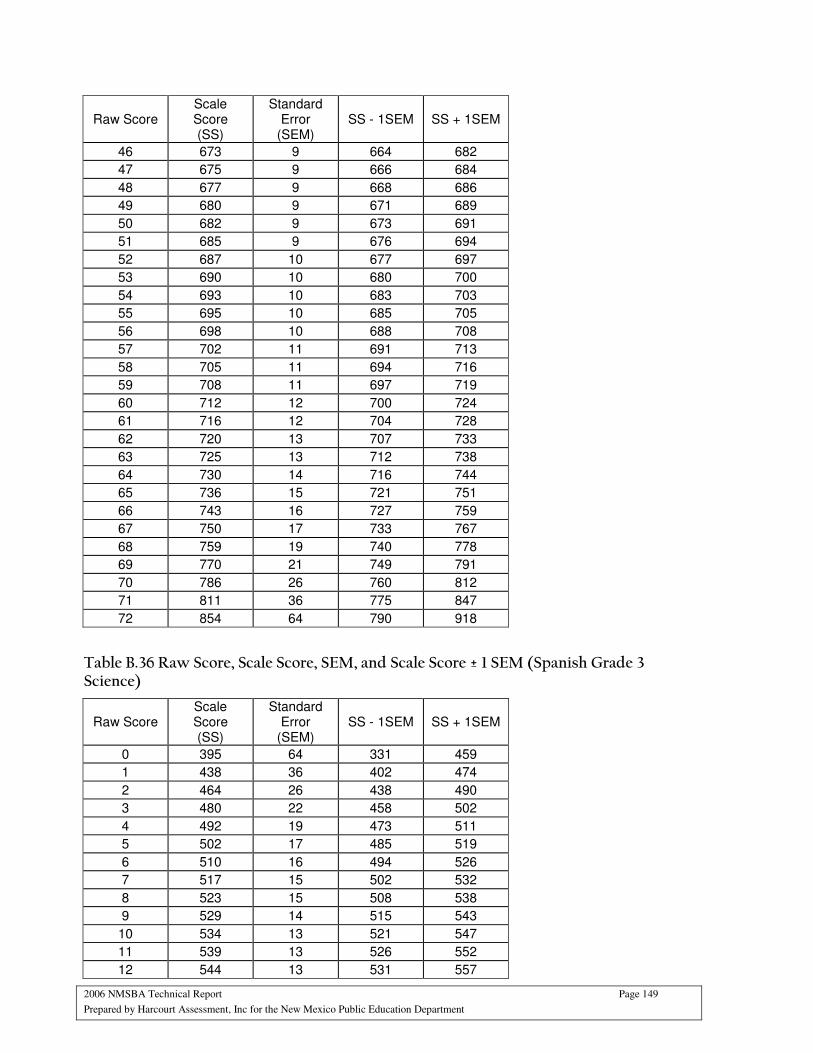
2006 NMSBA Technical Report Page 149
Prepared by Harcourt Assessment, Inc for the New Mexico Public Education Department
Raw Score Scale Score (SS)
Standard Error
(SEM) SS - 1SEM SS + 1SEM
46 673 9 664 682
47 675 9 666 684
48 677 9 668 686
49 680 9 671 689
50 682 9 673 691
51 685 9 676 694
52 687 10 677 697
53 690 10 680 700
54 693 10 683 703
55 695 10 685 705
56 698 10 688 708
57 702 11 691 713
58 705 11 694 716
59 708 11 697 719
60 712 12 700 724
61 716 12 704 728
62 720 13 707 733
63 725 13 712 738
64 730 14 716 744
65 736 15 721 751
66 743 16 727 759
67 750 17 733 767
68 759 19 740 778
69 770 21 749 791
70 786 26 760 812
71 811 36 775 847
72 854 64 790 918
Table B.36 Raw Score, Scale Score, SEM, and Scale Score ± 1 SEM (Spanish Grade 3 Science)
Raw Score Scale Score (SS)
Standard Error
(SEM) SS - 1SEM SS + 1SEM
0 395 64 331 459
1 438 36 402 474
2 464 26 438 490
3 480 22 458 502
4 492 19 473 511
5 502 17 485 519
6 510 16 494 526
7 517 15 502 532
8 523 15 508 538
9 529 14 515 543
10 534 13 521 547
11 539 13 526 552
12 544 13 531 557
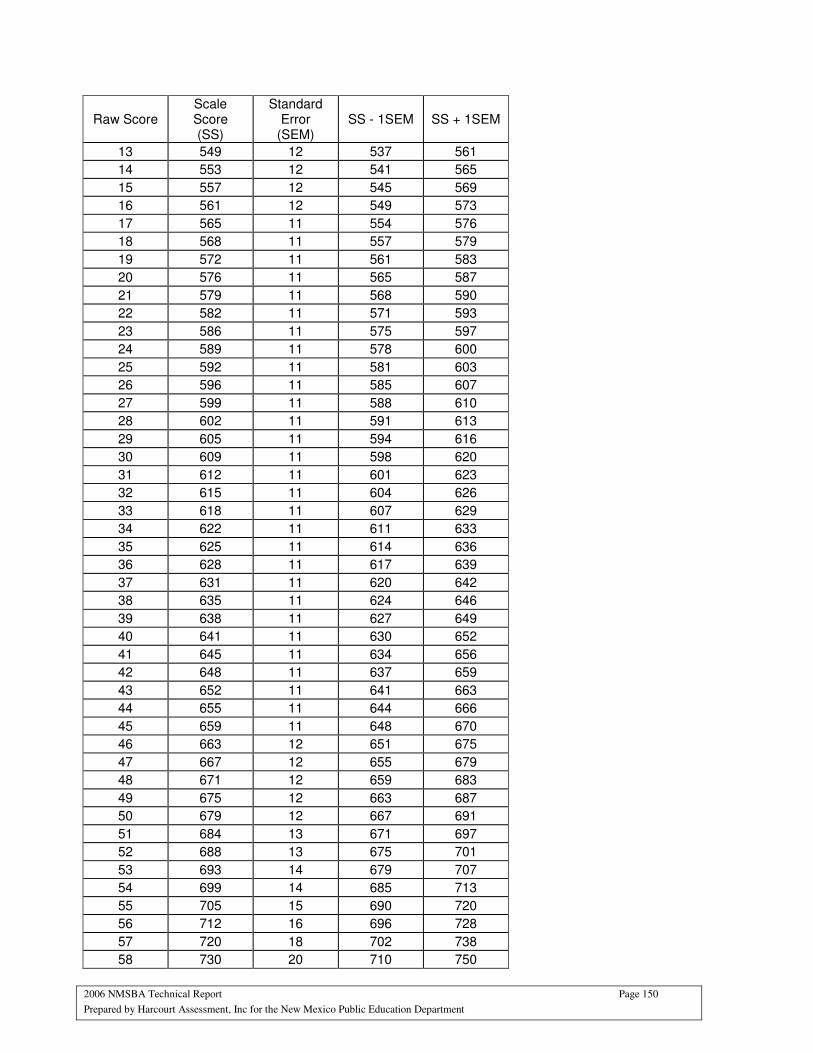
2006 NMSBA Technical Report Page 150
Prepared by Harcourt Assessment, Inc for the New Mexico Public Education Department
Raw Score Scale Score (SS)
Standard Error
(SEM) SS - 1SEM SS + 1SEM
13 549 12 537 561
14 553 12 541 565
15 557 12 545 569
16 561 12 549 573
17 565 11 554 576
18 568 11 557 579
19 572 11 561 583
20 576 11 565 587
21 579 11 568 590
22 582 11 571 593
23 586 11 575 597
24 589 11 578 600
25 592 11 581 603
26 596 11 585 607
27 599 11 588 610
28 602 11 591 613
29 605 11 594 616
30 609 11 598 620
31 612 11 601 623
32 615 11 604 626
33 618 11 607 629
34 622 11 611 633
35 625 11 614 636
36 628 11 617 639
37 631 11 620 642
38 635 11 624 646
39 638 11 627 649
40 641 11 630 652
41 645 11 634 656
42 648 11 637 659
43 652 11 641 663
44 655 11 644 666
45 659 11 648 670
46 663 12 651 675
47 667 12 655 679
48 671 12 659 683
49 675 12 663 687
50 679 12 667 691
51 684 13 671 697
52 688 13 675 701
53 693 14 679 707
54 699 14 685 713
55 705 15 690 720
56 712 16 696 728
57 720 18 702 738
58 730 20 710 750
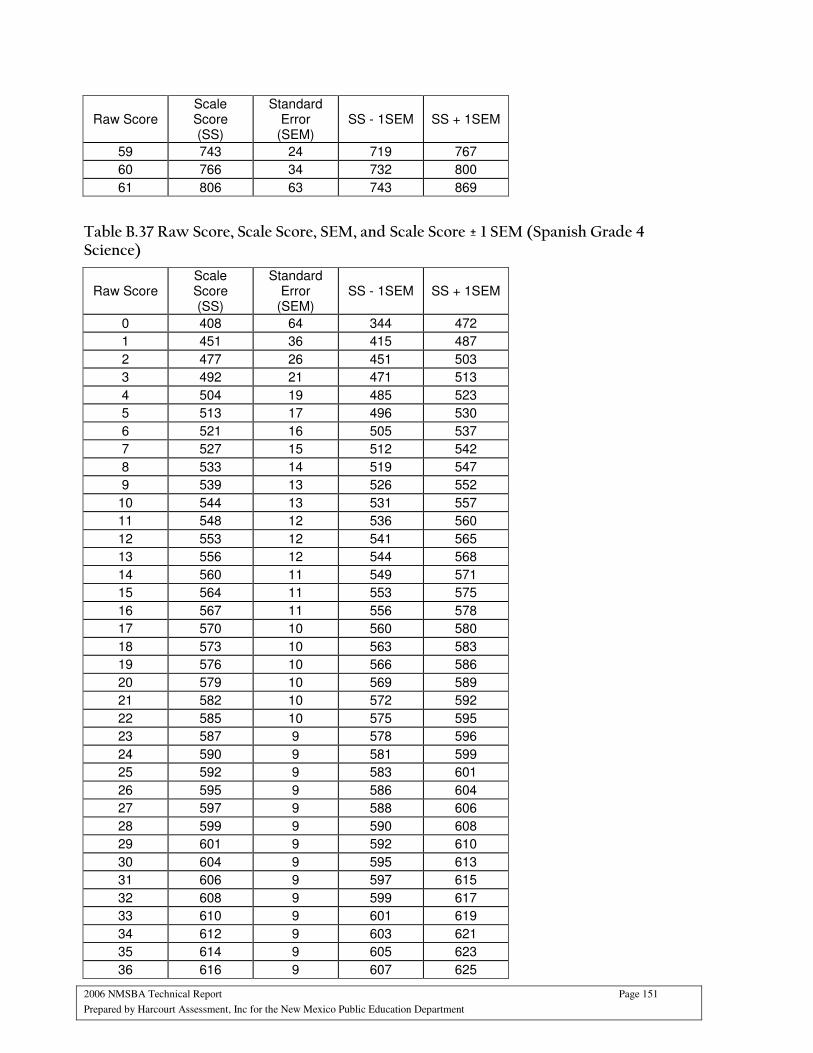
2006 NMSBA Technical Report Page 151
Prepared by Harcourt Assessment, Inc for the New Mexico Public Education Department
Raw Score Scale Score (SS)
Standard Error
(SEM) SS - 1SEM SS + 1SEM
59 743 24 719 767
60 766 34 732 800
61 806 63 743 869
Table B.37 Raw Score, Scale Score, SEM, and Scale Score ± 1 SEM (Spanish Grade 4 Science)
Raw Score Scale Score (SS)
Standard Error
(SEM) SS - 1SEM SS + 1SEM
0 408 64 344 472
1 451 36 415 487
2 477 26 451 503
3 492 21 471 513
4 504 19 485 523
5 513 17 496 530
6 521 16 505 537
7 527 15 512 542
8 533 14 519 547
9 539 13 526 552
10 544 13 531 557
11 548 12 536 560
12 553 12 541 565
13 556 12 544 568
14 560 11 549 571
15 564 11 553 575
16 567 11 556 578
17 570 10 560 580
18 573 10 563 583
19 576 10 566 586
20 579 10 569 589
21 582 10 572 592
22 585 10 575 595
23 587 9 578 596
24 590 9 581 599
25 592 9 583 601
26 595 9 586 604
27 597 9 588 606
28 599 9 590 608
29 601 9 592 610
30 604 9 595 613
31 606 9 597 615
32 608 9 599 617
33 610 9 601 619
34 612 9 603 621
35 614 9 605 623
36 616 9 607 625
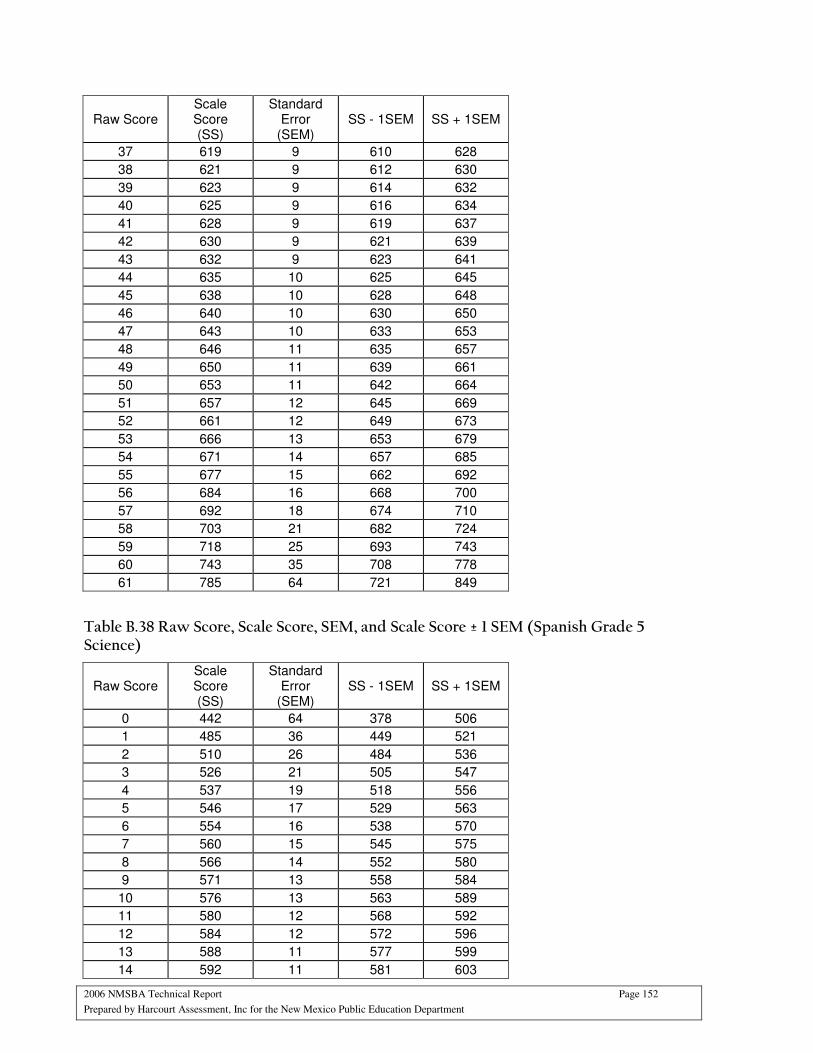
2006 NMSBA Technical Report Page 152
Prepared by Harcourt Assessment, Inc for the New Mexico Public Education Department
Raw Score Scale Score (SS)
Standard Error
(SEM) SS - 1SEM SS + 1SEM
37 619 9 610 628
38 621 9 612 630
39 623 9 614 632
40 625 9 616 634
41 628 9 619 637
42 630 9 621 639
43 632 9 623 641
44 635 10 625 645
45 638 10 628 648
46 640 10 630 650
47 643 10 633 653
48 646 11 635 657
49 650 11 639 661
50 653 11 642 664
51 657 12 645 669
52 661 12 649 673
53 666 13 653 679
54 671 14 657 685
55 677 15 662 692
56 684 16 668 700
57 692 18 674 710
58 703 21 682 724
59 718 25 693 743
60 743 35 708 778
61 785 64 721 849
Table B.38 Raw Score, Scale Score, SEM, and Scale Score ± 1 SEM (Spanish Grade 5 Science)
Raw Score Scale Score (SS)
Standard Error
(SEM) SS - 1SEM SS + 1SEM
0 442 64 378 506
1 485 36 449 521
2 510 26 484 536
3 526 21 505 547
4 537 19 518 556
5 546 17 529 563
6 554 16 538 570
7 560 15 545 575
8 566 14 552 580
9 571 13 558 584
10 576 13 563 589
11 580 12 568 592
12 584 12 572 596
13 588 11 577 599
14 592 11 581 603
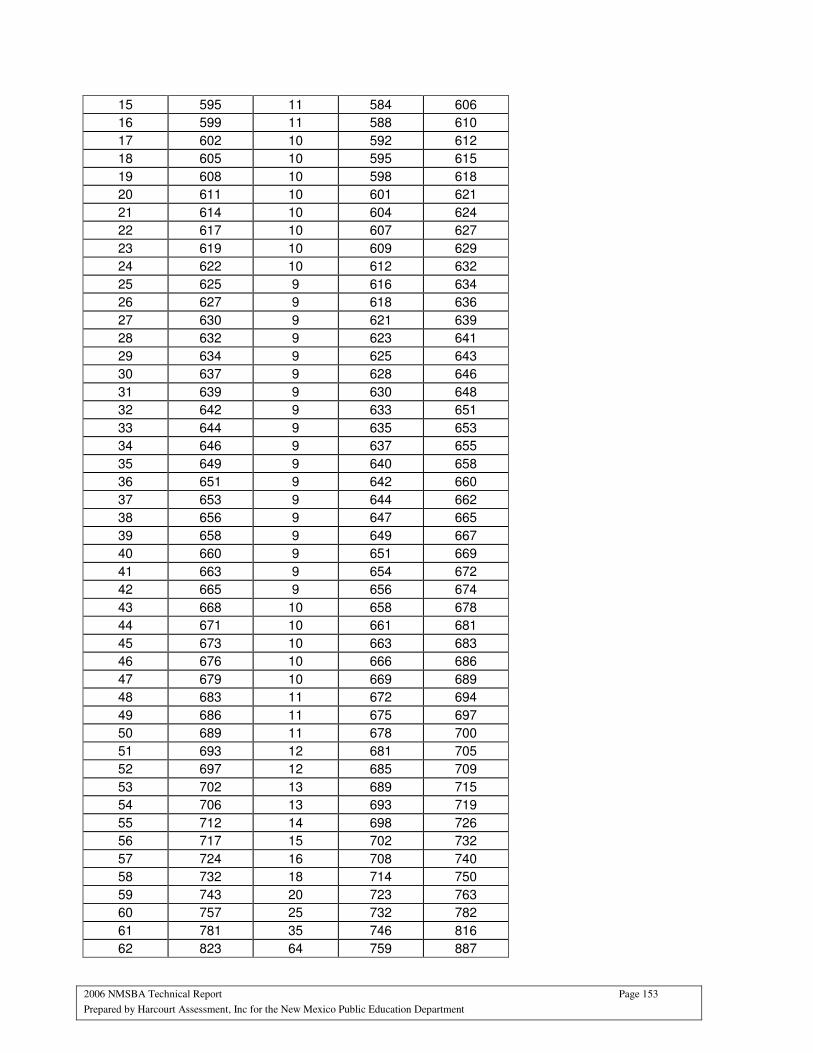
2006 NMSBA Technical Report Page 153
Prepared by Harcourt Assessment, Inc for the New Mexico Public Education Department
15 595 11 584 606
16 599 11 588 610
17 602 10 592 612
18 605 10 595 615
19 608 10 598 618
20 611 10 601 621
21 614 10 604 624
22 617 10 607 627
23 619 10 609 629
24 622 10 612 632
25 625 9 616 634
26 627 9 618 636
27 630 9 621 639
28 632 9 623 641
29 634 9 625 643
30 637 9 628 646
31 639 9 630 648
32 642 9 633 651
33 644 9 635 653
34 646 9 637 655
35 649 9 640 658
36 651 9 642 660
37 653 9 644 662
38 656 9 647 665
39 658 9 649 667
40 660 9 651 669
41 663 9 654 672
42 665 9 656 674
43 668 10 658 678
44 671 10 661 681
45 673 10 663 683
46 676 10 666 686
47 679 10 669 689
48 683 11 672 694
49 686 11 675 697
50 689 11 678 700
51 693 12 681 705
52 697 12 685 709
53 702 13 689 715
54 706 13 693 719
55 712 14 698 726
56 717 15 702 732
57 724 16 708 740
58 732 18 714 750
59 743 20 723 763
60 757 25 732 782
61 781 35 746 816
62 823 64 759 887
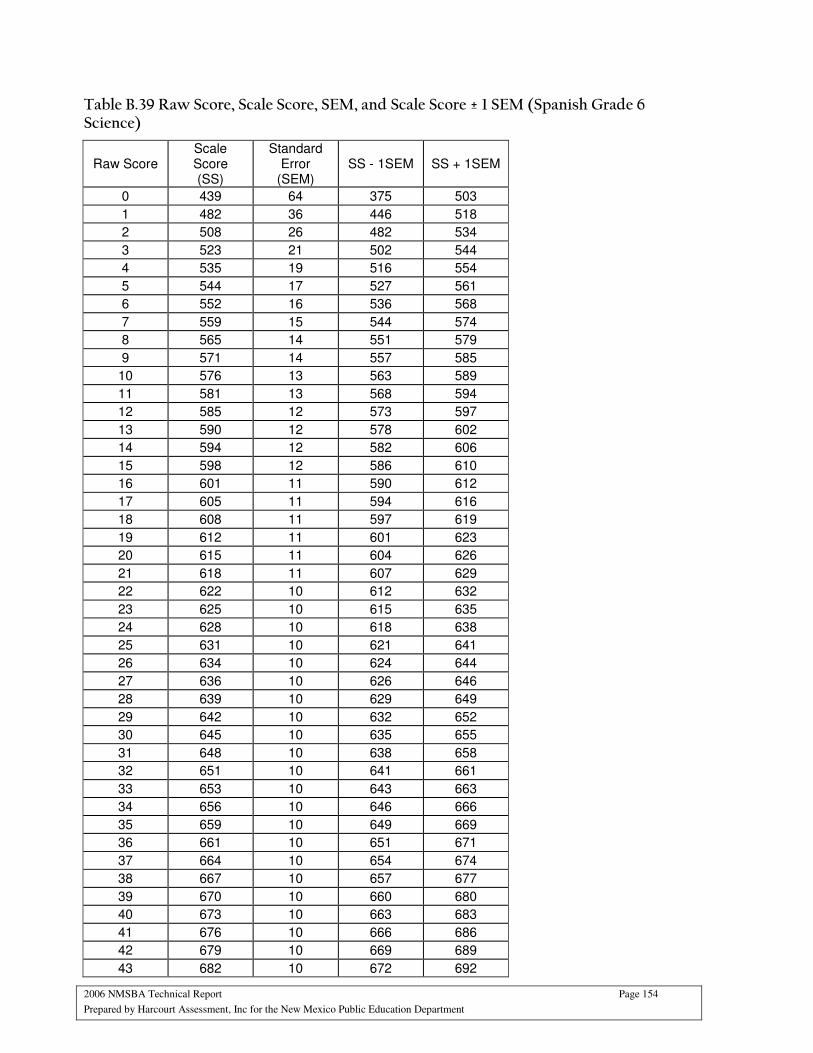
2006 NMSBA Technical Report Page 154
Prepared by Harcourt Assessment, Inc for the New Mexico Public Education Department
Table B.39 Raw Score, Scale Score, SEM, and Scale Score ± 1 SEM (Spanish Grade 6 Science)
Raw Score Scale Score (SS)
Standard Error
(SEM) SS - 1SEM SS + 1SEM
0 439 64 375 503
1 482 36 446 518
2 508 26 482 534
3 523 21 502 544
4 535 19 516 554
5 544 17 527 561
6 552 16 536 568
7 559 15 544 574
8 565 14 551 579
9 571 14 557 585
10 576 13 563 589
11 581 13 568 594
12 585 12 573 597
13 590 12 578 602
14 594 12 582 606
15 598 12 586 610
16 601 11 590 612
17 605 11 594 616
18 608 11 597 619
19 612 11 601 623
20 615 11 604 626
21 618 11 607 629
22 622 10 612 632
23 625 10 615 635
24 628 10 618 638
25 631 10 621 641
26 634 10 624 644
27 636 10 626 646
28 639 10 629 649
29 642 10 632 652
30 645 10 635 655
31 648 10 638 658
32 651 10 641 661
33 653 10 643 663
34 656 10 646 666
35 659 10 649 669
36 661 10 651 671
37 664 10 654 674
38 667 10 657 677
39 670 10 660 680
40 673 10 663 683
41 676 10 666 686
42 679 10 669 689
43 682 10 672 692
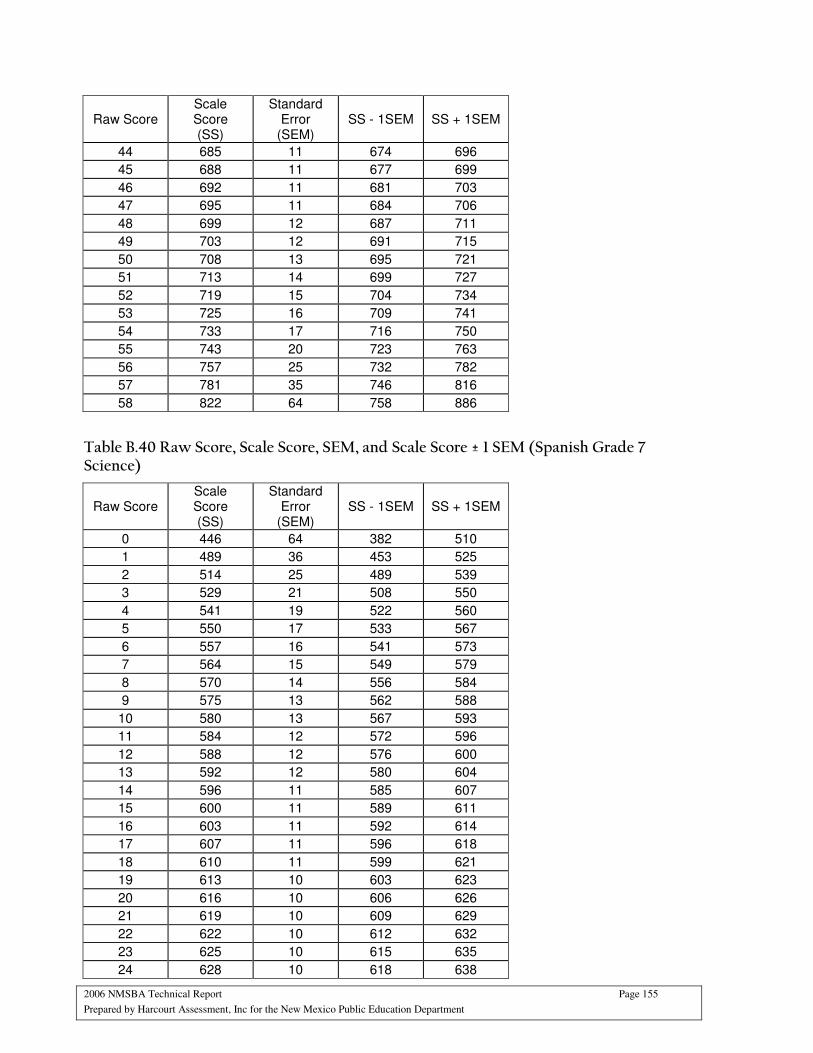
2006 NMSBA Technical Report Page 155
Prepared by Harcourt Assessment, Inc for the New Mexico Public Education Department
Raw Score Scale Score (SS)
Standard Error
(SEM) SS - 1SEM SS + 1SEM
44 685 11 674 696
45 688 11 677 699
46 692 11 681 703
47 695 11 684 706
48 699 12 687 711
49 703 12 691 715
50 708 13 695 721
51 713 14 699 727
52 719 15 704 734
53 725 16 709 741
54 733 17 716 750
55 743 20 723 763
56 757 25 732 782
57 781 35 746 816
58 822 64 758 886
Table B.40 Raw Score, Scale Score, SEM, and Scale Score ± 1 SEM (Spanish Grade 7 Science)
Raw Score Scale Score (SS)
Standard Error
(SEM) SS - 1SEM SS + 1SEM
0 446 64 382 510
1 489 36 453 525
2 514 25 489 539
3 529 21 508 550
4 541 19 522 560
5 550 17 533 567
6 557 16 541 573
7 564 15 549 579
8 570 14 556 584
9 575 13 562 588
10 580 13 567 593
11 584 12 572 596
12 588 12 576 600
13 592 12 580 604
14 596 11 585 607
15 600 11 589 611
16 603 11 592 614
17 607 11 596 618
18 610 11 599 621
19 613 10 603 623
20 616 10 606 626
21 619 10 609 629
22 622 10 612 632
23 625 10 615 635
24 628 10 618 638
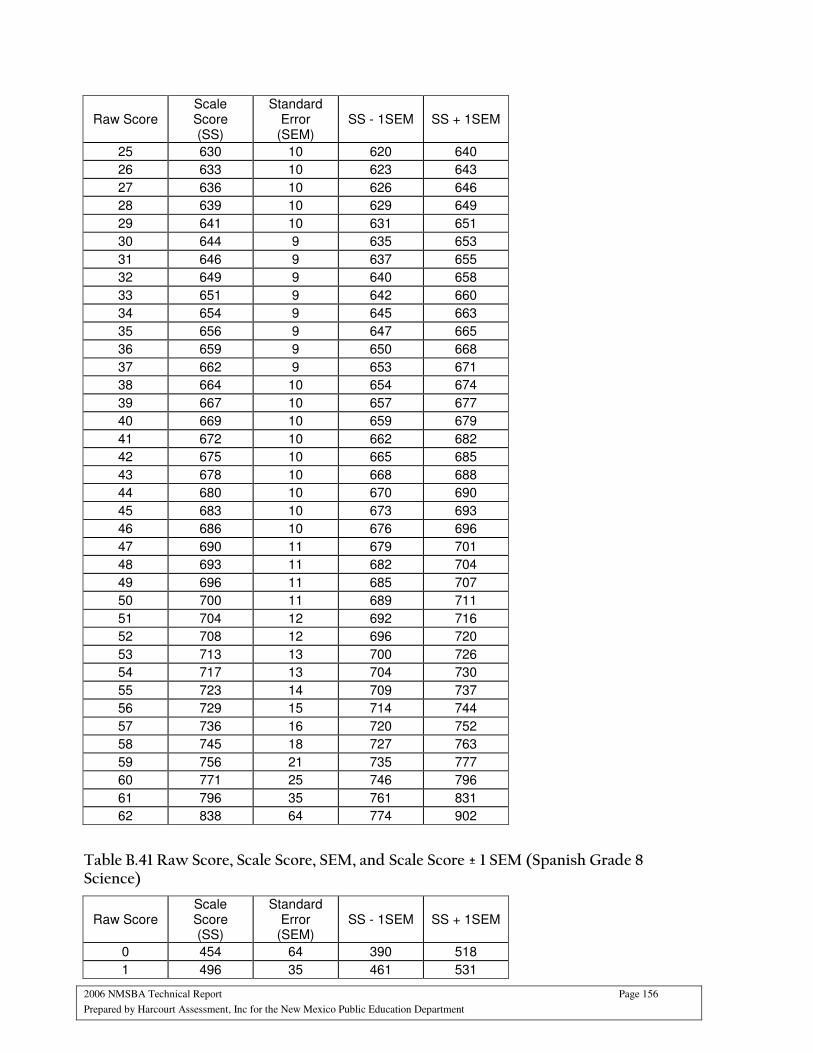
2006 NMSBA Technical Report Page 156
Prepared by Harcourt Assessment, Inc for the New Mexico Public Education Department
Raw Score Scale Score (SS)
Standard Error
(SEM) SS - 1SEM SS + 1SEM
25 630 10 620 640
26 633 10 623 643
27 636 10 626 646
28 639 10 629 649
29 641 10 631 651
30 644 9 635 653
31 646 9 637 655
32 649 9 640 658
33 651 9 642 660
34 654 9 645 663
35 656 9 647 665
36 659 9 650 668
37 662 9 653 671
38 664 10 654 674
39 667 10 657 677
40 669 10 659 679
41 672 10 662 682
42 675 10 665 685
43 678 10 668 688
44 680 10 670 690
45 683 10 673 693
46 686 10 676 696
47 690 11 679 701
48 693 11 682 704
49 696 11 685 707
50 700 11 689 711
51 704 12 692 716
52 708 12 696 720
53 713 13 700 726
54 717 13 704 730
55 723 14 709 737
56 729 15 714 744
57 736 16 720 752
58 745 18 727 763
59 756 21 735 777
60 771 25 746 796
61 796 35 761 831
62 838 64 774 902
Table B.41 Raw Score, Scale Score, SEM, and Scale Score ± 1 SEM (Spanish Grade 8 Science)
Raw Score Scale Score (SS)
Standard Error
(SEM) SS - 1SEM SS + 1SEM
0 454 64 390 518
1 496 35 461 531

2006 NMSBA Technical Report Page 157
Prepared by Harcourt Assessment, Inc for the New Mexico Public Education Department
Raw Score Scale Score (SS)
Standard Error
(SEM) SS - 1SEM SS + 1SEM
2 522 25 497 547
3 537 21 516 558
4 548 19 529 567
5 557 17 540 574
6 564 15 549 579
7 571 14 557 585
8 576 14 562 590
9 581 13 568 594
10 586 12 574 598
11 590 12 578 602
12 594 12 582 606
13 598 11 587 609
14 602 11 591 613
15 605 11 594 616
16 608 10 598 618
17 611 10 601 621
18 614 10 604 624
19 617 10 607 627
20 620 10 610 630
21 622 10 612 632
22 625 9 616 634
23 628 9 619 637
24 630 9 621 639
25 633 9 624 642
26 635 9 626 644
27 637 9 628 646
28 640 9 631 649
29 642 9 633 651
30 645 9 636 654
31 647 9 638 656
32 649 9 640 658
33 652 9 643 661
34 654 9 645 663
35 656 9 647 665
36 659 9 650 668
37 661 9 652 670
38 664 9 655 673
39 666 9 657 675
40 669 10 659 679
41 672 10 662 682
42 674 10 664 684
43 677 10 667 687
44 680 10 670 690
45 683 10 673 693
46 686 11 675 697
47 689 11 678 700
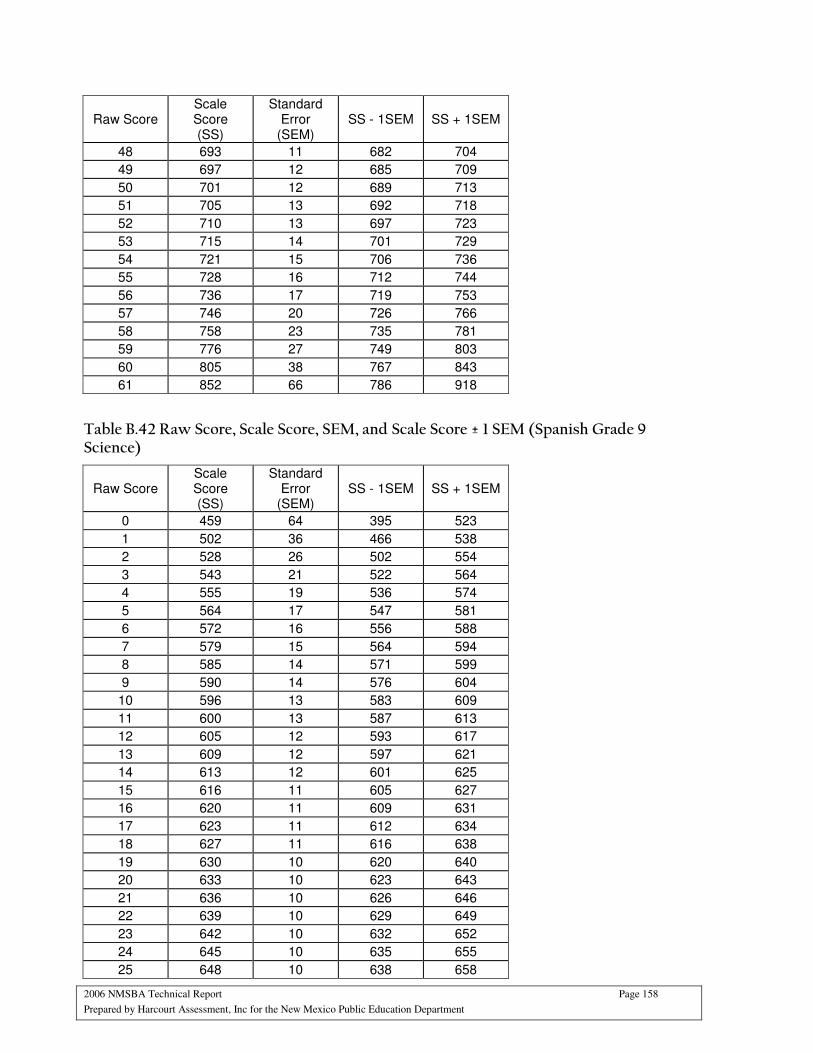
2006 NMSBA Technical Report Page 158
Prepared by Harcourt Assessment, Inc for the New Mexico Public Education Department
Raw Score Scale Score (SS)
Standard Error
(SEM) SS - 1SEM SS + 1SEM
48 693 11 682 704
49 697 12 685 709
50 701 12 689 713
51 705 13 692 718
52 710 13 697 723
53 715 14 701 729
54 721 15 706 736
55 728 16 712 744
56 736 17 719 753
57 746 20 726 766
58 758 23 735 781
59 776 27 749 803
60 805 38 767 843
61 852 66 786 918
Table B.42 Raw Score, Scale Score, SEM, and Scale Score ± 1 SEM (Spanish Grade 9 Science)
Raw Score Scale Score (SS)
Standard Error
(SEM) SS - 1SEM SS + 1SEM
0 459 64 395 523
1 502 36 466 538
2 528 26 502 554
3 543 21 522 564
4 555 19 536 574
5 564 17 547 581
6 572 16 556 588
7 579 15 564 594
8 585 14 571 599
9 590 14 576 604
10 596 13 583 609
11 600 13 587 613
12 605 12 593 617
13 609 12 597 621
14 613 12 601 625
15 616 11 605 627
16 620 11 609 631
17 623 11 612 634
18 627 11 616 638
19 630 10 620 640
20 633 10 623 643
21 636 10 626 646
22 639 10 629 649
23 642 10 632 652
24 645 10 635 655
25 648 10 638 658
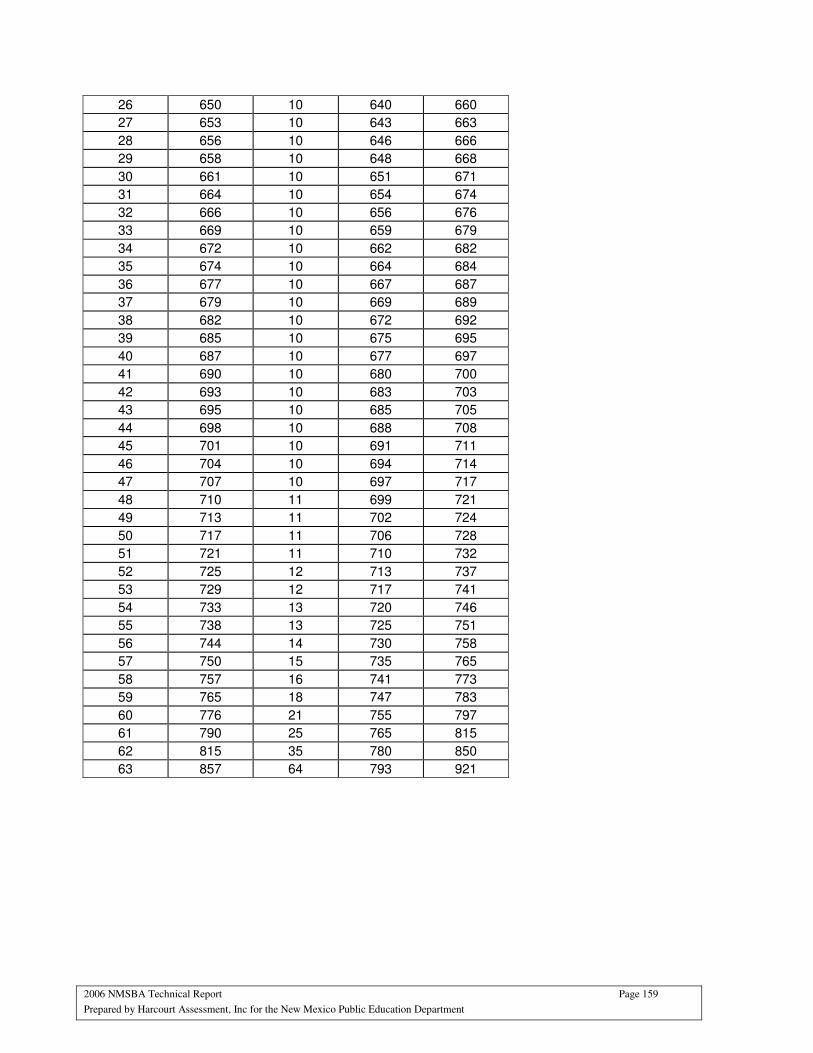
2006 NMSBA Technical Report Page 159
Prepared by Harcourt Assessment, Inc for the New Mexico Public Education Department
26 650 10 640 660
27 653 10 643 663
28 656 10 646 666
29 658 10 648 668
30 661 10 651 671
31 664 10 654 674
32 666 10 656 676
33 669 10 659 679
34 672 10 662 682
35 674 10 664 684
36 677 10 667 687
37 679 10 669 689
38 682 10 672 692
39 685 10 675 695
40 687 10 677 697
41 690 10 680 700
42 693 10 683 703
43 695 10 685 705
44 698 10 688 708
45 701 10 691 711
46 704 10 694 714
47 707 10 697 717
48 710 11 699 721
49 713 11 702 724
50 717 11 706 728
51 721 11 710 732
52 725 12 713 737
53 729 12 717 741
54 733 13 720 746
55 738 13 725 751
56 744 14 730 758
57 750 15 735 765
58 757 16 741 773
59 765 18 747 783
60 776 21 755 797
61 790 25 765 815
62 815 35 780 850
63 857 64 793 921
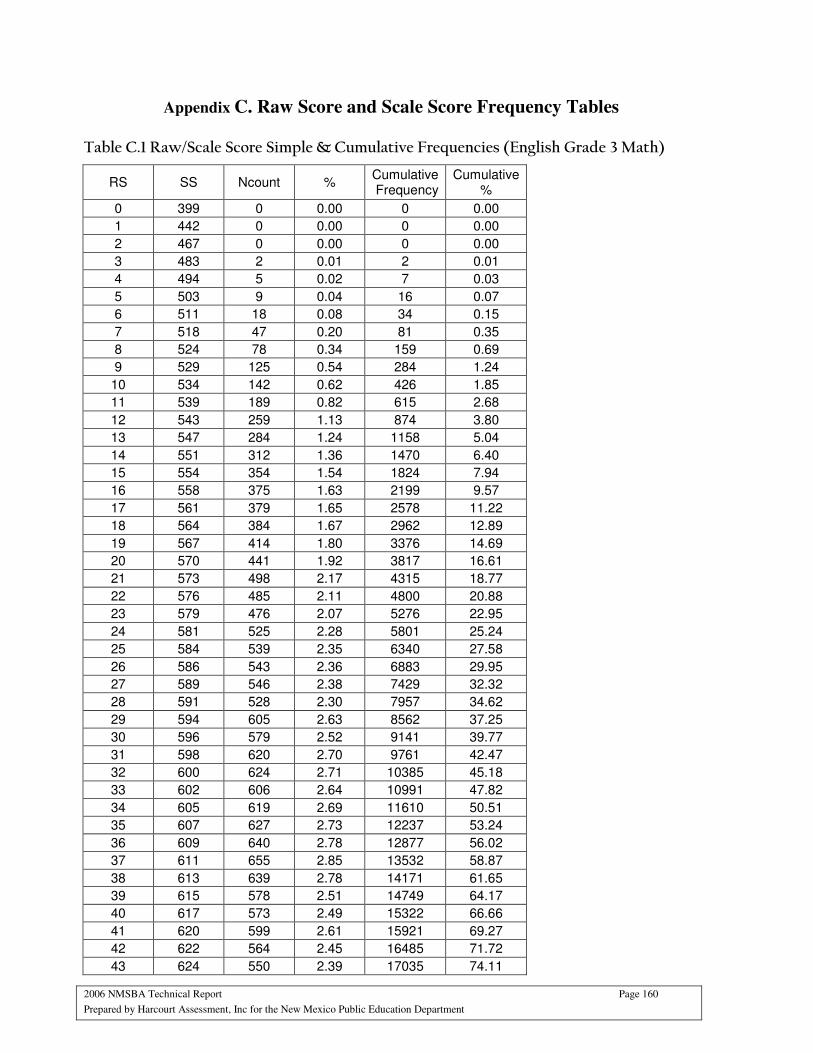
2006 NMSBA Technical Report Page 160
Prepared by Harcourt Assessment, Inc for the New Mexico Public Education Department
Appendix C. Raw Score and Scale Score Frequency Tables
Table C.1 Raw/Scale Score Simple & Cumulative Frequencies (English Grade 3 Math)
RS SS Ncount % Cumulative Frequency
Cumulative %
0 399 0 0.00 0 0.00
1 442 0 0.00 0 0.00
2 467 0 0.00 0 0.00
3 483 2 0.01 2 0.01
4 494 5 0.02 7 0.03
5 503 9 0.04 16 0.07
6 511 18 0.08 34 0.15
7 518 47 0.20 81 0.35
8 524 78 0.34 159 0.69
9 529 125 0.54 284 1.24
10 534 142 0.62 426 1.85
11 539 189 0.82 615 2.68
12 543 259 1.13 874 3.80
13 547 284 1.24 1158 5.04
14 551 312 1.36 1470 6.40
15 554 354 1.54 1824 7.94
16 558 375 1.63 2199 9.57
17 561 379 1.65 2578 11.22
18 564 384 1.67 2962 12.89
19 567 414 1.80 3376 14.69
20 570 441 1.92 3817 16.61
21 573 498 2.17 4315 18.77
22 576 485 2.11 4800 20.88
23 579 476 2.07 5276 22.95
24 581 525 2.28 5801 25.24
25 584 539 2.35 6340 27.58
26 586 543 2.36 6883 29.95
27 589 546 2.38 7429 32.32
28 591 528 2.30 7957 34.62
29 594 605 2.63 8562 37.25
30 596 579 2.52 9141 39.77
31 598 620 2.70 9761 42.47
32 600 624 2.71 10385 45.18
33 602 606 2.64 10991 47.82
34 605 619 2.69 11610 50.51
35 607 627 2.73 12237 53.24
36 609 640 2.78 12877 56.02
37 611 655 2.85 13532 58.87
38 613 639 2.78 14171 61.65
39 615 578 2.51 14749 64.17
40 617 573 2.49 15322 66.66
41 620 599 2.61 15921 69.27
42 622 564 2.45 16485 71.72
43 624 550 2.39 17035 74.11
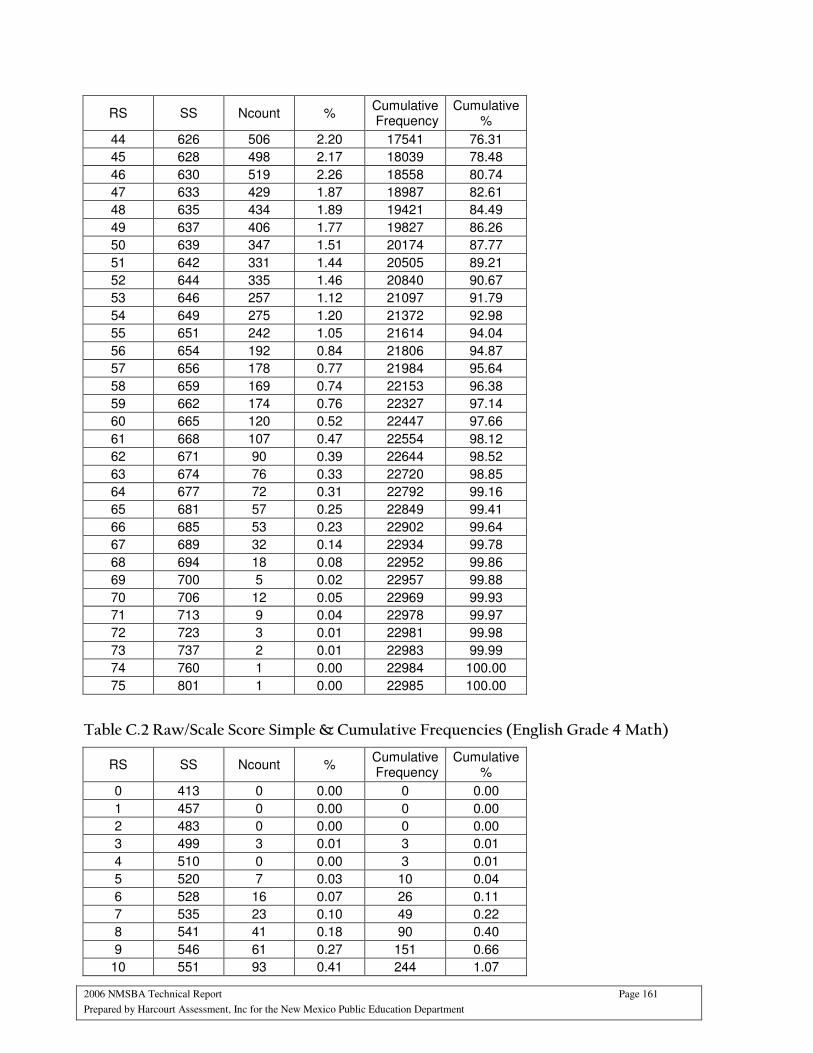
2006 NMSBA Technical Report Page 161
Prepared by Harcourt Assessment, Inc for the New Mexico Public Education Department
RS SS Ncount % Cumulative Frequency
Cumulative %
44 626 506 2.20 17541 76.31
45 628 498 2.17 18039 78.48
46 630 519 2.26 18558 80.74
47 633 429 1.87 18987 82.61
48 635 434 1.89 19421 84.49
49 637 406 1.77 19827 86.26
50 639 347 1.51 20174 87.77
51 642 331 1.44 20505 89.21
52 644 335 1.46 20840 90.67
53 646 257 1.12 21097 91.79
54 649 275 1.20 21372 92.98
55 651 242 1.05 21614 94.04
56 654 192 0.84 21806 94.87
57 656 178 0.77 21984 95.64
58 659 169 0.74 22153 96.38
59 662 174 0.76 22327 97.14
60 665 120 0.52 22447 97.66
61 668 107 0.47 22554 98.12
62 671 90 0.39 22644 98.52
63 674 76 0.33 22720 98.85
64 677 72 0.31 22792 99.16
65 681 57 0.25 22849 99.41
66 685 53 0.23 22902 99.64
67 689 32 0.14 22934 99.78
68 694 18 0.08 22952 99.86
69 700 5 0.02 22957 99.88
70 706 12 0.05 22969 99.93
71 713 9 0.04 22978 99.97
72 723 3 0.01 22981 99.98
73 737 2 0.01 22983 99.99
74 760 1 0.00 22984 100.00
75 801 1 0.00 22985 100.00
Table C.2 Raw/Scale Score Simple & Cumulative Frequencies (English Grade 4 Math)
RS SS Ncount % Cumulative Frequency
Cumulative %
0 413 0 0.00 0 0.00
1 457 0 0.00 0 0.00
2 483 0 0.00 0 0.00
3 499 3 0.01 3 0.01
4 510 0 0.00 3 0.01
5 520 7 0.03 10 0.04
6 528 16 0.07 26 0.11
7 535 23 0.10 49 0.22
8 541 41 0.18 90 0.40
9 546 61 0.27 151 0.66
10 551 93 0.41 244 1.07
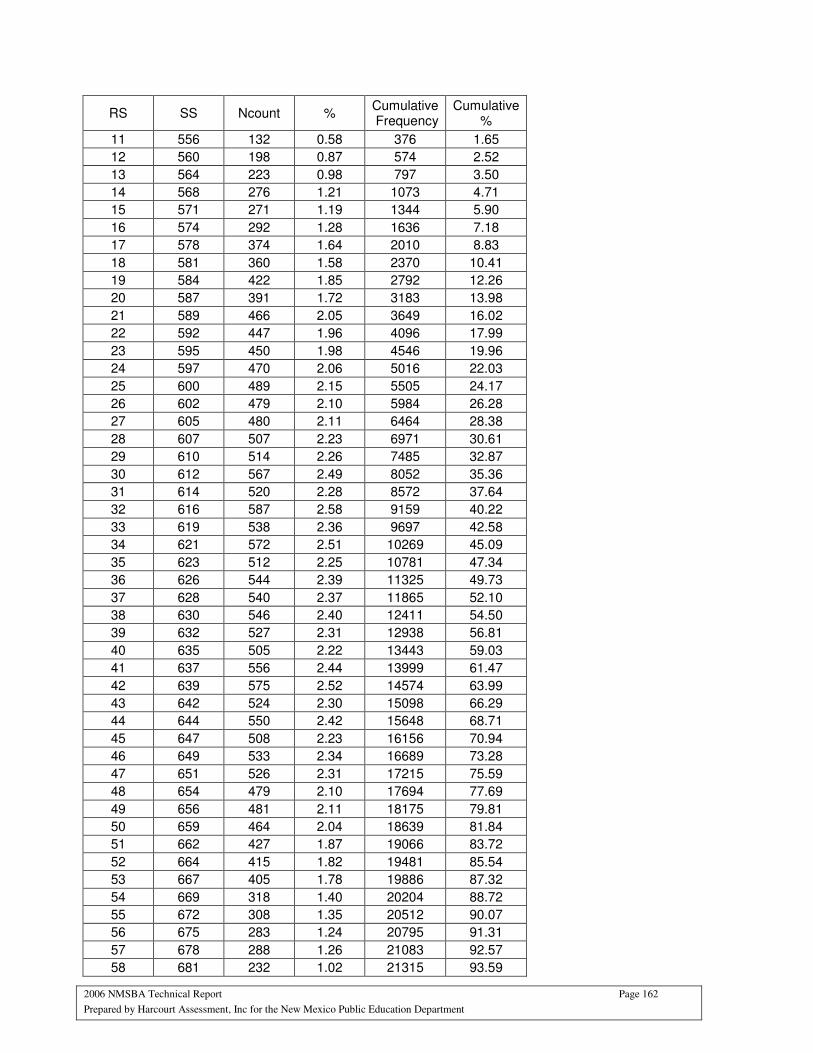
2006 NMSBA Technical Report Page 162
Prepared by Harcourt Assessment, Inc for the New Mexico Public Education Department
RS SS Ncount % Cumulative Frequency
Cumulative %
11 556 132 0.58 376 1.65
12 560 198 0.87 574 2.52
13 564 223 0.98 797 3.50
14 568 276 1.21 1073 4.71
15 571 271 1.19 1344 5.90
16 574 292 1.28 1636 7.18
17 578 374 1.64 2010 8.83
18 581 360 1.58 2370 10.41
19 584 422 1.85 2792 12.26
20 587 391 1.72 3183 13.98
21 589 466 2.05 3649 16.02
22 592 447 1.96 4096 17.99
23 595 450 1.98 4546 19.96
24 597 470 2.06 5016 22.03
25 600 489 2.15 5505 24.17
26 602 479 2.10 5984 26.28
27 605 480 2.11 6464 28.38
28 607 507 2.23 6971 30.61
29 610 514 2.26 7485 32.87
30 612 567 2.49 8052 35.36
31 614 520 2.28 8572 37.64
32 616 587 2.58 9159 40.22
33 619 538 2.36 9697 42.58
34 621 572 2.51 10269 45.09
35 623 512 2.25 10781 47.34
36 626 544 2.39 11325 49.73
37 628 540 2.37 11865 52.10
38 630 546 2.40 12411 54.50
39 632 527 2.31 12938 56.81
40 635 505 2.22 13443 59.03
41 637 556 2.44 13999 61.47
42 639 575 2.52 14574 63.99
43 642 524 2.30 15098 66.29
44 644 550 2.42 15648 68.71
45 647 508 2.23 16156 70.94
46 649 533 2.34 16689 73.28
47 651 526 2.31 17215 75.59
48 654 479 2.10 17694 77.69
49 656 481 2.11 18175 79.81
50 659 464 2.04 18639 81.84
51 662 427 1.87 19066 83.72
52 664 415 1.82 19481 85.54
53 667 405 1.78 19886 87.32
54 669 318 1.40 20204 88.72
55 672 308 1.35 20512 90.07
56 675 283 1.24 20795 91.31
57 678 288 1.26 21083 92.57
58 681 232 1.02 21315 93.59
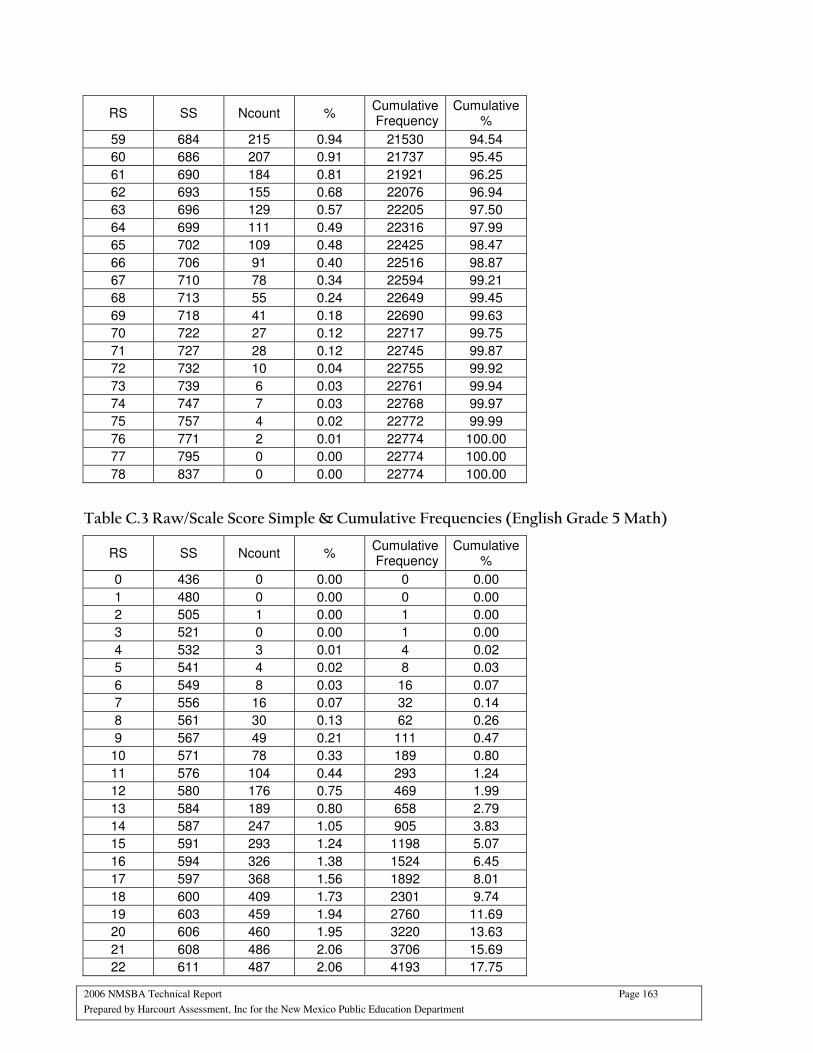
2006 NMSBA Technical Report Page 163
Prepared by Harcourt Assessment, Inc for the New Mexico Public Education Department
RS SS Ncount % Cumulative Frequency
Cumulative %
59 684 215 0.94 21530 94.54
60 686 207 0.91 21737 95.45
61 690 184 0.81 21921 96.25
62 693 155 0.68 22076 96.94
63 696 129 0.57 22205 97.50
64 699 111 0.49 22316 97.99
65 702 109 0.48 22425 98.47
66 706 91 0.40 22516 98.87
67 710 78 0.34 22594 99.21
68 713 55 0.24 22649 99.45
69 718 41 0.18 22690 99.63
70 722 27 0.12 22717 99.75
71 727 28 0.12 22745 99.87
72 732 10 0.04 22755 99.92
73 739 6 0.03 22761 99.94
74 747 7 0.03 22768 99.97
75 757 4 0.02 22772 99.99
76 771 2 0.01 22774 100.00
77 795 0 0.00 22774 100.00
78 837 0 0.00 22774 100.00
Table C.3 Raw/Scale Score Simple & Cumulative Frequencies (English Grade 5 Math)
RS SS Ncount % Cumulative Frequency
Cumulative %
0 436 0 0.00 0 0.00
1 480 0 0.00 0 0.00
2 505 1 0.00 1 0.00
3 521 0 0.00 1 0.00
4 532 3 0.01 4 0.02
5 541 4 0.02 8 0.03
6 549 8 0.03 16 0.07
7 556 16 0.07 32 0.14
8 561 30 0.13 62 0.26
9 567 49 0.21 111 0.47
10 571 78 0.33 189 0.80
11 576 104 0.44 293 1.24
12 580 176 0.75 469 1.99
13 584 189 0.80 658 2.79
14 587 247 1.05 905 3.83
15 591 293 1.24 1198 5.07
16 594 326 1.38 1524 6.45
17 597 368 1.56 1892 8.01
18 600 409 1.73 2301 9.74
19 603 459 1.94 2760 11.69
20 606 460 1.95 3220 13.63
21 608 486 2.06 3706 15.69
22 611 487 2.06 4193 17.75
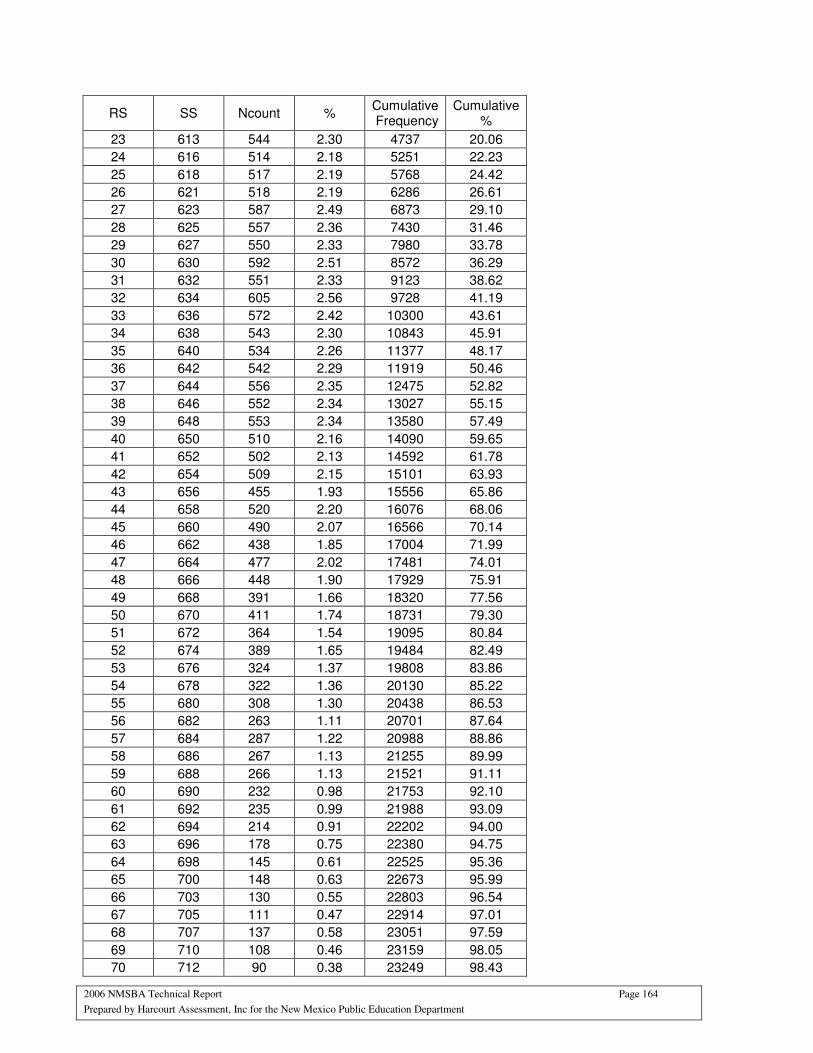
2006 NMSBA Technical Report Page 164
Prepared by Harcourt Assessment, Inc for the New Mexico Public Education Department
RS SS Ncount % Cumulative Frequency
Cumulative %
23 613 544 2.30 4737 20.06
24 616 514 2.18 5251 22.23
25 618 517 2.19 5768 24.42
26 621 518 2.19 6286 26.61
27 623 587 2.49 6873 29.10
28 625 557 2.36 7430 31.46
29 627 550 2.33 7980 33.78
30 630 592 2.51 8572 36.29
31 632 551 2.33 9123 38.62
32 634 605 2.56 9728 41.19
33 636 572 2.42 10300 43.61
34 638 543 2.30 10843 45.91
35 640 534 2.26 11377 48.17
36 642 542 2.29 11919 50.46
37 644 556 2.35 12475 52.82
38 646 552 2.34 13027 55.15
39 648 553 2.34 13580 57.49
40 650 510 2.16 14090 59.65
41 652 502 2.13 14592 61.78
42 654 509 2.15 15101 63.93
43 656 455 1.93 15556 65.86
44 658 520 2.20 16076 68.06
45 660 490 2.07 16566 70.14
46 662 438 1.85 17004 71.99
47 664 477 2.02 17481 74.01
48 666 448 1.90 17929 75.91
49 668 391 1.66 18320 77.56
50 670 411 1.74 18731 79.30
51 672 364 1.54 19095 80.84
52 674 389 1.65 19484 82.49
53 676 324 1.37 19808 83.86
54 678 322 1.36 20130 85.22
55 680 308 1.30 20438 86.53
56 682 263 1.11 20701 87.64
57 684 287 1.22 20988 88.86
58 686 267 1.13 21255 89.99
59 688 266 1.13 21521 91.11
60 690 232 0.98 21753 92.10
61 692 235 0.99 21988 93.09
62 694 214 0.91 22202 94.00
63 696 178 0.75 22380 94.75
64 698 145 0.61 22525 95.36
65 700 148 0.63 22673 95.99
66 703 130 0.55 22803 96.54
67 705 111 0.47 22914 97.01
68 707 137 0.58 23051 97.59
69 710 108 0.46 23159 98.05
70 712 90 0.38 23249 98.43

2006 NMSBA Technical Report Page 165
Prepared by Harcourt Assessment, Inc for the New Mexico Public Education Department
RS SS Ncount % Cumulative Frequency
Cumulative %
71 715 75 0.32 23324 98.75
72 717 56 0.24 23380 98.98
73 720 68 0.29 23448 99.27
74 723 41 0.17 23489 99.45
75 726 35 0.15 23524 99.59
76 730 27 0.11 23551 99.71
77 733 24 0.10 23575 99.81
78 737 15 0.06 23590 99.87
79 741 13 0.06 23603 99.93
80 746 3 0.01 23606 99.94
81 752 8 0.03 23614 99.97
82 758 4 0.02 23618 99.99
83 766 0 0.00 23618 99.99
84 776 2 0.01 23620 100.00
85 790 0 0.00 23620 100.00
86 814 0 0.00 23620 100.00
87 856 0 0.00 23620 100.00
Table C.4 Raw/Scale Score Simple & Cumulative Frequencies (English Grade 6 Math)
RS SS Ncount % Cumulative Frequency
Cumulative %
0 457 0 0.00 0 0.00
1 500 0 0.00 0 0.00
2 526 0 0.00 0 0.00
3 541 1 0.00 1 0.00
4 552 3 0.01 4 0.02
5 561 9 0.04 13 0.06
6 569 20 0.08 33 0.14
7 575 35 0.15 68 0.29
8 581 77 0.33 145 0.62
9 586 124 0.53 269 1.14
10 590 137 0.58 406 1.72
11 595 213 0.90 619 2.63
12 599 265 1.12 884 3.75
13 602 342 1.45 1226 5.20
14 606 381 1.62 1607 6.82
15 609 425 1.80 2032 8.62
16 612 441 1.87 2473 10.49
17 615 505 2.14 2978 12.63
18 618 495 2.10 3473 14.73
19 621 547 2.32 4020 17.05
20 623 554 2.35 4574 19.40
21 626 566 2.40 5140 21.80
22 628 586 2.49 5726 24.29
23 631 646 2.74 6372 27.03
24 633 567 2.41 6939 29.43
25 635 619 2.63 7558 32.06
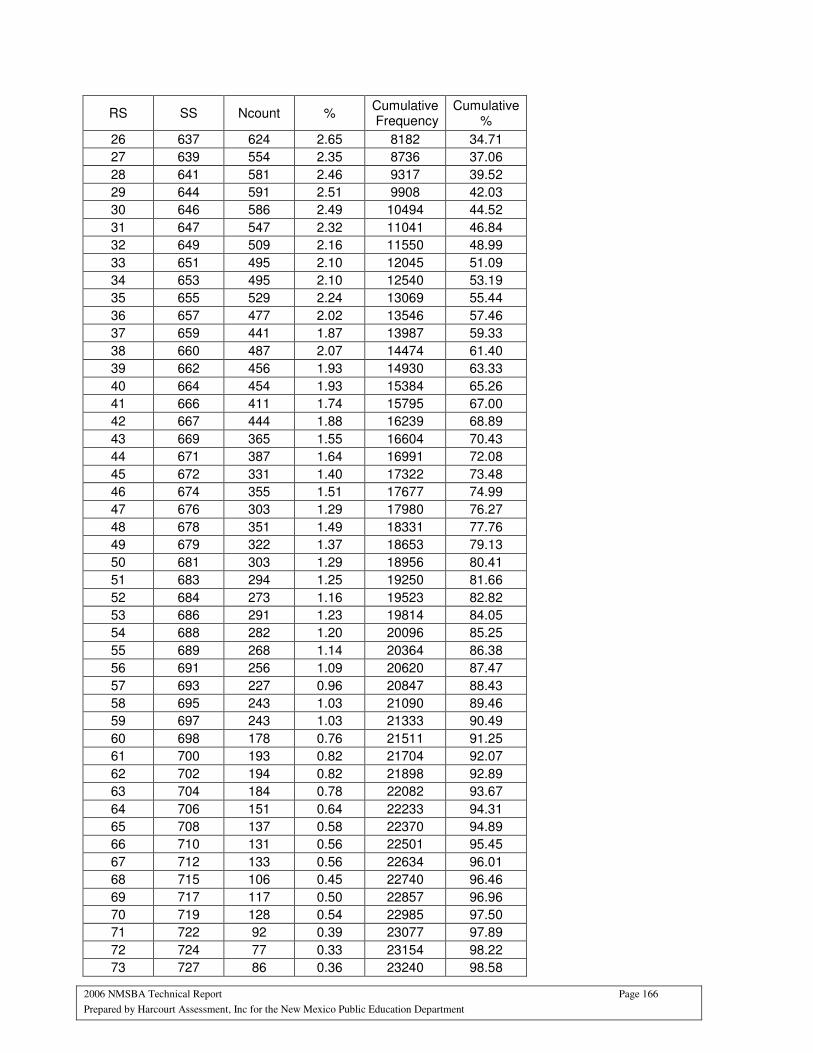
2006 NMSBA Technical Report Page 166
Prepared by Harcourt Assessment, Inc for the New Mexico Public Education Department
RS SS Ncount % Cumulative Frequency
Cumulative %
26 637 624 2.65 8182 34.71
27 639 554 2.35 8736 37.06
28 641 581 2.46 9317 39.52
29 644 591 2.51 9908 42.03
30 646 586 2.49 10494 44.52
31 647 547 2.32 11041 46.84
32 649 509 2.16 11550 48.99
33 651 495 2.10 12045 51.09
34 653 495 2.10 12540 53.19
35 655 529 2.24 13069 55.44
36 657 477 2.02 13546 57.46
37 659 441 1.87 13987 59.33
38 660 487 2.07 14474 61.40
39 662 456 1.93 14930 63.33
40 664 454 1.93 15384 65.26
41 666 411 1.74 15795 67.00
42 667 444 1.88 16239 68.89
43 669 365 1.55 16604 70.43
44 671 387 1.64 16991 72.08
45 672 331 1.40 17322 73.48
46 674 355 1.51 17677 74.99
47 676 303 1.29 17980 76.27
48 678 351 1.49 18331 77.76
49 679 322 1.37 18653 79.13
50 681 303 1.29 18956 80.41
51 683 294 1.25 19250 81.66
52 684 273 1.16 19523 82.82
53 686 291 1.23 19814 84.05
54 688 282 1.20 20096 85.25
55 689 268 1.14 20364 86.38
56 691 256 1.09 20620 87.47
57 693 227 0.96 20847 88.43
58 695 243 1.03 21090 89.46
59 697 243 1.03 21333 90.49
60 698 178 0.76 21511 91.25
61 700 193 0.82 21704 92.07
62 702 194 0.82 21898 92.89
63 704 184 0.78 22082 93.67
64 706 151 0.64 22233 94.31
65 708 137 0.58 22370 94.89
66 710 131 0.56 22501 95.45
67 712 133 0.56 22634 96.01
68 715 106 0.45 22740 96.46
69 717 117 0.50 22857 96.96
70 719 128 0.54 22985 97.50
71 722 92 0.39 23077 97.89
72 724 77 0.33 23154 98.22
73 727 86 0.36 23240 98.58
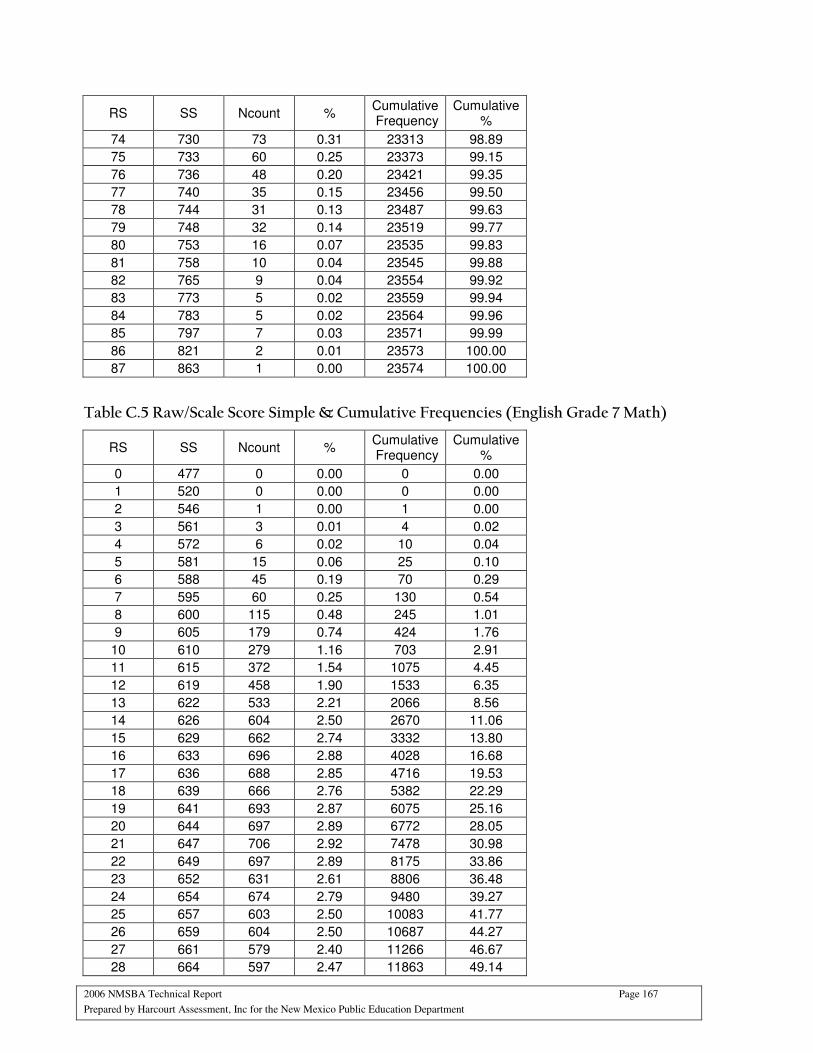
2006 NMSBA Technical Report Page 167
Prepared by Harcourt Assessment, Inc for the New Mexico Public Education Department
RS SS Ncount % Cumulative Frequency
Cumulative %
74 730 73 0.31 23313 98.89
75 733 60 0.25 23373 99.15
76 736 48 0.20 23421 99.35
77 740 35 0.15 23456 99.50
78 744 31 0.13 23487 99.63
79 748 32 0.14 23519 99.77
80 753 16 0.07 23535 99.83
81 758 10 0.04 23545 99.88
82 765 9 0.04 23554 99.92
83 773 5 0.02 23559 99.94
84 783 5 0.02 23564 99.96
85 797 7 0.03 23571 99.99
86 821 2 0.01 23573 100.00
87 863 1 0.00 23574 100.00
Table C.5 Raw/Scale Score Simple & Cumulative Frequencies (English Grade 7 Math)
RS SS Ncount % Cumulative Frequency
Cumulative %
0 477 0 0.00 0 0.00
1 520 0 0.00 0 0.00
2 546 1 0.00 1 0.00
3 561 3 0.01 4 0.02
4 572 6 0.02 10 0.04
5 581 15 0.06 25 0.10
6 588 45 0.19 70 0.29
7 595 60 0.25 130 0.54
8 600 115 0.48 245 1.01
9 605 179 0.74 424 1.76
10 610 279 1.16 703 2.91
11 615 372 1.54 1075 4.45
12 619 458 1.90 1533 6.35
13 622 533 2.21 2066 8.56
14 626 604 2.50 2670 11.06
15 629 662 2.74 3332 13.80
16 633 696 2.88 4028 16.68
17 636 688 2.85 4716 19.53
18 639 666 2.76 5382 22.29
19 641 693 2.87 6075 25.16
20 644 697 2.89 6772 28.05
21 647 706 2.92 7478 30.98
22 649 697 2.89 8175 33.86
23 652 631 2.61 8806 36.48
24 654 674 2.79 9480 39.27
25 657 603 2.50 10083 41.77
26 659 604 2.50 10687 44.27
27 661 579 2.40 11266 46.67
28 664 597 2.47 11863 49.14
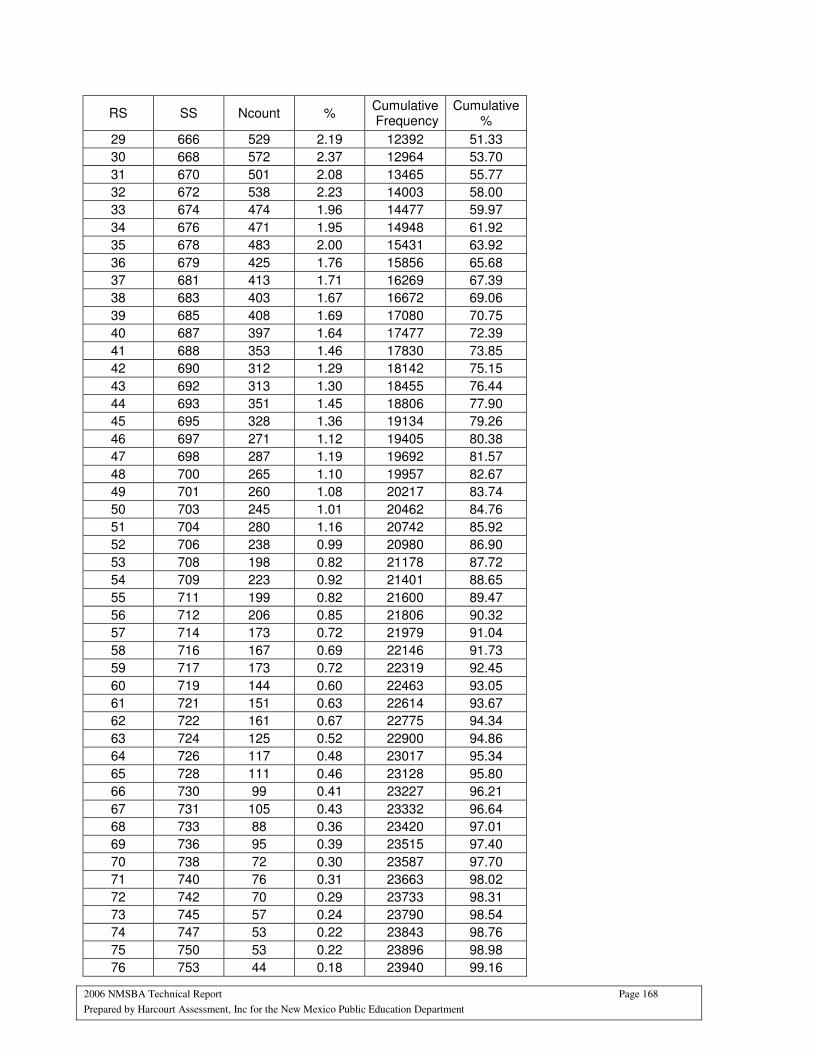
2006 NMSBA Technical Report Page 168
Prepared by Harcourt Assessment, Inc for the New Mexico Public Education Department
RS SS Ncount % Cumulative Frequency
Cumulative %
29 666 529 2.19 12392 51.33
30 668 572 2.37 12964 53.70
31 670 501 2.08 13465 55.77
32 672 538 2.23 14003 58.00
33 674 474 1.96 14477 59.97
34 676 471 1.95 14948 61.92
35 678 483 2.00 15431 63.92
36 679 425 1.76 15856 65.68
37 681 413 1.71 16269 67.39
38 683 403 1.67 16672 69.06
39 685 408 1.69 17080 70.75
40 687 397 1.64 17477 72.39
41 688 353 1.46 17830 73.85
42 690 312 1.29 18142 75.15
43 692 313 1.30 18455 76.44
44 693 351 1.45 18806 77.90
45 695 328 1.36 19134 79.26
46 697 271 1.12 19405 80.38
47 698 287 1.19 19692 81.57
48 700 265 1.10 19957 82.67
49 701 260 1.08 20217 83.74
50 703 245 1.01 20462 84.76
51 704 280 1.16 20742 85.92
52 706 238 0.99 20980 86.90
53 708 198 0.82 21178 87.72
54 709 223 0.92 21401 88.65
55 711 199 0.82 21600 89.47
56 712 206 0.85 21806 90.32
57 714 173 0.72 21979 91.04
58 716 167 0.69 22146 91.73
59 717 173 0.72 22319 92.45
60 719 144 0.60 22463 93.05
61 721 151 0.63 22614 93.67
62 722 161 0.67 22775 94.34
63 724 125 0.52 22900 94.86
64 726 117 0.48 23017 95.34
65 728 111 0.46 23128 95.80
66 730 99 0.41 23227 96.21
67 731 105 0.43 23332 96.64
68 733 88 0.36 23420 97.01
69 736 95 0.39 23515 97.40
70 738 72 0.30 23587 97.70
71 740 76 0.31 23663 98.02
72 742 70 0.29 23733 98.31
73 745 57 0.24 23790 98.54
74 747 53 0.22 23843 98.76
75 750 53 0.22 23896 98.98
76 753 44 0.18 23940 99.16

2006 NMSBA Technical Report Page 169
Prepared by Harcourt Assessment, Inc for the New Mexico Public Education Department
RS SS Ncount % Cumulative Frequency
Cumulative %
77 756 46 0.19 23986 99.35
78 759 34 0.14 24020 99.49
79 762 29 0.12 24049 99.61
80 766 20 0.08 24069 99.70
81 770 16 0.07 24085 99.76
82 775 17 0.07 24102 99.83
83 780 16 0.07 24118 99.90
84 787 7 0.03 24125 99.93
85 794 6 0.02 24131 99.95
86 805 6 0.02 24137 99.98
87 819 4 0.02 24141 100.00
88 843 1 0.00 24142 100.00
89 886 0 0.00 24142 100.00
Table C.6 Raw/Scale Score Simple & Cumulative Frequencies (English Grade 8 Math)
RS SS Ncount % Cumulative Frequency
Cumulative %
0 493 0 0.00 0 0.00
1 536 0 0.00 0 0.00
2 561 0 0.00 0 0.00
3 576 1 0.00 1 0.00
4 586 3 0.01 4 0.02
5 595 18 0.07 22 0.09
6 602 38 0.15 60 0.24
7 608 64 0.26 124 0.50
8 614 116 0.47 240 0.98
9 619 199 0.81 439 1.79
10 623 241 0.98 680 2.77
11 627 343 1.40 1023 4.17
12 631 424 1.73 1447 5.89
13 635 503 2.05 1950 7.94
14 638 464 1.89 2414 9.83
15 641 548 2.23 2962 12.06
16 644 522 2.13 3484 14.19
17 647 520 2.12 4004 16.31
18 650 561 2.28 4565 18.59
19 652 504 2.05 5069 20.64
20 655 504 2.05 5573 22.70
21 657 516 2.10 6089 24.80
22 660 502 2.04 6591 26.84
23 662 531 2.16 7122 29.00
24 664 575 2.34 7697 31.34
25 666 517 2.11 8214 33.45
26 669 525 2.14 8739 35.59
27 671 530 2.16 9269 37.75
28 673 528 2.15 9797 39.90
29 675 567 2.31 10364 42.21
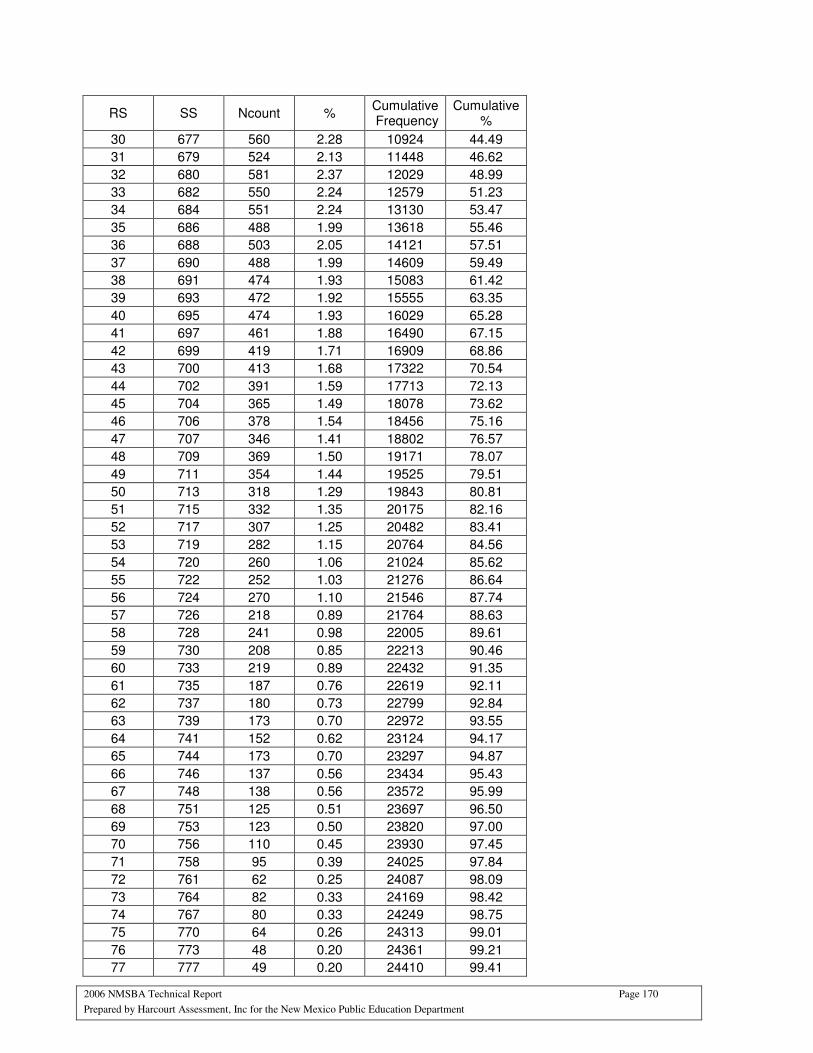
2006 NMSBA Technical Report Page 170
Prepared by Harcourt Assessment, Inc for the New Mexico Public Education Department
RS SS Ncount % Cumulative Frequency
Cumulative %
30 677 560 2.28 10924 44.49
31 679 524 2.13 11448 46.62
32 680 581 2.37 12029 48.99
33 682 550 2.24 12579 51.23
34 684 551 2.24 13130 53.47
35 686 488 1.99 13618 55.46
36 688 503 2.05 14121 57.51
37 690 488 1.99 14609 59.49
38 691 474 1.93 15083 61.42
39 693 472 1.92 15555 63.35
40 695 474 1.93 16029 65.28
41 697 461 1.88 16490 67.15
42 699 419 1.71 16909 68.86
43 700 413 1.68 17322 70.54
44 702 391 1.59 17713 72.13
45 704 365 1.49 18078 73.62
46 706 378 1.54 18456 75.16
47 707 346 1.41 18802 76.57
48 709 369 1.50 19171 78.07
49 711 354 1.44 19525 79.51
50 713 318 1.29 19843 80.81
51 715 332 1.35 20175 82.16
52 717 307 1.25 20482 83.41
53 719 282 1.15 20764 84.56
54 720 260 1.06 21024 85.62
55 722 252 1.03 21276 86.64
56 724 270 1.10 21546 87.74
57 726 218 0.89 21764 88.63
58 728 241 0.98 22005 89.61
59 730 208 0.85 22213 90.46
60 733 219 0.89 22432 91.35
61 735 187 0.76 22619 92.11
62 737 180 0.73 22799 92.84
63 739 173 0.70 22972 93.55
64 741 152 0.62 23124 94.17
65 744 173 0.70 23297 94.87
66 746 137 0.56 23434 95.43
67 748 138 0.56 23572 95.99
68 751 125 0.51 23697 96.50
69 753 123 0.50 23820 97.00
70 756 110 0.45 23930 97.45
71 758 95 0.39 24025 97.84
72 761 62 0.25 24087 98.09
73 764 82 0.33 24169 98.42
74 767 80 0.33 24249 98.75
75 770 64 0.26 24313 99.01
76 773 48 0.20 24361 99.21
77 777 49 0.20 24410 99.41
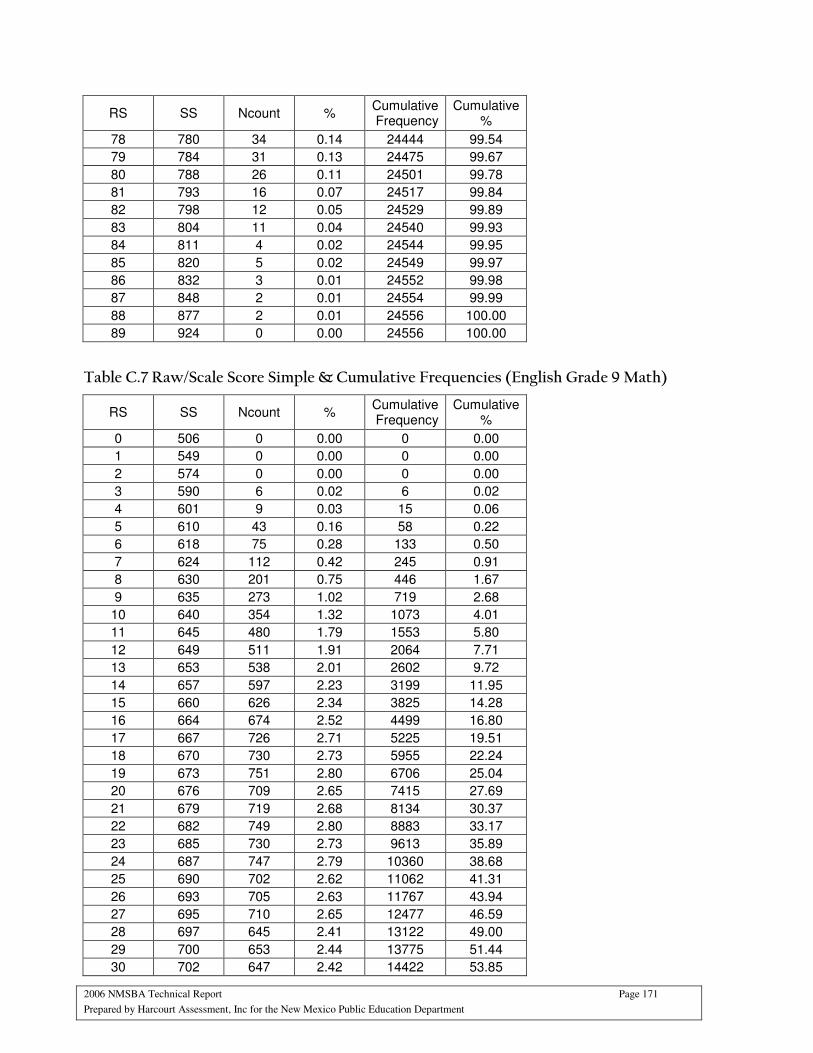
2006 NMSBA Technical Report Page 171
Prepared by Harcourt Assessment, Inc for the New Mexico Public Education Department
RS SS Ncount % Cumulative Frequency
Cumulative %
78 780 34 0.14 24444 99.54
79 784 31 0.13 24475 99.67
80 788 26 0.11 24501 99.78
81 793 16 0.07 24517 99.84
82 798 12 0.05 24529 99.89
83 804 11 0.04 24540 99.93
84 811 4 0.02 24544 99.95
85 820 5 0.02 24549 99.97
86 832 3 0.01 24552 99.98
87 848 2 0.01 24554 99.99
88 877 2 0.01 24556 100.00
89 924 0 0.00 24556 100.00
Table C.7 Raw/Scale Score Simple & Cumulative Frequencies (English Grade 9 Math)
RS SS Ncount % Cumulative Frequency
Cumulative %
0 506 0 0.00 0 0.00
1 549 0 0.00 0 0.00
2 574 0 0.00 0 0.00
3 590 6 0.02 6 0.02
4 601 9 0.03 15 0.06
5 610 43 0.16 58 0.22
6 618 75 0.28 133 0.50
7 624 112 0.42 245 0.91
8 630 201 0.75 446 1.67
9 635 273 1.02 719 2.68
10 640 354 1.32 1073 4.01
11 645 480 1.79 1553 5.80
12 649 511 1.91 2064 7.71
13 653 538 2.01 2602 9.72
14 657 597 2.23 3199 11.95
15 660 626 2.34 3825 14.28
16 664 674 2.52 4499 16.80
17 667 726 2.71 5225 19.51
18 670 730 2.73 5955 22.24
19 673 751 2.80 6706 25.04
20 676 709 2.65 7415 27.69
21 679 719 2.68 8134 30.37
22 682 749 2.80 8883 33.17
23 685 730 2.73 9613 35.89
24 687 747 2.79 10360 38.68
25 690 702 2.62 11062 41.31
26 693 705 2.63 11767 43.94
27 695 710 2.65 12477 46.59
28 697 645 2.41 13122 49.00
29 700 653 2.44 13775 51.44
30 702 647 2.42 14422 53.85
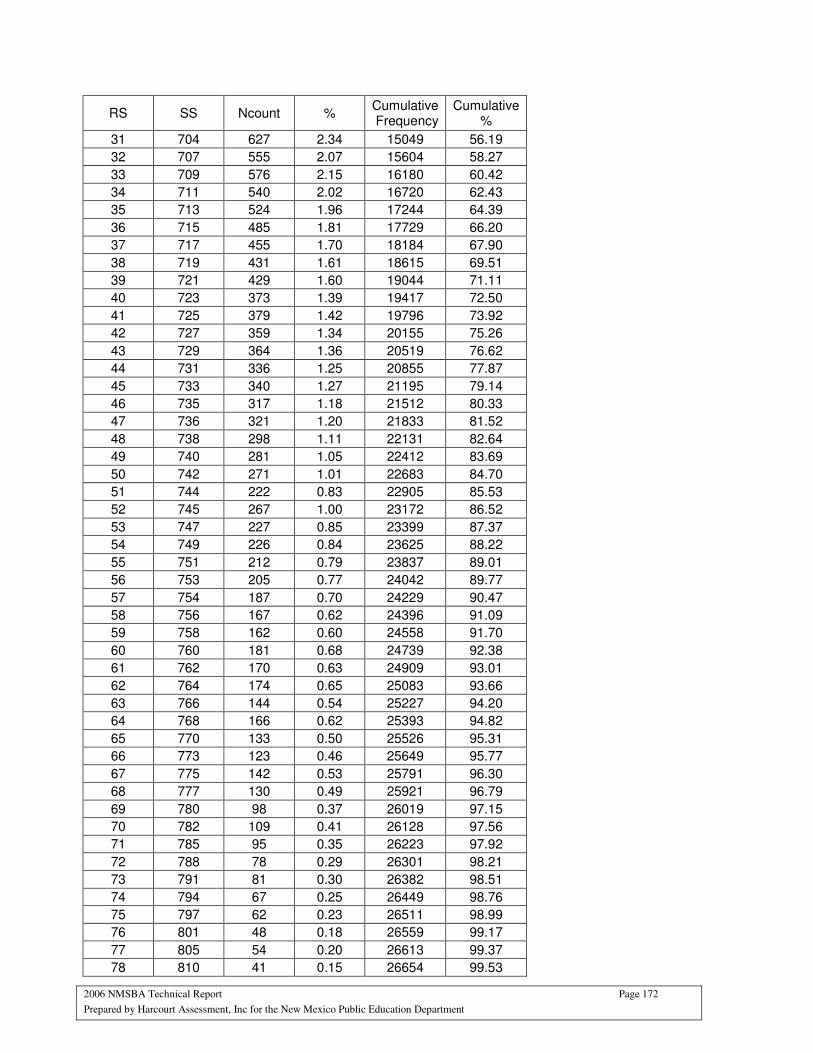
2006 NMSBA Technical Report Page 172
Prepared by Harcourt Assessment, Inc for the New Mexico Public Education Department
RS SS Ncount % Cumulative Frequency
Cumulative %
31 704 627 2.34 15049 56.19
32 707 555 2.07 15604 58.27
33 709 576 2.15 16180 60.42
34 711 540 2.02 16720 62.43
35 713 524 1.96 17244 64.39
36 715 485 1.81 17729 66.20
37 717 455 1.70 18184 67.90
38 719 431 1.61 18615 69.51
39 721 429 1.60 19044 71.11
40 723 373 1.39 19417 72.50
41 725 379 1.42 19796 73.92
42 727 359 1.34 20155 75.26
43 729 364 1.36 20519 76.62
44 731 336 1.25 20855 77.87
45 733 340 1.27 21195 79.14
46 735 317 1.18 21512 80.33
47 736 321 1.20 21833 81.52
48 738 298 1.11 22131 82.64
49 740 281 1.05 22412 83.69
50 742 271 1.01 22683 84.70
51 744 222 0.83 22905 85.53
52 745 267 1.00 23172 86.52
53 747 227 0.85 23399 87.37
54 749 226 0.84 23625 88.22
55 751 212 0.79 23837 89.01
56 753 205 0.77 24042 89.77
57 754 187 0.70 24229 90.47
58 756 167 0.62 24396 91.09
59 758 162 0.60 24558 91.70
60 760 181 0.68 24739 92.38
61 762 170 0.63 24909 93.01
62 764 174 0.65 25083 93.66
63 766 144 0.54 25227 94.20
64 768 166 0.62 25393 94.82
65 770 133 0.50 25526 95.31
66 773 123 0.46 25649 95.77
67 775 142 0.53 25791 96.30
68 777 130 0.49 25921 96.79
69 780 98 0.37 26019 97.15
70 782 109 0.41 26128 97.56
71 785 95 0.35 26223 97.92
72 788 78 0.29 26301 98.21
73 791 81 0.30 26382 98.51
74 794 67 0.25 26449 98.76
75 797 62 0.23 26511 98.99
76 801 48 0.18 26559 99.17
77 805 54 0.20 26613 99.37
78 810 41 0.15 26654 99.53
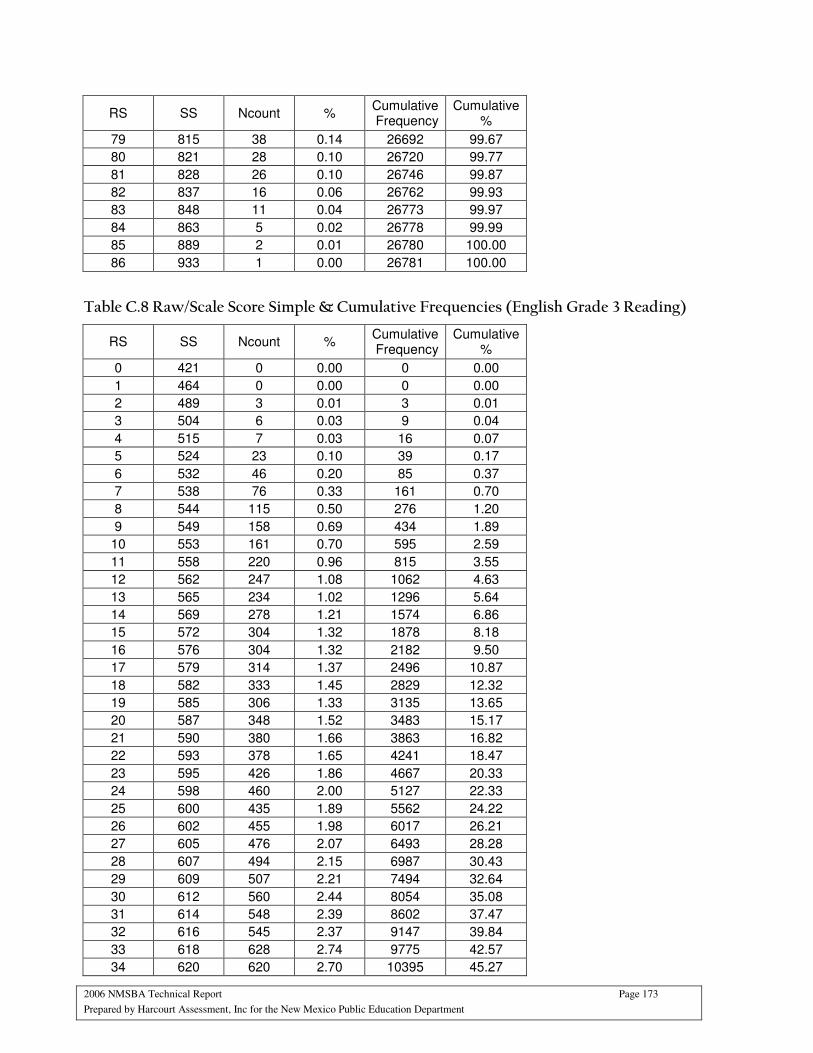
2006 NMSBA Technical Report Page 173
Prepared by Harcourt Assessment, Inc for the New Mexico Public Education Department
RS SS Ncount % Cumulative Frequency
Cumulative %
79 815 38 0.14 26692 99.67
80 821 28 0.10 26720 99.77
81 828 26 0.10 26746 99.87
82 837 16 0.06 26762 99.93
83 848 11 0.04 26773 99.97
84 863 5 0.02 26778 99.99
85 889 2 0.01 26780 100.00
86 933 1 0.00 26781 100.00
Table C.8 Raw/Scale Score Simple & Cumulative Frequencies (English Grade 3 Reading)
RS SS Ncount % Cumulative Frequency
Cumulative %
0 421 0 0.00 0 0.00
1 464 0 0.00 0 0.00
2 489 3 0.01 3 0.01
3 504 6 0.03 9 0.04
4 515 7 0.03 16 0.07
5 524 23 0.10 39 0.17
6 532 46 0.20 85 0.37
7 538 76 0.33 161 0.70
8 544 115 0.50 276 1.20
9 549 158 0.69 434 1.89
10 553 161 0.70 595 2.59
11 558 220 0.96 815 3.55
12 562 247 1.08 1062 4.63
13 565 234 1.02 1296 5.64
14 569 278 1.21 1574 6.86
15 572 304 1.32 1878 8.18
16 576 304 1.32 2182 9.50
17 579 314 1.37 2496 10.87
18 582 333 1.45 2829 12.32
19 585 306 1.33 3135 13.65
20 587 348 1.52 3483 15.17
21 590 380 1.66 3863 16.82
22 593 378 1.65 4241 18.47
23 595 426 1.86 4667 20.33
24 598 460 2.00 5127 22.33
25 600 435 1.89 5562 24.22
26 602 455 1.98 6017 26.21
27 605 476 2.07 6493 28.28
28 607 494 2.15 6987 30.43
29 609 507 2.21 7494 32.64
30 612 560 2.44 8054 35.08
31 614 548 2.39 8602 37.47
32 616 545 2.37 9147 39.84
33 618 628 2.74 9775 42.57
34 620 620 2.70 10395 45.27
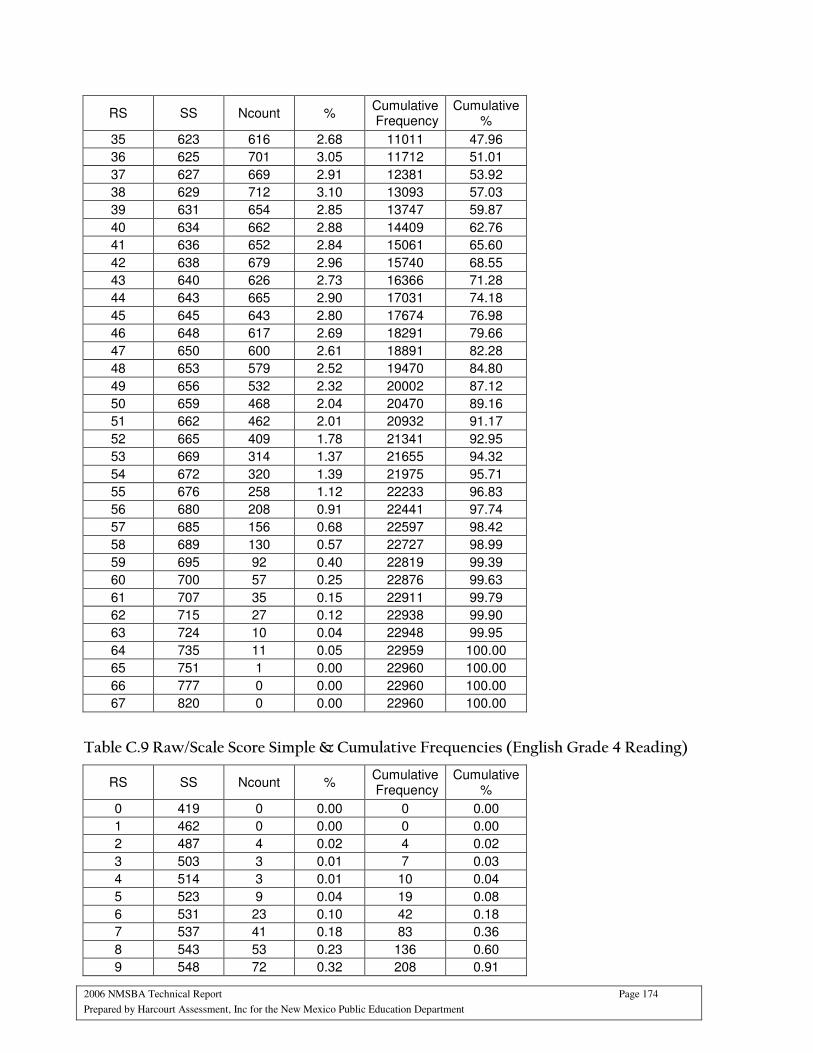
2006 NMSBA Technical Report Page 174
Prepared by Harcourt Assessment, Inc for the New Mexico Public Education Department
RS SS Ncount % Cumulative Frequency
Cumulative %
35 623 616 2.68 11011 47.96
36 625 701 3.05 11712 51.01
37 627 669 2.91 12381 53.92
38 629 712 3.10 13093 57.03
39 631 654 2.85 13747 59.87
40 634 662 2.88 14409 62.76
41 636 652 2.84 15061 65.60
42 638 679 2.96 15740 68.55
43 640 626 2.73 16366 71.28
44 643 665 2.90 17031 74.18
45 645 643 2.80 17674 76.98
46 648 617 2.69 18291 79.66
47 650 600 2.61 18891 82.28
48 653 579 2.52 19470 84.80
49 656 532 2.32 20002 87.12
50 659 468 2.04 20470 89.16
51 662 462 2.01 20932 91.17
52 665 409 1.78 21341 92.95
53 669 314 1.37 21655 94.32
54 672 320 1.39 21975 95.71
55 676 258 1.12 22233 96.83
56 680 208 0.91 22441 97.74
57 685 156 0.68 22597 98.42
58 689 130 0.57 22727 98.99
59 695 92 0.40 22819 99.39
60 700 57 0.25 22876 99.63
61 707 35 0.15 22911 99.79
62 715 27 0.12 22938 99.90
63 724 10 0.04 22948 99.95
64 735 11 0.05 22959 100.00
65 751 1 0.00 22960 100.00
66 777 0 0.00 22960 100.00
67 820 0 0.00 22960 100.00
Table C.9 Raw/Scale Score Simple & Cumulative Frequencies (English Grade 4 Reading)
RS SS Ncount % Cumulative Frequency
Cumulative %
0 419 0 0.00 0 0.00
1 462 0 0.00 0 0.00
2 487 4 0.02 4 0.02
3 503 3 0.01 7 0.03
4 514 3 0.01 10 0.04
5 523 9 0.04 19 0.08
6 531 23 0.10 42 0.18
7 537 41 0.18 83 0.36
8 543 53 0.23 136 0.60
9 548 72 0.32 208 0.91
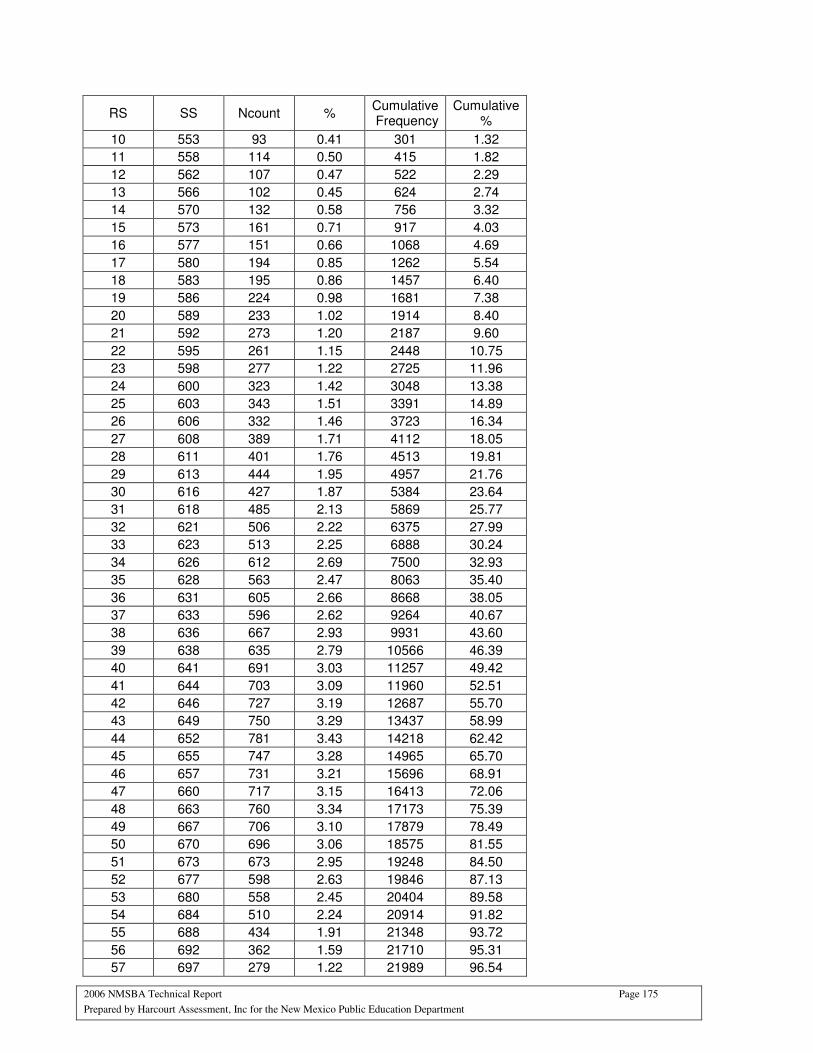
2006 NMSBA Technical Report Page 175
Prepared by Harcourt Assessment, Inc for the New Mexico Public Education Department
RS SS Ncount % Cumulative Frequency
Cumulative %
10 553 93 0.41 301 1.32
11 558 114 0.50 415 1.82
12 562 107 0.47 522 2.29
13 566 102 0.45 624 2.74
14 570 132 0.58 756 3.32
15 573 161 0.71 917 4.03
16 577 151 0.66 1068 4.69
17 580 194 0.85 1262 5.54
18 583 195 0.86 1457 6.40
19 586 224 0.98 1681 7.38
20 589 233 1.02 1914 8.40
21 592 273 1.20 2187 9.60
22 595 261 1.15 2448 10.75
23 598 277 1.22 2725 11.96
24 600 323 1.42 3048 13.38
25 603 343 1.51 3391 14.89
26 606 332 1.46 3723 16.34
27 608 389 1.71 4112 18.05
28 611 401 1.76 4513 19.81
29 613 444 1.95 4957 21.76
30 616 427 1.87 5384 23.64
31 618 485 2.13 5869 25.77
32 621 506 2.22 6375 27.99
33 623 513 2.25 6888 30.24
34 626 612 2.69 7500 32.93
35 628 563 2.47 8063 35.40
36 631 605 2.66 8668 38.05
37 633 596 2.62 9264 40.67
38 636 667 2.93 9931 43.60
39 638 635 2.79 10566 46.39
40 641 691 3.03 11257 49.42
41 644 703 3.09 11960 52.51
42 646 727 3.19 12687 55.70
43 649 750 3.29 13437 58.99
44 652 781 3.43 14218 62.42
45 655 747 3.28 14965 65.70
46 657 731 3.21 15696 68.91
47 660 717 3.15 16413 72.06
48 663 760 3.34 17173 75.39
49 667 706 3.10 17879 78.49
50 670 696 3.06 18575 81.55
51 673 673 2.95 19248 84.50
52 677 598 2.63 19846 87.13
53 680 558 2.45 20404 89.58
54 684 510 2.24 20914 91.82
55 688 434 1.91 21348 93.72
56 692 362 1.59 21710 95.31
57 697 279 1.22 21989 96.54
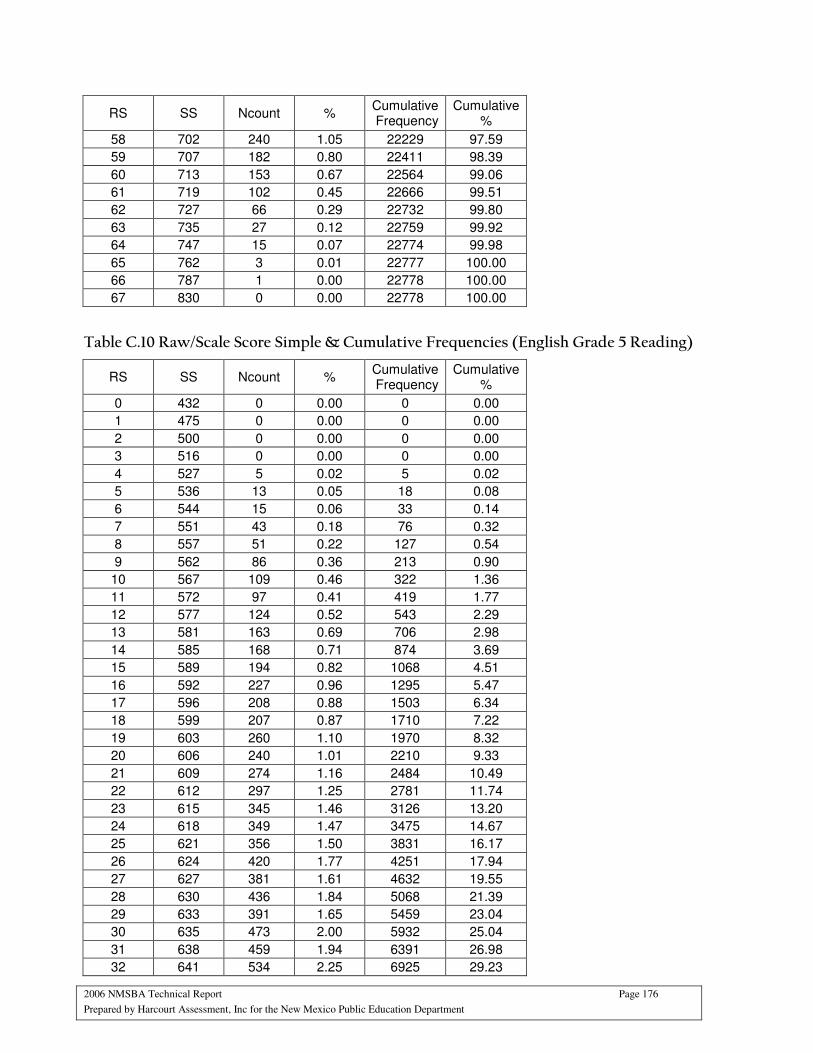
2006 NMSBA Technical Report Page 176
Prepared by Harcourt Assessment, Inc for the New Mexico Public Education Department
RS SS Ncount % Cumulative Frequency
Cumulative %
58 702 240 1.05 22229 97.59
59 707 182 0.80 22411 98.39
60 713 153 0.67 22564 99.06
61 719 102 0.45 22666 99.51
62 727 66 0.29 22732 99.80
63 735 27 0.12 22759 99.92
64 747 15 0.07 22774 99.98
65 762 3 0.01 22777 100.00
66 787 1 0.00 22778 100.00
67 830 0 0.00 22778 100.00
Table C.10 Raw/Scale Score Simple & Cumulative Frequencies (English Grade 5 Reading)
RS SS Ncount % Cumulative Frequency
Cumulative %
0 432 0 0.00 0 0.00
1 475 0 0.00 0 0.00
2 500 0 0.00 0 0.00
3 516 0 0.00 0 0.00
4 527 5 0.02 5 0.02
5 536 13 0.05 18 0.08
6 544 15 0.06 33 0.14
7 551 43 0.18 76 0.32
8 557 51 0.22 127 0.54
9 562 86 0.36 213 0.90
10 567 109 0.46 322 1.36
11 572 97 0.41 419 1.77
12 577 124 0.52 543 2.29
13 581 163 0.69 706 2.98
14 585 168 0.71 874 3.69
15 589 194 0.82 1068 4.51
16 592 227 0.96 1295 5.47
17 596 208 0.88 1503 6.34
18 599 207 0.87 1710 7.22
19 603 260 1.10 1970 8.32
20 606 240 1.01 2210 9.33
21 609 274 1.16 2484 10.49
22 612 297 1.25 2781 11.74
23 615 345 1.46 3126 13.20
24 618 349 1.47 3475 14.67
25 621 356 1.50 3831 16.17
26 624 420 1.77 4251 17.94
27 627 381 1.61 4632 19.55
28 630 436 1.84 5068 21.39
29 633 391 1.65 5459 23.04
30 635 473 2.00 5932 25.04
31 638 459 1.94 6391 26.98
32 641 534 2.25 6925 29.23
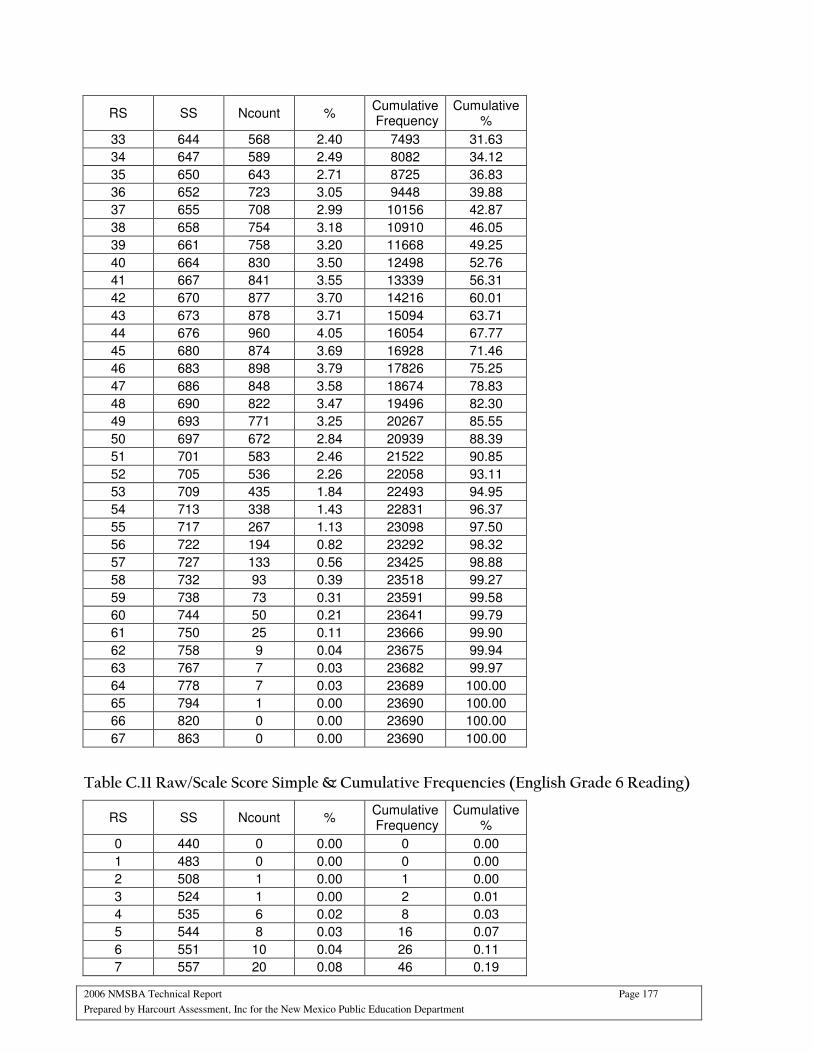
2006 NMSBA Technical Report Page 177
Prepared by Harcourt Assessment, Inc for the New Mexico Public Education Department
RS SS Ncount % Cumulative Frequency
Cumulative %
33 644 568 2.40 7493 31.63
34 647 589 2.49 8082 34.12
35 650 643 2.71 8725 36.83
36 652 723 3.05 9448 39.88
37 655 708 2.99 10156 42.87
38 658 754 3.18 10910 46.05
39 661 758 3.20 11668 49.25
40 664 830 3.50 12498 52.76
41 667 841 3.55 13339 56.31
42 670 877 3.70 14216 60.01
43 673 878 3.71 15094 63.71
44 676 960 4.05 16054 67.77
45 680 874 3.69 16928 71.46
46 683 898 3.79 17826 75.25
47 686 848 3.58 18674 78.83
48 690 822 3.47 19496 82.30
49 693 771 3.25 20267 85.55
50 697 672 2.84 20939 88.39
51 701 583 2.46 21522 90.85
52 705 536 2.26 22058 93.11
53 709 435 1.84 22493 94.95
54 713 338 1.43 22831 96.37
55 717 267 1.13 23098 97.50
56 722 194 0.82 23292 98.32
57 727 133 0.56 23425 98.88
58 732 93 0.39 23518 99.27
59 738 73 0.31 23591 99.58
60 744 50 0.21 23641 99.79
61 750 25 0.11 23666 99.90
62 758 9 0.04 23675 99.94
63 767 7 0.03 23682 99.97
64 778 7 0.03 23689 100.00
65 794 1 0.00 23690 100.00
66 820 0 0.00 23690 100.00
67 863 0 0.00 23690 100.00
Table C.11 Raw/Scale Score Simple & Cumulative Frequencies (English Grade 6 Reading)
RS SS Ncount % Cumulative Frequency
Cumulative %
0 440 0 0.00 0 0.00
1 483 0 0.00 0 0.00
2 508 1 0.00 1 0.00
3 524 1 0.00 2 0.01
4 535 6 0.02 8 0.03
5 544 8 0.03 16 0.07
6 551 10 0.04 26 0.11
7 557 20 0.08 46 0.19
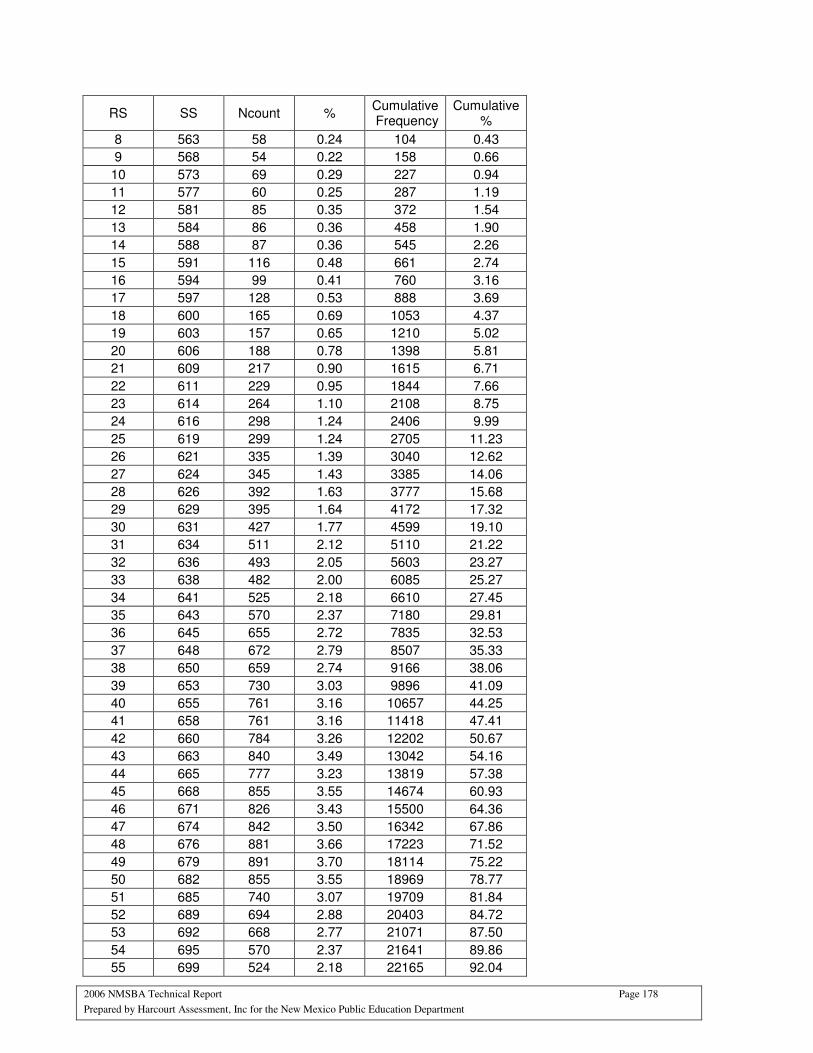
2006 NMSBA Technical Report Page 178
Prepared by Harcourt Assessment, Inc for the New Mexico Public Education Department
RS SS Ncount % Cumulative Frequency
Cumulative %
8 563 58 0.24 104 0.43
9 568 54 0.22 158 0.66
10 573 69 0.29 227 0.94
11 577 60 0.25 287 1.19
12 581 85 0.35 372 1.54
13 584 86 0.36 458 1.90
14 588 87 0.36 545 2.26
15 591 116 0.48 661 2.74
16 594 99 0.41 760 3.16
17 597 128 0.53 888 3.69
18 600 165 0.69 1053 4.37
19 603 157 0.65 1210 5.02
20 606 188 0.78 1398 5.81
21 609 217 0.90 1615 6.71
22 611 229 0.95 1844 7.66
23 614 264 1.10 2108 8.75
24 616 298 1.24 2406 9.99
25 619 299 1.24 2705 11.23
26 621 335 1.39 3040 12.62
27 624 345 1.43 3385 14.06
28 626 392 1.63 3777 15.68
29 629 395 1.64 4172 17.32
30 631 427 1.77 4599 19.10
31 634 511 2.12 5110 21.22
32 636 493 2.05 5603 23.27
33 638 482 2.00 6085 25.27
34 641 525 2.18 6610 27.45
35 643 570 2.37 7180 29.81
36 645 655 2.72 7835 32.53
37 648 672 2.79 8507 35.33
38 650 659 2.74 9166 38.06
39 653 730 3.03 9896 41.09
40 655 761 3.16 10657 44.25
41 658 761 3.16 11418 47.41
42 660 784 3.26 12202 50.67
43 663 840 3.49 13042 54.16
44 665 777 3.23 13819 57.38
45 668 855 3.55 14674 60.93
46 671 826 3.43 15500 64.36
47 674 842 3.50 16342 67.86
48 676 881 3.66 17223 71.52
49 679 891 3.70 18114 75.22
50 682 855 3.55 18969 78.77
51 685 740 3.07 19709 81.84
52 689 694 2.88 20403 84.72
53 692 668 2.77 21071 87.50
54 695 570 2.37 21641 89.86
55 699 524 2.18 22165 92.04
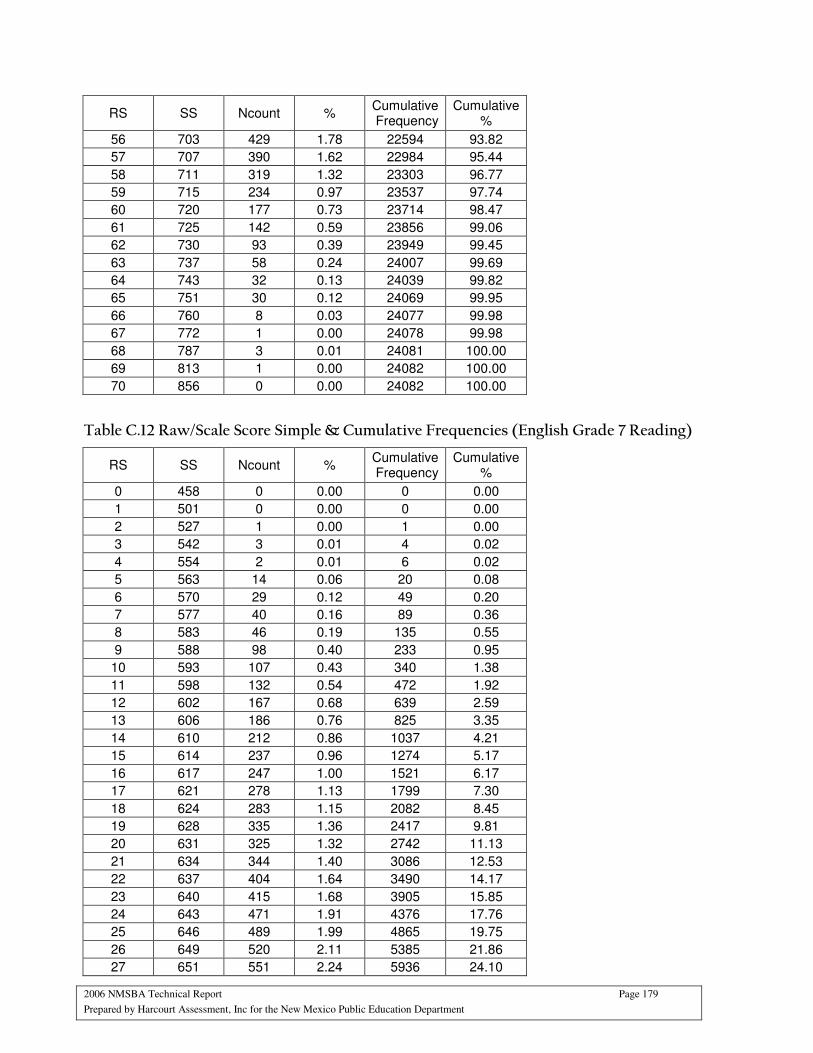
2006 NMSBA Technical Report Page 179
Prepared by Harcourt Assessment, Inc for the New Mexico Public Education Department
RS SS Ncount % Cumulative Frequency
Cumulative %
56 703 429 1.78 22594 93.82
57 707 390 1.62 22984 95.44
58 711 319 1.32 23303 96.77
59 715 234 0.97 23537 97.74
60 720 177 0.73 23714 98.47
61 725 142 0.59 23856 99.06
62 730 93 0.39 23949 99.45
63 737 58 0.24 24007 99.69
64 743 32 0.13 24039 99.82
65 751 30 0.12 24069 99.95
66 760 8 0.03 24077 99.98
67 772 1 0.00 24078 99.98
68 787 3 0.01 24081 100.00
69 813 1 0.00 24082 100.00
70 856 0 0.00 24082 100.00
Table C.12 Raw/Scale Score Simple & Cumulative Frequencies (English Grade 7 Reading)
RS SS Ncount % Cumulative Frequency
Cumulative %
0 458 0 0.00 0 0.00
1 501 0 0.00 0 0.00
2 527 1 0.00 1 0.00
3 542 3 0.01 4 0.02
4 554 2 0.01 6 0.02
5 563 14 0.06 20 0.08
6 570 29 0.12 49 0.20
7 577 40 0.16 89 0.36
8 583 46 0.19 135 0.55
9 588 98 0.40 233 0.95
10 593 107 0.43 340 1.38
11 598 132 0.54 472 1.92
12 602 167 0.68 639 2.59
13 606 186 0.76 825 3.35
14 610 212 0.86 1037 4.21
15 614 237 0.96 1274 5.17
16 617 247 1.00 1521 6.17
17 621 278 1.13 1799 7.30
18 624 283 1.15 2082 8.45
19 628 335 1.36 2417 9.81
20 631 325 1.32 2742 11.13
21 634 344 1.40 3086 12.53
22 637 404 1.64 3490 14.17
23 640 415 1.68 3905 15.85
24 643 471 1.91 4376 17.76
25 646 489 1.99 4865 19.75
26 649 520 2.11 5385 21.86
27 651 551 2.24 5936 24.10

2006 NMSBA Technical Report Page 180
Prepared by Harcourt Assessment, Inc for the New Mexico Public Education Department
RS SS Ncount % Cumulative Frequency
Cumulative %
28 654 562 2.28 6498 26.38
29 657 651 2.64 7149 29.02
30 660 709 2.88 7858 31.90
31 663 692 2.81 8550 34.71
32 665 715 2.90 9265 37.61
33 668 787 3.19 10052 40.81
34 671 828 3.36 10880 44.17
35 674 833 3.38 11713 47.55
36 677 861 3.50 12574 51.05
37 679 923 3.75 13497 54.79
38 682 882 3.58 14379 58.37
39 685 873 3.54 15252 61.92
40 688 964 3.91 16216 65.83
41 691 869 3.53 17085 69.36
42 694 858 3.48 17943 72.84
43 697 855 3.47 18798 76.31
44 700 771 3.13 19569 79.44
45 703 704 2.86 20273 82.30
46 706 664 2.70 20937 85.00
47 709 596 2.42 21533 87.42
48 712 623 2.53 22156 89.94
49 716 497 2.02 22653 91.96
50 719 414 1.68 23067 93.64
51 723 365 1.48 23432 95.12
52 726 300 1.22 23732 96.34
53 730 229 0.93 23961 97.27
54 734 200 0.81 24161 98.08
55 737 156 0.63 24317 98.72
56 742 108 0.44 24425 99.16
57 746 84 0.34 24509 99.50
58 750 41 0.17 24550 99.66
59 755 30 0.12 24580 99.78
60 760 21 0.09 24601 99.87
61 766 13 0.05 24614 99.92
62 772 8 0.03 24622 99.96
63 779 7 0.03 24629 99.98
64 787 3 0.01 24632 100.00
65 796 1 0.00 24633 100.00
66 807 0 0.00 24633 100.00
67 823 0 0.00 24633 100.00
68 849 0 0.00 24633 100.00
69 892 0 0.00 24633 100.00

2006 NMSBA Technical Report Page 181
Prepared by Harcourt Assessment, Inc for the New Mexico Public Education Department
Table C.13 Raw/Scale Score Simple & Cumulative Frequencies (English Grade 8 Reading)
RS SS Ncount % Cumulative Frequency
Cumulative %
0 462 0 0.00 0 0.00
1 505 0 0.00 0 0.00
2 531 0 0.00 0 0.00
3 547 0 0.00 0 0.00
4 558 5 0.02 5 0.02
5 568 13 0.05 18 0.07
6 576 17 0.07 35 0.14
7 583 33 0.13 68 0.27
8 589 42 0.17 110 0.44
9 595 72 0.29 182 0.73
10 600 103 0.41 285 1.14
11 605 92 0.37 377 1.51
12 610 119 0.48 496 1.99
13 614 138 0.55 634 2.54
14 618 156 0.62 790 3.16
15 623 181 0.72 971 3.89
16 626 220 0.88 1191 4.77
17 630 222 0.89 1413 5.66
18 634 266 1.06 1679 6.72
19 637 312 1.25 1991 7.97
20 641 330 1.32 2321 9.29
21 644 346 1.38 2667 10.68
22 647 369 1.48 3036 12.15
23 651 478 1.91 3514 14.07
24 654 453 1.81 3967 15.88
25 657 532 2.13 4499 18.01
26 660 581 2.33 5080 20.33
27 663 653 2.61 5733 22.95
28 666 652 2.61 6385 25.56
29 669 720 2.88 7105 28.44
30 671 802 3.21 7907 31.65
31 674 857 3.43 8764 35.08
32 677 912 3.65 9676 38.73
33 680 907 3.63 10583 42.36
34 683 935 3.74 11518 46.10
35 685 931 3.73 12449 49.83
36 688 981 3.93 13430 53.76
37 691 968 3.87 14398 57.63
38 693 926 3.71 15324 61.34
39 696 960 3.84 16284 65.18
40 699 844 3.38 17128 68.56
41 702 827 3.31 17955 71.87
42 704 771 3.09 18726 74.95
43 707 813 3.25 19539 78.21
44 710 732 2.93 20271 81.14
45 713 667 2.67 20938 83.81
46 715 666 2.67 21604 86.47

2006 NMSBA Technical Report Page 182
Prepared by Harcourt Assessment, Inc for the New Mexico Public Education Department
RS SS Ncount % Cumulative Frequency
Cumulative %
47 718 571 2.29 22175 88.76
48 721 484 1.94 22659 90.70
49 724 452 1.81 23111 92.51
50 727 372 1.49 23483 94.00
51 730 350 1.40 23833 95.40
52 733 264 1.06 24097 96.45
53 737 216 0.86 24313 97.32
54 740 188 0.75 24501 98.07
55 743 115 0.46 24616 98.53
56 747 116 0.46 24732 99.00
57 751 87 0.35 24819 99.34
58 755 56 0.22 24875 99.57
59 759 37 0.15 24912 99.72
60 764 31 0.12 24943 99.84
61 769 21 0.08 24964 99.92
62 775 11 0.04 24975 99.97
63 781 5 0.02 24980 99.99
64 788 3 0.01 24983 100.00
65 797 0 0.00 24983 100.00
66 808 0 0.00 24983 100.00
67 824 0 0.00 24983 100.00
68 849 0 0.00 24983 100.00
69 892 0 0.00 24983 100.00
Table C.14 Raw/Scale Score Simple & Cumulative Frequencies (English Grade 9 Reading)
RS SS Ncount % Cumulative Frequency
Cumulative %
0 469 0 0.00 0 0.00
1 512 0 0.00 0 0.00
2 538 5 0.02 5 0.02
3 553 7 0.03 12 0.04
4 564 10 0.04 22 0.08
5 573 23 0.09 45 0.17
6 581 52 0.19 97 0.36
7 587 76 0.28 173 0.65
8 593 113 0.42 286 1.07
9 598 120 0.45 406 1.51
10 603 160 0.60 566 2.11
11 608 187 0.70 753 2.81
12 612 187 0.70 940 3.51
13 616 220 0.82 1160 4.33
14 620 233 0.87 1393 5.19
15 623 254 0.95 1647 6.14
16 627 273 1.02 1920 7.16
17 630 307 1.14 2227 8.30
18 633 324 1.21 2551 9.51
19 637 377 1.41 2928 10.92
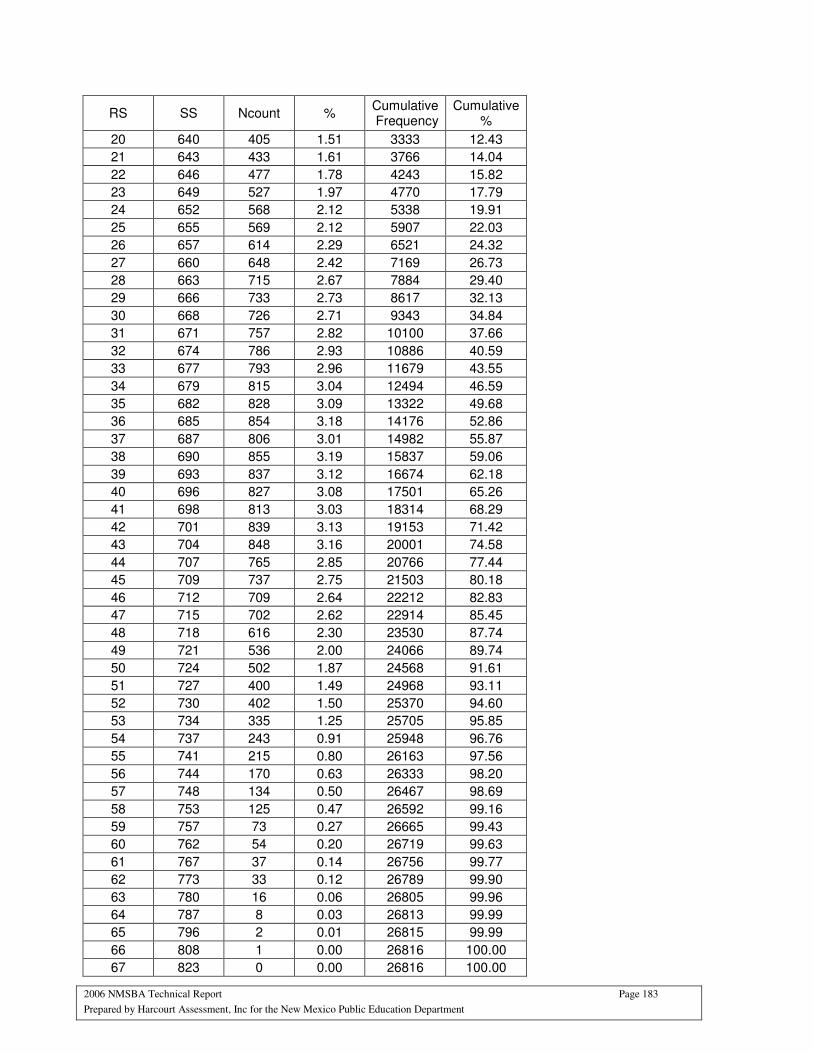
2006 NMSBA Technical Report Page 183
Prepared by Harcourt Assessment, Inc for the New Mexico Public Education Department
RS SS Ncount % Cumulative Frequency
Cumulative %
20 640 405 1.51 3333 12.43
21 643 433 1.61 3766 14.04
22 646 477 1.78 4243 15.82
23 649 527 1.97 4770 17.79
24 652 568 2.12 5338 19.91
25 655 569 2.12 5907 22.03
26 657 614 2.29 6521 24.32
27 660 648 2.42 7169 26.73
28 663 715 2.67 7884 29.40
29 666 733 2.73 8617 32.13
30 668 726 2.71 9343 34.84
31 671 757 2.82 10100 37.66
32 674 786 2.93 10886 40.59
33 677 793 2.96 11679 43.55
34 679 815 3.04 12494 46.59
35 682 828 3.09 13322 49.68
36 685 854 3.18 14176 52.86
37 687 806 3.01 14982 55.87
38 690 855 3.19 15837 59.06
39 693 837 3.12 16674 62.18
40 696 827 3.08 17501 65.26
41 698 813 3.03 18314 68.29
42 701 839 3.13 19153 71.42
43 704 848 3.16 20001 74.58
44 707 765 2.85 20766 77.44
45 709 737 2.75 21503 80.18
46 712 709 2.64 22212 82.83
47 715 702 2.62 22914 85.45
48 718 616 2.30 23530 87.74
49 721 536 2.00 24066 89.74
50 724 502 1.87 24568 91.61
51 727 400 1.49 24968 93.11
52 730 402 1.50 25370 94.60
53 734 335 1.25 25705 95.85
54 737 243 0.91 25948 96.76
55 741 215 0.80 26163 97.56
56 744 170 0.63 26333 98.20
57 748 134 0.50 26467 98.69
58 753 125 0.47 26592 99.16
59 757 73 0.27 26665 99.43
60 762 54 0.20 26719 99.63
61 767 37 0.14 26756 99.77
62 773 33 0.12 26789 99.90
63 780 16 0.06 26805 99.96
64 787 8 0.03 26813 99.99
65 796 2 0.01 26815 99.99
66 808 1 0.00 26816 100.00
67 823 0 0.00 26816 100.00

2006 NMSBA Technical Report Page 184
Prepared by Harcourt Assessment, Inc for the New Mexico Public Education Department
RS SS Ncount % Cumulative Frequency
Cumulative %
68 849 1 0.00 26817 100.00
69 892 0 0.00 26817 100.00
Table C.15 Raw/Scale Score Simple & Cumulative Frequencies (English Grade 3 Science)
RS SS Ncount % Cumulative Frequency
Cumulative %
0 395 0 0.00 0 0.00
1 438 0 0.00 0 0.00
2 465 0 0.00 0 0.00
3 481 0 0.00 0 0.00
4 493 0 0.00 0 0.00
5 502 1 0.00 1 0.00
6 510 3 0.01 4 0.02
7 518 5 0.02 9 0.04
8 524 19 0.08 28 0.12
9 530 29 0.13 57 0.25
10 536 43 0.19 100 0.44
11 541 51 0.22 151 0.66
12 546 78 0.34 229 1.00
13 550 97 0.42 326 1.42
14 555 127 0.55 453 1.97
15 559 166 0.72 619 2.70
16 563 177 0.77 796 3.47
17 567 219 0.95 1015 4.42
18 571 265 1.15 1280 5.57
19 575 273 1.19 1553 6.76
20 579 331 1.44 1884 8.20
21 582 385 1.68 2269 9.88
22 586 418 1.82 2687 11.70
23 590 446 1.94 3133 13.64
24 593 442 1.92 3575 15.57
25 596 524 2.28 4099 17.85
26 600 562 2.45 4661 20.30
27 603 626 2.73 5287 23.02
28 607 623 2.71 5910 25.73
29 610 663 2.89 6573 28.62
30 613 742 3.23 7315 31.85
31 617 732 3.19 8047 35.04
32 620 788 3.43 8835 38.47
33 623 799 3.48 9634 41.95
34 626 808 3.52 10442 45.47
35 630 824 3.59 11266 49.06
36 633 883 3.84 12149 52.90
37 636 827 3.60 12976 56.50
38 640 816 3.55 13792 60.05
39 643 825 3.59 14617 63.65
40 646 873 3.80 15490 67.45
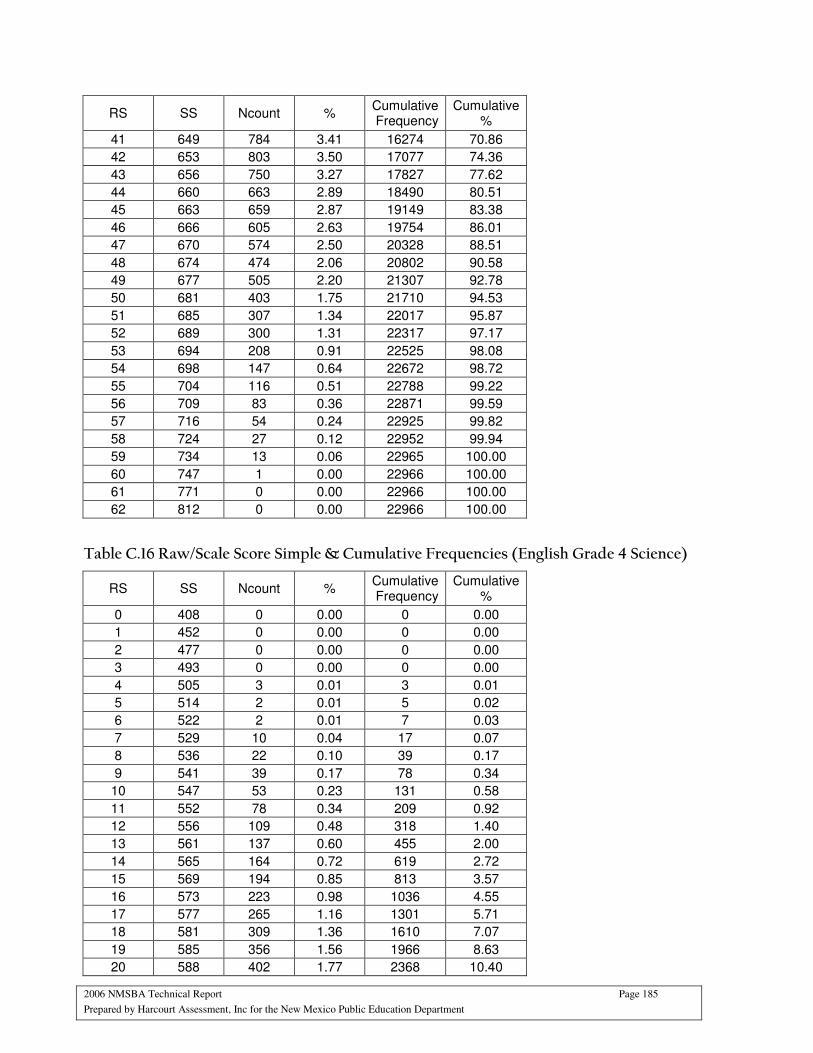
2006 NMSBA Technical Report Page 185
Prepared by Harcourt Assessment, Inc for the New Mexico Public Education Department
RS SS Ncount % Cumulative Frequency
Cumulative %
41 649 784 3.41 16274 70.86
42 653 803 3.50 17077 74.36
43 656 750 3.27 17827 77.62
44 660 663 2.89 18490 80.51
45 663 659 2.87 19149 83.38
46 666 605 2.63 19754 86.01
47 670 574 2.50 20328 88.51
48 674 474 2.06 20802 90.58
49 677 505 2.20 21307 92.78
50 681 403 1.75 21710 94.53
51 685 307 1.34 22017 95.87
52 689 300 1.31 22317 97.17
53 694 208 0.91 22525 98.08
54 698 147 0.64 22672 98.72
55 704 116 0.51 22788 99.22
56 709 83 0.36 22871 99.59
57 716 54 0.24 22925 99.82
58 724 27 0.12 22952 99.94
59 734 13 0.06 22965 100.00
60 747 1 0.00 22966 100.00
61 771 0 0.00 22966 100.00
62 812 0 0.00 22966 100.00
Table C.16 Raw/Scale Score Simple & Cumulative Frequencies (English Grade 4 Science)
RS SS Ncount % Cumulative Frequency
Cumulative %
0 408 0 0.00 0 0.00
1 452 0 0.00 0 0.00
2 477 0 0.00 0 0.00
3 493 0 0.00 0 0.00
4 505 3 0.01 3 0.01
5 514 2 0.01 5 0.02
6 522 2 0.01 7 0.03
7 529 10 0.04 17 0.07
8 536 22 0.10 39 0.17
9 541 39 0.17 78 0.34
10 547 53 0.23 131 0.58
11 552 78 0.34 209 0.92
12 556 109 0.48 318 1.40
13 561 137 0.60 455 2.00
14 565 164 0.72 619 2.72
15 569 194 0.85 813 3.57
16 573 223 0.98 1036 4.55
17 577 265 1.16 1301 5.71
18 581 309 1.36 1610 7.07
19 585 356 1.56 1966 8.63
20 588 402 1.77 2368 10.40
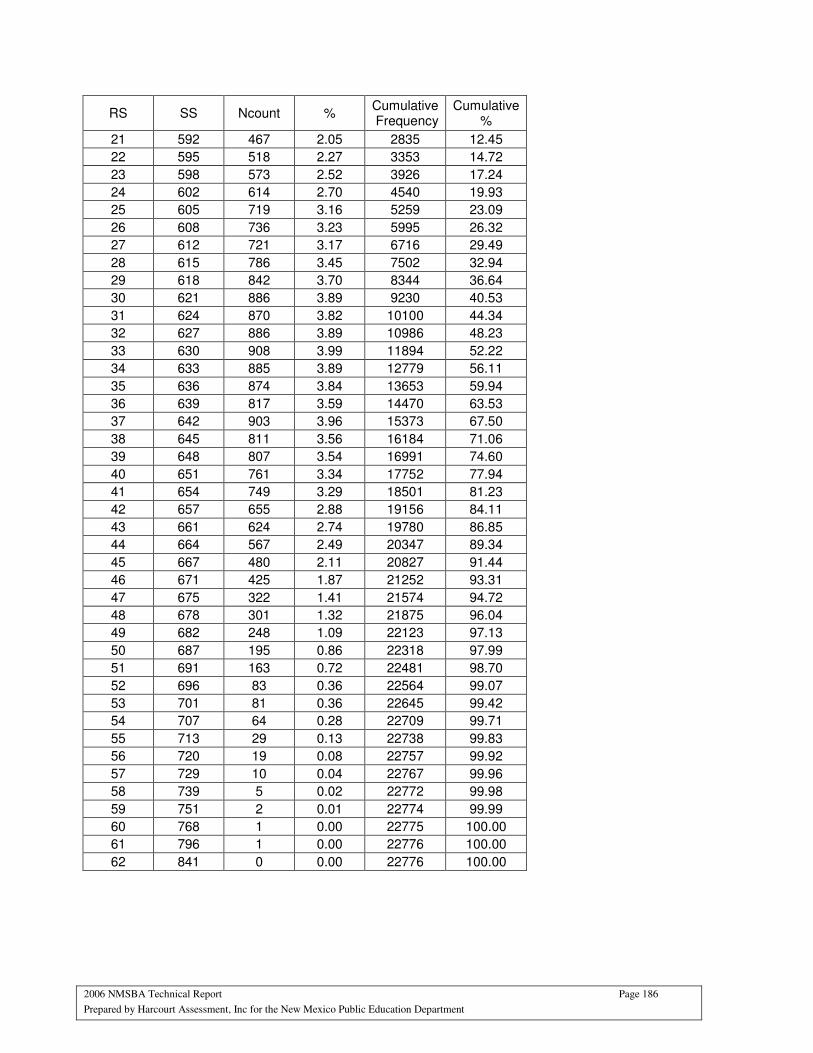
2006 NMSBA Technical Report Page 186
Prepared by Harcourt Assessment, Inc for the New Mexico Public Education Department
RS SS Ncount % Cumulative Frequency
Cumulative %
21 592 467 2.05 2835 12.45
22 595 518 2.27 3353 14.72
23 598 573 2.52 3926 17.24
24 602 614 2.70 4540 19.93
25 605 719 3.16 5259 23.09
26 608 736 3.23 5995 26.32
27 612 721 3.17 6716 29.49
28 615 786 3.45 7502 32.94
29 618 842 3.70 8344 36.64
30 621 886 3.89 9230 40.53
31 624 870 3.82 10100 44.34
32 627 886 3.89 10986 48.23
33 630 908 3.99 11894 52.22
34 633 885 3.89 12779 56.11
35 636 874 3.84 13653 59.94
36 639 817 3.59 14470 63.53
37 642 903 3.96 15373 67.50
38 645 811 3.56 16184 71.06
39 648 807 3.54 16991 74.60
40 651 761 3.34 17752 77.94
41 654 749 3.29 18501 81.23
42 657 655 2.88 19156 84.11
43 661 624 2.74 19780 86.85
44 664 567 2.49 20347 89.34
45 667 480 2.11 20827 91.44
46 671 425 1.87 21252 93.31
47 675 322 1.41 21574 94.72
48 678 301 1.32 21875 96.04
49 682 248 1.09 22123 97.13
50 687 195 0.86 22318 97.99
51 691 163 0.72 22481 98.70
52 696 83 0.36 22564 99.07
53 701 81 0.36 22645 99.42
54 707 64 0.28 22709 99.71
55 713 29 0.13 22738 99.83
56 720 19 0.08 22757 99.92
57 729 10 0.04 22767 99.96
58 739 5 0.02 22772 99.98
59 751 2 0.01 22774 99.99
60 768 1 0.00 22775 100.00
61 796 1 0.00 22776 100.00
62 841 0 0.00 22776 100.00
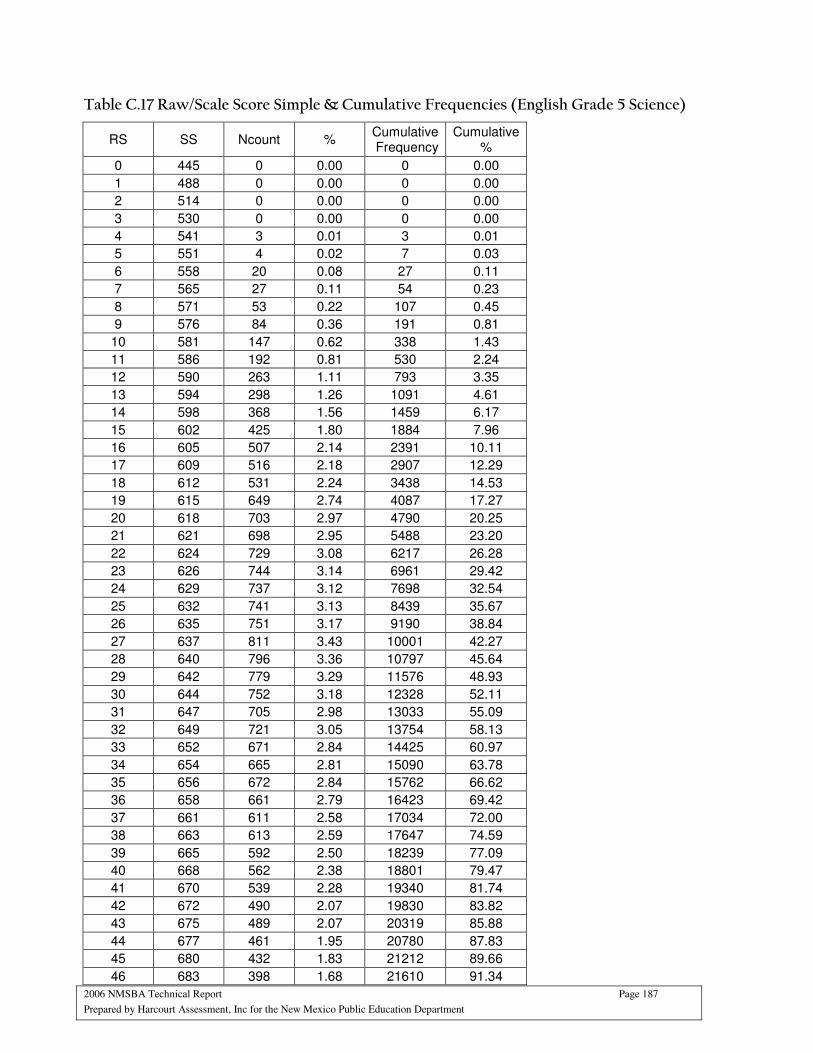
2006 NMSBA Technical Report Page 187
Prepared by Harcourt Assessment, Inc for the New Mexico Public Education Department
Table C.17 Raw/Scale Score Simple & Cumulative Frequencies (English Grade 5 Science)
RS SS Ncount % Cumulative Frequency
Cumulative %
0 445 0 0.00 0 0.00
1 488 0 0.00 0 0.00
2 514 0 0.00 0 0.00
3 530 0 0.00 0 0.00
4 541 3 0.01 3 0.01
5 551 4 0.02 7 0.03
6 558 20 0.08 27 0.11
7 565 27 0.11 54 0.23
8 571 53 0.22 107 0.45
9 576 84 0.36 191 0.81
10 581 147 0.62 338 1.43
11 586 192 0.81 530 2.24
12 590 263 1.11 793 3.35
13 594 298 1.26 1091 4.61
14 598 368 1.56 1459 6.17
15 602 425 1.80 1884 7.96
16 605 507 2.14 2391 10.11
17 609 516 2.18 2907 12.29
18 612 531 2.24 3438 14.53
19 615 649 2.74 4087 17.27
20 618 703 2.97 4790 20.25
21 621 698 2.95 5488 23.20
22 624 729 3.08 6217 26.28
23 626 744 3.14 6961 29.42
24 629 737 3.12 7698 32.54
25 632 741 3.13 8439 35.67
26 635 751 3.17 9190 38.84
27 637 811 3.43 10001 42.27
28 640 796 3.36 10797 45.64
29 642 779 3.29 11576 48.93
30 644 752 3.18 12328 52.11
31 647 705 2.98 13033 55.09
32 649 721 3.05 13754 58.13
33 652 671 2.84 14425 60.97
34 654 665 2.81 15090 63.78
35 656 672 2.84 15762 66.62
36 658 661 2.79 16423 69.42
37 661 611 2.58 17034 72.00
38 663 613 2.59 17647 74.59
39 665 592 2.50 18239 77.09
40 668 562 2.38 18801 79.47
41 670 539 2.28 19340 81.74
42 672 490 2.07 19830 83.82
43 675 489 2.07 20319 85.88
44 677 461 1.95 20780 87.83
45 680 432 1.83 21212 89.66
46 683 398 1.68 21610 91.34
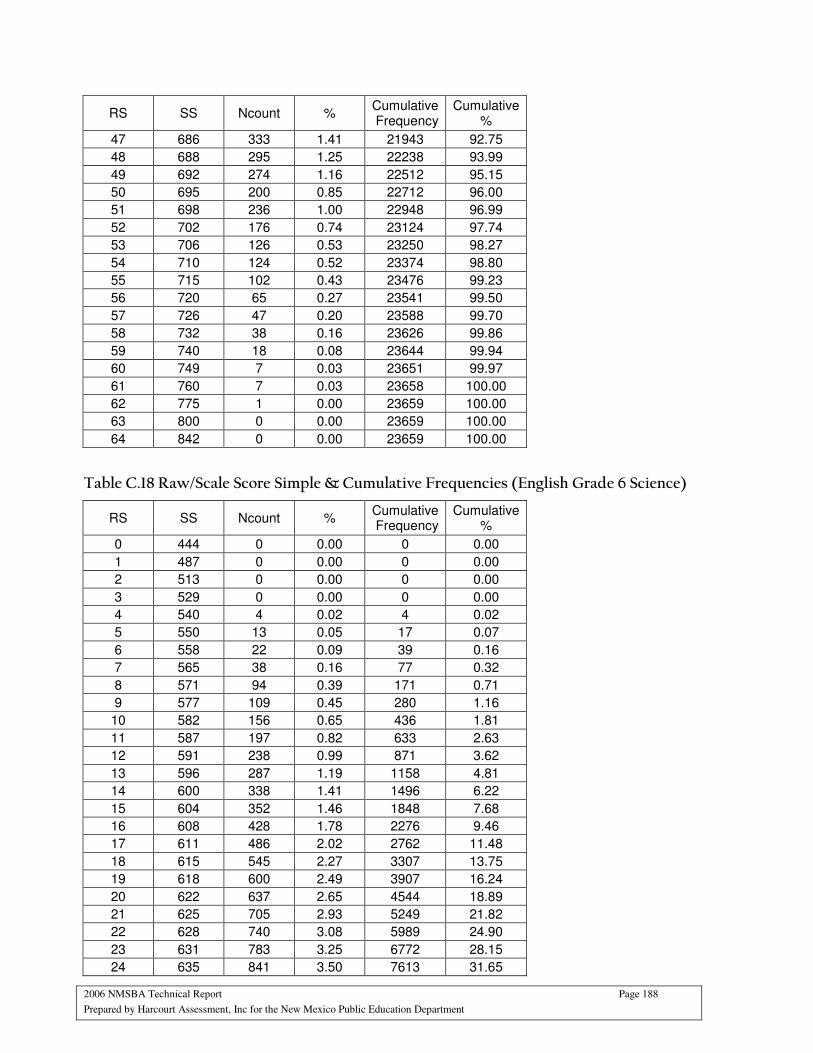
2006 NMSBA Technical Report Page 188
Prepared by Harcourt Assessment, Inc for the New Mexico Public Education Department
RS SS Ncount % Cumulative Frequency
Cumulative %
47 686 333 1.41 21943 92.75
48 688 295 1.25 22238 93.99
49 692 274 1.16 22512 95.15
50 695 200 0.85 22712 96.00
51 698 236 1.00 22948 96.99
52 702 176 0.74 23124 97.74
53 706 126 0.53 23250 98.27
54 710 124 0.52 23374 98.80
55 715 102 0.43 23476 99.23
56 720 65 0.27 23541 99.50
57 726 47 0.20 23588 99.70
58 732 38 0.16 23626 99.86
59 740 18 0.08 23644 99.94
60 749 7 0.03 23651 99.97
61 760 7 0.03 23658 100.00
62 775 1 0.00 23659 100.00
63 800 0 0.00 23659 100.00
64 842 0 0.00 23659 100.00
Table C.18 Raw/Scale Score Simple & Cumulative Frequencies (English Grade 6 Science)
RS SS Ncount % Cumulative Frequency
Cumulative %
0 444 0 0.00 0 0.00
1 487 0 0.00 0 0.00
2 513 0 0.00 0 0.00
3 529 0 0.00 0 0.00
4 540 4 0.02 4 0.02
5 550 13 0.05 17 0.07
6 558 22 0.09 39 0.16
7 565 38 0.16 77 0.32
8 571 94 0.39 171 0.71
9 577 109 0.45 280 1.16
10 582 156 0.65 436 1.81
11 587 197 0.82 633 2.63
12 591 238 0.99 871 3.62
13 596 287 1.19 1158 4.81
14 600 338 1.41 1496 6.22
15 604 352 1.46 1848 7.68
16 608 428 1.78 2276 9.46
17 611 486 2.02 2762 11.48
18 615 545 2.27 3307 13.75
19 618 600 2.49 3907 16.24
20 622 637 2.65 4544 18.89
21 625 705 2.93 5249 21.82
22 628 740 3.08 5989 24.90
23 631 783 3.25 6772 28.15
24 635 841 3.50 7613 31.65

2006 NMSBA Technical Report Page 189
Prepared by Harcourt Assessment, Inc for the New Mexico Public Education Department
RS SS Ncount % Cumulative Frequency
Cumulative %
25 638 803 3.34 8416 34.99
26 641 896 3.72 9312 38.71
27 644 893 3.71 10205 42.42
28 647 905 3.76 11110 46.18
29 650 918 3.82 12028 50.00
30 653 899 3.74 12927 53.74
31 656 824 3.43 13751 57.16
32 659 865 3.60 14616 60.76
33 662 837 3.48 15453 64.24
34 665 836 3.48 16289 67.71
35 668 757 3.15 17046 70.86
36 671 812 3.38 17858 74.24
37 674 695 2.89 18553 77.12
38 677 706 2.93 19259 80.06
39 680 644 2.68 19903 82.74
40 683 596 2.48 20499 85.21
41 687 573 2.38 21072 87.60
42 690 530 2.20 21602 89.80
43 693 464 1.93 22066 91.73
44 697 376 1.56 22442 93.29
45 700 358 1.49 22800 94.78
46 704 325 1.35 23125 96.13
47 708 225 0.94 23350 97.07
48 712 212 0.88 23562 97.95
49 716 144 0.60 23706 98.55
50 721 110 0.46 23816 99.00
51 725 89 0.37 23905 99.37
52 731 65 0.27 23970 99.64
53 737 38 0.16 24008 99.80
54 743 26 0.11 24034 99.91
55 751 13 0.05 24047 99.96
56 761 6 0.02 24053 99.99
57 773 3 0.01 24056 100.00
58 790 0 0.00 24056 100.00
59 819 0 0.00 24056 100.00
60 865 0 0.00 24056 100.00
Table C.19 Raw/Scale Score Simple & Cumulative Frequencies (English Grade 7 Science)
RS SS Ncount % Cumulative Frequency
Cumulative %
0 456 0 0.00 0 0.00
1 499 0 0.00 0 0.00
2 525 1 0.00 1 0.00
3 540 3 0.01 4 0.02
4 552 3 0.01 7 0.03
5 561 7 0.03 14 0.06
6 568 29 0.12 43 0.17

2006 NMSBA Technical Report Page 190
Prepared by Harcourt Assessment, Inc for the New Mexico Public Education Department
RS SS Ncount % Cumulative Frequency
Cumulative %
7 575 40 0.16 83 0.34
8 581 68 0.28 151 0.61
9 586 110 0.45 261 1.06
10 591 162 0.66 423 1.72
11 596 217 0.88 640 2.60
12 600 276 1.12 916 3.72
13 604 331 1.35 1247 5.07
14 608 415 1.69 1662 6.75
15 612 471 1.91 2133 8.67
16 615 461 1.87 2594 10.54
17 619 534 2.17 3128 12.71
18 622 572 2.32 3700 15.04
19 626 594 2.41 4294 17.45
20 629 647 2.63 4941 20.08
21 632 626 2.54 5567 22.62
22 635 694 2.82 6261 25.44
23 638 679 2.76 6940 28.20
24 641 742 3.02 7682 31.22
25 644 729 2.96 8411 34.18
26 647 771 3.13 9182 37.31
27 650 758 3.08 9940 40.39
28 652 755 3.07 10695 43.46
29 655 787 3.20 11482 46.66
30 658 789 3.21 12271 49.86
31 661 797 3.24 13068 53.10
32 664 810 3.29 13878 56.39
33 666 771 3.13 14649 59.53
34 669 740 3.01 15389 62.53
35 672 733 2.98 16122 65.51
36 675 780 3.17 16902 68.68
37 678 759 3.08 17661 71.77
38 681 702 2.85 18363 74.62
39 684 718 2.92 19081 77.54
40 687 678 2.76 19759 80.29
41 690 654 2.66 20413 82.95
42 693 570 2.32 20983 85.27
43 696 569 2.31 21552 87.58
44 699 499 2.03 22051 89.61
45 703 430 1.75 22481 91.35
46 706 403 1.64 22884 92.99
47 710 351 1.43 23235 94.42
48 713 283 1.15 23518 95.57
49 717 245 1.00 23763 96.56
50 721 199 0.81 23962 97.37
51 725 173 0.70 24135 98.07
52 729 138 0.56 24273 98.63
53 733 103 0.42 24376 99.05
54 738 74 0.30 24450 99.35
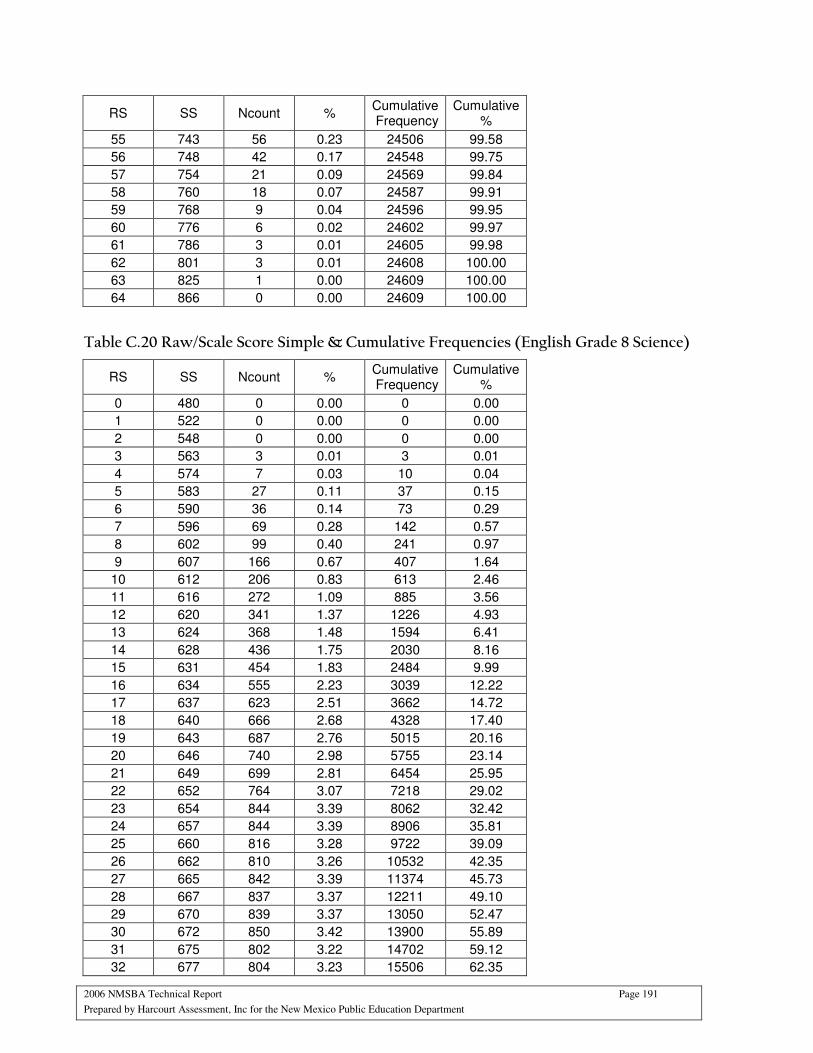
2006 NMSBA Technical Report Page 191
Prepared by Harcourt Assessment, Inc for the New Mexico Public Education Department
RS SS Ncount % Cumulative Frequency
Cumulative %
55 743 56 0.23 24506 99.58
56 748 42 0.17 24548 99.75
57 754 21 0.09 24569 99.84
58 760 18 0.07 24587 99.91
59 768 9 0.04 24596 99.95
60 776 6 0.02 24602 99.97
61 786 3 0.01 24605 99.98
62 801 3 0.01 24608 100.00
63 825 1 0.00 24609 100.00
64 866 0 0.00 24609 100.00
Table C.20 Raw/Scale Score Simple & Cumulative Frequencies (English Grade 8 Science)
RS SS Ncount % Cumulative Frequency
Cumulative %
0 480 0 0.00 0 0.00
1 522 0 0.00 0 0.00
2 548 0 0.00 0 0.00
3 563 3 0.01 3 0.01
4 574 7 0.03 10 0.04
5 583 27 0.11 37 0.15
6 590 36 0.14 73 0.29
7 596 69 0.28 142 0.57
8 602 99 0.40 241 0.97
9 607 166 0.67 407 1.64
10 612 206 0.83 613 2.46
11 616 272 1.09 885 3.56
12 620 341 1.37 1226 4.93
13 624 368 1.48 1594 6.41
14 628 436 1.75 2030 8.16
15 631 454 1.83 2484 9.99
16 634 555 2.23 3039 12.22
17 637 623 2.51 3662 14.72
18 640 666 2.68 4328 17.40
19 643 687 2.76 5015 20.16
20 646 740 2.98 5755 23.14
21 649 699 2.81 6454 25.95
22 652 764 3.07 7218 29.02
23 654 844 3.39 8062 32.42
24 657 844 3.39 8906 35.81
25 660 816 3.28 9722 39.09
26 662 810 3.26 10532 42.35
27 665 842 3.39 11374 45.73
28 667 837 3.37 12211 49.10
29 670 839 3.37 13050 52.47
30 672 850 3.42 13900 55.89
31 675 802 3.22 14702 59.12
32 677 804 3.23 15506 62.35
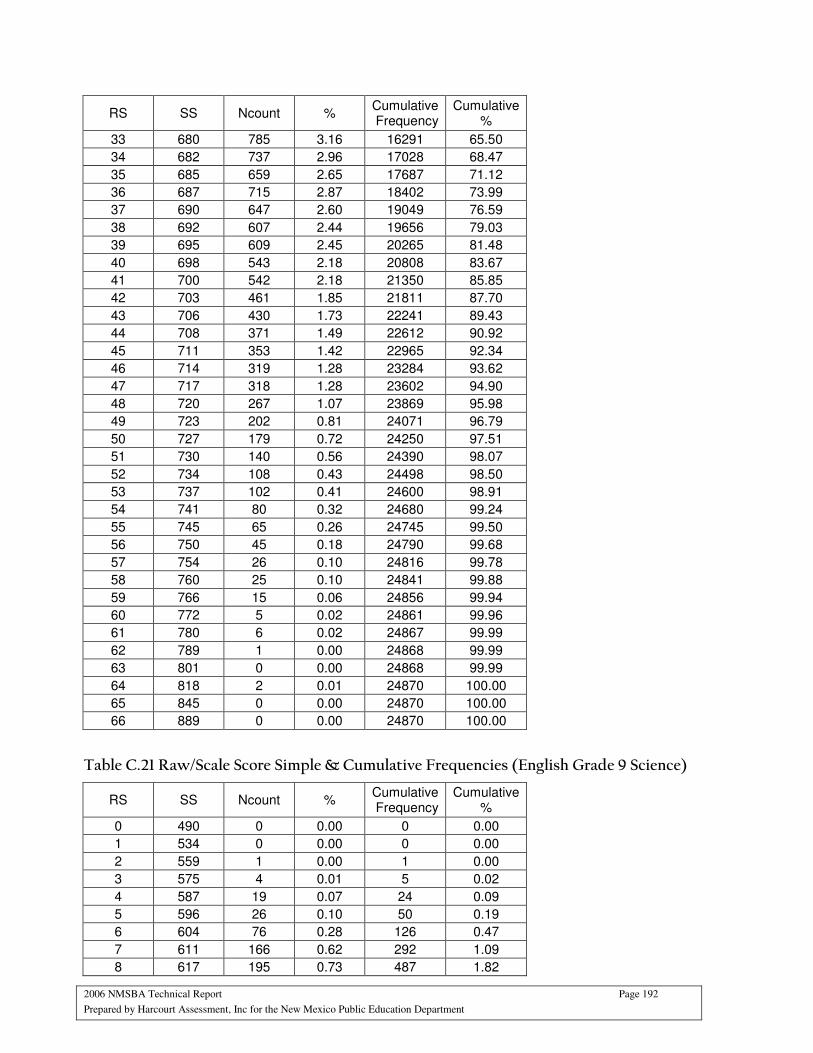
2006 NMSBA Technical Report Page 192
Prepared by Harcourt Assessment, Inc for the New Mexico Public Education Department
RS SS Ncount % Cumulative Frequency
Cumulative %
33 680 785 3.16 16291 65.50
34 682 737 2.96 17028 68.47
35 685 659 2.65 17687 71.12
36 687 715 2.87 18402 73.99
37 690 647 2.60 19049 76.59
38 692 607 2.44 19656 79.03
39 695 609 2.45 20265 81.48
40 698 543 2.18 20808 83.67
41 700 542 2.18 21350 85.85
42 703 461 1.85 21811 87.70
43 706 430 1.73 22241 89.43
44 708 371 1.49 22612 90.92
45 711 353 1.42 22965 92.34
46 714 319 1.28 23284 93.62
47 717 318 1.28 23602 94.90
48 720 267 1.07 23869 95.98
49 723 202 0.81 24071 96.79
50 727 179 0.72 24250 97.51
51 730 140 0.56 24390 98.07
52 734 108 0.43 24498 98.50
53 737 102 0.41 24600 98.91
54 741 80 0.32 24680 99.24
55 745 65 0.26 24745 99.50
56 750 45 0.18 24790 99.68
57 754 26 0.10 24816 99.78
58 760 25 0.10 24841 99.88
59 766 15 0.06 24856 99.94
60 772 5 0.02 24861 99.96
61 780 6 0.02 24867 99.99
62 789 1 0.00 24868 99.99
63 801 0 0.00 24868 99.99
64 818 2 0.01 24870 100.00
65 845 0 0.00 24870 100.00
66 889 0 0.00 24870 100.00
Table C.21 Raw/Scale Score Simple & Cumulative Frequencies (English Grade 9 Science)
RS SS Ncount % Cumulative Frequency
Cumulative %
0 490 0 0.00 0 0.00
1 534 0 0.00 0 0.00
2 559 1 0.00 1 0.00
3 575 4 0.01 5 0.02
4 587 19 0.07 24 0.09
5 596 26 0.10 50 0.19
6 604 76 0.28 126 0.47
7 611 166 0.62 292 1.09
8 617 195 0.73 487 1.82
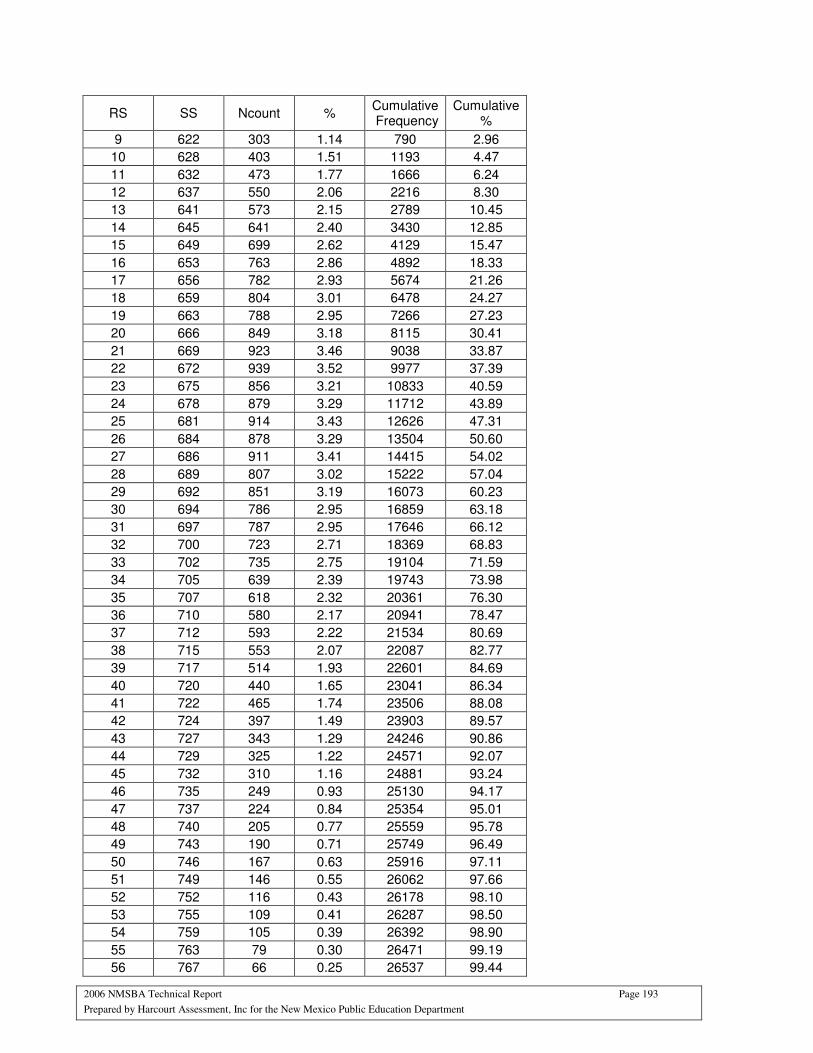
2006 NMSBA Technical Report Page 193
Prepared by Harcourt Assessment, Inc for the New Mexico Public Education Department
RS SS Ncount % Cumulative Frequency
Cumulative %
9 622 303 1.14 790 2.96
10 628 403 1.51 1193 4.47
11 632 473 1.77 1666 6.24
12 637 550 2.06 2216 8.30
13 641 573 2.15 2789 10.45
14 645 641 2.40 3430 12.85
15 649 699 2.62 4129 15.47
16 653 763 2.86 4892 18.33
17 656 782 2.93 5674 21.26
18 659 804 3.01 6478 24.27
19 663 788 2.95 7266 27.23
20 666 849 3.18 8115 30.41
21 669 923 3.46 9038 33.87
22 672 939 3.52 9977 37.39
23 675 856 3.21 10833 40.59
24 678 879 3.29 11712 43.89
25 681 914 3.43 12626 47.31
26 684 878 3.29 13504 50.60
27 686 911 3.41 14415 54.02
28 689 807 3.02 15222 57.04
29 692 851 3.19 16073 60.23
30 694 786 2.95 16859 63.18
31 697 787 2.95 17646 66.12
32 700 723 2.71 18369 68.83
33 702 735 2.75 19104 71.59
34 705 639 2.39 19743 73.98
35 707 618 2.32 20361 76.30
36 710 580 2.17 20941 78.47
37 712 593 2.22 21534 80.69
38 715 553 2.07 22087 82.77
39 717 514 1.93 22601 84.69
40 720 440 1.65 23041 86.34
41 722 465 1.74 23506 88.08
42 724 397 1.49 23903 89.57
43 727 343 1.29 24246 90.86
44 729 325 1.22 24571 92.07
45 732 310 1.16 24881 93.24
46 735 249 0.93 25130 94.17
47 737 224 0.84 25354 95.01
48 740 205 0.77 25559 95.78
49 743 190 0.71 25749 96.49
50 746 167 0.63 25916 97.11
51 749 146 0.55 26062 97.66
52 752 116 0.43 26178 98.10
53 755 109 0.41 26287 98.50
54 759 105 0.39 26392 98.90
55 763 79 0.30 26471 99.19
56 767 66 0.25 26537 99.44
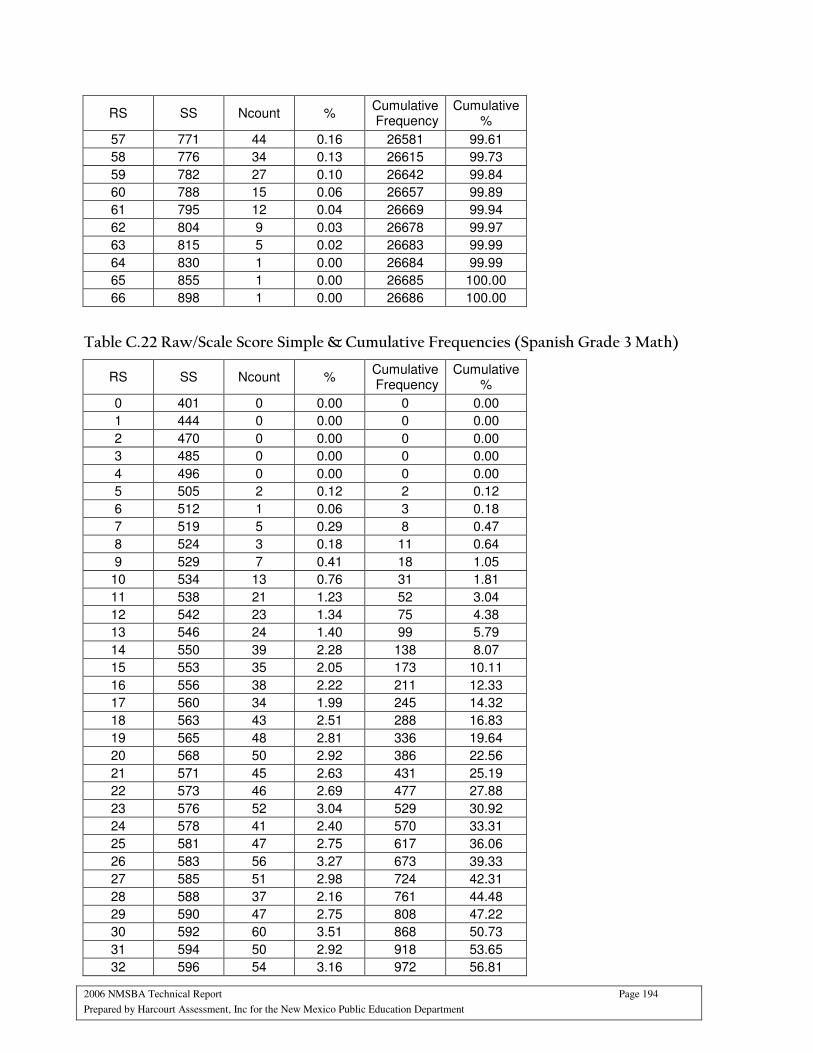
2006 NMSBA Technical Report Page 194
Prepared by Harcourt Assessment, Inc for the New Mexico Public Education Department
RS SS Ncount % Cumulative Frequency
Cumulative %
57 771 44 0.16 26581 99.61
58 776 34 0.13 26615 99.73
59 782 27 0.10 26642 99.84
60 788 15 0.06 26657 99.89
61 795 12 0.04 26669 99.94
62 804 9 0.03 26678 99.97
63 815 5 0.02 26683 99.99
64 830 1 0.00 26684 99.99
65 855 1 0.00 26685 100.00
66 898 1 0.00 26686 100.00
Table C.22 Raw/Scale Score Simple & Cumulative Frequencies (Spanish Grade 3 Math)
RS SS Ncount % Cumulative Frequency
Cumulative %
0 401 0 0.00 0 0.00
1 444 0 0.00 0 0.00
2 470 0 0.00 0 0.00
3 485 0 0.00 0 0.00
4 496 0 0.00 0 0.00
5 505 2 0.12 2 0.12
6 512 1 0.06 3 0.18
7 519 5 0.29 8 0.47
8 524 3 0.18 11 0.64
9 529 7 0.41 18 1.05
10 534 13 0.76 31 1.81
11 538 21 1.23 52 3.04
12 542 23 1.34 75 4.38
13 546 24 1.40 99 5.79
14 550 39 2.28 138 8.07
15 553 35 2.05 173 10.11
16 556 38 2.22 211 12.33
17 560 34 1.99 245 14.32
18 563 43 2.51 288 16.83
19 565 48 2.81 336 19.64
20 568 50 2.92 386 22.56
21 571 45 2.63 431 25.19
22 573 46 2.69 477 27.88
23 576 52 3.04 529 30.92
24 578 41 2.40 570 33.31
25 581 47 2.75 617 36.06
26 583 56 3.27 673 39.33
27 585 51 2.98 724 42.31
28 588 37 2.16 761 44.48
29 590 47 2.75 808 47.22
30 592 60 3.51 868 50.73
31 594 50 2.92 918 53.65
32 596 54 3.16 972 56.81
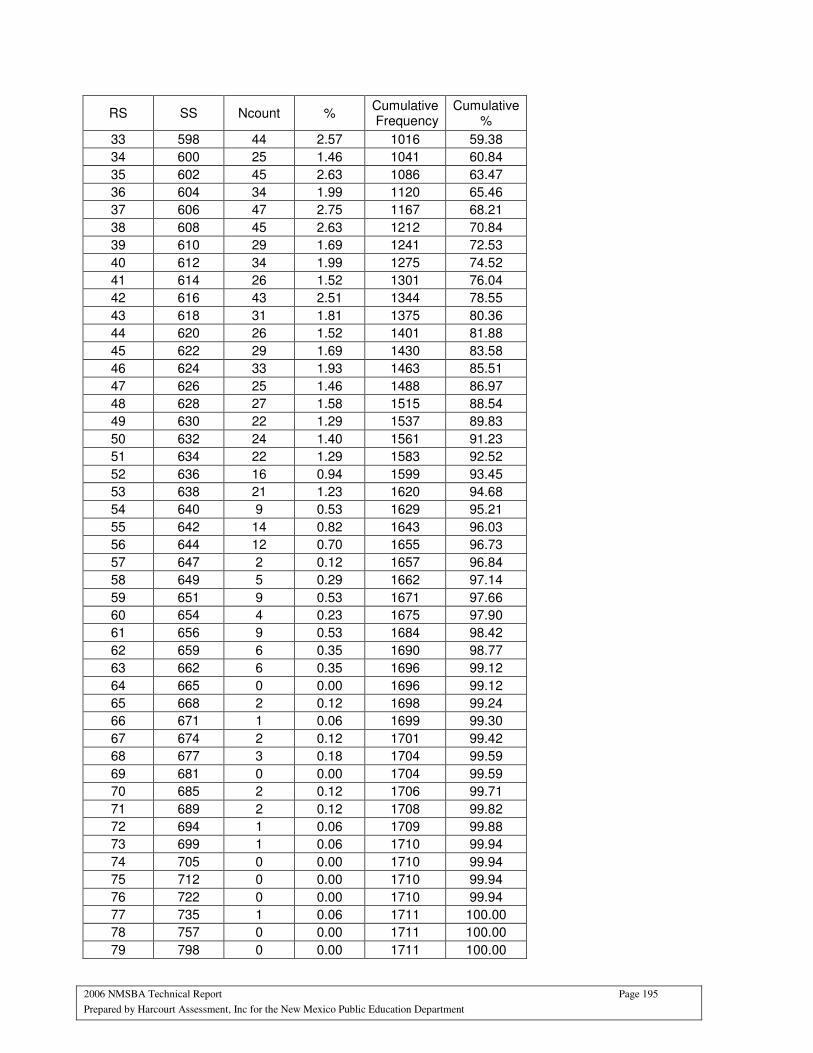
2006 NMSBA Technical Report Page 195
Prepared by Harcourt Assessment, Inc for the New Mexico Public Education Department
RS SS Ncount % Cumulative Frequency
Cumulative %
33 598 44 2.57 1016 59.38
34 600 25 1.46 1041 60.84
35 602 45 2.63 1086 63.47
36 604 34 1.99 1120 65.46
37 606 47 2.75 1167 68.21
38 608 45 2.63 1212 70.84
39 610 29 1.69 1241 72.53
40 612 34 1.99 1275 74.52
41 614 26 1.52 1301 76.04
42 616 43 2.51 1344 78.55
43 618 31 1.81 1375 80.36
44 620 26 1.52 1401 81.88
45 622 29 1.69 1430 83.58
46 624 33 1.93 1463 85.51
47 626 25 1.46 1488 86.97
48 628 27 1.58 1515 88.54
49 630 22 1.29 1537 89.83
50 632 24 1.40 1561 91.23
51 634 22 1.29 1583 92.52
52 636 16 0.94 1599 93.45
53 638 21 1.23 1620 94.68
54 640 9 0.53 1629 95.21
55 642 14 0.82 1643 96.03
56 644 12 0.70 1655 96.73
57 647 2 0.12 1657 96.84
58 649 5 0.29 1662 97.14
59 651 9 0.53 1671 97.66
60 654 4 0.23 1675 97.90
61 656 9 0.53 1684 98.42
62 659 6 0.35 1690 98.77
63 662 6 0.35 1696 99.12
64 665 0 0.00 1696 99.12
65 668 2 0.12 1698 99.24
66 671 1 0.06 1699 99.30
67 674 2 0.12 1701 99.42
68 677 3 0.18 1704 99.59
69 681 0 0.00 1704 99.59
70 685 2 0.12 1706 99.71
71 689 2 0.12 1708 99.82
72 694 1 0.06 1709 99.88
73 699 1 0.06 1710 99.94
74 705 0 0.00 1710 99.94
75 712 0 0.00 1710 99.94
76 722 0 0.00 1710 99.94
77 735 1 0.06 1711 100.00
78 757 0 0.00 1711 100.00
79 798 0 0.00 1711 100.00
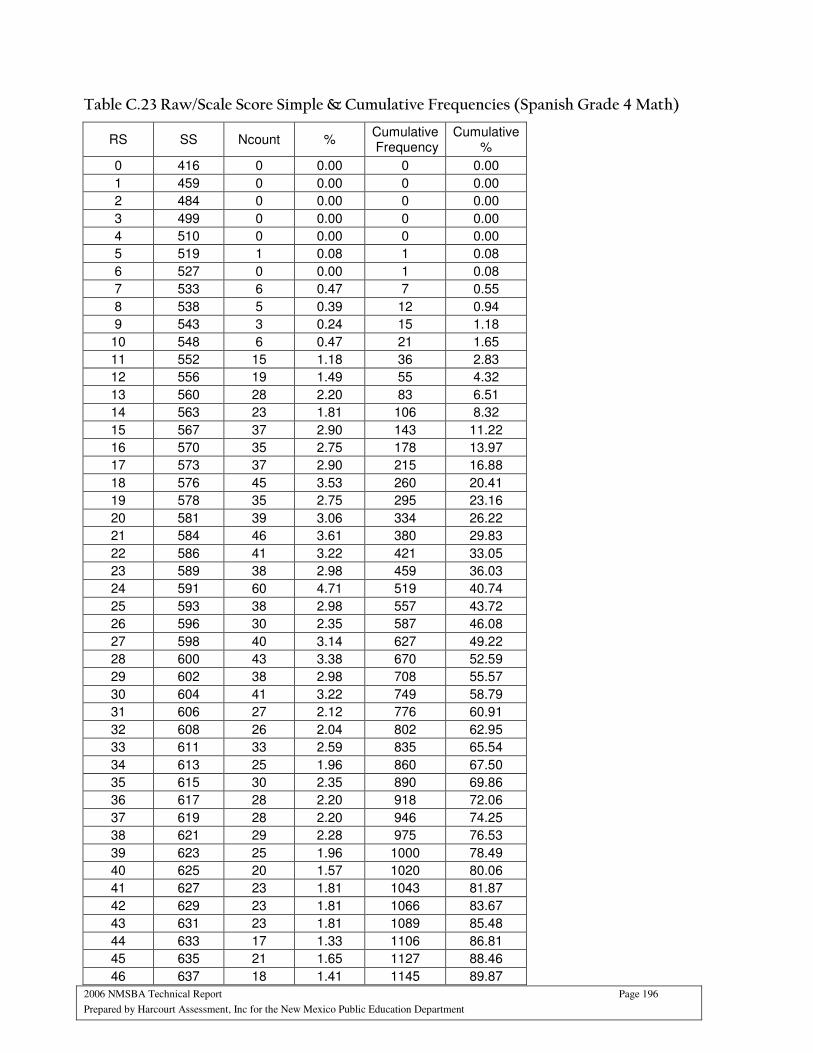
2006 NMSBA Technical Report Page 196
Prepared by Harcourt Assessment, Inc for the New Mexico Public Education Department
Table C.23 Raw/Scale Score Simple & Cumulative Frequencies (Spanish Grade 4 Math)
RS SS Ncount % Cumulative Frequency
Cumulative %
0 416 0 0.00 0 0.00
1 459 0 0.00 0 0.00
2 484 0 0.00 0 0.00
3 499 0 0.00 0 0.00
4 510 0 0.00 0 0.00
5 519 1 0.08 1 0.08
6 527 0 0.00 1 0.08
7 533 6 0.47 7 0.55
8 538 5 0.39 12 0.94
9 543 3 0.24 15 1.18
10 548 6 0.47 21 1.65
11 552 15 1.18 36 2.83
12 556 19 1.49 55 4.32
13 560 28 2.20 83 6.51
14 563 23 1.81 106 8.32
15 567 37 2.90 143 11.22
16 570 35 2.75 178 13.97
17 573 37 2.90 215 16.88
18 576 45 3.53 260 20.41
19 578 35 2.75 295 23.16
20 581 39 3.06 334 26.22
21 584 46 3.61 380 29.83
22 586 41 3.22 421 33.05
23 589 38 2.98 459 36.03
24 591 60 4.71 519 40.74
25 593 38 2.98 557 43.72
26 596 30 2.35 587 46.08
27 598 40 3.14 627 49.22
28 600 43 3.38 670 52.59
29 602 38 2.98 708 55.57
30 604 41 3.22 749 58.79
31 606 27 2.12 776 60.91
32 608 26 2.04 802 62.95
33 611 33 2.59 835 65.54
34 613 25 1.96 860 67.50
35 615 30 2.35 890 69.86
36 617 28 2.20 918 72.06
37 619 28 2.20 946 74.25
38 621 29 2.28 975 76.53
39 623 25 1.96 1000 78.49
40 625 20 1.57 1020 80.06
41 627 23 1.81 1043 81.87
42 629 23 1.81 1066 83.67
43 631 23 1.81 1089 85.48
44 633 17 1.33 1106 86.81
45 635 21 1.65 1127 88.46
46 637 18 1.41 1145 89.87

2006 NMSBA Technical Report Page 197
Prepared by Harcourt Assessment, Inc for the New Mexico Public Education Department
RS SS Ncount % Cumulative Frequency
Cumulative %
47 639 12 0.94 1157 90.82
48 641 10 0.78 1167 91.60
49 644 14 1.10 1181 92.70
50 646 17 1.33 1198 94.03
51 648 11 0.86 1209 94.90
52 650 6 0.47 1215 95.37
53 652 11 0.86 1226 96.23
54 655 7 0.55 1233 96.78
55 657 5 0.39 1238 97.17
56 659 6 0.47 1244 97.65
57 662 5 0.39 1249 98.04
58 664 4 0.31 1253 98.35
59 666 4 0.31 1257 98.67
60 669 3 0.24 1260 98.90
61 671 4 0.31 1264 99.22
62 674 6 0.47 1270 99.69
63 676 2 0.16 1272 99.84
64 679 1 0.08 1273 99.92
65 682 0 0.00 1273 99.92
66 685 0 0.00 1273 99.92
67 688 1 0.08 1274 100.00
68 691 0 0.00 1274 100.00
69 694 0 0.00 1274 100.00
70 698 0 0.00 1274 100.00
71 701 0 0.00 1274 100.00
72 705 0 0.00 1274 100.00
73 710 0 0.00 1274 100.00
74 715 0 0.00 1274 100.00
75 720 0 0.00 1274 100.00
76 726 0 0.00 1274 100.00
77 734 0 0.00 1274 100.00
78 744 0 0.00 1274 100.00
79 757 0 0.00 1274 100.00
80 781 0 0.00 1274 100.00
81 822 0 0.00 1274 100.00
Table C.24 Raw/Scale Score Simple & Cumulative Frequencies (Spanish Grade 5 Math)
RS SS Ncount % Cumulative Frequency
Cumulative %
0 430 0 0.00 0 0.00
1 473 0 0.00 0 0.00
2 498 1 0.12 1 0.12
3 514 0 0.00 1 0.12
4 525 0 0.00 1 0.12
5 534 0 0.00 1 0.12
6 541 2 0.23 3 0.35
7 548 2 0.23 5 0.58
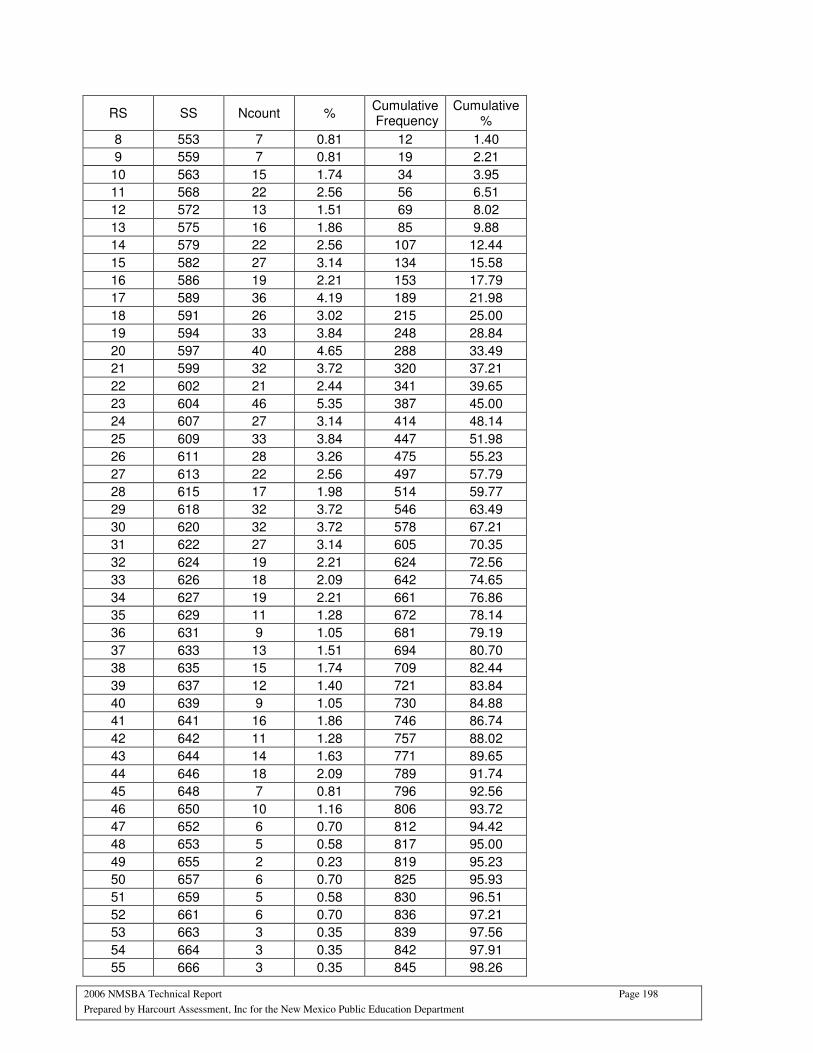
2006 NMSBA Technical Report Page 198
Prepared by Harcourt Assessment, Inc for the New Mexico Public Education Department
RS SS Ncount % Cumulative Frequency
Cumulative %
8 553 7 0.81 12 1.40
9 559 7 0.81 19 2.21
10 563 15 1.74 34 3.95
11 568 22 2.56 56 6.51
12 572 13 1.51 69 8.02
13 575 16 1.86 85 9.88
14 579 22 2.56 107 12.44
15 582 27 3.14 134 15.58
16 586 19 2.21 153 17.79
17 589 36 4.19 189 21.98
18 591 26 3.02 215 25.00
19 594 33 3.84 248 28.84
20 597 40 4.65 288 33.49
21 599 32 3.72 320 37.21
22 602 21 2.44 341 39.65
23 604 46 5.35 387 45.00
24 607 27 3.14 414 48.14
25 609 33 3.84 447 51.98
26 611 28 3.26 475 55.23
27 613 22 2.56 497 57.79
28 615 17 1.98 514 59.77
29 618 32 3.72 546 63.49
30 620 32 3.72 578 67.21
31 622 27 3.14 605 70.35
32 624 19 2.21 624 72.56
33 626 18 2.09 642 74.65
34 627 19 2.21 661 76.86
35 629 11 1.28 672 78.14
36 631 9 1.05 681 79.19
37 633 13 1.51 694 80.70
38 635 15 1.74 709 82.44
39 637 12 1.40 721 83.84
40 639 9 1.05 730 84.88
41 641 16 1.86 746 86.74
42 642 11 1.28 757 88.02
43 644 14 1.63 771 89.65
44 646 18 2.09 789 91.74
45 648 7 0.81 796 92.56
46 650 10 1.16 806 93.72
47 652 6 0.70 812 94.42
48 653 5 0.58 817 95.00
49 655 2 0.23 819 95.23
50 657 6 0.70 825 95.93
51 659 5 0.58 830 96.51
52 661 6 0.70 836 97.21
53 663 3 0.35 839 97.56
54 664 3 0.35 842 97.91
55 666 3 0.35 845 98.26
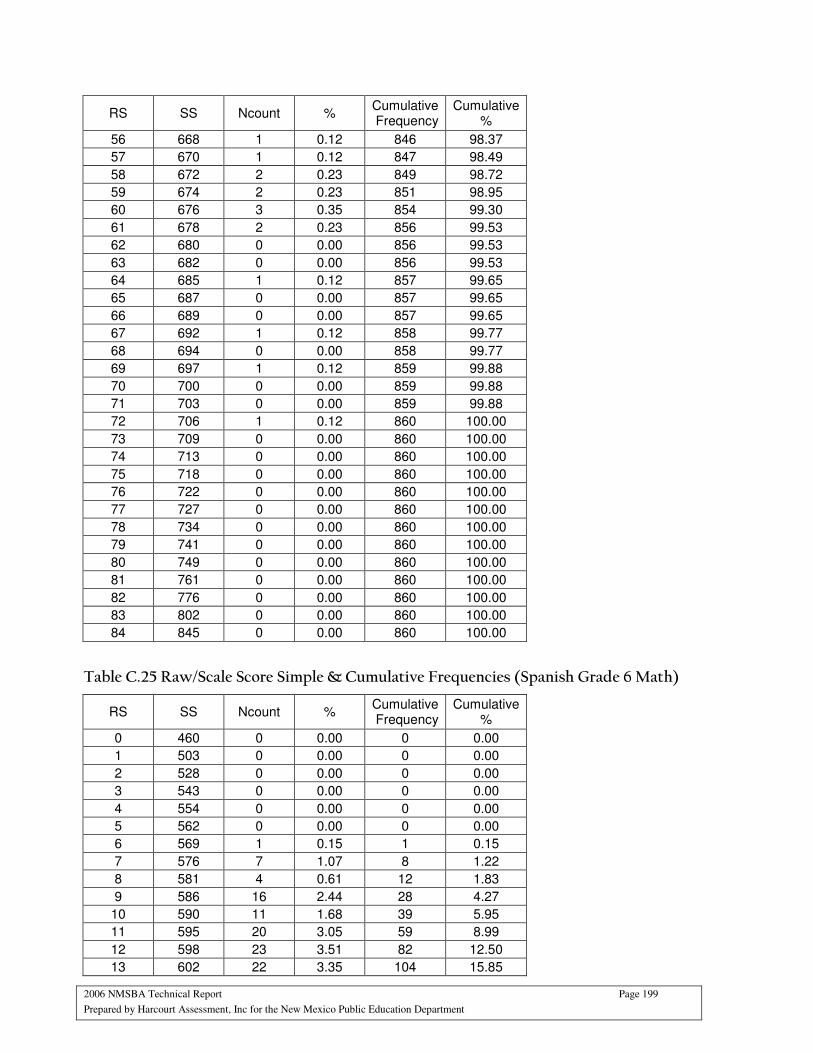
2006 NMSBA Technical Report Page 199
Prepared by Harcourt Assessment, Inc for the New Mexico Public Education Department
RS SS Ncount % Cumulative Frequency
Cumulative %
56 668 1 0.12 846 98.37
57 670 1 0.12 847 98.49
58 672 2 0.23 849 98.72
59 674 2 0.23 851 98.95
60 676 3 0.35 854 99.30
61 678 2 0.23 856 99.53
62 680 0 0.00 856 99.53
63 682 0 0.00 856 99.53
64 685 1 0.12 857 99.65
65 687 0 0.00 857 99.65
66 689 0 0.00 857 99.65
67 692 1 0.12 858 99.77
68 694 0 0.00 858 99.77
69 697 1 0.12 859 99.88
70 700 0 0.00 859 99.88
71 703 0 0.00 859 99.88
72 706 1 0.12 860 100.00
73 709 0 0.00 860 100.00
74 713 0 0.00 860 100.00
75 718 0 0.00 860 100.00
76 722 0 0.00 860 100.00
77 727 0 0.00 860 100.00
78 734 0 0.00 860 100.00
79 741 0 0.00 860 100.00
80 749 0 0.00 860 100.00
81 761 0 0.00 860 100.00
82 776 0 0.00 860 100.00
83 802 0 0.00 860 100.00
84 845 0 0.00 860 100.00
Table C.25 Raw/Scale Score Simple & Cumulative Frequencies (Spanish Grade 6 Math)
RS SS Ncount % Cumulative Frequency
Cumulative %
0 460 0 0.00 0 0.00
1 503 0 0.00 0 0.00
2 528 0 0.00 0 0.00
3 543 0 0.00 0 0.00
4 554 0 0.00 0 0.00
5 562 0 0.00 0 0.00
6 569 1 0.15 1 0.15
7 576 7 1.07 8 1.22
8 581 4 0.61 12 1.83
9 586 16 2.44 28 4.27
10 590 11 1.68 39 5.95
11 595 20 3.05 59 8.99
12 598 23 3.51 82 12.50
13 602 22 3.35 104 15.85
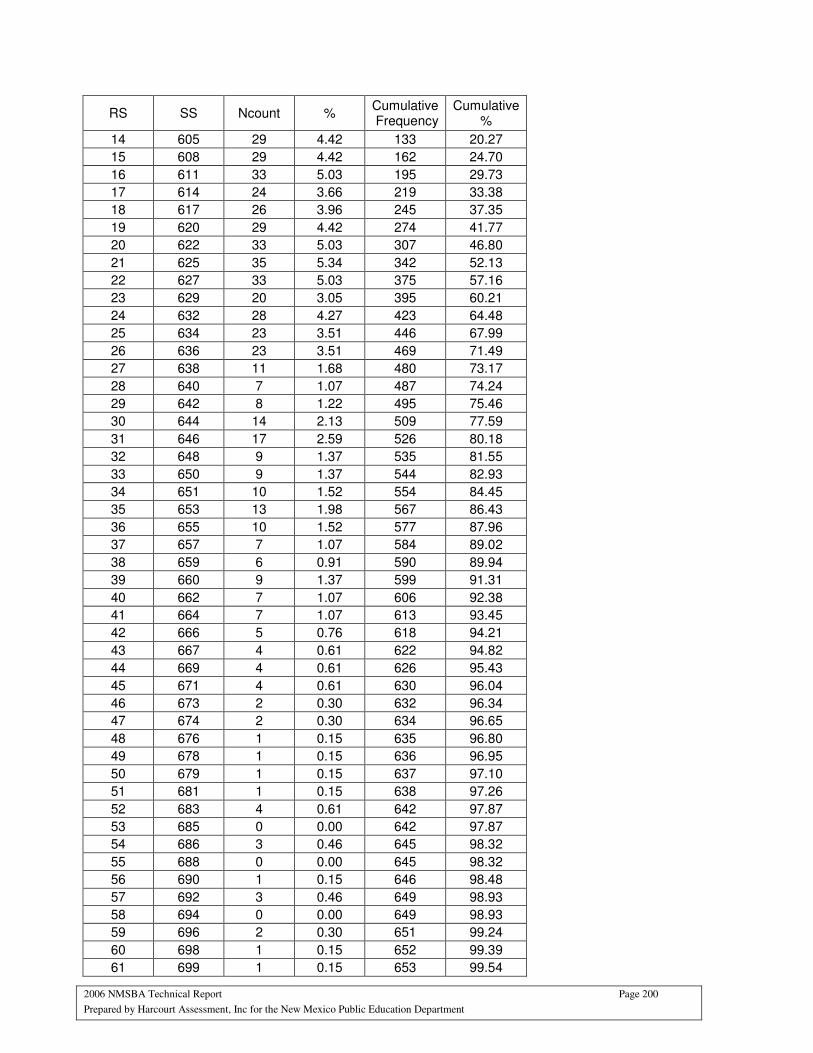
2006 NMSBA Technical Report Page 200
Prepared by Harcourt Assessment, Inc for the New Mexico Public Education Department
RS SS Ncount % Cumulative Frequency
Cumulative %
14 605 29 4.42 133 20.27
15 608 29 4.42 162 24.70
16 611 33 5.03 195 29.73
17 614 24 3.66 219 33.38
18 617 26 3.96 245 37.35
19 620 29 4.42 274 41.77
20 622 33 5.03 307 46.80
21 625 35 5.34 342 52.13
22 627 33 5.03 375 57.16
23 629 20 3.05 395 60.21
24 632 28 4.27 423 64.48
25 634 23 3.51 446 67.99
26 636 23 3.51 469 71.49
27 638 11 1.68 480 73.17
28 640 7 1.07 487 74.24
29 642 8 1.22 495 75.46
30 644 14 2.13 509 77.59
31 646 17 2.59 526 80.18
32 648 9 1.37 535 81.55
33 650 9 1.37 544 82.93
34 651 10 1.52 554 84.45
35 653 13 1.98 567 86.43
36 655 10 1.52 577 87.96
37 657 7 1.07 584 89.02
38 659 6 0.91 590 89.94
39 660 9 1.37 599 91.31
40 662 7 1.07 606 92.38
41 664 7 1.07 613 93.45
42 666 5 0.76 618 94.21
43 667 4 0.61 622 94.82
44 669 4 0.61 626 95.43
45 671 4 0.61 630 96.04
46 673 2 0.30 632 96.34
47 674 2 0.30 634 96.65
48 676 1 0.15 635 96.80
49 678 1 0.15 636 96.95
50 679 1 0.15 637 97.10
51 681 1 0.15 638 97.26
52 683 4 0.61 642 97.87
53 685 0 0.00 642 97.87
54 686 3 0.46 645 98.32
55 688 0 0.00 645 98.32
56 690 1 0.15 646 98.48
57 692 3 0.46 649 98.93
58 694 0 0.00 649 98.93
59 696 2 0.30 651 99.24
60 698 1 0.15 652 99.39
61 699 1 0.15 653 99.54
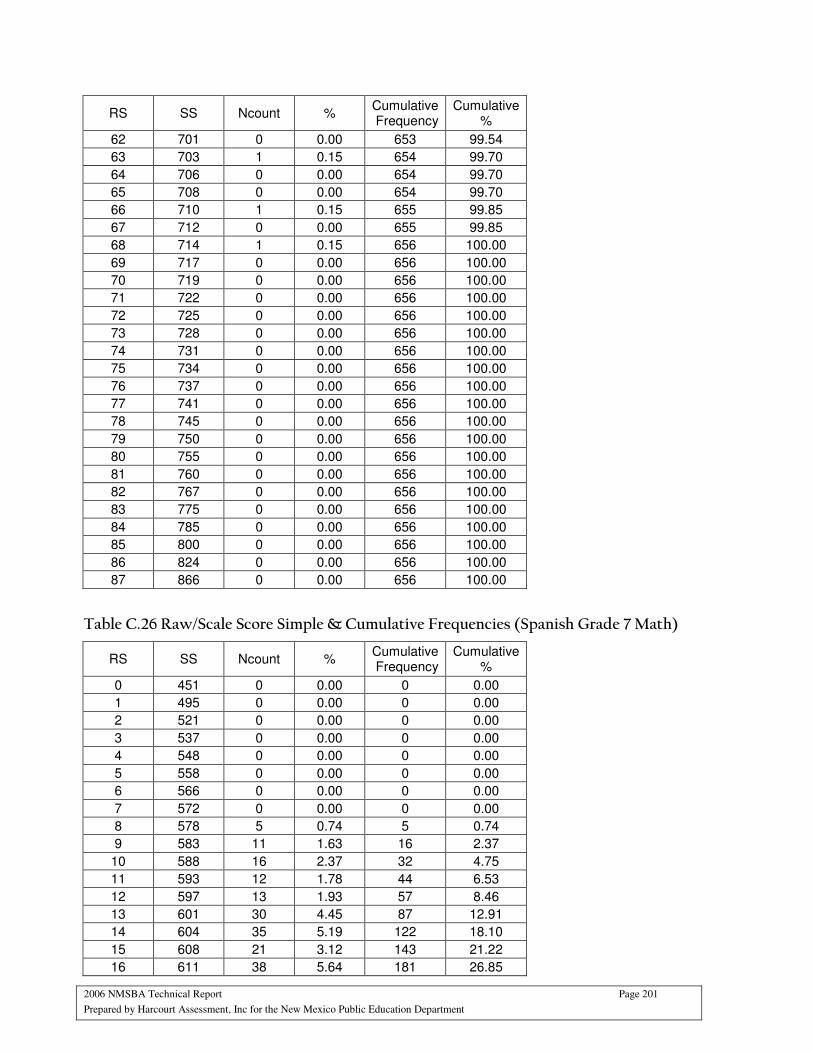
2006 NMSBA Technical Report Page 201
Prepared by Harcourt Assessment, Inc for the New Mexico Public Education Department
RS SS Ncount % Cumulative Frequency
Cumulative %
62 701 0 0.00 653 99.54
63 703 1 0.15 654 99.70
64 706 0 0.00 654 99.70
65 708 0 0.00 654 99.70
66 710 1 0.15 655 99.85
67 712 0 0.00 655 99.85
68 714 1 0.15 656 100.00
69 717 0 0.00 656 100.00
70 719 0 0.00 656 100.00
71 722 0 0.00 656 100.00
72 725 0 0.00 656 100.00
73 728 0 0.00 656 100.00
74 731 0 0.00 656 100.00
75 734 0 0.00 656 100.00
76 737 0 0.00 656 100.00
77 741 0 0.00 656 100.00
78 745 0 0.00 656 100.00
79 750 0 0.00 656 100.00
80 755 0 0.00 656 100.00
81 760 0 0.00 656 100.00
82 767 0 0.00 656 100.00
83 775 0 0.00 656 100.00
84 785 0 0.00 656 100.00
85 800 0 0.00 656 100.00
86 824 0 0.00 656 100.00
87 866 0 0.00 656 100.00
Table C.26 Raw/Scale Score Simple & Cumulative Frequencies (Spanish Grade 7 Math)
RS SS Ncount % Cumulative Frequency
Cumulative %
0 451 0 0.00 0 0.00
1 495 0 0.00 0 0.00
2 521 0 0.00 0 0.00
3 537 0 0.00 0 0.00
4 548 0 0.00 0 0.00
5 558 0 0.00 0 0.00
6 566 0 0.00 0 0.00
7 572 0 0.00 0 0.00
8 578 5 0.74 5 0.74
9 583 11 1.63 16 2.37
10 588 16 2.37 32 4.75
11 593 12 1.78 44 6.53
12 597 13 1.93 57 8.46
13 601 30 4.45 87 12.91
14 604 35 5.19 122 18.10
15 608 21 3.12 143 21.22
16 611 38 5.64 181 26.85
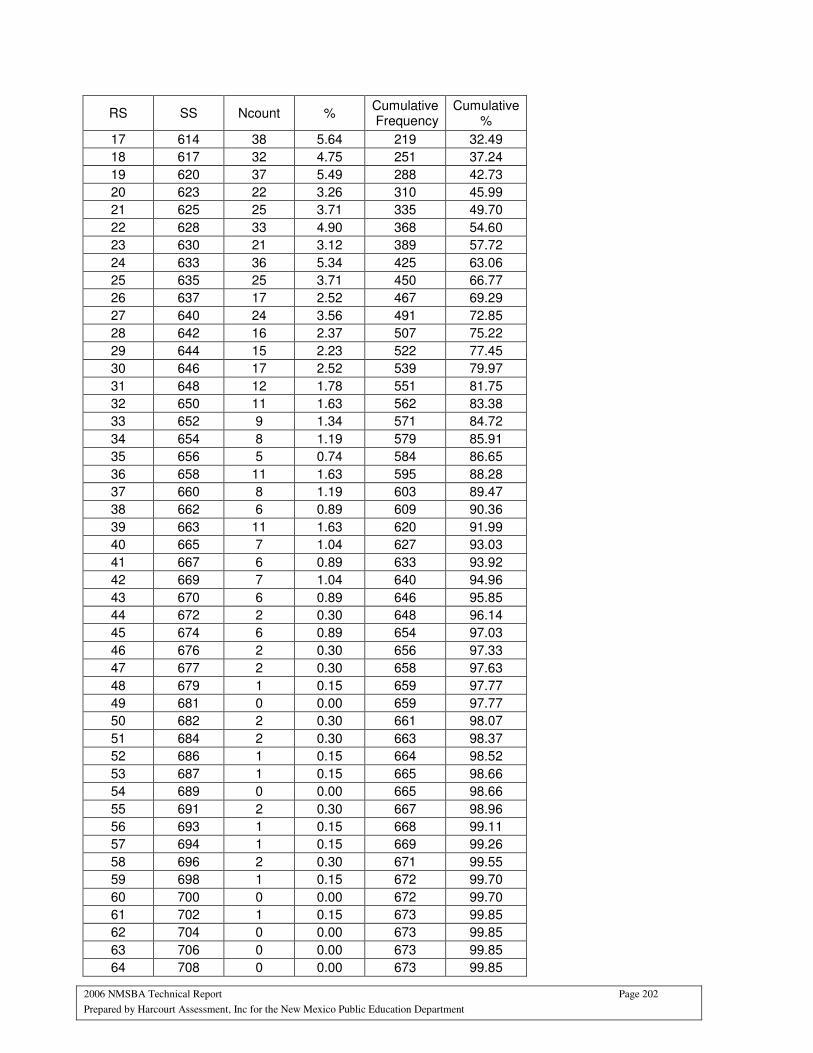
2006 NMSBA Technical Report Page 202
Prepared by Harcourt Assessment, Inc for the New Mexico Public Education Department
RS SS Ncount % Cumulative Frequency
Cumulative %
17 614 38 5.64 219 32.49
18 617 32 4.75 251 37.24
19 620 37 5.49 288 42.73
20 623 22 3.26 310 45.99
21 625 25 3.71 335 49.70
22 628 33 4.90 368 54.60
23 630 21 3.12 389 57.72
24 633 36 5.34 425 63.06
25 635 25 3.71 450 66.77
26 637 17 2.52 467 69.29
27 640 24 3.56 491 72.85
28 642 16 2.37 507 75.22
29 644 15 2.23 522 77.45
30 646 17 2.52 539 79.97
31 648 12 1.78 551 81.75
32 650 11 1.63 562 83.38
33 652 9 1.34 571 84.72
34 654 8 1.19 579 85.91
35 656 5 0.74 584 86.65
36 658 11 1.63 595 88.28
37 660 8 1.19 603 89.47
38 662 6 0.89 609 90.36
39 663 11 1.63 620 91.99
40 665 7 1.04 627 93.03
41 667 6 0.89 633 93.92
42 669 7 1.04 640 94.96
43 670 6 0.89 646 95.85
44 672 2 0.30 648 96.14
45 674 6 0.89 654 97.03
46 676 2 0.30 656 97.33
47 677 2 0.30 658 97.63
48 679 1 0.15 659 97.77
49 681 0 0.00 659 97.77
50 682 2 0.30 661 98.07
51 684 2 0.30 663 98.37
52 686 1 0.15 664 98.52
53 687 1 0.15 665 98.66
54 689 0 0.00 665 98.66
55 691 2 0.30 667 98.96
56 693 1 0.15 668 99.11
57 694 1 0.15 669 99.26
58 696 2 0.30 671 99.55
59 698 1 0.15 672 99.70
60 700 0 0.00 672 99.70
61 702 1 0.15 673 99.85
62 704 0 0.00 673 99.85
63 706 0 0.00 673 99.85
64 708 0 0.00 673 99.85
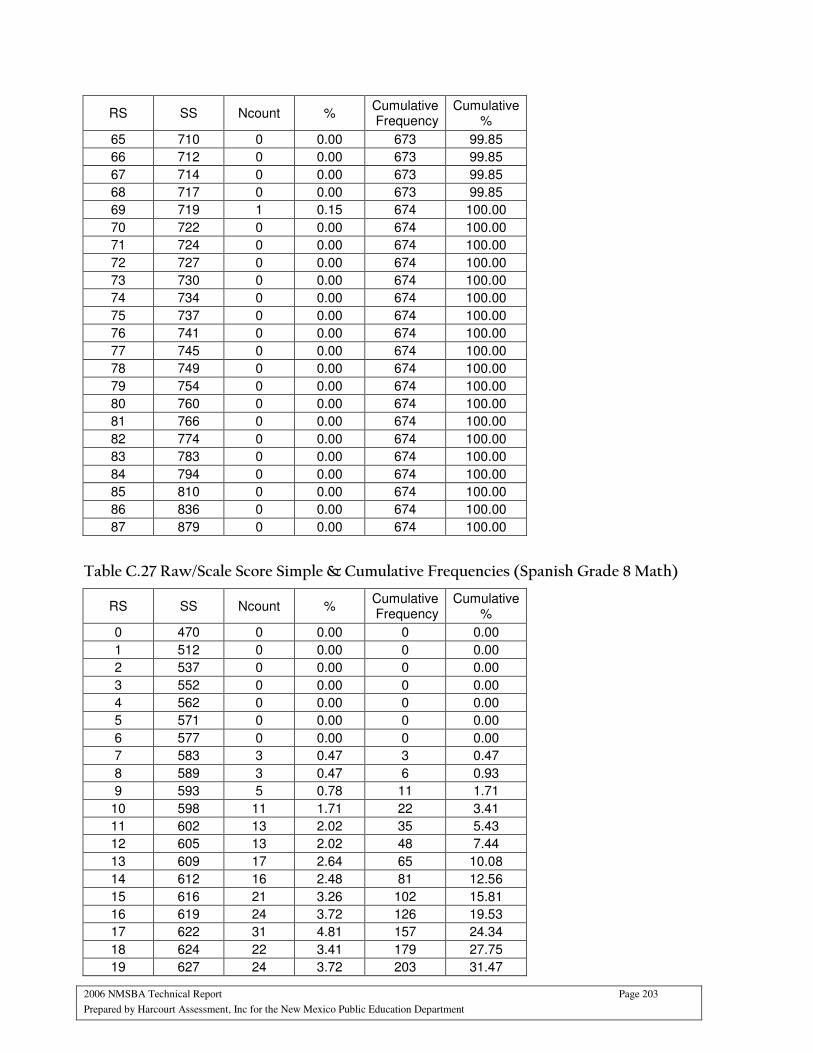
2006 NMSBA Technical Report Page 203
Prepared by Harcourt Assessment, Inc for the New Mexico Public Education Department
RS SS Ncount % Cumulative Frequency
Cumulative %
65 710 0 0.00 673 99.85
66 712 0 0.00 673 99.85
67 714 0 0.00 673 99.85
68 717 0 0.00 673 99.85
69 719 1 0.15 674 100.00
70 722 0 0.00 674 100.00
71 724 0 0.00 674 100.00
72 727 0 0.00 674 100.00
73 730 0 0.00 674 100.00
74 734 0 0.00 674 100.00
75 737 0 0.00 674 100.00
76 741 0 0.00 674 100.00
77 745 0 0.00 674 100.00
78 749 0 0.00 674 100.00
79 754 0 0.00 674 100.00
80 760 0 0.00 674 100.00
81 766 0 0.00 674 100.00
82 774 0 0.00 674 100.00
83 783 0 0.00 674 100.00
84 794 0 0.00 674 100.00
85 810 0 0.00 674 100.00
86 836 0 0.00 674 100.00
87 879 0 0.00 674 100.00
Table C.27 Raw/Scale Score Simple & Cumulative Frequencies (Spanish Grade 8 Math)
RS SS Ncount % Cumulative Frequency
Cumulative %
0 470 0 0.00 0 0.00
1 512 0 0.00 0 0.00
2 537 0 0.00 0 0.00
3 552 0 0.00 0 0.00
4 562 0 0.00 0 0.00
5 571 0 0.00 0 0.00
6 577 0 0.00 0 0.00
7 583 3 0.47 3 0.47
8 589 3 0.47 6 0.93
9 593 5 0.78 11 1.71
10 598 11 1.71 22 3.41
11 602 13 2.02 35 5.43
12 605 13 2.02 48 7.44
13 609 17 2.64 65 10.08
14 612 16 2.48 81 12.56
15 616 21 3.26 102 15.81
16 619 24 3.72 126 19.53
17 622 31 4.81 157 24.34
18 624 22 3.41 179 27.75
19 627 24 3.72 203 31.47
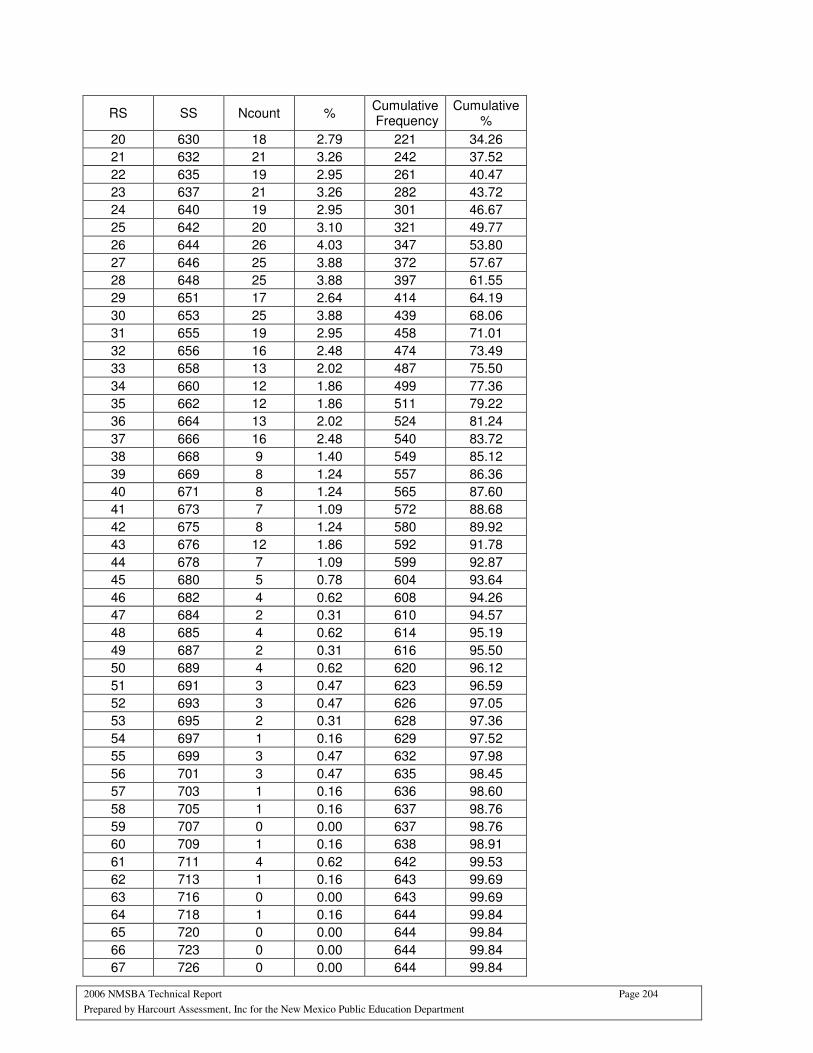
2006 NMSBA Technical Report Page 204
Prepared by Harcourt Assessment, Inc for the New Mexico Public Education Department
RS SS Ncount % Cumulative Frequency
Cumulative %
20 630 18 2.79 221 34.26
21 632 21 3.26 242 37.52
22 635 19 2.95 261 40.47
23 637 21 3.26 282 43.72
24 640 19 2.95 301 46.67
25 642 20 3.10 321 49.77
26 644 26 4.03 347 53.80
27 646 25 3.88 372 57.67
28 648 25 3.88 397 61.55
29 651 17 2.64 414 64.19
30 653 25 3.88 439 68.06
31 655 19 2.95 458 71.01
32 656 16 2.48 474 73.49
33 658 13 2.02 487 75.50
34 660 12 1.86 499 77.36
35 662 12 1.86 511 79.22
36 664 13 2.02 524 81.24
37 666 16 2.48 540 83.72
38 668 9 1.40 549 85.12
39 669 8 1.24 557 86.36
40 671 8 1.24 565 87.60
41 673 7 1.09 572 88.68
42 675 8 1.24 580 89.92
43 676 12 1.86 592 91.78
44 678 7 1.09 599 92.87
45 680 5 0.78 604 93.64
46 682 4 0.62 608 94.26
47 684 2 0.31 610 94.57
48 685 4 0.62 614 95.19
49 687 2 0.31 616 95.50
50 689 4 0.62 620 96.12
51 691 3 0.47 623 96.59
52 693 3 0.47 626 97.05
53 695 2 0.31 628 97.36
54 697 1 0.16 629 97.52
55 699 3 0.47 632 97.98
56 701 3 0.47 635 98.45
57 703 1 0.16 636 98.60
58 705 1 0.16 637 98.76
59 707 0 0.00 637 98.76
60 709 1 0.16 638 98.91
61 711 4 0.62 642 99.53
62 713 1 0.16 643 99.69
63 716 0 0.00 643 99.69
64 718 1 0.16 644 99.84
65 720 0 0.00 644 99.84
66 723 0 0.00 644 99.84
67 726 0 0.00 644 99.84
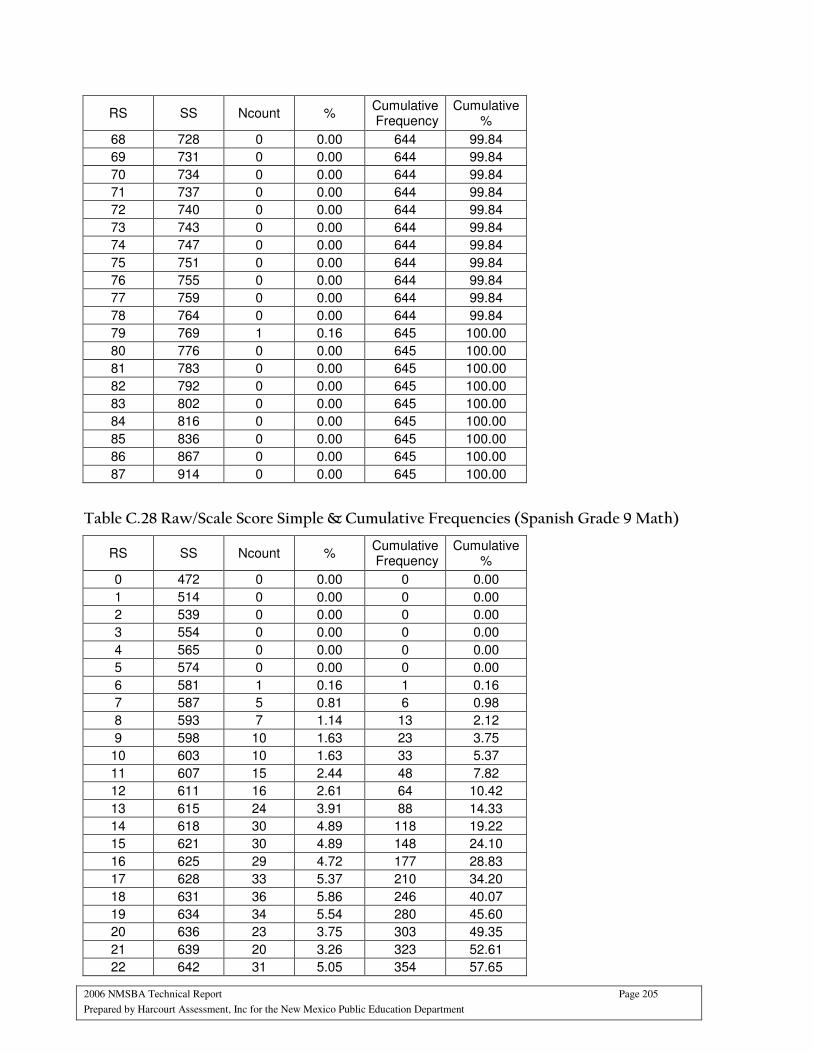
2006 NMSBA Technical Report Page 205
Prepared by Harcourt Assessment, Inc for the New Mexico Public Education Department
RS SS Ncount % Cumulative Frequency
Cumulative %
68 728 0 0.00 644 99.84
69 731 0 0.00 644 99.84
70 734 0 0.00 644 99.84
71 737 0 0.00 644 99.84
72 740 0 0.00 644 99.84
73 743 0 0.00 644 99.84
74 747 0 0.00 644 99.84
75 751 0 0.00 644 99.84
76 755 0 0.00 644 99.84
77 759 0 0.00 644 99.84
78 764 0 0.00 644 99.84
79 769 1 0.16 645 100.00
80 776 0 0.00 645 100.00
81 783 0 0.00 645 100.00
82 792 0 0.00 645 100.00
83 802 0 0.00 645 100.00
84 816 0 0.00 645 100.00
85 836 0 0.00 645 100.00
86 867 0 0.00 645 100.00
87 914 0 0.00 645 100.00
Table C.28 Raw/Scale Score Simple & Cumulative Frequencies (Spanish Grade 9 Math)
RS SS Ncount % Cumulative Frequency
Cumulative %
0 472 0 0.00 0 0.00
1 514 0 0.00 0 0.00
2 539 0 0.00 0 0.00
3 554 0 0.00 0 0.00
4 565 0 0.00 0 0.00
5 574 0 0.00 0 0.00
6 581 1 0.16 1 0.16
7 587 5 0.81 6 0.98
8 593 7 1.14 13 2.12
9 598 10 1.63 23 3.75
10 603 10 1.63 33 5.37
11 607 15 2.44 48 7.82
12 611 16 2.61 64 10.42
13 615 24 3.91 88 14.33
14 618 30 4.89 118 19.22
15 621 30 4.89 148 24.10
16 625 29 4.72 177 28.83
17 628 33 5.37 210 34.20
18 631 36 5.86 246 40.07
19 634 34 5.54 280 45.60
20 636 23 3.75 303 49.35
21 639 20 3.26 323 52.61
22 642 31 5.05 354 57.65

2006 NMSBA Technical Report Page 206
Prepared by Harcourt Assessment, Inc for the New Mexico Public Education Department
RS SS Ncount % Cumulative Frequency
Cumulative %
23 644 20 3.26 374 60.91
24 647 22 3.58 396 64.50
25 649 23 3.75 419 68.24
26 652 19 3.09 438 71.34
27 654 16 2.61 454 73.94
28 657 19 3.09 473 77.04
29 659 15 2.44 488 79.48
30 661 14 2.28 502 81.76
31 663 8 1.30 510 83.06
32 666 11 1.79 521 84.85
33 668 7 1.14 528 85.99
34 670 7 1.14 535 87.13
35 672 5 0.81 540 87.95
36 674 6 0.98 546 88.93
37 676 8 1.30 554 90.23
38 678 3 0.49 557 90.72
39 680 8 1.30 565 92.02
40 682 8 1.30 573 93.32
41 684 4 0.65 577 93.97
42 685 1 0.16 578 94.14
43 687 3 0.49 581 94.63
44 689 5 0.81 586 95.44
45 691 3 0.49 589 95.93
46 692 3 0.49 592 96.42
47 694 2 0.33 594 96.74
48 696 1 0.16 595 96.91
49 698 1 0.16 596 97.07
50 699 2 0.33 598 97.39
51 701 1 0.16 599 97.56
52 703 3 0.49 602 98.05
53 704 0 0.00 602 98.05
54 706 0 0.00 602 98.05
55 708 0 0.00 602 98.05
56 709 1 0.16 603 98.21
57 711 2 0.33 605 98.53
58 713 0 0.00 605 98.53
59 715 2 0.33 607 98.86
60 717 1 0.16 608 99.02
61 718 0 0.00 608 99.02
62 720 0 0.00 608 99.02
63 722 1 0.16 609 99.19
64 724 1 0.16 610 99.35
65 726 1 0.16 611 99.51
66 729 1 0.16 612 99.67
67 731 0 0.00 612 99.67
68 733 0 0.00 612 99.67
69 736 0 0.00 612 99.67
70 738 1 0.16 613 99.84
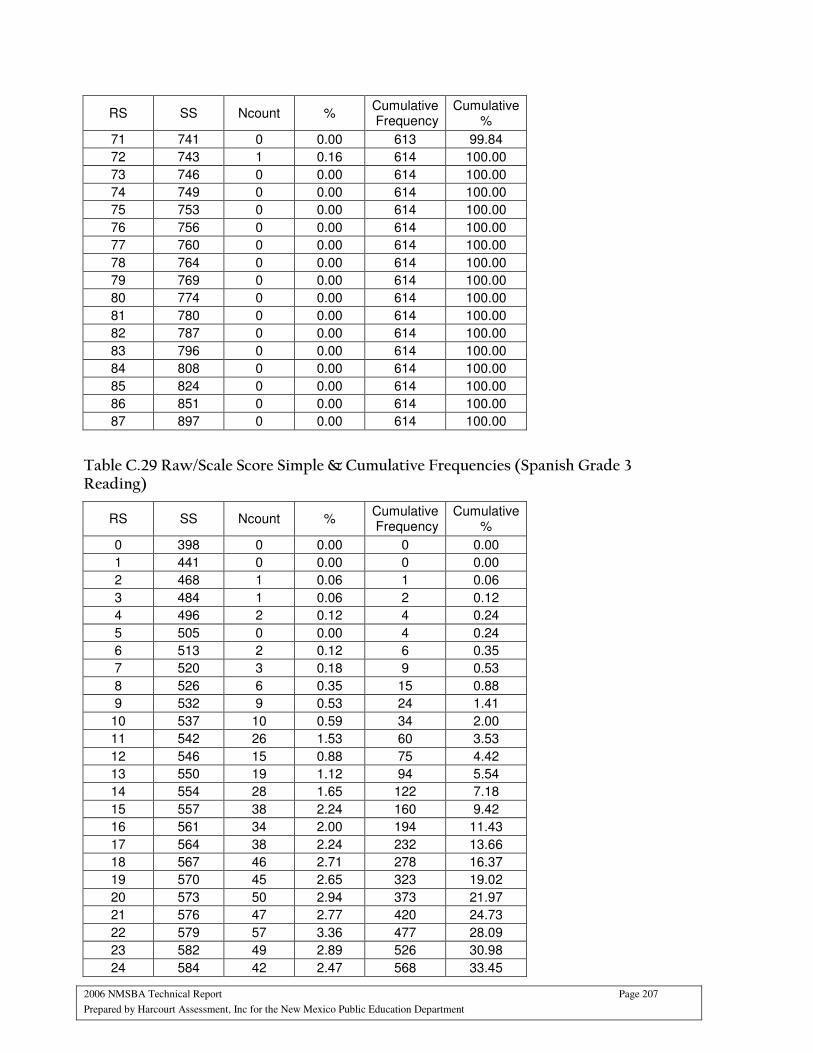
2006 NMSBA Technical Report Page 207
Prepared by Harcourt Assessment, Inc for the New Mexico Public Education Department
RS SS Ncount % Cumulative Frequency
Cumulative %
71 741 0 0.00 613 99.84
72 743 1 0.16 614 100.00
73 746 0 0.00 614 100.00
74 749 0 0.00 614 100.00
75 753 0 0.00 614 100.00
76 756 0 0.00 614 100.00
77 760 0 0.00 614 100.00
78 764 0 0.00 614 100.00
79 769 0 0.00 614 100.00
80 774 0 0.00 614 100.00
81 780 0 0.00 614 100.00
82 787 0 0.00 614 100.00
83 796 0 0.00 614 100.00
84 808 0 0.00 614 100.00
85 824 0 0.00 614 100.00
86 851 0 0.00 614 100.00
87 897 0 0.00 614 100.00
Table C.29 Raw/Scale Score Simple & Cumulative Frequencies (Spanish Grade 3 Reading)
RS SS Ncount % Cumulative Frequency
Cumulative %
0 398 0 0.00 0 0.00
1 441 0 0.00 0 0.00
2 468 1 0.06 1 0.06
3 484 1 0.06 2 0.12
4 496 2 0.12 4 0.24
5 505 0 0.00 4 0.24
6 513 2 0.12 6 0.35
7 520 3 0.18 9 0.53
8 526 6 0.35 15 0.88
9 532 9 0.53 24 1.41
10 537 10 0.59 34 2.00
11 542 26 1.53 60 3.53
12 546 15 0.88 75 4.42
13 550 19 1.12 94 5.54
14 554 28 1.65 122 7.18
15 557 38 2.24 160 9.42
16 561 34 2.00 194 11.43
17 564 38 2.24 232 13.66
18 567 46 2.71 278 16.37
19 570 45 2.65 323 19.02
20 573 50 2.94 373 21.97
21 576 47 2.77 420 24.73
22 579 57 3.36 477 28.09
23 582 49 2.89 526 30.98
24 584 42 2.47 568 33.45
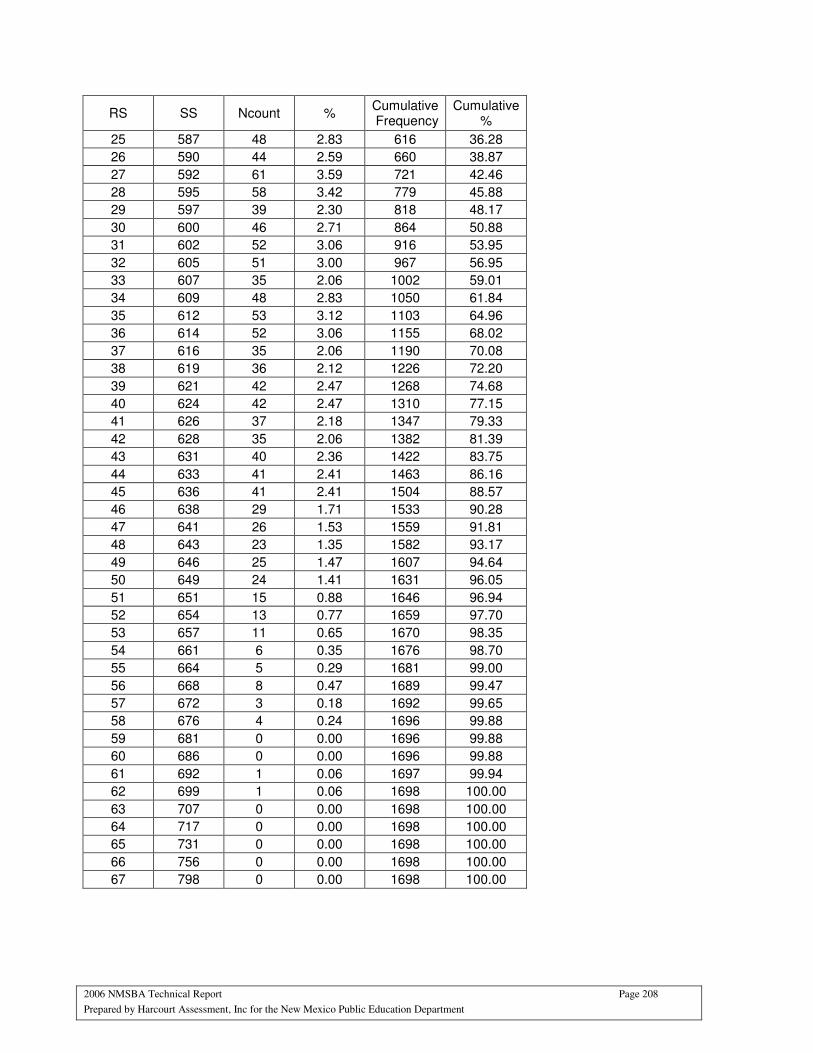
2006 NMSBA Technical Report Page 208
Prepared by Harcourt Assessment, Inc for the New Mexico Public Education Department
RS SS Ncount % Cumulative Frequency
Cumulative %
25 587 48 2.83 616 36.28
26 590 44 2.59 660 38.87
27 592 61 3.59 721 42.46
28 595 58 3.42 779 45.88
29 597 39 2.30 818 48.17
30 600 46 2.71 864 50.88
31 602 52 3.06 916 53.95
32 605 51 3.00 967 56.95
33 607 35 2.06 1002 59.01
34 609 48 2.83 1050 61.84
35 612 53 3.12 1103 64.96
36 614 52 3.06 1155 68.02
37 616 35 2.06 1190 70.08
38 619 36 2.12 1226 72.20
39 621 42 2.47 1268 74.68
40 624 42 2.47 1310 77.15
41 626 37 2.18 1347 79.33
42 628 35 2.06 1382 81.39
43 631 40 2.36 1422 83.75
44 633 41 2.41 1463 86.16
45 636 41 2.41 1504 88.57
46 638 29 1.71 1533 90.28
47 641 26 1.53 1559 91.81
48 643 23 1.35 1582 93.17
49 646 25 1.47 1607 94.64
50 649 24 1.41 1631 96.05
51 651 15 0.88 1646 96.94
52 654 13 0.77 1659 97.70
53 657 11 0.65 1670 98.35
54 661 6 0.35 1676 98.70
55 664 5 0.29 1681 99.00
56 668 8 0.47 1689 99.47
57 672 3 0.18 1692 99.65
58 676 4 0.24 1696 99.88
59 681 0 0.00 1696 99.88
60 686 0 0.00 1696 99.88
61 692 1 0.06 1697 99.94
62 699 1 0.06 1698 100.00
63 707 0 0.00 1698 100.00
64 717 0 0.00 1698 100.00
65 731 0 0.00 1698 100.00
66 756 0 0.00 1698 100.00
67 798 0 0.00 1698 100.00
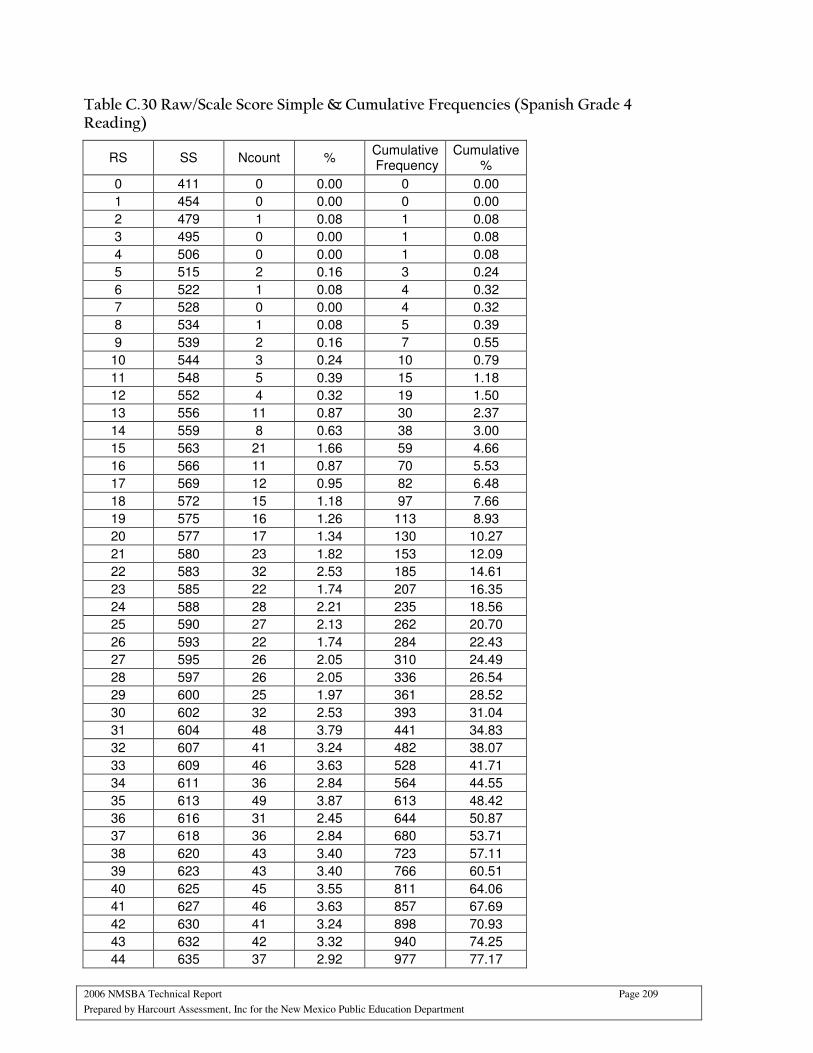
2006 NMSBA Technical Report Page 209
Prepared by Harcourt Assessment, Inc for the New Mexico Public Education Department
Table C.30 Raw/Scale Score Simple & Cumulative Frequencies (Spanish Grade 4 Reading)
RS SS Ncount % Cumulative Frequency
Cumulative %
0 411 0 0.00 0 0.00
1 454 0 0.00 0 0.00
2 479 1 0.08 1 0.08
3 495 0 0.00 1 0.08
4 506 0 0.00 1 0.08
5 515 2 0.16 3 0.24
6 522 1 0.08 4 0.32
7 528 0 0.00 4 0.32
8 534 1 0.08 5 0.39
9 539 2 0.16 7 0.55
10 544 3 0.24 10 0.79
11 548 5 0.39 15 1.18
12 552 4 0.32 19 1.50
13 556 11 0.87 30 2.37
14 559 8 0.63 38 3.00
15 563 21 1.66 59 4.66
16 566 11 0.87 70 5.53
17 569 12 0.95 82 6.48
18 572 15 1.18 97 7.66
19 575 16 1.26 113 8.93
20 577 17 1.34 130 10.27
21 580 23 1.82 153 12.09
22 583 32 2.53 185 14.61
23 585 22 1.74 207 16.35
24 588 28 2.21 235 18.56
25 590 27 2.13 262 20.70
26 593 22 1.74 284 22.43
27 595 26 2.05 310 24.49
28 597 26 2.05 336 26.54
29 600 25 1.97 361 28.52
30 602 32 2.53 393 31.04
31 604 48 3.79 441 34.83
32 607 41 3.24 482 38.07
33 609 46 3.63 528 41.71
34 611 36 2.84 564 44.55
35 613 49 3.87 613 48.42
36 616 31 2.45 644 50.87
37 618 36 2.84 680 53.71
38 620 43 3.40 723 57.11
39 623 43 3.40 766 60.51
40 625 45 3.55 811 64.06
41 627 46 3.63 857 67.69
42 630 41 3.24 898 70.93
43 632 42 3.32 940 74.25
44 635 37 2.92 977 77.17
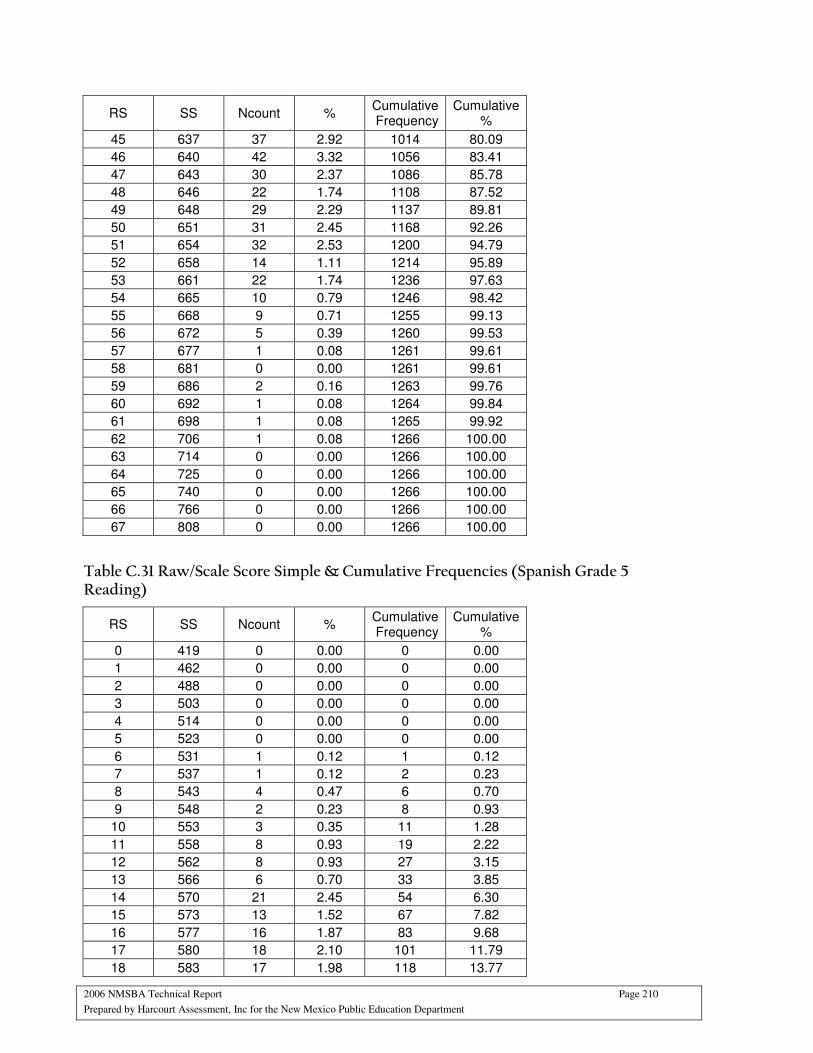
2006 NMSBA Technical Report Page 210
Prepared by Harcourt Assessment, Inc for the New Mexico Public Education Department
RS SS Ncount % Cumulative Frequency
Cumulative %
45 637 37 2.92 1014 80.09
46 640 42 3.32 1056 83.41
47 643 30 2.37 1086 85.78
48 646 22 1.74 1108 87.52
49 648 29 2.29 1137 89.81
50 651 31 2.45 1168 92.26
51 654 32 2.53 1200 94.79
52 658 14 1.11 1214 95.89
53 661 22 1.74 1236 97.63
54 665 10 0.79 1246 98.42
55 668 9 0.71 1255 99.13
56 672 5 0.39 1260 99.53
57 677 1 0.08 1261 99.61
58 681 0 0.00 1261 99.61
59 686 2 0.16 1263 99.76
60 692 1 0.08 1264 99.84
61 698 1 0.08 1265 99.92
62 706 1 0.08 1266 100.00
63 714 0 0.00 1266 100.00
64 725 0 0.00 1266 100.00
65 740 0 0.00 1266 100.00
66 766 0 0.00 1266 100.00
67 808 0 0.00 1266 100.00
Table C.31 Raw/Scale Score Simple & Cumulative Frequencies (Spanish Grade 5 Reading)
RS SS Ncount % Cumulative Frequency
Cumulative %
0 419 0 0.00 0 0.00
1 462 0 0.00 0 0.00
2 488 0 0.00 0 0.00
3 503 0 0.00 0 0.00
4 514 0 0.00 0 0.00
5 523 0 0.00 0 0.00
6 531 1 0.12 1 0.12
7 537 1 0.12 2 0.23
8 543 4 0.47 6 0.70
9 548 2 0.23 8 0.93
10 553 3 0.35 11 1.28
11 558 8 0.93 19 2.22
12 562 8 0.93 27 3.15
13 566 6 0.70 33 3.85
14 570 21 2.45 54 6.30
15 573 13 1.52 67 7.82
16 577 16 1.87 83 9.68
17 580 18 2.10 101 11.79
18 583 17 1.98 118 13.77
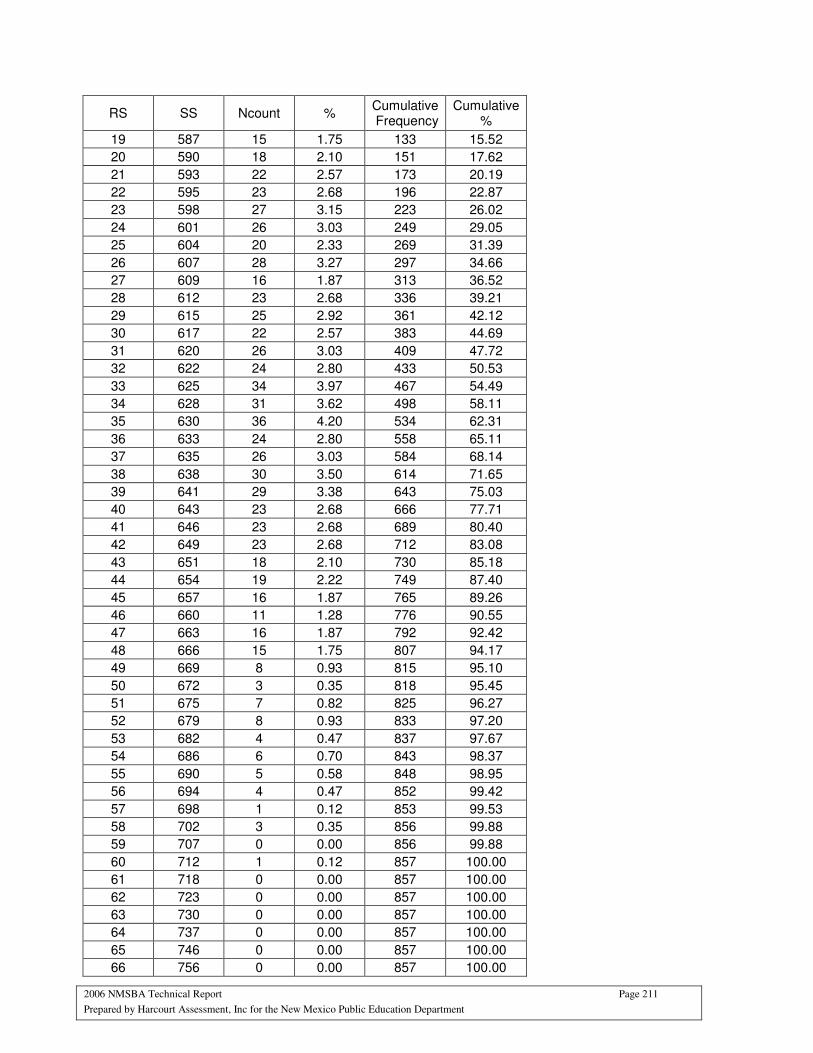
2006 NMSBA Technical Report Page 211
Prepared by Harcourt Assessment, Inc for the New Mexico Public Education Department
RS SS Ncount % Cumulative Frequency
Cumulative %
19 587 15 1.75 133 15.52
20 590 18 2.10 151 17.62
21 593 22 2.57 173 20.19
22 595 23 2.68 196 22.87
23 598 27 3.15 223 26.02
24 601 26 3.03 249 29.05
25 604 20 2.33 269 31.39
26 607 28 3.27 297 34.66
27 609 16 1.87 313 36.52
28 612 23 2.68 336 39.21
29 615 25 2.92 361 42.12
30 617 22 2.57 383 44.69
31 620 26 3.03 409 47.72
32 622 24 2.80 433 50.53
33 625 34 3.97 467 54.49
34 628 31 3.62 498 58.11
35 630 36 4.20 534 62.31
36 633 24 2.80 558 65.11
37 635 26 3.03 584 68.14
38 638 30 3.50 614 71.65
39 641 29 3.38 643 75.03
40 643 23 2.68 666 77.71
41 646 23 2.68 689 80.40
42 649 23 2.68 712 83.08
43 651 18 2.10 730 85.18
44 654 19 2.22 749 87.40
45 657 16 1.87 765 89.26
46 660 11 1.28 776 90.55
47 663 16 1.87 792 92.42
48 666 15 1.75 807 94.17
49 669 8 0.93 815 95.10
50 672 3 0.35 818 95.45
51 675 7 0.82 825 96.27
52 679 8 0.93 833 97.20
53 682 4 0.47 837 97.67
54 686 6 0.70 843 98.37
55 690 5 0.58 848 98.95
56 694 4 0.47 852 99.42
57 698 1 0.12 853 99.53
58 702 3 0.35 856 99.88
59 707 0 0.00 856 99.88
60 712 1 0.12 857 100.00
61 718 0 0.00 857 100.00
62 723 0 0.00 857 100.00
63 730 0 0.00 857 100.00
64 737 0 0.00 857 100.00
65 746 0 0.00 857 100.00
66 756 0 0.00 857 100.00
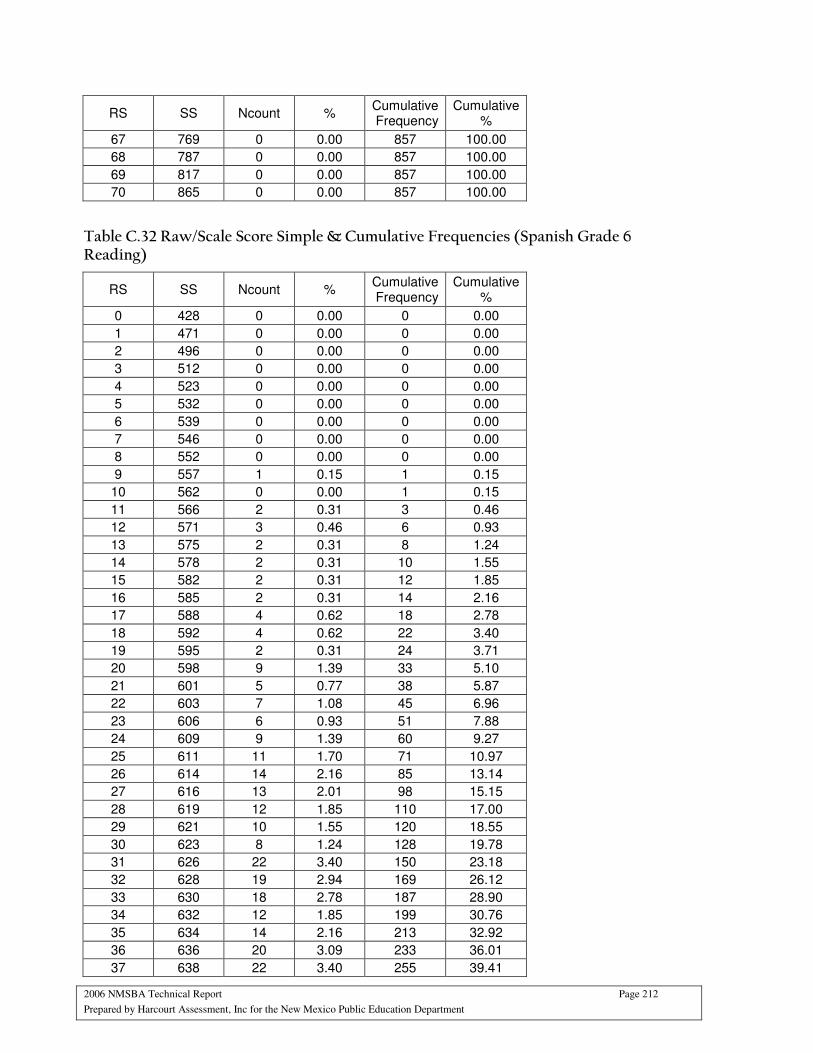
2006 NMSBA Technical Report Page 212
Prepared by Harcourt Assessment, Inc for the New Mexico Public Education Department
RS SS Ncount % Cumulative Frequency
Cumulative %
67 769 0 0.00 857 100.00
68 787 0 0.00 857 100.00
69 817 0 0.00 857 100.00
70 865 0 0.00 857 100.00
Table C.32 Raw/Scale Score Simple & Cumulative Frequencies (Spanish Grade 6 Reading)
RS SS Ncount % Cumulative Frequency
Cumulative %
0 428 0 0.00 0 0.00
1 471 0 0.00 0 0.00
2 496 0 0.00 0 0.00
3 512 0 0.00 0 0.00
4 523 0 0.00 0 0.00
5 532 0 0.00 0 0.00
6 539 0 0.00 0 0.00
7 546 0 0.00 0 0.00
8 552 0 0.00 0 0.00
9 557 1 0.15 1 0.15
10 562 0 0.00 1 0.15
11 566 2 0.31 3 0.46
12 571 3 0.46 6 0.93
13 575 2 0.31 8 1.24
14 578 2 0.31 10 1.55
15 582 2 0.31 12 1.85
16 585 2 0.31 14 2.16
17 588 4 0.62 18 2.78
18 592 4 0.62 22 3.40
19 595 2 0.31 24 3.71
20 598 9 1.39 33 5.10
21 601 5 0.77 38 5.87
22 603 7 1.08 45 6.96
23 606 6 0.93 51 7.88
24 609 9 1.39 60 9.27
25 611 11 1.70 71 10.97
26 614 14 2.16 85 13.14
27 616 13 2.01 98 15.15
28 619 12 1.85 110 17.00
29 621 10 1.55 120 18.55
30 623 8 1.24 128 19.78
31 626 22 3.40 150 23.18
32 628 19 2.94 169 26.12
33 630 18 2.78 187 28.90
34 632 12 1.85 199 30.76
35 634 14 2.16 213 32.92
36 636 20 3.09 233 36.01
37 638 22 3.40 255 39.41
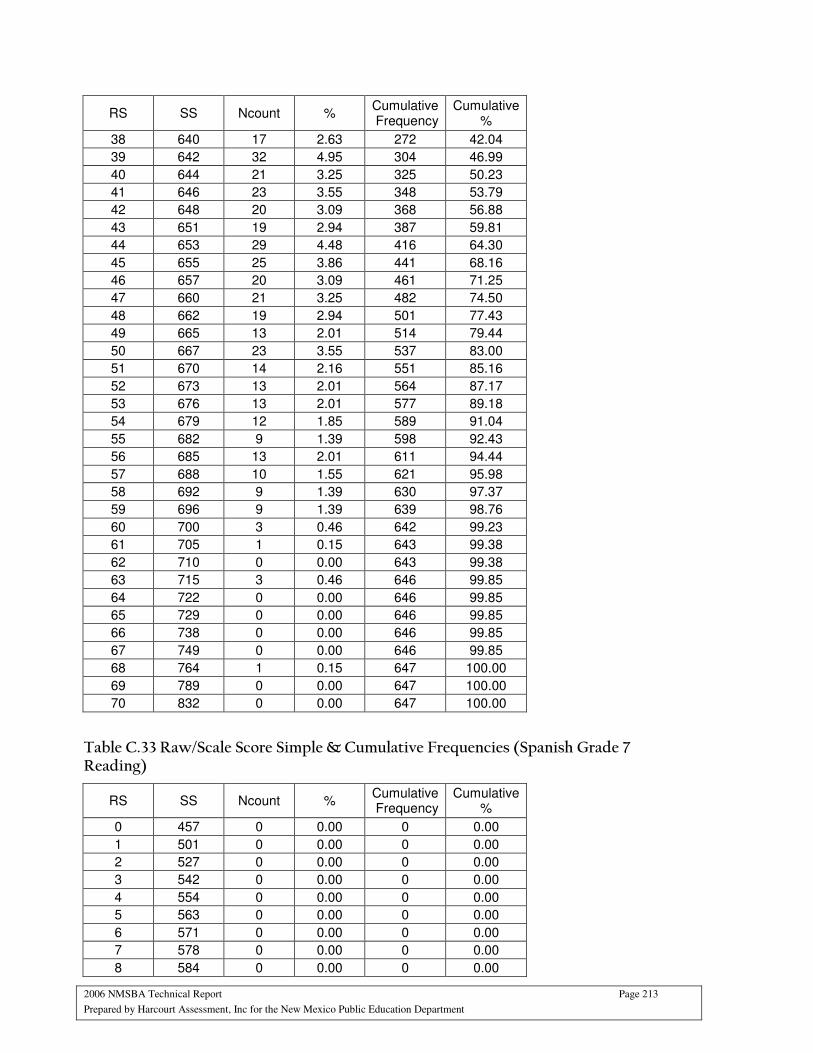
2006 NMSBA Technical Report Page 213
Prepared by Harcourt Assessment, Inc for the New Mexico Public Education Department
RS SS Ncount % Cumulative Frequency
Cumulative %
38 640 17 2.63 272 42.04
39 642 32 4.95 304 46.99
40 644 21 3.25 325 50.23
41 646 23 3.55 348 53.79
42 648 20 3.09 368 56.88
43 651 19 2.94 387 59.81
44 653 29 4.48 416 64.30
45 655 25 3.86 441 68.16
46 657 20 3.09 461 71.25
47 660 21 3.25 482 74.50
48 662 19 2.94 501 77.43
49 665 13 2.01 514 79.44
50 667 23 3.55 537 83.00
51 670 14 2.16 551 85.16
52 673 13 2.01 564 87.17
53 676 13 2.01 577 89.18
54 679 12 1.85 589 91.04
55 682 9 1.39 598 92.43
56 685 13 2.01 611 94.44
57 688 10 1.55 621 95.98
58 692 9 1.39 630 97.37
59 696 9 1.39 639 98.76
60 700 3 0.46 642 99.23
61 705 1 0.15 643 99.38
62 710 0 0.00 643 99.38
63 715 3 0.46 646 99.85
64 722 0 0.00 646 99.85
65 729 0 0.00 646 99.85
66 738 0 0.00 646 99.85
67 749 0 0.00 646 99.85
68 764 1 0.15 647 100.00
69 789 0 0.00 647 100.00
70 832 0 0.00 647 100.00
Table C.33 Raw/Scale Score Simple & Cumulative Frequencies (Spanish Grade 7 Reading)
RS SS Ncount % Cumulative Frequency
Cumulative %
0 457 0 0.00 0 0.00
1 501 0 0.00 0 0.00
2 527 0 0.00 0 0.00
3 542 0 0.00 0 0.00
4 554 0 0.00 0 0.00
5 563 0 0.00 0 0.00
6 571 0 0.00 0 0.00
7 578 0 0.00 0 0.00
8 584 0 0.00 0 0.00
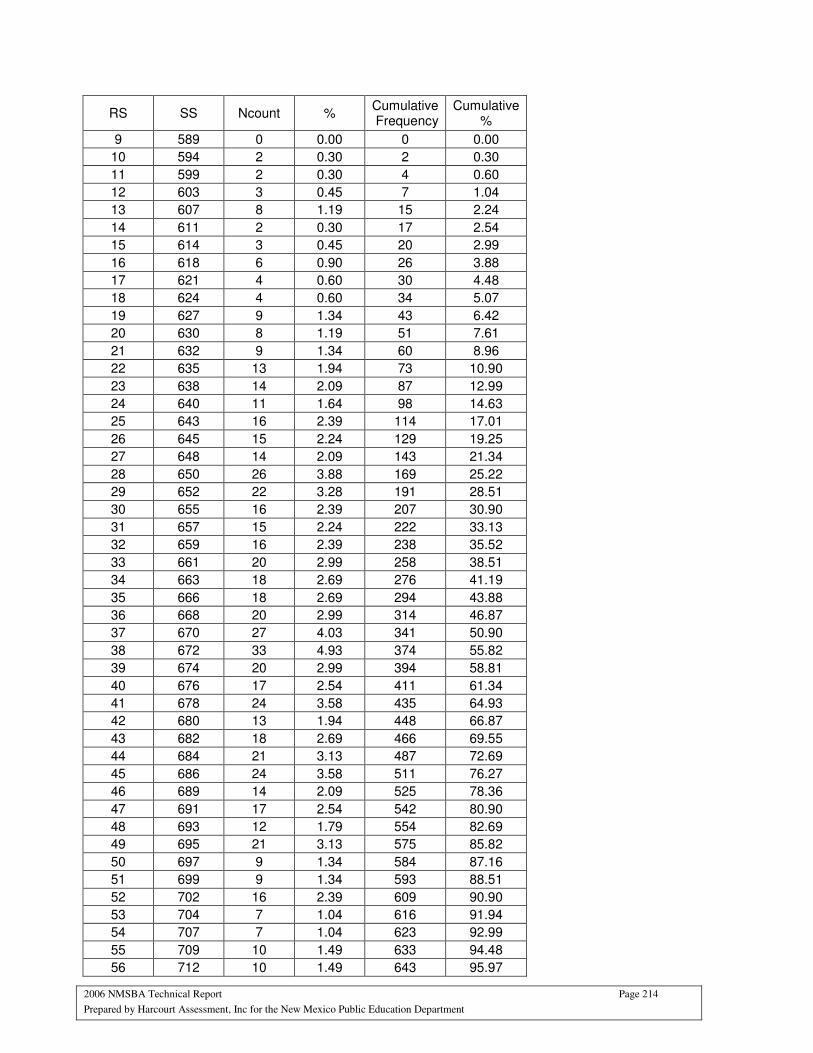
2006 NMSBA Technical Report Page 214
Prepared by Harcourt Assessment, Inc for the New Mexico Public Education Department
RS SS Ncount % Cumulative Frequency
Cumulative %
9 589 0 0.00 0 0.00
10 594 2 0.30 2 0.30
11 599 2 0.30 4 0.60
12 603 3 0.45 7 1.04
13 607 8 1.19 15 2.24
14 611 2 0.30 17 2.54
15 614 3 0.45 20 2.99
16 618 6 0.90 26 3.88
17 621 4 0.60 30 4.48
18 624 4 0.60 34 5.07
19 627 9 1.34 43 6.42
20 630 8 1.19 51 7.61
21 632 9 1.34 60 8.96
22 635 13 1.94 73 10.90
23 638 14 2.09 87 12.99
24 640 11 1.64 98 14.63
25 643 16 2.39 114 17.01
26 645 15 2.24 129 19.25
27 648 14 2.09 143 21.34
28 650 26 3.88 169 25.22
29 652 22 3.28 191 28.51
30 655 16 2.39 207 30.90
31 657 15 2.24 222 33.13
32 659 16 2.39 238 35.52
33 661 20 2.99 258 38.51
34 663 18 2.69 276 41.19
35 666 18 2.69 294 43.88
36 668 20 2.99 314 46.87
37 670 27 4.03 341 50.90
38 672 33 4.93 374 55.82
39 674 20 2.99 394 58.81
40 676 17 2.54 411 61.34
41 678 24 3.58 435 64.93
42 680 13 1.94 448 66.87
43 682 18 2.69 466 69.55
44 684 21 3.13 487 72.69
45 686 24 3.58 511 76.27
46 689 14 2.09 525 78.36
47 691 17 2.54 542 80.90
48 693 12 1.79 554 82.69
49 695 21 3.13 575 85.82
50 697 9 1.34 584 87.16
51 699 9 1.34 593 88.51
52 702 16 2.39 609 90.90
53 704 7 1.04 616 91.94
54 707 7 1.04 623 92.99
55 709 10 1.49 633 94.48
56 712 10 1.49 643 95.97
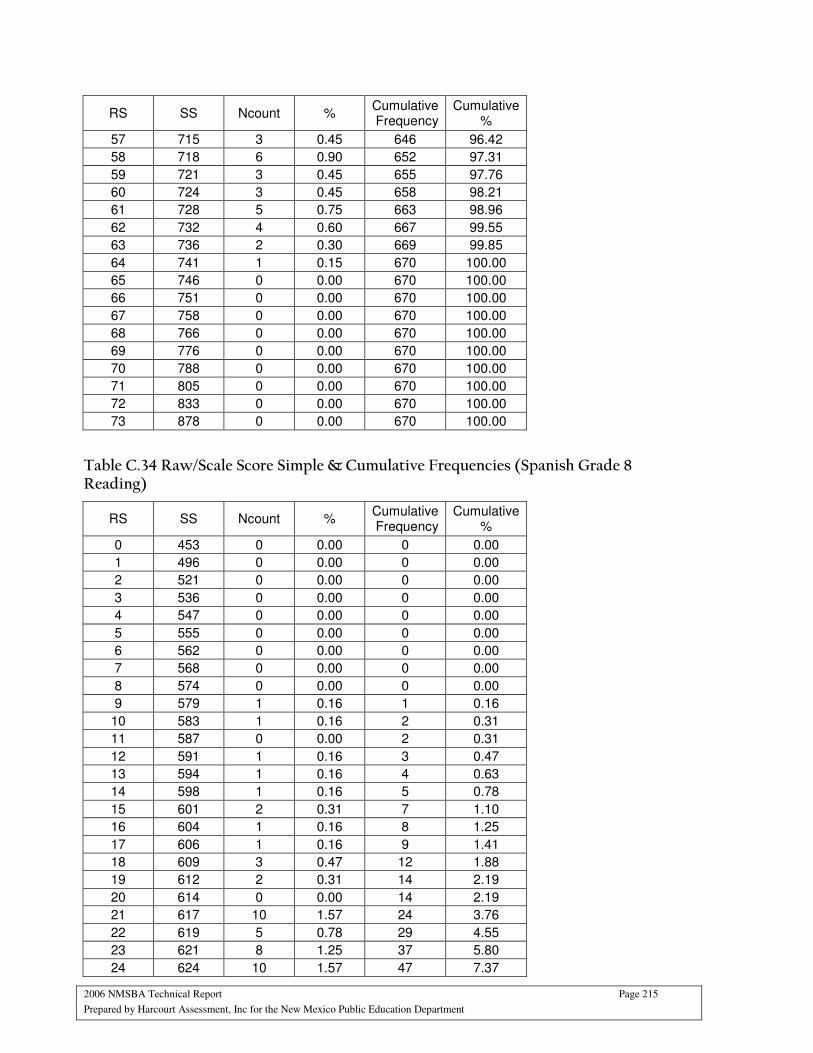
2006 NMSBA Technical Report Page 215
Prepared by Harcourt Assessment, Inc for the New Mexico Public Education Department
RS SS Ncount % Cumulative Frequency
Cumulative %
57 715 3 0.45 646 96.42
58 718 6 0.90 652 97.31
59 721 3 0.45 655 97.76
60 724 3 0.45 658 98.21
61 728 5 0.75 663 98.96
62 732 4 0.60 667 99.55
63 736 2 0.30 669 99.85
64 741 1 0.15 670 100.00
65 746 0 0.00 670 100.00
66 751 0 0.00 670 100.00
67 758 0 0.00 670 100.00
68 766 0 0.00 670 100.00
69 776 0 0.00 670 100.00
70 788 0 0.00 670 100.00
71 805 0 0.00 670 100.00
72 833 0 0.00 670 100.00
73 878 0 0.00 670 100.00
Table C.34 Raw/Scale Score Simple & Cumulative Frequencies (Spanish Grade 8 Reading)
RS SS Ncount % Cumulative Frequency
Cumulative %
0 453 0 0.00 0 0.00
1 496 0 0.00 0 0.00
2 521 0 0.00 0 0.00
3 536 0 0.00 0 0.00
4 547 0 0.00 0 0.00
5 555 0 0.00 0 0.00
6 562 0 0.00 0 0.00
7 568 0 0.00 0 0.00
8 574 0 0.00 0 0.00
9 579 1 0.16 1 0.16
10 583 1 0.16 2 0.31
11 587 0 0.00 2 0.31
12 591 1 0.16 3 0.47
13 594 1 0.16 4 0.63
14 598 1 0.16 5 0.78
15 601 2 0.31 7 1.10
16 604 1 0.16 8 1.25
17 606 1 0.16 9 1.41
18 609 3 0.47 12 1.88
19 612 2 0.31 14 2.19
20 614 0 0.00 14 2.19
21 617 10 1.57 24 3.76
22 619 5 0.78 29 4.55
23 621 8 1.25 37 5.80
24 624 10 1.57 47 7.37
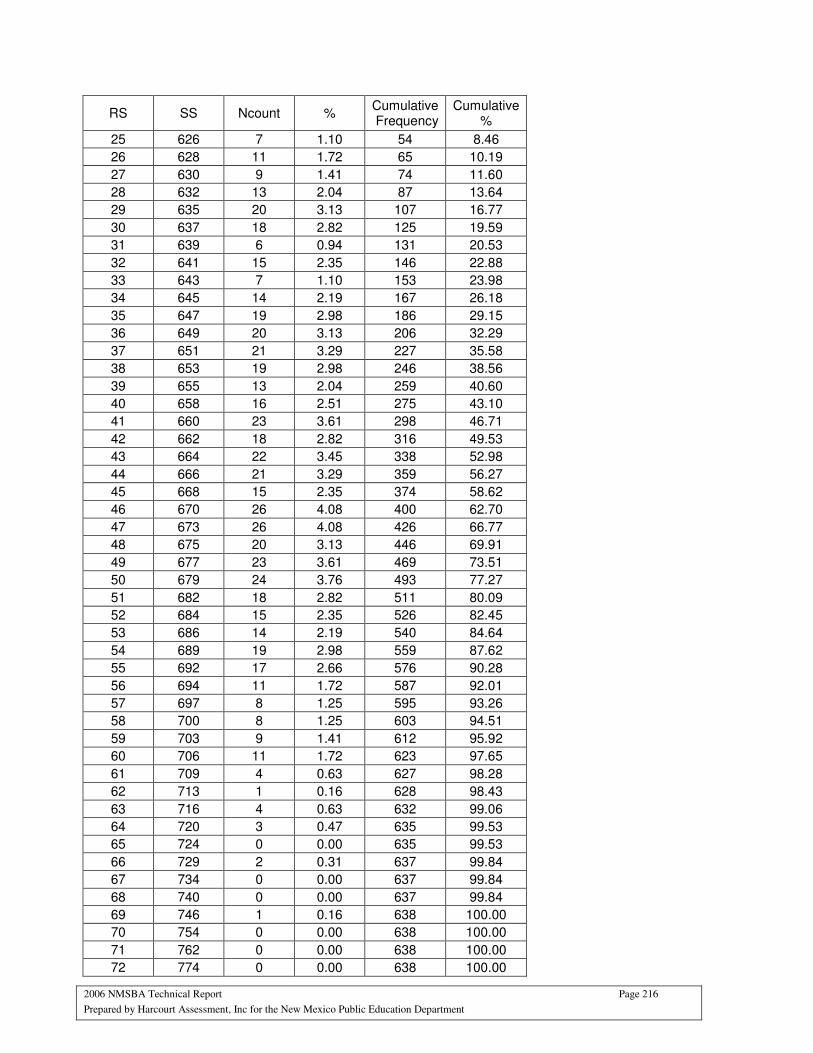
2006 NMSBA Technical Report Page 216
Prepared by Harcourt Assessment, Inc for the New Mexico Public Education Department
RS SS Ncount % Cumulative Frequency
Cumulative %
25 626 7 1.10 54 8.46
26 628 11 1.72 65 10.19
27 630 9 1.41 74 11.60
28 632 13 2.04 87 13.64
29 635 20 3.13 107 16.77
30 637 18 2.82 125 19.59
31 639 6 0.94 131 20.53
32 641 15 2.35 146 22.88
33 643 7 1.10 153 23.98
34 645 14 2.19 167 26.18
35 647 19 2.98 186 29.15
36 649 20 3.13 206 32.29
37 651 21 3.29 227 35.58
38 653 19 2.98 246 38.56
39 655 13 2.04 259 40.60
40 658 16 2.51 275 43.10
41 660 23 3.61 298 46.71
42 662 18 2.82 316 49.53
43 664 22 3.45 338 52.98
44 666 21 3.29 359 56.27
45 668 15 2.35 374 58.62
46 670 26 4.08 400 62.70
47 673 26 4.08 426 66.77
48 675 20 3.13 446 69.91
49 677 23 3.61 469 73.51
50 679 24 3.76 493 77.27
51 682 18 2.82 511 80.09
52 684 15 2.35 526 82.45
53 686 14 2.19 540 84.64
54 689 19 2.98 559 87.62
55 692 17 2.66 576 90.28
56 694 11 1.72 587 92.01
57 697 8 1.25 595 93.26
58 700 8 1.25 603 94.51
59 703 9 1.41 612 95.92
60 706 11 1.72 623 97.65
61 709 4 0.63 627 98.28
62 713 1 0.16 628 98.43
63 716 4 0.63 632 99.06
64 720 3 0.47 635 99.53
65 724 0 0.00 635 99.53
66 729 2 0.31 637 99.84
67 734 0 0.00 637 99.84
68 740 0 0.00 637 99.84
69 746 1 0.16 638 100.00
70 754 0 0.00 638 100.00
71 762 0 0.00 638 100.00
72 774 0 0.00 638 100.00
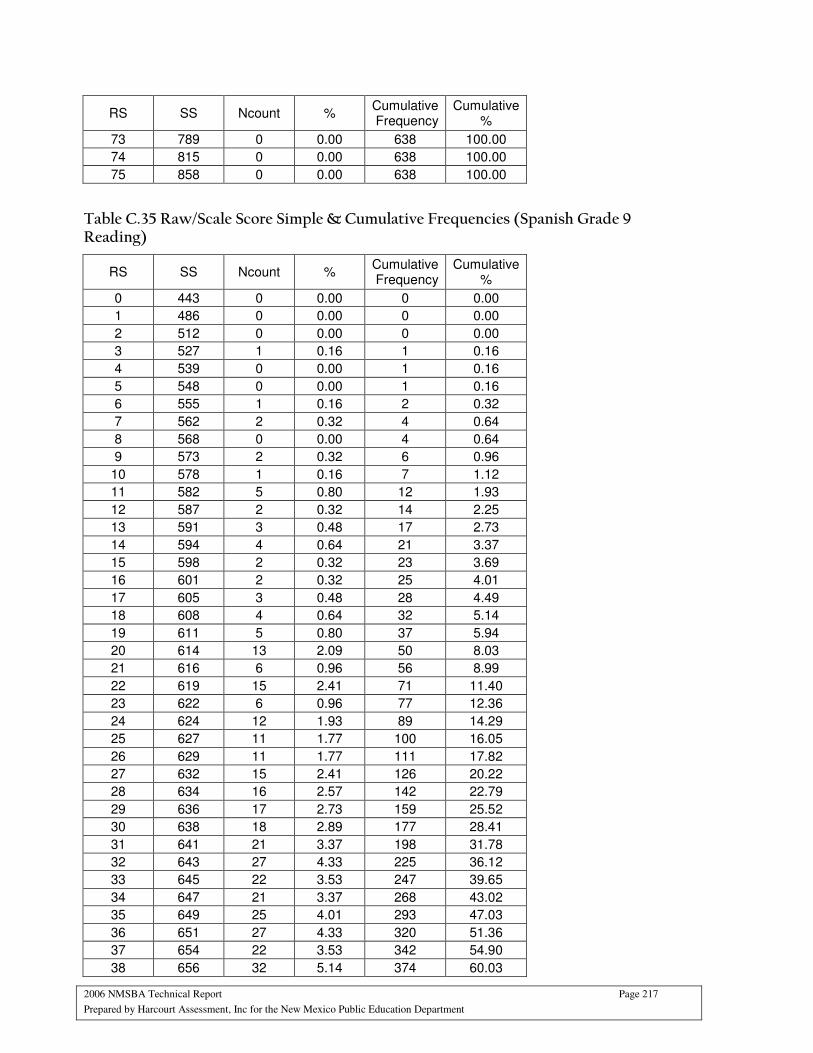
2006 NMSBA Technical Report Page 217
Prepared by Harcourt Assessment, Inc for the New Mexico Public Education Department
RS SS Ncount % Cumulative Frequency
Cumulative %
73 789 0 0.00 638 100.00
74 815 0 0.00 638 100.00
75 858 0 0.00 638 100.00
Table C.35 Raw/Scale Score Simple & Cumulative Frequencies (Spanish Grade 9 Reading)
RS SS Ncount % Cumulative Frequency
Cumulative %
0 443 0 0.00 0 0.00
1 486 0 0.00 0 0.00
2 512 0 0.00 0 0.00
3 527 1 0.16 1 0.16
4 539 0 0.00 1 0.16
5 548 0 0.00 1 0.16
6 555 1 0.16 2 0.32
7 562 2 0.32 4 0.64
8 568 0 0.00 4 0.64
9 573 2 0.32 6 0.96
10 578 1 0.16 7 1.12
11 582 5 0.80 12 1.93
12 587 2 0.32 14 2.25
13 591 3 0.48 17 2.73
14 594 4 0.64 21 3.37
15 598 2 0.32 23 3.69
16 601 2 0.32 25 4.01
17 605 3 0.48 28 4.49
18 608 4 0.64 32 5.14
19 611 5 0.80 37 5.94
20 614 13 2.09 50 8.03
21 616 6 0.96 56 8.99
22 619 15 2.41 71 11.40
23 622 6 0.96 77 12.36
24 624 12 1.93 89 14.29
25 627 11 1.77 100 16.05
26 629 11 1.77 111 17.82
27 632 15 2.41 126 20.22
28 634 16 2.57 142 22.79
29 636 17 2.73 159 25.52
30 638 18 2.89 177 28.41
31 641 21 3.37 198 31.78
32 643 27 4.33 225 36.12
33 645 22 3.53 247 39.65
34 647 21 3.37 268 43.02
35 649 25 4.01 293 47.03
36 651 27 4.33 320 51.36
37 654 22 3.53 342 54.90
38 656 32 5.14 374 60.03
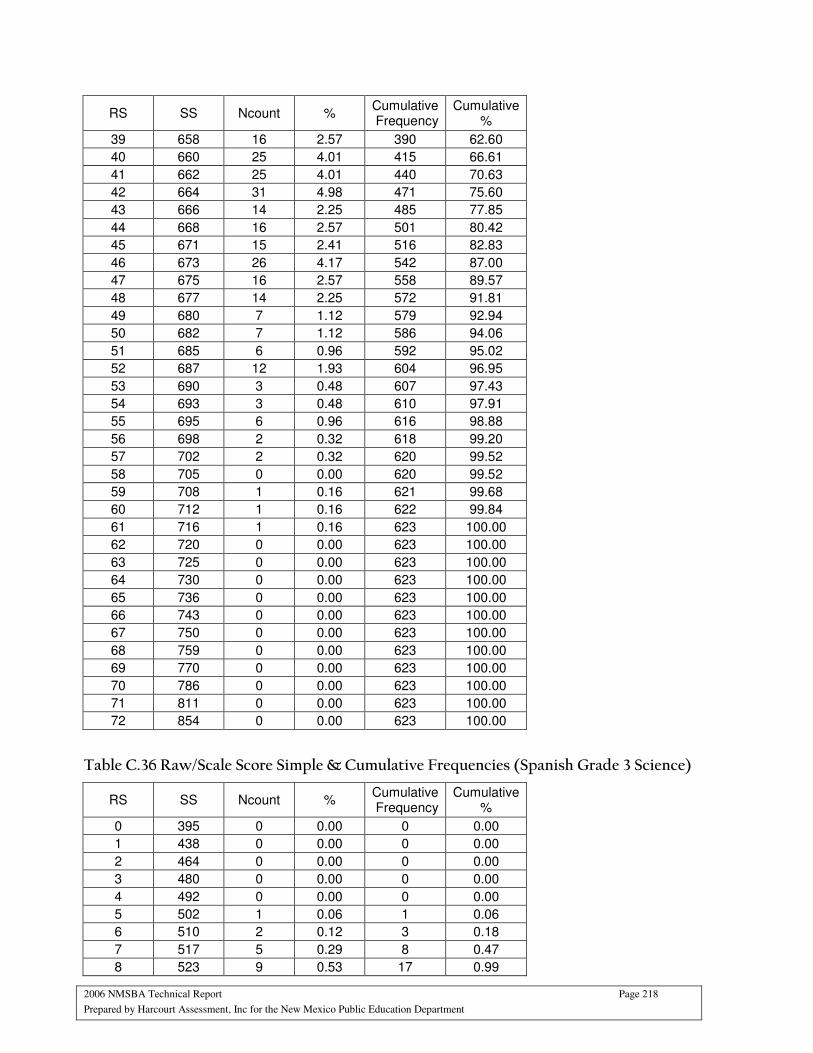
2006 NMSBA Technical Report Page 218
Prepared by Harcourt Assessment, Inc for the New Mexico Public Education Department
RS SS Ncount % Cumulative Frequency
Cumulative %
39 658 16 2.57 390 62.60
40 660 25 4.01 415 66.61
41 662 25 4.01 440 70.63
42 664 31 4.98 471 75.60
43 666 14 2.25 485 77.85
44 668 16 2.57 501 80.42
45 671 15 2.41 516 82.83
46 673 26 4.17 542 87.00
47 675 16 2.57 558 89.57
48 677 14 2.25 572 91.81
49 680 7 1.12 579 92.94
50 682 7 1.12 586 94.06
51 685 6 0.96 592 95.02
52 687 12 1.93 604 96.95
53 690 3 0.48 607 97.43
54 693 3 0.48 610 97.91
55 695 6 0.96 616 98.88
56 698 2 0.32 618 99.20
57 702 2 0.32 620 99.52
58 705 0 0.00 620 99.52
59 708 1 0.16 621 99.68
60 712 1 0.16 622 99.84
61 716 1 0.16 623 100.00
62 720 0 0.00 623 100.00
63 725 0 0.00 623 100.00
64 730 0 0.00 623 100.00
65 736 0 0.00 623 100.00
66 743 0 0.00 623 100.00
67 750 0 0.00 623 100.00
68 759 0 0.00 623 100.00
69 770 0 0.00 623 100.00
70 786 0 0.00 623 100.00
71 811 0 0.00 623 100.00
72 854 0 0.00 623 100.00
Table C.36 Raw/Scale Score Simple & Cumulative Frequencies (Spanish Grade 3 Science)
RS SS Ncount % Cumulative Frequency
Cumulative %
0 395 0 0.00 0 0.00
1 438 0 0.00 0 0.00
2 464 0 0.00 0 0.00
3 480 0 0.00 0 0.00
4 492 0 0.00 0 0.00
5 502 1 0.06 1 0.06
6 510 2 0.12 3 0.18
7 517 5 0.29 8 0.47
8 523 9 0.53 17 0.99

2006 NMSBA Technical Report Page 219
Prepared by Harcourt Assessment, Inc for the New Mexico Public Education Department
RS SS Ncount % Cumulative Frequency
Cumulative %
9 529 5 0.29 22 1.29
10 534 16 0.94 38 2.22
11 539 18 1.05 56 3.27
12 544 27 1.58 83 4.85
13 549 34 1.99 117 6.84
14 553 34 1.99 151 8.83
15 557 44 2.57 195 11.40
16 561 50 2.92 245 14.33
17 565 53 3.10 298 17.43
18 568 61 3.57 359 20.99
19 572 72 4.21 431 25.20
20 576 60 3.51 491 28.71
21 579 55 3.22 546 31.93
22 582 55 3.22 601 35.15
23 586 80 4.68 681 39.82
24 589 85 4.97 766 44.80
25 592 56 3.27 822 48.07
26 596 74 4.33 896 52.40
27 599 68 3.98 964 56.37
28 602 76 4.44 1040 60.82
29 605 91 5.32 1131 66.14
30 609 67 3.92 1198 70.06
31 612 70 4.09 1268 74.15
32 615 60 3.51 1328 77.66
33 618 62 3.63 1390 81.29
34 622 38 2.22 1428 83.51
35 625 55 3.22 1483 86.73
36 628 38 2.22 1521 88.95
37 631 43 2.51 1564 91.46
38 635 20 1.17 1584 92.63
39 638 23 1.35 1607 93.98
40 641 18 1.05 1625 95.03
41 645 27 1.58 1652 96.61
42 648 10 0.58 1662 97.19
43 652 13 0.76 1675 97.95
44 655 15 0.88 1690 98.83
45 659 5 0.29 1695 99.12
46 663 8 0.47 1703 99.59
47 667 4 0.23 1707 99.82
48 671 0 0.00 1707 99.82
49 675 1 0.06 1708 99.88
50 679 0 0.00 1708 99.88
51 684 1 0.06 1709 99.94
52 688 1 0.06 1710 100.00
53 693 0 0.00 1710 100.00
54 699 0 0.00 1710 100.00
55 705 0 0.00 1710 100.00
56 712 0 0.00 1710 100.00
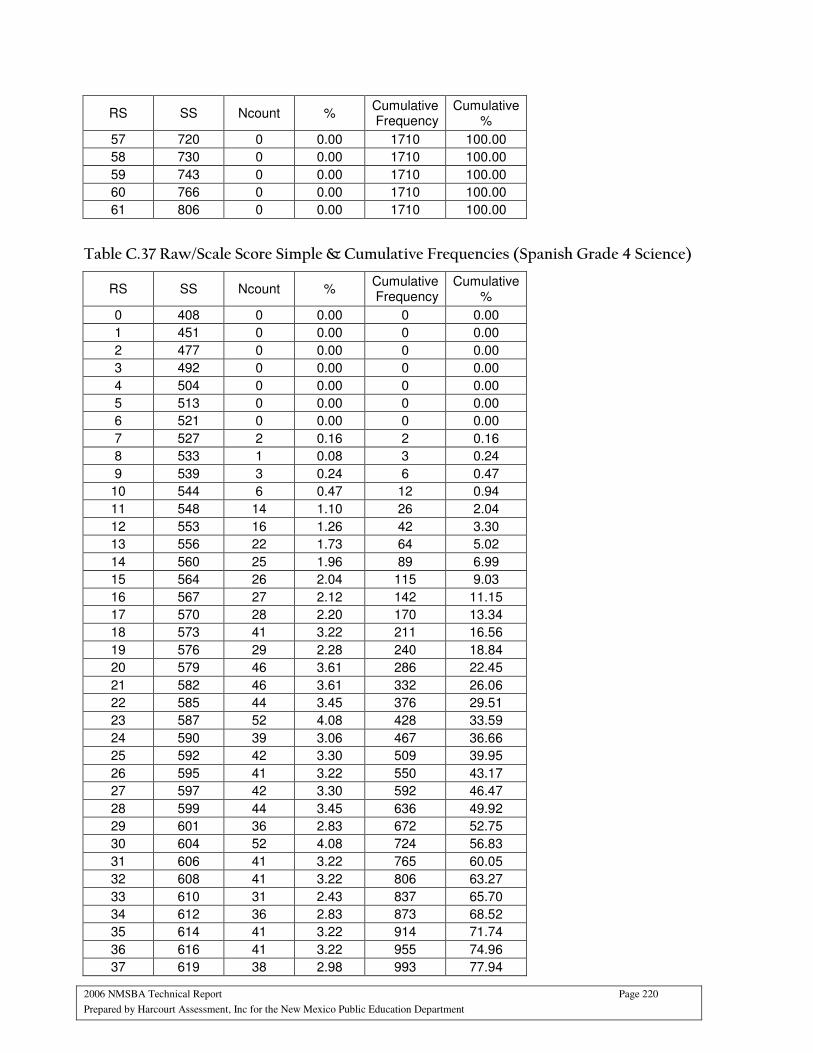
2006 NMSBA Technical Report Page 220
Prepared by Harcourt Assessment, Inc for the New Mexico Public Education Department
RS SS Ncount % Cumulative Frequency
Cumulative %
57 720 0 0.00 1710 100.00
58 730 0 0.00 1710 100.00
59 743 0 0.00 1710 100.00
60 766 0 0.00 1710 100.00
61 806 0 0.00 1710 100.00
Table C.37 Raw/Scale Score Simple & Cumulative Frequencies (Spanish Grade 4 Science)
RS SS Ncount % Cumulative Frequency
Cumulative %
0 408 0 0.00 0 0.00
1 451 0 0.00 0 0.00
2 477 0 0.00 0 0.00
3 492 0 0.00 0 0.00
4 504 0 0.00 0 0.00
5 513 0 0.00 0 0.00
6 521 0 0.00 0 0.00
7 527 2 0.16 2 0.16
8 533 1 0.08 3 0.24
9 539 3 0.24 6 0.47
10 544 6 0.47 12 0.94
11 548 14 1.10 26 2.04
12 553 16 1.26 42 3.30
13 556 22 1.73 64 5.02
14 560 25 1.96 89 6.99
15 564 26 2.04 115 9.03
16 567 27 2.12 142 11.15
17 570 28 2.20 170 13.34
18 573 41 3.22 211 16.56
19 576 29 2.28 240 18.84
20 579 46 3.61 286 22.45
21 582 46 3.61 332 26.06
22 585 44 3.45 376 29.51
23 587 52 4.08 428 33.59
24 590 39 3.06 467 36.66
25 592 42 3.30 509 39.95
26 595 41 3.22 550 43.17
27 597 42 3.30 592 46.47
28 599 44 3.45 636 49.92
29 601 36 2.83 672 52.75
30 604 52 4.08 724 56.83
31 606 41 3.22 765 60.05
32 608 41 3.22 806 63.27
33 610 31 2.43 837 65.70
34 612 36 2.83 873 68.52
35 614 41 3.22 914 71.74
36 616 41 3.22 955 74.96
37 619 38 2.98 993 77.94
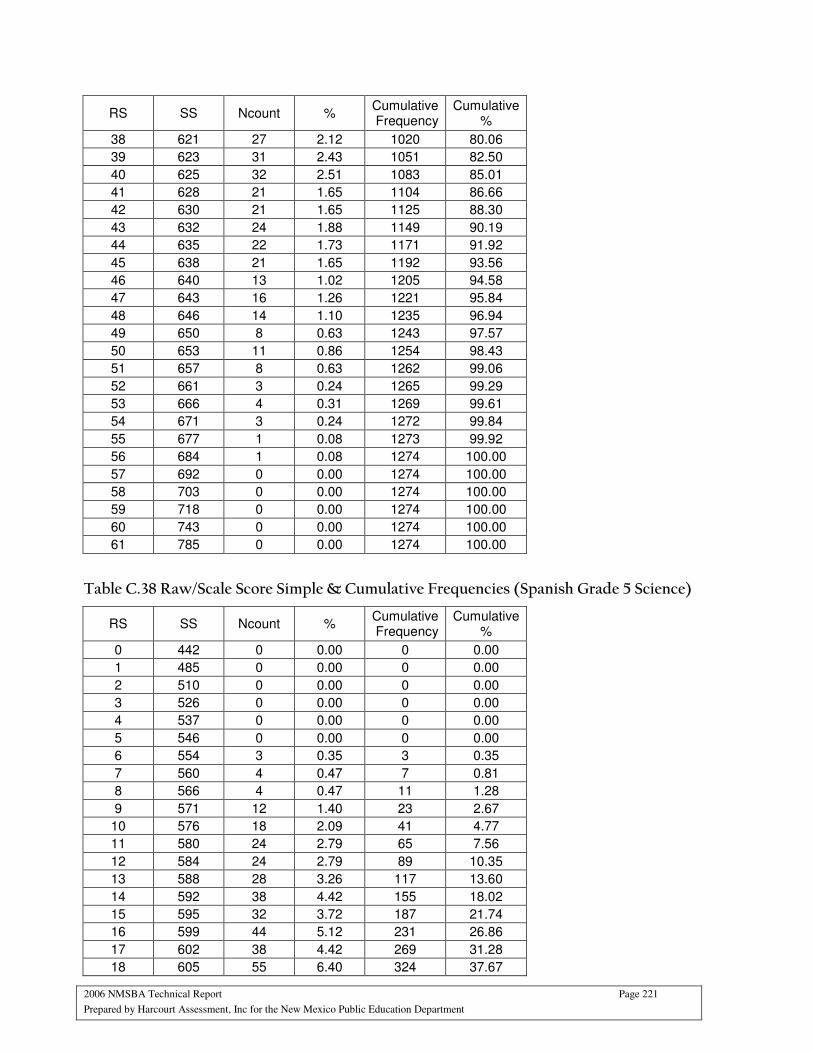
2006 NMSBA Technical Report Page 221
Prepared by Harcourt Assessment, Inc for the New Mexico Public Education Department
RS SS Ncount % Cumulative Frequency
Cumulative %
38 621 27 2.12 1020 80.06
39 623 31 2.43 1051 82.50
40 625 32 2.51 1083 85.01
41 628 21 1.65 1104 86.66
42 630 21 1.65 1125 88.30
43 632 24 1.88 1149 90.19
44 635 22 1.73 1171 91.92
45 638 21 1.65 1192 93.56
46 640 13 1.02 1205 94.58
47 643 16 1.26 1221 95.84
48 646 14 1.10 1235 96.94
49 650 8 0.63 1243 97.57
50 653 11 0.86 1254 98.43
51 657 8 0.63 1262 99.06
52 661 3 0.24 1265 99.29
53 666 4 0.31 1269 99.61
54 671 3 0.24 1272 99.84
55 677 1 0.08 1273 99.92
56 684 1 0.08 1274 100.00
57 692 0 0.00 1274 100.00
58 703 0 0.00 1274 100.00
59 718 0 0.00 1274 100.00
60 743 0 0.00 1274 100.00
61 785 0 0.00 1274 100.00
Table C.38 Raw/Scale Score Simple & Cumulative Frequencies (Spanish Grade 5 Science)
RS SS Ncount % Cumulative Frequency
Cumulative %
0 442 0 0.00 0 0.00
1 485 0 0.00 0 0.00
2 510 0 0.00 0 0.00
3 526 0 0.00 0 0.00
4 537 0 0.00 0 0.00
5 546 0 0.00 0 0.00
6 554 3 0.35 3 0.35
7 560 4 0.47 7 0.81
8 566 4 0.47 11 1.28
9 571 12 1.40 23 2.67
10 576 18 2.09 41 4.77
11 580 24 2.79 65 7.56
12 584 24 2.79 89 10.35
13 588 28 3.26 117 13.60
14 592 38 4.42 155 18.02
15 595 32 3.72 187 21.74
16 599 44 5.12 231 26.86
17 602 38 4.42 269 31.28
18 605 55 6.40 324 37.67
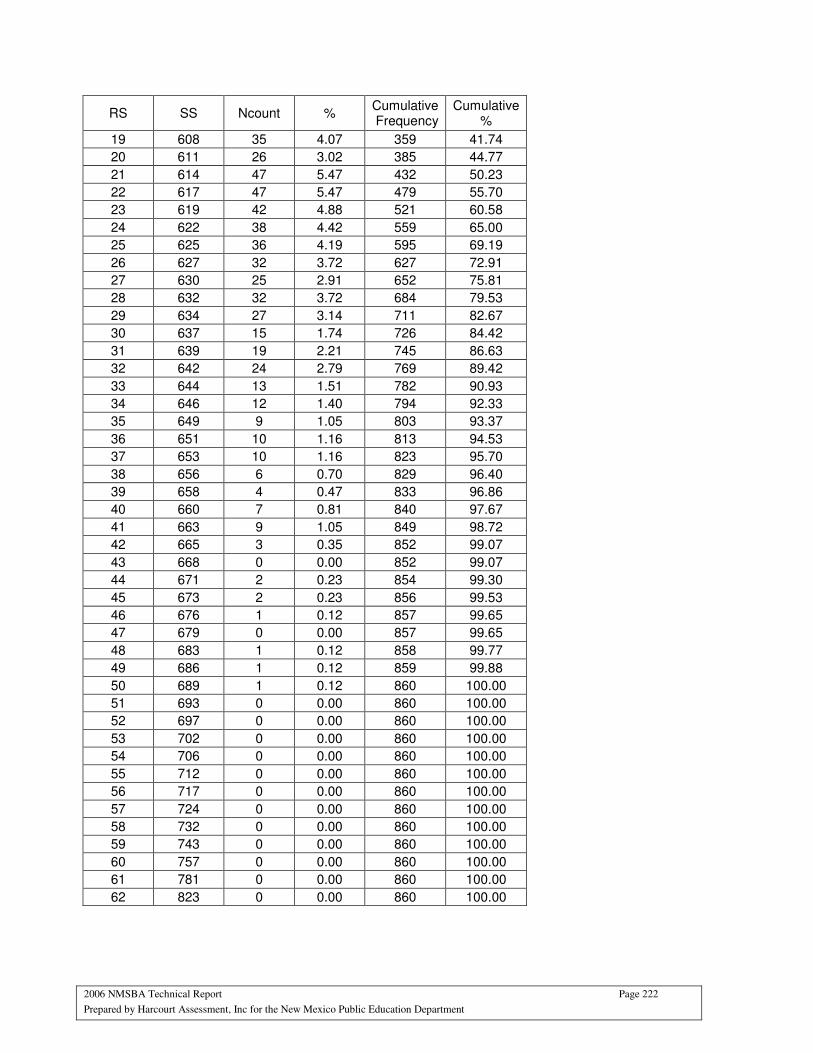
2006 NMSBA Technical Report Page 222
Prepared by Harcourt Assessment, Inc for the New Mexico Public Education Department
RS SS Ncount % Cumulative Frequency
Cumulative %
19 608 35 4.07 359 41.74
20 611 26 3.02 385 44.77
21 614 47 5.47 432 50.23
22 617 47 5.47 479 55.70
23 619 42 4.88 521 60.58
24 622 38 4.42 559 65.00
25 625 36 4.19 595 69.19
26 627 32 3.72 627 72.91
27 630 25 2.91 652 75.81
28 632 32 3.72 684 79.53
29 634 27 3.14 711 82.67
30 637 15 1.74 726 84.42
31 639 19 2.21 745 86.63
32 642 24 2.79 769 89.42
33 644 13 1.51 782 90.93
34 646 12 1.40 794 92.33
35 649 9 1.05 803 93.37
36 651 10 1.16 813 94.53
37 653 10 1.16 823 95.70
38 656 6 0.70 829 96.40
39 658 4 0.47 833 96.86
40 660 7 0.81 840 97.67
41 663 9 1.05 849 98.72
42 665 3 0.35 852 99.07
43 668 0 0.00 852 99.07
44 671 2 0.23 854 99.30
45 673 2 0.23 856 99.53
46 676 1 0.12 857 99.65
47 679 0 0.00 857 99.65
48 683 1 0.12 858 99.77
49 686 1 0.12 859 99.88
50 689 1 0.12 860 100.00
51 693 0 0.00 860 100.00
52 697 0 0.00 860 100.00
53 702 0 0.00 860 100.00
54 706 0 0.00 860 100.00
55 712 0 0.00 860 100.00
56 717 0 0.00 860 100.00
57 724 0 0.00 860 100.00
58 732 0 0.00 860 100.00
59 743 0 0.00 860 100.00
60 757 0 0.00 860 100.00
61 781 0 0.00 860 100.00
62 823 0 0.00 860 100.00
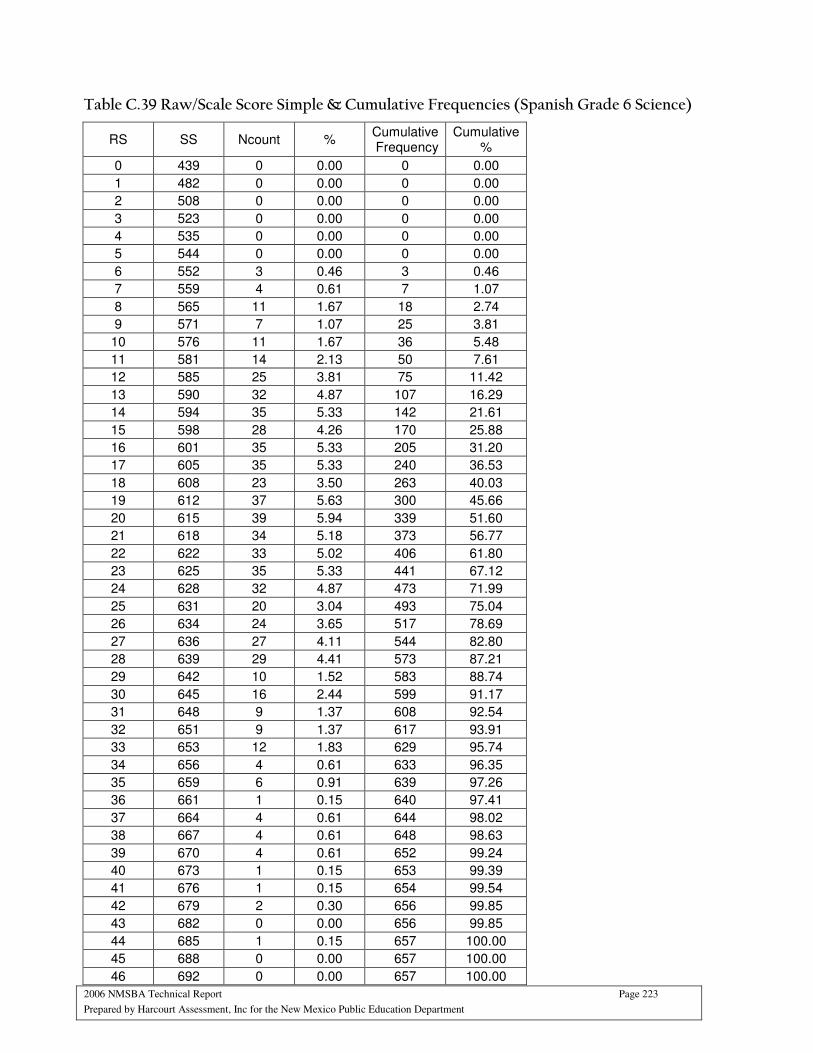
2006 NMSBA Technical Report Page 223
Prepared by Harcourt Assessment, Inc for the New Mexico Public Education Department
Table C.39 Raw/Scale Score Simple & Cumulative Frequencies (Spanish Grade 6 Science)
RS SS Ncount % Cumulative Frequency
Cumulative %
0 439 0 0.00 0 0.00
1 482 0 0.00 0 0.00
2 508 0 0.00 0 0.00
3 523 0 0.00 0 0.00
4 535 0 0.00 0 0.00
5 544 0 0.00 0 0.00
6 552 3 0.46 3 0.46
7 559 4 0.61 7 1.07
8 565 11 1.67 18 2.74
9 571 7 1.07 25 3.81
10 576 11 1.67 36 5.48
11 581 14 2.13 50 7.61
12 585 25 3.81 75 11.42
13 590 32 4.87 107 16.29
14 594 35 5.33 142 21.61
15 598 28 4.26 170 25.88
16 601 35 5.33 205 31.20
17 605 35 5.33 240 36.53
18 608 23 3.50 263 40.03
19 612 37 5.63 300 45.66
20 615 39 5.94 339 51.60
21 618 34 5.18 373 56.77
22 622 33 5.02 406 61.80
23 625 35 5.33 441 67.12
24 628 32 4.87 473 71.99
25 631 20 3.04 493 75.04
26 634 24 3.65 517 78.69
27 636 27 4.11 544 82.80
28 639 29 4.41 573 87.21
29 642 10 1.52 583 88.74
30 645 16 2.44 599 91.17
31 648 9 1.37 608 92.54
32 651 9 1.37 617 93.91
33 653 12 1.83 629 95.74
34 656 4 0.61 633 96.35
35 659 6 0.91 639 97.26
36 661 1 0.15 640 97.41
37 664 4 0.61 644 98.02
38 667 4 0.61 648 98.63
39 670 4 0.61 652 99.24
40 673 1 0.15 653 99.39
41 676 1 0.15 654 99.54
42 679 2 0.30 656 99.85
43 682 0 0.00 656 99.85
44 685 1 0.15 657 100.00
45 688 0 0.00 657 100.00
46 692 0 0.00 657 100.00
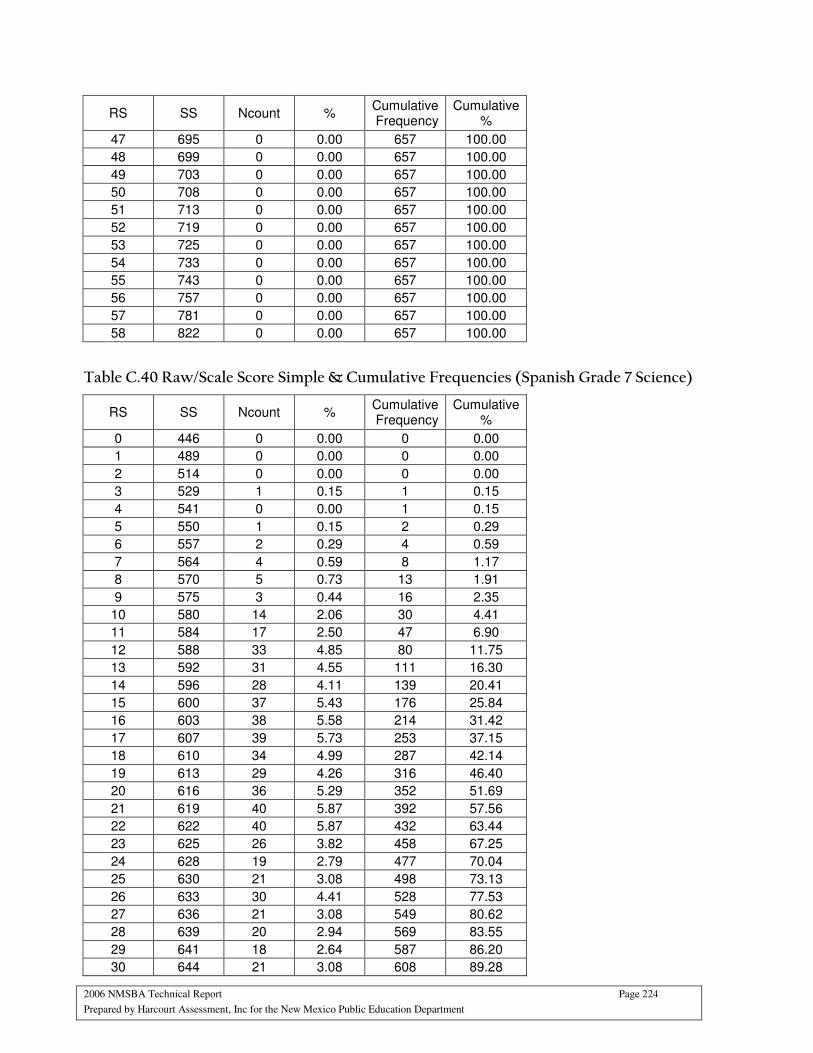
2006 NMSBA Technical Report Page 224
Prepared by Harcourt Assessment, Inc for the New Mexico Public Education Department
RS SS Ncount % Cumulative Frequency
Cumulative %
47 695 0 0.00 657 100.00
48 699 0 0.00 657 100.00
49 703 0 0.00 657 100.00
50 708 0 0.00 657 100.00
51 713 0 0.00 657 100.00
52 719 0 0.00 657 100.00
53 725 0 0.00 657 100.00
54 733 0 0.00 657 100.00
55 743 0 0.00 657 100.00
56 757 0 0.00 657 100.00
57 781 0 0.00 657 100.00
58 822 0 0.00 657 100.00
Table C.40 Raw/Scale Score Simple & Cumulative Frequencies (Spanish Grade 7 Science)
RS SS Ncount % Cumulative Frequency
Cumulative %
0 446 0 0.00 0 0.00
1 489 0 0.00 0 0.00
2 514 0 0.00 0 0.00
3 529 1 0.15 1 0.15
4 541 0 0.00 1 0.15
5 550 1 0.15 2 0.29
6 557 2 0.29 4 0.59
7 564 4 0.59 8 1.17
8 570 5 0.73 13 1.91
9 575 3 0.44 16 2.35
10 580 14 2.06 30 4.41
11 584 17 2.50 47 6.90
12 588 33 4.85 80 11.75
13 592 31 4.55 111 16.30
14 596 28 4.11 139 20.41
15 600 37 5.43 176 25.84
16 603 38 5.58 214 31.42
17 607 39 5.73 253 37.15
18 610 34 4.99 287 42.14
19 613 29 4.26 316 46.40
20 616 36 5.29 352 51.69
21 619 40 5.87 392 57.56
22 622 40 5.87 432 63.44
23 625 26 3.82 458 67.25
24 628 19 2.79 477 70.04
25 630 21 3.08 498 73.13
26 633 30 4.41 528 77.53
27 636 21 3.08 549 80.62
28 639 20 2.94 569 83.55
29 641 18 2.64 587 86.20
30 644 21 3.08 608 89.28
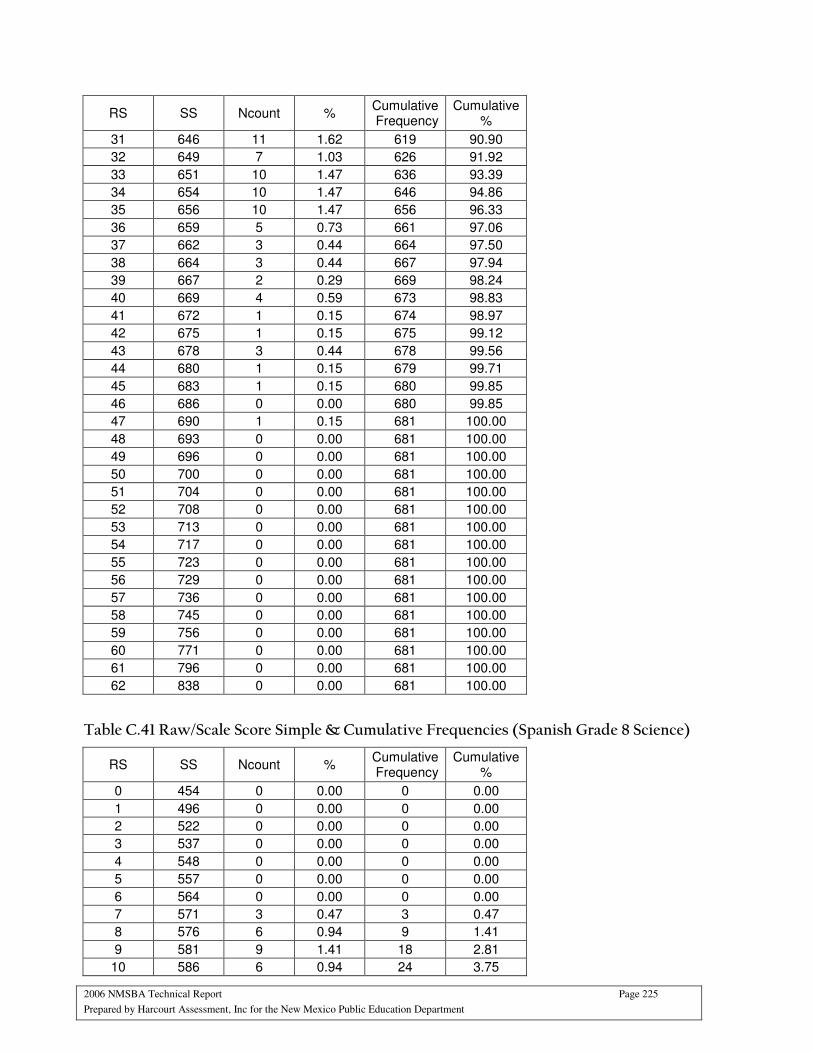
2006 NMSBA Technical Report Page 225
Prepared by Harcourt Assessment, Inc for the New Mexico Public Education Department
RS SS Ncount % Cumulative Frequency
Cumulative %
31 646 11 1.62 619 90.90
32 649 7 1.03 626 91.92
33 651 10 1.47 636 93.39
34 654 10 1.47 646 94.86
35 656 10 1.47 656 96.33
36 659 5 0.73 661 97.06
37 662 3 0.44 664 97.50
38 664 3 0.44 667 97.94
39 667 2 0.29 669 98.24
40 669 4 0.59 673 98.83
41 672 1 0.15 674 98.97
42 675 1 0.15 675 99.12
43 678 3 0.44 678 99.56
44 680 1 0.15 679 99.71
45 683 1 0.15 680 99.85
46 686 0 0.00 680 99.85
47 690 1 0.15 681 100.00
48 693 0 0.00 681 100.00
49 696 0 0.00 681 100.00
50 700 0 0.00 681 100.00
51 704 0 0.00 681 100.00
52 708 0 0.00 681 100.00
53 713 0 0.00 681 100.00
54 717 0 0.00 681 100.00
55 723 0 0.00 681 100.00
56 729 0 0.00 681 100.00
57 736 0 0.00 681 100.00
58 745 0 0.00 681 100.00
59 756 0 0.00 681 100.00
60 771 0 0.00 681 100.00
61 796 0 0.00 681 100.00
62 838 0 0.00 681 100.00
Table C.41 Raw/Scale Score Simple & Cumulative Frequencies (Spanish Grade 8 Science)
RS SS Ncount % Cumulative Frequency
Cumulative %
0 454 0 0.00 0 0.00
1 496 0 0.00 0 0.00
2 522 0 0.00 0 0.00
3 537 0 0.00 0 0.00
4 548 0 0.00 0 0.00
5 557 0 0.00 0 0.00
6 564 0 0.00 0 0.00
7 571 3 0.47 3 0.47
8 576 6 0.94 9 1.41
9 581 9 1.41 18 2.81
10 586 6 0.94 24 3.75
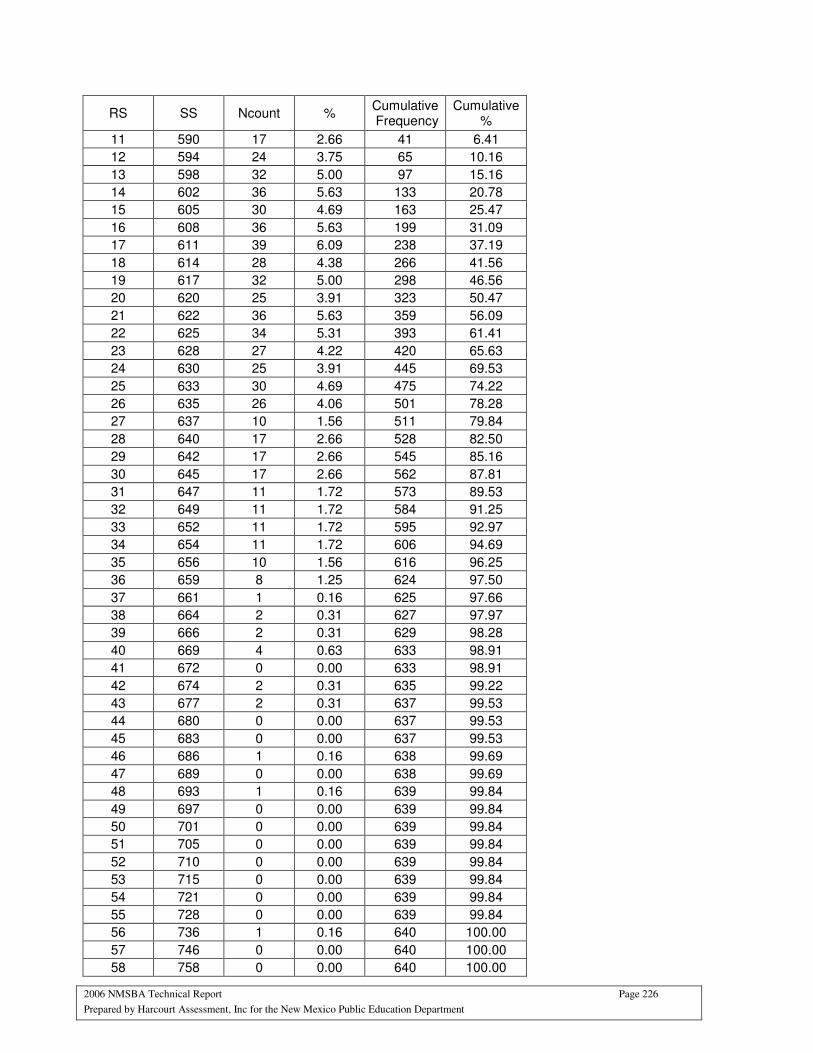
2006 NMSBA Technical Report Page 226
Prepared by Harcourt Assessment, Inc for the New Mexico Public Education Department
RS SS Ncount % Cumulative Frequency
Cumulative %
11 590 17 2.66 41 6.41
12 594 24 3.75 65 10.16
13 598 32 5.00 97 15.16
14 602 36 5.63 133 20.78
15 605 30 4.69 163 25.47
16 608 36 5.63 199 31.09
17 611 39 6.09 238 37.19
18 614 28 4.38 266 41.56
19 617 32 5.00 298 46.56
20 620 25 3.91 323 50.47
21 622 36 5.63 359 56.09
22 625 34 5.31 393 61.41
23 628 27 4.22 420 65.63
24 630 25 3.91 445 69.53
25 633 30 4.69 475 74.22
26 635 26 4.06 501 78.28
27 637 10 1.56 511 79.84
28 640 17 2.66 528 82.50
29 642 17 2.66 545 85.16
30 645 17 2.66 562 87.81
31 647 11 1.72 573 89.53
32 649 11 1.72 584 91.25
33 652 11 1.72 595 92.97
34 654 11 1.72 606 94.69
35 656 10 1.56 616 96.25
36 659 8 1.25 624 97.50
37 661 1 0.16 625 97.66
38 664 2 0.31 627 97.97
39 666 2 0.31 629 98.28
40 669 4 0.63 633 98.91
41 672 0 0.00 633 98.91
42 674 2 0.31 635 99.22
43 677 2 0.31 637 99.53
44 680 0 0.00 637 99.53
45 683 0 0.00 637 99.53
46 686 1 0.16 638 99.69
47 689 0 0.00 638 99.69
48 693 1 0.16 639 99.84
49 697 0 0.00 639 99.84
50 701 0 0.00 639 99.84
51 705 0 0.00 639 99.84
52 710 0 0.00 639 99.84
53 715 0 0.00 639 99.84
54 721 0 0.00 639 99.84
55 728 0 0.00 639 99.84
56 736 1 0.16 640 100.00
57 746 0 0.00 640 100.00
58 758 0 0.00 640 100.00
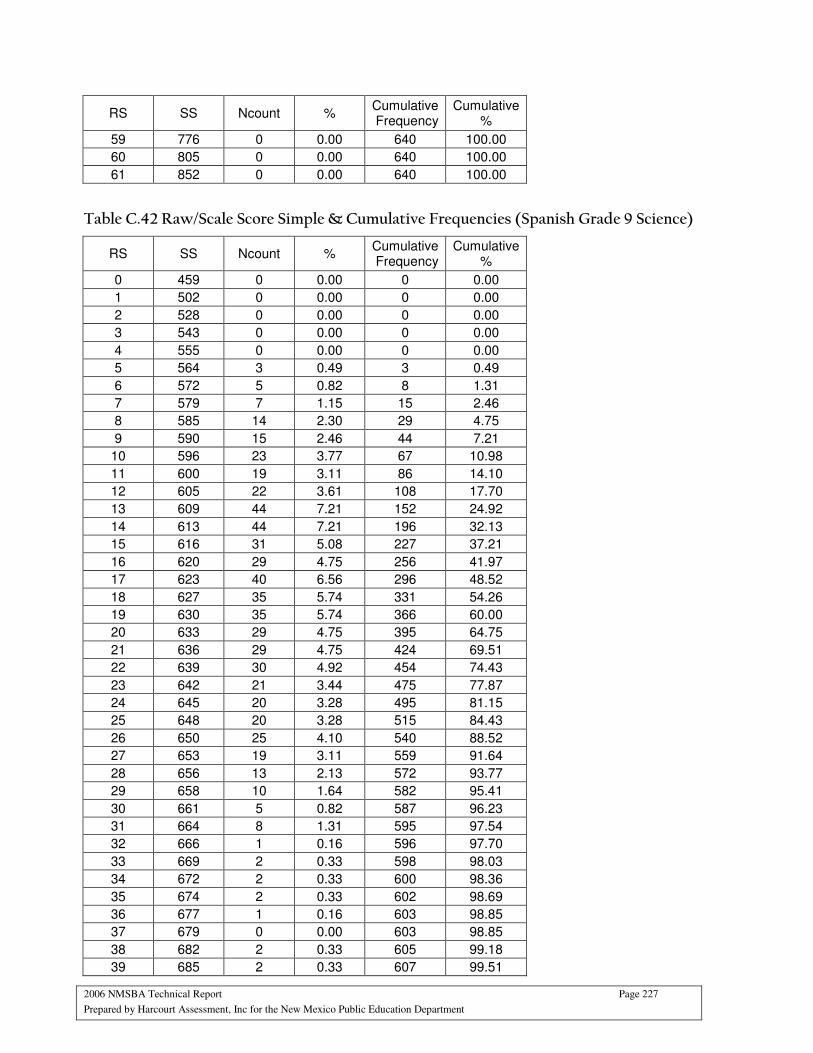
2006 NMSBA Technical Report Page 227
Prepared by Harcourt Assessment, Inc for the New Mexico Public Education Department
RS SS Ncount % Cumulative Frequency
Cumulative %
59 776 0 0.00 640 100.00
60 805 0 0.00 640 100.00
61 852 0 0.00 640 100.00
Table C.42 Raw/Scale Score Simple & Cumulative Frequencies (Spanish Grade 9 Science)
RS SS Ncount % Cumulative Frequency
Cumulative %
0 459 0 0.00 0 0.00
1 502 0 0.00 0 0.00
2 528 0 0.00 0 0.00
3 543 0 0.00 0 0.00
4 555 0 0.00 0 0.00
5 564 3 0.49 3 0.49
6 572 5 0.82 8 1.31
7 579 7 1.15 15 2.46
8 585 14 2.30 29 4.75
9 590 15 2.46 44 7.21
10 596 23 3.77 67 10.98
11 600 19 3.11 86 14.10
12 605 22 3.61 108 17.70
13 609 44 7.21 152 24.92
14 613 44 7.21 196 32.13
15 616 31 5.08 227 37.21
16 620 29 4.75 256 41.97
17 623 40 6.56 296 48.52
18 627 35 5.74 331 54.26
19 630 35 5.74 366 60.00
20 633 29 4.75 395 64.75
21 636 29 4.75 424 69.51
22 639 30 4.92 454 74.43
23 642 21 3.44 475 77.87
24 645 20 3.28 495 81.15
25 648 20 3.28 515 84.43
26 650 25 4.10 540 88.52
27 653 19 3.11 559 91.64
28 656 13 2.13 572 93.77
29 658 10 1.64 582 95.41
30 661 5 0.82 587 96.23
31 664 8 1.31 595 97.54
32 666 1 0.16 596 97.70
33 669 2 0.33 598 98.03
34 672 2 0.33 600 98.36
35 674 2 0.33 602 98.69
36 677 1 0.16 603 98.85
37 679 0 0.00 603 98.85
38 682 2 0.33 605 99.18
39 685 2 0.33 607 99.51
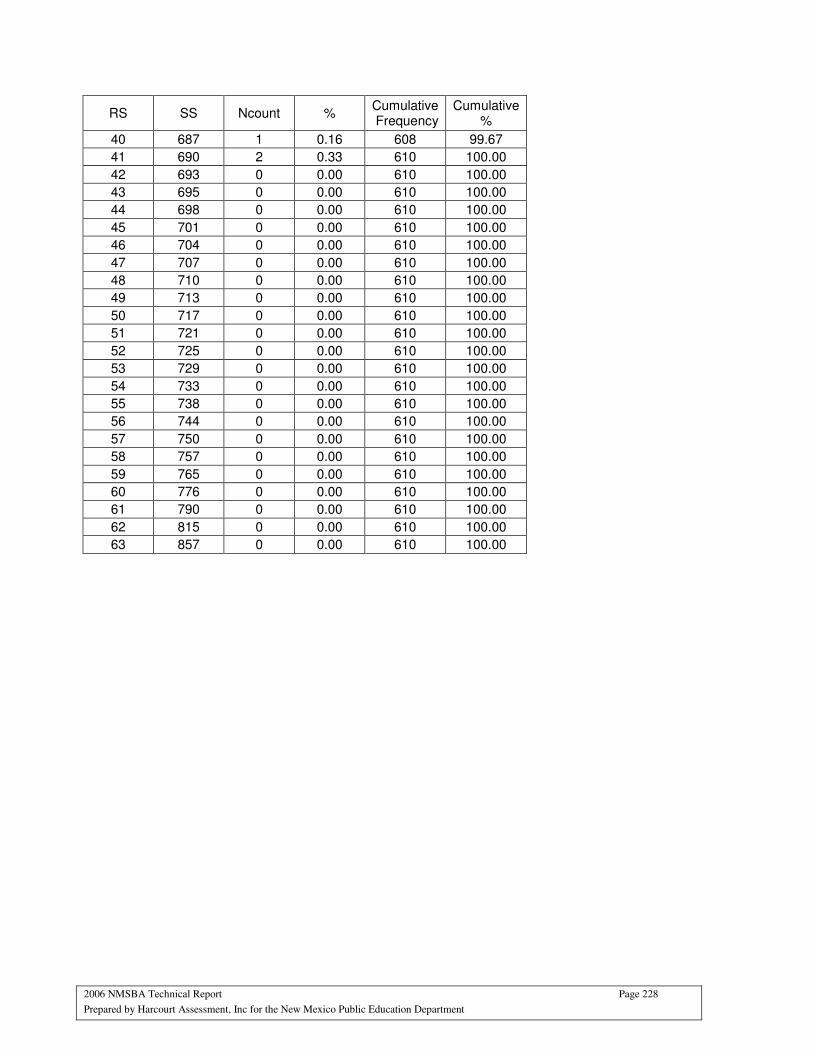
2006 NMSBA Technical Report Page 228
Prepared by Harcourt Assessment, Inc for the New Mexico Public Education Department
RS SS Ncount % Cumulative Frequency
Cumulative %
40 687 1 0.16 608 99.67
41 690 2 0.33 610 100.00
42 693 0 0.00 610 100.00
43 695 0 0.00 610 100.00
44 698 0 0.00 610 100.00
45 701 0 0.00 610 100.00
46 704 0 0.00 610 100.00
47 707 0 0.00 610 100.00
48 710 0 0.00 610 100.00
49 713 0 0.00 610 100.00
50 717 0 0.00 610 100.00
51 721 0 0.00 610 100.00
52 725 0 0.00 610 100.00
53 729 0 0.00 610 100.00
54 733 0 0.00 610 100.00
55 738 0 0.00 610 100.00
56 744 0 0.00 610 100.00
57 750 0 0.00 610 100.00
58 757 0 0.00 610 100.00
59 765 0 0.00 610 100.00
60 776 0 0.00 610 100.00
61 790 0 0.00 610 100.00
62 815 0 0.00 610 100.00
63 857 0 0.00 610 100.00
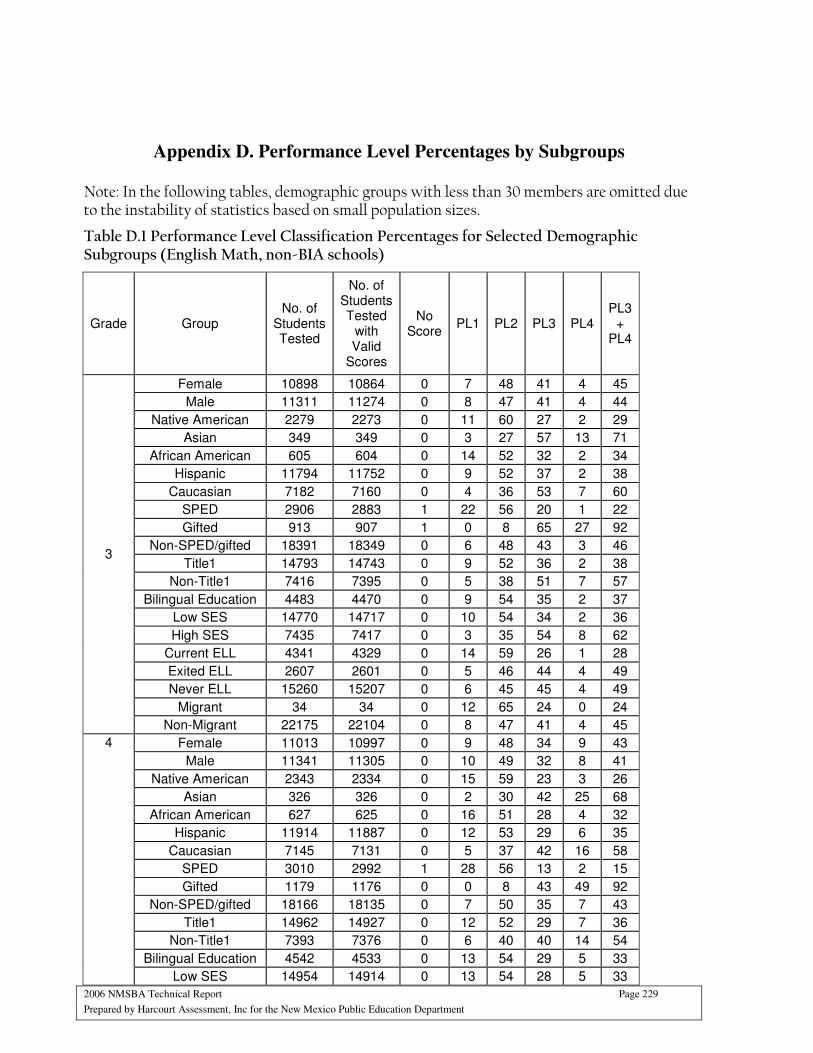
2006 NMSBA Technical Report Page 229
Prepared by Harcourt Assessment, Inc for the New Mexico Public Education Department
Appendix D. Performance Level Percentages by Subgroups
Note: In the following tables, demographic groups with less than 30 members are omitted due to the instability of statistics based on small population sizes.
Table D.1 Performance Level Classification Percentages for Selected Demographic Subgroups (English Math, non-BIA schools)
Grade Group No. of
Students Tested
No. of Students Tested
with Valid
Scores
No Score
PL1 PL2 PL3 PL4 PL3
+ PL4
Female 10898 10864 0 7 48 41 4 45
Male 11311 11274 0 8 47 41 4 44
Native American 2279 2273 0 11 60 27 2 29
Asian 349 349 0 3 27 57 13 71
African American 605 604 0 14 52 32 2 34
Hispanic 11794 11752 0 9 52 37 2 38
Caucasian 7182 7160 0 4 36 53 7 60
SPED 2906 2883 1 22 56 20 1 22
Gifted 913 907 1 0 8 65 27 92
Non-SPED/gifted 18391 18349 0 6 48 43 3 46
Title1 14793 14743 0 9 52 36 2 38
Non-Title1 7416 7395 0 5 38 51 7 57
Bilingual Education 4483 4470 0 9 54 35 2 37
Low SES 14770 14717 0 10 54 34 2 36
High SES 7435 7417 0 3 35 54 8 62
Current ELL 4341 4329 0 14 59 26 1 28
Exited ELL 2607 2601 0 5 46 44 4 49
Never ELL 15260 15207 0 6 45 45 4 49
Migrant 34 34 0 12 65 24 0 24
3
Non-Migrant 22175 22104 0 8 47 41 4 45
Female 11013 10997 0 9 48 34 9 43
Male 11341 11305 0 10 49 32 8 41
Native American 2343 2334 0 15 59 23 3 26
Asian 326 326 0 2 30 42 25 68
African American 627 625 0 16 51 28 4 32
Hispanic 11914 11887 0 12 53 29 6 35
Caucasian 7145 7131 0 5 37 42 16 58
SPED 3010 2992 1 28 56 13 2 15
Gifted 1179 1176 0 0 8 43 49 92
Non-SPED/gifted 18166 18135 0 7 50 35 7 43
Title1 14962 14927 0 12 52 29 7 36
Non-Title1 7393 7376 0 6 40 40 14 54
Bilingual Education 4542 4533 0 13 54 29 5 33
4
Low SES 14954 14914 0 13 54 28 5 33

2006 NMSBA Technical Report Page 230
Prepared by Harcourt Assessment, Inc for the New Mexico Public Education Department
Grade Group No. of
Students Tested
No. of Students Tested
with Valid
Scores
No Score
PL1 PL2 PL3 PL4 PL3
+ PL4
High SES 7400 7388 0 4 36 42 17 59
Current ELL 4509 4494 0 18 60 20 2 22
Exited ELL 2806 2802 0 7 47 37 9 46
Never ELL 15040 15007 0 8 45 36 11 47
Migrant 46 46 0 13 54 26 7 33
Non-Migrant 22309 22257 0 10 48 33 9 42
Female 11241 11186 0 14 50 29 6 35
Male 11860 11790 1 15 49 29 6 35
Native American 2386 2313 3 21 57 18 1 19
Asian 294 293 0 6 35 38 20 59
African American 624 623 0 21 53 22 4 26
Hispanic 12452 12424 0 18 54 24 4 28
Caucasian 7347 7325 0 7 41 40 12 51
SPED 3273 3239 1 41 48 8 1 9
Gifted 1456 1450 0 0 9 50 40 90
Non-SPED/gifted 18375 18290 0 11 53 31 4 35
Title1 15377 15267 1 18 54 24 4 28
Non-Title1 7727 7712 0 9 42 38 11 49
Bilingual Education 4667 4588 2 21 55 20 2 23
Low SES 15355 15248 1 19 55 23 3 25
High SES 7747 7729 0 7 39 41 13 54
Current ELL 4605 4552 1 28 57 13 1 14
Exited ELL 3361 3342 1 11 51 31 6 38
Never ELL 15138 15085 0 12 47 33 8 40
Migrant 81 80 1 15 57 23 4 27
5
Non-Migrant 23023 22899 1 15 50 29 6 35
Female 11633 11337 3 21 52 21 4 25
Male 12094 11777 3 25 50 19 4 23
Native American 2619 2578 2 31 55 12 1 13
Asian 283 266 6 12 34 31 17 48
African American 637 608 5 27 54 13 2 14
Hispanic 12716 12442 2 27 54 15 2 17
Caucasian 7473 7221 3 12 45 31 8 39
SPED 3366 3277 3 59 35 3 0 4
Gifted 1409 1370 3 0 15 50 31 81
Non-SPED/gifted 18954 18469 3 18 56 20 3 23
Title1 12728 12638 1 29 54 15 2 17
Non-Title1 11001 10478 5 16 48 25 6 31
Bilingual Education 3557 3517 1 33 54 10 1 11
Low SES 15610 15362 2 29 54 14 2 16
High SES 8118 7753 4 11 45 31 9 40
Current ELL 4550 4481 2 42 51 5 1 6
6
Exited ELL 3811 3715 3 20 55 19 3 22
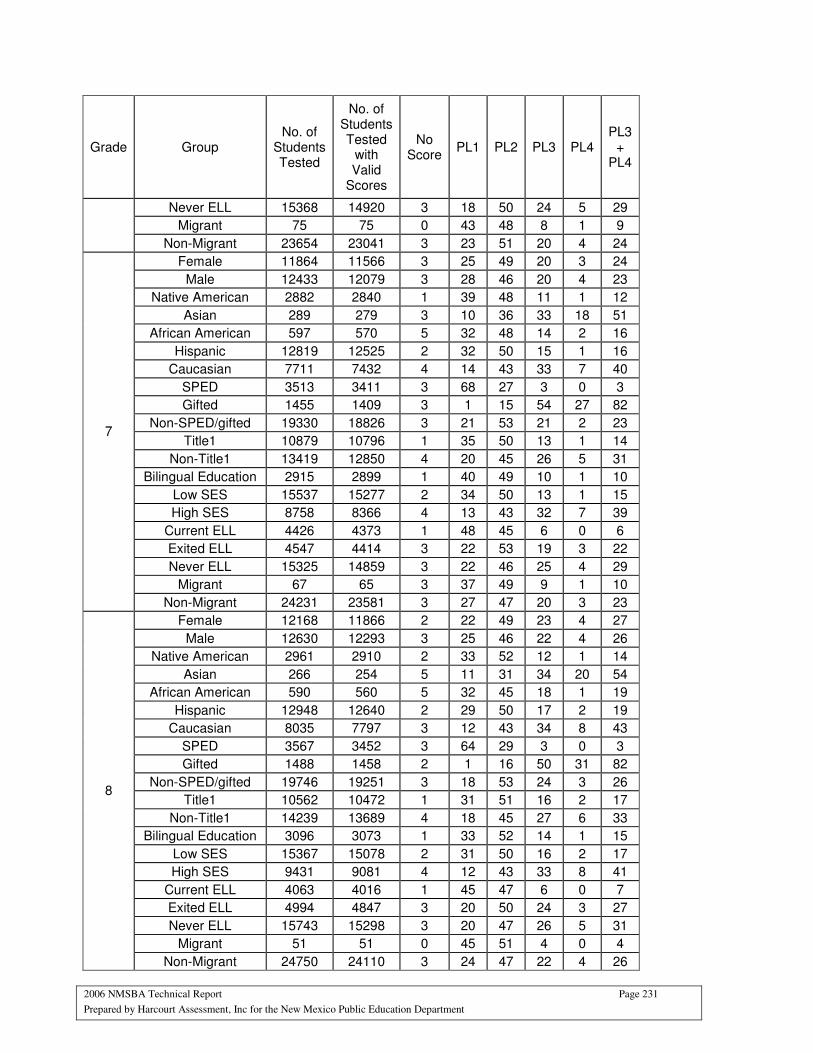
2006 NMSBA Technical Report Page 231
Prepared by Harcourt Assessment, Inc for the New Mexico Public Education Department
Grade Group No. of
Students Tested
No. of Students Tested
with Valid
Scores
No Score
PL1 PL2 PL3 PL4 PL3
+ PL4
Never ELL 15368 14920 3 18 50 24 5 29
Migrant 75 75 0 43 48 8 1 9
Non-Migrant 23654 23041 3 23 51 20 4 24
Female 11864 11566 3 25 49 20 3 24
Male 12433 12079 3 28 46 20 4 23
Native American 2882 2840 1 39 48 11 1 12
Asian 289 279 3 10 36 33 18 51
African American 597 570 5 32 48 14 2 16
Hispanic 12819 12525 2 32 50 15 1 16
Caucasian 7711 7432 4 14 43 33 7 40
SPED 3513 3411 3 68 27 3 0 3
Gifted 1455 1409 3 1 15 54 27 82
Non-SPED/gifted 19330 18826 3 21 53 21 2 23
Title1 10879 10796 1 35 50 13 1 14
Non-Title1 13419 12850 4 20 45 26 5 31
Bilingual Education 2915 2899 1 40 49 10 1 10
Low SES 15537 15277 2 34 50 13 1 15
High SES 8758 8366 4 13 43 32 7 39
Current ELL 4426 4373 1 48 45 6 0 6
Exited ELL 4547 4414 3 22 53 19 3 22
Never ELL 15325 14859 3 22 46 25 4 29
Migrant 67 65 3 37 49 9 1 10
7
Non-Migrant 24231 23581 3 27 47 20 3 23
Female 12168 11866 2 22 49 23 4 27
Male 12630 12293 3 25 46 22 4 26
Native American 2961 2910 2 33 52 12 1 14
Asian 266 254 5 11 31 34 20 54
African American 590 560 5 32 45 18 1 19
Hispanic 12948 12640 2 29 50 17 2 19
Caucasian 8035 7797 3 12 43 34 8 43
SPED 3567 3452 3 64 29 3 0 3
Gifted 1488 1458 2 1 16 50 31 82
Non-SPED/gifted 19746 19251 3 18 53 24 3 26
Title1 10562 10472 1 31 51 16 2 17
Non-Title1 14239 13689 4 18 45 27 6 33
Bilingual Education 3096 3073 1 33 52 14 1 15
Low SES 15367 15078 2 31 50 16 2 17
High SES 9431 9081 4 12 43 33 8 41
Current ELL 4063 4016 1 45 47 6 0 7
Exited ELL 4994 4847 3 20 50 24 3 27
Never ELL 15743 15298 3 20 47 26 5 31
Migrant 51 51 0 45 51 4 0 4
8
Non-Migrant 24750 24110 3 24 47 22 4 26

2006 NMSBA Technical Report Page 232
Prepared by Harcourt Assessment, Inc for the New Mexico Public Education Department
Grade Group No. of
Students Tested
No. of Students Tested
with Valid
Scores
No Score
PL1 PL2 PL3 PL4 PL3
+ PL4
Female 13101 12824 2 13 50 30 5 35
Male 14101 13727 3 20 46 27 5 32
Native American 3657 3547 3 20 58 18 1 19
Asian 296 289 2 8 30 40 19 59
African American 720 691 4 20 50 23 3 26
Hispanic 13886 13510 3 20 52 23 2 25
Caucasian 8646 8517 1 9 37 41 11 52
SPED 4220 4029 5 50 41 5 0 5
Gifted 1297 1290 1 1 10 49 40 89
Non-SPED/gifted 21690 21237 2 11 52 31 4 35
Title1 4934 4754 4 21 55 18 2 20
Non-Title1 22273 21802 2 15 46 30 6 36
Bilingual Education 2926 2836 3 19 60 17 1 18
Low SES 15100 14720 3 21 54 20 2 22
High SES 12091 11824 2 11 40 38 9 47
Current ELL 4473 4324 3 29 59 9 1 9
Exited ELL 5223 5131 2 13 51 30 4 34
Never ELL 17510 17100 2 14 44 33 7 39
Migrant 69 68 1 23 64 12 0 12
9
Non-Migrant 27138 26488 2 16 48 28 5 33
Table D.2 Performance Level Classification Percentages for Selected Demographic Subgroups (English Reading, non-BIA schools)
Grade Group No. of
Students Tested
No. of Students Tested
with Valid
Scores
No Score
PL1 PL2 PL3 PL4 PL3
+ PL4
Female 10902 10866 0 12 27 54 7 60
Male 11305 11252 0 19 29 46 5 51
Native American 2275 2254 1 27 36 35 2 37
Asian 346 340 2 6 21 60 12 71
African American 605 604 0 21 30 45 4 49
Hispanic 11795 11754 0 18 31 46 4 50
Caucasian 7186 7166 0 9 20 60 11 71
SPED 2904 2879 1 48 29 22 1 23
Gifted 913 910 0 1 4 58 37 95
Non-SPED/gifted 18391 18330 0 12 29 54 5 59
Title1 14791 14733 0 19 32 46 4 49
Non-Title1 7416 7385 0 10 21 58 10 68
Bilingual Education 4480 4467 0 19 33 44 3 48
3
Low SES 14765 14706 0 20 32 44 3 47
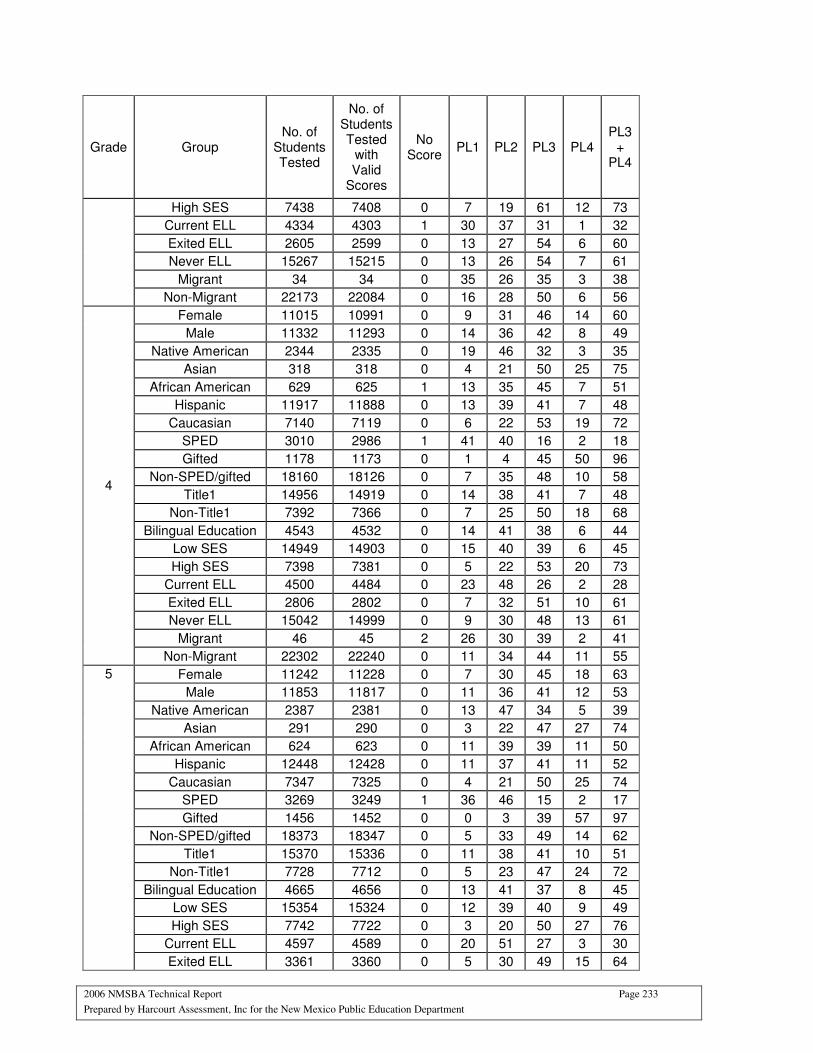
2006 NMSBA Technical Report Page 233
Prepared by Harcourt Assessment, Inc for the New Mexico Public Education Department
Grade Group No. of
Students Tested
No. of Students Tested
with Valid
Scores
No Score
PL1 PL2 PL3 PL4 PL3
+ PL4
High SES 7438 7408 0 7 19 61 12 73
Current ELL 4334 4303 1 30 37 31 1 32
Exited ELL 2605 2599 0 13 27 54 6 60
Never ELL 15267 15215 0 13 26 54 7 61
Migrant 34 34 0 35 26 35 3 38
Non-Migrant 22173 22084 0 16 28 50 6 56
Female 11015 10991 0 9 31 46 14 60
Male 11332 11293 0 14 36 42 8 49
Native American 2344 2335 0 19 46 32 3 35
Asian 318 318 0 4 21 50 25 75
African American 629 625 1 13 35 45 7 51
Hispanic 11917 11888 0 13 39 41 7 48
Caucasian 7140 7119 0 6 22 53 19 72
SPED 3010 2986 1 41 40 16 2 18
Gifted 1178 1173 0 1 4 45 50 96
Non-SPED/gifted 18160 18126 0 7 35 48 10 58
Title1 14956 14919 0 14 38 41 7 48
Non-Title1 7392 7366 0 7 25 50 18 68
Bilingual Education 4543 4532 0 14 41 38 6 44
Low SES 14949 14903 0 15 40 39 6 45
High SES 7398 7381 0 5 22 53 20 73
Current ELL 4500 4484 0 23 48 26 2 28
Exited ELL 2806 2802 0 7 32 51 10 61
Never ELL 15042 14999 0 9 30 48 13 61
Migrant 46 45 2 26 30 39 2 41
4
Non-Migrant 22302 22240 0 11 34 44 11 55
Female 11242 11228 0 7 30 45 18 63
Male 11853 11817 0 11 36 41 12 53
Native American 2387 2381 0 13 47 34 5 39
Asian 291 290 0 3 22 47 27 74
African American 624 623 0 11 39 39 11 50
Hispanic 12448 12428 0 11 37 41 11 52
Caucasian 7347 7325 0 4 21 50 25 74
SPED 3269 3249 1 36 46 15 2 17
Gifted 1456 1452 0 0 3 39 57 97
Non-SPED/gifted 18373 18347 0 5 33 49 14 62
Title1 15370 15336 0 11 38 41 10 51
Non-Title1 7728 7712 0 5 23 47 24 72
Bilingual Education 4665 4656 0 13 41 37 8 45
Low SES 15354 15324 0 12 39 40 9 49
High SES 7742 7722 0 3 20 50 27 76
Current ELL 4597 4589 0 20 51 27 3 30
5
Exited ELL 3361 3360 0 5 30 49 15 64
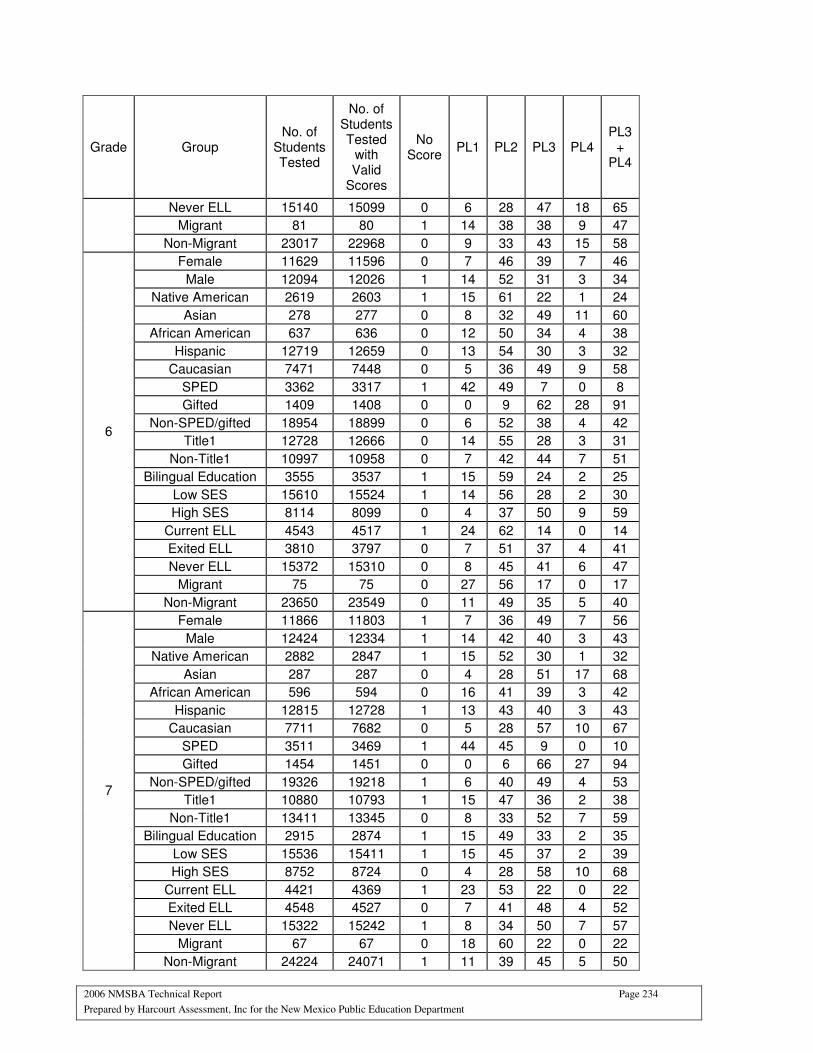
2006 NMSBA Technical Report Page 234
Prepared by Harcourt Assessment, Inc for the New Mexico Public Education Department
Grade Group No. of
Students Tested
No. of Students Tested
with Valid
Scores
No Score
PL1 PL2 PL3 PL4 PL3
+ PL4
Never ELL 15140 15099 0 6 28 47 18 65
Migrant 81 80 1 14 38 38 9 47
Non-Migrant 23017 22968 0 9 33 43 15 58
Female 11629 11596 0 7 46 39 7 46
Male 12094 12026 1 14 52 31 3 34
Native American 2619 2603 1 15 61 22 1 24
Asian 278 277 0 8 32 49 11 60
African American 637 636 0 12 50 34 4 38
Hispanic 12719 12659 0 13 54 30 3 32
Caucasian 7471 7448 0 5 36 49 9 58
SPED 3362 3317 1 42 49 7 0 8
Gifted 1409 1408 0 0 9 62 28 91
Non-SPED/gifted 18954 18899 0 6 52 38 4 42
Title1 12728 12666 0 14 55 28 3 31
Non-Title1 10997 10958 0 7 42 44 7 51
Bilingual Education 3555 3537 1 15 59 24 2 25
Low SES 15610 15524 1 14 56 28 2 30
High SES 8114 8099 0 4 37 50 9 59
Current ELL 4543 4517 1 24 62 14 0 14
Exited ELL 3810 3797 0 7 51 37 4 41
Never ELL 15372 15310 0 8 45 41 6 47
Migrant 75 75 0 27 56 17 0 17
6
Non-Migrant 23650 23549 0 11 49 35 5 40
Female 11866 11803 1 7 36 49 7 56
Male 12424 12334 1 14 42 40 3 43
Native American 2882 2847 1 15 52 30 1 32
Asian 287 287 0 4 28 51 17 68
African American 596 594 0 16 41 39 3 42
Hispanic 12815 12728 1 13 43 40 3 43
Caucasian 7711 7682 0 5 28 57 10 67
SPED 3511 3469 1 44 45 9 0 10
Gifted 1454 1451 0 0 6 66 27 94
Non-SPED/gifted 19326 19218 1 6 40 49 4 53
Title1 10880 10793 1 15 47 36 2 38
Non-Title1 13411 13345 0 8 33 52 7 59
Bilingual Education 2915 2874 1 15 49 33 2 35
Low SES 15536 15411 1 15 45 37 2 39
High SES 8752 8724 0 4 28 58 10 68
Current ELL 4421 4369 1 23 53 22 0 22
Exited ELL 4548 4527 0 7 41 48 4 52
Never ELL 15322 15242 1 8 34 50 7 57
Migrant 67 67 0 18 60 22 0 22
7
Non-Migrant 24224 24071 1 11 39 45 5 50
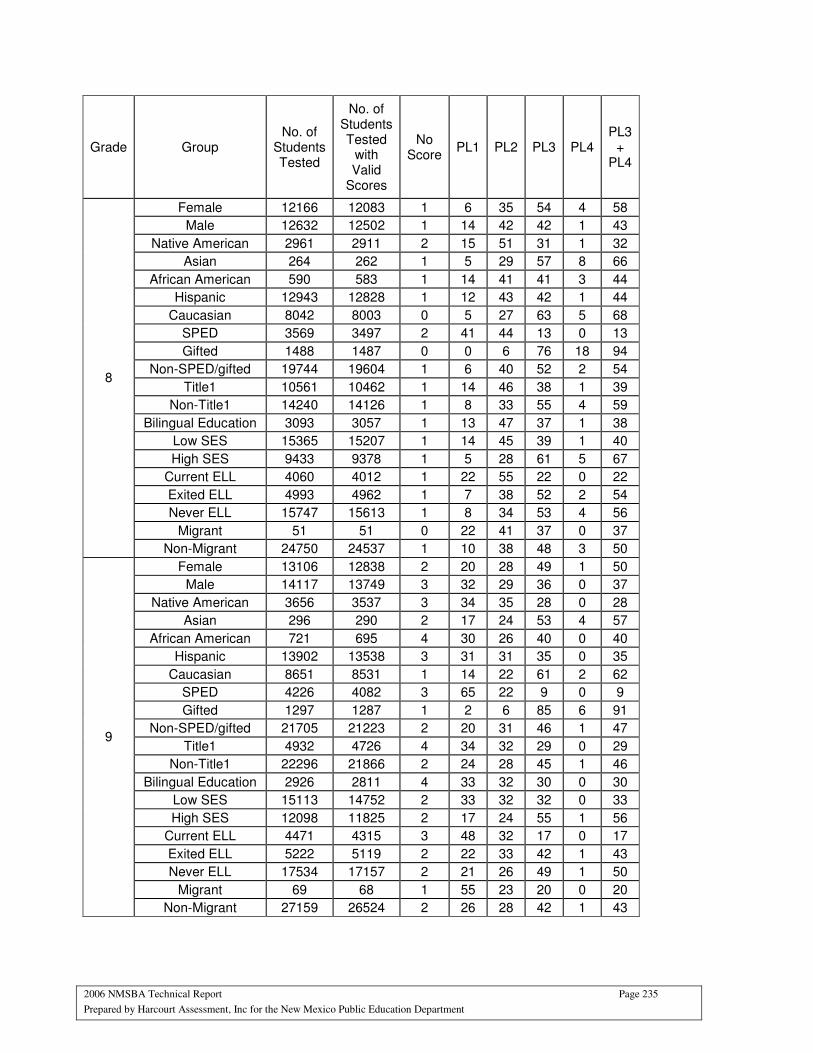
2006 NMSBA Technical Report Page 235
Prepared by Harcourt Assessment, Inc for the New Mexico Public Education Department
Grade Group No. of
Students Tested
No. of Students Tested
with Valid
Scores
No Score
PL1 PL2 PL3 PL4 PL3
+ PL4
Female 12166 12083 1 6 35 54 4 58
Male 12632 12502 1 14 42 42 1 43
Native American 2961 2911 2 15 51 31 1 32
Asian 264 262 1 5 29 57 8 66
African American 590 583 1 14 41 41 3 44
Hispanic 12943 12828 1 12 43 42 1 44
Caucasian 8042 8003 0 5 27 63 5 68
SPED 3569 3497 2 41 44 13 0 13
Gifted 1488 1487 0 0 6 76 18 94
Non-SPED/gifted 19744 19604 1 6 40 52 2 54
Title1 10561 10462 1 14 46 38 1 39
Non-Title1 14240 14126 1 8 33 55 4 59
Bilingual Education 3093 3057 1 13 47 37 1 38
Low SES 15365 15207 1 14 45 39 1 40
High SES 9433 9378 1 5 28 61 5 67
Current ELL 4060 4012 1 22 55 22 0 22
Exited ELL 4993 4962 1 7 38 52 2 54
Never ELL 15747 15613 1 8 34 53 4 56
Migrant 51 51 0 22 41 37 0 37
8
Non-Migrant 24750 24537 1 10 38 48 3 50
Female 13106 12838 2 20 28 49 1 50
Male 14117 13749 3 32 29 36 0 37
Native American 3656 3537 3 34 35 28 0 28
Asian 296 290 2 17 24 53 4 57
African American 721 695 4 30 26 40 0 40
Hispanic 13902 13538 3 31 31 35 0 35
Caucasian 8651 8531 1 14 22 61 2 62
SPED 4226 4082 3 65 22 9 0 9
Gifted 1297 1287 1 2 6 85 6 91
Non-SPED/gifted 21705 21223 2 20 31 46 1 47
Title1 4932 4726 4 34 32 29 0 29
Non-Title1 22296 21866 2 24 28 45 1 46
Bilingual Education 2926 2811 4 33 32 30 0 30
Low SES 15113 14752 2 33 32 32 0 33
High SES 12098 11825 2 17 24 55 1 56
Current ELL 4471 4315 3 48 32 17 0 17
Exited ELL 5222 5119 2 22 33 42 1 43
Never ELL 17534 17157 2 21 26 49 1 50
Migrant 69 68 1 55 23 20 0 20
9
Non-Migrant 27159 26524 2 26 28 42 1 43
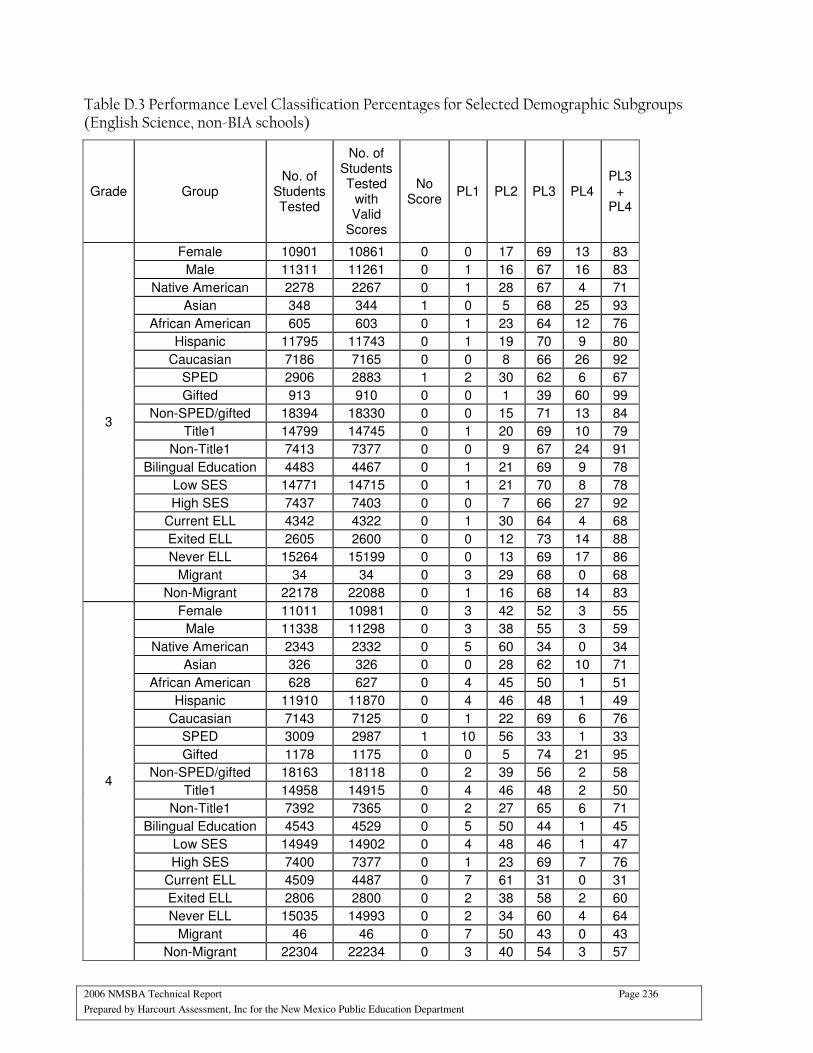
2006 NMSBA Technical Report Page 236
Prepared by Harcourt Assessment, Inc for the New Mexico Public Education Department
Table D.3 Performance Level Classification Percentages for Selected Demographic Subgroups (English Science, non-BIA schools)
Grade Group No. of
Students Tested
No. of Students Tested
with Valid
Scores
No Score
PL1 PL2 PL3 PL4 PL3
+ PL4
Female 10901 10861 0 0 17 69 13 83
Male 11311 11261 0 1 16 67 16 83
Native American 2278 2267 0 1 28 67 4 71
Asian 348 344 1 0 5 68 25 93
African American 605 603 0 1 23 64 12 76
Hispanic 11795 11743 0 1 19 70 9 80
Caucasian 7186 7165 0 0 8 66 26 92
SPED 2906 2883 1 2 30 62 6 67
Gifted 913 910 0 0 1 39 60 99
Non-SPED/gifted 18394 18330 0 0 15 71 13 84
Title1 14799 14745 0 1 20 69 10 79
Non-Title1 7413 7377 0 0 9 67 24 91
Bilingual Education 4483 4467 0 1 21 69 9 78
Low SES 14771 14715 0 1 21 70 8 78
High SES 7437 7403 0 0 7 66 27 92
Current ELL 4342 4322 0 1 30 64 4 68
Exited ELL 2605 2600 0 0 12 73 14 88
Never ELL 15264 15199 0 0 13 69 17 86
Migrant 34 34 0 3 29 68 0 68
3
Non-Migrant 22178 22088 0 1 16 68 14 83
Female 11011 10981 0 3 42 52 3 55
Male 11338 11298 0 3 38 55 3 59
Native American 2343 2332 0 5 60 34 0 34
Asian 326 326 0 0 28 62 10 71
African American 628 627 0 4 45 50 1 51
Hispanic 11910 11870 0 4 46 48 1 49
Caucasian 7143 7125 0 1 22 69 6 76
SPED 3009 2987 1 10 56 33 1 33
Gifted 1178 1175 0 0 5 74 21 95
Non-SPED/gifted 18163 18118 0 2 39 56 2 58
Title1 14958 14915 0 4 46 48 2 50
Non-Title1 7392 7365 0 2 27 65 6 71
Bilingual Education 4543 4529 0 5 50 44 1 45
Low SES 14949 14902 0 4 48 46 1 47
High SES 7400 7377 0 1 23 69 7 76
Current ELL 4509 4487 0 7 61 31 0 31
Exited ELL 2806 2800 0 2 38 58 2 60
Never ELL 15035 14993 0 2 34 60 4 64
Migrant 46 46 0 7 50 43 0 43
4
Non-Migrant 22304 22234 0 3 40 54 3 57

2006 NMSBA Technical Report Page 237
Prepared by Harcourt Assessment, Inc for the New Mexico Public Education Department
Grade Group No. of
Students Tested
No. of Students Tested
with Valid
Scores
No Score
PL1 PL2 PL3 PL4 PL3
+ PL4
Female 11242 11214 0 4 56 38 2 40
Male 11857 11802 0 4 49 43 3 46
Native American 2386 2374 1 8 72 19 0 19
Asian 293 293 0 2 36 55 8 62
African American 624 623 0 7 56 36 1 37
Hispanic 12451 12409 0 5 60 33 1 34
Caucasian 7347 7319 0 1 33 60 5 65
SPED 3270 3238 1 14 66 18 1 19
Gifted 1456 1451 0 0 7 73 20 92
Non-SPED/gifted 18376 18330 0 3 54 42 1 43
Title1 15376 15322 0 5 60 33 1 35
Non-Title1 7726 7697 0 2 38 55 5 59
Bilingual Education 4666 4650 0 6 66 27 1 27
Low SES 15353 15302 0 6 62 31 1 32
High SES 7747 7715 0 1 33 60 5 65
Current ELL 4604 4587 0 10 74 16 0 16
Exited ELL 3360 3353 0 2 56 40 2 42
Never ELL 15138 15079 0 3 45 48 3 51
Migrant 81 80 1 1 69 27 1 28
5
Non-Migrant 23021 22939 0 4 53 41 2 43
Female 11632 11582 0 11 62 26 1 27
Male 12091 12017 1 11 55 31 2 33
Native American 2617 2595 1 15 67 16 0 16
Asian 283 282 0 6 45 43 6 49
African American 636 634 0 13 62 23 1 24
Hispanic 12717 12645 1 14 65 20 1 21
Caucasian 7471 7443 0 5 45 47 3 50
SPED 3362 3324 1 33 57 8 0 8
Gifted 1409 1407 0 0 13 72 15 87
Non-SPED/gifted 18954 18869 0 8 62 29 1 29
Title1 12727 12662 1 14 65 20 1 21
Non-Title1 10998 10938 1 7 52 38 2 40
Bilingual Education 3557 3540 0 17 67 15 0 16
Low SES 15610 15508 1 15 65 19 0 20
High SES 8114 8091 0 4 46 46 4 50
Current ELL 4549 4519 1 24 68 7 0 7
Exited ELL 3810 3797 0 9 64 26 1 27
Never ELL 15366 15284 1 8 55 35 2 37
Migrant 75 75 0 23 71 7 0 7
6
Non-Migrant 23650 23525 1 11 59 28 1 30

2006 NMSBA Technical Report Page 238
Prepared by Harcourt Assessment, Inc for the New Mexico Public Education Department
Grade Group No. of
Students Tested
No. of Students Tested
with Valid
Scores
No Score
PL1 PL2 PL3 PL4 PL3
+ PL4
Female 11858 11781 1 15 59 24 1 24
Male 12430 12329 1 18 54 26 1 27
Native American 2878 2855 1 28 62 10 0 10
Asian 289 287 1 7 48 39 5 45
African American 596 593 1 22 59 18 0 19
Hispanic 12817 12703 1 20 62 17 0 18
Caucasian 7709 7673 0 8 47 43 2 45
SPED 3512 3463 1 46 47 5 0 5
Gifted 1454 1448 0 0 17 74 8 82
Non-SPED/gifted 19323 19200 1 13 61 25 1 25
Title1 10873 10789 1 23 62 14 0 15
Non-Title1 13416 13322 1 12 52 33 2 35
Bilingual Education 2914 2896 1 25 63 11 0 11
Low SES 15529 15391 1 22 61 16 0 16
High SES 8757 8717 0 8 49 41 2 43
Current ELL 4423 4386 1 33 61 5 0 6
Exited ELL 4547 4521 1 13 65 20 1 21
Never ELL 15319 15204 1 13 53 32 1 33
Migrant 67 64 4 22 64 9 0 9
7
Non-Migrant 24222 24047 1 17 57 25 1 26
Female 12165 12017 1 14 64 20 0 21
Male 12627 12458 1 15 58 26 1 26
Native American 2958 2901 2 19 69 10 0 10
Asian 266 257 3 6 49 41 2 42
African American 590 574 3 19 60 18 0 18
Hispanic 12946 12796 1 18 65 15 0 15
Caucasian 8034 7949 1 6 51 40 1 42
SPED 3566 3493 2 41 52 5 0 5
Gifted 1489 1482 0 0 21 73 5 78
Non-SPED/gifted 19740 19502 1 10 66 23 0 23
Title1 10555 10431 1 19 66 14 0 14
Non-Title1 14240 14046 1 11 57 30 1 30
Bilingual Education 3096 3060 1 20 67 12 0 12
Low SES 15364 15154 1 19 65 14 0 15
High SES 9428 9321 1 7 54 37 1 38
Current ELL 4061 4008 1 28 66 5 0 5
Exited ELL 4993 4957 1 11 67 21 0 22
Never ELL 15740 15512 1 12 58 28 1 29
Migrant 51 51 0 35 51 14 0 14
8
Non-Migrant 24744 24426 1 14 61 23 1 24
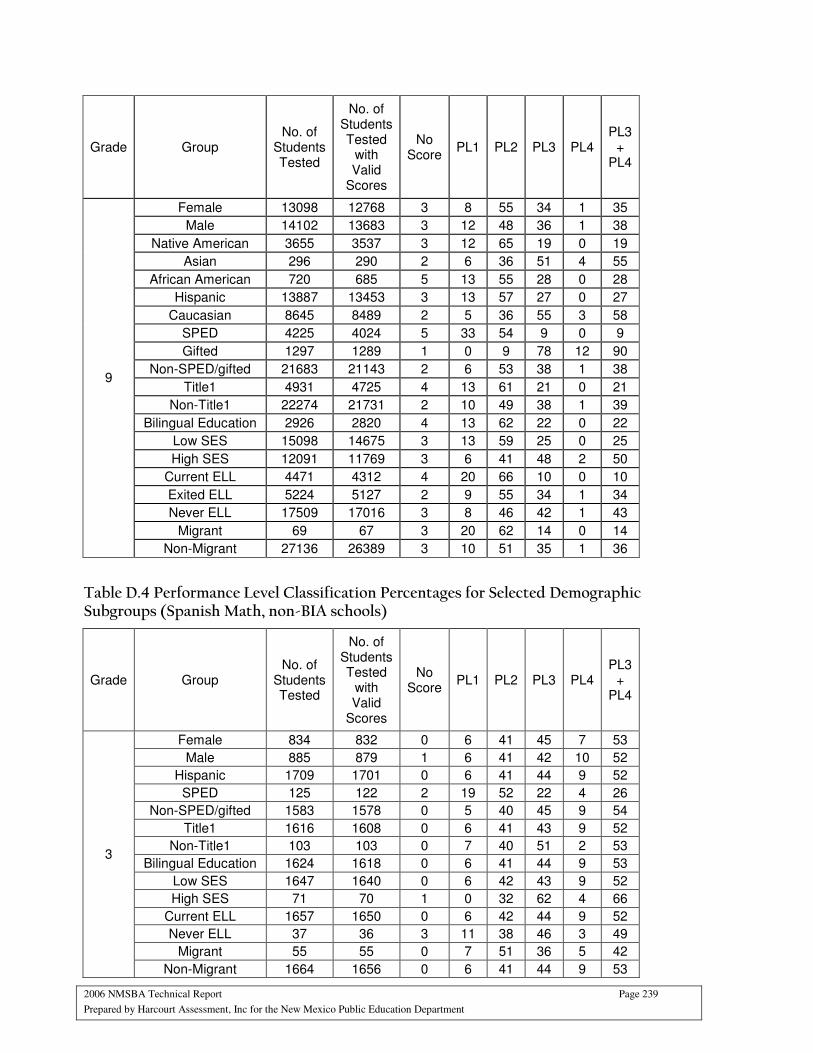
2006 NMSBA Technical Report Page 239
Prepared by Harcourt Assessment, Inc for the New Mexico Public Education Department
Grade Group No. of
Students Tested
No. of Students Tested
with Valid
Scores
No Score
PL1 PL2 PL3 PL4 PL3
+ PL4
Female 13098 12768 3 8 55 34 1 35
Male 14102 13683 3 12 48 36 1 38
Native American 3655 3537 3 12 65 19 0 19
Asian 296 290 2 6 36 51 4 55
African American 720 685 5 13 55 28 0 28
Hispanic 13887 13453 3 13 57 27 0 27
Caucasian 8645 8489 2 5 36 55 3 58
SPED 4225 4024 5 33 54 9 0 9
Gifted 1297 1289 1 0 9 78 12 90
Non-SPED/gifted 21683 21143 2 6 53 38 1 38
Title1 4931 4725 4 13 61 21 0 21
Non-Title1 22274 21731 2 10 49 38 1 39
Bilingual Education 2926 2820 4 13 62 22 0 22
Low SES 15098 14675 3 13 59 25 0 25
High SES 12091 11769 3 6 41 48 2 50
Current ELL 4471 4312 4 20 66 10 0 10
Exited ELL 5224 5127 2 9 55 34 1 34
Never ELL 17509 17016 3 8 46 42 1 43
Migrant 69 67 3 20 62 14 0 14
9
Non-Migrant 27136 26389 3 10 51 35 1 36
Table D.4 Performance Level Classification Percentages for Selected Demographic Subgroups (Spanish Math, non-BIA schools)
Grade Group No. of
Students Tested
No. of Students Tested
with Valid
Scores
No Score
PL1 PL2 PL3 PL4 PL3
+ PL4
Female 834 832 0 6 41 45 7 53
Male 885 879 1 6 41 42 10 52
Hispanic 1709 1701 0 6 41 44 9 52
SPED 125 122 2 19 52 22 4 26
Non-SPED/gifted 1583 1578 0 5 40 45 9 54
Title1 1616 1608 0 6 41 43 9 52
Non-Title1 103 103 0 7 40 51 2 53
Bilingual Education 1624 1618 0 6 41 44 9 53
Low SES 1647 1640 0 6 42 43 9 52
High SES 71 70 1 0 32 62 4 66
Current ELL 1657 1650 0 6 42 44 9 52
Never ELL 37 36 3 11 38 46 3 49
Migrant 55 55 0 7 51 36 5 42
3
Non-Migrant 1664 1656 0 6 41 44 9 53
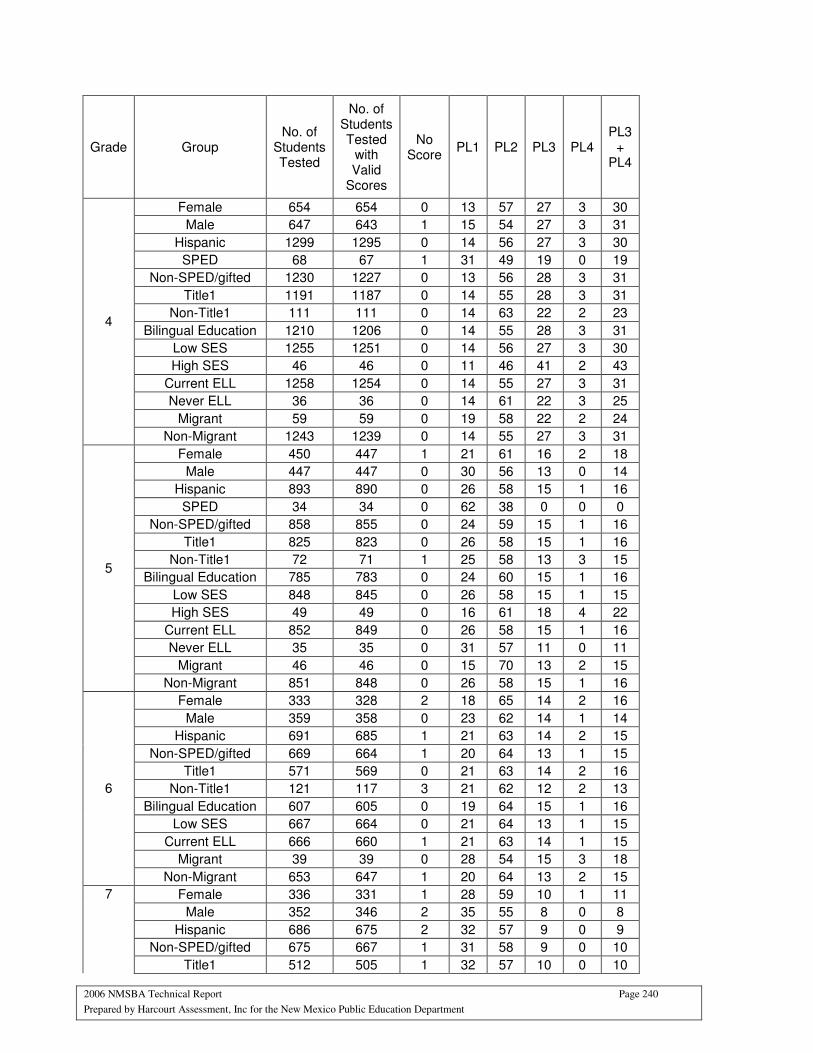
2006 NMSBA Technical Report Page 240
Prepared by Harcourt Assessment, Inc for the New Mexico Public Education Department
Grade Group No. of
Students Tested
No. of Students Tested
with Valid
Scores
No Score
PL1 PL2 PL3 PL4 PL3
+ PL4
Female 654 654 0 13 57 27 3 30
Male 647 643 1 15 54 27 3 31
Hispanic 1299 1295 0 14 56 27 3 30
SPED 68 67 1 31 49 19 0 19
Non-SPED/gifted 1230 1227 0 13 56 28 3 31
Title1 1191 1187 0 14 55 28 3 31
Non-Title1 111 111 0 14 63 22 2 23
Bilingual Education 1210 1206 0 14 55 28 3 31
Low SES 1255 1251 0 14 56 27 3 30
High SES 46 46 0 11 46 41 2 43
Current ELL 1258 1254 0 14 55 27 3 31
Never ELL 36 36 0 14 61 22 3 25
Migrant 59 59 0 19 58 22 2 24
4
Non-Migrant 1243 1239 0 14 55 27 3 31
Female 450 447 1 21 61 16 2 18
Male 447 447 0 30 56 13 0 14
Hispanic 893 890 0 26 58 15 1 16
SPED 34 34 0 62 38 0 0 0
Non-SPED/gifted 858 855 0 24 59 15 1 16
Title1 825 823 0 26 58 15 1 16
Non-Title1 72 71 1 25 58 13 3 15
Bilingual Education 785 783 0 24 60 15 1 16
Low SES 848 845 0 26 58 15 1 15
High SES 49 49 0 16 61 18 4 22
Current ELL 852 849 0 26 58 15 1 16
Never ELL 35 35 0 31 57 11 0 11
Migrant 46 46 0 15 70 13 2 15
5
Non-Migrant 851 848 0 26 58 15 1 16
Female 333 328 2 18 65 14 2 16
Male 359 358 0 23 62 14 1 14
Hispanic 691 685 1 21 63 14 2 15
Non-SPED/gifted 669 664 1 20 64 13 1 15
Title1 571 569 0 21 63 14 2 16
Non-Title1 121 117 3 21 62 12 2 13
Bilingual Education 607 605 0 19 64 15 1 16
Low SES 667 664 0 21 64 13 1 15
Current ELL 666 660 1 21 63 14 1 15
Migrant 39 39 0 28 54 15 3 18
6
Non-Migrant 653 647 1 20 64 13 2 15
Female 336 331 1 28 59 10 1 11
Male 352 346 2 35 55 8 0 8
Hispanic 686 675 2 32 57 9 0 9
Non-SPED/gifted 675 667 1 31 58 9 0 10
7
Title1 512 505 1 32 57 10 0 10
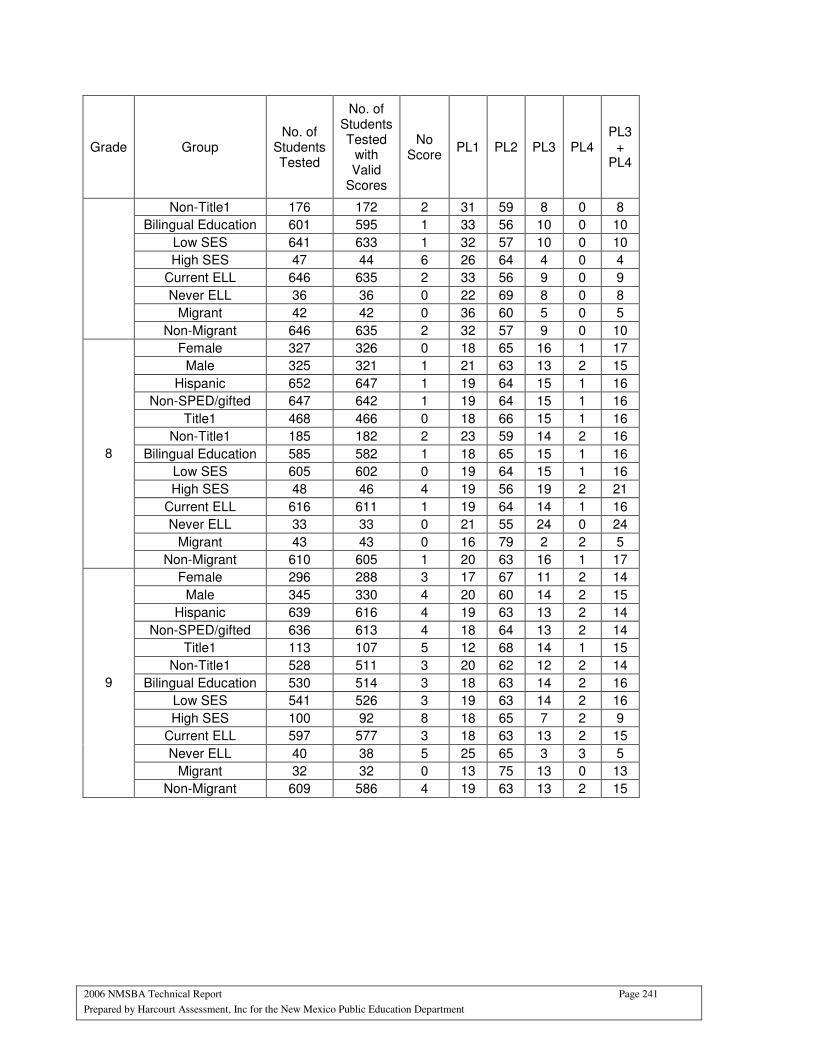
2006 NMSBA Technical Report Page 241
Prepared by Harcourt Assessment, Inc for the New Mexico Public Education Department
Grade Group No. of
Students Tested
No. of Students Tested
with Valid
Scores
No Score
PL1 PL2 PL3 PL4 PL3
+ PL4
Non-Title1 176 172 2 31 59 8 0 8
Bilingual Education 601 595 1 33 56 10 0 10
Low SES 641 633 1 32 57 10 0 10
High SES 47 44 6 26 64 4 0 4
Current ELL 646 635 2 33 56 9 0 9
Never ELL 36 36 0 22 69 8 0 8
Migrant 42 42 0 36 60 5 0 5
Non-Migrant 646 635 2 32 57 9 0 10
Female 327 326 0 18 65 16 1 17
Male 325 321 1 21 63 13 2 15
Hispanic 652 647 1 19 64 15 1 16
Non-SPED/gifted 647 642 1 19 64 15 1 16
Title1 468 466 0 18 66 15 1 16
Non-Title1 185 182 2 23 59 14 2 16
Bilingual Education 585 582 1 18 65 15 1 16
Low SES 605 602 0 19 64 15 1 16
High SES 48 46 4 19 56 19 2 21
Current ELL 616 611 1 19 64 14 1 16
Never ELL 33 33 0 21 55 24 0 24
Migrant 43 43 0 16 79 2 2 5
8
Non-Migrant 610 605 1 20 63 16 1 17
Female 296 288 3 17 67 11 2 14
Male 345 330 4 20 60 14 2 15
Hispanic 639 616 4 19 63 13 2 14
Non-SPED/gifted 636 613 4 18 64 13 2 14
Title1 113 107 5 12 68 14 1 15
Non-Title1 528 511 3 20 62 12 2 14
Bilingual Education 530 514 3 18 63 14 2 16
Low SES 541 526 3 19 63 14 2 16
High SES 100 92 8 18 65 7 2 9
Current ELL 597 577 3 18 63 13 2 15
Never ELL 40 38 5 25 65 3 3 5
Migrant 32 32 0 13 75 13 0 13
9
Non-Migrant 609 586 4 19 63 13 2 15
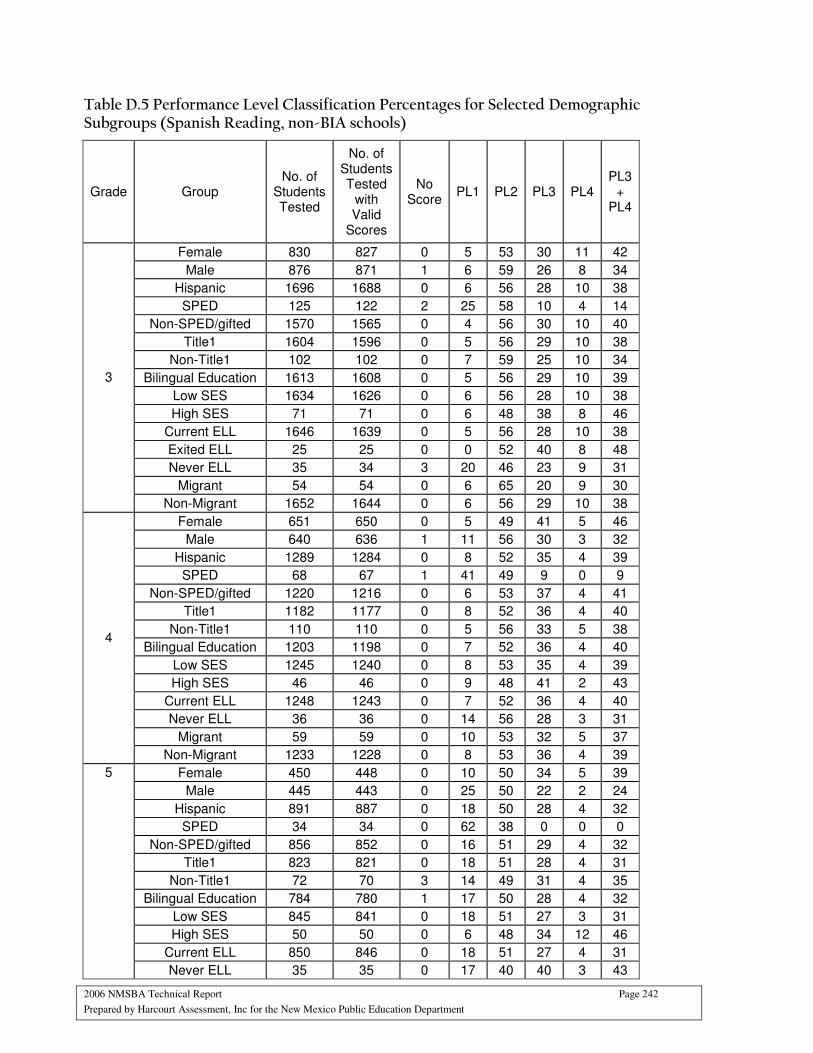
2006 NMSBA Technical Report Page 242
Prepared by Harcourt Assessment, Inc for the New Mexico Public Education Department
Table D.5 Performance Level Classification Percentages for Selected Demographic Subgroups (Spanish Reading, non-BIA schools)
Grade Group No. of
Students Tested
No. of Students Tested
with Valid
Scores
No Score
PL1 PL2 PL3 PL4 PL3
+ PL4
Female 830 827 0 5 53 30 11 42
Male 876 871 1 6 59 26 8 34
Hispanic 1696 1688 0 6 56 28 10 38
SPED 125 122 2 25 58 10 4 14
Non-SPED/gifted 1570 1565 0 4 56 30 10 40
Title1 1604 1596 0 5 56 29 10 38
Non-Title1 102 102 0 7 59 25 10 34
Bilingual Education 1613 1608 0 5 56 29 10 39
Low SES 1634 1626 0 6 56 28 10 38
High SES 71 71 0 6 48 38 8 46
Current ELL 1646 1639 0 5 56 28 10 38
Exited ELL 25 25 0 0 52 40 8 48
Never ELL 35 34 3 20 46 23 9 31
Migrant 54 54 0 6 65 20 9 30
3
Non-Migrant 1652 1644 0 6 56 29 10 38
Female 651 650 0 5 49 41 5 46
Male 640 636 1 11 56 30 3 32
Hispanic 1289 1284 0 8 52 35 4 39
SPED 68 67 1 41 49 9 0 9
Non-SPED/gifted 1220 1216 0 6 53 37 4 41
Title1 1182 1177 0 8 52 36 4 40
Non-Title1 110 110 0 5 56 33 5 38
Bilingual Education 1203 1198 0 7 52 36 4 40
Low SES 1245 1240 0 8 53 35 4 39
High SES 46 46 0 9 48 41 2 43
Current ELL 1248 1243 0 7 52 36 4 40
Never ELL 36 36 0 14 56 28 3 31
Migrant 59 59 0 10 53 32 5 37
4
Non-Migrant 1233 1228 0 8 53 36 4 39
Female 450 448 0 10 50 34 5 39
Male 445 443 0 25 50 22 2 24
Hispanic 891 887 0 18 50 28 4 32
SPED 34 34 0 62 38 0 0 0
Non-SPED/gifted 856 852 0 16 51 29 4 32
Title1 823 821 0 18 51 28 4 31
Non-Title1 72 70 3 14 49 31 4 35
Bilingual Education 784 780 1 17 50 28 4 32
Low SES 845 841 0 18 51 27 3 31
High SES 50 50 0 6 48 34 12 46
Current ELL 850 846 0 18 51 27 4 31
5
Never ELL 35 35 0 17 40 40 3 43
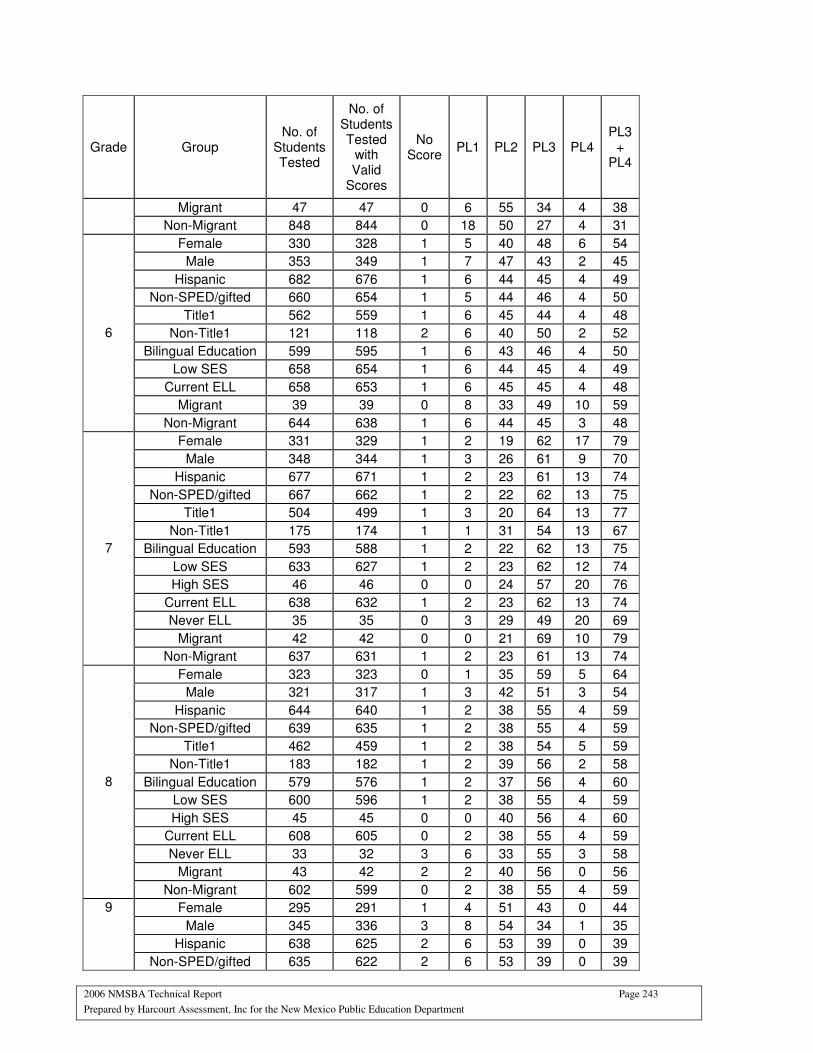
2006 NMSBA Technical Report Page 243
Prepared by Harcourt Assessment, Inc for the New Mexico Public Education Department
Grade Group No. of
Students Tested
No. of Students Tested
with Valid
Scores
No Score
PL1 PL2 PL3 PL4 PL3
+ PL4
Migrant 47 47 0 6 55 34 4 38
Non-Migrant 848 844 0 18 50 27 4 31
Female 330 328 1 5 40 48 6 54
Male 353 349 1 7 47 43 2 45
Hispanic 682 676 1 6 44 45 4 49
Non-SPED/gifted 660 654 1 5 44 46 4 50
Title1 562 559 1 6 45 44 4 48
Non-Title1 121 118 2 6 40 50 2 52
Bilingual Education 599 595 1 6 43 46 4 50
Low SES 658 654 1 6 44 45 4 49
Current ELL 658 653 1 6 45 45 4 48
Migrant 39 39 0 8 33 49 10 59
6
Non-Migrant 644 638 1 6 44 45 3 48
Female 331 329 1 2 19 62 17 79
Male 348 344 1 3 26 61 9 70
Hispanic 677 671 1 2 23 61 13 74
Non-SPED/gifted 667 662 1 2 22 62 13 75
Title1 504 499 1 3 20 64 13 77
Non-Title1 175 174 1 1 31 54 13 67
Bilingual Education 593 588 1 2 22 62 13 75
Low SES 633 627 1 2 23 62 12 74
High SES 46 46 0 0 24 57 20 76
Current ELL 638 632 1 2 23 62 13 74
Never ELL 35 35 0 3 29 49 20 69
Migrant 42 42 0 0 21 69 10 79
7
Non-Migrant 637 631 1 2 23 61 13 74
Female 323 323 0 1 35 59 5 64
Male 321 317 1 3 42 51 3 54
Hispanic 644 640 1 2 38 55 4 59
Non-SPED/gifted 639 635 1 2 38 55 4 59
Title1 462 459 1 2 38 54 5 59
Non-Title1 183 182 1 2 39 56 2 58
Bilingual Education 579 576 1 2 37 56 4 60
Low SES 600 596 1 2 38 55 4 59
High SES 45 45 0 0 40 56 4 60
Current ELL 608 605 0 2 38 55 4 59
Never ELL 33 32 3 6 33 55 3 58
Migrant 43 42 2 2 40 56 0 56
8
Non-Migrant 602 599 0 2 38 55 4 59
Female 295 291 1 4 51 43 0 44
Male 345 336 3 8 54 34 1 35
Hispanic 638 625 2 6 53 39 0 39
9
Non-SPED/gifted 635 622 2 6 53 39 0 39
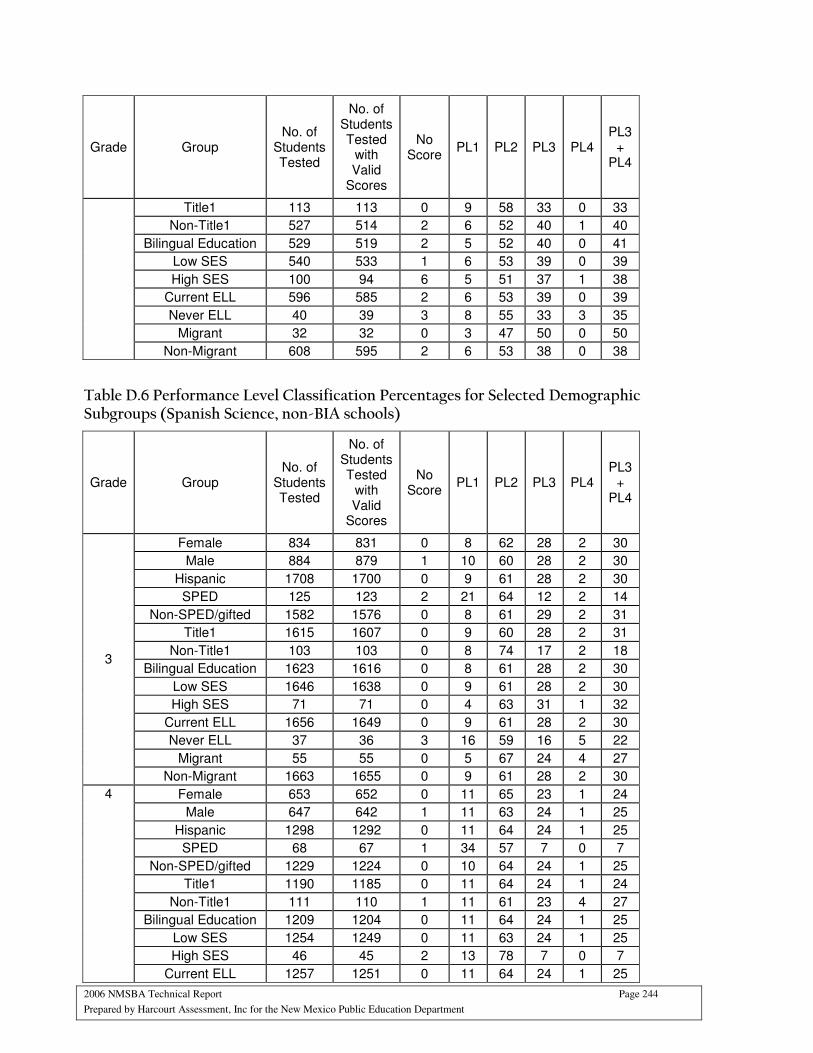
2006 NMSBA Technical Report Page 244
Prepared by Harcourt Assessment, Inc for the New Mexico Public Education Department
Grade Group No. of
Students Tested
No. of Students Tested
with Valid
Scores
No Score
PL1 PL2 PL3 PL4 PL3
+ PL4
Title1 113 113 0 9 58 33 0 33
Non-Title1 527 514 2 6 52 40 1 40
Bilingual Education 529 519 2 5 52 40 0 41
Low SES 540 533 1 6 53 39 0 39
High SES 100 94 6 5 51 37 1 38
Current ELL 596 585 2 6 53 39 0 39
Never ELL 40 39 3 8 55 33 3 35
Migrant 32 32 0 3 47 50 0 50
Non-Migrant 608 595 2 6 53 38 0 38
Table D.6 Performance Level Classification Percentages for Selected Demographic Subgroups (Spanish Science, non-BIA schools)
Grade Group No. of
Students Tested
No. of Students Tested
with Valid
Scores
No Score
PL1 PL2 PL3 PL4 PL3
+ PL4
Female 834 831 0 8 62 28 2 30
Male 884 879 1 10 60 28 2 30
Hispanic 1708 1700 0 9 61 28 2 30
SPED 125 123 2 21 64 12 2 14
Non-SPED/gifted 1582 1576 0 8 61 29 2 31
Title1 1615 1607 0 9 60 28 2 31
Non-Title1 103 103 0 8 74 17 2 18
Bilingual Education 1623 1616 0 8 61 28 2 30
Low SES 1646 1638 0 9 61 28 2 30
High SES 71 71 0 4 63 31 1 32
Current ELL 1656 1649 0 9 61 28 2 30
Never ELL 37 36 3 16 59 16 5 22
Migrant 55 55 0 5 67 24 4 27
3
Non-Migrant 1663 1655 0 9 61 28 2 30
Female 653 652 0 11 65 23 1 24
Male 647 642 1 11 63 24 1 25
Hispanic 1298 1292 0 11 64 24 1 25
SPED 68 67 1 34 57 7 0 7
Non-SPED/gifted 1229 1224 0 10 64 24 1 25
Title1 1190 1185 0 11 64 24 1 24
Non-Title1 111 110 1 11 61 23 4 27
Bilingual Education 1209 1204 0 11 64 24 1 25
Low SES 1254 1249 0 11 63 24 1 25
High SES 46 45 2 13 78 7 0 7
4
Current ELL 1257 1251 0 11 64 24 1 25
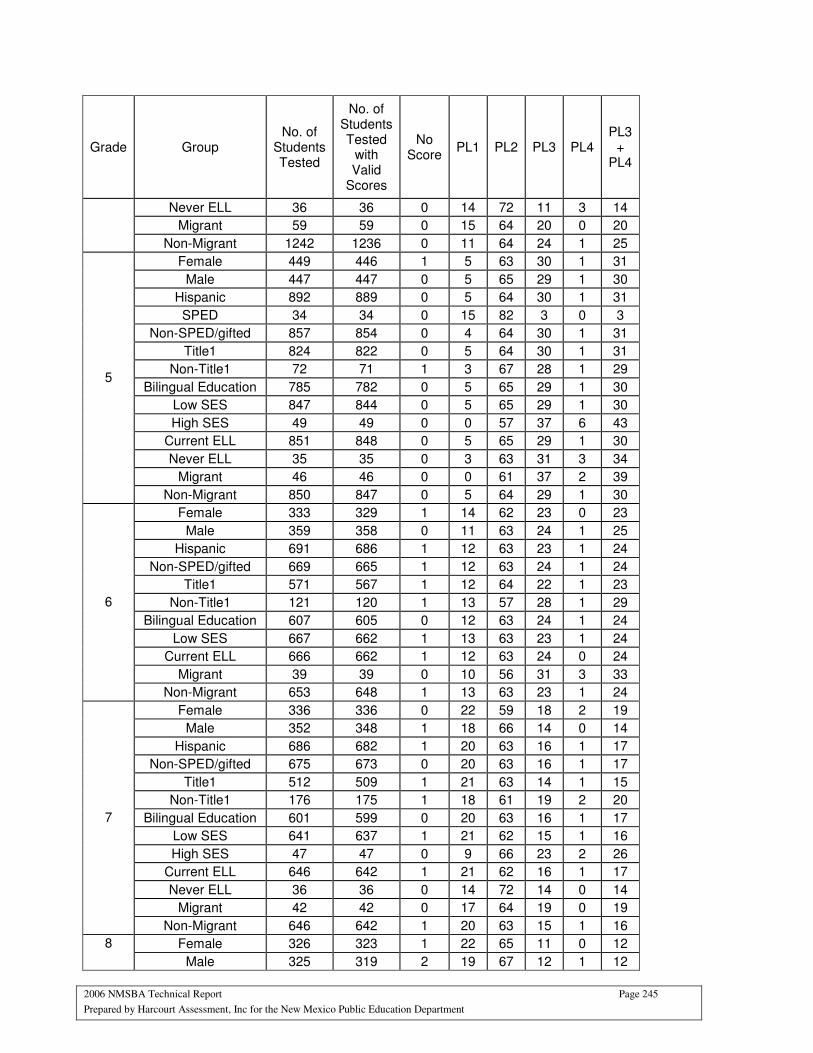
2006 NMSBA Technical Report Page 245
Prepared by Harcourt Assessment, Inc for the New Mexico Public Education Department
Grade Group No. of
Students Tested
No. of Students Tested
with Valid
Scores
No Score
PL1 PL2 PL3 PL4 PL3
+ PL4
Never ELL 36 36 0 14 72 11 3 14
Migrant 59 59 0 15 64 20 0 20
Non-Migrant 1242 1236 0 11 64 24 1 25
Female 449 446 1 5 63 30 1 31
Male 447 447 0 5 65 29 1 30
Hispanic 892 889 0 5 64 30 1 31
SPED 34 34 0 15 82 3 0 3
Non-SPED/gifted 857 854 0 4 64 30 1 31
Title1 824 822 0 5 64 30 1 31
Non-Title1 72 71 1 3 67 28 1 29
Bilingual Education 785 782 0 5 65 29 1 30
Low SES 847 844 0 5 65 29 1 30
High SES 49 49 0 0 57 37 6 43
Current ELL 851 848 0 5 65 29 1 30
Never ELL 35 35 0 3 63 31 3 34
Migrant 46 46 0 0 61 37 2 39
5
Non-Migrant 850 847 0 5 64 29 1 30
Female 333 329 1 14 62 23 0 23
Male 359 358 0 11 63 24 1 25
Hispanic 691 686 1 12 63 23 1 24
Non-SPED/gifted 669 665 1 12 63 24 1 24
Title1 571 567 1 12 64 22 1 23
Non-Title1 121 120 1 13 57 28 1 29
Bilingual Education 607 605 0 12 63 24 1 24
Low SES 667 662 1 13 63 23 1 24
Current ELL 666 662 1 12 63 24 0 24
Migrant 39 39 0 10 56 31 3 33
6
Non-Migrant 653 648 1 13 63 23 1 24
Female 336 336 0 22 59 18 2 19
Male 352 348 1 18 66 14 0 14
Hispanic 686 682 1 20 63 16 1 17
Non-SPED/gifted 675 673 0 20 63 16 1 17
Title1 512 509 1 21 63 14 1 15
Non-Title1 176 175 1 18 61 19 2 20
Bilingual Education 601 599 0 20 63 16 1 17
Low SES 641 637 1 21 62 15 1 16
High SES 47 47 0 9 66 23 2 26
Current ELL 646 642 1 21 62 16 1 17
Never ELL 36 36 0 14 72 14 0 14
Migrant 42 42 0 17 64 19 0 19
7
Non-Migrant 646 642 1 20 63 15 1 16
Female 326 323 1 22 65 11 0 12 8
Male 325 319 2 19 67 12 1 12
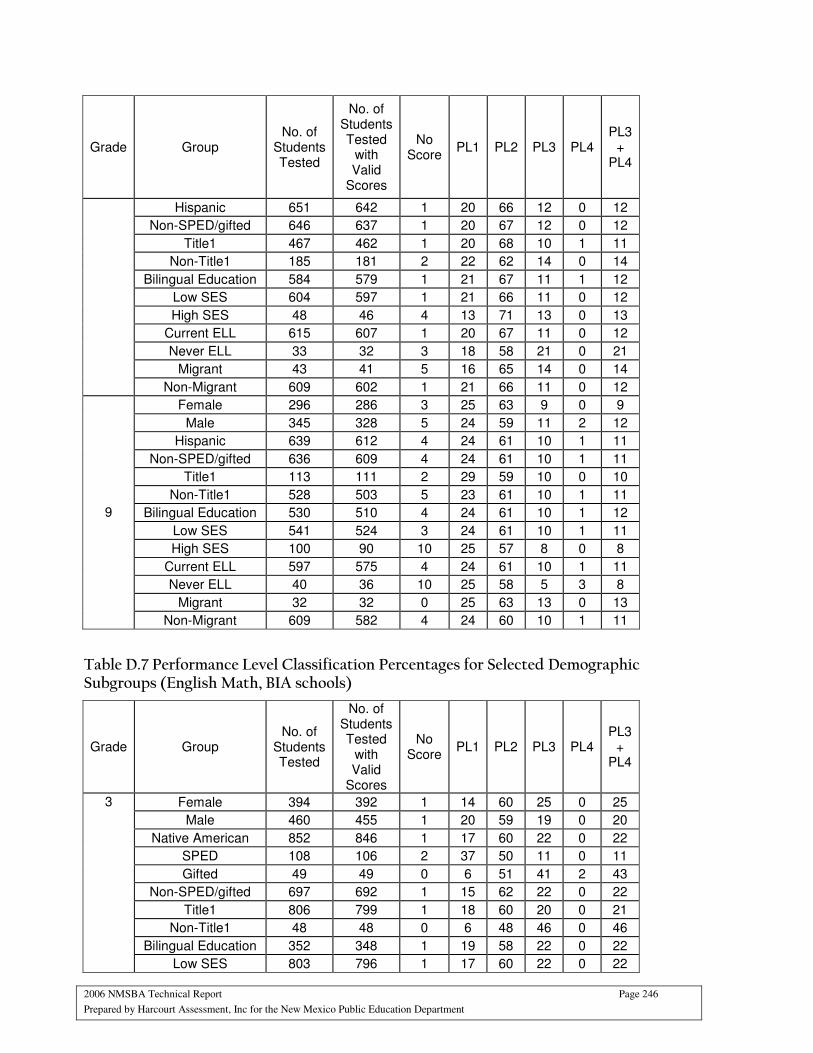
2006 NMSBA Technical Report Page 246
Prepared by Harcourt Assessment, Inc for the New Mexico Public Education Department
Grade Group No. of
Students Tested
No. of Students Tested
with Valid
Scores
No Score
PL1 PL2 PL3 PL4 PL3
+ PL4
Hispanic 651 642 1 20 66 12 0 12
Non-SPED/gifted 646 637 1 20 67 12 0 12
Title1 467 462 1 20 68 10 1 11
Non-Title1 185 181 2 22 62 14 0 14
Bilingual Education 584 579 1 21 67 11 1 12
Low SES 604 597 1 21 66 11 0 12
High SES 48 46 4 13 71 13 0 13
Current ELL 615 607 1 20 67 11 0 12
Never ELL 33 32 3 18 58 21 0 21
Migrant 43 41 5 16 65 14 0 14
Non-Migrant 609 602 1 21 66 11 0 12
Female 296 286 3 25 63 9 0 9
Male 345 328 5 24 59 11 2 12
Hispanic 639 612 4 24 61 10 1 11
Non-SPED/gifted 636 609 4 24 61 10 1 11
Title1 113 111 2 29 59 10 0 10
Non-Title1 528 503 5 23 61 10 1 11
Bilingual Education 530 510 4 24 61 10 1 12
Low SES 541 524 3 24 61 10 1 11
High SES 100 90 10 25 57 8 0 8
Current ELL 597 575 4 24 61 10 1 11
Never ELL 40 36 10 25 58 5 3 8
Migrant 32 32 0 25 63 13 0 13
9
Non-Migrant 609 582 4 24 60 10 1 11
Table D.7 Performance Level Classification Percentages for Selected Demographic Subgroups (English Math, BIA schools)
Grade Group No. of
Students Tested
No. of Students Tested
with Valid
Scores
No Score
PL1 PL2 PL3 PL4 PL3
+ PL4
Female 394 392 1 14 60 25 0 25
Male 460 455 1 20 59 19 0 20
Native American 852 846 1 17 60 22 0 22
SPED 108 106 2 37 50 11 0 11
Gifted 49 49 0 6 51 41 2 43
Non-SPED/gifted 697 692 1 15 62 22 0 22
Title1 806 799 1 18 60 20 0 21
Non-Title1 48 48 0 6 48 46 0 46
Bilingual Education 352 348 1 19 58 22 0 22
3
Low SES 803 796 1 17 60 22 0 22
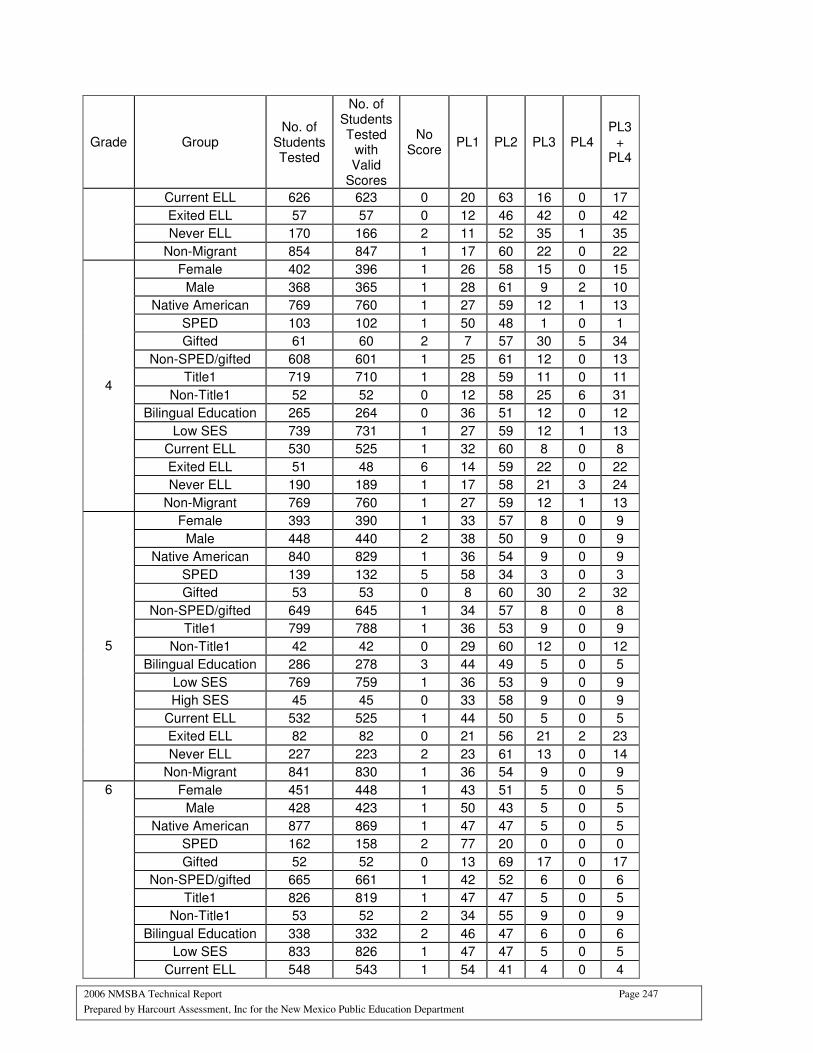
2006 NMSBA Technical Report Page 247
Prepared by Harcourt Assessment, Inc for the New Mexico Public Education Department
Grade Group No. of
Students Tested
No. of Students Tested
with Valid
Scores
No Score
PL1 PL2 PL3 PL4 PL3
+ PL4
Current ELL 626 623 0 20 63 16 0 17
Exited ELL 57 57 0 12 46 42 0 42
Never ELL 170 166 2 11 52 35 1 35
Non-Migrant 854 847 1 17 60 22 0 22
Female 402 396 1 26 58 15 0 15
Male 368 365 1 28 61 9 2 10
Native American 769 760 1 27 59 12 1 13
SPED 103 102 1 50 48 1 0 1
Gifted 61 60 2 7 57 30 5 34
Non-SPED/gifted 608 601 1 25 61 12 0 13
Title1 719 710 1 28 59 11 0 11
Non-Title1 52 52 0 12 58 25 6 31
Bilingual Education 265 264 0 36 51 12 0 12
Low SES 739 731 1 27 59 12 1 13
Current ELL 530 525 1 32 60 8 0 8
Exited ELL 51 48 6 14 59 22 0 22
Never ELL 190 189 1 17 58 21 3 24
4
Non-Migrant 769 760 1 27 59 12 1 13
Female 393 390 1 33 57 8 0 9
Male 448 440 2 38 50 9 0 9
Native American 840 829 1 36 54 9 0 9
SPED 139 132 5 58 34 3 0 3
Gifted 53 53 0 8 60 30 2 32
Non-SPED/gifted 649 645 1 34 57 8 0 8
Title1 799 788 1 36 53 9 0 9
Non-Title1 42 42 0 29 60 12 0 12
Bilingual Education 286 278 3 44 49 5 0 5
Low SES 769 759 1 36 53 9 0 9
High SES 45 45 0 33 58 9 0 9
Current ELL 532 525 1 44 50 5 0 5
Exited ELL 82 82 0 21 56 21 2 23
Never ELL 227 223 2 23 61 13 0 14
5
Non-Migrant 841 830 1 36 54 9 0 9
Female 451 448 1 43 51 5 0 5
Male 428 423 1 50 43 5 0 5
Native American 877 869 1 47 47 5 0 5
SPED 162 158 2 77 20 0 0 0
Gifted 52 52 0 13 69 17 0 17
Non-SPED/gifted 665 661 1 42 52 6 0 6
Title1 826 819 1 47 47 5 0 5
Non-Title1 53 52 2 34 55 9 0 9
Bilingual Education 338 332 2 46 47 6 0 6
Low SES 833 826 1 47 47 5 0 5
6
Current ELL 548 543 1 54 41 4 0 4
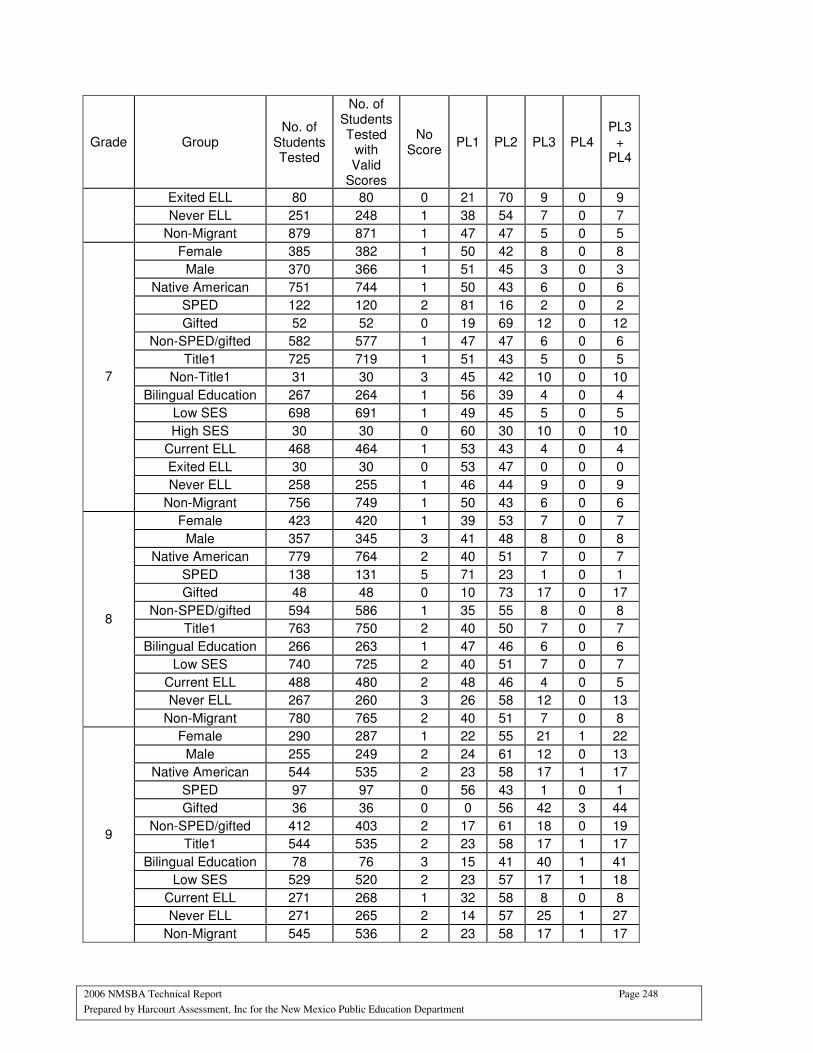
2006 NMSBA Technical Report Page 248
Prepared by Harcourt Assessment, Inc for the New Mexico Public Education Department
Grade Group No. of
Students Tested
No. of Students Tested
with Valid
Scores
No Score
PL1 PL2 PL3 PL4 PL3
+ PL4
Exited ELL 80 80 0 21 70 9 0 9
Never ELL 251 248 1 38 54 7 0 7
Non-Migrant 879 871 1 47 47 5 0 5
Female 385 382 1 50 42 8 0 8
Male 370 366 1 51 45 3 0 3
Native American 751 744 1 50 43 6 0 6
SPED 122 120 2 81 16 2 0 2
Gifted 52 52 0 19 69 12 0 12
Non-SPED/gifted 582 577 1 47 47 6 0 6
Title1 725 719 1 51 43 5 0 5
Non-Title1 31 30 3 45 42 10 0 10
Bilingual Education 267 264 1 56 39 4 0 4
Low SES 698 691 1 49 45 5 0 5
High SES 30 30 0 60 30 10 0 10
Current ELL 468 464 1 53 43 4 0 4
Exited ELL 30 30 0 53 47 0 0 0
Never ELL 258 255 1 46 44 9 0 9
7
Non-Migrant 756 749 1 50 43 6 0 6
Female 423 420 1 39 53 7 0 7
Male 357 345 3 41 48 8 0 8
Native American 779 764 2 40 51 7 0 7
SPED 138 131 5 71 23 1 0 1
Gifted 48 48 0 10 73 17 0 17
Non-SPED/gifted 594 586 1 35 55 8 0 8
Title1 763 750 2 40 50 7 0 7
Bilingual Education 266 263 1 47 46 6 0 6
Low SES 740 725 2 40 51 7 0 7
Current ELL 488 480 2 48 46 4 0 5
Never ELL 267 260 3 26 58 12 0 13
8
Non-Migrant 780 765 2 40 51 7 0 8
Female 290 287 1 22 55 21 1 22
Male 255 249 2 24 61 12 0 13
Native American 544 535 2 23 58 17 1 17
SPED 97 97 0 56 43 1 0 1
Gifted 36 36 0 0 56 42 3 44
Non-SPED/gifted 412 403 2 17 61 18 0 19
Title1 544 535 2 23 58 17 1 17
Bilingual Education 78 76 3 15 41 40 1 41
Low SES 529 520 2 23 57 17 1 18
Current ELL 271 268 1 32 58 8 0 8
Never ELL 271 265 2 14 57 25 1 27
9
Non-Migrant 545 536 2 23 58 17 1 17

2006 NMSBA Technical Report Page 249
Prepared by Harcourt Assessment, Inc for the New Mexico Public Education Department
Table D.8 Performance Level Classification Percentages for Selected Demographic Subgroups (English Reading, BIA schools)
Grade Group No. of
Students Tested
No. of Students Tested
with Valid
Scores
No Score
PL1 PL2 PL3 PL4 PL3
+ PL4
Female 394 391 1 27 42 30 0 30
Male 460 451 2 45 33 20 0 20
Native American 852 841 1 37 38 24 0 25
SPED 108 101 6 71 19 4 0 4
Gifted 49 49 0 10 33 57 0 57
Non-SPED/gifted 697 692 1 33 41 25 0 26
Title1 806 795 1 38 37 23 0 23
Non-Title1 48 47 2 10 44 44 0 44
Bilingual Education 352 348 1 41 38 19 0 20
Low SES 803 792 1 36 38 25 0 25
Current ELL 626 619 1 43 36 19 0 19
Exited ELL 57 57 0 19 40 40 0 40
Never ELL 170 165 3 18 41 38 1 38
3
Non-Migrant 854 842 1 36 38 24 0 25
Female 402 401 0 25 53 21 0 22
Male 368 365 1 35 48 15 1 16
Native American 769 765 1 30 51 18 1 19
SPED 103 103 0 66 32 2 0 2
Gifted 61 61 0 7 46 46 2 48
Non-SPED/gifted 608 604 1 26 54 18 1 19
Title1 719 715 1 30 52 17 0 18
Non-Title1 52 52 0 23 38 35 4 38
Bilingual Education 265 264 0 36 47 17 0 17
Low SES 739 735 1 29 51 19 1 19
High SES 27 27 0 37 44 19 0 19
Current ELL 530 527 1 35 53 12 0 12
Exited ELL 51 51 0 14 49 35 2 37
Never ELL 190 189 1 21 44 33 2 35
4
Non-Migrant 769 765 1 30 51 18 1 19
Female 393 390 1 18 52 26 3 29
Male 448 442 1 27 48 21 2 23
Native American 840 831 1 23 50 24 2 26
SPED 139 133 4 60 31 5 0 5
Gifted 53 53 0 2 45 45 8 53
Non-SPED/gifted 649 646 0 16 55 26 2 28
Title1 799 790 1 23 51 23 2 25
Non-Title1 42 42 0 17 45 38 0 38
Bilingual Education 286 280 2 28 52 17 1 18
Low SES 769 761 1 23 49 25 2 27
High SES 45 45 0 18 58 20 4 24
5
Current ELL 532 527 1 29 51 18 1 19

2006 NMSBA Technical Report Page 250
Prepared by Harcourt Assessment, Inc for the New Mexico Public Education Department
Grade Group No. of
Students Tested
No. of Students Tested
with Valid
Scores
No Score
PL1 PL2 PL3 PL4 PL3
+ PL4
Exited ELL 82 82 0 5 43 45 7 52
Never ELL 227 223 2 15 51 30 3 33
Non-Migrant 841 832 1 23 50 24 2 26
Female 451 450 0 17 67 16 1 17
Male 428 422 1 31 56 12 0 12
Native American 877 870 1 23 61 14 1 15
SPED 162 158 2 57 40 1 0 1
Gifted 52 52 0 2 54 44 0 44
Non-SPED/gifted 665 662 0 17 67 15 1 15
Title1 826 819 1 24 62 13 0 13
Non-Title1 53 53 0 11 53 30 6 36
Bilingual Education 338 334 1 27 59 13 0 13
Low SES 833 826 1 24 61 14 1 15
High SES 28 28 0 11 75 14 0 14
Current ELL 548 542 1 30 60 9 0 9
Exited ELL 80 80 0 6 64 26 4 30
Never ELL 251 250 0 16 62 21 1 22
6
Non-Migrant 879 872 1 23 61 14 1 15
Female 385 383 1 18 55 26 1 27
Male 370 367 1 29 57 13 0 13
Native American 751 746 1 23 56 19 1 20
SPED 122 121 1 68 28 3 0 3
Gifted 52 52 0 2 46 50 2 52
Non-SPED/gifted 582 578 1 16 63 20 1 21
Title1 725 720 1 24 56 19 1 20
Non-Title1 31 31 0 13 61 26 0 26
Bilingual Education 267 264 1 33 49 15 1 16
Low SES 698 693 1 23 56 19 1 20
High SES 30 30 0 13 53 33 0 33
Current ELL 468 465 1 28 56 15 0 15
Exited ELL 30 30 0 7 67 27 0 27
Never ELL 258 256 1 16 54 28 1 29
7
Non-Migrant 756 751 1 23 56 20 1 20
Female 423 421 0 17 50 31 1 32
Male 357 348 3 26 52 19 0 20
Native American 779 768 1 21 51 26 1 26
SPED 138 130 6 54 36 4 0 4
Gifted 48 48 0 6 31 60 2 63
Non-SPED/gifted 594 591 1 15 56 28 1 29
Title1 763 754 1 22 51 26 0 26
Bilingual Education 266 264 1 21 58 21 0 21
Low SES 740 729 1 21 51 25 1 26
Current ELL 488 483 1 26 57 16 0 16
8
Never ELL 267 261 2 13 40 43 2 45
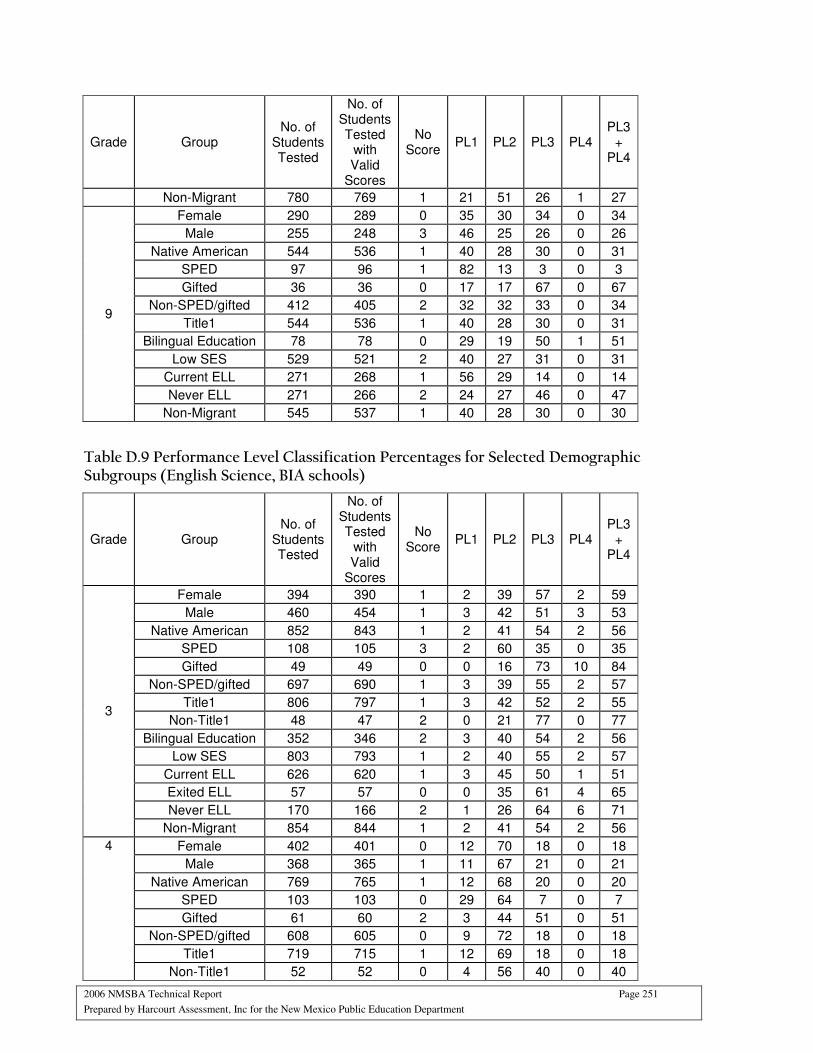
2006 NMSBA Technical Report Page 251
Prepared by Harcourt Assessment, Inc for the New Mexico Public Education Department
Grade Group No. of
Students Tested
No. of Students Tested
with Valid
Scores
No Score
PL1 PL2 PL3 PL4 PL3
+ PL4
Non-Migrant 780 769 1 21 51 26 1 27
Female 290 289 0 35 30 34 0 34
Male 255 248 3 46 25 26 0 26
Native American 544 536 1 40 28 30 0 31
SPED 97 96 1 82 13 3 0 3
Gifted 36 36 0 17 17 67 0 67
Non-SPED/gifted 412 405 2 32 32 33 0 34
Title1 544 536 1 40 28 30 0 31
Bilingual Education 78 78 0 29 19 50 1 51
Low SES 529 521 2 40 27 31 0 31
Current ELL 271 268 1 56 29 14 0 14
Never ELL 271 266 2 24 27 46 0 47
9
Non-Migrant 545 537 1 40 28 30 0 30
Table D.9 Performance Level Classification Percentages for Selected Demographic Subgroups (English Science, BIA schools)
Grade Group No. of
Students Tested
No. of Students Tested
with Valid
Scores
No Score
PL1 PL2 PL3 PL4 PL3
+ PL4
Female 394 390 1 2 39 57 2 59
Male 460 454 1 3 42 51 3 53
Native American 852 843 1 2 41 54 2 56
SPED 108 105 3 2 60 35 0 35
Gifted 49 49 0 0 16 73 10 84
Non-SPED/gifted 697 690 1 3 39 55 2 57
Title1 806 797 1 3 42 52 2 55
Non-Title1 48 47 2 0 21 77 0 77
Bilingual Education 352 346 2 3 40 54 2 56
Low SES 803 793 1 2 40 55 2 57
Current ELL 626 620 1 3 45 50 1 51
Exited ELL 57 57 0 0 35 61 4 65
Never ELL 170 166 2 1 26 64 6 71
3
Non-Migrant 854 844 1 2 41 54 2 56
Female 402 401 0 12 70 18 0 18
Male 368 365 1 11 67 21 0 21
Native American 769 765 1 12 68 20 0 20
SPED 103 103 0 29 64 7 0 7
Gifted 61 60 2 3 44 51 0 51
Non-SPED/gifted 608 605 0 9 72 18 0 18
Title1 719 715 1 12 69 18 0 18
4
Non-Title1 52 52 0 4 56 40 0 40
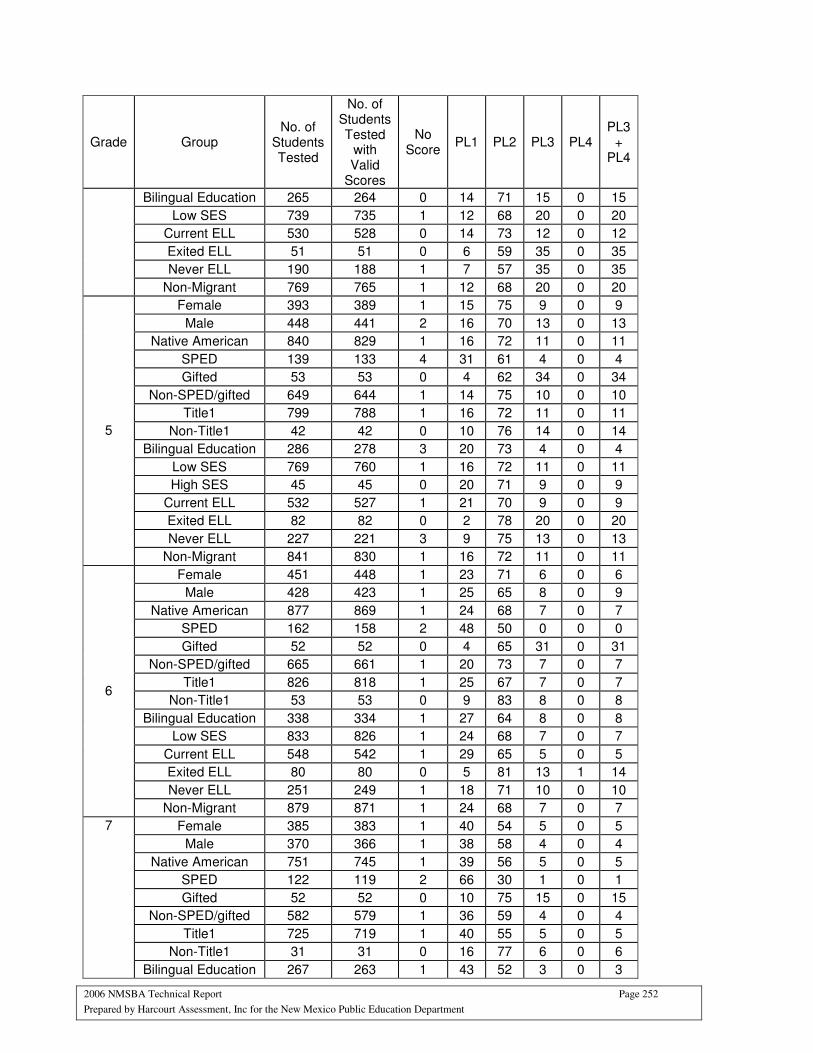
2006 NMSBA Technical Report Page 252
Prepared by Harcourt Assessment, Inc for the New Mexico Public Education Department
Grade Group No. of
Students Tested
No. of Students Tested
with Valid
Scores
No Score
PL1 PL2 PL3 PL4 PL3
+ PL4
Bilingual Education 265 264 0 14 71 15 0 15
Low SES 739 735 1 12 68 20 0 20
Current ELL 530 528 0 14 73 12 0 12
Exited ELL 51 51 0 6 59 35 0 35
Never ELL 190 188 1 7 57 35 0 35
Non-Migrant 769 765 1 12 68 20 0 20
Female 393 389 1 15 75 9 0 9
Male 448 441 2 16 70 13 0 13
Native American 840 829 1 16 72 11 0 11
SPED 139 133 4 31 61 4 0 4
Gifted 53 53 0 4 62 34 0 34
Non-SPED/gifted 649 644 1 14 75 10 0 10
Title1 799 788 1 16 72 11 0 11
Non-Title1 42 42 0 10 76 14 0 14
Bilingual Education 286 278 3 20 73 4 0 4
Low SES 769 760 1 16 72 11 0 11
High SES 45 45 0 20 71 9 0 9
Current ELL 532 527 1 21 70 9 0 9
Exited ELL 82 82 0 2 78 20 0 20
Never ELL 227 221 3 9 75 13 0 13
5
Non-Migrant 841 830 1 16 72 11 0 11
Female 451 448 1 23 71 6 0 6
Male 428 423 1 25 65 8 0 9
Native American 877 869 1 24 68 7 0 7
SPED 162 158 2 48 50 0 0 0
Gifted 52 52 0 4 65 31 0 31
Non-SPED/gifted 665 661 1 20 73 7 0 7
Title1 826 818 1 25 67 7 0 7
Non-Title1 53 53 0 9 83 8 0 8
Bilingual Education 338 334 1 27 64 8 0 8
Low SES 833 826 1 24 68 7 0 7
Current ELL 548 542 1 29 65 5 0 5
Exited ELL 80 80 0 5 81 13 1 14
Never ELL 251 249 1 18 71 10 0 10
6
Non-Migrant 879 871 1 24 68 7 0 7
Female 385 383 1 40 54 5 0 5
Male 370 366 1 38 58 4 0 4
Native American 751 745 1 39 56 5 0 5
SPED 122 119 2 66 30 1 0 1
Gifted 52 52 0 10 75 15 0 15
Non-SPED/gifted 582 579 1 36 59 4 0 4
Title1 725 719 1 40 55 5 0 5
Non-Title1 31 31 0 16 77 6 0 6
7
Bilingual Education 267 263 1 43 52 3 0 3
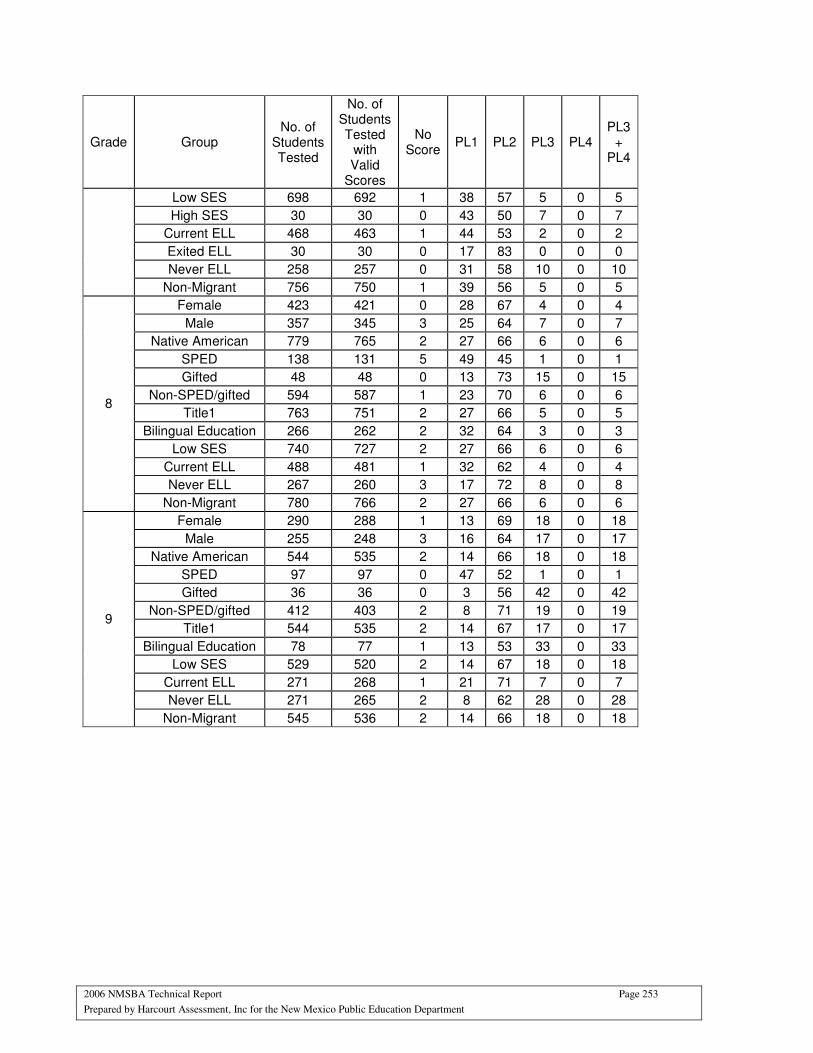
2006 NMSBA Technical Report Page 253
Prepared by Harcourt Assessment, Inc for the New Mexico Public Education Department
Grade Group No. of
Students Tested
No. of Students Tested
with Valid
Scores
No Score
PL1 PL2 PL3 PL4 PL3
+ PL4
Low SES 698 692 1 38 57 5 0 5
High SES 30 30 0 43 50 7 0 7
Current ELL 468 463 1 44 53 2 0 2
Exited ELL 30 30 0 17 83 0 0 0
Never ELL 258 257 0 31 58 10 0 10
Non-Migrant 756 750 1 39 56 5 0 5
Female 423 421 0 28 67 4 0 4
Male 357 345 3 25 64 7 0 7
Native American 779 765 2 27 66 6 0 6
SPED 138 131 5 49 45 1 0 1
Gifted 48 48 0 13 73 15 0 15
Non-SPED/gifted 594 587 1 23 70 6 0 6
Title1 763 751 2 27 66 5 0 5
Bilingual Education 266 262 2 32 64 3 0 3
Low SES 740 727 2 27 66 6 0 6
Current ELL 488 481 1 32 62 4 0 4
Never ELL 267 260 3 17 72 8 0 8
8
Non-Migrant 780 766 2 27 66 6 0 6
Female 290 288 1 13 69 18 0 18
Male 255 248 3 16 64 17 0 17
Native American 544 535 2 14 66 18 0 18
SPED 97 97 0 47 52 1 0 1
Gifted 36 36 0 3 56 42 0 42
Non-SPED/gifted 412 403 2 8 71 19 0 19
Title1 544 535 2 14 67 17 0 17
Bilingual Education 78 77 1 13 53 33 0 33
Low SES 529 520 2 14 67 18 0 18
Current ELL 271 268 1 21 71 7 0 7
Never ELL 271 265 2 8 62 28 0 28
9
Non-Migrant 545 536 2 14 66 18 0 18
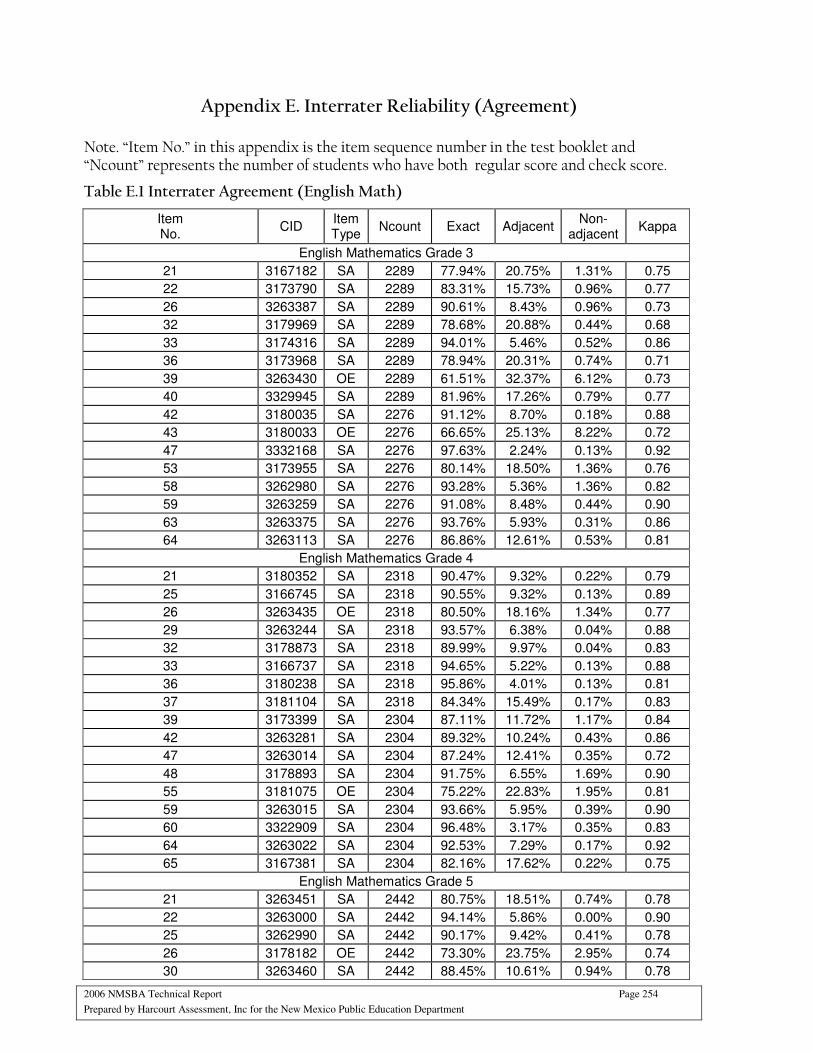
2006 NMSBA Technical Report Page 254
Prepared by Harcourt Assessment, Inc for the New Mexico Public Education Department
Appendix E. Interrater Reliability (Agreement)
Note. “Item No.” in this appendix is the item sequence number in the test booklet and “Ncount” represents the number of students who have both regular score and check score.
Table E.1 Interrater Agreement (English Math)
Item No.
CID Item Type
Ncount Exact Adjacent Non-
adjacent Kappa
English Mathematics Grade 3
21 3167182 SA 2289 77.94% 20.75% 1.31% 0.75
22 3173790 SA 2289 83.31% 15.73% 0.96% 0.77
26 3263387 SA 2289 90.61% 8.43% 0.96% 0.73
32 3179969 SA 2289 78.68% 20.88% 0.44% 0.68
33 3174316 SA 2289 94.01% 5.46% 0.52% 0.86
36 3173968 SA 2289 78.94% 20.31% 0.74% 0.71
39 3263430 OE 2289 61.51% 32.37% 6.12% 0.73
40 3329945 SA 2289 81.96% 17.26% 0.79% 0.77
42 3180035 SA 2276 91.12% 8.70% 0.18% 0.88
43 3180033 OE 2276 66.65% 25.13% 8.22% 0.72
47 3332168 SA 2276 97.63% 2.24% 0.13% 0.92
53 3173955 SA 2276 80.14% 18.50% 1.36% 0.76
58 3262980 SA 2276 93.28% 5.36% 1.36% 0.82
59 3263259 SA 2276 91.08% 8.48% 0.44% 0.90
63 3263375 SA 2276 93.76% 5.93% 0.31% 0.86
64 3263113 SA 2276 86.86% 12.61% 0.53% 0.81
English Mathematics Grade 4
21 3180352 SA 2318 90.47% 9.32% 0.22% 0.79
25 3166745 SA 2318 90.55% 9.32% 0.13% 0.89
26 3263435 OE 2318 80.50% 18.16% 1.34% 0.77
29 3263244 SA 2318 93.57% 6.38% 0.04% 0.88
32 3178873 SA 2318 89.99% 9.97% 0.04% 0.83
33 3166737 SA 2318 94.65% 5.22% 0.13% 0.88
36 3180238 SA 2318 95.86% 4.01% 0.13% 0.81
37 3181104 SA 2318 84.34% 15.49% 0.17% 0.83
39 3173399 SA 2304 87.11% 11.72% 1.17% 0.84
42 3263281 SA 2304 89.32% 10.24% 0.43% 0.86
47 3263014 SA 2304 87.24% 12.41% 0.35% 0.72
48 3178893 SA 2304 91.75% 6.55% 1.69% 0.90
55 3181075 OE 2304 75.22% 22.83% 1.95% 0.81
59 3263015 SA 2304 93.66% 5.95% 0.39% 0.90
60 3322909 SA 2304 96.48% 3.17% 0.35% 0.83
64 3263022 SA 2304 92.53% 7.29% 0.17% 0.92
65 3167381 SA 2304 82.16% 17.62% 0.22% 0.75
English Mathematics Grade 5
21 3263451 SA 2442 80.75% 18.51% 0.74% 0.78
22 3263000 SA 2442 94.14% 5.86% 0.00% 0.90
25 3262990 SA 2442 90.17% 9.42% 0.41% 0.78
26 3178182 OE 2442 73.30% 23.75% 2.95% 0.74
30 3263460 SA 2442 88.45% 10.61% 0.94% 0.78
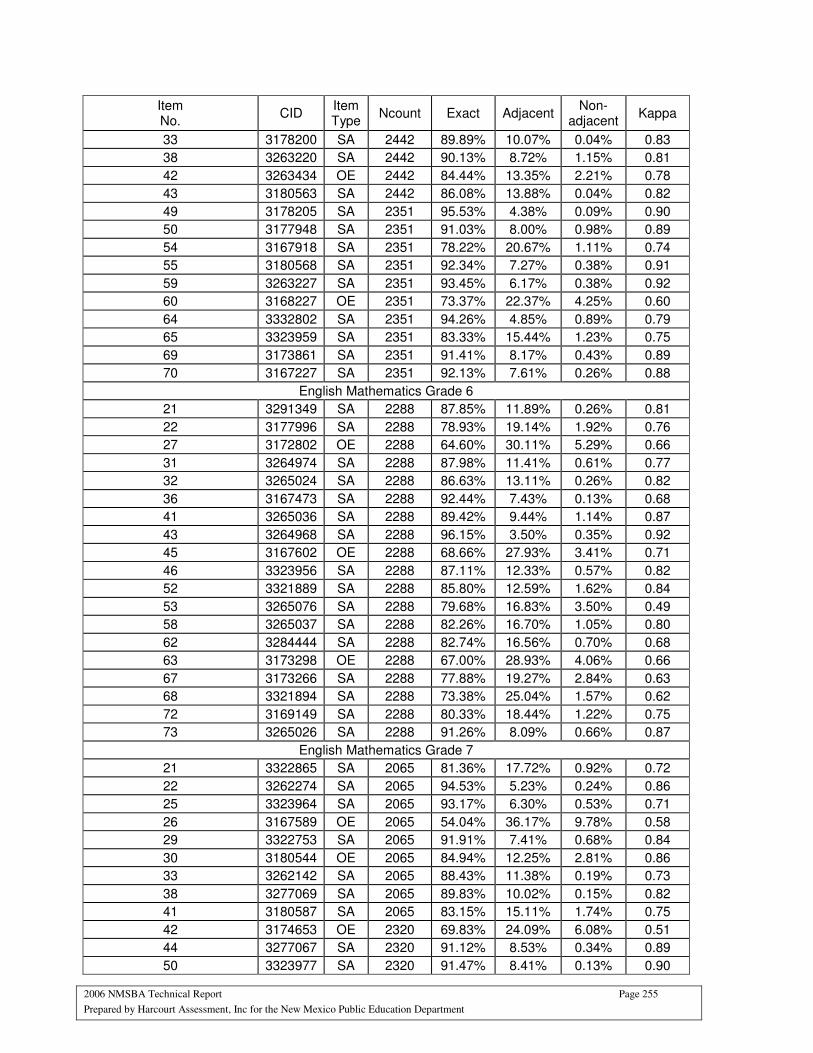
2006 NMSBA Technical Report Page 255
Prepared by Harcourt Assessment, Inc for the New Mexico Public Education Department
Item No.
CID Item Type
Ncount Exact Adjacent Non-
adjacent Kappa
33 3178200 SA 2442 89.89% 10.07% 0.04% 0.83
38 3263220 SA 2442 90.13% 8.72% 1.15% 0.81
42 3263434 OE 2442 84.44% 13.35% 2.21% 0.78
43 3180563 SA 2442 86.08% 13.88% 0.04% 0.82
49 3178205 SA 2351 95.53% 4.38% 0.09% 0.90
50 3177948 SA 2351 91.03% 8.00% 0.98% 0.89
54 3167918 SA 2351 78.22% 20.67% 1.11% 0.74
55 3180568 SA 2351 92.34% 7.27% 0.38% 0.91
59 3263227 SA 2351 93.45% 6.17% 0.38% 0.92
60 3168227 OE 2351 73.37% 22.37% 4.25% 0.60
64 3332802 SA 2351 94.26% 4.85% 0.89% 0.79
65 3323959 SA 2351 83.33% 15.44% 1.23% 0.75
69 3173861 SA 2351 91.41% 8.17% 0.43% 0.89
70 3167227 SA 2351 92.13% 7.61% 0.26% 0.88
English Mathematics Grade 6
21 3291349 SA 2288 87.85% 11.89% 0.26% 0.81
22 3177996 SA 2288 78.93% 19.14% 1.92% 0.76
27 3172802 OE 2288 64.60% 30.11% 5.29% 0.66
31 3264974 SA 2288 87.98% 11.41% 0.61% 0.77
32 3265024 SA 2288 86.63% 13.11% 0.26% 0.82
36 3167473 SA 2288 92.44% 7.43% 0.13% 0.68
41 3265036 SA 2288 89.42% 9.44% 1.14% 0.87
43 3264968 SA 2288 96.15% 3.50% 0.35% 0.92
45 3167602 OE 2288 68.66% 27.93% 3.41% 0.71
46 3323956 SA 2288 87.11% 12.33% 0.57% 0.82
52 3321889 SA 2288 85.80% 12.59% 1.62% 0.84
53 3265076 SA 2288 79.68% 16.83% 3.50% 0.49
58 3265037 SA 2288 82.26% 16.70% 1.05% 0.80
62 3284444 SA 2288 82.74% 16.56% 0.70% 0.68
63 3173298 OE 2288 67.00% 28.93% 4.06% 0.66
67 3173266 SA 2288 77.88% 19.27% 2.84% 0.63
68 3321894 SA 2288 73.38% 25.04% 1.57% 0.62
72 3169149 SA 2288 80.33% 18.44% 1.22% 0.75
73 3265026 SA 2288 91.26% 8.09% 0.66% 0.87
English Mathematics Grade 7
21 3322865 SA 2065 81.36% 17.72% 0.92% 0.72
22 3262274 SA 2065 94.53% 5.23% 0.24% 0.86
25 3323964 SA 2065 93.17% 6.30% 0.53% 0.71
26 3167589 OE 2065 54.04% 36.17% 9.78% 0.58
29 3322753 SA 2065 91.91% 7.41% 0.68% 0.84
30 3180544 OE 2065 84.94% 12.25% 2.81% 0.86
33 3262142 SA 2065 88.43% 11.38% 0.19% 0.73
38 3277069 SA 2065 89.83% 10.02% 0.15% 0.82
41 3180587 SA 2065 83.15% 15.11% 1.74% 0.75
42 3174653 OE 2320 69.83% 24.09% 6.08% 0.51
44 3277067 SA 2320 91.12% 8.53% 0.34% 0.89
50 3323977 SA 2320 91.47% 8.41% 0.13% 0.90
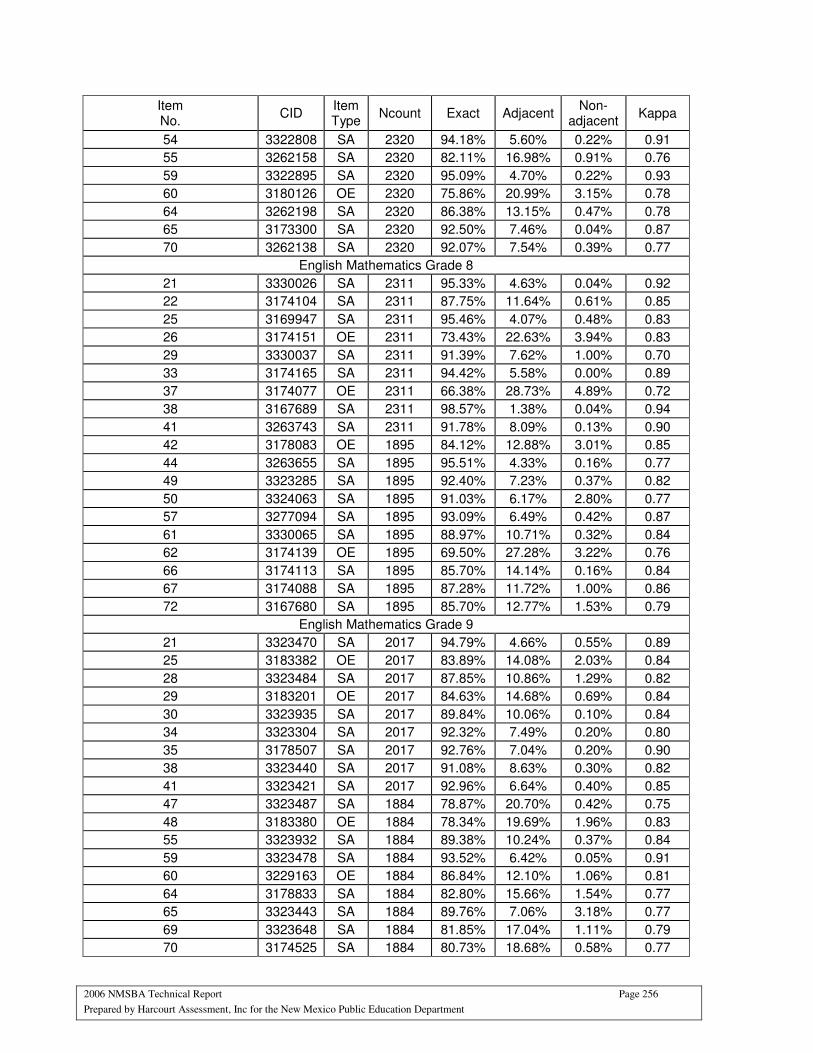
2006 NMSBA Technical Report Page 256
Prepared by Harcourt Assessment, Inc for the New Mexico Public Education Department
Item No.
CID Item Type
Ncount Exact Adjacent Non-
adjacent Kappa
54 3322808 SA 2320 94.18% 5.60% 0.22% 0.91
55 3262158 SA 2320 82.11% 16.98% 0.91% 0.76
59 3322895 SA 2320 95.09% 4.70% 0.22% 0.93
60 3180126 OE 2320 75.86% 20.99% 3.15% 0.78
64 3262198 SA 2320 86.38% 13.15% 0.47% 0.78
65 3173300 SA 2320 92.50% 7.46% 0.04% 0.87
70 3262138 SA 2320 92.07% 7.54% 0.39% 0.77
English Mathematics Grade 8
21 3330026 SA 2311 95.33% 4.63% 0.04% 0.92
22 3174104 SA 2311 87.75% 11.64% 0.61% 0.85
25 3169947 SA 2311 95.46% 4.07% 0.48% 0.83
26 3174151 OE 2311 73.43% 22.63% 3.94% 0.83
29 3330037 SA 2311 91.39% 7.62% 1.00% 0.70
33 3174165 SA 2311 94.42% 5.58% 0.00% 0.89
37 3174077 OE 2311 66.38% 28.73% 4.89% 0.72
38 3167689 SA 2311 98.57% 1.38% 0.04% 0.94
41 3263743 SA 2311 91.78% 8.09% 0.13% 0.90
42 3178083 OE 1895 84.12% 12.88% 3.01% 0.85
44 3263655 SA 1895 95.51% 4.33% 0.16% 0.77
49 3323285 SA 1895 92.40% 7.23% 0.37% 0.82
50 3324063 SA 1895 91.03% 6.17% 2.80% 0.77
57 3277094 SA 1895 93.09% 6.49% 0.42% 0.87
61 3330065 SA 1895 88.97% 10.71% 0.32% 0.84
62 3174139 OE 1895 69.50% 27.28% 3.22% 0.76
66 3174113 SA 1895 85.70% 14.14% 0.16% 0.84
67 3174088 SA 1895 87.28% 11.72% 1.00% 0.86
72 3167680 SA 1895 85.70% 12.77% 1.53% 0.79
English Mathematics Grade 9
21 3323470 SA 2017 94.79% 4.66% 0.55% 0.89
25 3183382 OE 2017 83.89% 14.08% 2.03% 0.84
28 3323484 SA 2017 87.85% 10.86% 1.29% 0.82
29 3183201 OE 2017 84.63% 14.68% 0.69% 0.84
30 3323935 SA 2017 89.84% 10.06% 0.10% 0.84
34 3323304 SA 2017 92.32% 7.49% 0.20% 0.80
35 3178507 SA 2017 92.76% 7.04% 0.20% 0.90
38 3323440 SA 2017 91.08% 8.63% 0.30% 0.82
41 3323421 SA 2017 92.96% 6.64% 0.40% 0.85
47 3323487 SA 1884 78.87% 20.70% 0.42% 0.75
48 3183380 OE 1884 78.34% 19.69% 1.96% 0.83
55 3323932 SA 1884 89.38% 10.24% 0.37% 0.84
59 3323478 SA 1884 93.52% 6.42% 0.05% 0.91
60 3229163 OE 1884 86.84% 12.10% 1.06% 0.81
64 3178833 SA 1884 82.80% 15.66% 1.54% 0.77
65 3323443 SA 1884 89.76% 7.06% 3.18% 0.77
69 3323648 SA 1884 81.85% 17.04% 1.11% 0.79
70 3174525 SA 1884 80.73% 18.68% 0.58% 0.77
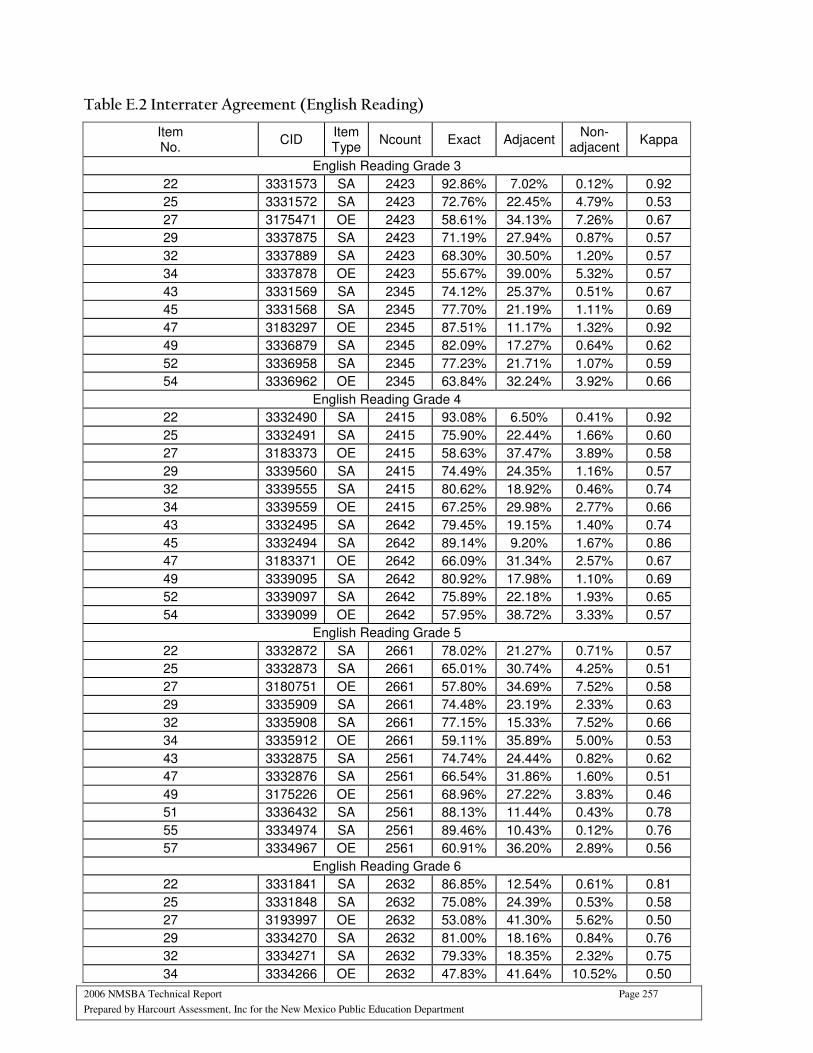
2006 NMSBA Technical Report Page 257
Prepared by Harcourt Assessment, Inc for the New Mexico Public Education Department
Table E.2 Interrater Agreement (English Reading)
Item No.
CID Item Type
Ncount Exact Adjacent Non-
adjacent Kappa
English Reading Grade 3
22 3331573 SA 2423 92.86% 7.02% 0.12% 0.92
25 3331572 SA 2423 72.76% 22.45% 4.79% 0.53
27 3175471 OE 2423 58.61% 34.13% 7.26% 0.67
29 3337875 SA 2423 71.19% 27.94% 0.87% 0.57
32 3337889 SA 2423 68.30% 30.50% 1.20% 0.57
34 3337878 OE 2423 55.67% 39.00% 5.32% 0.57
43 3331569 SA 2345 74.12% 25.37% 0.51% 0.67
45 3331568 SA 2345 77.70% 21.19% 1.11% 0.69
47 3183297 OE 2345 87.51% 11.17% 1.32% 0.92
49 3336879 SA 2345 82.09% 17.27% 0.64% 0.62
52 3336958 SA 2345 77.23% 21.71% 1.07% 0.59
54 3336962 OE 2345 63.84% 32.24% 3.92% 0.66
English Reading Grade 4
22 3332490 SA 2415 93.08% 6.50% 0.41% 0.92
25 3332491 SA 2415 75.90% 22.44% 1.66% 0.60
27 3183373 OE 2415 58.63% 37.47% 3.89% 0.58
29 3339560 SA 2415 74.49% 24.35% 1.16% 0.57
32 3339555 SA 2415 80.62% 18.92% 0.46% 0.74
34 3339559 OE 2415 67.25% 29.98% 2.77% 0.66
43 3332495 SA 2642 79.45% 19.15% 1.40% 0.74
45 3332494 SA 2642 89.14% 9.20% 1.67% 0.86
47 3183371 OE 2642 66.09% 31.34% 2.57% 0.67
49 3339095 SA 2642 80.92% 17.98% 1.10% 0.69
52 3339097 SA 2642 75.89% 22.18% 1.93% 0.65
54 3339099 OE 2642 57.95% 38.72% 3.33% 0.57
English Reading Grade 5
22 3332872 SA 2661 78.02% 21.27% 0.71% 0.57
25 3332873 SA 2661 65.01% 30.74% 4.25% 0.51
27 3180751 OE 2661 57.80% 34.69% 7.52% 0.58
29 3335909 SA 2661 74.48% 23.19% 2.33% 0.63
32 3335908 SA 2661 77.15% 15.33% 7.52% 0.66
34 3335912 OE 2661 59.11% 35.89% 5.00% 0.53
43 3332875 SA 2561 74.74% 24.44% 0.82% 0.62
47 3332876 SA 2561 66.54% 31.86% 1.60% 0.51
49 3175226 OE 2561 68.96% 27.22% 3.83% 0.46
51 3336432 SA 2561 88.13% 11.44% 0.43% 0.78
55 3334974 SA 2561 89.46% 10.43% 0.12% 0.76
57 3334967 OE 2561 60.91% 36.20% 2.89% 0.56
English Reading Grade 6
22 3331841 SA 2632 86.85% 12.54% 0.61% 0.81
25 3331848 SA 2632 75.08% 24.39% 0.53% 0.58
27 3193997 OE 2632 53.08% 41.30% 5.62% 0.50
29 3334270 SA 2632 81.00% 18.16% 0.84% 0.76
32 3334271 SA 2632 79.33% 18.35% 2.32% 0.75
34 3334266 OE 2632 47.83% 41.64% 10.52% 0.50
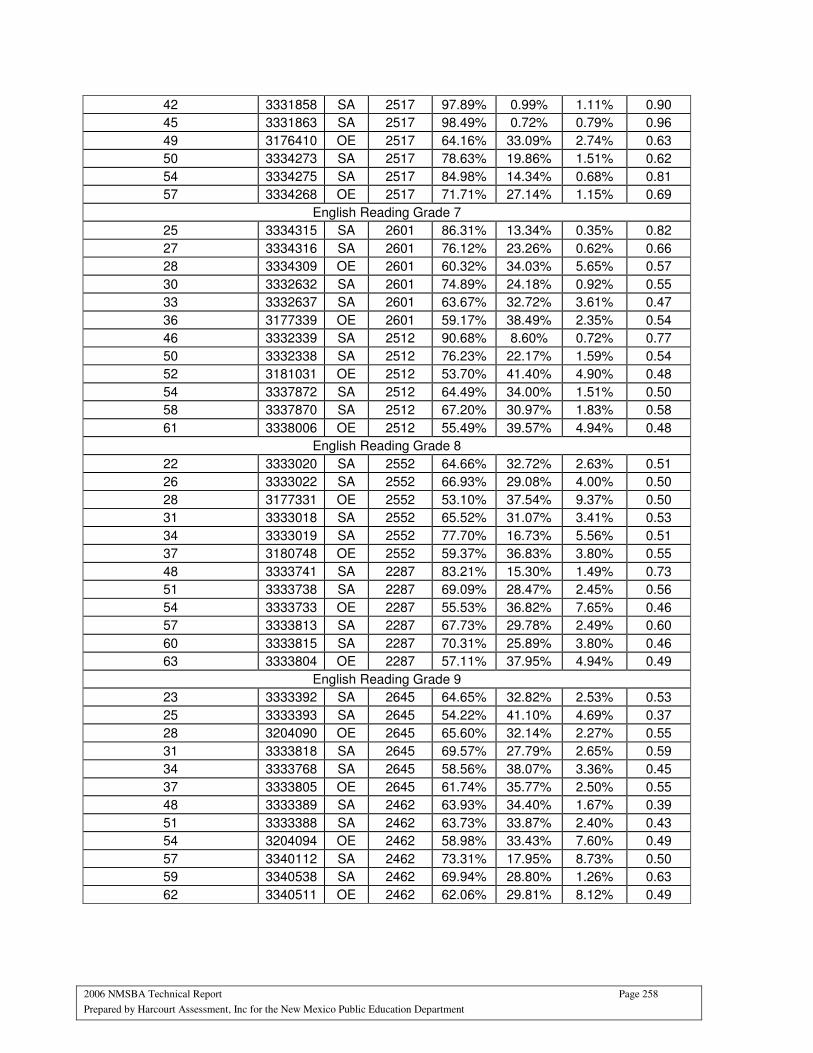
2006 NMSBA Technical Report Page 258
Prepared by Harcourt Assessment, Inc for the New Mexico Public Education Department
42 3331858 SA 2517 97.89% 0.99% 1.11% 0.90
45 3331863 SA 2517 98.49% 0.72% 0.79% 0.96
49 3176410 OE 2517 64.16% 33.09% 2.74% 0.63
50 3334273 SA 2517 78.63% 19.86% 1.51% 0.62
54 3334275 SA 2517 84.98% 14.34% 0.68% 0.81
57 3334268 OE 2517 71.71% 27.14% 1.15% 0.69
English Reading Grade 7
25 3334315 SA 2601 86.31% 13.34% 0.35% 0.82
27 3334316 SA 2601 76.12% 23.26% 0.62% 0.66
28 3334309 OE 2601 60.32% 34.03% 5.65% 0.57
30 3332632 SA 2601 74.89% 24.18% 0.92% 0.55
33 3332637 SA 2601 63.67% 32.72% 3.61% 0.47
36 3177339 OE 2601 59.17% 38.49% 2.35% 0.54
46 3332339 SA 2512 90.68% 8.60% 0.72% 0.77
50 3332338 SA 2512 76.23% 22.17% 1.59% 0.54
52 3181031 OE 2512 53.70% 41.40% 4.90% 0.48
54 3337872 SA 2512 64.49% 34.00% 1.51% 0.50
58 3337870 SA 2512 67.20% 30.97% 1.83% 0.58
61 3338006 OE 2512 55.49% 39.57% 4.94% 0.48
English Reading Grade 8
22 3333020 SA 2552 64.66% 32.72% 2.63% 0.51
26 3333022 SA 2552 66.93% 29.08% 4.00% 0.50
28 3177331 OE 2552 53.10% 37.54% 9.37% 0.50
31 3333018 SA 2552 65.52% 31.07% 3.41% 0.53
34 3333019 SA 2552 77.70% 16.73% 5.56% 0.51
37 3180748 OE 2552 59.37% 36.83% 3.80% 0.55
48 3333741 SA 2287 83.21% 15.30% 1.49% 0.73
51 3333738 SA 2287 69.09% 28.47% 2.45% 0.56
54 3333733 OE 2287 55.53% 36.82% 7.65% 0.46
57 3333813 SA 2287 67.73% 29.78% 2.49% 0.60
60 3333815 SA 2287 70.31% 25.89% 3.80% 0.46
63 3333804 OE 2287 57.11% 37.95% 4.94% 0.49
English Reading Grade 9
23 3333392 SA 2645 64.65% 32.82% 2.53% 0.53
25 3333393 SA 2645 54.22% 41.10% 4.69% 0.37
28 3204090 OE 2645 65.60% 32.14% 2.27% 0.55
31 3333818 SA 2645 69.57% 27.79% 2.65% 0.59
34 3333768 SA 2645 58.56% 38.07% 3.36% 0.45
37 3333805 OE 2645 61.74% 35.77% 2.50% 0.55
48 3333389 SA 2462 63.93% 34.40% 1.67% 0.39
51 3333388 SA 2462 63.73% 33.87% 2.40% 0.43
54 3204094 OE 2462 58.98% 33.43% 7.60% 0.49
57 3340112 SA 2462 73.31% 17.95% 8.73% 0.50
59 3340538 SA 2462 69.94% 28.80% 1.26% 0.63
62 3340511 OE 2462 62.06% 29.81% 8.12% 0.49
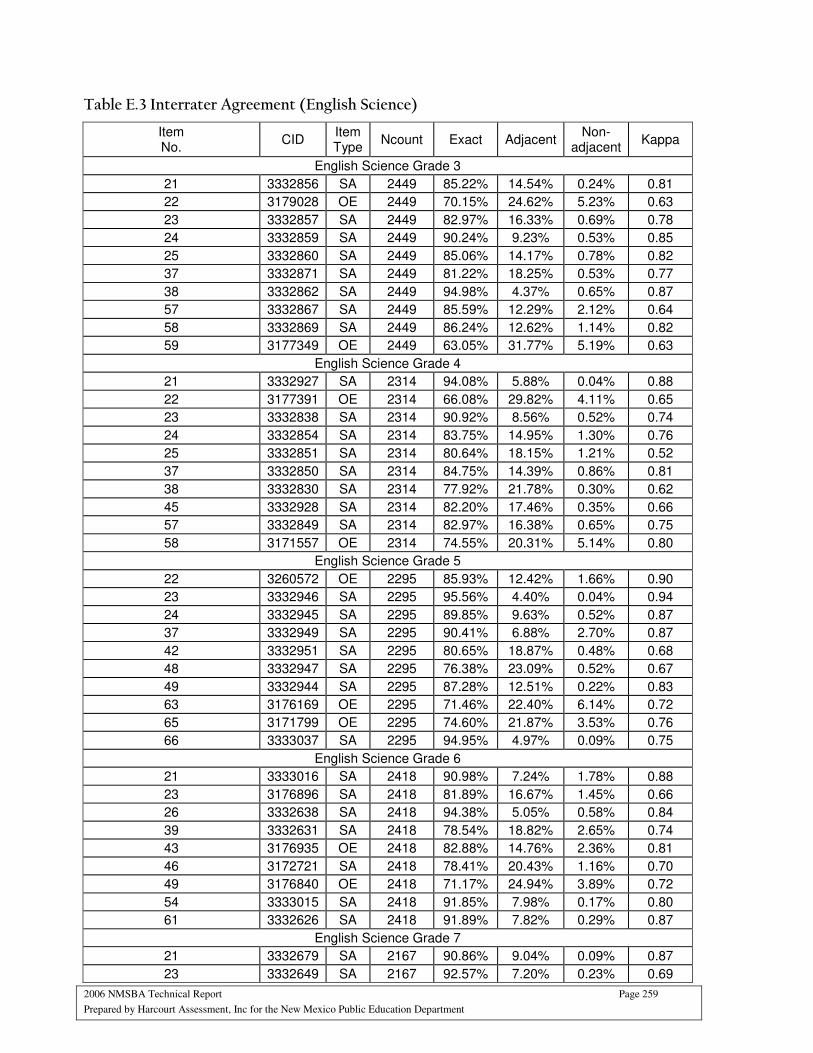
2006 NMSBA Technical Report Page 259
Prepared by Harcourt Assessment, Inc for the New Mexico Public Education Department
Table E.3 Interrater Agreement (English Science)
Item No.
CID Item Type
Ncount Exact Adjacent Non-
adjacent Kappa
English Science Grade 3
21 3332856 SA 2449 85.22% 14.54% 0.24% 0.81
22 3179028 OE 2449 70.15% 24.62% 5.23% 0.63
23 3332857 SA 2449 82.97% 16.33% 0.69% 0.78
24 3332859 SA 2449 90.24% 9.23% 0.53% 0.85
25 3332860 SA 2449 85.06% 14.17% 0.78% 0.82
37 3332871 SA 2449 81.22% 18.25% 0.53% 0.77
38 3332862 SA 2449 94.98% 4.37% 0.65% 0.87
57 3332867 SA 2449 85.59% 12.29% 2.12% 0.64
58 3332869 SA 2449 86.24% 12.62% 1.14% 0.82
59 3177349 OE 2449 63.05% 31.77% 5.19% 0.63
English Science Grade 4
21 3332927 SA 2314 94.08% 5.88% 0.04% 0.88
22 3177391 OE 2314 66.08% 29.82% 4.11% 0.65
23 3332838 SA 2314 90.92% 8.56% 0.52% 0.74
24 3332854 SA 2314 83.75% 14.95% 1.30% 0.76
25 3332851 SA 2314 80.64% 18.15% 1.21% 0.52
37 3332850 SA 2314 84.75% 14.39% 0.86% 0.81
38 3332830 SA 2314 77.92% 21.78% 0.30% 0.62
45 3332928 SA 2314 82.20% 17.46% 0.35% 0.66
57 3332849 SA 2314 82.97% 16.38% 0.65% 0.75
58 3171557 OE 2314 74.55% 20.31% 5.14% 0.80
English Science Grade 5
22 3260572 OE 2295 85.93% 12.42% 1.66% 0.90
23 3332946 SA 2295 95.56% 4.40% 0.04% 0.94
24 3332945 SA 2295 89.85% 9.63% 0.52% 0.87
37 3332949 SA 2295 90.41% 6.88% 2.70% 0.87
42 3332951 SA 2295 80.65% 18.87% 0.48% 0.68
48 3332947 SA 2295 76.38% 23.09% 0.52% 0.67
49 3332944 SA 2295 87.28% 12.51% 0.22% 0.83
63 3176169 OE 2295 71.46% 22.40% 6.14% 0.72
65 3171799 OE 2295 74.60% 21.87% 3.53% 0.76
66 3333037 SA 2295 94.95% 4.97% 0.09% 0.75
English Science Grade 6
21 3333016 SA 2418 90.98% 7.24% 1.78% 0.88
23 3176896 SA 2418 81.89% 16.67% 1.45% 0.66
26 3332638 SA 2418 94.38% 5.05% 0.58% 0.84
39 3332631 SA 2418 78.54% 18.82% 2.65% 0.74
43 3176935 OE 2418 82.88% 14.76% 2.36% 0.81
46 3172721 SA 2418 78.41% 20.43% 1.16% 0.70
49 3176840 OE 2418 71.17% 24.94% 3.89% 0.72
54 3333015 SA 2418 91.85% 7.98% 0.17% 0.80
61 3332626 SA 2418 91.89% 7.82% 0.29% 0.87
English Science Grade 7
21 3332679 SA 2167 90.86% 9.04% 0.09% 0.87
23 3332649 SA 2167 92.57% 7.20% 0.23% 0.69
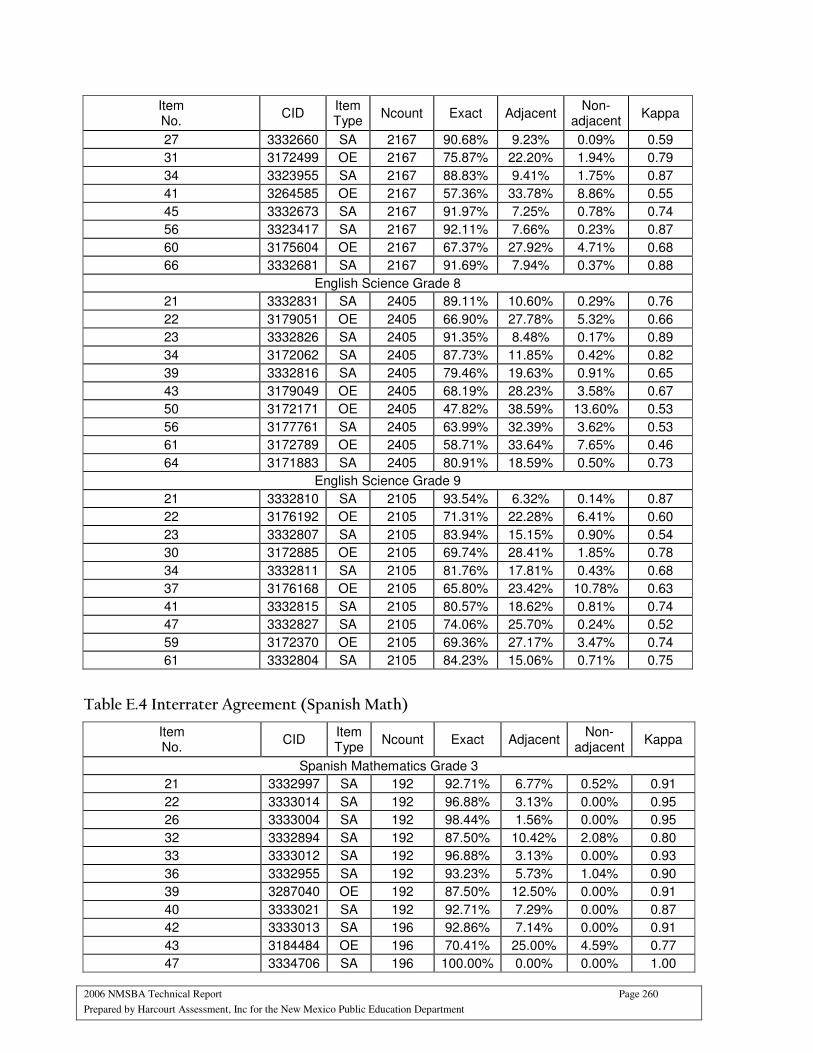
2006 NMSBA Technical Report Page 260
Prepared by Harcourt Assessment, Inc for the New Mexico Public Education Department
Item No.
CID Item Type
Ncount Exact Adjacent Non-
adjacent Kappa
27 3332660 SA 2167 90.68% 9.23% 0.09% 0.59
31 3172499 OE 2167 75.87% 22.20% 1.94% 0.79
34 3323955 SA 2167 88.83% 9.41% 1.75% 0.87
41 3264585 OE 2167 57.36% 33.78% 8.86% 0.55
45 3332673 SA 2167 91.97% 7.25% 0.78% 0.74
56 3323417 SA 2167 92.11% 7.66% 0.23% 0.87
60 3175604 OE 2167 67.37% 27.92% 4.71% 0.68
66 3332681 SA 2167 91.69% 7.94% 0.37% 0.88
English Science Grade 8
21 3332831 SA 2405 89.11% 10.60% 0.29% 0.76
22 3179051 OE 2405 66.90% 27.78% 5.32% 0.66
23 3332826 SA 2405 91.35% 8.48% 0.17% 0.89
34 3172062 SA 2405 87.73% 11.85% 0.42% 0.82
39 3332816 SA 2405 79.46% 19.63% 0.91% 0.65
43 3179049 OE 2405 68.19% 28.23% 3.58% 0.67
50 3172171 OE 2405 47.82% 38.59% 13.60% 0.53
56 3177761 SA 2405 63.99% 32.39% 3.62% 0.53
61 3172789 OE 2405 58.71% 33.64% 7.65% 0.46
64 3171883 SA 2405 80.91% 18.59% 0.50% 0.73
English Science Grade 9
21 3332810 SA 2105 93.54% 6.32% 0.14% 0.87
22 3176192 OE 2105 71.31% 22.28% 6.41% 0.60
23 3332807 SA 2105 83.94% 15.15% 0.90% 0.54
30 3172885 OE 2105 69.74% 28.41% 1.85% 0.78
34 3332811 SA 2105 81.76% 17.81% 0.43% 0.68
37 3176168 OE 2105 65.80% 23.42% 10.78% 0.63
41 3332815 SA 2105 80.57% 18.62% 0.81% 0.74
47 3332827 SA 2105 74.06% 25.70% 0.24% 0.52
59 3172370 OE 2105 69.36% 27.17% 3.47% 0.74
61 3332804 SA 2105 84.23% 15.06% 0.71% 0.75
Table E.4 Interrater Agreement (Spanish Math)
Item No.
CID Item Type
Ncount Exact Adjacent Non-
adjacent Kappa
Spanish Mathematics Grade 3
21 3332997 SA 192 92.71% 6.77% 0.52% 0.91
22 3333014 SA 192 96.88% 3.13% 0.00% 0.95
26 3333004 SA 192 98.44% 1.56% 0.00% 0.95
32 3332894 SA 192 87.50% 10.42% 2.08% 0.80
33 3333012 SA 192 96.88% 3.13% 0.00% 0.93
36 3332955 SA 192 93.23% 5.73% 1.04% 0.90
39 3287040 OE 192 87.50% 12.50% 0.00% 0.91
40 3333021 SA 192 92.71% 7.29% 0.00% 0.87
42 3333013 SA 196 92.86% 7.14% 0.00% 0.91
43 3184484 OE 196 70.41% 25.00% 4.59% 0.77
47 3334706 SA 196 100.00% 0.00% 0.00% 1.00
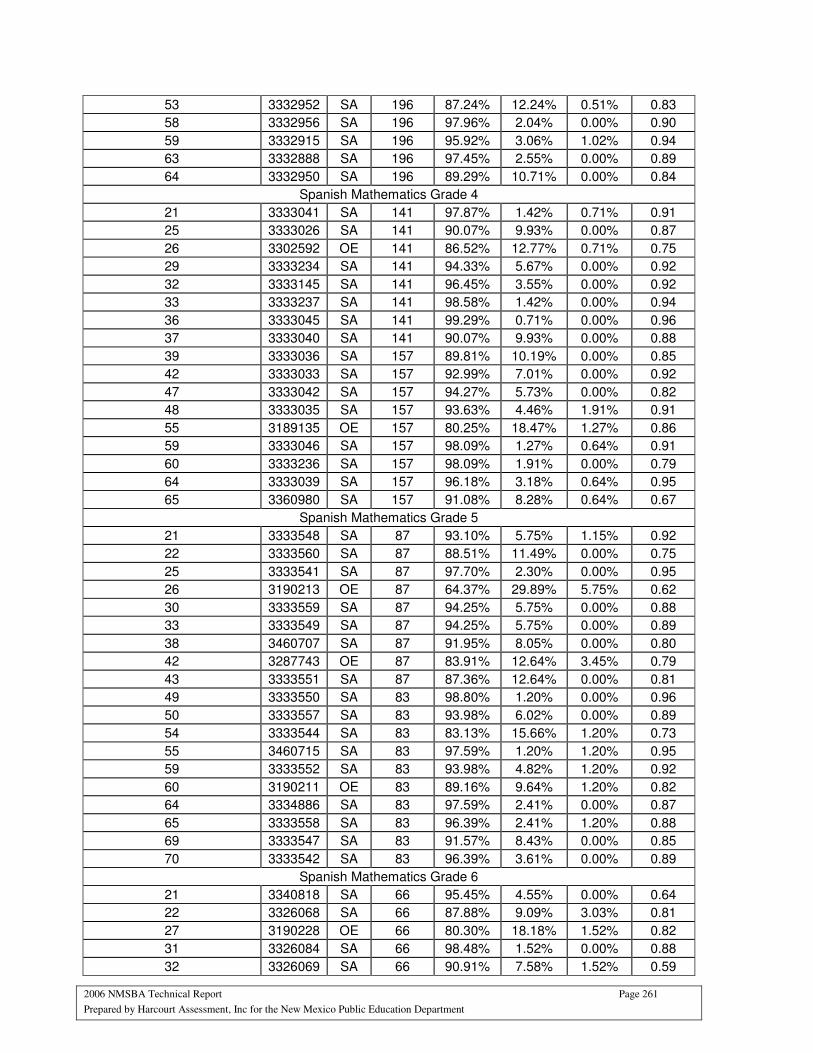
2006 NMSBA Technical Report Page 261
Prepared by Harcourt Assessment, Inc for the New Mexico Public Education Department
53 3332952 SA 196 87.24% 12.24% 0.51% 0.83
58 3332956 SA 196 97.96% 2.04% 0.00% 0.90
59 3332915 SA 196 95.92% 3.06% 1.02% 0.94
63 3332888 SA 196 97.45% 2.55% 0.00% 0.89
64 3332950 SA 196 89.29% 10.71% 0.00% 0.84
Spanish Mathematics Grade 4
21 3333041 SA 141 97.87% 1.42% 0.71% 0.91
25 3333026 SA 141 90.07% 9.93% 0.00% 0.87
26 3302592 OE 141 86.52% 12.77% 0.71% 0.75
29 3333234 SA 141 94.33% 5.67% 0.00% 0.92
32 3333145 SA 141 96.45% 3.55% 0.00% 0.92
33 3333237 SA 141 98.58% 1.42% 0.00% 0.94
36 3333045 SA 141 99.29% 0.71% 0.00% 0.96
37 3333040 SA 141 90.07% 9.93% 0.00% 0.88
39 3333036 SA 157 89.81% 10.19% 0.00% 0.85
42 3333033 SA 157 92.99% 7.01% 0.00% 0.92
47 3333042 SA 157 94.27% 5.73% 0.00% 0.82
48 3333035 SA 157 93.63% 4.46% 1.91% 0.91
55 3189135 OE 157 80.25% 18.47% 1.27% 0.86
59 3333046 SA 157 98.09% 1.27% 0.64% 0.91
60 3333236 SA 157 98.09% 1.91% 0.00% 0.79
64 3333039 SA 157 96.18% 3.18% 0.64% 0.95
65 3360980 SA 157 91.08% 8.28% 0.64% 0.67
Spanish Mathematics Grade 5
21 3333548 SA 87 93.10% 5.75% 1.15% 0.92
22 3333560 SA 87 88.51% 11.49% 0.00% 0.75
25 3333541 SA 87 97.70% 2.30% 0.00% 0.95
26 3190213 OE 87 64.37% 29.89% 5.75% 0.62
30 3333559 SA 87 94.25% 5.75% 0.00% 0.88
33 3333549 SA 87 94.25% 5.75% 0.00% 0.89
38 3460707 SA 87 91.95% 8.05% 0.00% 0.80
42 3287743 OE 87 83.91% 12.64% 3.45% 0.79
43 3333551 SA 87 87.36% 12.64% 0.00% 0.81
49 3333550 SA 83 98.80% 1.20% 0.00% 0.96
50 3333557 SA 83 93.98% 6.02% 0.00% 0.89
54 3333544 SA 83 83.13% 15.66% 1.20% 0.73
55 3460715 SA 83 97.59% 1.20% 1.20% 0.95
59 3333552 SA 83 93.98% 4.82% 1.20% 0.92
60 3190211 OE 83 89.16% 9.64% 1.20% 0.82
64 3334886 SA 83 97.59% 2.41% 0.00% 0.87
65 3333558 SA 83 96.39% 2.41% 1.20% 0.88
69 3333547 SA 83 91.57% 8.43% 0.00% 0.85
70 3333542 SA 83 96.39% 3.61% 0.00% 0.89
Spanish Mathematics Grade 6
21 3340818 SA 66 95.45% 4.55% 0.00% 0.64
22 3326068 SA 66 87.88% 9.09% 3.03% 0.81
27 3190228 OE 66 80.30% 18.18% 1.52% 0.82
31 3326084 SA 66 98.48% 1.52% 0.00% 0.88
32 3326069 SA 66 90.91% 7.58% 1.52% 0.59
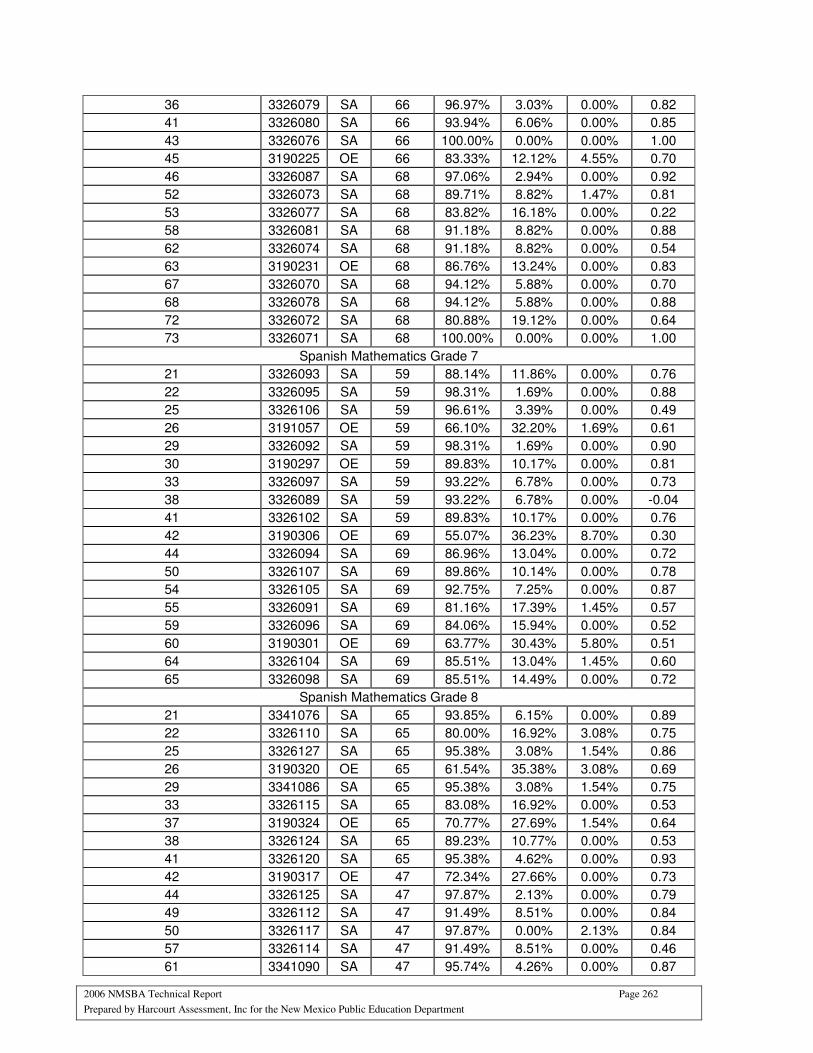
2006 NMSBA Technical Report Page 262
Prepared by Harcourt Assessment, Inc for the New Mexico Public Education Department
36 3326079 SA 66 96.97% 3.03% 0.00% 0.82
41 3326080 SA 66 93.94% 6.06% 0.00% 0.85
43 3326076 SA 66 100.00% 0.00% 0.00% 1.00
45 3190225 OE 66 83.33% 12.12% 4.55% 0.70
46 3326087 SA 68 97.06% 2.94% 0.00% 0.92
52 3326073 SA 68 89.71% 8.82% 1.47% 0.81
53 3326077 SA 68 83.82% 16.18% 0.00% 0.22
58 3326081 SA 68 91.18% 8.82% 0.00% 0.88
62 3326074 SA 68 91.18% 8.82% 0.00% 0.54
63 3190231 OE 68 86.76% 13.24% 0.00% 0.83
67 3326070 SA 68 94.12% 5.88% 0.00% 0.70
68 3326078 SA 68 94.12% 5.88% 0.00% 0.88
72 3326072 SA 68 80.88% 19.12% 0.00% 0.64
73 3326071 SA 68 100.00% 0.00% 0.00% 1.00
Spanish Mathematics Grade 7
21 3326093 SA 59 88.14% 11.86% 0.00% 0.76
22 3326095 SA 59 98.31% 1.69% 0.00% 0.88
25 3326106 SA 59 96.61% 3.39% 0.00% 0.49
26 3191057 OE 59 66.10% 32.20% 1.69% 0.61
29 3326092 SA 59 98.31% 1.69% 0.00% 0.90
30 3190297 OE 59 89.83% 10.17% 0.00% 0.81
33 3326097 SA 59 93.22% 6.78% 0.00% 0.73
38 3326089 SA 59 93.22% 6.78% 0.00% -0.04
41 3326102 SA 59 89.83% 10.17% 0.00% 0.76
42 3190306 OE 69 55.07% 36.23% 8.70% 0.30
44 3326094 SA 69 86.96% 13.04% 0.00% 0.72
50 3326107 SA 69 89.86% 10.14% 0.00% 0.78
54 3326105 SA 69 92.75% 7.25% 0.00% 0.87
55 3326091 SA 69 81.16% 17.39% 1.45% 0.57
59 3326096 SA 69 84.06% 15.94% 0.00% 0.52
60 3190301 OE 69 63.77% 30.43% 5.80% 0.51
64 3326104 SA 69 85.51% 13.04% 1.45% 0.60
65 3326098 SA 69 85.51% 14.49% 0.00% 0.72
Spanish Mathematics Grade 8
21 3341076 SA 65 93.85% 6.15% 0.00% 0.89
22 3326110 SA 65 80.00% 16.92% 3.08% 0.75
25 3326127 SA 65 95.38% 3.08% 1.54% 0.86
26 3190320 OE 65 61.54% 35.38% 3.08% 0.69
29 3341086 SA 65 95.38% 3.08% 1.54% 0.75
33 3326115 SA 65 83.08% 16.92% 0.00% 0.53
37 3190324 OE 65 70.77% 27.69% 1.54% 0.64
38 3326124 SA 65 89.23% 10.77% 0.00% 0.53
41 3326120 SA 65 95.38% 4.62% 0.00% 0.93
42 3190317 OE 47 72.34% 27.66% 0.00% 0.73
44 3326125 SA 47 97.87% 2.13% 0.00% 0.79
49 3326112 SA 47 91.49% 8.51% 0.00% 0.84
50 3326117 SA 47 97.87% 0.00% 2.13% 0.84
57 3326114 SA 47 91.49% 8.51% 0.00% 0.46
61 3341090 SA 47 95.74% 4.26% 0.00% 0.87
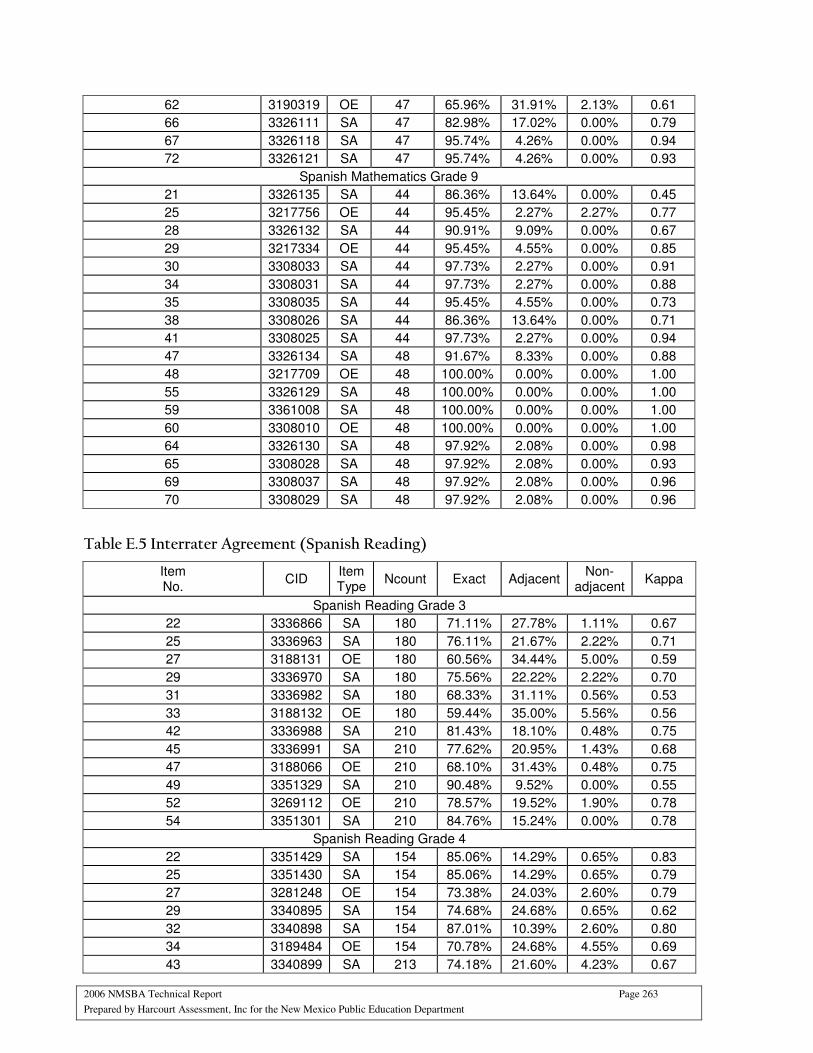
2006 NMSBA Technical Report Page 263
Prepared by Harcourt Assessment, Inc for the New Mexico Public Education Department
62 3190319 OE 47 65.96% 31.91% 2.13% 0.61
66 3326111 SA 47 82.98% 17.02% 0.00% 0.79
67 3326118 SA 47 95.74% 4.26% 0.00% 0.94
72 3326121 SA 47 95.74% 4.26% 0.00% 0.93
Spanish Mathematics Grade 9
21 3326135 SA 44 86.36% 13.64% 0.00% 0.45
25 3217756 OE 44 95.45% 2.27% 2.27% 0.77
28 3326132 SA 44 90.91% 9.09% 0.00% 0.67
29 3217334 OE 44 95.45% 4.55% 0.00% 0.85
30 3308033 SA 44 97.73% 2.27% 0.00% 0.91
34 3308031 SA 44 97.73% 2.27% 0.00% 0.88
35 3308035 SA 44 95.45% 4.55% 0.00% 0.73
38 3308026 SA 44 86.36% 13.64% 0.00% 0.71
41 3308025 SA 44 97.73% 2.27% 0.00% 0.94
47 3326134 SA 48 91.67% 8.33% 0.00% 0.88
48 3217709 OE 48 100.00% 0.00% 0.00% 1.00
55 3326129 SA 48 100.00% 0.00% 0.00% 1.00
59 3361008 SA 48 100.00% 0.00% 0.00% 1.00
60 3308010 OE 48 100.00% 0.00% 0.00% 1.00
64 3326130 SA 48 97.92% 2.08% 0.00% 0.98
65 3308028 SA 48 97.92% 2.08% 0.00% 0.93
69 3308037 SA 48 97.92% 2.08% 0.00% 0.96
70 3308029 SA 48 97.92% 2.08% 0.00% 0.96
Table E.5 Interrater Agreement (Spanish Reading)
Item No.
CID Item Type
Ncount Exact Adjacent Non-
adjacent Kappa
Spanish Reading Grade 3
22 3336866 SA 180 71.11% 27.78% 1.11% 0.67
25 3336963 SA 180 76.11% 21.67% 2.22% 0.71
27 3188131 OE 180 60.56% 34.44% 5.00% 0.59
29 3336970 SA 180 75.56% 22.22% 2.22% 0.70
31 3336982 SA 180 68.33% 31.11% 0.56% 0.53
33 3188132 OE 180 59.44% 35.00% 5.56% 0.56
42 3336988 SA 210 81.43% 18.10% 0.48% 0.75
45 3336991 SA 210 77.62% 20.95% 1.43% 0.68
47 3188066 OE 210 68.10% 31.43% 0.48% 0.75
49 3351329 SA 210 90.48% 9.52% 0.00% 0.55
52 3269112 OE 210 78.57% 19.52% 1.90% 0.78
54 3351301 SA 210 84.76% 15.24% 0.00% 0.78
Spanish Reading Grade 4
22 3351429 SA 154 85.06% 14.29% 0.65% 0.83
25 3351430 SA 154 85.06% 14.29% 0.65% 0.79
27 3281248 OE 154 73.38% 24.03% 2.60% 0.79
29 3340895 SA 154 74.68% 24.68% 0.65% 0.62
32 3340898 SA 154 87.01% 10.39% 2.60% 0.80
34 3189484 OE 154 70.78% 24.68% 4.55% 0.69
43 3340899 SA 213 74.18% 21.60% 4.23% 0.67
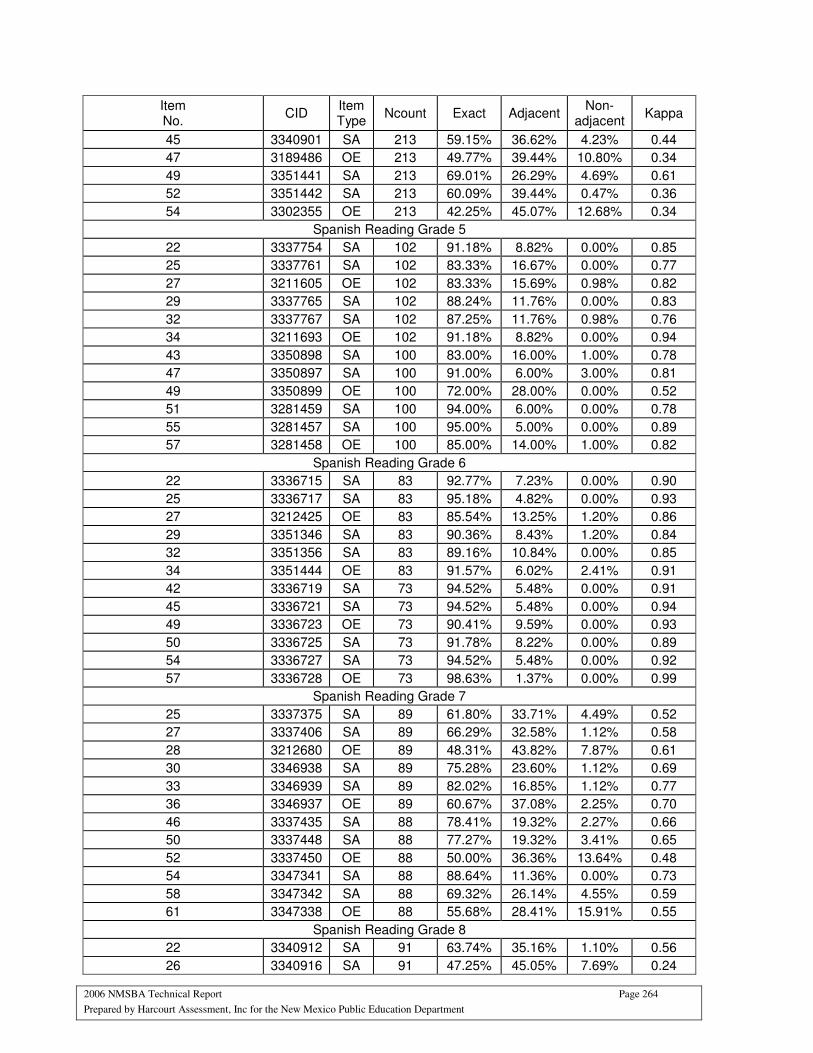
2006 NMSBA Technical Report Page 264
Prepared by Harcourt Assessment, Inc for the New Mexico Public Education Department
Item No.
CID Item Type
Ncount Exact Adjacent Non-
adjacent Kappa
45 3340901 SA 213 59.15% 36.62% 4.23% 0.44
47 3189486 OE 213 49.77% 39.44% 10.80% 0.34
49 3351441 SA 213 69.01% 26.29% 4.69% 0.61
52 3351442 SA 213 60.09% 39.44% 0.47% 0.36
54 3302355 OE 213 42.25% 45.07% 12.68% 0.34
Spanish Reading Grade 5
22 3337754 SA 102 91.18% 8.82% 0.00% 0.85
25 3337761 SA 102 83.33% 16.67% 0.00% 0.77
27 3211605 OE 102 83.33% 15.69% 0.98% 0.82
29 3337765 SA 102 88.24% 11.76% 0.00% 0.83
32 3337767 SA 102 87.25% 11.76% 0.98% 0.76
34 3211693 OE 102 91.18% 8.82% 0.00% 0.94
43 3350898 SA 100 83.00% 16.00% 1.00% 0.78
47 3350897 SA 100 91.00% 6.00% 3.00% 0.81
49 3350899 OE 100 72.00% 28.00% 0.00% 0.52
51 3281459 SA 100 94.00% 6.00% 0.00% 0.78
55 3281457 SA 100 95.00% 5.00% 0.00% 0.89
57 3281458 OE 100 85.00% 14.00% 1.00% 0.82
Spanish Reading Grade 6
22 3336715 SA 83 92.77% 7.23% 0.00% 0.90
25 3336717 SA 83 95.18% 4.82% 0.00% 0.93
27 3212425 OE 83 85.54% 13.25% 1.20% 0.86
29 3351346 SA 83 90.36% 8.43% 1.20% 0.84
32 3351356 SA 83 89.16% 10.84% 0.00% 0.85
34 3351444 OE 83 91.57% 6.02% 2.41% 0.91
42 3336719 SA 73 94.52% 5.48% 0.00% 0.91
45 3336721 SA 73 94.52% 5.48% 0.00% 0.94
49 3336723 OE 73 90.41% 9.59% 0.00% 0.93
50 3336725 SA 73 91.78% 8.22% 0.00% 0.89
54 3336727 SA 73 94.52% 5.48% 0.00% 0.92
57 3336728 OE 73 98.63% 1.37% 0.00% 0.99
Spanish Reading Grade 7
25 3337375 SA 89 61.80% 33.71% 4.49% 0.52
27 3337406 SA 89 66.29% 32.58% 1.12% 0.58
28 3212680 OE 89 48.31% 43.82% 7.87% 0.61
30 3346938 SA 89 75.28% 23.60% 1.12% 0.69
33 3346939 SA 89 82.02% 16.85% 1.12% 0.77
36 3346937 OE 89 60.67% 37.08% 2.25% 0.70
46 3337435 SA 88 78.41% 19.32% 2.27% 0.66
50 3337448 SA 88 77.27% 19.32% 3.41% 0.65
52 3337450 OE 88 50.00% 36.36% 13.64% 0.48
54 3347341 SA 88 88.64% 11.36% 0.00% 0.73
58 3347342 SA 88 69.32% 26.14% 4.55% 0.59
61 3347338 OE 88 55.68% 28.41% 15.91% 0.55
Spanish Reading Grade 8
22 3340912 SA 91 63.74% 35.16% 1.10% 0.56
26 3340916 SA 91 47.25% 45.05% 7.69% 0.24

2006 NMSBA Technical Report Page 265
Prepared by Harcourt Assessment, Inc for the New Mexico Public Education Department
Item No.
CID Item Type
Ncount Exact Adjacent Non-
adjacent Kappa
28 3212932 OE 91 70.33% 28.57% 1.10% 0.74
31 3341005 SA 91 49.45% 47.25% 3.30% 0.35
34 3341006 SA 91 65.93% 31.87% 2.20% 0.43
37 3212931 OE 91 37.36% 53.85% 8.79% 0.38
48 3351015 SA 84 95.24% 4.76% 0.00% 0.94
51 3351016 SA 84 88.10% 11.90% 0.00% 0.81
54 3351013 OE 84 76.19% 22.62% 1.19% 0.73
57 3281590 SA 84 78.57% 20.24% 1.19% 0.52
60 3281589 SA 84 54.76% 42.86% 2.38% 0.44
63 3281591 OE 84 57.14% 40.48% 2.38% 0.53
Spanish Reading Grade 9
23 3337704 SA 68 89.71% 8.82% 1.47% 0.87
25 3337708 SA 68 79.41% 20.59% 0.00% 0.66
28 3212748 OE 68 51.47% 42.65% 5.88% 0.33
31 3351347 SA 68 57.35% 36.76% 5.88% 0.41
34 3351348 SA 68 57.35% 42.65% 0.00% 0.30
37 3303238 OE 68 60.29% 30.88% 8.82% 0.61
48 3337723 SA 55 83.64% 16.36% 0.00% 0.83
51 3337726 SA 55 63.64% 34.55% 1.82% 0.56
54 3212807 OE 55 65.45% 29.09% 5.45% 0.62
57 3347884 SA 55 85.45% 14.55% 0.00% 0.84
59 3347886 SA 55 78.18% 21.82% 0.00% 0.75
62 3347882 SA 55 89.09% 9.09% 1.82% 0.80
Table E.6 Interrater Agreement (Spanish Science)
Item No.
CID Item Type
Ncount Exact Adjacent Non-
adjacent Kappa
Spanish Science Grade 3
21 3337523 SA 285 90.18% 9.12% 0.70% 0.89
22 3187568 OE 285 71.23% 25.96% 2.81% 0.55
23 3337524 SA 285 79.65% 19.30% 1.05% 0.63
24 3337525 SA 285 87.72% 12.28% 0.00% 0.72
25 3337526 SA 285 84.91% 14.74% 0.35% 0.79
37 3337527 SA 285 68.07% 28.77% 3.16% 0.53
38 3337528 SA 285 95.44% 3.86% 0.70% 0.69
57 3337531 SA 285 88.42% 9.82% 1.75% 0.47
58 3337532 SA 285 87.72% 12.28% 0.00% 0.61
59 3187628 OE 285 62.81% 27.02% 10.18% 0.51
Spanish Science Grade 4
21 3341109 SA 119 67.23% 27.73% 5.04% 0.54
22 3208699 OE 119 52.94% 19.33% 27.73% 0.43
23 3341104 SA 119 76.47% 10.08% 13.45% 0.26
24 3341106 SA 119 69.75% 21.01% 9.24% 0.56
25 3341107 SA 119 60.50% 17.65% 21.85% 0.18
37 3341108 SA 119 66.39% 20.17% 13.45% 0.39
38 3341102 SA 119 54.62% 36.13% 9.24% 0.36
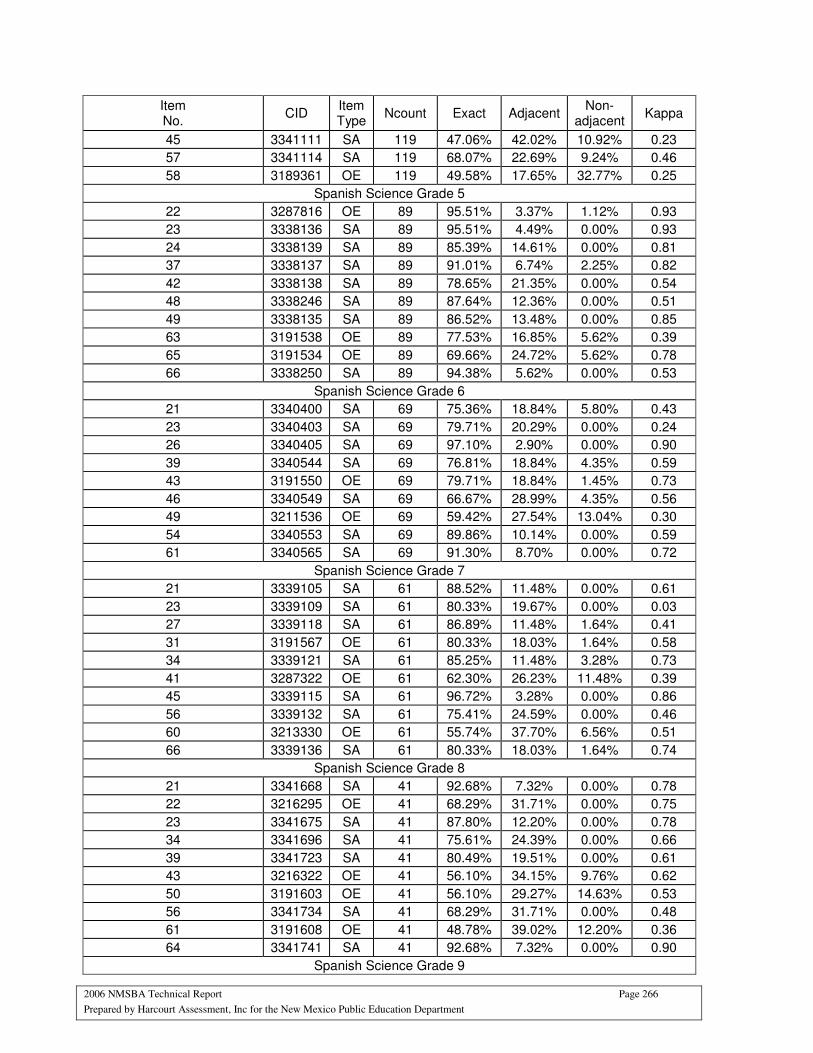
2006 NMSBA Technical Report Page 266
Prepared by Harcourt Assessment, Inc for the New Mexico Public Education Department
Item No.
CID Item Type
Ncount Exact Adjacent Non-
adjacent Kappa
45 3341111 SA 119 47.06% 42.02% 10.92% 0.23
57 3341114 SA 119 68.07% 22.69% 9.24% 0.46
58 3189361 OE 119 49.58% 17.65% 32.77% 0.25
Spanish Science Grade 5
22 3287816 OE 89 95.51% 3.37% 1.12% 0.93
23 3338136 SA 89 95.51% 4.49% 0.00% 0.93
24 3338139 SA 89 85.39% 14.61% 0.00% 0.81
37 3338137 SA 89 91.01% 6.74% 2.25% 0.82
42 3338138 SA 89 78.65% 21.35% 0.00% 0.54
48 3338246 SA 89 87.64% 12.36% 0.00% 0.51
49 3338135 SA 89 86.52% 13.48% 0.00% 0.85
63 3191538 OE 89 77.53% 16.85% 5.62% 0.39
65 3191534 OE 89 69.66% 24.72% 5.62% 0.78
66 3338250 SA 89 94.38% 5.62% 0.00% 0.53
Spanish Science Grade 6
21 3340400 SA 69 75.36% 18.84% 5.80% 0.43
23 3340403 SA 69 79.71% 20.29% 0.00% 0.24
26 3340405 SA 69 97.10% 2.90% 0.00% 0.90
39 3340544 SA 69 76.81% 18.84% 4.35% 0.59
43 3191550 OE 69 79.71% 18.84% 1.45% 0.73
46 3340549 SA 69 66.67% 28.99% 4.35% 0.56
49 3211536 OE 69 59.42% 27.54% 13.04% 0.30
54 3340553 SA 69 89.86% 10.14% 0.00% 0.59
61 3340565 SA 69 91.30% 8.70% 0.00% 0.72
Spanish Science Grade 7
21 3339105 SA 61 88.52% 11.48% 0.00% 0.61
23 3339109 SA 61 80.33% 19.67% 0.00% 0.03
27 3339118 SA 61 86.89% 11.48% 1.64% 0.41
31 3191567 OE 61 80.33% 18.03% 1.64% 0.58
34 3339121 SA 61 85.25% 11.48% 3.28% 0.73
41 3287322 OE 61 62.30% 26.23% 11.48% 0.39
45 3339115 SA 61 96.72% 3.28% 0.00% 0.86
56 3339132 SA 61 75.41% 24.59% 0.00% 0.46
60 3213330 OE 61 55.74% 37.70% 6.56% 0.51
66 3339136 SA 61 80.33% 18.03% 1.64% 0.74
Spanish Science Grade 8
21 3341668 SA 41 92.68% 7.32% 0.00% 0.78
22 3216295 OE 41 68.29% 31.71% 0.00% 0.75
23 3341675 SA 41 87.80% 12.20% 0.00% 0.78
34 3341696 SA 41 75.61% 24.39% 0.00% 0.66
39 3341723 SA 41 80.49% 19.51% 0.00% 0.61
43 3216322 OE 41 56.10% 34.15% 9.76% 0.62
50 3191603 OE 41 56.10% 29.27% 14.63% 0.53
56 3341734 SA 41 68.29% 31.71% 0.00% 0.48
61 3191608 OE 41 48.78% 39.02% 12.20% 0.36
64 3341741 SA 41 92.68% 7.32% 0.00% 0.90
Spanish Science Grade 9
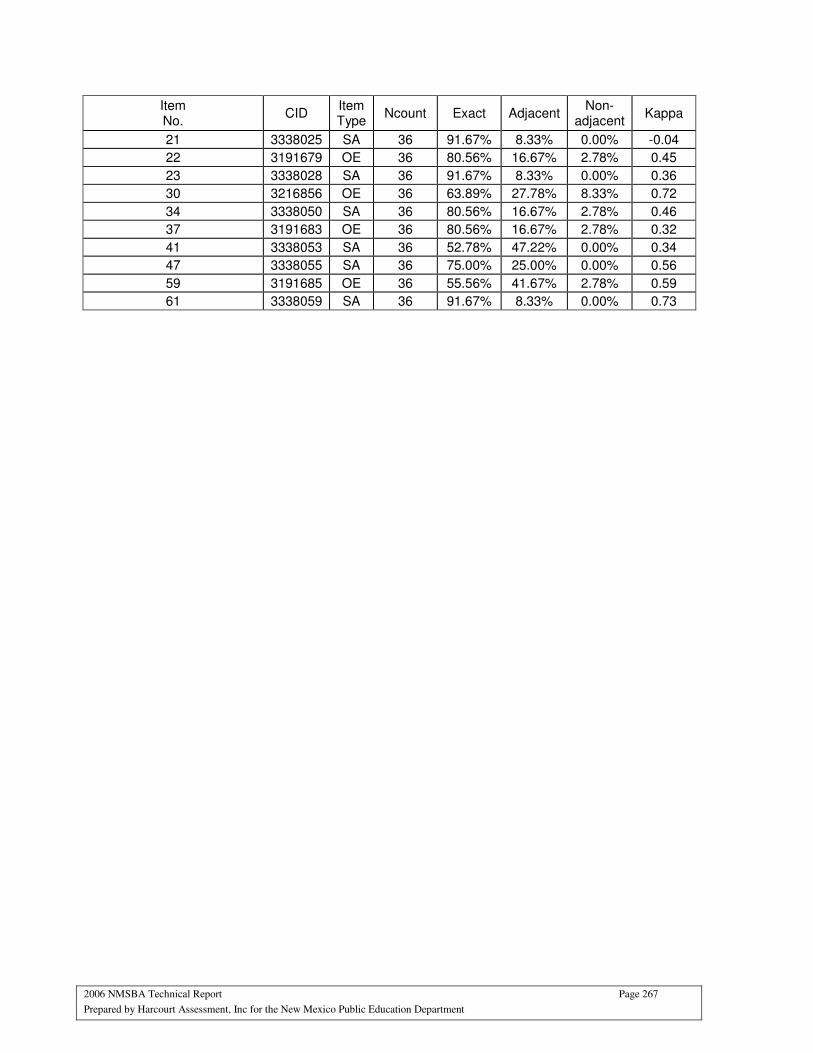
2006 NMSBA Technical Report Page 267
Prepared by Harcourt Assessment, Inc for the New Mexico Public Education Department
Item No.
CID Item Type
Ncount Exact Adjacent Non-
adjacent Kappa
21 3338025 SA 36 91.67% 8.33% 0.00% -0.04
22 3191679 OE 36 80.56% 16.67% 2.78% 0.45
23 3338028 SA 36 91.67% 8.33% 0.00% 0.36
30 3216856 OE 36 63.89% 27.78% 8.33% 0.72
34 3338050 SA 36 80.56% 16.67% 2.78% 0.46
37 3191683 OE 36 80.56% 16.67% 2.78% 0.32
41 3338053 SA 36 52.78% 47.22% 0.00% 0.34
47 3338055 SA 36 75.00% 25.00% 0.00% 0.56
59 3191685 OE 36 55.56% 41.67% 2.78% 0.59
61 3338059 SA 36 91.67% 8.33% 0.00% 0.73
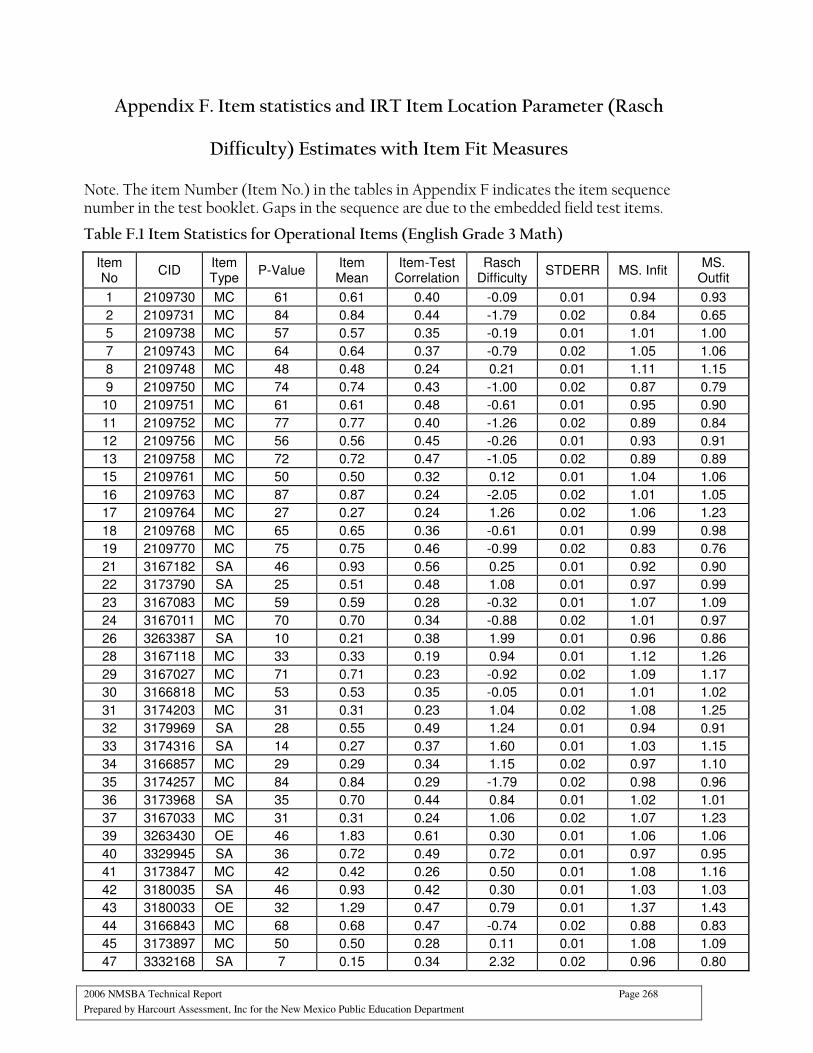
2006 NMSBA Technical Report Page 268
Prepared by Harcourt Assessment, Inc for the New Mexico Public Education Department
Appendix F. Item statistics and IRT Item Location Parameter (Rasch
Difficulty) Estimates with Item Fit Measures
Note. The item Number (Item No.) in the tables in Appendix F indicates the item sequence number in the test booklet. Gaps in the sequence are due to the embedded field test items.
Table F.1 Item Statistics for Operational Items (English Grade 3 Math)
Item No
CID Item Type
P-Value Item Mean
Item-Test Correlation
Rasch Difficulty
STDERR MS. Infit MS.
Outfit
1 2109730 MC 61 0.61 0.40 -0.09 0.01 0.94 0.93
2 2109731 MC 84 0.84 0.44 -1.79 0.02 0.84 0.65
5 2109738 MC 57 0.57 0.35 -0.19 0.01 1.01 1.00
7 2109743 MC 64 0.64 0.37 -0.79 0.02 1.05 1.06
8 2109748 MC 48 0.48 0.24 0.21 0.01 1.11 1.15
9 2109750 MC 74 0.74 0.43 -1.00 0.02 0.87 0.79
10 2109751 MC 61 0.61 0.48 -0.61 0.01 0.95 0.90
11 2109752 MC 77 0.77 0.40 -1.26 0.02 0.89 0.84
12 2109756 MC 56 0.56 0.45 -0.26 0.01 0.93 0.91
13 2109758 MC 72 0.72 0.47 -1.05 0.02 0.89 0.89
15 2109761 MC 50 0.50 0.32 0.12 0.01 1.04 1.06
16 2109763 MC 87 0.87 0.24 -2.05 0.02 1.01 1.05
17 2109764 MC 27 0.27 0.24 1.26 0.02 1.06 1.23
18 2109768 MC 65 0.65 0.36 -0.61 0.01 0.99 0.98
19 2109770 MC 75 0.75 0.46 -0.99 0.02 0.83 0.76
21 3167182 SA 46 0.93 0.56 0.25 0.01 0.92 0.90
22 3173790 SA 25 0.51 0.48 1.08 0.01 0.97 0.99
23 3167083 MC 59 0.59 0.28 -0.32 0.01 1.07 1.09
24 3167011 MC 70 0.70 0.34 -0.88 0.02 1.01 0.97
26 3263387 SA 10 0.21 0.38 1.99 0.01 0.96 0.86
28 3167118 MC 33 0.33 0.19 0.94 0.01 1.12 1.26
29 3167027 MC 71 0.71 0.23 -0.92 0.02 1.09 1.17
30 3166818 MC 53 0.53 0.35 -0.05 0.01 1.01 1.02
31 3174203 MC 31 0.31 0.23 1.04 0.02 1.08 1.25
32 3179969 SA 28 0.55 0.49 1.24 0.01 0.94 0.91
33 3174316 SA 14 0.27 0.37 1.60 0.01 1.03 1.15
34 3166857 MC 29 0.29 0.34 1.15 0.02 0.97 1.10
35 3174257 MC 84 0.84 0.29 -1.79 0.02 0.98 0.96
36 3173968 SA 35 0.70 0.44 0.84 0.01 1.02 1.01
37 3167033 MC 31 0.31 0.24 1.06 0.02 1.07 1.23
39 3263430 OE 46 1.83 0.61 0.30 0.01 1.06 1.06
40 3329945 SA 36 0.72 0.49 0.72 0.01 0.97 0.95
41 3173847 MC 42 0.42 0.26 0.50 0.01 1.08 1.16
42 3180035 SA 46 0.93 0.42 0.30 0.01 1.03 1.03
43 3180033 OE 32 1.29 0.47 0.79 0.01 1.37 1.43
44 3166843 MC 68 0.68 0.47 -0.74 0.02 0.88 0.83
45 3173897 MC 50 0.50 0.28 0.11 0.01 1.08 1.09
47 3332168 SA 7 0.15 0.34 2.32 0.02 0.96 0.80
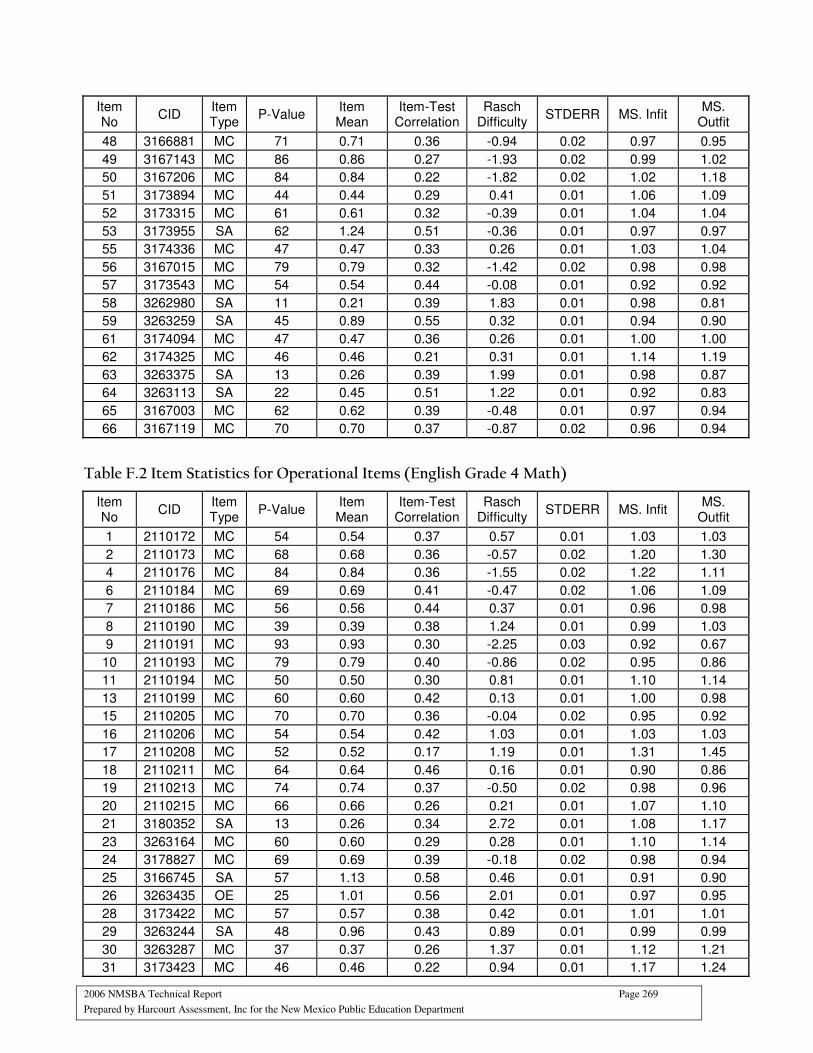
2006 NMSBA Technical Report Page 269
Prepared by Harcourt Assessment, Inc for the New Mexico Public Education Department
Item No
CID Item Type
P-Value Item Mean
Item-Test Correlation
Rasch Difficulty
STDERR MS. Infit MS.
Outfit
48 3166881 MC 71 0.71 0.36 -0.94 0.02 0.97 0.95
49 3167143 MC 86 0.86 0.27 -1.93 0.02 0.99 1.02
50 3167206 MC 84 0.84 0.22 -1.82 0.02 1.02 1.18
51 3173894 MC 44 0.44 0.29 0.41 0.01 1.06 1.09
52 3173315 MC 61 0.61 0.32 -0.39 0.01 1.04 1.04
53 3173955 SA 62 1.24 0.51 -0.36 0.01 0.97 0.97
55 3174336 MC 47 0.47 0.33 0.26 0.01 1.03 1.04
56 3167015 MC 79 0.79 0.32 -1.42 0.02 0.98 0.98
57 3173543 MC 54 0.54 0.44 -0.08 0.01 0.92 0.92
58 3262980 SA 11 0.21 0.39 1.83 0.01 0.98 0.81
59 3263259 SA 45 0.89 0.55 0.32 0.01 0.94 0.90
61 3174094 MC 47 0.47 0.36 0.26 0.01 1.00 1.00
62 3174325 MC 46 0.46 0.21 0.31 0.01 1.14 1.19
63 3263375 SA 13 0.26 0.39 1.99 0.01 0.98 0.87
64 3263113 SA 22 0.45 0.51 1.22 0.01 0.92 0.83
65 3167003 MC 62 0.62 0.39 -0.48 0.01 0.97 0.94
66 3167119 MC 70 0.70 0.37 -0.87 0.02 0.96 0.94
Table F.2 Item Statistics for Operational Items (English Grade 4 Math)
Item No
CID Item Type
P-Value Item Mean
Item-Test Correlation
Rasch Difficulty
STDERR MS. Infit MS.
Outfit
1 2110172 MC 54 0.54 0.37 0.57 0.01 1.03 1.03
2 2110173 MC 68 0.68 0.36 -0.57 0.02 1.20 1.30
4 2110176 MC 84 0.84 0.36 -1.55 0.02 1.22 1.11
6 2110184 MC 69 0.69 0.41 -0.47 0.02 1.06 1.09
7 2110186 MC 56 0.56 0.44 0.37 0.01 0.96 0.98
8 2110190 MC 39 0.39 0.38 1.24 0.01 0.99 1.03
9 2110191 MC 93 0.93 0.30 -2.25 0.03 0.92 0.67
10 2110193 MC 79 0.79 0.40 -0.86 0.02 0.95 0.86
11 2110194 MC 50 0.50 0.30 0.81 0.01 1.10 1.14
13 2110199 MC 60 0.60 0.42 0.13 0.01 1.00 0.98
15 2110205 MC 70 0.70 0.36 -0.04 0.02 0.95 0.92
16 2110206 MC 54 0.54 0.42 1.03 0.01 1.03 1.03
17 2110208 MC 52 0.52 0.17 1.19 0.01 1.31 1.45
18 2110211 MC 64 0.64 0.46 0.16 0.01 0.90 0.86
19 2110213 MC 74 0.74 0.37 -0.50 0.02 0.98 0.96
20 2110215 MC 66 0.66 0.26 0.21 0.01 1.07 1.10
21 3180352 SA 13 0.26 0.34 2.72 0.01 1.08 1.17
23 3263164 MC 60 0.60 0.29 0.28 0.01 1.10 1.14
24 3178827 MC 69 0.69 0.39 -0.18 0.02 0.98 0.94
25 3166745 SA 57 1.13 0.58 0.46 0.01 0.91 0.90
26 3263435 OE 25 1.01 0.56 2.01 0.01 0.97 0.95
28 3173422 MC 57 0.57 0.38 0.42 0.01 1.01 1.01
29 3263244 SA 48 0.96 0.43 0.89 0.01 0.99 0.99
30 3263287 MC 37 0.37 0.26 1.37 0.01 1.12 1.21
31 3173423 MC 46 0.46 0.22 0.94 0.01 1.17 1.24

2006 NMSBA Technical Report Page 270
Prepared by Harcourt Assessment, Inc for the New Mexico Public Education Department
Item No
CID Item Type
P-Value Item Mean
Item-Test Correlation
Rasch Difficulty
STDERR MS. Infit MS.
Outfit
32 3178873 SA 25 0.51 0.58 2.53 0.01 0.83 0.79
33 3166737 SA 13 0.26 0.43 2.55 0.01 0.96 0.90
34 3178887 MC 60 0.60 0.45 0.26 0.01 0.94 0.92
35 3181097 MC 66 0.66 0.48 -0.04 0.02 0.90 0.86
36 3180238 SA 6 0.11 0.26 3.20 0.02 1.06 1.34
37 3181104 SA 48 0.97 0.63 0.82 0.01 0.85 0.81
38 3263476 MC 92 0.92 0.22 -2.01 0.02 1.00 1.02
39 3173399 SA 33 0.66 0.59 1.41 0.01 0.91 0.84
40 3181087 MC 40 0.40 0.31 1.24 0.01 1.07 1.15
42 3263281 SA 67 1.35 0.48 0.02 0.01 1.04 1.10
43 3167113 MC 38 0.38 0.37 1.33 0.01 1.00 1.07
45 3173393 MC 67 0.67 0.36 -0.06 0.02 1.02 1.00
46 3169931 MC 40 0.40 0.25 1.26 0.01 1.13 1.23
47 3263014 SA 12 0.25 0.45 2.60 0.01 0.91 0.81
48 3178893 SA 51 1.03 0.61 0.71 0.01 0.93 0.89
49 3181094 MC 41 0.41 0.37 1.19 0.01 1.01 1.06
50 3180242 MC 75 0.75 0.30 -0.56 0.02 1.05 1.06
51 3170126 MC 30 0.30 0.36 1.77 0.02 0.98 1.13
52 3173413 MC 54 0.54 0.31 0.58 0.01 1.08 1.13
53 3178894 MC 34 0.34 0.33 1.53 0.02 1.03 1.14
55 3181075 OE 53 2.10 0.61 0.76 0.01 1.03 1.05
56 3167334 MC 44 0.44 0.28 1.06 0.01 1.12 1.16
58 3167067 MC 63 0.63 0.44 0.12 0.01 0.94 0.91
59 3263015 SA 19 0.38 0.53 2.05 0.01 0.89 0.80
60 3322909 SA 6 0.12 0.35 3.05 0.02 0.93 0.70
61 3263075 MC 76 0.76 0.37 -0.62 0.02 0.97 0.93
62 3173418 MC 54 0.54 0.20 0.55 0.01 1.20 1.26
63 3178682 MC 61 0.61 0.24 0.20 0.01 1.14 1.23
64 3263022 SA 55 1.11 0.60 0.54 0.01 0.90 0.88
65 3167381 SA 34 0.67 0.56 1.62 0.01 0.90 0.88
66 3173419 MC 75 0.75 0.28 -0.54 0.02 1.06 1.13
67 3167085 MC 79 0.79 0.45 -0.80 0.02 0.88 0.76
Table F.3 Item Statistics for Operational Items (English Grade 5 Math)
Item No
CID Item Type
P-Value Item Mean
Item-Test Correlation
Rasch Difficulty
STDERR MS. Infit MS.
Outfit
1 2110591 MC 66 0.66 0.29 0.31 0.01 1.10 1.11
2 2110594 MC 32 0.32 0.06 2.00 0.01 1.24 1.39
3 2110595 MC 77 0.77 0.34 -0.51 0.02 1.18 1.15
7 2110606 MC 43 0.43 0.34 1.57 0.01 1.03 1.06
8 2110609 MC 45 0.45 0.36 1.14 0.01 1.03 1.03
9 2110611 MC 56 0.56 0.45 0.83 0.01 0.93 0.92
10 2110612 MC 67 0.67 0.46 0.42 0.01 0.88 0.82
11 2110615 MC 67 0.67 0.35 0.83 0.01 0.95 0.93
12 2110616 MC 74 0.74 0.35 0.05 0.02 0.94 0.92
13 2110621 MC 93 0.93 0.27 -1.64 0.03 0.93 0.69
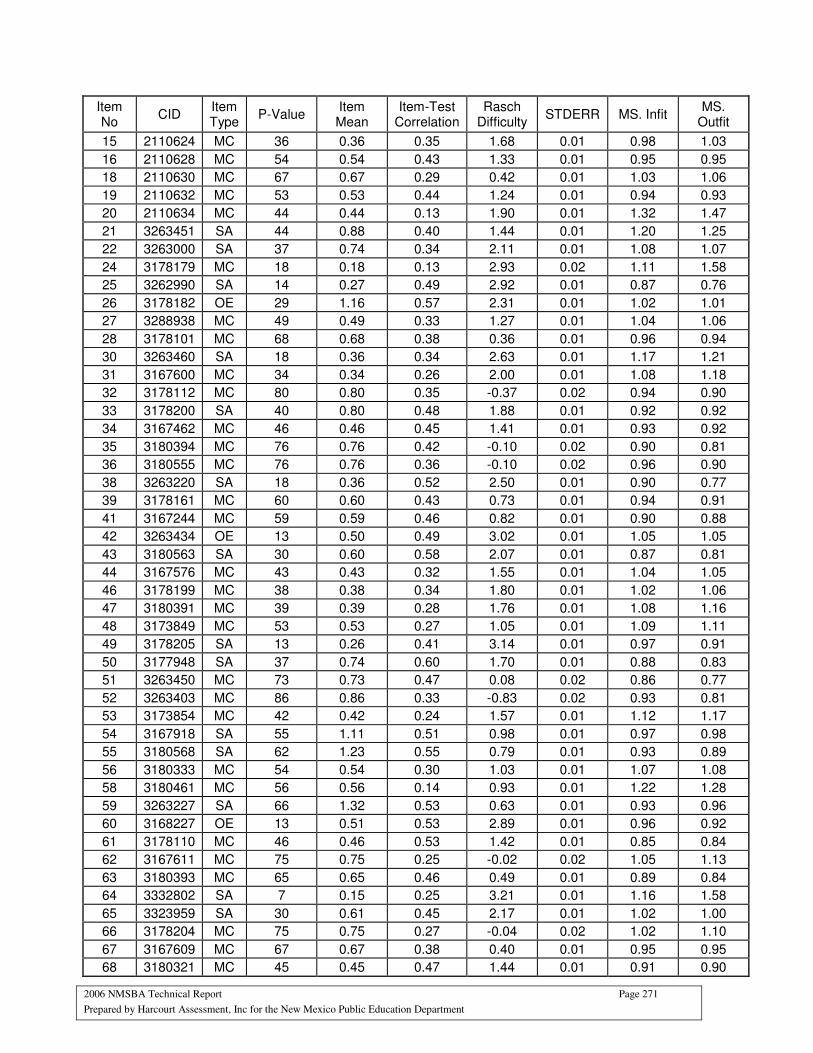
2006 NMSBA Technical Report Page 271
Prepared by Harcourt Assessment, Inc for the New Mexico Public Education Department
Item No
CID Item Type
P-Value Item Mean
Item-Test Correlation
Rasch Difficulty
STDERR MS. Infit MS.
Outfit
15 2110624 MC 36 0.36 0.35 1.68 0.01 0.98 1.03
16 2110628 MC 54 0.54 0.43 1.33 0.01 0.95 0.95
18 2110630 MC 67 0.67 0.29 0.42 0.01 1.03 1.06
19 2110632 MC 53 0.53 0.44 1.24 0.01 0.94 0.93
20 2110634 MC 44 0.44 0.13 1.90 0.01 1.32 1.47
21 3263451 SA 44 0.88 0.40 1.44 0.01 1.20 1.25
22 3263000 SA 37 0.74 0.34 2.11 0.01 1.08 1.07
24 3178179 MC 18 0.18 0.13 2.93 0.02 1.11 1.58
25 3262990 SA 14 0.27 0.49 2.92 0.01 0.87 0.76
26 3178182 OE 29 1.16 0.57 2.31 0.01 1.02 1.01
27 3288938 MC 49 0.49 0.33 1.27 0.01 1.04 1.06
28 3178101 MC 68 0.68 0.38 0.36 0.01 0.96 0.94
30 3263460 SA 18 0.36 0.34 2.63 0.01 1.17 1.21
31 3167600 MC 34 0.34 0.26 2.00 0.01 1.08 1.18
32 3178112 MC 80 0.80 0.35 -0.37 0.02 0.94 0.90
33 3178200 SA 40 0.80 0.48 1.88 0.01 0.92 0.92
34 3167462 MC 46 0.46 0.45 1.41 0.01 0.93 0.92
35 3180394 MC 76 0.76 0.42 -0.10 0.02 0.90 0.81
36 3180555 MC 76 0.76 0.36 -0.10 0.02 0.96 0.90
38 3263220 SA 18 0.36 0.52 2.50 0.01 0.90 0.77
39 3178161 MC 60 0.60 0.43 0.73 0.01 0.94 0.91
41 3167244 MC 59 0.59 0.46 0.82 0.01 0.90 0.88
42 3263434 OE 13 0.50 0.49 3.02 0.01 1.05 1.05
43 3180563 SA 30 0.60 0.58 2.07 0.01 0.87 0.81
44 3167576 MC 43 0.43 0.32 1.55 0.01 1.04 1.05
46 3178199 MC 38 0.38 0.34 1.80 0.01 1.02 1.06
47 3180391 MC 39 0.39 0.28 1.76 0.01 1.08 1.16
48 3173849 MC 53 0.53 0.27 1.05 0.01 1.09 1.11
49 3178205 SA 13 0.26 0.41 3.14 0.01 0.97 0.91
50 3177948 SA 37 0.74 0.60 1.70 0.01 0.88 0.83
51 3263450 MC 73 0.73 0.47 0.08 0.02 0.86 0.77
52 3263403 MC 86 0.86 0.33 -0.83 0.02 0.93 0.81
53 3173854 MC 42 0.42 0.24 1.57 0.01 1.12 1.17
54 3167918 SA 55 1.11 0.51 0.98 0.01 0.97 0.98
55 3180568 SA 62 1.23 0.55 0.79 0.01 0.93 0.89
56 3180333 MC 54 0.54 0.30 1.03 0.01 1.07 1.08
58 3180461 MC 56 0.56 0.14 0.93 0.01 1.22 1.28
59 3263227 SA 66 1.32 0.53 0.63 0.01 0.93 0.96
60 3168227 OE 13 0.51 0.53 2.89 0.01 0.96 0.92
61 3178110 MC 46 0.46 0.53 1.42 0.01 0.85 0.84
62 3167611 MC 75 0.75 0.25 -0.02 0.02 1.05 1.13
63 3180393 MC 65 0.65 0.46 0.49 0.01 0.89 0.84
64 3332802 SA 7 0.15 0.25 3.21 0.01 1.16 1.58
65 3323959 SA 30 0.61 0.45 2.17 0.01 1.02 1.00
66 3178204 MC 75 0.75 0.27 -0.04 0.02 1.02 1.10
67 3167609 MC 67 0.67 0.38 0.40 0.01 0.95 0.95
68 3180321 MC 45 0.45 0.47 1.44 0.01 0.91 0.90
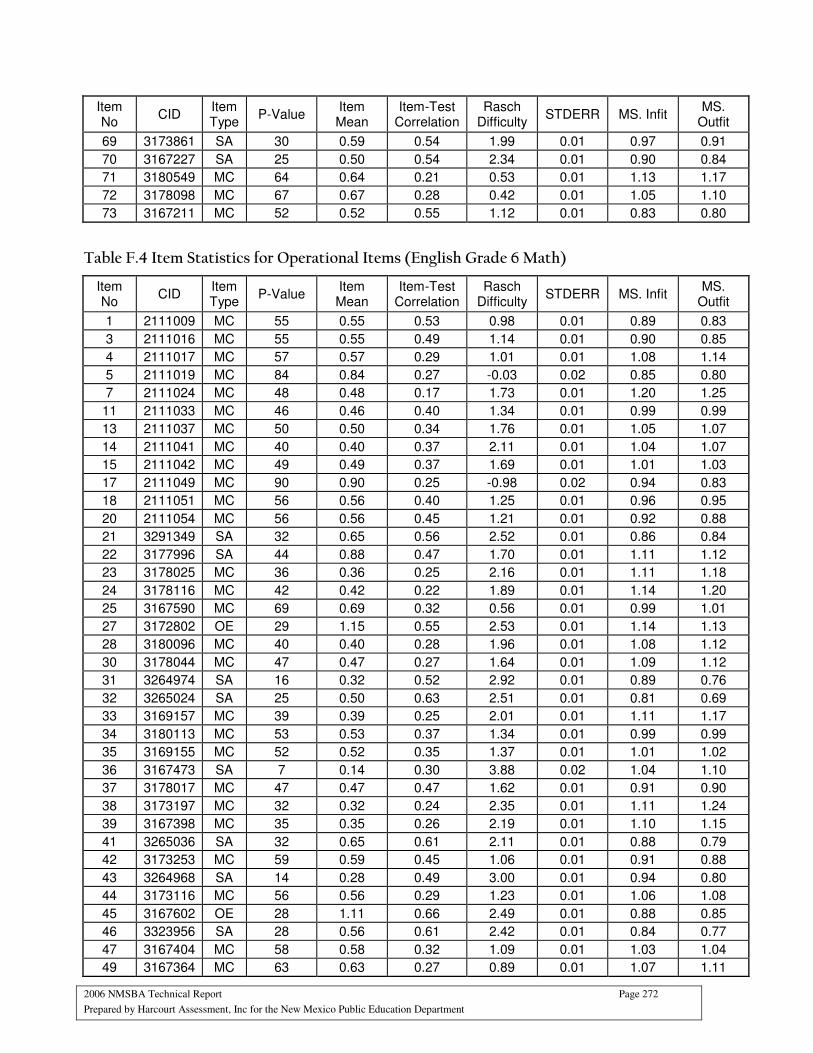
2006 NMSBA Technical Report Page 272
Prepared by Harcourt Assessment, Inc for the New Mexico Public Education Department
Item No
CID Item Type
P-Value Item Mean
Item-Test Correlation
Rasch Difficulty
STDERR MS. Infit MS.
Outfit
69 3173861 SA 30 0.59 0.54 1.99 0.01 0.97 0.91
70 3167227 SA 25 0.50 0.54 2.34 0.01 0.90 0.84
71 3180549 MC 64 0.64 0.21 0.53 0.01 1.13 1.17
72 3178098 MC 67 0.67 0.28 0.42 0.01 1.05 1.10
73 3167211 MC 52 0.52 0.55 1.12 0.01 0.83 0.80
Table F.4 Item Statistics for Operational Items (English Grade 6 Math)
Item No
CID Item Type
P-Value Item Mean
Item-Test Correlation
Rasch Difficulty
STDERR MS. Infit MS.
Outfit
1 2111009 MC 55 0.55 0.53 0.98 0.01 0.89 0.83
3 2111016 MC 55 0.55 0.49 1.14 0.01 0.90 0.85
4 2111017 MC 57 0.57 0.29 1.01 0.01 1.08 1.14
5 2111019 MC 84 0.84 0.27 -0.03 0.02 0.85 0.80
7 2111024 MC 48 0.48 0.17 1.73 0.01 1.20 1.25
11 2111033 MC 46 0.46 0.40 1.34 0.01 0.99 0.99
13 2111037 MC 50 0.50 0.34 1.76 0.01 1.05 1.07
14 2111041 MC 40 0.40 0.37 2.11 0.01 1.04 1.07
15 2111042 MC 49 0.49 0.37 1.69 0.01 1.01 1.03
17 2111049 MC 90 0.90 0.25 -0.98 0.02 0.94 0.83
18 2111051 MC 56 0.56 0.40 1.25 0.01 0.96 0.95
20 2111054 MC 56 0.56 0.45 1.21 0.01 0.92 0.88
21 3291349 SA 32 0.65 0.56 2.52 0.01 0.86 0.84
22 3177996 SA 44 0.88 0.47 1.70 0.01 1.11 1.12
23 3178025 MC 36 0.36 0.25 2.16 0.01 1.11 1.18
24 3178116 MC 42 0.42 0.22 1.89 0.01 1.14 1.20
25 3167590 MC 69 0.69 0.32 0.56 0.01 0.99 1.01
27 3172802 OE 29 1.15 0.55 2.53 0.01 1.14 1.13
28 3180096 MC 40 0.40 0.28 1.96 0.01 1.08 1.12
30 3178044 MC 47 0.47 0.27 1.64 0.01 1.09 1.12
31 3264974 SA 16 0.32 0.52 2.92 0.01 0.89 0.76
32 3265024 SA 25 0.50 0.63 2.51 0.01 0.81 0.69
33 3169157 MC 39 0.39 0.25 2.01 0.01 1.11 1.17
34 3180113 MC 53 0.53 0.37 1.34 0.01 0.99 0.99
35 3169155 MC 52 0.52 0.35 1.37 0.01 1.01 1.02
36 3167473 SA 7 0.14 0.30 3.88 0.02 1.04 1.10
37 3178017 MC 47 0.47 0.47 1.62 0.01 0.91 0.90
38 3173197 MC 32 0.32 0.24 2.35 0.01 1.11 1.24
39 3167398 MC 35 0.35 0.26 2.19 0.01 1.10 1.15
41 3265036 SA 32 0.65 0.61 2.11 0.01 0.88 0.79
42 3173253 MC 59 0.59 0.45 1.06 0.01 0.91 0.88
43 3264968 SA 14 0.28 0.49 3.00 0.01 0.94 0.80
44 3173116 MC 56 0.56 0.29 1.23 0.01 1.06 1.08
45 3167602 OE 28 1.11 0.66 2.49 0.01 0.88 0.85
46 3323956 SA 28 0.56 0.61 2.42 0.01 0.84 0.77
47 3167404 MC 58 0.58 0.32 1.09 0.01 1.03 1.04
49 3167364 MC 63 0.63 0.27 0.89 0.01 1.07 1.11
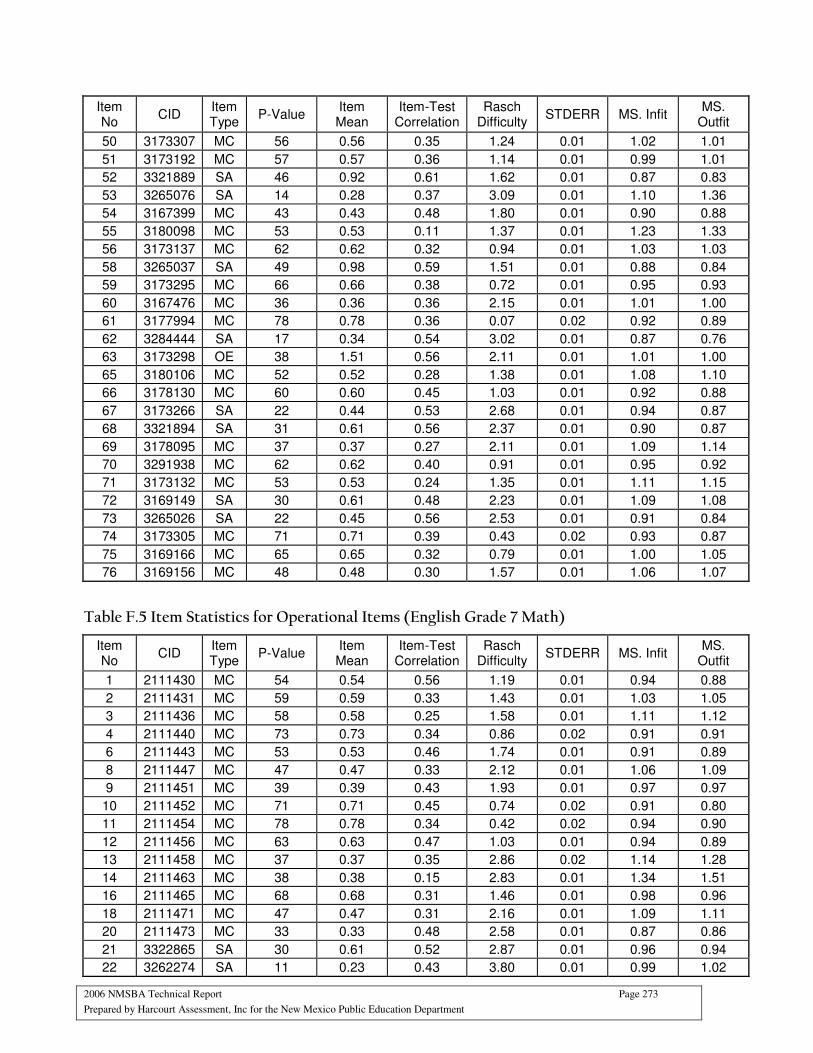
2006 NMSBA Technical Report Page 273
Prepared by Harcourt Assessment, Inc for the New Mexico Public Education Department
Item No
CID Item Type
P-Value Item Mean
Item-Test Correlation
Rasch Difficulty
STDERR MS. Infit MS.
Outfit
50 3173307 MC 56 0.56 0.35 1.24 0.01 1.02 1.01
51 3173192 MC 57 0.57 0.36 1.14 0.01 0.99 1.01
52 3321889 SA 46 0.92 0.61 1.62 0.01 0.87 0.83
53 3265076 SA 14 0.28 0.37 3.09 0.01 1.10 1.36
54 3167399 MC 43 0.43 0.48 1.80 0.01 0.90 0.88
55 3180098 MC 53 0.53 0.11 1.37 0.01 1.23 1.33
56 3173137 MC 62 0.62 0.32 0.94 0.01 1.03 1.03
58 3265037 SA 49 0.98 0.59 1.51 0.01 0.88 0.84
59 3173295 MC 66 0.66 0.38 0.72 0.01 0.95 0.93
60 3167476 MC 36 0.36 0.36 2.15 0.01 1.01 1.00
61 3177994 MC 78 0.78 0.36 0.07 0.02 0.92 0.89
62 3284444 SA 17 0.34 0.54 3.02 0.01 0.87 0.76
63 3173298 OE 38 1.51 0.56 2.11 0.01 1.01 1.00
65 3180106 MC 52 0.52 0.28 1.38 0.01 1.08 1.10
66 3178130 MC 60 0.60 0.45 1.03 0.01 0.92 0.88
67 3173266 SA 22 0.44 0.53 2.68 0.01 0.94 0.87
68 3321894 SA 31 0.61 0.56 2.37 0.01 0.90 0.87
69 3178095 MC 37 0.37 0.27 2.11 0.01 1.09 1.14
70 3291938 MC 62 0.62 0.40 0.91 0.01 0.95 0.92
71 3173132 MC 53 0.53 0.24 1.35 0.01 1.11 1.15
72 3169149 SA 30 0.61 0.48 2.23 0.01 1.09 1.08
73 3265026 SA 22 0.45 0.56 2.53 0.01 0.91 0.84
74 3173305 MC 71 0.71 0.39 0.43 0.02 0.93 0.87
75 3169166 MC 65 0.65 0.32 0.79 0.01 1.00 1.05
76 3169156 MC 48 0.48 0.30 1.57 0.01 1.06 1.07
Table F.5 Item Statistics for Operational Items (English Grade 7 Math)
Item No
CID Item Type
P-Value Item Mean
Item-Test Correlation
Rasch Difficulty
STDERR MS. Infit MS.
Outfit
1 2111430 MC 54 0.54 0.56 1.19 0.01 0.94 0.88
2 2111431 MC 59 0.59 0.33 1.43 0.01 1.03 1.05
3 2111436 MC 58 0.58 0.25 1.58 0.01 1.11 1.12
4 2111440 MC 73 0.73 0.34 0.86 0.02 0.91 0.91
6 2111443 MC 53 0.53 0.46 1.74 0.01 0.91 0.89
8 2111447 MC 47 0.47 0.33 2.12 0.01 1.06 1.09
9 2111451 MC 39 0.39 0.43 1.93 0.01 0.97 0.97
10 2111452 MC 71 0.71 0.45 0.74 0.02 0.91 0.80
11 2111454 MC 78 0.78 0.34 0.42 0.02 0.94 0.90
12 2111456 MC 63 0.63 0.47 1.03 0.01 0.94 0.89
13 2111458 MC 37 0.37 0.35 2.86 0.02 1.14 1.28
14 2111463 MC 38 0.38 0.15 2.83 0.01 1.34 1.51
16 2111465 MC 68 0.68 0.31 1.46 0.01 0.98 0.96
18 2111471 MC 47 0.47 0.31 2.16 0.01 1.09 1.11
20 2111473 MC 33 0.33 0.48 2.58 0.01 0.87 0.86
21 3322865 SA 30 0.61 0.52 2.87 0.01 0.96 0.94
22 3262274 SA 11 0.23 0.43 3.80 0.01 0.99 1.02

2006 NMSBA Technical Report Page 274
Prepared by Harcourt Assessment, Inc for the New Mexico Public Education Department
Item No
CID Item Type
P-Value Item Mean
Item-Test Correlation
Rasch Difficulty
STDERR MS. Infit MS.
Outfit
23 3180074 MC 60 0.60 0.38 1.42 0.01 0.98 0.96
24 3174700 MC 31 0.31 0.43 2.83 0.01 0.95 1.00
25 3323964 SA 5 0.11 0.43 4.25 0.02 0.88 0.60
26 3167589 OE 31 1.22 0.60 2.84 0.01 1.07 1.03
28 3180076 MC 41 0.41 0.29 2.33 0.01 1.09 1.12
29 3322753 SA 16 0.32 0.55 3.28 0.01 0.93 0.75
30 3180544 OE 22 0.88 0.59 2.90 0.01 1.22 1.33
31 3180400 MC 57 0.57 0.36 1.54 0.01 1.00 1.00
32 3180424 MC 45 0.45 0.48 2.11 0.01 0.90 0.88
33 3262142 SA 13 0.27 0.53 3.69 0.01 0.87 0.79
34 3180087 MC 51 0.51 0.45 1.83 0.01 0.93 0.90
35 3174541 MC 28 0.28 0.11 3.02 0.02 1.24 1.47
36 3169943 MC 57 0.57 0.39 1.55 0.01 0.98 0.96
38 3277069 SA 18 0.36 0.53 3.42 0.01 0.93 0.80
39 3180070 MC 50 0.50 0.46 1.90 0.01 0.92 0.90
40 3262193 MC 31 0.31 0.33 2.85 0.02 1.05 1.09
41 3180587 SA 25 0.50 0.52 2.93 0.01 1.02 0.97
42 3174653 OE 11 0.45 0.39 3.75 0.01 1.39 1.69
43 3167577 MC 25 0.25 0.15 3.20 0.02 1.19 1.39
44 3277067 SA 30 0.59 0.65 2.74 0.01 0.81 0.70
46 3180147 MC 43 0.43 0.54 2.21 0.01 0.85 0.83
47 3169946 MC 43 0.43 0.38 2.21 0.01 1.00 1.03
48 3174684 MC 54 0.54 0.41 1.71 0.01 0.95 0.95
50 3323977 SA 35 0.70 0.45 2.53 0.01 1.11 1.08
51 3180422 MC 49 0.49 0.30 1.93 0.01 1.08 1.10
52 3174662 MC 50 0.50 0.27 1.90 0.01 1.11 1.14
53 3180055 MC 44 0.44 0.30 2.19 0.01 1.08 1.11
54 3322808 SA 24 0.47 0.53 3.00 0.01 0.99 0.93
55 3262158 SA 56 1.12 0.41 1.56 0.01 1.08 1.10
57 3180092 MC 76 0.76 0.41 0.54 0.02 0.88 0.77
58 3262273 MC 54 0.54 0.40 1.70 0.01 0.98 0.96
59 3322895 SA 24 0.48 0.57 2.89 0.01 0.97 0.82
60 3180126 OE 21 0.86 0.63 2.90 0.01 1.09 1.15
61 3169989 MC 56 0.56 0.28 1.63 0.01 1.08 1.12
62 3174547 MC 45 0.45 0.32 2.12 0.01 1.07 1.08
63 3178034 MC 56 0.56 0.34 1.62 0.01 1.01 1.03
64 3262198 SA 22 0.44 0.46 3.27 0.01 1.03 1.00
65 3173300 SA 30 0.59 0.53 3.46 0.01 0.87 0.86
66 3169952 MC 53 0.53 0.38 1.76 0.01 0.99 0.99
67 3180153 MC 37 0.37 0.48 2.51 0.01 0.91 0.91
68 3180458 MC 83 0.83 0.32 0.10 0.02 0.94 0.85
70 3262138 SA 8 0.16 0.32 4.05 0.02 1.12 1.31
71 3180416 MC 48 0.48 0.38 1.99 0.01 1.01 1.00
72 3262159 MC 58 0.58 0.38 1.52 0.01 0.99 0.97
73 3174650 MC 47 0.47 0.32 2.04 0.01 1.07 1.08
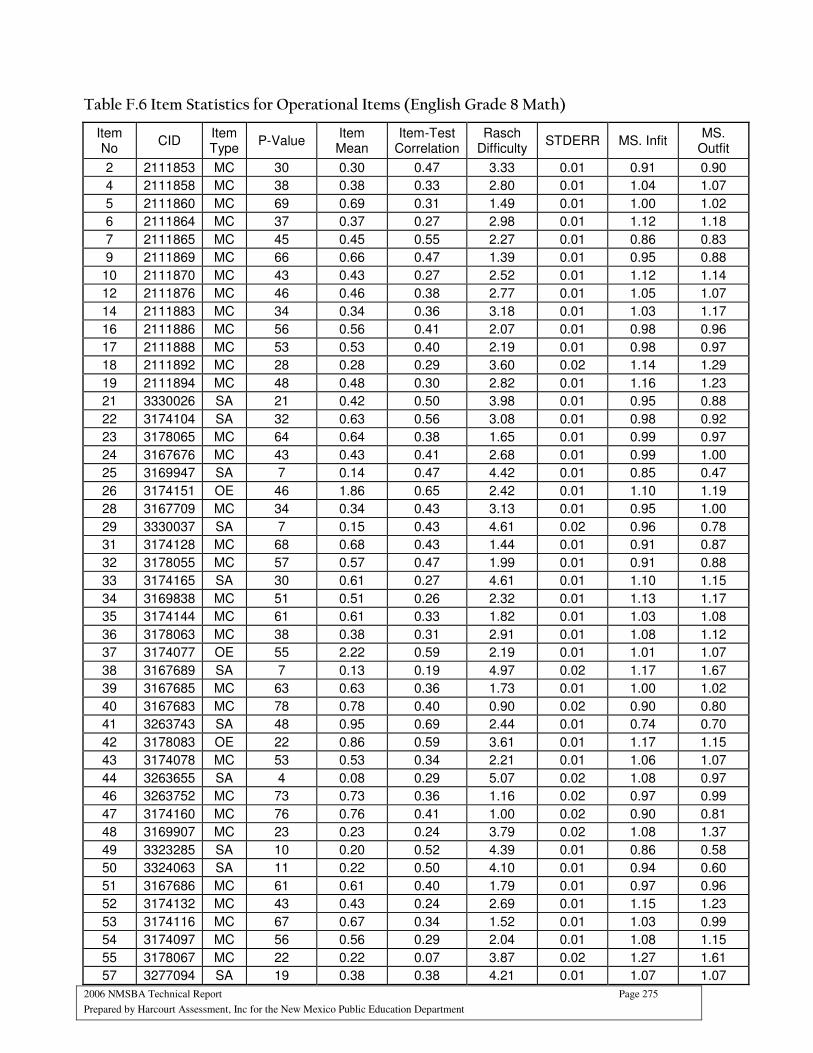
2006 NMSBA Technical Report Page 275
Prepared by Harcourt Assessment, Inc for the New Mexico Public Education Department
Table F.6 Item Statistics for Operational Items (English Grade 8 Math)
Item No
CID Item Type
P-Value Item Mean
Item-Test Correlation
Rasch Difficulty
STDERR MS. Infit MS.
Outfit
2 2111853 MC 30 0.30 0.47 3.33 0.01 0.91 0.90
4 2111858 MC 38 0.38 0.33 2.80 0.01 1.04 1.07
5 2111860 MC 69 0.69 0.31 1.49 0.01 1.00 1.02
6 2111864 MC 37 0.37 0.27 2.98 0.01 1.12 1.18
7 2111865 MC 45 0.45 0.55 2.27 0.01 0.86 0.83
9 2111869 MC 66 0.66 0.47 1.39 0.01 0.95 0.88
10 2111870 MC 43 0.43 0.27 2.52 0.01 1.12 1.14
12 2111876 MC 46 0.46 0.38 2.77 0.01 1.05 1.07
14 2111883 MC 34 0.34 0.36 3.18 0.01 1.03 1.17
16 2111886 MC 56 0.56 0.41 2.07 0.01 0.98 0.96
17 2111888 MC 53 0.53 0.40 2.19 0.01 0.98 0.97
18 2111892 MC 28 0.28 0.29 3.60 0.02 1.14 1.29
19 2111894 MC 48 0.48 0.30 2.82 0.01 1.16 1.23
21 3330026 SA 21 0.42 0.50 3.98 0.01 0.95 0.88
22 3174104 SA 32 0.63 0.56 3.08 0.01 0.98 0.92
23 3178065 MC 64 0.64 0.38 1.65 0.01 0.99 0.97
24 3167676 MC 43 0.43 0.41 2.68 0.01 0.99 1.00
25 3169947 SA 7 0.14 0.47 4.42 0.01 0.85 0.47
26 3174151 OE 46 1.86 0.65 2.42 0.01 1.10 1.19
28 3167709 MC 34 0.34 0.43 3.13 0.01 0.95 1.00
29 3330037 SA 7 0.15 0.43 4.61 0.02 0.96 0.78
31 3174128 MC 68 0.68 0.43 1.44 0.01 0.91 0.87
32 3178055 MC 57 0.57 0.47 1.99 0.01 0.91 0.88
33 3174165 SA 30 0.61 0.27 4.61 0.01 1.10 1.15
34 3169838 MC 51 0.51 0.26 2.32 0.01 1.13 1.17
35 3174144 MC 61 0.61 0.33 1.82 0.01 1.03 1.08
36 3178063 MC 38 0.38 0.31 2.91 0.01 1.08 1.12
37 3174077 OE 55 2.22 0.59 2.19 0.01 1.01 1.07
38 3167689 SA 7 0.13 0.19 4.97 0.02 1.17 1.67
39 3167685 MC 63 0.63 0.36 1.73 0.01 1.00 1.02
40 3167683 MC 78 0.78 0.40 0.90 0.02 0.90 0.80
41 3263743 SA 48 0.95 0.69 2.44 0.01 0.74 0.70
42 3178083 OE 22 0.86 0.59 3.61 0.01 1.17 1.15
43 3174078 MC 53 0.53 0.34 2.21 0.01 1.06 1.07
44 3263655 SA 4 0.08 0.29 5.07 0.02 1.08 0.97
46 3263752 MC 73 0.73 0.36 1.16 0.02 0.97 0.99
47 3174160 MC 76 0.76 0.41 1.00 0.02 0.90 0.81
48 3169907 MC 23 0.23 0.24 3.79 0.02 1.08 1.37
49 3323285 SA 10 0.20 0.52 4.39 0.01 0.86 0.58
50 3324063 SA 11 0.22 0.50 4.10 0.01 0.94 0.60
51 3167686 MC 61 0.61 0.40 1.79 0.01 0.97 0.96
52 3174132 MC 43 0.43 0.24 2.69 0.01 1.15 1.23
53 3174116 MC 67 0.67 0.34 1.52 0.01 1.03 0.99
54 3174097 MC 56 0.56 0.29 2.04 0.01 1.08 1.15
55 3178067 MC 22 0.22 0.07 3.87 0.02 1.27 1.61
57 3277094 SA 19 0.38 0.38 4.21 0.01 1.07 1.07
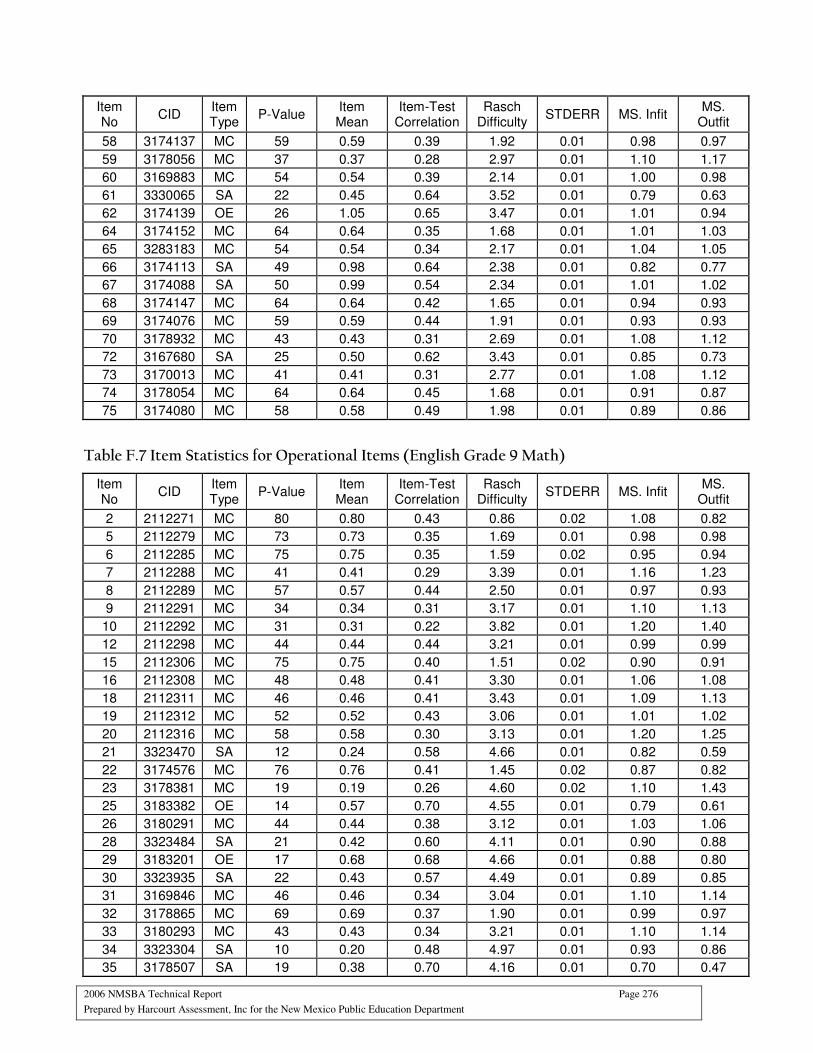
2006 NMSBA Technical Report Page 276
Prepared by Harcourt Assessment, Inc for the New Mexico Public Education Department
Item No
CID Item Type
P-Value Item Mean
Item-Test Correlation
Rasch Difficulty
STDERR MS. Infit MS.
Outfit
58 3174137 MC 59 0.59 0.39 1.92 0.01 0.98 0.97
59 3178056 MC 37 0.37 0.28 2.97 0.01 1.10 1.17
60 3169883 MC 54 0.54 0.39 2.14 0.01 1.00 0.98
61 3330065 SA 22 0.45 0.64 3.52 0.01 0.79 0.63
62 3174139 OE 26 1.05 0.65 3.47 0.01 1.01 0.94
64 3174152 MC 64 0.64 0.35 1.68 0.01 1.01 1.03
65 3283183 MC 54 0.54 0.34 2.17 0.01 1.04 1.05
66 3174113 SA 49 0.98 0.64 2.38 0.01 0.82 0.77
67 3174088 SA 50 0.99 0.54 2.34 0.01 1.01 1.02
68 3174147 MC 64 0.64 0.42 1.65 0.01 0.94 0.93
69 3174076 MC 59 0.59 0.44 1.91 0.01 0.93 0.93
70 3178932 MC 43 0.43 0.31 2.69 0.01 1.08 1.12
72 3167680 SA 25 0.50 0.62 3.43 0.01 0.85 0.73
73 3170013 MC 41 0.41 0.31 2.77 0.01 1.08 1.12
74 3178054 MC 64 0.64 0.45 1.68 0.01 0.91 0.87
75 3174080 MC 58 0.58 0.49 1.98 0.01 0.89 0.86
Table F.7 Item Statistics for Operational Items (English Grade 9 Math)
Item No
CID Item Type
P-Value Item Mean
Item-Test Correlation
Rasch Difficulty
STDERR MS. Infit MS.
Outfit
2 2112271 MC 80 0.80 0.43 0.86 0.02 1.08 0.82
5 2112279 MC 73 0.73 0.35 1.69 0.01 0.98 0.98
6 2112285 MC 75 0.75 0.35 1.59 0.02 0.95 0.94
7 2112288 MC 41 0.41 0.29 3.39 0.01 1.16 1.23
8 2112289 MC 57 0.57 0.44 2.50 0.01 0.97 0.93
9 2112291 MC 34 0.34 0.31 3.17 0.01 1.10 1.13
10 2112292 MC 31 0.31 0.22 3.82 0.01 1.20 1.40
12 2112298 MC 44 0.44 0.44 3.21 0.01 0.99 0.99
15 2112306 MC 75 0.75 0.40 1.51 0.02 0.90 0.91
16 2112308 MC 48 0.48 0.41 3.30 0.01 1.06 1.08
18 2112311 MC 46 0.46 0.41 3.43 0.01 1.09 1.13
19 2112312 MC 52 0.52 0.43 3.06 0.01 1.01 1.02
20 2112316 MC 58 0.58 0.30 3.13 0.01 1.20 1.25
21 3323470 SA 12 0.24 0.58 4.66 0.01 0.82 0.59
22 3174576 MC 76 0.76 0.41 1.45 0.02 0.87 0.82
23 3178381 MC 19 0.19 0.26 4.60 0.02 1.10 1.43
25 3183382 OE 14 0.57 0.70 4.55 0.01 0.79 0.61
26 3180291 MC 44 0.44 0.38 3.12 0.01 1.03 1.06
28 3323484 SA 21 0.42 0.60 4.11 0.01 0.90 0.88
29 3183201 OE 17 0.68 0.68 4.66 0.01 0.88 0.80
30 3323935 SA 22 0.43 0.57 4.49 0.01 0.89 0.85
31 3169846 MC 46 0.46 0.34 3.04 0.01 1.10 1.14
32 3178865 MC 69 0.69 0.37 1.90 0.01 0.99 0.97
33 3180293 MC 43 0.43 0.34 3.21 0.01 1.10 1.14
34 3323304 SA 10 0.20 0.48 4.97 0.01 0.93 0.86
35 3178507 SA 19 0.38 0.70 4.16 0.01 0.70 0.47
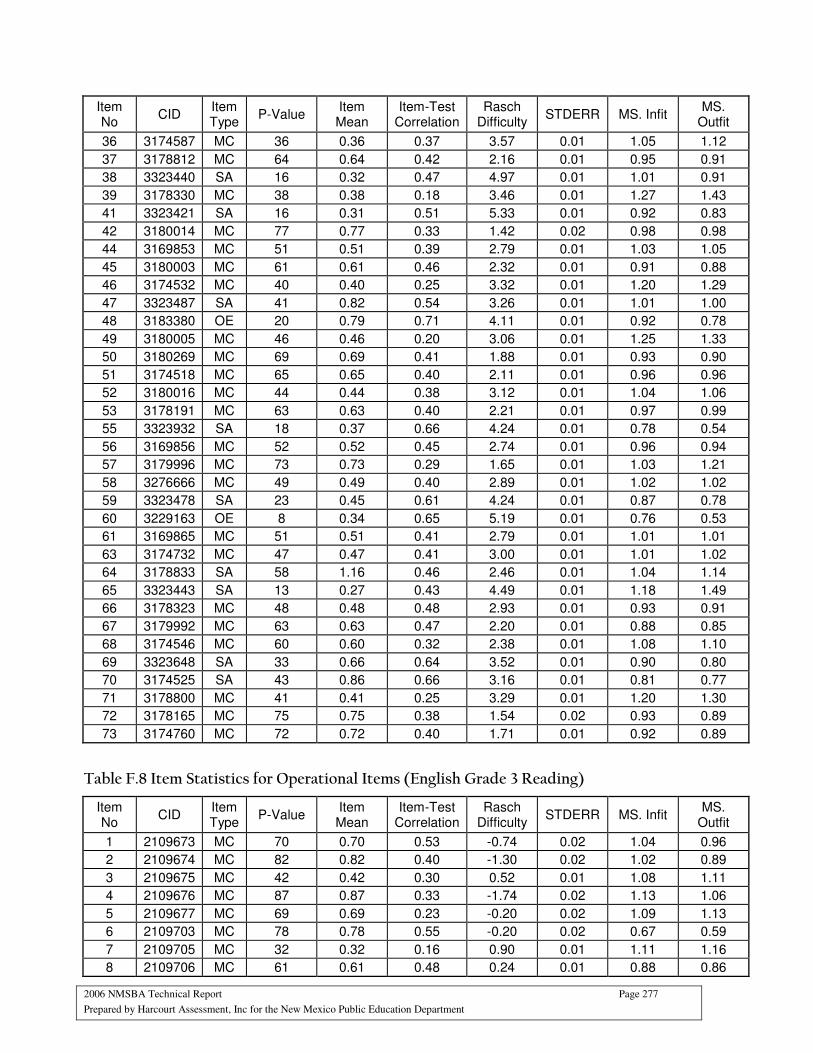
2006 NMSBA Technical Report Page 277
Prepared by Harcourt Assessment, Inc for the New Mexico Public Education Department
Item No
CID Item Type
P-Value Item Mean
Item-Test Correlation
Rasch Difficulty
STDERR MS. Infit MS.
Outfit
36 3174587 MC 36 0.36 0.37 3.57 0.01 1.05 1.12
37 3178812 MC 64 0.64 0.42 2.16 0.01 0.95 0.91
38 3323440 SA 16 0.32 0.47 4.97 0.01 1.01 0.91
39 3178330 MC 38 0.38 0.18 3.46 0.01 1.27 1.43
41 3323421 SA 16 0.31 0.51 5.33 0.01 0.92 0.83
42 3180014 MC 77 0.77 0.33 1.42 0.02 0.98 0.98
44 3169853 MC 51 0.51 0.39 2.79 0.01 1.03 1.05
45 3180003 MC 61 0.61 0.46 2.32 0.01 0.91 0.88
46 3174532 MC 40 0.40 0.25 3.32 0.01 1.20 1.29
47 3323487 SA 41 0.82 0.54 3.26 0.01 1.01 1.00
48 3183380 OE 20 0.79 0.71 4.11 0.01 0.92 0.78
49 3180005 MC 46 0.46 0.20 3.06 0.01 1.25 1.33
50 3180269 MC 69 0.69 0.41 1.88 0.01 0.93 0.90
51 3174518 MC 65 0.65 0.40 2.11 0.01 0.96 0.96
52 3180016 MC 44 0.44 0.38 3.12 0.01 1.04 1.06
53 3178191 MC 63 0.63 0.40 2.21 0.01 0.97 0.99
55 3323932 SA 18 0.37 0.66 4.24 0.01 0.78 0.54
56 3169856 MC 52 0.52 0.45 2.74 0.01 0.96 0.94
57 3179996 MC 73 0.73 0.29 1.65 0.01 1.03 1.21
58 3276666 MC 49 0.49 0.40 2.89 0.01 1.02 1.02
59 3323478 SA 23 0.45 0.61 4.24 0.01 0.87 0.78
60 3229163 OE 8 0.34 0.65 5.19 0.01 0.76 0.53
61 3169865 MC 51 0.51 0.41 2.79 0.01 1.01 1.01
63 3174732 MC 47 0.47 0.41 3.00 0.01 1.01 1.02
64 3178833 SA 58 1.16 0.46 2.46 0.01 1.04 1.14
65 3323443 SA 13 0.27 0.43 4.49 0.01 1.18 1.49
66 3178323 MC 48 0.48 0.48 2.93 0.01 0.93 0.91
67 3179992 MC 63 0.63 0.47 2.20 0.01 0.88 0.85
68 3174546 MC 60 0.60 0.32 2.38 0.01 1.08 1.10
69 3323648 SA 33 0.66 0.64 3.52 0.01 0.90 0.80
70 3174525 SA 43 0.86 0.66 3.16 0.01 0.81 0.77
71 3178800 MC 41 0.41 0.25 3.29 0.01 1.20 1.30
72 3178165 MC 75 0.75 0.38 1.54 0.02 0.93 0.89
73 3174760 MC 72 0.72 0.40 1.71 0.01 0.92 0.89
Table F.8 Item Statistics for Operational Items (English Grade 3 Reading)
Item No
CID Item Type
P-Value Item Mean
Item-Test Correlation
Rasch Difficulty
STDERR MS. Infit MS.
Outfit
1 2109673 MC 70 0.70 0.53 -0.74 0.02 1.04 0.96
2 2109674 MC 82 0.82 0.40 -1.30 0.02 1.02 0.89
3 2109675 MC 42 0.42 0.30 0.52 0.01 1.08 1.11
4 2109676 MC 87 0.87 0.33 -1.74 0.02 1.13 1.06
5 2109677 MC 69 0.69 0.23 -0.20 0.02 1.09 1.13
6 2109703 MC 78 0.78 0.55 -0.20 0.02 0.67 0.59
7 2109705 MC 32 0.32 0.16 0.90 0.01 1.11 1.16
8 2109706 MC 61 0.61 0.48 0.24 0.01 0.88 0.86
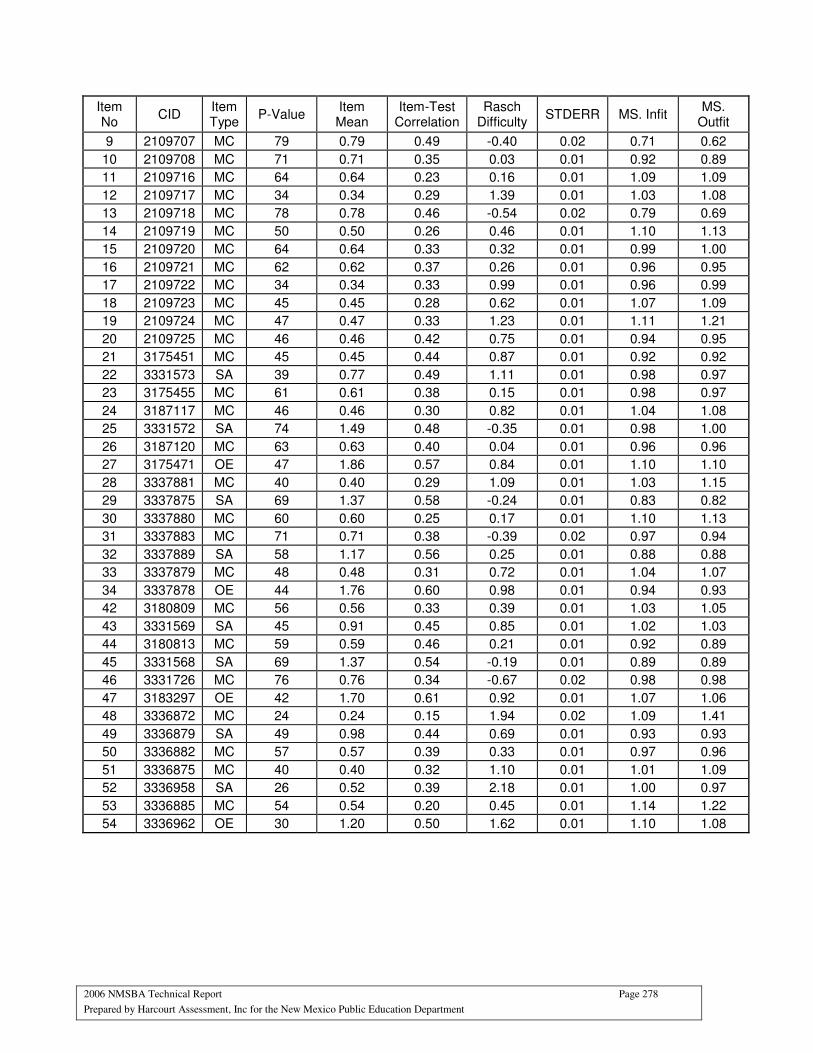
2006 NMSBA Technical Report Page 278
Prepared by Harcourt Assessment, Inc for the New Mexico Public Education Department
Item No
CID Item Type
P-Value Item Mean
Item-Test Correlation
Rasch Difficulty
STDERR MS. Infit MS.
Outfit
9 2109707 MC 79 0.79 0.49 -0.40 0.02 0.71 0.62
10 2109708 MC 71 0.71 0.35 0.03 0.01 0.92 0.89
11 2109716 MC 64 0.64 0.23 0.16 0.01 1.09 1.09
12 2109717 MC 34 0.34 0.29 1.39 0.01 1.03 1.08
13 2109718 MC 78 0.78 0.46 -0.54 0.02 0.79 0.69
14 2109719 MC 50 0.50 0.26 0.46 0.01 1.10 1.13
15 2109720 MC 64 0.64 0.33 0.32 0.01 0.99 1.00
16 2109721 MC 62 0.62 0.37 0.26 0.01 0.96 0.95
17 2109722 MC 34 0.34 0.33 0.99 0.01 0.96 0.99
18 2109723 MC 45 0.45 0.28 0.62 0.01 1.07 1.09
19 2109724 MC 47 0.47 0.33 1.23 0.01 1.11 1.21
20 2109725 MC 46 0.46 0.42 0.75 0.01 0.94 0.95
21 3175451 MC 45 0.45 0.44 0.87 0.01 0.92 0.92
22 3331573 SA 39 0.77 0.49 1.11 0.01 0.98 0.97
23 3175455 MC 61 0.61 0.38 0.15 0.01 0.98 0.97
24 3187117 MC 46 0.46 0.30 0.82 0.01 1.04 1.08
25 3331572 SA 74 1.49 0.48 -0.35 0.01 0.98 1.00
26 3187120 MC 63 0.63 0.40 0.04 0.01 0.96 0.96
27 3175471 OE 47 1.86 0.57 0.84 0.01 1.10 1.10
28 3337881 MC 40 0.40 0.29 1.09 0.01 1.03 1.15
29 3337875 SA 69 1.37 0.58 -0.24 0.01 0.83 0.82
30 3337880 MC 60 0.60 0.25 0.17 0.01 1.10 1.13
31 3337883 MC 71 0.71 0.38 -0.39 0.02 0.97 0.94
32 3337889 SA 58 1.17 0.56 0.25 0.01 0.88 0.88
33 3337879 MC 48 0.48 0.31 0.72 0.01 1.04 1.07
34 3337878 OE 44 1.76 0.60 0.98 0.01 0.94 0.93
42 3180809 MC 56 0.56 0.33 0.39 0.01 1.03 1.05
43 3331569 SA 45 0.91 0.45 0.85 0.01 1.02 1.03
44 3180813 MC 59 0.59 0.46 0.21 0.01 0.92 0.89
45 3331568 SA 69 1.37 0.54 -0.19 0.01 0.89 0.89
46 3331726 MC 76 0.76 0.34 -0.67 0.02 0.98 0.98
47 3183297 OE 42 1.70 0.61 0.92 0.01 1.07 1.06
48 3336872 MC 24 0.24 0.15 1.94 0.02 1.09 1.41
49 3336879 SA 49 0.98 0.44 0.69 0.01 0.93 0.93
50 3336882 MC 57 0.57 0.39 0.33 0.01 0.97 0.96
51 3336875 MC 40 0.40 0.32 1.10 0.01 1.01 1.09
52 3336958 SA 26 0.52 0.39 2.18 0.01 1.00 0.97
53 3336885 MC 54 0.54 0.20 0.45 0.01 1.14 1.22
54 3336962 OE 30 1.20 0.50 1.62 0.01 1.10 1.08
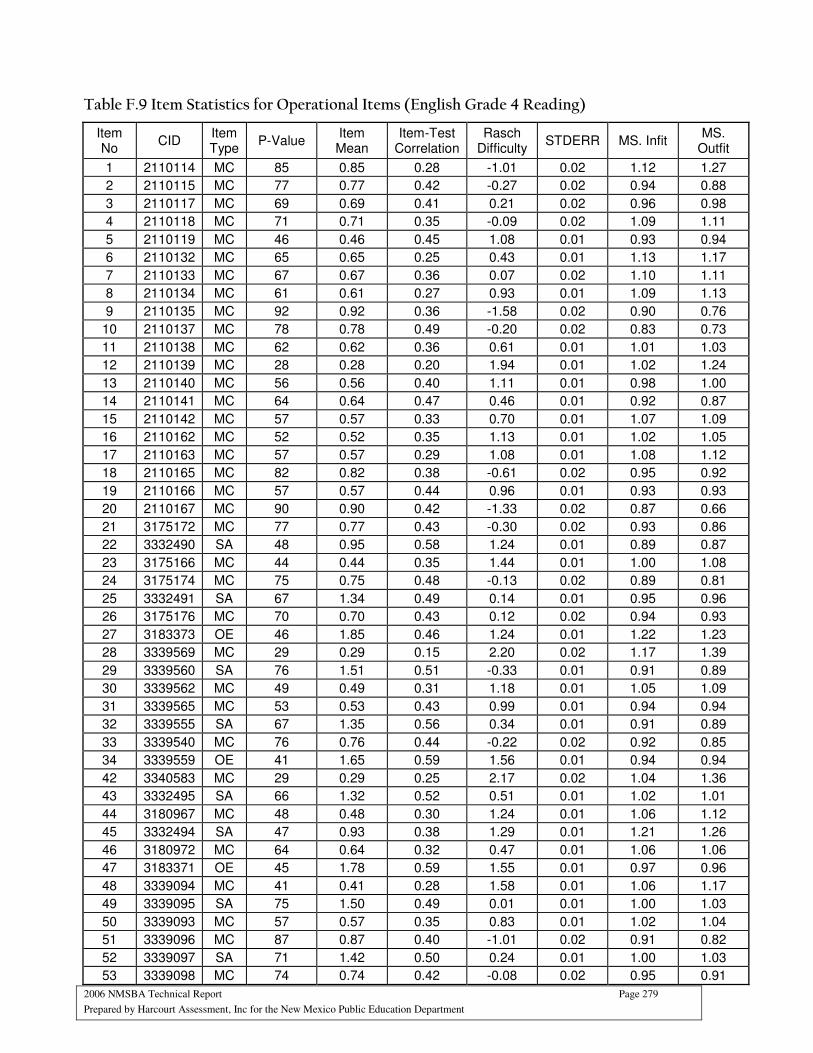
2006 NMSBA Technical Report Page 279
Prepared by Harcourt Assessment, Inc for the New Mexico Public Education Department
Table F.9 Item Statistics for Operational Items (English Grade 4 Reading)
Item No
CID Item Type
P-Value Item Mean
Item-Test Correlation
Rasch Difficulty
STDERR MS. Infit MS.
Outfit
1 2110114 MC 85 0.85 0.28 -1.01 0.02 1.12 1.27
2 2110115 MC 77 0.77 0.42 -0.27 0.02 0.94 0.88
3 2110117 MC 69 0.69 0.41 0.21 0.02 0.96 0.98
4 2110118 MC 71 0.71 0.35 -0.09 0.02 1.09 1.11
5 2110119 MC 46 0.46 0.45 1.08 0.01 0.93 0.94
6 2110132 MC 65 0.65 0.25 0.43 0.01 1.13 1.17
7 2110133 MC 67 0.67 0.36 0.07 0.02 1.10 1.11
8 2110134 MC 61 0.61 0.27 0.93 0.01 1.09 1.13
9 2110135 MC 92 0.92 0.36 -1.58 0.02 0.90 0.76
10 2110137 MC 78 0.78 0.49 -0.20 0.02 0.83 0.73
11 2110138 MC 62 0.62 0.36 0.61 0.01 1.01 1.03
12 2110139 MC 28 0.28 0.20 1.94 0.01 1.02 1.24
13 2110140 MC 56 0.56 0.40 1.11 0.01 0.98 1.00
14 2110141 MC 64 0.64 0.47 0.46 0.01 0.92 0.87
15 2110142 MC 57 0.57 0.33 0.70 0.01 1.07 1.09
16 2110162 MC 52 0.52 0.35 1.13 0.01 1.02 1.05
17 2110163 MC 57 0.57 0.29 1.08 0.01 1.08 1.12
18 2110165 MC 82 0.82 0.38 -0.61 0.02 0.95 0.92
19 2110166 MC 57 0.57 0.44 0.96 0.01 0.93 0.93
20 2110167 MC 90 0.90 0.42 -1.33 0.02 0.87 0.66
21 3175172 MC 77 0.77 0.43 -0.30 0.02 0.93 0.86
22 3332490 SA 48 0.95 0.58 1.24 0.01 0.89 0.87
23 3175166 MC 44 0.44 0.35 1.44 0.01 1.00 1.08
24 3175174 MC 75 0.75 0.48 -0.13 0.02 0.89 0.81
25 3332491 SA 67 1.34 0.49 0.14 0.01 0.95 0.96
26 3175176 MC 70 0.70 0.43 0.12 0.02 0.94 0.93
27 3183373 OE 46 1.85 0.46 1.24 0.01 1.22 1.23
28 3339569 MC 29 0.29 0.15 2.20 0.02 1.17 1.39
29 3339560 SA 76 1.51 0.51 -0.33 0.01 0.91 0.89
30 3339562 MC 49 0.49 0.31 1.18 0.01 1.05 1.09
31 3339565 MC 53 0.53 0.43 0.99 0.01 0.94 0.94
32 3339555 SA 67 1.35 0.56 0.34 0.01 0.91 0.89
33 3339540 MC 76 0.76 0.44 -0.22 0.02 0.92 0.85
34 3339559 OE 41 1.65 0.59 1.56 0.01 0.94 0.94
42 3340583 MC 29 0.29 0.25 2.17 0.02 1.04 1.36
43 3332495 SA 66 1.32 0.52 0.51 0.01 1.02 1.01
44 3180967 MC 48 0.48 0.30 1.24 0.01 1.06 1.12
45 3332494 SA 47 0.93 0.38 1.29 0.01 1.21 1.26
46 3180972 MC 64 0.64 0.32 0.47 0.01 1.06 1.06
47 3183371 OE 45 1.78 0.59 1.55 0.01 0.97 0.96
48 3339094 MC 41 0.41 0.28 1.58 0.01 1.06 1.17
49 3339095 SA 75 1.50 0.49 0.01 0.01 1.00 1.03
50 3339093 MC 57 0.57 0.35 0.83 0.01 1.02 1.04
51 3339096 MC 87 0.87 0.40 -1.01 0.02 0.91 0.82
52 3339097 SA 71 1.42 0.50 0.24 0.01 1.00 1.03
53 3339098 MC 74 0.74 0.42 -0.08 0.02 0.95 0.91
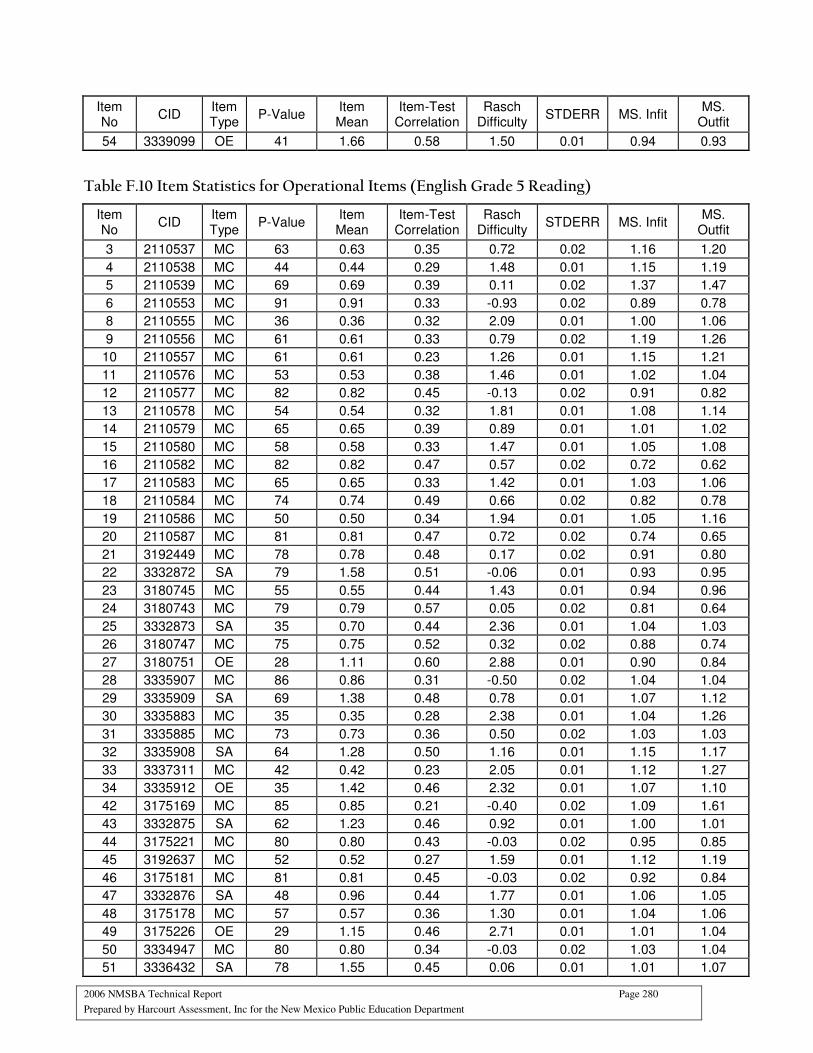
2006 NMSBA Technical Report Page 280
Prepared by Harcourt Assessment, Inc for the New Mexico Public Education Department
Item No
CID Item Type
P-Value Item Mean
Item-Test Correlation
Rasch Difficulty
STDERR MS. Infit MS.
Outfit
54 3339099 OE 41 1.66 0.58 1.50 0.01 0.94 0.93
Table F.10 Item Statistics for Operational Items (English Grade 5 Reading)
Item No
CID Item Type
P-Value Item Mean
Item-Test Correlation
Rasch Difficulty
STDERR MS. Infit MS.
Outfit
3 2110537 MC 63 0.63 0.35 0.72 0.02 1.16 1.20
4 2110538 MC 44 0.44 0.29 1.48 0.01 1.15 1.19
5 2110539 MC 69 0.69 0.39 0.11 0.02 1.37 1.47
6 2110553 MC 91 0.91 0.33 -0.93 0.02 0.89 0.78
8 2110555 MC 36 0.36 0.32 2.09 0.01 1.00 1.06
9 2110556 MC 61 0.61 0.33 0.79 0.02 1.19 1.26
10 2110557 MC 61 0.61 0.23 1.26 0.01 1.15 1.21
11 2110576 MC 53 0.53 0.38 1.46 0.01 1.02 1.04
12 2110577 MC 82 0.82 0.45 -0.13 0.02 0.91 0.82
13 2110578 MC 54 0.54 0.32 1.81 0.01 1.08 1.14
14 2110579 MC 65 0.65 0.39 0.89 0.01 1.01 1.02
15 2110580 MC 58 0.58 0.33 1.47 0.01 1.05 1.08
16 2110582 MC 82 0.82 0.47 0.57 0.02 0.72 0.62
17 2110583 MC 65 0.65 0.33 1.42 0.01 1.03 1.06
18 2110584 MC 74 0.74 0.49 0.66 0.02 0.82 0.78
19 2110586 MC 50 0.50 0.34 1.94 0.01 1.05 1.16
20 2110587 MC 81 0.81 0.47 0.72 0.02 0.74 0.65
21 3192449 MC 78 0.78 0.48 0.17 0.02 0.91 0.80
22 3332872 SA 79 1.58 0.51 -0.06 0.01 0.93 0.95
23 3180745 MC 55 0.55 0.44 1.43 0.01 0.94 0.96
24 3180743 MC 79 0.79 0.57 0.05 0.02 0.81 0.64
25 3332873 SA 35 0.70 0.44 2.36 0.01 1.04 1.03
26 3180747 MC 75 0.75 0.52 0.32 0.02 0.88 0.74
27 3180751 OE 28 1.11 0.60 2.88 0.01 0.90 0.84
28 3335907 MC 86 0.86 0.31 -0.50 0.02 1.04 1.04
29 3335909 SA 69 1.38 0.48 0.78 0.01 1.07 1.12
30 3335883 MC 35 0.35 0.28 2.38 0.01 1.04 1.26
31 3335885 MC 73 0.73 0.36 0.50 0.02 1.03 1.03
32 3335908 SA 64 1.28 0.50 1.16 0.01 1.15 1.17
33 3337311 MC 42 0.42 0.23 2.05 0.01 1.12 1.27
34 3335912 OE 35 1.42 0.46 2.32 0.01 1.07 1.10
42 3175169 MC 85 0.85 0.21 -0.40 0.02 1.09 1.61
43 3332875 SA 62 1.23 0.46 0.92 0.01 1.00 1.01
44 3175221 MC 80 0.80 0.43 -0.03 0.02 0.95 0.85
45 3192637 MC 52 0.52 0.27 1.59 0.01 1.12 1.19
46 3175181 MC 81 0.81 0.45 -0.03 0.02 0.92 0.84
47 3332876 SA 48 0.96 0.44 1.77 0.01 1.06 1.05
48 3175178 MC 57 0.57 0.36 1.30 0.01 1.04 1.06
49 3175226 OE 29 1.15 0.46 2.71 0.01 1.01 1.04
50 3334947 MC 80 0.80 0.34 -0.03 0.02 1.03 1.04
51 3336432 SA 78 1.55 0.45 0.06 0.01 1.01 1.07

2006 NMSBA Technical Report Page 281
Prepared by Harcourt Assessment, Inc for the New Mexico Public Education Department
Item No
CID Item Type
P-Value Item Mean
Item-Test Correlation
Rasch Difficulty
STDERR MS. Infit MS.
Outfit
52 3334968 MC 68 0.68 0.41 0.78 0.02 0.99 0.97
53 3334949 MC 83 0.83 0.52 -0.25 0.02 0.84 0.64
54 3334941 MC 67 0.67 0.41 0.79 0.02 0.99 0.97
55 3334974 SA 57 1.13 0.47 1.00 0.01 0.90 0.88
56 3336474 MC 58 0.58 0.41 1.27 0.01 0.98 1.00
57 3334967 OE 28 1.11 0.59 2.89 0.01 0.85 0.84
Table F.11 Item Statistics for Operational Items (English Grade 6 Reading)
Item No
CID Item Type
P-Value Item Mean
Item-Test Correlation
Rasch Difficulty
STDERR MS. Infit MS.
Outfit
1 2110954 MC 83 0.83 0.42 -0.30 0.02 1.00 0.88
2 2110955 MC 65 0.65 0.38 0.80 0.01 1.02 1.02
3 2110956 MC 47 0.47 0.33 1.55 0.01 1.02 1.03
4 2110957 MC 52 0.52 0.28 1.46 0.01 1.07 1.10
5 2110958 MC 95 0.95 0.33 -0.92 0.02 0.57 0.45
6 2110960 MC 54 0.54 0.09 1.49 0.01 1.23 1.30
7 2110961 MC 94 0.94 0.32 -1.04 0.02 0.64 0.48
8 2110962 MC 50 0.50 0.37 1.31 0.01 1.03 1.04
9 2110963 MC 87 0.87 0.38 -0.50 0.02 0.94 0.83
10 2110964 MC 29 0.29 0.20 2.37 0.01 1.00 1.13
11 2110990 MC 55 0.55 0.30 1.64 0.01 1.03 1.08
12 2110991 MC 52 0.52 0.31 1.58 0.01 1.03 1.05
13 2110992 MC 59 0.59 0.17 1.60 0.01 1.15 1.21
14 2110993 MC 66 0.66 0.34 0.88 0.01 1.01 0.99
15 2110994 MC 65 0.65 0.24 1.31 0.01 1.05 1.06
16 2111002 MC 83 0.83 0.40 -0.12 0.02 0.92 0.83
17 2111004 MC 29 0.29 0.12 2.81 0.02 1.20 1.47
18 2111005 MC 56 0.56 0.17 1.36 0.01 1.16 1.21
19 2111006 MC 66 0.66 0.30 0.89 0.01 1.04 1.04
20 2111007 MC 50 0.50 0.28 1.84 0.01 1.06 1.10
21 3176324 MC 80 0.80 0.46 0.09 0.02 0.88 0.77
22 3331841 SA 63 1.27 0.38 0.97 0.01 1.08 1.08
23 3176336 MC 50 0.50 0.22 1.69 0.01 1.11 1.14
24 3193861 MC 53 0.53 0.30 1.51 0.01 1.04 1.07
25 3331848 SA 27 0.54 0.25 2.94 0.01 1.15 1.18
26 3176338 MC 83 0.83 0.42 -0.15 0.02 0.90 0.81
27 3193997 OE 44 1.76 0.55 2.03 0.01 0.97 0.96
28 3334234 MC 47 0.47 0.33 1.79 0.01 1.01 1.02
29 3334270 SA 64 1.27 0.61 1.13 0.01 0.81 0.78
30 3334238 MC 59 0.59 0.42 1.24 0.01 0.94 0.92
31 3334264 MC 54 0.54 0.43 1.49 0.01 0.92 0.92
32 3334271 SA 46 0.93 0.38 1.80 0.01 1.14 1.17
33 3334236 MC 65 0.65 0.39 0.95 0.01 0.96 0.94
34 3334266 OE 31 1.22 0.59 2.64 0.01 0.87 0.86
42 3331858 SA 91 1.82 0.42 -0.08 0.01 0.95 0.92
43 3176420 MC 82 0.82 0.49 -0.09 0.02 0.85 0.70
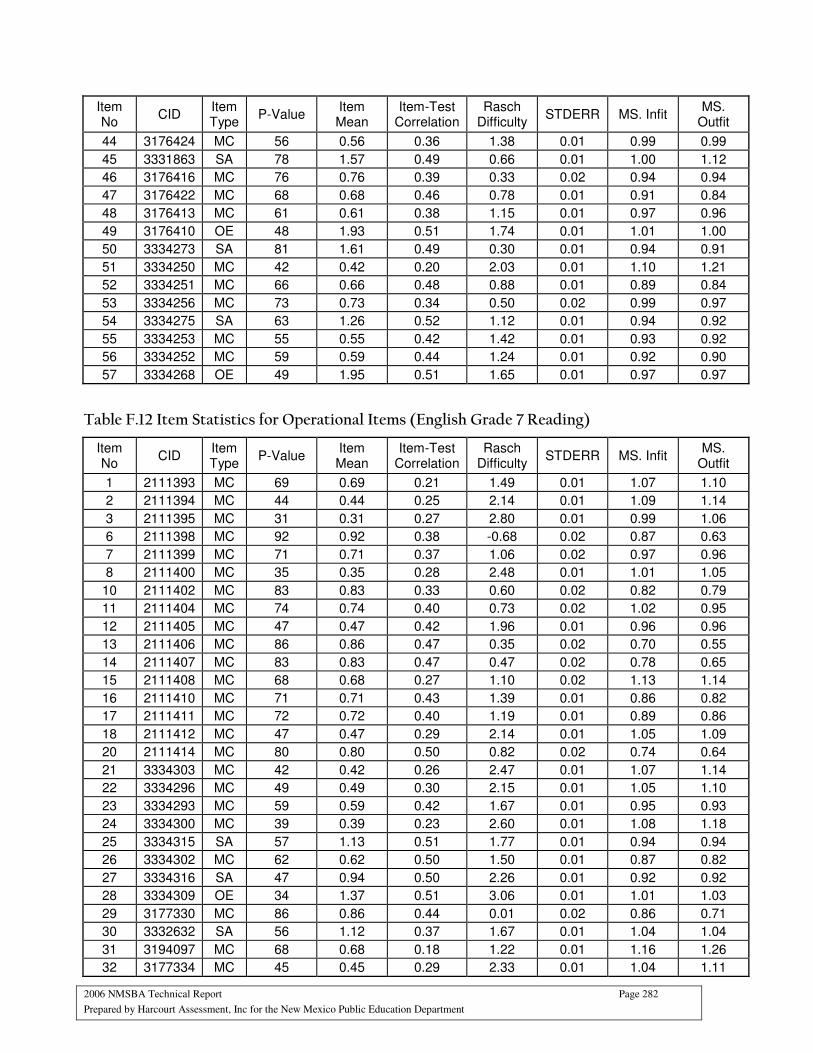
2006 NMSBA Technical Report Page 282
Prepared by Harcourt Assessment, Inc for the New Mexico Public Education Department
Item No
CID Item Type
P-Value Item Mean
Item-Test Correlation
Rasch Difficulty
STDERR MS. Infit MS.
Outfit
44 3176424 MC 56 0.56 0.36 1.38 0.01 0.99 0.99
45 3331863 SA 78 1.57 0.49 0.66 0.01 1.00 1.12
46 3176416 MC 76 0.76 0.39 0.33 0.02 0.94 0.94
47 3176422 MC 68 0.68 0.46 0.78 0.01 0.91 0.84
48 3176413 MC 61 0.61 0.38 1.15 0.01 0.97 0.96
49 3176410 OE 48 1.93 0.51 1.74 0.01 1.01 1.00
50 3334273 SA 81 1.61 0.49 0.30 0.01 0.94 0.91
51 3334250 MC 42 0.42 0.20 2.03 0.01 1.10 1.21
52 3334251 MC 66 0.66 0.48 0.88 0.01 0.89 0.84
53 3334256 MC 73 0.73 0.34 0.50 0.02 0.99 0.97
54 3334275 SA 63 1.26 0.52 1.12 0.01 0.94 0.92
55 3334253 MC 55 0.55 0.42 1.42 0.01 0.93 0.92
56 3334252 MC 59 0.59 0.44 1.24 0.01 0.92 0.90
57 3334268 OE 49 1.95 0.51 1.65 0.01 0.97 0.97
Table F.12 Item Statistics for Operational Items (English Grade 7 Reading)
Item No
CID Item Type
P-Value Item Mean
Item-Test Correlation
Rasch Difficulty
STDERR MS. Infit MS.
Outfit
1 2111393 MC 69 0.69 0.21 1.49 0.01 1.07 1.10
2 2111394 MC 44 0.44 0.25 2.14 0.01 1.09 1.14
3 2111395 MC 31 0.31 0.27 2.80 0.01 0.99 1.06
6 2111398 MC 92 0.92 0.38 -0.68 0.02 0.87 0.63
7 2111399 MC 71 0.71 0.37 1.06 0.02 0.97 0.96
8 2111400 MC 35 0.35 0.28 2.48 0.01 1.01 1.05
10 2111402 MC 83 0.83 0.33 0.60 0.02 0.82 0.79
11 2111404 MC 74 0.74 0.40 0.73 0.02 1.02 0.95
12 2111405 MC 47 0.47 0.42 1.96 0.01 0.96 0.96
13 2111406 MC 86 0.86 0.47 0.35 0.02 0.70 0.55
14 2111407 MC 83 0.83 0.47 0.47 0.02 0.78 0.65
15 2111408 MC 68 0.68 0.27 1.10 0.02 1.13 1.14
16 2111410 MC 71 0.71 0.43 1.39 0.01 0.86 0.82
17 2111411 MC 72 0.72 0.40 1.19 0.01 0.89 0.86
18 2111412 MC 47 0.47 0.29 2.14 0.01 1.05 1.09
20 2111414 MC 80 0.80 0.50 0.82 0.02 0.74 0.64
21 3334303 MC 42 0.42 0.26 2.47 0.01 1.07 1.14
22 3334296 MC 49 0.49 0.30 2.15 0.01 1.05 1.10
23 3334293 MC 59 0.59 0.42 1.67 0.01 0.95 0.93
24 3334300 MC 39 0.39 0.23 2.60 0.01 1.08 1.18
25 3334315 SA 57 1.13 0.51 1.77 0.01 0.94 0.94
26 3334302 MC 62 0.62 0.50 1.50 0.01 0.87 0.82
27 3334316 SA 47 0.94 0.50 2.26 0.01 0.92 0.92
28 3334309 OE 34 1.37 0.51 3.06 0.01 1.01 1.03
29 3177330 MC 86 0.86 0.44 0.01 0.02 0.86 0.71
30 3332632 SA 56 1.12 0.37 1.67 0.01 1.04 1.04
31 3194097 MC 68 0.68 0.18 1.22 0.01 1.16 1.26
32 3177334 MC 45 0.45 0.29 2.33 0.01 1.04 1.11
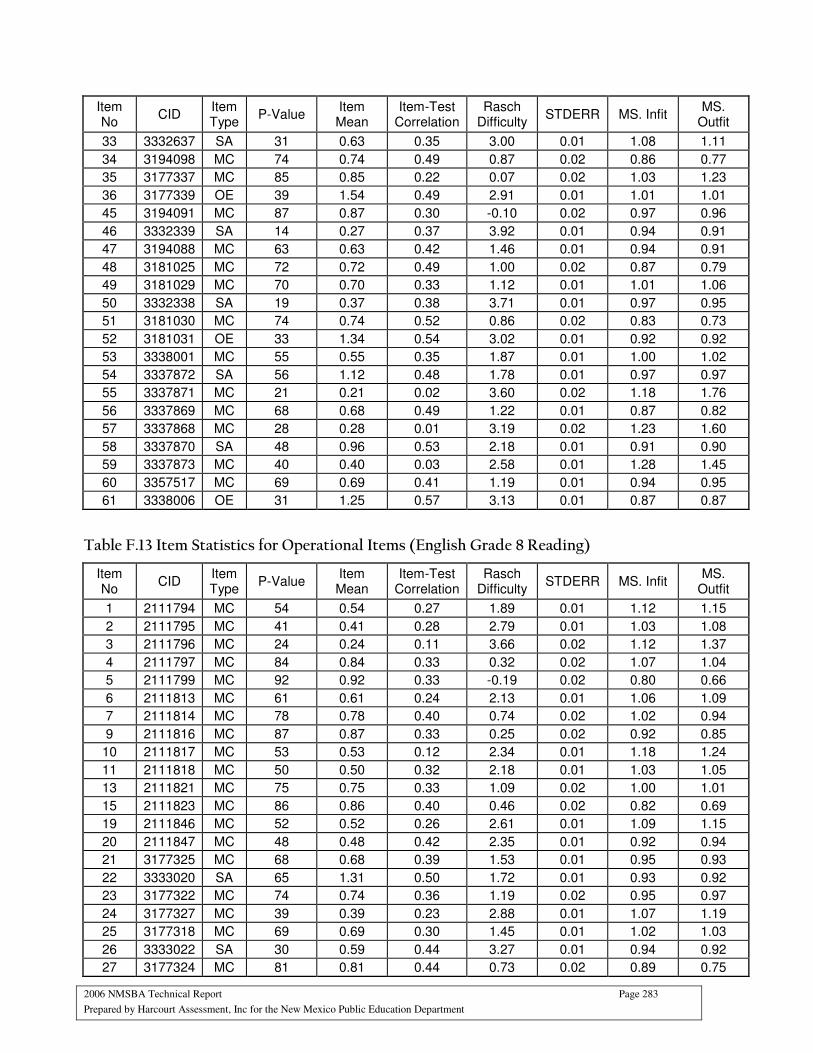
2006 NMSBA Technical Report Page 283
Prepared by Harcourt Assessment, Inc for the New Mexico Public Education Department
Item No
CID Item Type
P-Value Item Mean
Item-Test Correlation
Rasch Difficulty
STDERR MS. Infit MS.
Outfit
33 3332637 SA 31 0.63 0.35 3.00 0.01 1.08 1.11
34 3194098 MC 74 0.74 0.49 0.87 0.02 0.86 0.77
35 3177337 MC 85 0.85 0.22 0.07 0.02 1.03 1.23
36 3177339 OE 39 1.54 0.49 2.91 0.01 1.01 1.01
45 3194091 MC 87 0.87 0.30 -0.10 0.02 0.97 0.96
46 3332339 SA 14 0.27 0.37 3.92 0.01 0.94 0.91
47 3194088 MC 63 0.63 0.42 1.46 0.01 0.94 0.91
48 3181025 MC 72 0.72 0.49 1.00 0.02 0.87 0.79
49 3181029 MC 70 0.70 0.33 1.12 0.01 1.01 1.06
50 3332338 SA 19 0.37 0.38 3.71 0.01 0.97 0.95
51 3181030 MC 74 0.74 0.52 0.86 0.02 0.83 0.73
52 3181031 OE 33 1.34 0.54 3.02 0.01 0.92 0.92
53 3338001 MC 55 0.55 0.35 1.87 0.01 1.00 1.02
54 3337872 SA 56 1.12 0.48 1.78 0.01 0.97 0.97
55 3337871 MC 21 0.21 0.02 3.60 0.02 1.18 1.76
56 3337869 MC 68 0.68 0.49 1.22 0.01 0.87 0.82
57 3337868 MC 28 0.28 0.01 3.19 0.02 1.23 1.60
58 3337870 SA 48 0.96 0.53 2.18 0.01 0.91 0.90
59 3337873 MC 40 0.40 0.03 2.58 0.01 1.28 1.45
60 3357517 MC 69 0.69 0.41 1.19 0.01 0.94 0.95
61 3338006 OE 31 1.25 0.57 3.13 0.01 0.87 0.87
Table F.13 Item Statistics for Operational Items (English Grade 8 Reading)
Item No
CID Item Type
P-Value Item Mean
Item-Test Correlation
Rasch Difficulty
STDERR MS. Infit MS.
Outfit
1 2111794 MC 54 0.54 0.27 1.89 0.01 1.12 1.15
2 2111795 MC 41 0.41 0.28 2.79 0.01 1.03 1.08
3 2111796 MC 24 0.24 0.11 3.66 0.02 1.12 1.37
4 2111797 MC 84 0.84 0.33 0.32 0.02 1.07 1.04
5 2111799 MC 92 0.92 0.33 -0.19 0.02 0.80 0.66
6 2111813 MC 61 0.61 0.24 2.13 0.01 1.06 1.09
7 2111814 MC 78 0.78 0.40 0.74 0.02 1.02 0.94
9 2111816 MC 87 0.87 0.33 0.25 0.02 0.92 0.85
10 2111817 MC 53 0.53 0.12 2.34 0.01 1.18 1.24
11 2111818 MC 50 0.50 0.32 2.18 0.01 1.03 1.05
13 2111821 MC 75 0.75 0.33 1.09 0.02 1.00 1.01
15 2111823 MC 86 0.86 0.40 0.46 0.02 0.82 0.69
19 2111846 MC 52 0.52 0.26 2.61 0.01 1.09 1.15
20 2111847 MC 48 0.48 0.42 2.35 0.01 0.92 0.94
21 3177325 MC 68 0.68 0.39 1.53 0.01 0.95 0.93
22 3333020 SA 65 1.31 0.50 1.72 0.01 0.93 0.92
23 3177322 MC 74 0.74 0.36 1.19 0.02 0.95 0.97
24 3177327 MC 39 0.39 0.23 2.88 0.01 1.07 1.19
25 3177318 MC 69 0.69 0.30 1.45 0.01 1.02 1.03
26 3333022 SA 30 0.59 0.44 3.27 0.01 0.94 0.92
27 3177324 MC 81 0.81 0.44 0.73 0.02 0.89 0.75

2006 NMSBA Technical Report Page 284
Prepared by Harcourt Assessment, Inc for the New Mexico Public Education Department
Item No
CID Item Type
P-Value Item Mean
Item-Test Correlation
Rasch Difficulty
STDERR MS. Infit MS.
Outfit
28 3177331 OE 27 1.07 0.62 3.52 0.01 0.78 0.77
29 3180746 MC 93 0.93 0.31 -0.47 0.03 0.90 0.81
30 3204011 MC 80 0.80 0.50 0.84 0.02 0.83 0.69
31 3333018 SA 36 0.72 0.25 2.99 0.01 1.21 1.28
32 3180741 MC 53 0.53 0.15 2.23 0.01 1.15 1.22
33 3180744 MC 64 0.64 0.27 1.74 0.01 1.06 1.07
34 3333019 SA 17 0.33 0.36 3.70 0.01 0.99 0.99
35 3204012 MC 85 0.85 0.25 0.45 0.02 1.01 1.07
36 3204010 MC 90 0.90 0.33 -0.03 0.02 0.91 0.86
37 3180748 OE 35 1.42 0.55 3.27 0.01 0.91 0.91
46 3333715 MC 87 0.87 0.32 0.24 0.02 0.94 0.92
47 3333704 MC 50 0.50 0.25 2.38 0.01 1.07 1.10
48 3333741 SA 23 0.47 0.06 3.52 0.01 1.39 2.02
49 3333706 MC 44 0.44 0.29 2.67 0.01 1.02 1.07
50 3333708 MC 67 0.67 0.40 1.55 0.01 0.94 0.91
51 3333738 SA 40 0.81 0.36 2.86 0.01 1.06 1.07
52 3333707 MC 51 0.51 0.40 2.34 0.01 0.94 0.94
53 3333705 MC 63 0.63 0.33 1.77 0.01 1.00 0.99
54 3333733 OE 35 1.38 0.53 3.15 0.01 0.91 0.91
55 3333763 MC 53 0.53 0.45 2.23 0.01 0.89 0.89
56 3333814 MC 85 0.85 0.44 0.44 0.02 0.86 0.70
57 3333813 SA 49 0.98 0.51 2.44 0.01 0.93 0.92
58 3333764 MC 47 0.47 0.32 2.50 0.01 1.00 1.03
59 3333762 MC 15 0.15 -0.07 4.34 0.02 1.18 1.99
60 3333815 SA 23 0.46 0.39 3.61 0.01 0.98 0.96
61 3341855 MC 89 0.89 0.36 0.05 0.02 0.90 0.76
62 3341886 MC 51 0.51 0.28 2.36 0.01 1.05 1.08
63 3333804 OE 42 1.68 0.51 2.72 0.01 0.94 0.95
Table F.14 Item Statistics for Operational Items (English Grade 9 Reading)
Item No
CID Item Type
P-Value Item Mean
Item-Test Correlation
Rasch Difficulty
STDERR MS. Infit MS.
Outfit
1 2112215 MC 48 0.48 0.33 2.40 0.01 1.04 1.07
4 2112218 MC 67 0.67 0.37 1.56 0.01 0.98 0.98
7 2112221 MC 77 0.77 0.40 0.74 0.02 1.02 0.99
8 2112223 MC 91 0.91 0.38 -0.12 0.02 0.75 0.58
9 2112224 MC 50 0.50 0.21 2.23 0.01 1.16 1.21
10 2112225 MC 81 0.81 0.31 0.66 0.02 0.99 1.02
11 2112226 MC 77 0.77 0.26 0.85 0.02 1.06 1.26
12 2112227 MC 90 0.90 0.38 -0.27 0.02 0.86 0.77
13 2112232 MC 68 0.68 0.39 1.61 0.01 0.93 0.91
14 2112233 MC 69 0.69 0.44 1.40 0.01 0.91 0.87
15 2112234 MC 76 0.76 0.43 1.07 0.01 0.87 0.81
16 2112235 MC 82 0.82 0.42 0.50 0.02 0.90 0.79
18 2112238 MC 70 0.70 0.48 1.07 0.01 0.99 0.90
19 2112239 MC 70 0.70 0.34 1.29 0.01 1.02 1.01
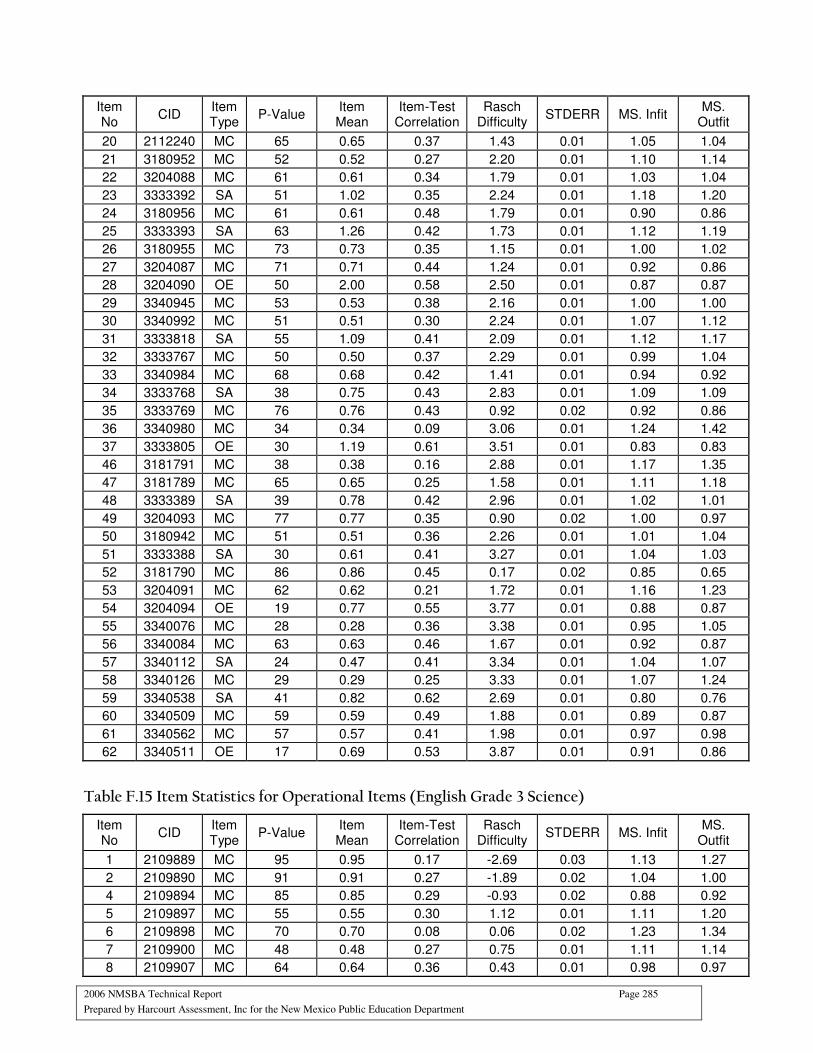
2006 NMSBA Technical Report Page 285
Prepared by Harcourt Assessment, Inc for the New Mexico Public Education Department
Item No
CID Item Type
P-Value Item Mean
Item-Test Correlation
Rasch Difficulty
STDERR MS. Infit MS.
Outfit
20 2112240 MC 65 0.65 0.37 1.43 0.01 1.05 1.04
21 3180952 MC 52 0.52 0.27 2.20 0.01 1.10 1.14
22 3204088 MC 61 0.61 0.34 1.79 0.01 1.03 1.04
23 3333392 SA 51 1.02 0.35 2.24 0.01 1.18 1.20
24 3180956 MC 61 0.61 0.48 1.79 0.01 0.90 0.86
25 3333393 SA 63 1.26 0.42 1.73 0.01 1.12 1.19
26 3180955 MC 73 0.73 0.35 1.15 0.01 1.00 1.02
27 3204087 MC 71 0.71 0.44 1.24 0.01 0.92 0.86
28 3204090 OE 50 2.00 0.58 2.50 0.01 0.87 0.87
29 3340945 MC 53 0.53 0.38 2.16 0.01 1.00 1.00
30 3340992 MC 51 0.51 0.30 2.24 0.01 1.07 1.12
31 3333818 SA 55 1.09 0.41 2.09 0.01 1.12 1.17
32 3333767 MC 50 0.50 0.37 2.29 0.01 0.99 1.04
33 3340984 MC 68 0.68 0.42 1.41 0.01 0.94 0.92
34 3333768 SA 38 0.75 0.43 2.83 0.01 1.09 1.09
35 3333769 MC 76 0.76 0.43 0.92 0.02 0.92 0.86
36 3340980 MC 34 0.34 0.09 3.06 0.01 1.24 1.42
37 3333805 OE 30 1.19 0.61 3.51 0.01 0.83 0.83
46 3181791 MC 38 0.38 0.16 2.88 0.01 1.17 1.35
47 3181789 MC 65 0.65 0.25 1.58 0.01 1.11 1.18
48 3333389 SA 39 0.78 0.42 2.96 0.01 1.02 1.01
49 3204093 MC 77 0.77 0.35 0.90 0.02 1.00 0.97
50 3180942 MC 51 0.51 0.36 2.26 0.01 1.01 1.04
51 3333388 SA 30 0.61 0.41 3.27 0.01 1.04 1.03
52 3181790 MC 86 0.86 0.45 0.17 0.02 0.85 0.65
53 3204091 MC 62 0.62 0.21 1.72 0.01 1.16 1.23
54 3204094 OE 19 0.77 0.55 3.77 0.01 0.88 0.87
55 3340076 MC 28 0.28 0.36 3.38 0.01 0.95 1.05
56 3340084 MC 63 0.63 0.46 1.67 0.01 0.92 0.87
57 3340112 SA 24 0.47 0.41 3.34 0.01 1.04 1.07
58 3340126 MC 29 0.29 0.25 3.33 0.01 1.07 1.24
59 3340538 SA 41 0.82 0.62 2.69 0.01 0.80 0.76
60 3340509 MC 59 0.59 0.49 1.88 0.01 0.89 0.87
61 3340562 MC 57 0.57 0.41 1.98 0.01 0.97 0.98
62 3340511 OE 17 0.69 0.53 3.87 0.01 0.91 0.86
Table F.15 Item Statistics for Operational Items (English Grade 3 Science)
Item No
CID Item Type
P-Value Item Mean
Item-Test Correlation
Rasch Difficulty
STDERR MS. Infit MS.
Outfit
1 2109889 MC 95 0.95 0.17 -2.69 0.03 1.13 1.27
2 2109890 MC 91 0.91 0.27 -1.89 0.02 1.04 1.00
4 2109894 MC 85 0.85 0.29 -0.93 0.02 0.88 0.92
5 2109897 MC 55 0.55 0.30 1.12 0.01 1.11 1.20
6 2109898 MC 70 0.70 0.08 0.06 0.02 1.23 1.34
7 2109900 MC 48 0.48 0.27 0.75 0.01 1.11 1.14
8 2109907 MC 64 0.64 0.36 0.43 0.01 0.98 0.97
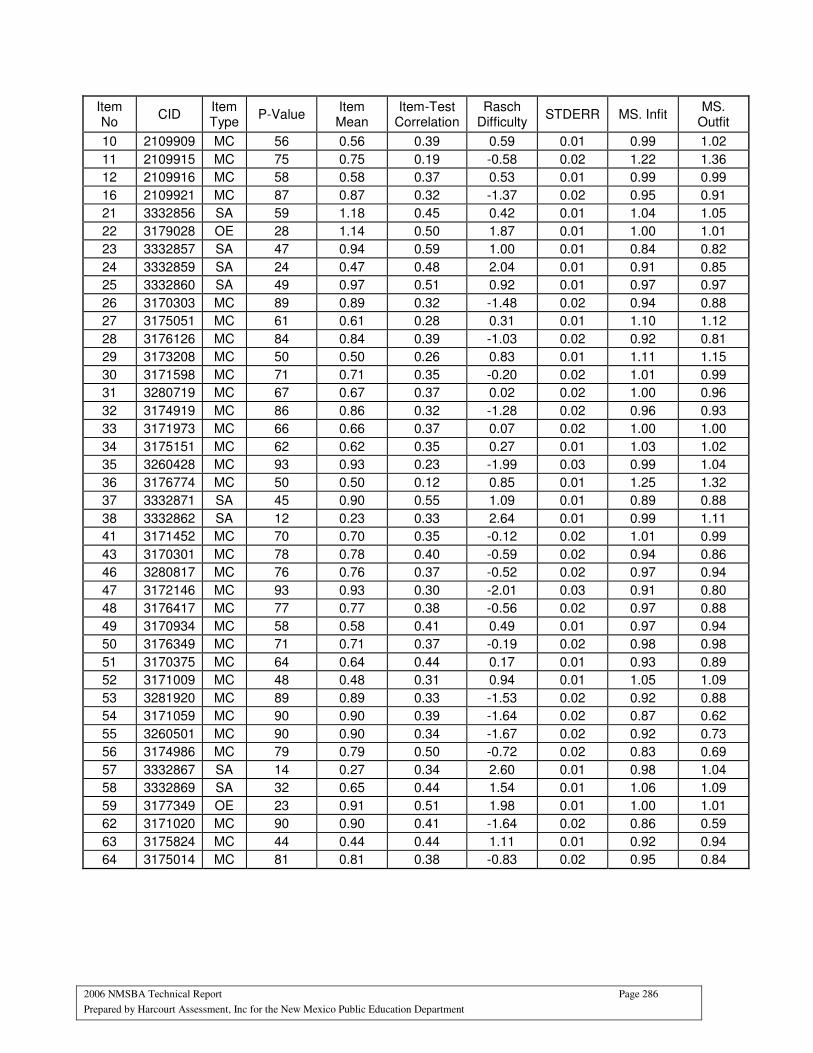
2006 NMSBA Technical Report Page 286
Prepared by Harcourt Assessment, Inc for the New Mexico Public Education Department
Item No
CID Item Type
P-Value Item Mean
Item-Test Correlation
Rasch Difficulty
STDERR MS. Infit MS.
Outfit
10 2109909 MC 56 0.56 0.39 0.59 0.01 0.99 1.02
11 2109915 MC 75 0.75 0.19 -0.58 0.02 1.22 1.36
12 2109916 MC 58 0.58 0.37 0.53 0.01 0.99 0.99
16 2109921 MC 87 0.87 0.32 -1.37 0.02 0.95 0.91
21 3332856 SA 59 1.18 0.45 0.42 0.01 1.04 1.05
22 3179028 OE 28 1.14 0.50 1.87 0.01 1.00 1.01
23 3332857 SA 47 0.94 0.59 1.00 0.01 0.84 0.82
24 3332859 SA 24 0.47 0.48 2.04 0.01 0.91 0.85
25 3332860 SA 49 0.97 0.51 0.92 0.01 0.97 0.97
26 3170303 MC 89 0.89 0.32 -1.48 0.02 0.94 0.88
27 3175051 MC 61 0.61 0.28 0.31 0.01 1.10 1.12
28 3176126 MC 84 0.84 0.39 -1.03 0.02 0.92 0.81
29 3173208 MC 50 0.50 0.26 0.83 0.01 1.11 1.15
30 3171598 MC 71 0.71 0.35 -0.20 0.02 1.01 0.99
31 3280719 MC 67 0.67 0.37 0.02 0.02 1.00 0.96
32 3174919 MC 86 0.86 0.32 -1.28 0.02 0.96 0.93
33 3171973 MC 66 0.66 0.37 0.07 0.02 1.00 1.00
34 3175151 MC 62 0.62 0.35 0.27 0.01 1.03 1.02
35 3260428 MC 93 0.93 0.23 -1.99 0.03 0.99 1.04
36 3176774 MC 50 0.50 0.12 0.85 0.01 1.25 1.32
37 3332871 SA 45 0.90 0.55 1.09 0.01 0.89 0.88
38 3332862 SA 12 0.23 0.33 2.64 0.01 0.99 1.11
41 3171452 MC 70 0.70 0.35 -0.12 0.02 1.01 0.99
43 3170301 MC 78 0.78 0.40 -0.59 0.02 0.94 0.86
46 3280817 MC 76 0.76 0.37 -0.52 0.02 0.97 0.94
47 3172146 MC 93 0.93 0.30 -2.01 0.03 0.91 0.80
48 3176417 MC 77 0.77 0.38 -0.56 0.02 0.97 0.88
49 3170934 MC 58 0.58 0.41 0.49 0.01 0.97 0.94
50 3176349 MC 71 0.71 0.37 -0.19 0.02 0.98 0.98
51 3170375 MC 64 0.64 0.44 0.17 0.01 0.93 0.89
52 3171009 MC 48 0.48 0.31 0.94 0.01 1.05 1.09
53 3281920 MC 89 0.89 0.33 -1.53 0.02 0.92 0.88
54 3171059 MC 90 0.90 0.39 -1.64 0.02 0.87 0.62
55 3260501 MC 90 0.90 0.34 -1.67 0.02 0.92 0.73
56 3174986 MC 79 0.79 0.50 -0.72 0.02 0.83 0.69
57 3332867 SA 14 0.27 0.34 2.60 0.01 0.98 1.04
58 3332869 SA 32 0.65 0.44 1.54 0.01 1.06 1.09
59 3177349 OE 23 0.91 0.51 1.98 0.01 1.00 1.01
62 3171020 MC 90 0.90 0.41 -1.64 0.02 0.86 0.59
63 3175824 MC 44 0.44 0.44 1.11 0.01 0.92 0.94
64 3175014 MC 81 0.81 0.38 -0.83 0.02 0.95 0.84
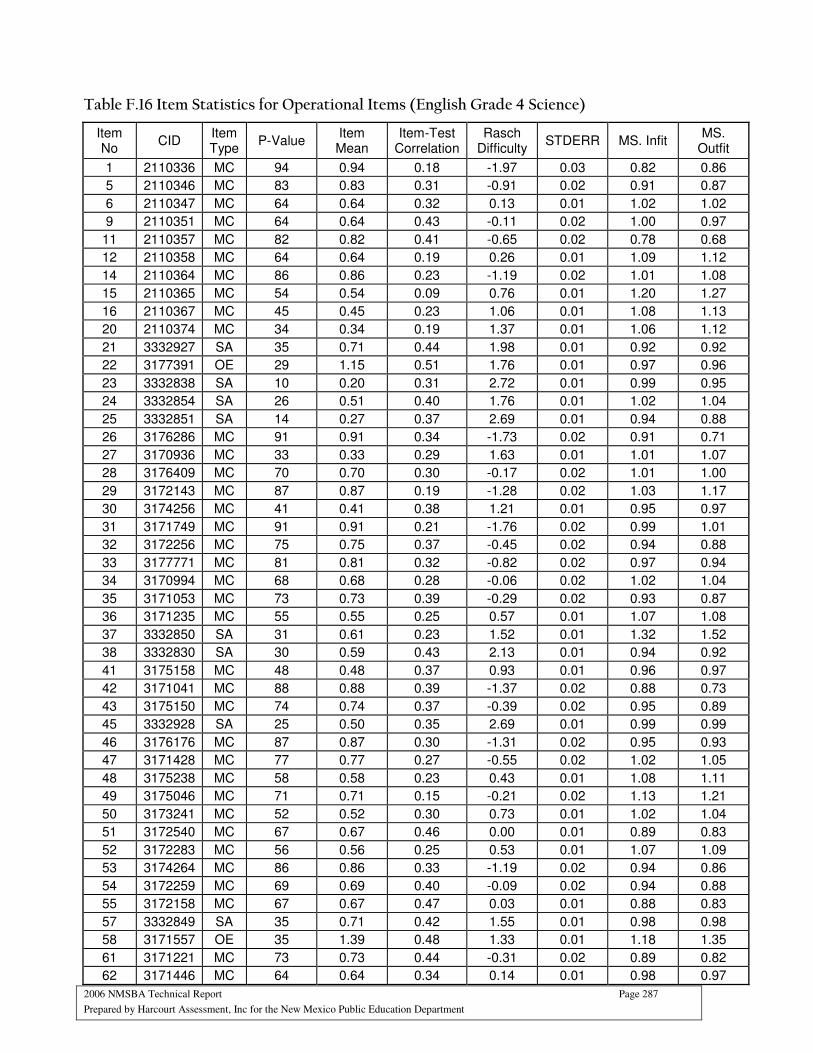
2006 NMSBA Technical Report Page 287
Prepared by Harcourt Assessment, Inc for the New Mexico Public Education Department
Table F.16 Item Statistics for Operational Items (English Grade 4 Science)
Item No
CID Item Type
P-Value Item Mean
Item-Test Correlation
Rasch Difficulty
STDERR MS. Infit MS.
Outfit
1 2110336 MC 94 0.94 0.18 -1.97 0.03 0.82 0.86
5 2110346 MC 83 0.83 0.31 -0.91 0.02 0.91 0.87
6 2110347 MC 64 0.64 0.32 0.13 0.01 1.02 1.02
9 2110351 MC 64 0.64 0.43 -0.11 0.02 1.00 0.97
11 2110357 MC 82 0.82 0.41 -0.65 0.02 0.78 0.68
12 2110358 MC 64 0.64 0.19 0.26 0.01 1.09 1.12
14 2110364 MC 86 0.86 0.23 -1.19 0.02 1.01 1.08
15 2110365 MC 54 0.54 0.09 0.76 0.01 1.20 1.27
16 2110367 MC 45 0.45 0.23 1.06 0.01 1.08 1.13
20 2110374 MC 34 0.34 0.19 1.37 0.01 1.06 1.12
21 3332927 SA 35 0.71 0.44 1.98 0.01 0.92 0.92
22 3177391 OE 29 1.15 0.51 1.76 0.01 0.97 0.96
23 3332838 SA 10 0.20 0.31 2.72 0.01 0.99 0.95
24 3332854 SA 26 0.51 0.40 1.76 0.01 1.02 1.04
25 3332851 SA 14 0.27 0.37 2.69 0.01 0.94 0.88
26 3176286 MC 91 0.91 0.34 -1.73 0.02 0.91 0.71
27 3170936 MC 33 0.33 0.29 1.63 0.01 1.01 1.07
28 3176409 MC 70 0.70 0.30 -0.17 0.02 1.01 1.00
29 3172143 MC 87 0.87 0.19 -1.28 0.02 1.03 1.17
30 3174256 MC 41 0.41 0.38 1.21 0.01 0.95 0.97
31 3171749 MC 91 0.91 0.21 -1.76 0.02 0.99 1.01
32 3172256 MC 75 0.75 0.37 -0.45 0.02 0.94 0.88
33 3177771 MC 81 0.81 0.32 -0.82 0.02 0.97 0.94
34 3170994 MC 68 0.68 0.28 -0.06 0.02 1.02 1.04
35 3171053 MC 73 0.73 0.39 -0.29 0.02 0.93 0.87
36 3171235 MC 55 0.55 0.25 0.57 0.01 1.07 1.08
37 3332850 SA 31 0.61 0.23 1.52 0.01 1.32 1.52
38 3332830 SA 30 0.59 0.43 2.13 0.01 0.94 0.92
41 3175158 MC 48 0.48 0.37 0.93 0.01 0.96 0.97
42 3171041 MC 88 0.88 0.39 -1.37 0.02 0.88 0.73
43 3175150 MC 74 0.74 0.37 -0.39 0.02 0.95 0.89
45 3332928 SA 25 0.50 0.35 2.69 0.01 0.99 0.99
46 3176176 MC 87 0.87 0.30 -1.31 0.02 0.95 0.93
47 3171428 MC 77 0.77 0.27 -0.55 0.02 1.02 1.05
48 3175238 MC 58 0.58 0.23 0.43 0.01 1.08 1.11
49 3175046 MC 71 0.71 0.15 -0.21 0.02 1.13 1.21
50 3173241 MC 52 0.52 0.30 0.73 0.01 1.02 1.04
51 3172540 MC 67 0.67 0.46 0.00 0.01 0.89 0.83
52 3172283 MC 56 0.56 0.25 0.53 0.01 1.07 1.09
53 3174264 MC 86 0.86 0.33 -1.19 0.02 0.94 0.86
54 3172259 MC 69 0.69 0.40 -0.09 0.02 0.94 0.88
55 3172158 MC 67 0.67 0.47 0.03 0.01 0.88 0.83
57 3332849 SA 35 0.71 0.42 1.55 0.01 0.98 0.98
58 3171557 OE 35 1.39 0.48 1.33 0.01 1.18 1.35
61 3171221 MC 73 0.73 0.44 -0.31 0.02 0.89 0.82
62 3171446 MC 64 0.64 0.34 0.14 0.01 0.98 0.97
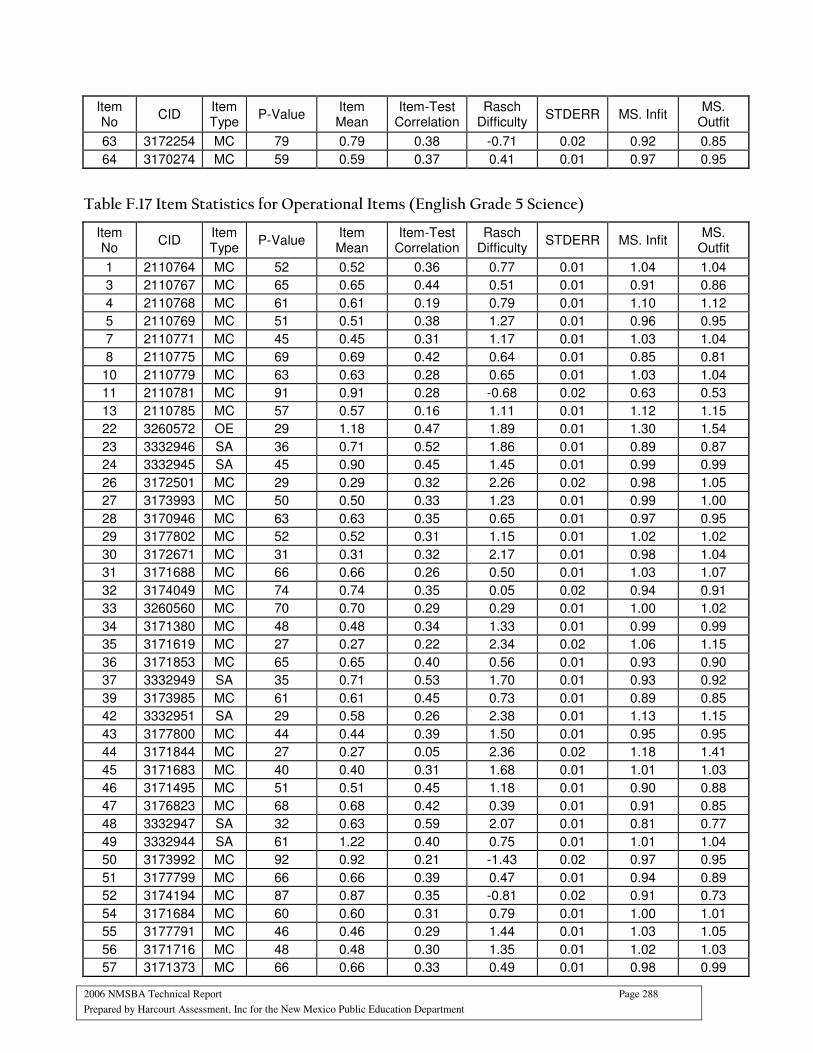
2006 NMSBA Technical Report Page 288
Prepared by Harcourt Assessment, Inc for the New Mexico Public Education Department
Item No
CID Item Type
P-Value Item Mean
Item-Test Correlation
Rasch Difficulty
STDERR MS. Infit MS.
Outfit
63 3172254 MC 79 0.79 0.38 -0.71 0.02 0.92 0.85
64 3170274 MC 59 0.59 0.37 0.41 0.01 0.97 0.95
Table F.17 Item Statistics for Operational Items (English Grade 5 Science)
Item No
CID Item Type
P-Value Item Mean
Item-Test Correlation
Rasch Difficulty
STDERR MS. Infit MS.
Outfit
1 2110764 MC 52 0.52 0.36 0.77 0.01 1.04 1.04
3 2110767 MC 65 0.65 0.44 0.51 0.01 0.91 0.86
4 2110768 MC 61 0.61 0.19 0.79 0.01 1.10 1.12
5 2110769 MC 51 0.51 0.38 1.27 0.01 0.96 0.95
7 2110771 MC 45 0.45 0.31 1.17 0.01 1.03 1.04
8 2110775 MC 69 0.69 0.42 0.64 0.01 0.85 0.81
10 2110779 MC 63 0.63 0.28 0.65 0.01 1.03 1.04
11 2110781 MC 91 0.91 0.28 -0.68 0.02 0.63 0.53
13 2110785 MC 57 0.57 0.16 1.11 0.01 1.12 1.15
22 3260572 OE 29 1.18 0.47 1.89 0.01 1.30 1.54
23 3332946 SA 36 0.71 0.52 1.86 0.01 0.89 0.87
24 3332945 SA 45 0.90 0.45 1.45 0.01 0.99 0.99
26 3172501 MC 29 0.29 0.32 2.26 0.02 0.98 1.05
27 3173993 MC 50 0.50 0.33 1.23 0.01 0.99 1.00
28 3170946 MC 63 0.63 0.35 0.65 0.01 0.97 0.95
29 3177802 MC 52 0.52 0.31 1.15 0.01 1.02 1.02
30 3172671 MC 31 0.31 0.32 2.17 0.01 0.98 1.04
31 3171688 MC 66 0.66 0.26 0.50 0.01 1.03 1.07
32 3174049 MC 74 0.74 0.35 0.05 0.02 0.94 0.91
33 3260560 MC 70 0.70 0.29 0.29 0.01 1.00 1.02
34 3171380 MC 48 0.48 0.34 1.33 0.01 0.99 0.99
35 3171619 MC 27 0.27 0.22 2.34 0.02 1.06 1.15
36 3171853 MC 65 0.65 0.40 0.56 0.01 0.93 0.90
37 3332949 SA 35 0.71 0.53 1.70 0.01 0.93 0.92
39 3173985 MC 61 0.61 0.45 0.73 0.01 0.89 0.85
42 3332951 SA 29 0.58 0.26 2.38 0.01 1.13 1.15
43 3177800 MC 44 0.44 0.39 1.50 0.01 0.95 0.95
44 3171844 MC 27 0.27 0.05 2.36 0.02 1.18 1.41
45 3171683 MC 40 0.40 0.31 1.68 0.01 1.01 1.03
46 3171495 MC 51 0.51 0.45 1.18 0.01 0.90 0.88
47 3176823 MC 68 0.68 0.42 0.39 0.01 0.91 0.85
48 3332947 SA 32 0.63 0.59 2.07 0.01 0.81 0.77
49 3332944 SA 61 1.22 0.40 0.75 0.01 1.01 1.04
50 3173992 MC 92 0.92 0.21 -1.43 0.02 0.97 0.95
51 3177799 MC 66 0.66 0.39 0.47 0.01 0.94 0.89
52 3174194 MC 87 0.87 0.35 -0.81 0.02 0.91 0.73
54 3171684 MC 60 0.60 0.31 0.79 0.01 1.00 1.01
55 3177791 MC 46 0.46 0.29 1.44 0.01 1.03 1.05
56 3171716 MC 48 0.48 0.30 1.35 0.01 1.02 1.03
57 3171373 MC 66 0.66 0.33 0.49 0.01 0.98 0.99
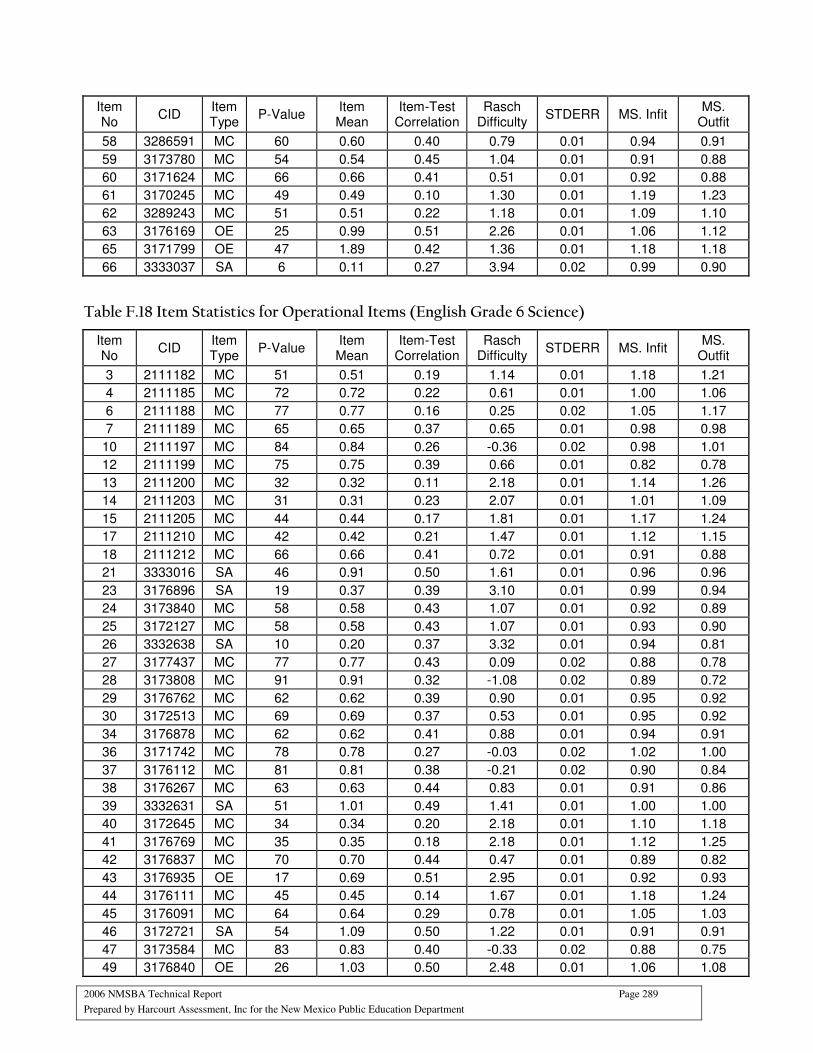
2006 NMSBA Technical Report Page 289
Prepared by Harcourt Assessment, Inc for the New Mexico Public Education Department
Item No
CID Item Type
P-Value Item Mean
Item-Test Correlation
Rasch Difficulty
STDERR MS. Infit MS.
Outfit
58 3286591 MC 60 0.60 0.40 0.79 0.01 0.94 0.91
59 3173780 MC 54 0.54 0.45 1.04 0.01 0.91 0.88
60 3171624 MC 66 0.66 0.41 0.51 0.01 0.92 0.88
61 3170245 MC 49 0.49 0.10 1.30 0.01 1.19 1.23
62 3289243 MC 51 0.51 0.22 1.18 0.01 1.09 1.10
63 3176169 OE 25 0.99 0.51 2.26 0.01 1.06 1.12
65 3171799 OE 47 1.89 0.42 1.36 0.01 1.18 1.18
66 3333037 SA 6 0.11 0.27 3.94 0.02 0.99 0.90
Table F.18 Item Statistics for Operational Items (English Grade 6 Science)
Item No
CID Item Type
P-Value Item Mean
Item-Test Correlation
Rasch Difficulty
STDERR MS. Infit MS.
Outfit
3 2111182 MC 51 0.51 0.19 1.14 0.01 1.18 1.21
4 2111185 MC 72 0.72 0.22 0.61 0.01 1.00 1.06
6 2111188 MC 77 0.77 0.16 0.25 0.02 1.05 1.17
7 2111189 MC 65 0.65 0.37 0.65 0.01 0.98 0.98
10 2111197 MC 84 0.84 0.26 -0.36 0.02 0.98 1.01
12 2111199 MC 75 0.75 0.39 0.66 0.01 0.82 0.78
13 2111200 MC 32 0.32 0.11 2.18 0.01 1.14 1.26
14 2111203 MC 31 0.31 0.23 2.07 0.01 1.01 1.09
15 2111205 MC 44 0.44 0.17 1.81 0.01 1.17 1.24
17 2111210 MC 42 0.42 0.21 1.47 0.01 1.12 1.15
18 2111212 MC 66 0.66 0.41 0.72 0.01 0.91 0.88
21 3333016 SA 46 0.91 0.50 1.61 0.01 0.96 0.96
23 3176896 SA 19 0.37 0.39 3.10 0.01 0.99 0.94
24 3173840 MC 58 0.58 0.43 1.07 0.01 0.92 0.89
25 3172127 MC 58 0.58 0.43 1.07 0.01 0.93 0.90
26 3332638 SA 10 0.20 0.37 3.32 0.01 0.94 0.81
27 3177437 MC 77 0.77 0.43 0.09 0.02 0.88 0.78
28 3173808 MC 91 0.91 0.32 -1.08 0.02 0.89 0.72
29 3176762 MC 62 0.62 0.39 0.90 0.01 0.95 0.92
30 3172513 MC 69 0.69 0.37 0.53 0.01 0.95 0.92
34 3176878 MC 62 0.62 0.41 0.88 0.01 0.94 0.91
36 3171742 MC 78 0.78 0.27 -0.03 0.02 1.02 1.00
37 3176112 MC 81 0.81 0.38 -0.21 0.02 0.90 0.84
38 3176267 MC 63 0.63 0.44 0.83 0.01 0.91 0.86
39 3332631 SA 51 1.01 0.49 1.41 0.01 1.00 1.00
40 3172645 MC 34 0.34 0.20 2.18 0.01 1.10 1.18
41 3176769 MC 35 0.35 0.18 2.18 0.01 1.12 1.25
42 3176837 MC 70 0.70 0.44 0.47 0.01 0.89 0.82
43 3176935 OE 17 0.69 0.51 2.95 0.01 0.92 0.93
44 3176111 MC 45 0.45 0.14 1.67 0.01 1.18 1.24
45 3176091 MC 64 0.64 0.29 0.78 0.01 1.05 1.03
46 3172721 SA 54 1.09 0.50 1.22 0.01 0.91 0.91
47 3173584 MC 83 0.83 0.40 -0.33 0.02 0.88 0.75
49 3176840 OE 26 1.03 0.50 2.48 0.01 1.06 1.08
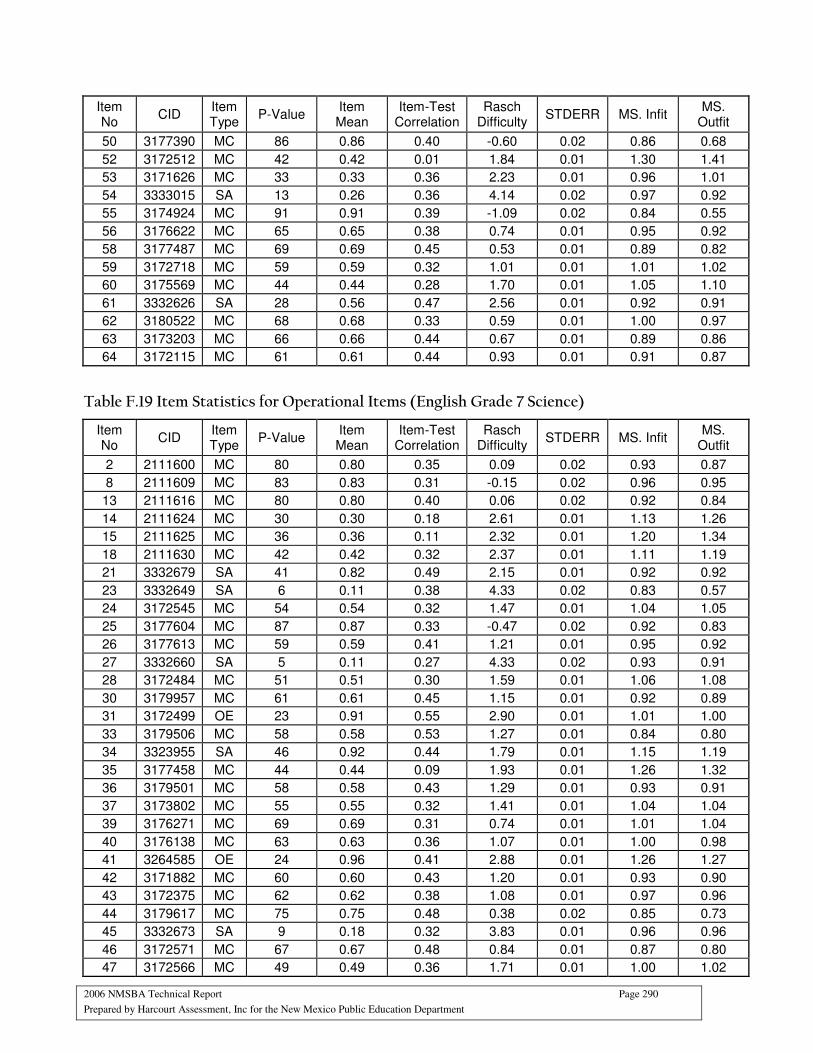
2006 NMSBA Technical Report Page 290
Prepared by Harcourt Assessment, Inc for the New Mexico Public Education Department
Item No
CID Item Type
P-Value Item Mean
Item-Test Correlation
Rasch Difficulty
STDERR MS. Infit MS.
Outfit
50 3177390 MC 86 0.86 0.40 -0.60 0.02 0.86 0.68
52 3172512 MC 42 0.42 0.01 1.84 0.01 1.30 1.41
53 3171626 MC 33 0.33 0.36 2.23 0.01 0.96 1.01
54 3333015 SA 13 0.26 0.36 4.14 0.02 0.97 0.92
55 3174924 MC 91 0.91 0.39 -1.09 0.02 0.84 0.55
56 3176622 MC 65 0.65 0.38 0.74 0.01 0.95 0.92
58 3177487 MC 69 0.69 0.45 0.53 0.01 0.89 0.82
59 3172718 MC 59 0.59 0.32 1.01 0.01 1.01 1.02
60 3175569 MC 44 0.44 0.28 1.70 0.01 1.05 1.10
61 3332626 SA 28 0.56 0.47 2.56 0.01 0.92 0.91
62 3180522 MC 68 0.68 0.33 0.59 0.01 1.00 0.97
63 3173203 MC 66 0.66 0.44 0.67 0.01 0.89 0.86
64 3172115 MC 61 0.61 0.44 0.93 0.01 0.91 0.87
Table F.19 Item Statistics for Operational Items (English Grade 7 Science)
Item No
CID Item Type
P-Value Item Mean
Item-Test Correlation
Rasch Difficulty
STDERR MS. Infit MS.
Outfit
2 2111600 MC 80 0.80 0.35 0.09 0.02 0.93 0.87
8 2111609 MC 83 0.83 0.31 -0.15 0.02 0.96 0.95
13 2111616 MC 80 0.80 0.40 0.06 0.02 0.92 0.84
14 2111624 MC 30 0.30 0.18 2.61 0.01 1.13 1.26
15 2111625 MC 36 0.36 0.11 2.32 0.01 1.20 1.34
18 2111630 MC 42 0.42 0.32 2.37 0.01 1.11 1.19
21 3332679 SA 41 0.82 0.49 2.15 0.01 0.92 0.92
23 3332649 SA 6 0.11 0.38 4.33 0.02 0.83 0.57
24 3172545 MC 54 0.54 0.32 1.47 0.01 1.04 1.05
25 3177604 MC 87 0.87 0.33 -0.47 0.02 0.92 0.83
26 3177613 MC 59 0.59 0.41 1.21 0.01 0.95 0.92
27 3332660 SA 5 0.11 0.27 4.33 0.02 0.93 0.91
28 3172484 MC 51 0.51 0.30 1.59 0.01 1.06 1.08
30 3179957 MC 61 0.61 0.45 1.15 0.01 0.92 0.89
31 3172499 OE 23 0.91 0.55 2.90 0.01 1.01 1.00
33 3179506 MC 58 0.58 0.53 1.27 0.01 0.84 0.80
34 3323955 SA 46 0.92 0.44 1.79 0.01 1.15 1.19
35 3177458 MC 44 0.44 0.09 1.93 0.01 1.26 1.32
36 3179501 MC 58 0.58 0.43 1.29 0.01 0.93 0.91
37 3173802 MC 55 0.55 0.32 1.41 0.01 1.04 1.04
39 3176271 MC 69 0.69 0.31 0.74 0.01 1.01 1.04
40 3176138 MC 63 0.63 0.36 1.07 0.01 1.00 0.98
41 3264585 OE 24 0.96 0.41 2.88 0.01 1.26 1.27
42 3171882 MC 60 0.60 0.43 1.20 0.01 0.93 0.90
43 3172375 MC 62 0.62 0.38 1.08 0.01 0.97 0.96
44 3179617 MC 75 0.75 0.48 0.38 0.02 0.85 0.73
45 3332673 SA 9 0.18 0.32 3.83 0.01 0.96 0.96
46 3172571 MC 67 0.67 0.48 0.84 0.01 0.87 0.80
47 3172566 MC 49 0.49 0.36 1.71 0.01 1.00 1.02
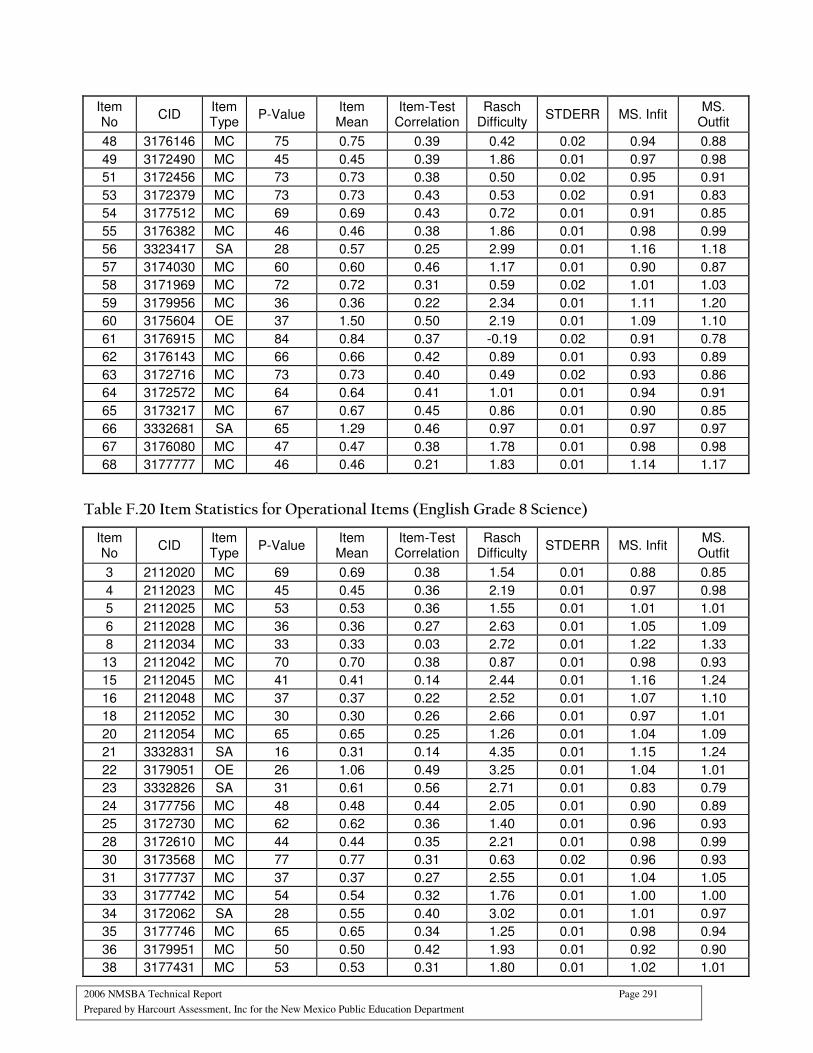
2006 NMSBA Technical Report Page 291
Prepared by Harcourt Assessment, Inc for the New Mexico Public Education Department
Item No
CID Item Type
P-Value Item Mean
Item-Test Correlation
Rasch Difficulty
STDERR MS. Infit MS.
Outfit
48 3176146 MC 75 0.75 0.39 0.42 0.02 0.94 0.88
49 3172490 MC 45 0.45 0.39 1.86 0.01 0.97 0.98
51 3172456 MC 73 0.73 0.38 0.50 0.02 0.95 0.91
53 3172379 MC 73 0.73 0.43 0.53 0.02 0.91 0.83
54 3177512 MC 69 0.69 0.43 0.72 0.01 0.91 0.85
55 3176382 MC 46 0.46 0.38 1.86 0.01 0.98 0.99
56 3323417 SA 28 0.57 0.25 2.99 0.01 1.16 1.18
57 3174030 MC 60 0.60 0.46 1.17 0.01 0.90 0.87
58 3171969 MC 72 0.72 0.31 0.59 0.02 1.01 1.03
59 3179956 MC 36 0.36 0.22 2.34 0.01 1.11 1.20
60 3175604 OE 37 1.50 0.50 2.19 0.01 1.09 1.10
61 3176915 MC 84 0.84 0.37 -0.19 0.02 0.91 0.78
62 3176143 MC 66 0.66 0.42 0.89 0.01 0.93 0.89
63 3172716 MC 73 0.73 0.40 0.49 0.02 0.93 0.86
64 3172572 MC 64 0.64 0.41 1.01 0.01 0.94 0.91
65 3173217 MC 67 0.67 0.45 0.86 0.01 0.90 0.85
66 3332681 SA 65 1.29 0.46 0.97 0.01 0.97 0.97
67 3176080 MC 47 0.47 0.38 1.78 0.01 0.98 0.98
68 3177777 MC 46 0.46 0.21 1.83 0.01 1.14 1.17
Table F.20 Item Statistics for Operational Items (English Grade 8 Science)
Item No
CID Item Type
P-Value Item Mean
Item-Test Correlation
Rasch Difficulty
STDERR MS. Infit MS.
Outfit
3 2112020 MC 69 0.69 0.38 1.54 0.01 0.88 0.85
4 2112023 MC 45 0.45 0.36 2.19 0.01 0.97 0.98
5 2112025 MC 53 0.53 0.36 1.55 0.01 1.01 1.01
6 2112028 MC 36 0.36 0.27 2.63 0.01 1.05 1.09
8 2112034 MC 33 0.33 0.03 2.72 0.01 1.22 1.33
13 2112042 MC 70 0.70 0.38 0.87 0.01 0.98 0.93
15 2112045 MC 41 0.41 0.14 2.44 0.01 1.16 1.24
16 2112048 MC 37 0.37 0.22 2.52 0.01 1.07 1.10
18 2112052 MC 30 0.30 0.26 2.66 0.01 0.97 1.01
20 2112054 MC 65 0.65 0.25 1.26 0.01 1.04 1.09
21 3332831 SA 16 0.31 0.14 4.35 0.01 1.15 1.24
22 3179051 OE 26 1.06 0.49 3.25 0.01 1.04 1.01
23 3332826 SA 31 0.61 0.56 2.71 0.01 0.83 0.79
24 3177756 MC 48 0.48 0.44 2.05 0.01 0.90 0.89
25 3172730 MC 62 0.62 0.36 1.40 0.01 0.96 0.93
28 3172610 MC 44 0.44 0.35 2.21 0.01 0.98 0.99
30 3173568 MC 77 0.77 0.31 0.63 0.02 0.96 0.93
31 3177737 MC 37 0.37 0.27 2.55 0.01 1.04 1.05
33 3177742 MC 54 0.54 0.32 1.76 0.01 1.00 1.00
34 3172062 SA 28 0.55 0.40 3.02 0.01 1.01 0.97
35 3177746 MC 65 0.65 0.34 1.25 0.01 0.98 0.94
36 3179951 MC 50 0.50 0.42 1.93 0.01 0.92 0.90
38 3177431 MC 53 0.53 0.31 1.80 0.01 1.02 1.01

2006 NMSBA Technical Report Page 292
Prepared by Harcourt Assessment, Inc for the New Mexico Public Education Department
Item No
CID Item Type
P-Value Item Mean
Item-Test Correlation
Rasch Difficulty
STDERR MS. Infit MS.
Outfit
39 3332816 SA 23 0.46 0.42 3.38 0.01 0.95 0.91
40 3175539 MC 52 0.52 0.34 1.88 0.01 0.99 0.99
41 3173586 MC 36 0.36 0.30 2.61 0.01 1.01 1.03
42 3173205 MC 68 0.68 0.19 1.09 0.01 1.08 1.15
43 3179049 OE 39 1.56 0.55 2.80 0.01 0.89 0.88
44 3172161 MC 50 0.50 0.38 1.96 0.01 0.96 0.95
45 3171694 MC 80 0.80 0.35 0.44 0.02 0.92 0.86
46 3172775 MC 78 0.78 0.23 0.57 0.02 1.02 1.06
47 3171885 MC 77 0.77 0.37 0.60 0.02 0.92 0.84
48 3172469 MC 39 0.39 0.10 2.45 0.01 1.18 1.26
50 3172171 OE 40 1.61 0.51 2.34 0.01 1.09 1.07
51 3172086 MC 35 0.35 0.38 2.64 0.01 0.94 0.97
53 3172770 MC 48 0.48 0.48 2.05 0.01 0.88 0.86
55 3177721 MC 74 0.74 0.37 0.81 0.01 0.92 0.88
56 3177761 SA 61 1.23 0.43 1.49 0.01 0.98 1.00
57 3172036 MC 68 0.68 0.35 1.12 0.01 0.96 0.94
59 3172782 MC 55 0.55 0.32 1.73 0.01 1.00 1.00
60 3175590 MC 28 0.28 0.18 3.00 0.01 1.09 1.20
61 3172789 OE 15 0.58 0.39 3.49 0.01 1.10 1.14
62 3177782 MC 43 0.43 0.46 2.26 0.01 0.89 0.89
63 3172107 MC 45 0.45 0.25 2.17 0.01 1.06 1.08
64 3171883 SA 57 1.14 0.51 1.58 0.01 0.87 0.87
65 3177416 MC 56 0.56 0.29 1.66 0.01 1.03 1.02
66 3177725 MC 55 0.55 0.45 1.70 0.01 0.90 0.87
67 3172615 MC 57 0.57 0.42 1.63 0.01 0.92 0.89
Table F.21 Item Statistics for Operational Items (English Grade 9 Science)
Item No
CID Item Type
P-Value Item Mean
Item-Test Correlation
Rasch Difficulty
STDERR MS. Infit MS.
Outfit
1 2112407 MC 85 0.85 0.26 0.73 0.02 0.84 0.85
2 2112408 MC 63 0.63 0.35 1.77 0.01 0.99 0.98
3 2112411 MC 23 0.23 0.08 3.71 0.02 1.16 1.55
5 2112415 MC 46 0.46 0.31 2.16 0.01 1.08 1.10
7 2112417 MC 48 0.48 0.21 2.39 0.01 1.14 1.17
8 2112418 MC 54 0.54 0.29 2.22 0.01 1.05 1.07
9 2112419 MC 67 0.67 0.47 1.54 0.01 0.87 0.80
11 2112421 MC 73 0.73 0.41 1.20 0.01 0.92 0.90
17 2112433 MC 41 0.41 0.23 2.80 0.01 1.12 1.17
18 2112440 MC 18 0.18 0.16 3.96 0.02 1.05 1.39
19 2112443 MC 28 0.28 0.28 3.64 0.02 1.11 1.31
21 3332810 SA 12 0.24 0.45 4.07 0.01 0.92 0.84
22 3176192 OE 13 0.53 0.52 4.14 0.01 0.99 0.93
23 3332807 SA 9 0.19 0.38 4.75 0.01 0.95 0.88
24 3172109 MC 88 0.88 0.39 0.13 0.02 0.83 0.58
25 3177434 MC 62 0.62 0.37 1.79 0.01 0.98 0.96
26 3172761 MC 60 0.60 0.15 1.93 0.01 1.17 1.26
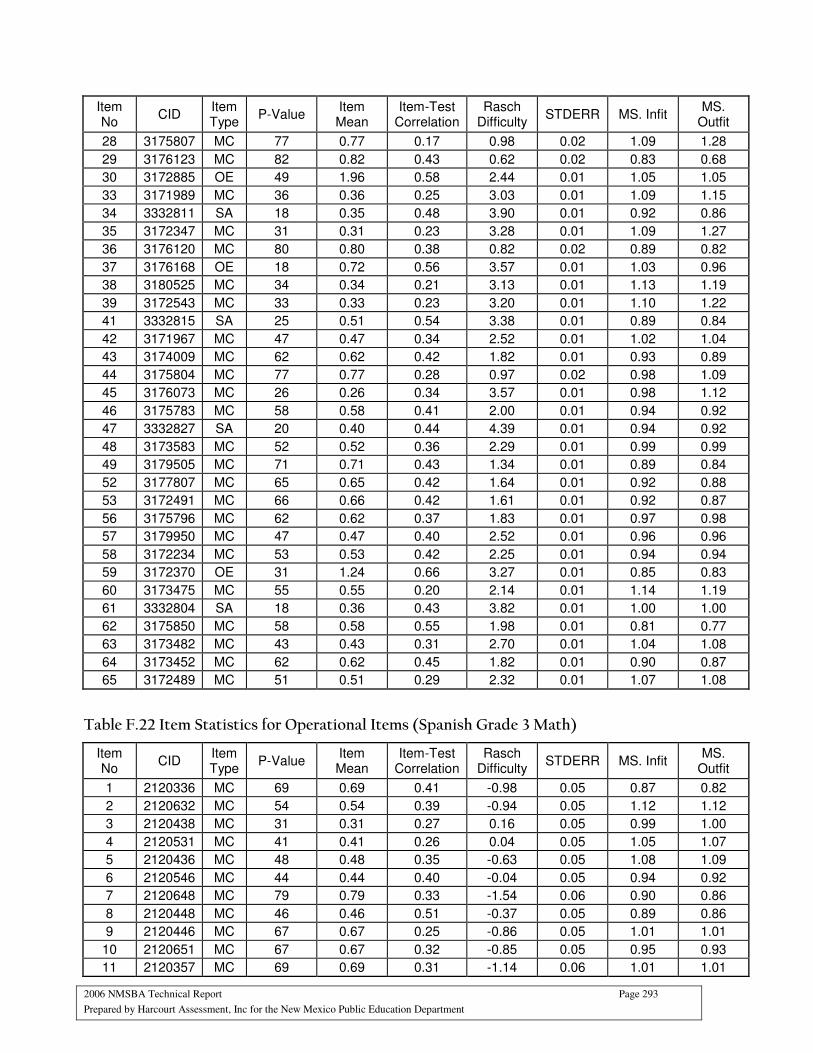
2006 NMSBA Technical Report Page 293
Prepared by Harcourt Assessment, Inc for the New Mexico Public Education Department
Item No
CID Item Type
P-Value Item Mean
Item-Test Correlation
Rasch Difficulty
STDERR MS. Infit MS.
Outfit
28 3175807 MC 77 0.77 0.17 0.98 0.02 1.09 1.28
29 3176123 MC 82 0.82 0.43 0.62 0.02 0.83 0.68
30 3172885 OE 49 1.96 0.58 2.44 0.01 1.05 1.05
33 3171989 MC 36 0.36 0.25 3.03 0.01 1.09 1.15
34 3332811 SA 18 0.35 0.48 3.90 0.01 0.92 0.86
35 3172347 MC 31 0.31 0.23 3.28 0.01 1.09 1.27
36 3176120 MC 80 0.80 0.38 0.82 0.02 0.89 0.82
37 3176168 OE 18 0.72 0.56 3.57 0.01 1.03 0.96
38 3180525 MC 34 0.34 0.21 3.13 0.01 1.13 1.19
39 3172543 MC 33 0.33 0.23 3.20 0.01 1.10 1.22
41 3332815 SA 25 0.51 0.54 3.38 0.01 0.89 0.84
42 3171967 MC 47 0.47 0.34 2.52 0.01 1.02 1.04
43 3174009 MC 62 0.62 0.42 1.82 0.01 0.93 0.89
44 3175804 MC 77 0.77 0.28 0.97 0.02 0.98 1.09
45 3176073 MC 26 0.26 0.34 3.57 0.01 0.98 1.12
46 3175783 MC 58 0.58 0.41 2.00 0.01 0.94 0.92
47 3332827 SA 20 0.40 0.44 4.39 0.01 0.94 0.92
48 3173583 MC 52 0.52 0.36 2.29 0.01 0.99 0.99
49 3179505 MC 71 0.71 0.43 1.34 0.01 0.89 0.84
52 3177807 MC 65 0.65 0.42 1.64 0.01 0.92 0.88
53 3172491 MC 66 0.66 0.42 1.61 0.01 0.92 0.87
56 3175796 MC 62 0.62 0.37 1.83 0.01 0.97 0.98
57 3179950 MC 47 0.47 0.40 2.52 0.01 0.96 0.96
58 3172234 MC 53 0.53 0.42 2.25 0.01 0.94 0.94
59 3172370 OE 31 1.24 0.66 3.27 0.01 0.85 0.83
60 3173475 MC 55 0.55 0.20 2.14 0.01 1.14 1.19
61 3332804 SA 18 0.36 0.43 3.82 0.01 1.00 1.00
62 3175850 MC 58 0.58 0.55 1.98 0.01 0.81 0.77
63 3173482 MC 43 0.43 0.31 2.70 0.01 1.04 1.08
64 3173452 MC 62 0.62 0.45 1.82 0.01 0.90 0.87
65 3172489 MC 51 0.51 0.29 2.32 0.01 1.07 1.08
Table F.22 Item Statistics for Operational Items (Spanish Grade 3 Math)
Item No
CID Item Type
P-Value Item Mean
Item-Test Correlation
Rasch Difficulty
STDERR MS. Infit MS.
Outfit
1 2120336 MC 69 0.69 0.41 -0.98 0.05 0.87 0.82
2 2120632 MC 54 0.54 0.39 -0.94 0.05 1.12 1.12
3 2120438 MC 31 0.31 0.27 0.16 0.05 0.99 1.00
4 2120531 MC 41 0.41 0.26 0.04 0.05 1.05 1.07
5 2120436 MC 48 0.48 0.35 -0.63 0.05 1.08 1.09
6 2120546 MC 44 0.44 0.40 -0.04 0.05 0.94 0.92
7 2120648 MC 79 0.79 0.33 -1.54 0.06 0.90 0.86
8 2120448 MC 46 0.46 0.51 -0.37 0.05 0.89 0.86
9 2120446 MC 67 0.67 0.25 -0.86 0.05 1.01 1.01
10 2120651 MC 67 0.67 0.32 -0.85 0.05 0.95 0.93
11 2120357 MC 69 0.69 0.31 -1.14 0.06 1.01 1.01
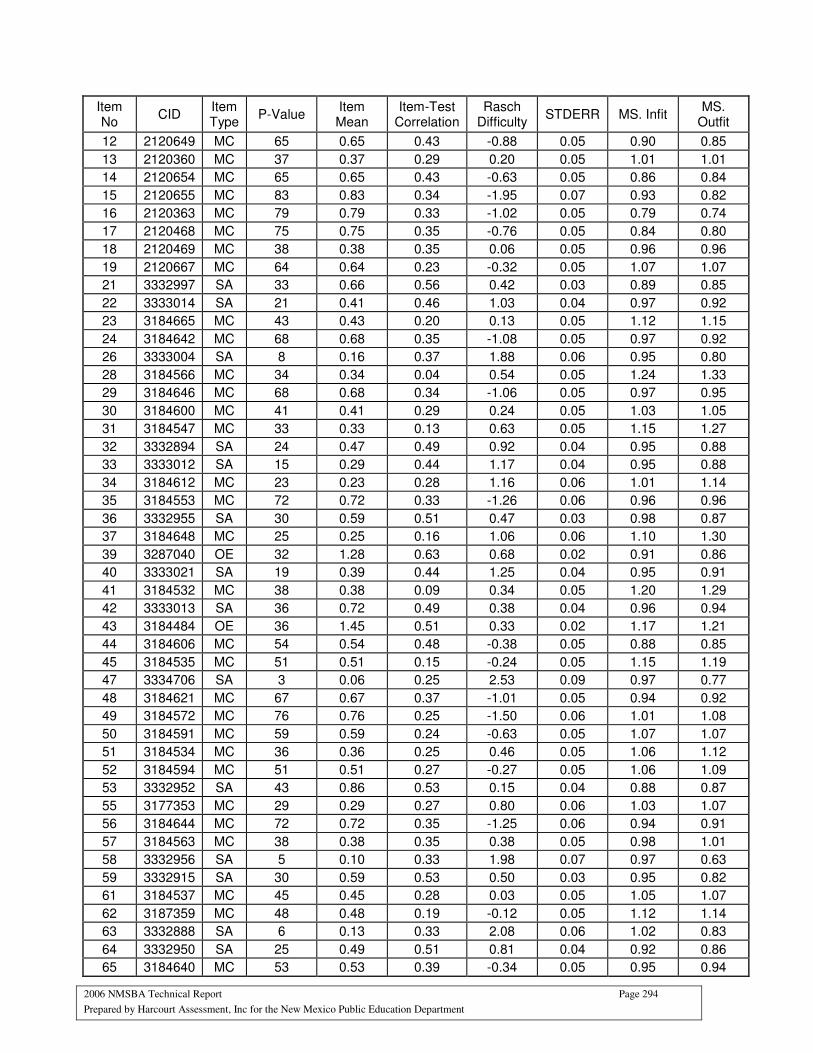
2006 NMSBA Technical Report Page 294
Prepared by Harcourt Assessment, Inc for the New Mexico Public Education Department
Item No
CID Item Type
P-Value Item Mean
Item-Test Correlation
Rasch Difficulty
STDERR MS. Infit MS.
Outfit
12 2120649 MC 65 0.65 0.43 -0.88 0.05 0.90 0.85
13 2120360 MC 37 0.37 0.29 0.20 0.05 1.01 1.01
14 2120654 MC 65 0.65 0.43 -0.63 0.05 0.86 0.84
15 2120655 MC 83 0.83 0.34 -1.95 0.07 0.93 0.82
16 2120363 MC 79 0.79 0.33 -1.02 0.05 0.79 0.74
17 2120468 MC 75 0.75 0.35 -0.76 0.05 0.84 0.80
18 2120469 MC 38 0.38 0.35 0.06 0.05 0.96 0.96
19 2120667 MC 64 0.64 0.23 -0.32 0.05 1.07 1.07
21 3332997 SA 33 0.66 0.56 0.42 0.03 0.89 0.85
22 3333014 SA 21 0.41 0.46 1.03 0.04 0.97 0.92
23 3184665 MC 43 0.43 0.20 0.13 0.05 1.12 1.15
24 3184642 MC 68 0.68 0.35 -1.08 0.05 0.97 0.92
26 3333004 SA 8 0.16 0.37 1.88 0.06 0.95 0.80
28 3184566 MC 34 0.34 0.04 0.54 0.05 1.24 1.33
29 3184646 MC 68 0.68 0.34 -1.06 0.05 0.97 0.95
30 3184600 MC 41 0.41 0.29 0.24 0.05 1.03 1.05
31 3184547 MC 33 0.33 0.13 0.63 0.05 1.15 1.27
32 3332894 SA 24 0.47 0.49 0.92 0.04 0.95 0.88
33 3333012 SA 15 0.29 0.44 1.17 0.04 0.95 0.88
34 3184612 MC 23 0.23 0.28 1.16 0.06 1.01 1.14
35 3184553 MC 72 0.72 0.33 -1.26 0.06 0.96 0.96
36 3332955 SA 30 0.59 0.51 0.47 0.03 0.98 0.87
37 3184648 MC 25 0.25 0.16 1.06 0.06 1.10 1.30
39 3287040 OE 32 1.28 0.63 0.68 0.02 0.91 0.86
40 3333021 SA 19 0.39 0.44 1.25 0.04 0.95 0.91
41 3184532 MC 38 0.38 0.09 0.34 0.05 1.20 1.29
42 3333013 SA 36 0.72 0.49 0.38 0.04 0.96 0.94
43 3184484 OE 36 1.45 0.51 0.33 0.02 1.17 1.21
44 3184606 MC 54 0.54 0.48 -0.38 0.05 0.88 0.85
45 3184535 MC 51 0.51 0.15 -0.24 0.05 1.15 1.19
47 3334706 SA 3 0.06 0.25 2.53 0.09 0.97 0.77
48 3184621 MC 67 0.67 0.37 -1.01 0.05 0.94 0.92
49 3184572 MC 76 0.76 0.25 -1.50 0.06 1.01 1.08
50 3184591 MC 59 0.59 0.24 -0.63 0.05 1.07 1.07
51 3184534 MC 36 0.36 0.25 0.46 0.05 1.06 1.12
52 3184594 MC 51 0.51 0.27 -0.27 0.05 1.06 1.09
53 3332952 SA 43 0.86 0.53 0.15 0.04 0.88 0.87
55 3177353 MC 29 0.29 0.27 0.80 0.06 1.03 1.07
56 3184644 MC 72 0.72 0.35 -1.25 0.06 0.94 0.91
57 3184563 MC 38 0.38 0.35 0.38 0.05 0.98 1.01
58 3332956 SA 5 0.10 0.33 1.98 0.07 0.97 0.63
59 3332915 SA 30 0.59 0.53 0.50 0.03 0.95 0.82
61 3184537 MC 45 0.45 0.28 0.03 0.05 1.05 1.07
62 3187359 MC 48 0.48 0.19 -0.12 0.05 1.12 1.14
63 3332888 SA 6 0.13 0.33 2.08 0.06 1.02 0.83
64 3332950 SA 25 0.49 0.51 0.81 0.04 0.92 0.86
65 3184640 MC 53 0.53 0.39 -0.34 0.05 0.95 0.94
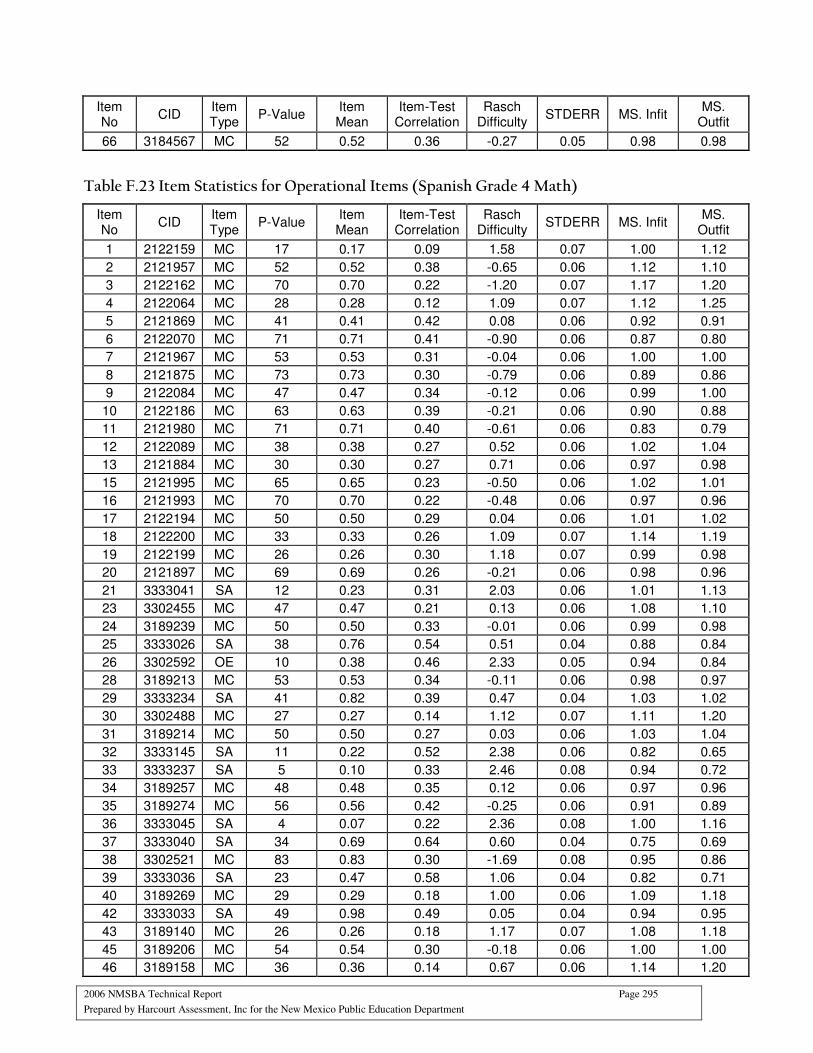
2006 NMSBA Technical Report Page 295
Prepared by Harcourt Assessment, Inc for the New Mexico Public Education Department
Item No
CID Item Type
P-Value Item Mean
Item-Test Correlation
Rasch Difficulty
STDERR MS. Infit MS.
Outfit
66 3184567 MC 52 0.52 0.36 -0.27 0.05 0.98 0.98
Table F.23 Item Statistics for Operational Items (Spanish Grade 4 Math)
Item No
CID Item Type
P-Value Item Mean
Item-Test Correlation
Rasch Difficulty
STDERR MS. Infit MS.
Outfit
1 2122159 MC 17 0.17 0.09 1.58 0.07 1.00 1.12
2 2121957 MC 52 0.52 0.38 -0.65 0.06 1.12 1.10
3 2122162 MC 70 0.70 0.22 -1.20 0.07 1.17 1.20
4 2122064 MC 28 0.28 0.12 1.09 0.07 1.12 1.25
5 2121869 MC 41 0.41 0.42 0.08 0.06 0.92 0.91
6 2122070 MC 71 0.71 0.41 -0.90 0.06 0.87 0.80
7 2121967 MC 53 0.53 0.31 -0.04 0.06 1.00 1.00
8 2121875 MC 73 0.73 0.30 -0.79 0.06 0.89 0.86
9 2122084 MC 47 0.47 0.34 -0.12 0.06 0.99 1.00
10 2122186 MC 63 0.63 0.39 -0.21 0.06 0.90 0.88
11 2121980 MC 71 0.71 0.40 -0.61 0.06 0.83 0.79
12 2122089 MC 38 0.38 0.27 0.52 0.06 1.02 1.04
13 2121884 MC 30 0.30 0.27 0.71 0.06 0.97 0.98
15 2121995 MC 65 0.65 0.23 -0.50 0.06 1.02 1.01
16 2121993 MC 70 0.70 0.22 -0.48 0.06 0.97 0.96
17 2122194 MC 50 0.50 0.29 0.04 0.06 1.01 1.02
18 2122200 MC 33 0.33 0.26 1.09 0.07 1.14 1.19
19 2122199 MC 26 0.26 0.30 1.18 0.07 0.99 0.98
20 2121897 MC 69 0.69 0.26 -0.21 0.06 0.98 0.96
21 3333041 SA 12 0.23 0.31 2.03 0.06 1.01 1.13
23 3302455 MC 47 0.47 0.21 0.13 0.06 1.08 1.10
24 3189239 MC 50 0.50 0.33 -0.01 0.06 0.99 0.98
25 3333026 SA 38 0.76 0.54 0.51 0.04 0.88 0.84
26 3302592 OE 10 0.38 0.46 2.33 0.05 0.94 0.84
28 3189213 MC 53 0.53 0.34 -0.11 0.06 0.98 0.97
29 3333234 SA 41 0.82 0.39 0.47 0.04 1.03 1.02
30 3302488 MC 27 0.27 0.14 1.12 0.07 1.11 1.20
31 3189214 MC 50 0.50 0.27 0.03 0.06 1.03 1.04
32 3333145 SA 11 0.22 0.52 2.38 0.06 0.82 0.65
33 3333237 SA 5 0.10 0.33 2.46 0.08 0.94 0.72
34 3189257 MC 48 0.48 0.35 0.12 0.06 0.97 0.96
35 3189274 MC 56 0.56 0.42 -0.25 0.06 0.91 0.89
36 3333045 SA 4 0.07 0.22 2.36 0.08 1.00 1.16
37 3333040 SA 34 0.69 0.64 0.60 0.04 0.75 0.69
38 3302521 MC 83 0.83 0.30 -1.69 0.08 0.95 0.86
39 3333036 SA 23 0.47 0.58 1.06 0.04 0.82 0.71
40 3189269 MC 29 0.29 0.18 1.00 0.06 1.09 1.18
42 3333033 SA 49 0.98 0.49 0.05 0.04 0.94 0.95
43 3189140 MC 26 0.26 0.18 1.17 0.07 1.08 1.18
45 3189206 MC 54 0.54 0.30 -0.18 0.06 1.00 1.00
46 3189158 MC 36 0.36 0.14 0.67 0.06 1.14 1.20
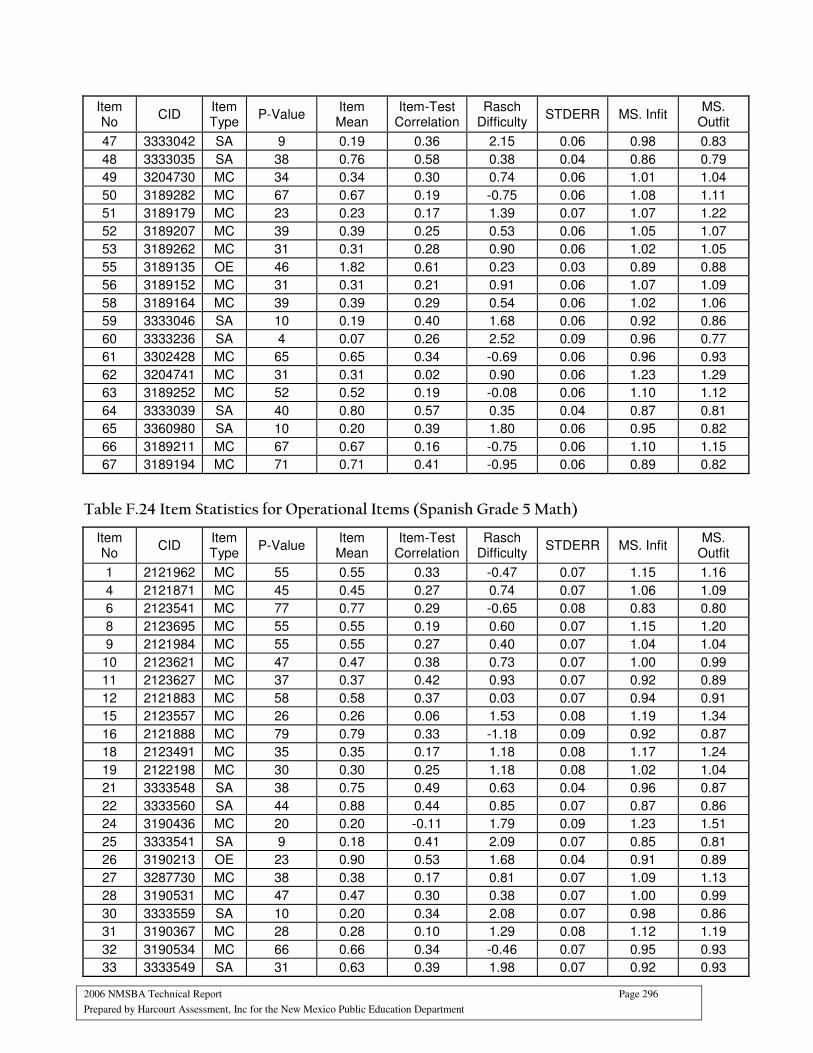
2006 NMSBA Technical Report Page 296
Prepared by Harcourt Assessment, Inc for the New Mexico Public Education Department
Item No
CID Item Type
P-Value Item Mean
Item-Test Correlation
Rasch Difficulty
STDERR MS. Infit MS.
Outfit
47 3333042 SA 9 0.19 0.36 2.15 0.06 0.98 0.83
48 3333035 SA 38 0.76 0.58 0.38 0.04 0.86 0.79
49 3204730 MC 34 0.34 0.30 0.74 0.06 1.01 1.04
50 3189282 MC 67 0.67 0.19 -0.75 0.06 1.08 1.11
51 3189179 MC 23 0.23 0.17 1.39 0.07 1.07 1.22
52 3189207 MC 39 0.39 0.25 0.53 0.06 1.05 1.07
53 3189262 MC 31 0.31 0.28 0.90 0.06 1.02 1.05
55 3189135 OE 46 1.82 0.61 0.23 0.03 0.89 0.88
56 3189152 MC 31 0.31 0.21 0.91 0.06 1.07 1.09
58 3189164 MC 39 0.39 0.29 0.54 0.06 1.02 1.06
59 3333046 SA 10 0.19 0.40 1.68 0.06 0.92 0.86
60 3333236 SA 4 0.07 0.26 2.52 0.09 0.96 0.77
61 3302428 MC 65 0.65 0.34 -0.69 0.06 0.96 0.93
62 3204741 MC 31 0.31 0.02 0.90 0.06 1.23 1.29
63 3189252 MC 52 0.52 0.19 -0.08 0.06 1.10 1.12
64 3333039 SA 40 0.80 0.57 0.35 0.04 0.87 0.81
65 3360980 SA 10 0.20 0.39 1.80 0.06 0.95 0.82
66 3189211 MC 67 0.67 0.16 -0.75 0.06 1.10 1.15
67 3189194 MC 71 0.71 0.41 -0.95 0.06 0.89 0.82
Table F.24 Item Statistics for Operational Items (Spanish Grade 5 Math)
Item No
CID Item Type
P-Value Item Mean
Item-Test Correlation
Rasch Difficulty
STDERR MS. Infit MS.
Outfit
1 2121962 MC 55 0.55 0.33 -0.47 0.07 1.15 1.16
4 2121871 MC 45 0.45 0.27 0.74 0.07 1.06 1.09
6 2123541 MC 77 0.77 0.29 -0.65 0.08 0.83 0.80
8 2123695 MC 55 0.55 0.19 0.60 0.07 1.15 1.20
9 2121984 MC 55 0.55 0.27 0.40 0.07 1.04 1.04
10 2123621 MC 47 0.47 0.38 0.73 0.07 1.00 0.99
11 2123627 MC 37 0.37 0.42 0.93 0.07 0.92 0.89
12 2121883 MC 58 0.58 0.37 0.03 0.07 0.94 0.91
15 2123557 MC 26 0.26 0.06 1.53 0.08 1.19 1.34
16 2121888 MC 79 0.79 0.33 -1.18 0.09 0.92 0.87
18 2123491 MC 35 0.35 0.17 1.18 0.08 1.17 1.24
19 2122198 MC 30 0.30 0.25 1.18 0.08 1.02 1.04
21 3333548 SA 38 0.75 0.49 0.63 0.04 0.96 0.87
22 3333560 SA 44 0.88 0.44 0.85 0.07 0.87 0.86
24 3190436 MC 20 0.20 -0.11 1.79 0.09 1.23 1.51
25 3333541 SA 9 0.18 0.41 2.09 0.07 0.85 0.81
26 3190213 OE 23 0.90 0.53 1.68 0.04 0.91 0.89
27 3287730 MC 38 0.38 0.17 0.81 0.07 1.09 1.13
28 3190531 MC 47 0.47 0.30 0.38 0.07 1.00 0.99
30 3333559 SA 10 0.20 0.34 2.08 0.07 0.98 0.86
31 3190367 MC 28 0.28 0.10 1.29 0.08 1.12 1.19
32 3190534 MC 66 0.66 0.34 -0.46 0.07 0.95 0.93
33 3333549 SA 31 0.63 0.39 1.98 0.07 0.92 0.93
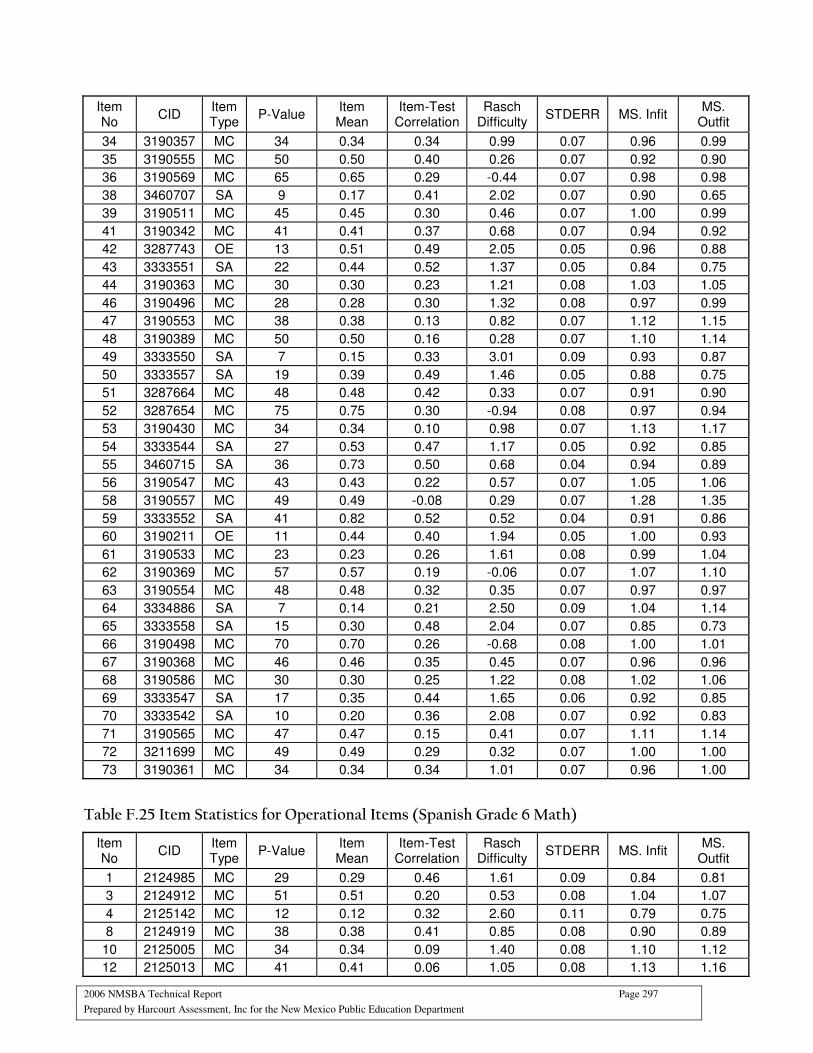
2006 NMSBA Technical Report Page 297
Prepared by Harcourt Assessment, Inc for the New Mexico Public Education Department
Item No
CID Item Type
P-Value Item Mean
Item-Test Correlation
Rasch Difficulty
STDERR MS. Infit MS.
Outfit
34 3190357 MC 34 0.34 0.34 0.99 0.07 0.96 0.99
35 3190555 MC 50 0.50 0.40 0.26 0.07 0.92 0.90
36 3190569 MC 65 0.65 0.29 -0.44 0.07 0.98 0.98
38 3460707 SA 9 0.17 0.41 2.02 0.07 0.90 0.65
39 3190511 MC 45 0.45 0.30 0.46 0.07 1.00 0.99
41 3190342 MC 41 0.41 0.37 0.68 0.07 0.94 0.92
42 3287743 OE 13 0.51 0.49 2.05 0.05 0.96 0.88
43 3333551 SA 22 0.44 0.52 1.37 0.05 0.84 0.75
44 3190363 MC 30 0.30 0.23 1.21 0.08 1.03 1.05
46 3190496 MC 28 0.28 0.30 1.32 0.08 0.97 0.99
47 3190553 MC 38 0.38 0.13 0.82 0.07 1.12 1.15
48 3190389 MC 50 0.50 0.16 0.28 0.07 1.10 1.14
49 3333550 SA 7 0.15 0.33 3.01 0.09 0.93 0.87
50 3333557 SA 19 0.39 0.49 1.46 0.05 0.88 0.75
51 3287664 MC 48 0.48 0.42 0.33 0.07 0.91 0.90
52 3287654 MC 75 0.75 0.30 -0.94 0.08 0.97 0.94
53 3190430 MC 34 0.34 0.10 0.98 0.07 1.13 1.17
54 3333544 SA 27 0.53 0.47 1.17 0.05 0.92 0.85
55 3460715 SA 36 0.73 0.50 0.68 0.04 0.94 0.89
56 3190547 MC 43 0.43 0.22 0.57 0.07 1.05 1.06
58 3190557 MC 49 0.49 -0.08 0.29 0.07 1.28 1.35
59 3333552 SA 41 0.82 0.52 0.52 0.04 0.91 0.86
60 3190211 OE 11 0.44 0.40 1.94 0.05 1.00 0.93
61 3190533 MC 23 0.23 0.26 1.61 0.08 0.99 1.04
62 3190369 MC 57 0.57 0.19 -0.06 0.07 1.07 1.10
63 3190554 MC 48 0.48 0.32 0.35 0.07 0.97 0.97
64 3334886 SA 7 0.14 0.21 2.50 0.09 1.04 1.14
65 3333558 SA 15 0.30 0.48 2.04 0.07 0.85 0.73
66 3190498 MC 70 0.70 0.26 -0.68 0.08 1.00 1.01
67 3190368 MC 46 0.46 0.35 0.45 0.07 0.96 0.96
68 3190586 MC 30 0.30 0.25 1.22 0.08 1.02 1.06
69 3333547 SA 17 0.35 0.44 1.65 0.06 0.92 0.85
70 3333542 SA 10 0.20 0.36 2.08 0.07 0.92 0.83
71 3190565 MC 47 0.47 0.15 0.41 0.07 1.11 1.14
72 3211699 MC 49 0.49 0.29 0.32 0.07 1.00 1.00
73 3190361 MC 34 0.34 0.34 1.01 0.07 0.96 1.00
Table F.25 Item Statistics for Operational Items (Spanish Grade 6 Math)
Item No
CID Item Type
P-Value Item Mean
Item-Test Correlation
Rasch Difficulty
STDERR MS. Infit MS.
Outfit
1 2124985 MC 29 0.29 0.46 1.61 0.09 0.84 0.81
3 2124912 MC 51 0.51 0.20 0.53 0.08 1.04 1.07
4 2125142 MC 12 0.12 0.32 2.60 0.11 0.79 0.75
8 2124919 MC 38 0.38 0.41 0.85 0.08 0.90 0.89
10 2125005 MC 34 0.34 0.09 1.40 0.08 1.10 1.12
12 2125013 MC 41 0.41 0.06 1.05 0.08 1.13 1.16
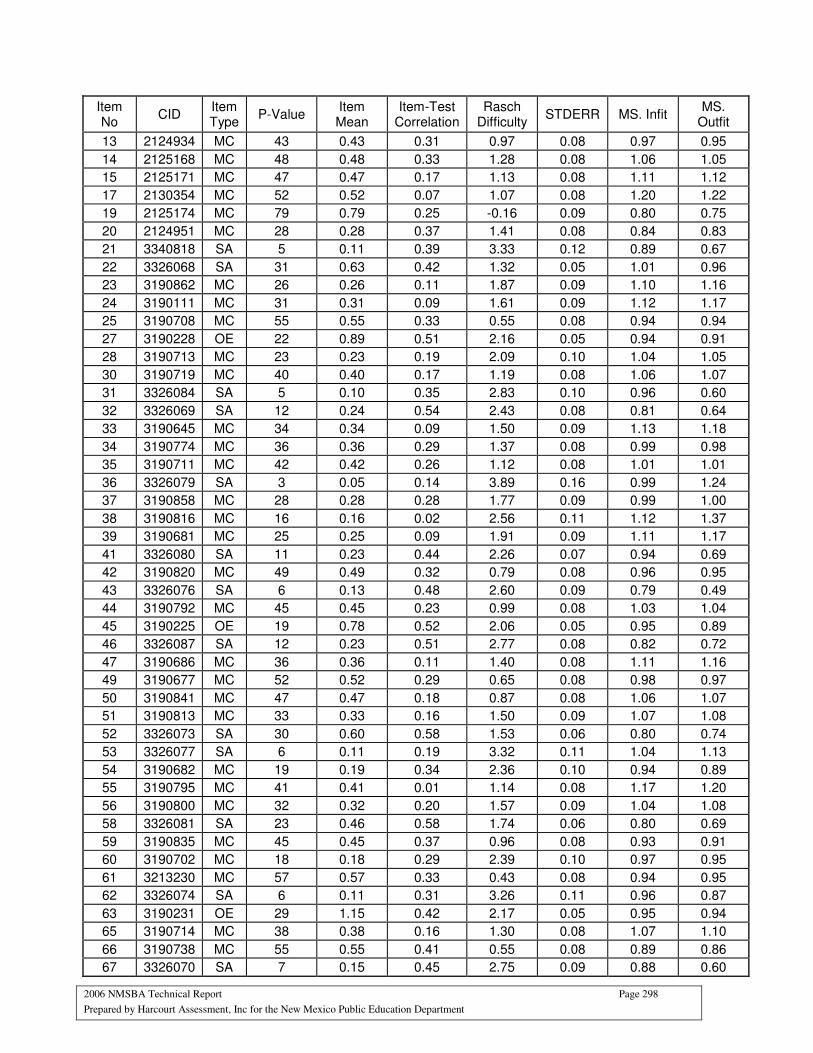
2006 NMSBA Technical Report Page 298
Prepared by Harcourt Assessment, Inc for the New Mexico Public Education Department
Item No
CID Item Type
P-Value Item Mean
Item-Test Correlation
Rasch Difficulty
STDERR MS. Infit MS.
Outfit
13 2124934 MC 43 0.43 0.31 0.97 0.08 0.97 0.95
14 2125168 MC 48 0.48 0.33 1.28 0.08 1.06 1.05
15 2125171 MC 47 0.47 0.17 1.13 0.08 1.11 1.12
17 2130354 MC 52 0.52 0.07 1.07 0.08 1.20 1.22
19 2125174 MC 79 0.79 0.25 -0.16 0.09 0.80 0.75
20 2124951 MC 28 0.28 0.37 1.41 0.08 0.84 0.83
21 3340818 SA 5 0.11 0.39 3.33 0.12 0.89 0.67
22 3326068 SA 31 0.63 0.42 1.32 0.05 1.01 0.96
23 3190862 MC 26 0.26 0.11 1.87 0.09 1.10 1.16
24 3190111 MC 31 0.31 0.09 1.61 0.09 1.12 1.17
25 3190708 MC 55 0.55 0.33 0.55 0.08 0.94 0.94
27 3190228 OE 22 0.89 0.51 2.16 0.05 0.94 0.91
28 3190713 MC 23 0.23 0.19 2.09 0.10 1.04 1.05
30 3190719 MC 40 0.40 0.17 1.19 0.08 1.06 1.07
31 3326084 SA 5 0.10 0.35 2.83 0.10 0.96 0.60
32 3326069 SA 12 0.24 0.54 2.43 0.08 0.81 0.64
33 3190645 MC 34 0.34 0.09 1.50 0.09 1.13 1.18
34 3190774 MC 36 0.36 0.29 1.37 0.08 0.99 0.98
35 3190711 MC 42 0.42 0.26 1.12 0.08 1.01 1.01
36 3326079 SA 3 0.05 0.14 3.89 0.16 0.99 1.24
37 3190858 MC 28 0.28 0.28 1.77 0.09 0.99 1.00
38 3190816 MC 16 0.16 0.02 2.56 0.11 1.12 1.37
39 3190681 MC 25 0.25 0.09 1.91 0.09 1.11 1.17
41 3326080 SA 11 0.23 0.44 2.26 0.07 0.94 0.69
42 3190820 MC 49 0.49 0.32 0.79 0.08 0.96 0.95
43 3326076 SA 6 0.13 0.48 2.60 0.09 0.79 0.49
44 3190792 MC 45 0.45 0.23 0.99 0.08 1.03 1.04
45 3190225 OE 19 0.78 0.52 2.06 0.05 0.95 0.89
46 3326087 SA 12 0.23 0.51 2.77 0.08 0.82 0.72
47 3190686 MC 36 0.36 0.11 1.40 0.08 1.11 1.16
49 3190677 MC 52 0.52 0.29 0.65 0.08 0.98 0.97
50 3190841 MC 47 0.47 0.18 0.87 0.08 1.06 1.07
51 3190813 MC 33 0.33 0.16 1.50 0.09 1.07 1.08
52 3326073 SA 30 0.60 0.58 1.53 0.06 0.80 0.74
53 3326077 SA 6 0.11 0.19 3.32 0.11 1.04 1.13
54 3190682 MC 19 0.19 0.34 2.36 0.10 0.94 0.89
55 3190795 MC 41 0.41 0.01 1.14 0.08 1.17 1.20
56 3190800 MC 32 0.32 0.20 1.57 0.09 1.04 1.08
58 3326081 SA 23 0.46 0.58 1.74 0.06 0.80 0.69
59 3190835 MC 45 0.45 0.37 0.96 0.08 0.93 0.91
60 3190702 MC 18 0.18 0.29 2.39 0.10 0.97 0.95
61 3213230 MC 57 0.57 0.33 0.43 0.08 0.94 0.95
62 3326074 SA 6 0.11 0.31 3.26 0.11 0.96 0.87
63 3190231 OE 29 1.15 0.42 2.17 0.05 0.95 0.94
65 3190714 MC 38 0.38 0.16 1.30 0.08 1.07 1.10
66 3190738 MC 55 0.55 0.41 0.55 0.08 0.89 0.86
67 3326070 SA 7 0.15 0.45 2.75 0.09 0.88 0.60
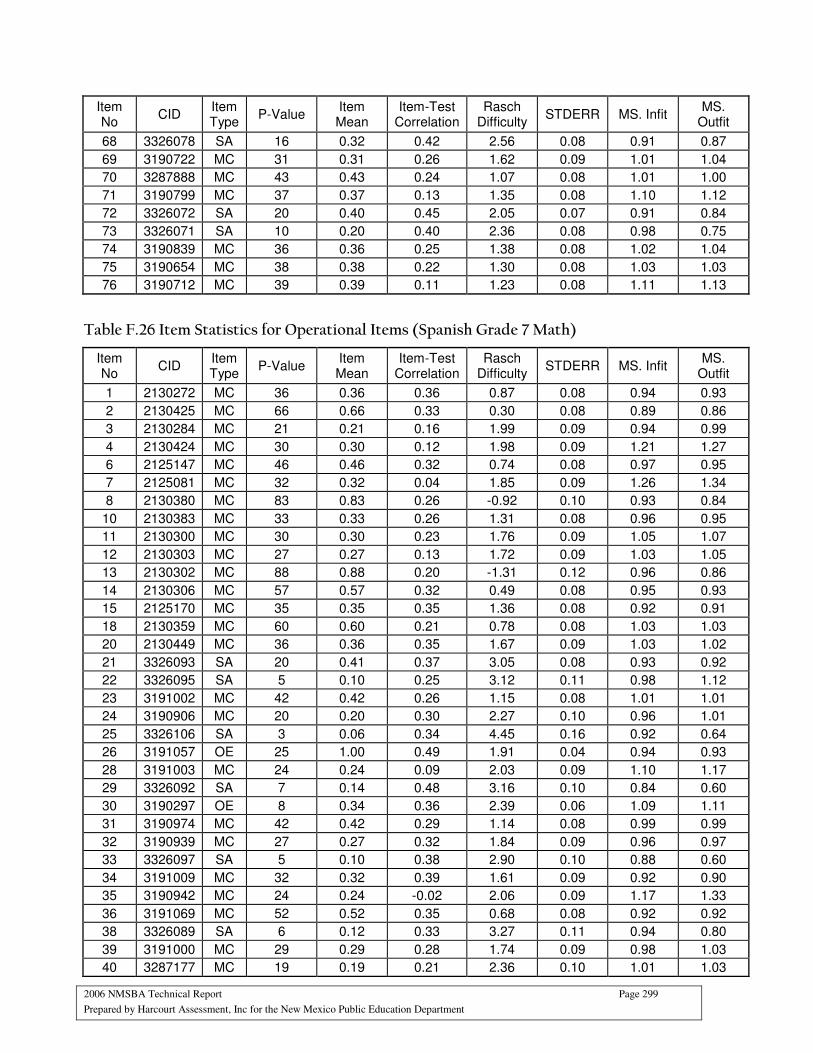
2006 NMSBA Technical Report Page 299
Prepared by Harcourt Assessment, Inc for the New Mexico Public Education Department
Item No
CID Item Type
P-Value Item Mean
Item-Test Correlation
Rasch Difficulty
STDERR MS. Infit MS.
Outfit
68 3326078 SA 16 0.32 0.42 2.56 0.08 0.91 0.87
69 3190722 MC 31 0.31 0.26 1.62 0.09 1.01 1.04
70 3287888 MC 43 0.43 0.24 1.07 0.08 1.01 1.00
71 3190799 MC 37 0.37 0.13 1.35 0.08 1.10 1.12
72 3326072 SA 20 0.40 0.45 2.05 0.07 0.91 0.84
73 3326071 SA 10 0.20 0.40 2.36 0.08 0.98 0.75
74 3190839 MC 36 0.36 0.25 1.38 0.08 1.02 1.04
75 3190654 MC 38 0.38 0.22 1.30 0.08 1.03 1.03
76 3190712 MC 39 0.39 0.11 1.23 0.08 1.11 1.13
Table F.26 Item Statistics for Operational Items (Spanish Grade 7 Math)
Item No
CID Item Type
P-Value Item Mean
Item-Test Correlation
Rasch Difficulty
STDERR MS. Infit MS.
Outfit
1 2130272 MC 36 0.36 0.36 0.87 0.08 0.94 0.93
2 2130425 MC 66 0.66 0.33 0.30 0.08 0.89 0.86
3 2130284 MC 21 0.21 0.16 1.99 0.09 0.94 0.99
4 2130424 MC 30 0.30 0.12 1.98 0.09 1.21 1.27
6 2125147 MC 46 0.46 0.32 0.74 0.08 0.97 0.95
7 2125081 MC 32 0.32 0.04 1.85 0.09 1.26 1.34
8 2130380 MC 83 0.83 0.26 -0.92 0.10 0.93 0.84
10 2130383 MC 33 0.33 0.26 1.31 0.08 0.96 0.95
11 2130300 MC 30 0.30 0.23 1.76 0.09 1.05 1.07
12 2130303 MC 27 0.27 0.13 1.72 0.09 1.03 1.05
13 2130302 MC 88 0.88 0.20 -1.31 0.12 0.96 0.86
14 2130306 MC 57 0.57 0.32 0.49 0.08 0.95 0.93
15 2125170 MC 35 0.35 0.35 1.36 0.08 0.92 0.91
18 2130359 MC 60 0.60 0.21 0.78 0.08 1.03 1.03
20 2130449 MC 36 0.36 0.35 1.67 0.09 1.03 1.02
21 3326093 SA 20 0.41 0.37 3.05 0.08 0.93 0.92
22 3326095 SA 5 0.10 0.25 3.12 0.11 0.98 1.12
23 3191002 MC 42 0.42 0.26 1.15 0.08 1.01 1.01
24 3190906 MC 20 0.20 0.30 2.27 0.10 0.96 1.01
25 3326106 SA 3 0.06 0.34 4.45 0.16 0.92 0.64
26 3191057 OE 25 1.00 0.49 1.91 0.04 0.94 0.93
28 3191003 MC 24 0.24 0.09 2.03 0.09 1.10 1.17
29 3326092 SA 7 0.14 0.48 3.16 0.10 0.84 0.60
30 3190297 OE 8 0.34 0.36 2.39 0.06 1.09 1.11
31 3190974 MC 42 0.42 0.29 1.14 0.08 0.99 0.99
32 3190939 MC 27 0.27 0.32 1.84 0.09 0.96 0.97
33 3326097 SA 5 0.10 0.38 2.90 0.10 0.88 0.60
34 3191009 MC 32 0.32 0.39 1.61 0.09 0.92 0.90
35 3190942 MC 24 0.24 -0.02 2.06 0.09 1.17 1.33
36 3191069 MC 52 0.52 0.35 0.68 0.08 0.92 0.92
38 3326089 SA 6 0.12 0.33 3.27 0.11 0.94 0.80
39 3191000 MC 29 0.29 0.28 1.74 0.09 0.98 1.03
40 3287177 MC 19 0.19 0.21 2.36 0.10 1.01 1.03
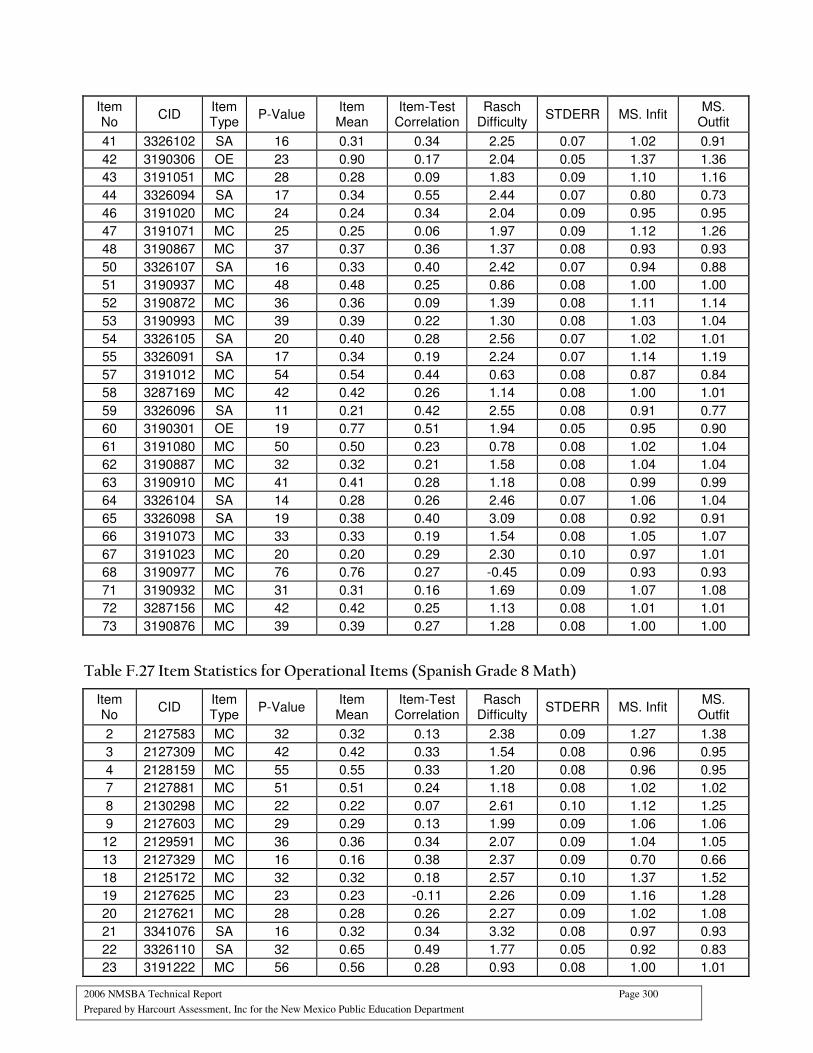
2006 NMSBA Technical Report Page 300
Prepared by Harcourt Assessment, Inc for the New Mexico Public Education Department
Item No
CID Item Type
P-Value Item Mean
Item-Test Correlation
Rasch Difficulty
STDERR MS. Infit MS.
Outfit
41 3326102 SA 16 0.31 0.34 2.25 0.07 1.02 0.91
42 3190306 OE 23 0.90 0.17 2.04 0.05 1.37 1.36
43 3191051 MC 28 0.28 0.09 1.83 0.09 1.10 1.16
44 3326094 SA 17 0.34 0.55 2.44 0.07 0.80 0.73
46 3191020 MC 24 0.24 0.34 2.04 0.09 0.95 0.95
47 3191071 MC 25 0.25 0.06 1.97 0.09 1.12 1.26
48 3190867 MC 37 0.37 0.36 1.37 0.08 0.93 0.93
50 3326107 SA 16 0.33 0.40 2.42 0.07 0.94 0.88
51 3190937 MC 48 0.48 0.25 0.86 0.08 1.00 1.00
52 3190872 MC 36 0.36 0.09 1.39 0.08 1.11 1.14
53 3190993 MC 39 0.39 0.22 1.30 0.08 1.03 1.04
54 3326105 SA 20 0.40 0.28 2.56 0.07 1.02 1.01
55 3326091 SA 17 0.34 0.19 2.24 0.07 1.14 1.19
57 3191012 MC 54 0.54 0.44 0.63 0.08 0.87 0.84
58 3287169 MC 42 0.42 0.26 1.14 0.08 1.00 1.01
59 3326096 SA 11 0.21 0.42 2.55 0.08 0.91 0.77
60 3190301 OE 19 0.77 0.51 1.94 0.05 0.95 0.90
61 3191080 MC 50 0.50 0.23 0.78 0.08 1.02 1.04
62 3190887 MC 32 0.32 0.21 1.58 0.08 1.04 1.04
63 3190910 MC 41 0.41 0.28 1.18 0.08 0.99 0.99
64 3326104 SA 14 0.28 0.26 2.46 0.07 1.06 1.04
65 3326098 SA 19 0.38 0.40 3.09 0.08 0.92 0.91
66 3191073 MC 33 0.33 0.19 1.54 0.08 1.05 1.07
67 3191023 MC 20 0.20 0.29 2.30 0.10 0.97 1.01
68 3190977 MC 76 0.76 0.27 -0.45 0.09 0.93 0.93
71 3190932 MC 31 0.31 0.16 1.69 0.09 1.07 1.08
72 3287156 MC 42 0.42 0.25 1.13 0.08 1.01 1.01
73 3190876 MC 39 0.39 0.27 1.28 0.08 1.00 1.00
Table F.27 Item Statistics for Operational Items (Spanish Grade 8 Math)
Item No
CID Item Type
P-Value Item Mean
Item-Test Correlation
Rasch Difficulty
STDERR MS. Infit MS.
Outfit
2 2127583 MC 32 0.32 0.13 2.38 0.09 1.27 1.38
3 2127309 MC 42 0.42 0.33 1.54 0.08 0.96 0.95
4 2128159 MC 55 0.55 0.33 1.20 0.08 0.96 0.95
7 2127881 MC 51 0.51 0.24 1.18 0.08 1.02 1.02
8 2130298 MC 22 0.22 0.07 2.61 0.10 1.12 1.25
9 2127603 MC 29 0.29 0.13 1.99 0.09 1.06 1.06
12 2129591 MC 36 0.36 0.34 2.07 0.09 1.04 1.05
13 2127329 MC 16 0.16 0.38 2.37 0.09 0.70 0.66
18 2125172 MC 32 0.32 0.18 2.57 0.10 1.37 1.52
19 2127625 MC 23 0.23 -0.11 2.26 0.09 1.16 1.28
20 2127621 MC 28 0.28 0.26 2.27 0.09 1.02 1.08
21 3341076 SA 16 0.32 0.34 3.32 0.08 0.97 0.93
22 3326110 SA 32 0.65 0.49 1.77 0.05 0.92 0.83
23 3191222 MC 56 0.56 0.28 0.93 0.08 1.00 1.01
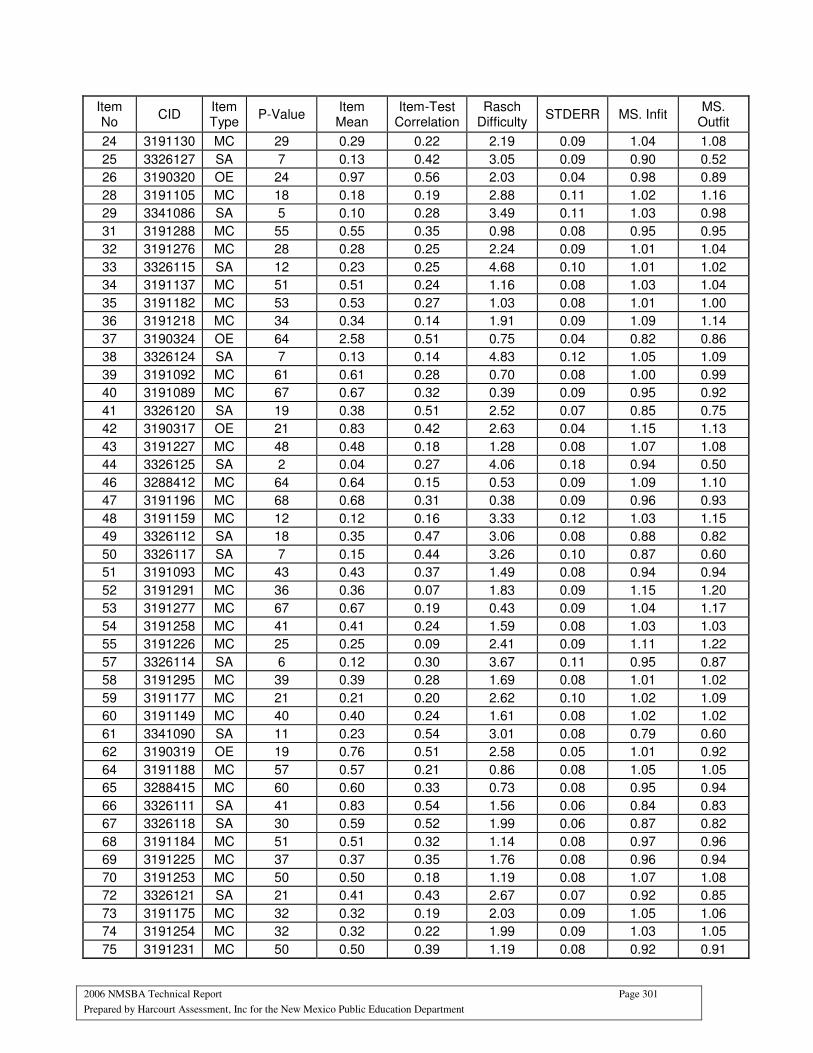
2006 NMSBA Technical Report Page 301
Prepared by Harcourt Assessment, Inc for the New Mexico Public Education Department
Item No
CID Item Type
P-Value Item Mean
Item-Test Correlation
Rasch Difficulty
STDERR MS. Infit MS.
Outfit
24 3191130 MC 29 0.29 0.22 2.19 0.09 1.04 1.08
25 3326127 SA 7 0.13 0.42 3.05 0.09 0.90 0.52
26 3190320 OE 24 0.97 0.56 2.03 0.04 0.98 0.89
28 3191105 MC 18 0.18 0.19 2.88 0.11 1.02 1.16
29 3341086 SA 5 0.10 0.28 3.49 0.11 1.03 0.98
31 3191288 MC 55 0.55 0.35 0.98 0.08 0.95 0.95
32 3191276 MC 28 0.28 0.25 2.24 0.09 1.01 1.04
33 3326115 SA 12 0.23 0.25 4.68 0.10 1.01 1.02
34 3191137 MC 51 0.51 0.24 1.16 0.08 1.03 1.04
35 3191182 MC 53 0.53 0.27 1.03 0.08 1.01 1.00
36 3191218 MC 34 0.34 0.14 1.91 0.09 1.09 1.14
37 3190324 OE 64 2.58 0.51 0.75 0.04 0.82 0.86
38 3326124 SA 7 0.13 0.14 4.83 0.12 1.05 1.09
39 3191092 MC 61 0.61 0.28 0.70 0.08 1.00 0.99
40 3191089 MC 67 0.67 0.32 0.39 0.09 0.95 0.92
41 3326120 SA 19 0.38 0.51 2.52 0.07 0.85 0.75
42 3190317 OE 21 0.83 0.42 2.63 0.04 1.15 1.13
43 3191227 MC 48 0.48 0.18 1.28 0.08 1.07 1.08
44 3326125 SA 2 0.04 0.27 4.06 0.18 0.94 0.50
46 3288412 MC 64 0.64 0.15 0.53 0.09 1.09 1.10
47 3191196 MC 68 0.68 0.31 0.38 0.09 0.96 0.93
48 3191159 MC 12 0.12 0.16 3.33 0.12 1.03 1.15
49 3326112 SA 18 0.35 0.47 3.06 0.08 0.88 0.82
50 3326117 SA 7 0.15 0.44 3.26 0.10 0.87 0.60
51 3191093 MC 43 0.43 0.37 1.49 0.08 0.94 0.94
52 3191291 MC 36 0.36 0.07 1.83 0.09 1.15 1.20
53 3191277 MC 67 0.67 0.19 0.43 0.09 1.04 1.17
54 3191258 MC 41 0.41 0.24 1.59 0.08 1.03 1.03
55 3191226 MC 25 0.25 0.09 2.41 0.09 1.11 1.22
57 3326114 SA 6 0.12 0.30 3.67 0.11 0.95 0.87
58 3191295 MC 39 0.39 0.28 1.69 0.08 1.01 1.02
59 3191177 MC 21 0.21 0.20 2.62 0.10 1.02 1.09
60 3191149 MC 40 0.40 0.24 1.61 0.08 1.02 1.02
61 3341090 SA 11 0.23 0.54 3.01 0.08 0.79 0.60
62 3190319 OE 19 0.76 0.51 2.58 0.05 1.01 0.92
64 3191188 MC 57 0.57 0.21 0.86 0.08 1.05 1.05
65 3288415 MC 60 0.60 0.33 0.73 0.08 0.95 0.94
66 3326111 SA 41 0.83 0.54 1.56 0.06 0.84 0.83
67 3326118 SA 30 0.59 0.52 1.99 0.06 0.87 0.82
68 3191184 MC 51 0.51 0.32 1.14 0.08 0.97 0.96
69 3191225 MC 37 0.37 0.35 1.76 0.08 0.96 0.94
70 3191253 MC 50 0.50 0.18 1.19 0.08 1.07 1.08
72 3326121 SA 21 0.41 0.43 2.67 0.07 0.92 0.85
73 3191175 MC 32 0.32 0.19 2.03 0.09 1.05 1.06
74 3191254 MC 32 0.32 0.22 1.99 0.09 1.03 1.05
75 3191231 MC 50 0.50 0.39 1.19 0.08 0.92 0.91

2006 NMSBA Technical Report Page 302
Prepared by Harcourt Assessment, Inc for the New Mexico Public Education Department
Table F.28 Item Statistics for Operational Items (Spanish Grade 9 Math)
Item No
CID Item Type
P-Value Item Mean
Item-Test Correlation
Rasch Difficulty
STDERR MS. Infit MS.
Outfit
1 2129752 MC 58 0.58 0.18 0.79 0.08 1.06 1.07
3 2128620 MC 32 0.32 0.41 1.95 0.09 0.91 0.90
4 2128632 MC 47 0.47 0.31 1.29 0.08 0.97 0.97
5 2128633 MC 41 0.41 0.15 1.58 0.09 1.11 1.13
6 2129763 MC 26 0.26 0.09 1.95 0.09 1.04 1.08
7 2129766 MC 29 0.29 0.31 1.84 0.09 0.91 0.92
8 2128789 MC 35 0.35 0.27 1.88 0.09 1.04 1.04
9 2128792 MC 34 0.34 0.19 1.91 0.09 1.09 1.13
10 2128473 MC 66 0.66 0.33 0.79 0.08 0.89 0.86
11 2125165 MC 40 0.40 0.33 1.81 0.09 1.03 1.03
12 2129777 MC 34 0.34 0.29 2.02 0.09 1.05 1.07
14 2128800 MC 22 0.22 0.18 2.60 0.10 1.11 1.22
15 2123715 MC 27 0.27 0.22 1.96 0.09 0.97 0.97
17 2128646 MC 46 0.46 0.22 1.22 0.08 1.04 1.04
18 2128486 MC 30 0.30 0.08 2.19 0.09 1.22 1.28
19 2128649 MC 19 0.19 0.25 2.42 0.10 0.89 0.94
21 3326135 SA 9 0.18 0.37 3.36 0.10 0.97 0.92
22 3191417 MC 68 0.68 0.38 0.29 0.09 0.87 0.82
23 3191424 MC 23 0.23 0.00 2.49 0.10 1.20 1.32
25 3217756 OE 5 0.21 0.58 3.20 0.07 0.85 0.41
26 3191362 MC 29 0.29 0.27 2.12 0.09 1.01 1.02
28 3326132 SA 9 0.18 0.43 3.27 0.10 0.91 0.88
29 3217334 OE 8 0.30 0.56 3.59 0.07 0.87 0.68
30 3308033 SA 8 0.16 0.43 3.66 0.11 0.90 0.76
31 3191313 MC 35 0.35 0.15 1.83 0.09 1.11 1.17
32 3191528 MC 57 0.57 0.31 0.82 0.08 0.96 0.96
33 3191364 MC 31 0.31 0.18 2.04 0.09 1.08 1.15
34 3308031 SA 6 0.12 0.50 3.18 0.10 0.84 0.64
35 3308035 SA 6 0.12 0.57 3.22 0.10 0.77 0.36
36 3191427 MC 20 0.20 0.30 2.64 0.10 0.99 1.00
37 3190208 MC 53 0.53 0.22 1.01 0.08 1.04 1.06
38 3308026 SA 25 0.50 0.41 3.71 0.08 0.89 0.87
39 3191411 MC 30 0.30 0.12 2.07 0.09 1.12 1.17
41 3308025 SA 12 0.24 0.31 2.41 0.10 0.98 0.91
42 3191347 MC 68 0.68 0.28 0.29 0.09 0.95 0.96
44 3191298 MC 36 0.36 0.15 1.78 0.09 1.09 1.15
45 3191336 MC 35 0.35 0.34 1.80 0.09 0.96 0.95
46 3191395 MC 36 0.36 0.17 1.78 0.09 1.09 1.13
47 3326134 SA 21 0.43 0.36 2.69 0.07 1.00 0.96
48 3217709 OE 7 0.28 0.56 2.84 0.06 1.01 0.61
49 3191338 MC 39 0.39 0.12 1.62 0.09 1.11 1.14
50 3191354 MC 54 0.54 0.35 0.94 0.08 0.92 0.92
51 3191382 MC 53 0.53 0.31 0.98 0.08 0.96 0.95
52 3191349 MC 33 0.33 0.23 1.94 0.09 1.04 1.05
53 3191371 MC 36 0.36 0.18 1.78 0.09 1.07 1.10
55 3326129 SA 3 0.06 0.44 3.61 0.14 0.87 0.32
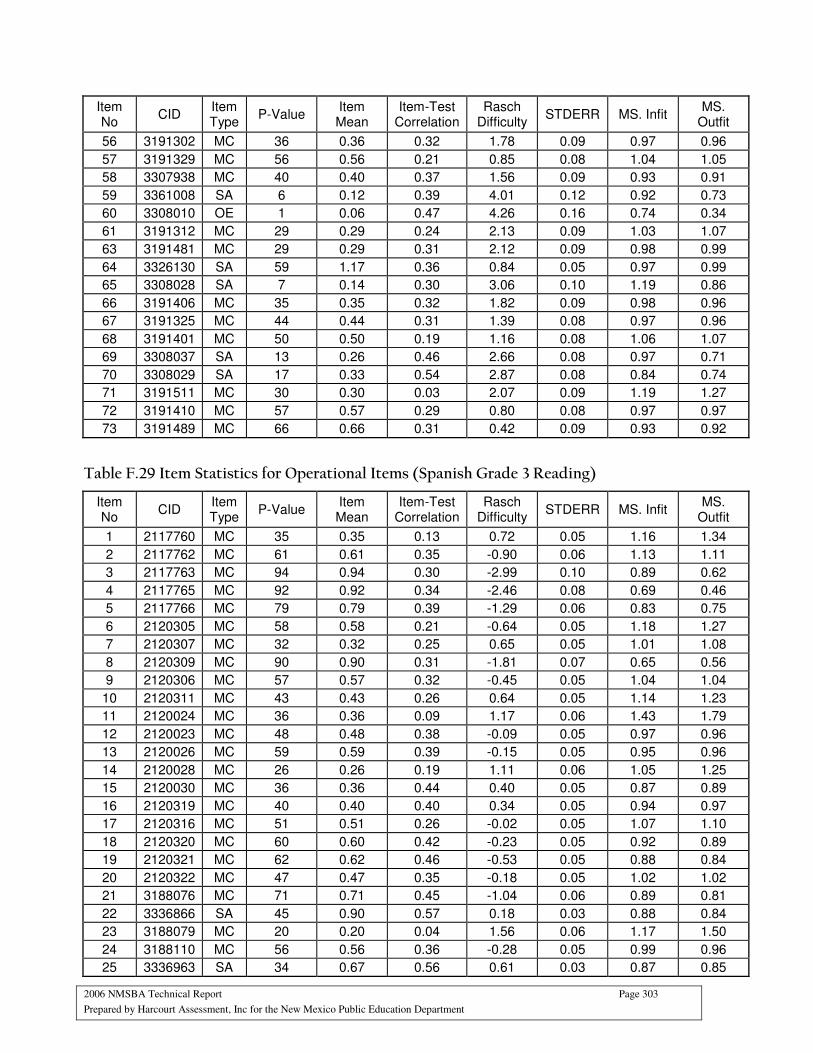
2006 NMSBA Technical Report Page 303
Prepared by Harcourt Assessment, Inc for the New Mexico Public Education Department
Item No
CID Item Type
P-Value Item Mean
Item-Test Correlation
Rasch Difficulty
STDERR MS. Infit MS.
Outfit
56 3191302 MC 36 0.36 0.32 1.78 0.09 0.97 0.96
57 3191329 MC 56 0.56 0.21 0.85 0.08 1.04 1.05
58 3307938 MC 40 0.40 0.37 1.56 0.09 0.93 0.91
59 3361008 SA 6 0.12 0.39 4.01 0.12 0.92 0.73
60 3308010 OE 1 0.06 0.47 4.26 0.16 0.74 0.34
61 3191312 MC 29 0.29 0.24 2.13 0.09 1.03 1.07
63 3191481 MC 29 0.29 0.31 2.12 0.09 0.98 0.99
64 3326130 SA 59 1.17 0.36 0.84 0.05 0.97 0.99
65 3308028 SA 7 0.14 0.30 3.06 0.10 1.19 0.86
66 3191406 MC 35 0.35 0.32 1.82 0.09 0.98 0.96
67 3191325 MC 44 0.44 0.31 1.39 0.08 0.97 0.96
68 3191401 MC 50 0.50 0.19 1.16 0.08 1.06 1.07
69 3308037 SA 13 0.26 0.46 2.66 0.08 0.97 0.71
70 3308029 SA 17 0.33 0.54 2.87 0.08 0.84 0.74
71 3191511 MC 30 0.30 0.03 2.07 0.09 1.19 1.27
72 3191410 MC 57 0.57 0.29 0.80 0.08 0.97 0.97
73 3191489 MC 66 0.66 0.31 0.42 0.09 0.93 0.92
Table F.29 Item Statistics for Operational Items (Spanish Grade 3 Reading)
Item No
CID Item Type
P-Value Item Mean
Item-Test Correlation
Rasch Difficulty
STDERR MS. Infit MS.
Outfit
1 2117760 MC 35 0.35 0.13 0.72 0.05 1.16 1.34
2 2117762 MC 61 0.61 0.35 -0.90 0.06 1.13 1.11
3 2117763 MC 94 0.94 0.30 -2.99 0.10 0.89 0.62
4 2117765 MC 92 0.92 0.34 -2.46 0.08 0.69 0.46
5 2117766 MC 79 0.79 0.39 -1.29 0.06 0.83 0.75
6 2120305 MC 58 0.58 0.21 -0.64 0.05 1.18 1.27
7 2120307 MC 32 0.32 0.25 0.65 0.05 1.01 1.08
8 2120309 MC 90 0.90 0.31 -1.81 0.07 0.65 0.56
9 2120306 MC 57 0.57 0.32 -0.45 0.05 1.04 1.04
10 2120311 MC 43 0.43 0.26 0.64 0.05 1.14 1.23
11 2120024 MC 36 0.36 0.09 1.17 0.06 1.43 1.79
12 2120023 MC 48 0.48 0.38 -0.09 0.05 0.97 0.96
13 2120026 MC 59 0.59 0.39 -0.15 0.05 0.95 0.96
14 2120028 MC 26 0.26 0.19 1.11 0.06 1.05 1.25
15 2120030 MC 36 0.36 0.44 0.40 0.05 0.87 0.89
16 2120319 MC 40 0.40 0.40 0.34 0.05 0.94 0.97
17 2120316 MC 51 0.51 0.26 -0.02 0.05 1.07 1.10
18 2120320 MC 60 0.60 0.42 -0.23 0.05 0.92 0.89
19 2120321 MC 62 0.62 0.46 -0.53 0.05 0.88 0.84
20 2120322 MC 47 0.47 0.35 -0.18 0.05 1.02 1.02
21 3188076 MC 71 0.71 0.45 -1.04 0.06 0.89 0.81
22 3336866 SA 45 0.90 0.57 0.18 0.03 0.88 0.84
23 3188079 MC 20 0.20 0.04 1.56 0.06 1.17 1.50
24 3188110 MC 56 0.56 0.36 -0.28 0.05 0.99 0.96
25 3336963 SA 34 0.67 0.56 0.61 0.03 0.87 0.85
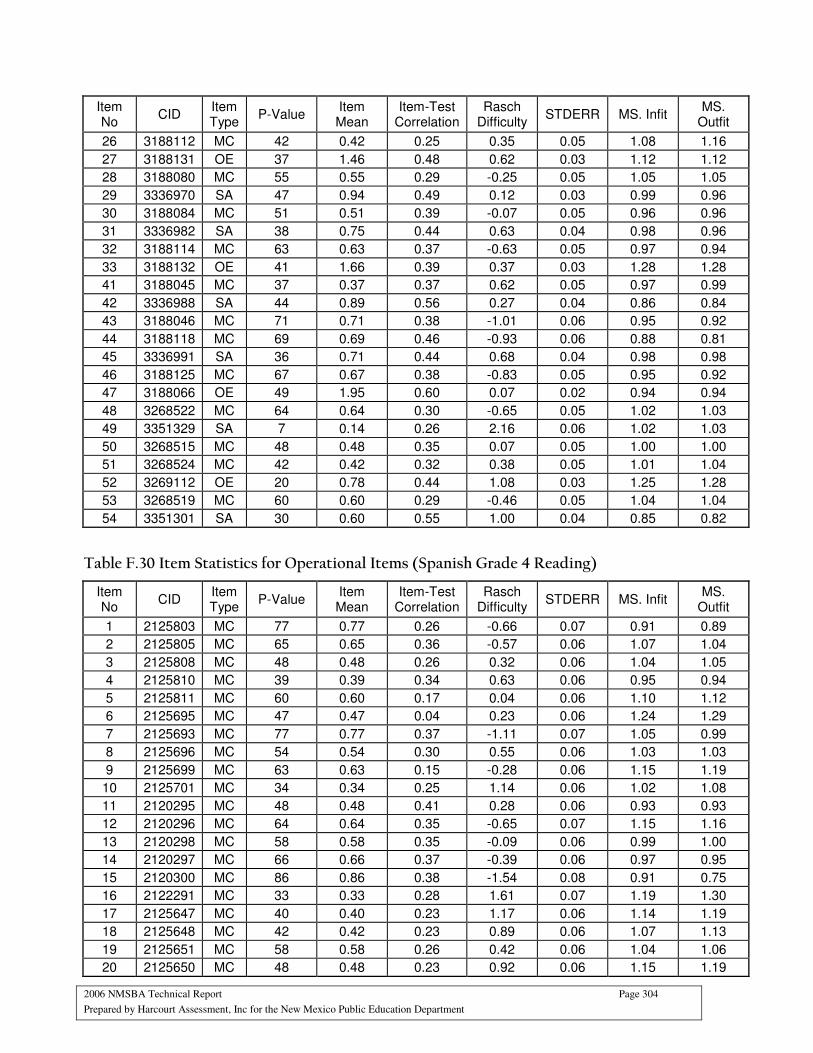
2006 NMSBA Technical Report Page 304
Prepared by Harcourt Assessment, Inc for the New Mexico Public Education Department
Item No
CID Item Type
P-Value Item Mean
Item-Test Correlation
Rasch Difficulty
STDERR MS. Infit MS.
Outfit
26 3188112 MC 42 0.42 0.25 0.35 0.05 1.08 1.16
27 3188131 OE 37 1.46 0.48 0.62 0.03 1.12 1.12
28 3188080 MC 55 0.55 0.29 -0.25 0.05 1.05 1.05
29 3336970 SA 47 0.94 0.49 0.12 0.03 0.99 0.96
30 3188084 MC 51 0.51 0.39 -0.07 0.05 0.96 0.96
31 3336982 SA 38 0.75 0.44 0.63 0.04 0.98 0.96
32 3188114 MC 63 0.63 0.37 -0.63 0.05 0.97 0.94
33 3188132 OE 41 1.66 0.39 0.37 0.03 1.28 1.28
41 3188045 MC 37 0.37 0.37 0.62 0.05 0.97 0.99
42 3336988 SA 44 0.89 0.56 0.27 0.04 0.86 0.84
43 3188046 MC 71 0.71 0.38 -1.01 0.06 0.95 0.92
44 3188118 MC 69 0.69 0.46 -0.93 0.06 0.88 0.81
45 3336991 SA 36 0.71 0.44 0.68 0.04 0.98 0.98
46 3188125 MC 67 0.67 0.38 -0.83 0.05 0.95 0.92
47 3188066 OE 49 1.95 0.60 0.07 0.02 0.94 0.94
48 3268522 MC 64 0.64 0.30 -0.65 0.05 1.02 1.03
49 3351329 SA 7 0.14 0.26 2.16 0.06 1.02 1.03
50 3268515 MC 48 0.48 0.35 0.07 0.05 1.00 1.00
51 3268524 MC 42 0.42 0.32 0.38 0.05 1.01 1.04
52 3269112 OE 20 0.78 0.44 1.08 0.03 1.25 1.28
53 3268519 MC 60 0.60 0.29 -0.46 0.05 1.04 1.04
54 3351301 SA 30 0.60 0.55 1.00 0.04 0.85 0.82
Table F.30 Item Statistics for Operational Items (Spanish Grade 4 Reading)
Item No
CID Item Type
P-Value Item Mean
Item-Test Correlation
Rasch Difficulty
STDERR MS. Infit MS.
Outfit
1 2125803 MC 77 0.77 0.26 -0.66 0.07 0.91 0.89
2 2125805 MC 65 0.65 0.36 -0.57 0.06 1.07 1.04
3 2125808 MC 48 0.48 0.26 0.32 0.06 1.04 1.05
4 2125810 MC 39 0.39 0.34 0.63 0.06 0.95 0.94
5 2125811 MC 60 0.60 0.17 0.04 0.06 1.10 1.12
6 2125695 MC 47 0.47 0.04 0.23 0.06 1.24 1.29
7 2125693 MC 77 0.77 0.37 -1.11 0.07 1.05 0.99
8 2125696 MC 54 0.54 0.30 0.55 0.06 1.03 1.03
9 2125699 MC 63 0.63 0.15 -0.28 0.06 1.15 1.19
10 2125701 MC 34 0.34 0.25 1.14 0.06 1.02 1.08
11 2120295 MC 48 0.48 0.41 0.28 0.06 0.93 0.93
12 2120296 MC 64 0.64 0.35 -0.65 0.07 1.15 1.16
13 2120298 MC 58 0.58 0.35 -0.09 0.06 0.99 1.00
14 2120297 MC 66 0.66 0.37 -0.39 0.06 0.97 0.95
15 2120300 MC 86 0.86 0.38 -1.54 0.08 0.91 0.75
16 2122291 MC 33 0.33 0.28 1.61 0.07 1.19 1.30
17 2125647 MC 40 0.40 0.23 1.17 0.06 1.14 1.19
18 2125648 MC 42 0.42 0.23 0.89 0.06 1.07 1.13
19 2125651 MC 58 0.58 0.26 0.42 0.06 1.04 1.06
20 2125650 MC 48 0.48 0.23 0.92 0.06 1.15 1.19
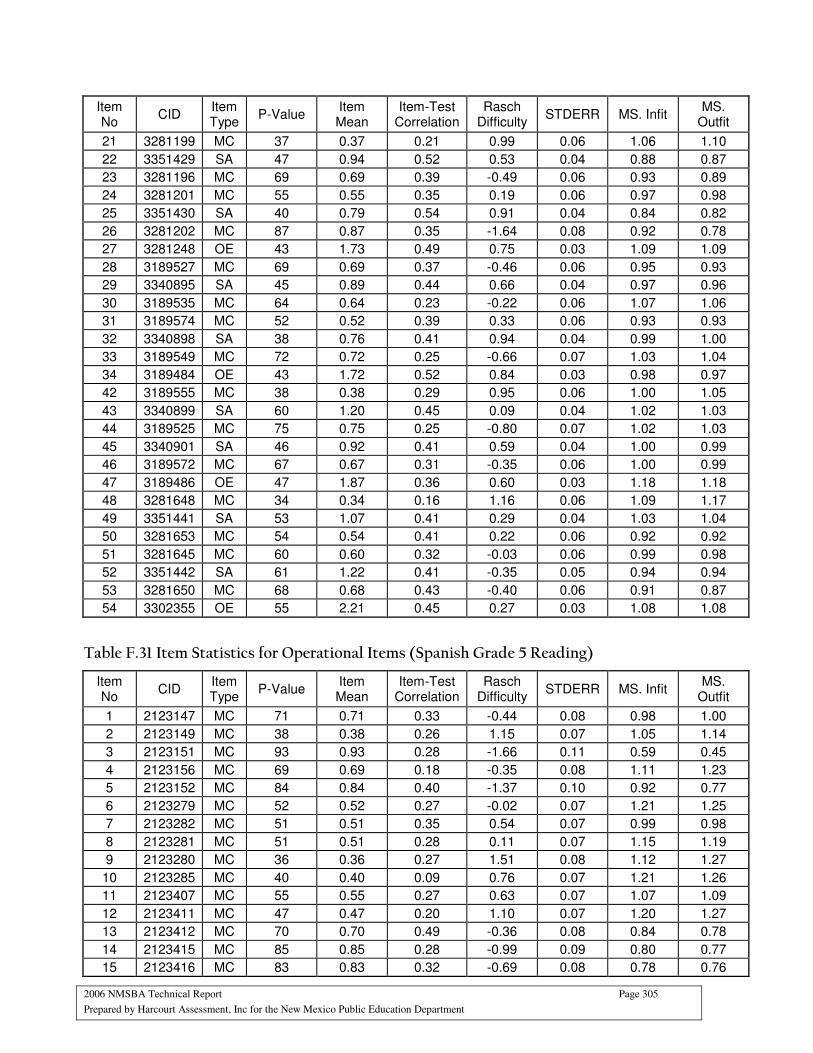
2006 NMSBA Technical Report Page 305
Prepared by Harcourt Assessment, Inc for the New Mexico Public Education Department
Item No
CID Item Type
P-Value Item Mean
Item-Test Correlation
Rasch Difficulty
STDERR MS. Infit MS.
Outfit
21 3281199 MC 37 0.37 0.21 0.99 0.06 1.06 1.10
22 3351429 SA 47 0.94 0.52 0.53 0.04 0.88 0.87
23 3281196 MC 69 0.69 0.39 -0.49 0.06 0.93 0.89
24 3281201 MC 55 0.55 0.35 0.19 0.06 0.97 0.98
25 3351430 SA 40 0.79 0.54 0.91 0.04 0.84 0.82
26 3281202 MC 87 0.87 0.35 -1.64 0.08 0.92 0.78
27 3281248 OE 43 1.73 0.49 0.75 0.03 1.09 1.09
28 3189527 MC 69 0.69 0.37 -0.46 0.06 0.95 0.93
29 3340895 SA 45 0.89 0.44 0.66 0.04 0.97 0.96
30 3189535 MC 64 0.64 0.23 -0.22 0.06 1.07 1.06
31 3189574 MC 52 0.52 0.39 0.33 0.06 0.93 0.93
32 3340898 SA 38 0.76 0.41 0.94 0.04 0.99 1.00
33 3189549 MC 72 0.72 0.25 -0.66 0.07 1.03 1.04
34 3189484 OE 43 1.72 0.52 0.84 0.03 0.98 0.97
42 3189555 MC 38 0.38 0.29 0.95 0.06 1.00 1.05
43 3340899 SA 60 1.20 0.45 0.09 0.04 1.02 1.03
44 3189525 MC 75 0.75 0.25 -0.80 0.07 1.02 1.03
45 3340901 SA 46 0.92 0.41 0.59 0.04 1.00 0.99
46 3189572 MC 67 0.67 0.31 -0.35 0.06 1.00 0.99
47 3189486 OE 47 1.87 0.36 0.60 0.03 1.18 1.18
48 3281648 MC 34 0.34 0.16 1.16 0.06 1.09 1.17
49 3351441 SA 53 1.07 0.41 0.29 0.04 1.03 1.04
50 3281653 MC 54 0.54 0.41 0.22 0.06 0.92 0.92
51 3281645 MC 60 0.60 0.32 -0.03 0.06 0.99 0.98
52 3351442 SA 61 1.22 0.41 -0.35 0.05 0.94 0.94
53 3281650 MC 68 0.68 0.43 -0.40 0.06 0.91 0.87
54 3302355 OE 55 2.21 0.45 0.27 0.03 1.08 1.08
Table F.31 Item Statistics for Operational Items (Spanish Grade 5 Reading)
Item No
CID Item Type
P-Value Item Mean
Item-Test Correlation
Rasch Difficulty
STDERR MS. Infit MS.
Outfit
1 2123147 MC 71 0.71 0.33 -0.44 0.08 0.98 1.00
2 2123149 MC 38 0.38 0.26 1.15 0.07 1.05 1.14
3 2123151 MC 93 0.93 0.28 -1.66 0.11 0.59 0.45
4 2123156 MC 69 0.69 0.18 -0.35 0.08 1.11 1.23
5 2123152 MC 84 0.84 0.40 -1.37 0.10 0.92 0.77
6 2123279 MC 52 0.52 0.27 -0.02 0.07 1.21 1.25
7 2123282 MC 51 0.51 0.35 0.54 0.07 0.99 0.98
8 2123281 MC 51 0.51 0.28 0.11 0.07 1.15 1.19
9 2123280 MC 36 0.36 0.27 1.51 0.08 1.12 1.27
10 2123285 MC 40 0.40 0.09 0.76 0.07 1.21 1.26
11 2123407 MC 55 0.55 0.27 0.63 0.07 1.07 1.09
12 2123411 MC 47 0.47 0.20 1.10 0.07 1.20 1.27
13 2123412 MC 70 0.70 0.49 -0.36 0.08 0.84 0.78
14 2123415 MC 85 0.85 0.28 -0.99 0.09 0.80 0.77
15 2123416 MC 83 0.83 0.32 -0.69 0.08 0.78 0.76
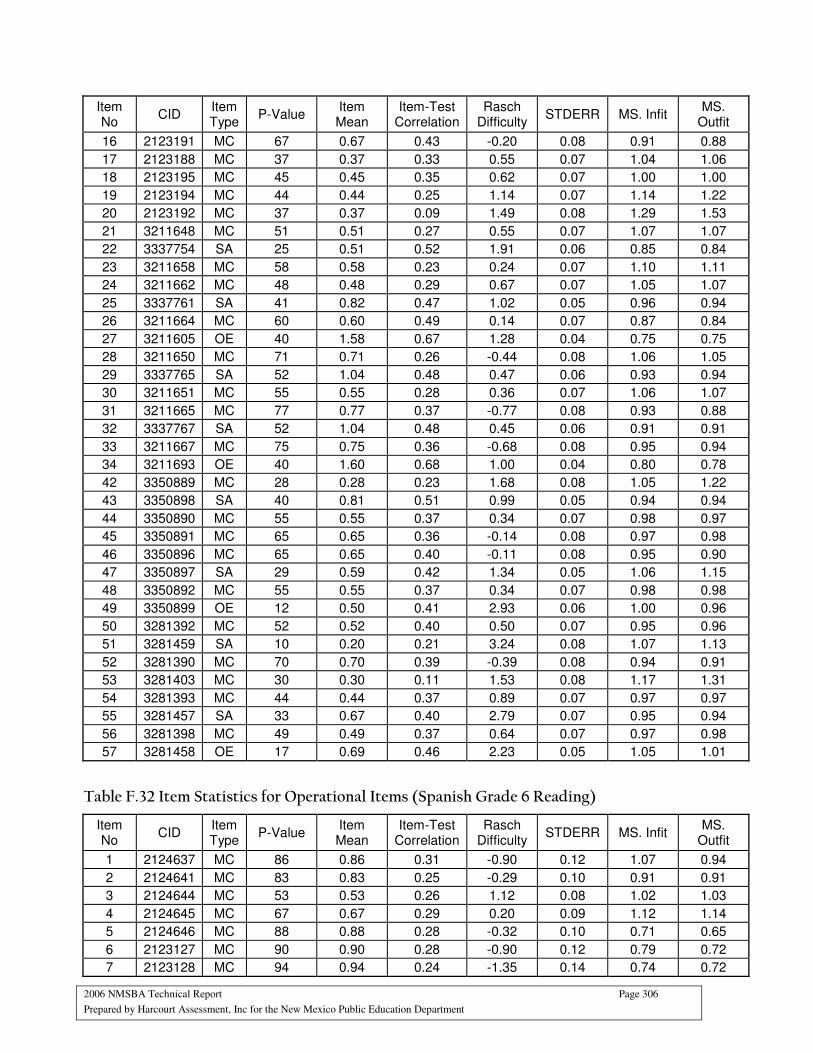
2006 NMSBA Technical Report Page 306
Prepared by Harcourt Assessment, Inc for the New Mexico Public Education Department
Item No
CID Item Type
P-Value Item Mean
Item-Test Correlation
Rasch Difficulty
STDERR MS. Infit MS.
Outfit
16 2123191 MC 67 0.67 0.43 -0.20 0.08 0.91 0.88
17 2123188 MC 37 0.37 0.33 0.55 0.07 1.04 1.06
18 2123195 MC 45 0.45 0.35 0.62 0.07 1.00 1.00
19 2123194 MC 44 0.44 0.25 1.14 0.07 1.14 1.22
20 2123192 MC 37 0.37 0.09 1.49 0.08 1.29 1.53
21 3211648 MC 51 0.51 0.27 0.55 0.07 1.07 1.07
22 3337754 SA 25 0.51 0.52 1.91 0.06 0.85 0.84
23 3211658 MC 58 0.58 0.23 0.24 0.07 1.10 1.11
24 3211662 MC 48 0.48 0.29 0.67 0.07 1.05 1.07
25 3337761 SA 41 0.82 0.47 1.02 0.05 0.96 0.94
26 3211664 MC 60 0.60 0.49 0.14 0.07 0.87 0.84
27 3211605 OE 40 1.58 0.67 1.28 0.04 0.75 0.75
28 3211650 MC 71 0.71 0.26 -0.44 0.08 1.06 1.05
29 3337765 SA 52 1.04 0.48 0.47 0.06 0.93 0.94
30 3211651 MC 55 0.55 0.28 0.36 0.07 1.06 1.07
31 3211665 MC 77 0.77 0.37 -0.77 0.08 0.93 0.88
32 3337767 SA 52 1.04 0.48 0.45 0.06 0.91 0.91
33 3211667 MC 75 0.75 0.36 -0.68 0.08 0.95 0.94
34 3211693 OE 40 1.60 0.68 1.00 0.04 0.80 0.78
42 3350889 MC 28 0.28 0.23 1.68 0.08 1.05 1.22
43 3350898 SA 40 0.81 0.51 0.99 0.05 0.94 0.94
44 3350890 MC 55 0.55 0.37 0.34 0.07 0.98 0.97
45 3350891 MC 65 0.65 0.36 -0.14 0.08 0.97 0.98
46 3350896 MC 65 0.65 0.40 -0.11 0.08 0.95 0.90
47 3350897 SA 29 0.59 0.42 1.34 0.05 1.06 1.15
48 3350892 MC 55 0.55 0.37 0.34 0.07 0.98 0.98
49 3350899 OE 12 0.50 0.41 2.93 0.06 1.00 0.96
50 3281392 MC 52 0.52 0.40 0.50 0.07 0.95 0.96
51 3281459 SA 10 0.20 0.21 3.24 0.08 1.07 1.13
52 3281390 MC 70 0.70 0.39 -0.39 0.08 0.94 0.91
53 3281403 MC 30 0.30 0.11 1.53 0.08 1.17 1.31
54 3281393 MC 44 0.44 0.37 0.89 0.07 0.97 0.97
55 3281457 SA 33 0.67 0.40 2.79 0.07 0.95 0.94
56 3281398 MC 49 0.49 0.37 0.64 0.07 0.97 0.98
57 3281458 OE 17 0.69 0.46 2.23 0.05 1.05 1.01
Table F.32 Item Statistics for Operational Items (Spanish Grade 6 Reading)
Item No
CID Item Type
P-Value Item Mean
Item-Test Correlation
Rasch Difficulty
STDERR MS. Infit MS.
Outfit
1 2124637 MC 86 0.86 0.31 -0.90 0.12 1.07 0.94
2 2124641 MC 83 0.83 0.25 -0.29 0.10 0.91 0.91
3 2124644 MC 53 0.53 0.26 1.12 0.08 1.02 1.03
4 2124645 MC 67 0.67 0.29 0.20 0.09 1.12 1.14
5 2124646 MC 88 0.88 0.28 -0.32 0.10 0.71 0.65
6 2123127 MC 90 0.90 0.28 -0.90 0.12 0.79 0.72
7 2123128 MC 94 0.94 0.24 -1.35 0.14 0.74 0.72

2006 NMSBA Technical Report Page 307
Prepared by Harcourt Assessment, Inc for the New Mexico Public Education Department
Item No
CID Item Type
P-Value Item Mean
Item-Test Correlation
Rasch Difficulty
STDERR MS. Infit MS.
Outfit
8 2123134 MC 91 0.91 0.23 -0.90 0.12 0.78 0.77
9 2123131 MC 60 0.60 0.28 0.15 0.09 1.33 1.40
10 2123132 MC 63 0.63 0.20 0.08 0.09 1.36 1.41
11 2124537 MC 76 0.76 0.15 0.02 0.09 1.08 1.12
12 2124544 MC 61 0.61 0.40 0.27 0.09 1.14 1.10
13 2124542 MC 63 0.63 0.23 1.13 0.08 1.03 1.05
14 2124543 MC 44 0.44 0.22 1.04 0.08 1.10 1.13
15 2124538 MC 75 0.75 0.41 0.13 0.09 0.86 0.81
16 2124559 MC 54 0.54 0.23 0.68 0.08 1.14 1.17
17 2124560 MC 54 0.54 0.28 1.63 0.08 1.10 1.13
18 2124562 MC 80 0.80 0.25 0.37 0.09 0.84 0.80
19 2124566 MC 58 0.58 0.28 1.28 0.08 1.01 1.04
20 2124565 MC 43 0.43 0.10 1.77 0.08 1.18 1.21
21 3212404 MC 67 0.67 0.37 0.50 0.09 0.94 0.91
22 3336715 SA 67 1.34 0.29 0.40 0.06 1.08 1.09
23 3212421 MC 76 0.76 0.35 -0.03 0.10 0.94 0.88
24 3212422 MC 56 0.56 0.35 1.00 0.08 0.96 0.94
25 3336717 SA 58 1.15 0.26 0.77 0.07 1.08 1.08
26 3212458 MC 77 0.77 0.30 -0.07 0.10 0.98 0.94
27 3212425 OE 41 1.63 0.45 1.79 0.05 1.02 1.03
28 3281761 MC 63 0.63 0.37 0.64 0.08 0.94 0.92
29 3351346 SA 81 1.62 0.50 -0.29 0.07 0.85 0.79
30 3281764 MC 39 0.39 0.13 1.74 0.08 1.13 1.15
31 3281765 MC 70 0.70 0.25 0.35 0.09 1.03 1.06
32 3351356 SA 52 1.05 0.40 1.13 0.06 0.97 0.97
33 3281769 MC 47 0.47 0.31 1.37 0.08 0.98 0.99
34 3351444 OE 27 1.09 0.50 2.01 0.04 0.93 0.94
42 3336719 SA 32 0.64 0.45 2.23 0.07 0.90 0.90
43 3212403 MC 57 0.57 0.16 0.92 0.08 1.09 1.14
44 3212437 MC 60 0.60 0.29 0.80 0.08 1.00 1.00
45 3336721 SA 65 1.30 0.55 0.70 0.05 0.84 0.79
46 3212438 MC 42 0.42 0.22 1.61 0.08 1.04 1.07
47 3212436 MC 49 0.49 0.22 1.32 0.08 1.05 1.07
48 3212439 MC 75 0.75 0.36 0.04 0.09 0.94 0.89
49 3336723 OE 48 1.91 0.53 1.47 0.04 0.96 0.96
50 3336725 SA 38 0.76 0.35 1.78 0.06 1.04 1.04
51 3212441 MC 57 0.57 0.36 0.94 0.08 0.95 0.93
52 3212442 MC 55 0.55 0.25 1.06 0.08 1.03 1.05
53 3212443 MC 46 0.46 0.23 1.42 0.08 1.04 1.05
54 3336727 SA 24 0.49 0.43 2.27 0.06 0.92 0.83
55 3212472 MC 69 0.69 0.42 0.39 0.09 0.90 0.86
56 3212468 MC 73 0.73 0.38 0.18 0.09 0.94 0.87
57 3336728 OE 56 2.22 0.45 1.15 0.03 1.39 1.86
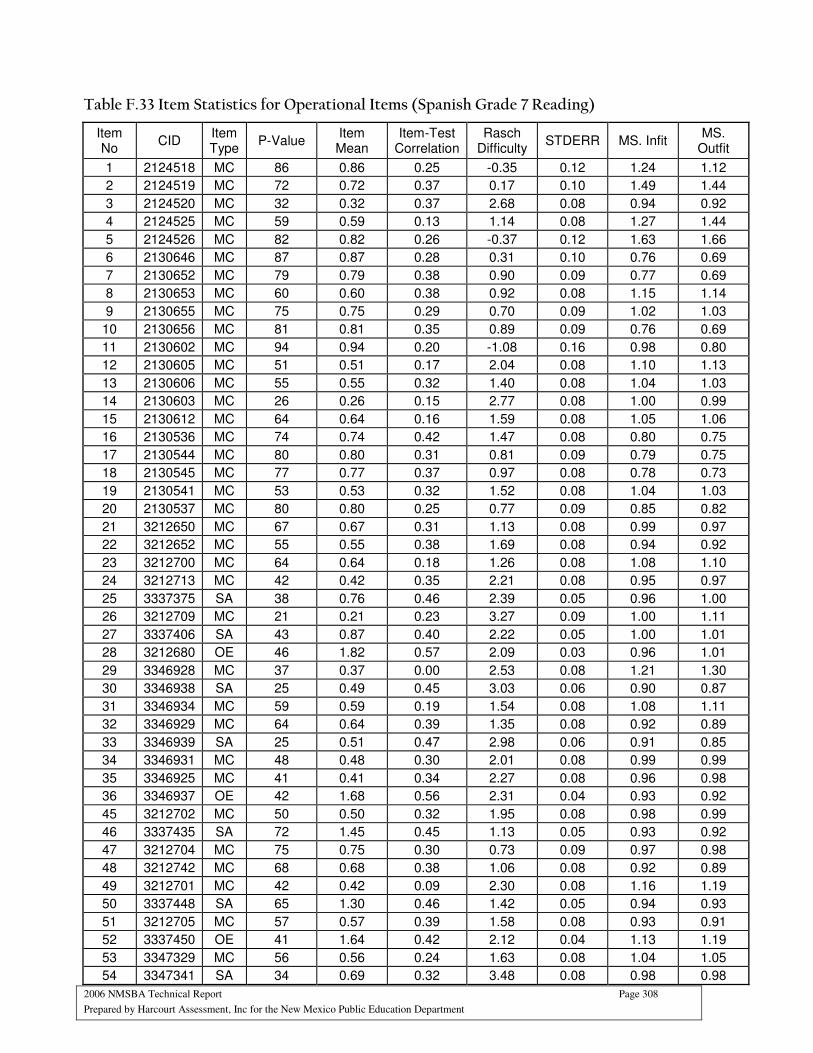
2006 NMSBA Technical Report Page 308
Prepared by Harcourt Assessment, Inc for the New Mexico Public Education Department
Table F.33 Item Statistics for Operational Items (Spanish Grade 7 Reading)
Item No
CID Item Type
P-Value Item Mean
Item-Test Correlation
Rasch Difficulty
STDERR MS. Infit MS.
Outfit
1 2124518 MC 86 0.86 0.25 -0.35 0.12 1.24 1.12
2 2124519 MC 72 0.72 0.37 0.17 0.10 1.49 1.44
3 2124520 MC 32 0.32 0.37 2.68 0.08 0.94 0.92
4 2124525 MC 59 0.59 0.13 1.14 0.08 1.27 1.44
5 2124526 MC 82 0.82 0.26 -0.37 0.12 1.63 1.66
6 2130646 MC 87 0.87 0.28 0.31 0.10 0.76 0.69
7 2130652 MC 79 0.79 0.38 0.90 0.09 0.77 0.69
8 2130653 MC 60 0.60 0.38 0.92 0.08 1.15 1.14
9 2130655 MC 75 0.75 0.29 0.70 0.09 1.02 1.03
10 2130656 MC 81 0.81 0.35 0.89 0.09 0.76 0.69
11 2130602 MC 94 0.94 0.20 -1.08 0.16 0.98 0.80
12 2130605 MC 51 0.51 0.17 2.04 0.08 1.10 1.13
13 2130606 MC 55 0.55 0.32 1.40 0.08 1.04 1.03
14 2130603 MC 26 0.26 0.15 2.77 0.08 1.00 0.99
15 2130612 MC 64 0.64 0.16 1.59 0.08 1.05 1.06
16 2130536 MC 74 0.74 0.42 1.47 0.08 0.80 0.75
17 2130544 MC 80 0.80 0.31 0.81 0.09 0.79 0.75
18 2130545 MC 77 0.77 0.37 0.97 0.08 0.78 0.73
19 2130541 MC 53 0.53 0.32 1.52 0.08 1.04 1.03
20 2130537 MC 80 0.80 0.25 0.77 0.09 0.85 0.82
21 3212650 MC 67 0.67 0.31 1.13 0.08 0.99 0.97
22 3212652 MC 55 0.55 0.38 1.69 0.08 0.94 0.92
23 3212700 MC 64 0.64 0.18 1.26 0.08 1.08 1.10
24 3212713 MC 42 0.42 0.35 2.21 0.08 0.95 0.97
25 3337375 SA 38 0.76 0.46 2.39 0.05 0.96 1.00
26 3212709 MC 21 0.21 0.23 3.27 0.09 1.00 1.11
27 3337406 SA 43 0.87 0.40 2.22 0.05 1.00 1.01
28 3212680 OE 46 1.82 0.57 2.09 0.03 0.96 1.01
29 3346928 MC 37 0.37 0.00 2.53 0.08 1.21 1.30
30 3346938 SA 25 0.49 0.45 3.03 0.06 0.90 0.87
31 3346934 MC 59 0.59 0.19 1.54 0.08 1.08 1.11
32 3346929 MC 64 0.64 0.39 1.35 0.08 0.92 0.89
33 3346939 SA 25 0.51 0.47 2.98 0.06 0.91 0.85
34 3346931 MC 48 0.48 0.30 2.01 0.08 0.99 0.99
35 3346925 MC 41 0.41 0.34 2.27 0.08 0.96 0.98
36 3346937 OE 42 1.68 0.56 2.31 0.04 0.93 0.92
45 3212702 MC 50 0.50 0.32 1.95 0.08 0.98 0.99
46 3337435 SA 72 1.45 0.45 1.13 0.05 0.93 0.92
47 3212704 MC 75 0.75 0.30 0.73 0.09 0.97 0.98
48 3212742 MC 68 0.68 0.38 1.06 0.08 0.92 0.89
49 3212701 MC 42 0.42 0.09 2.30 0.08 1.16 1.19
50 3337448 SA 65 1.30 0.46 1.42 0.05 0.94 0.93
51 3212705 MC 57 0.57 0.39 1.58 0.08 0.93 0.91
52 3337450 OE 41 1.64 0.42 2.12 0.04 1.13 1.19
53 3347329 MC 56 0.56 0.24 1.63 0.08 1.04 1.05
54 3347341 SA 34 0.69 0.32 3.48 0.08 0.98 0.98
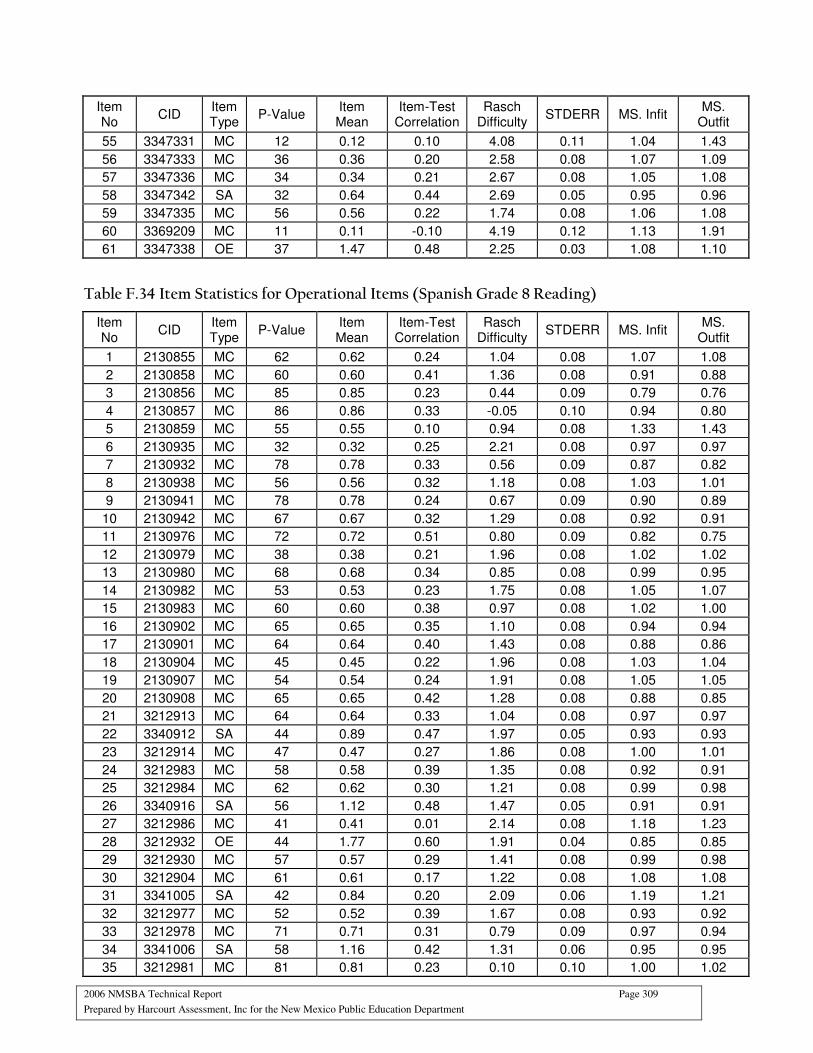
2006 NMSBA Technical Report Page 309
Prepared by Harcourt Assessment, Inc for the New Mexico Public Education Department
Item No
CID Item Type
P-Value Item Mean
Item-Test Correlation
Rasch Difficulty
STDERR MS. Infit MS.
Outfit
55 3347331 MC 12 0.12 0.10 4.08 0.11 1.04 1.43
56 3347333 MC 36 0.36 0.20 2.58 0.08 1.07 1.09
57 3347336 MC 34 0.34 0.21 2.67 0.08 1.05 1.08
58 3347342 SA 32 0.64 0.44 2.69 0.05 0.95 0.96
59 3347335 MC 56 0.56 0.22 1.74 0.08 1.06 1.08
60 3369209 MC 11 0.11 -0.10 4.19 0.12 1.13 1.91
61 3347338 OE 37 1.47 0.48 2.25 0.03 1.08 1.10
Table F.34 Item Statistics for Operational Items (Spanish Grade 8 Reading)
Item No
CID Item Type
P-Value Item Mean
Item-Test Correlation
Rasch Difficulty
STDERR MS. Infit MS.
Outfit
1 2130855 MC 62 0.62 0.24 1.04 0.08 1.07 1.08
2 2130858 MC 60 0.60 0.41 1.36 0.08 0.91 0.88
3 2130856 MC 85 0.85 0.23 0.44 0.09 0.79 0.76
4 2130857 MC 86 0.86 0.33 -0.05 0.10 0.94 0.80
5 2130859 MC 55 0.55 0.10 0.94 0.08 1.33 1.43
6 2130935 MC 32 0.32 0.25 2.21 0.08 0.97 0.97
7 2130932 MC 78 0.78 0.33 0.56 0.09 0.87 0.82
8 2130938 MC 56 0.56 0.32 1.18 0.08 1.03 1.01
9 2130941 MC 78 0.78 0.24 0.67 0.09 0.90 0.89
10 2130942 MC 67 0.67 0.32 1.29 0.08 0.92 0.91
11 2130976 MC 72 0.72 0.51 0.80 0.09 0.82 0.75
12 2130979 MC 38 0.38 0.21 1.96 0.08 1.02 1.02
13 2130980 MC 68 0.68 0.34 0.85 0.08 0.99 0.95
14 2130982 MC 53 0.53 0.23 1.75 0.08 1.05 1.07
15 2130983 MC 60 0.60 0.38 0.97 0.08 1.02 1.00
16 2130902 MC 65 0.65 0.35 1.10 0.08 0.94 0.94
17 2130901 MC 64 0.64 0.40 1.43 0.08 0.88 0.86
18 2130904 MC 45 0.45 0.22 1.96 0.08 1.03 1.04
19 2130907 MC 54 0.54 0.24 1.91 0.08 1.05 1.05
20 2130908 MC 65 0.65 0.42 1.28 0.08 0.88 0.85
21 3212913 MC 64 0.64 0.33 1.04 0.08 0.97 0.97
22 3340912 SA 44 0.89 0.47 1.97 0.05 0.93 0.93
23 3212914 MC 47 0.47 0.27 1.86 0.08 1.00 1.01
24 3212983 MC 58 0.58 0.39 1.35 0.08 0.92 0.91
25 3212984 MC 62 0.62 0.30 1.21 0.08 0.99 0.98
26 3340916 SA 56 1.12 0.48 1.47 0.05 0.91 0.91
27 3212986 MC 41 0.41 0.01 2.14 0.08 1.18 1.23
28 3212932 OE 44 1.77 0.60 1.91 0.04 0.85 0.85
29 3212930 MC 57 0.57 0.29 1.41 0.08 0.99 0.98
30 3212904 MC 61 0.61 0.17 1.22 0.08 1.08 1.08
31 3341005 SA 42 0.84 0.20 2.09 0.06 1.19 1.21
32 3212977 MC 52 0.52 0.39 1.67 0.08 0.93 0.92
33 3212978 MC 71 0.71 0.31 0.79 0.09 0.97 0.94
34 3341006 SA 58 1.16 0.42 1.31 0.06 0.95 0.95
35 3212981 MC 81 0.81 0.23 0.10 0.10 1.00 1.02
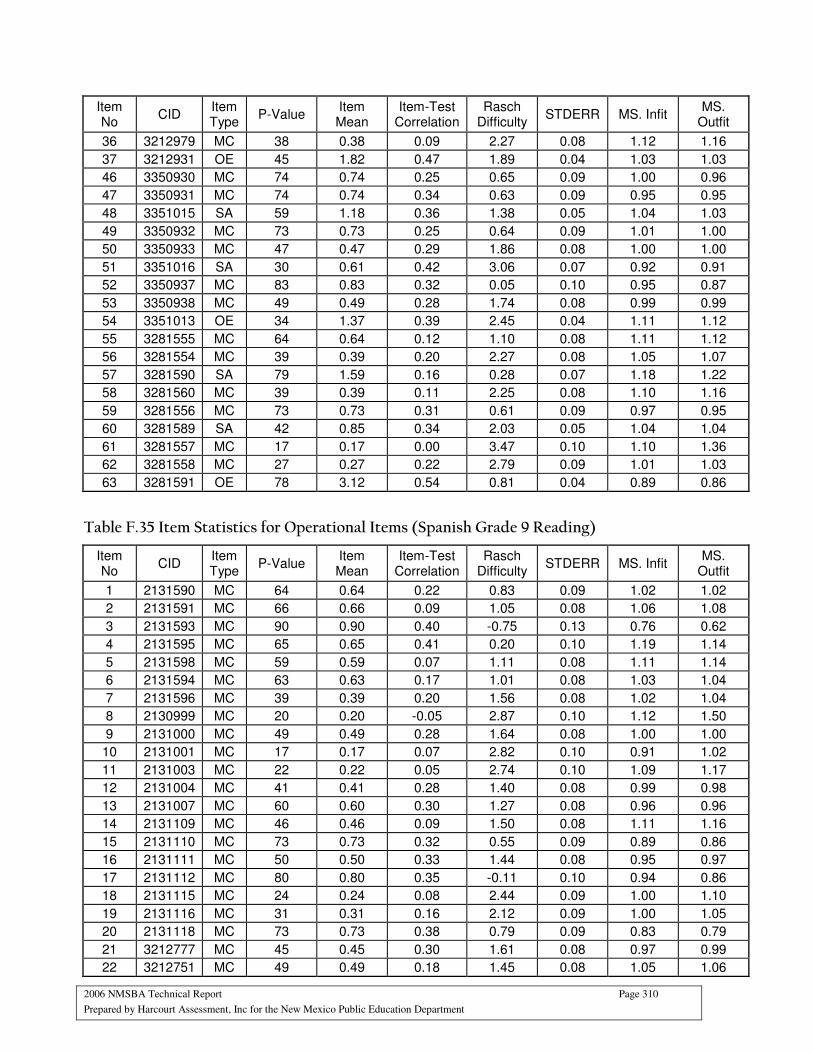
2006 NMSBA Technical Report Page 310
Prepared by Harcourt Assessment, Inc for the New Mexico Public Education Department
Item No
CID Item Type
P-Value Item Mean
Item-Test Correlation
Rasch Difficulty
STDERR MS. Infit MS.
Outfit
36 3212979 MC 38 0.38 0.09 2.27 0.08 1.12 1.16
37 3212931 OE 45 1.82 0.47 1.89 0.04 1.03 1.03
46 3350930 MC 74 0.74 0.25 0.65 0.09 1.00 0.96
47 3350931 MC 74 0.74 0.34 0.63 0.09 0.95 0.95
48 3351015 SA 59 1.18 0.36 1.38 0.05 1.04 1.03
49 3350932 MC 73 0.73 0.25 0.64 0.09 1.01 1.00
50 3350933 MC 47 0.47 0.29 1.86 0.08 1.00 1.00
51 3351016 SA 30 0.61 0.42 3.06 0.07 0.92 0.91
52 3350937 MC 83 0.83 0.32 0.05 0.10 0.95 0.87
53 3350938 MC 49 0.49 0.28 1.74 0.08 0.99 0.99
54 3351013 OE 34 1.37 0.39 2.45 0.04 1.11 1.12
55 3281555 MC 64 0.64 0.12 1.10 0.08 1.11 1.12
56 3281554 MC 39 0.39 0.20 2.27 0.08 1.05 1.07
57 3281590 SA 79 1.59 0.16 0.28 0.07 1.18 1.22
58 3281560 MC 39 0.39 0.11 2.25 0.08 1.10 1.16
59 3281556 MC 73 0.73 0.31 0.61 0.09 0.97 0.95
60 3281589 SA 42 0.85 0.34 2.03 0.05 1.04 1.04
61 3281557 MC 17 0.17 0.00 3.47 0.10 1.10 1.36
62 3281558 MC 27 0.27 0.22 2.79 0.09 1.01 1.03
63 3281591 OE 78 3.12 0.54 0.81 0.04 0.89 0.86
Table F.35 Item Statistics for Operational Items (Spanish Grade 9 Reading)
Item No
CID Item Type
P-Value Item Mean
Item-Test Correlation
Rasch Difficulty
STDERR MS. Infit MS.
Outfit
1 2131590 MC 64 0.64 0.22 0.83 0.09 1.02 1.02
2 2131591 MC 66 0.66 0.09 1.05 0.08 1.06 1.08
3 2131593 MC 90 0.90 0.40 -0.75 0.13 0.76 0.62
4 2131595 MC 65 0.65 0.41 0.20 0.10 1.19 1.14
5 2131598 MC 59 0.59 0.07 1.11 0.08 1.11 1.14
6 2131594 MC 63 0.63 0.17 1.01 0.08 1.03 1.04
7 2131596 MC 39 0.39 0.20 1.56 0.08 1.02 1.04
8 2130999 MC 20 0.20 -0.05 2.87 0.10 1.12 1.50
9 2131000 MC 49 0.49 0.28 1.64 0.08 1.00 1.00
10 2131001 MC 17 0.17 0.07 2.82 0.10 0.91 1.02
11 2131003 MC 22 0.22 0.05 2.74 0.10 1.09 1.17
12 2131004 MC 41 0.41 0.28 1.40 0.08 0.99 0.98
13 2131007 MC 60 0.60 0.30 1.27 0.08 0.96 0.96
14 2131109 MC 46 0.46 0.09 1.50 0.08 1.11 1.16
15 2131110 MC 73 0.73 0.32 0.55 0.09 0.89 0.86
16 2131111 MC 50 0.50 0.33 1.44 0.08 0.95 0.97
17 2131112 MC 80 0.80 0.35 -0.11 0.10 0.94 0.86
18 2131115 MC 24 0.24 0.08 2.44 0.09 1.00 1.10
19 2131116 MC 31 0.31 0.16 2.12 0.09 1.00 1.05
20 2131118 MC 73 0.73 0.38 0.79 0.09 0.83 0.79
21 3212777 MC 45 0.45 0.30 1.61 0.08 0.97 0.99
22 3212751 MC 49 0.49 0.18 1.45 0.08 1.05 1.06
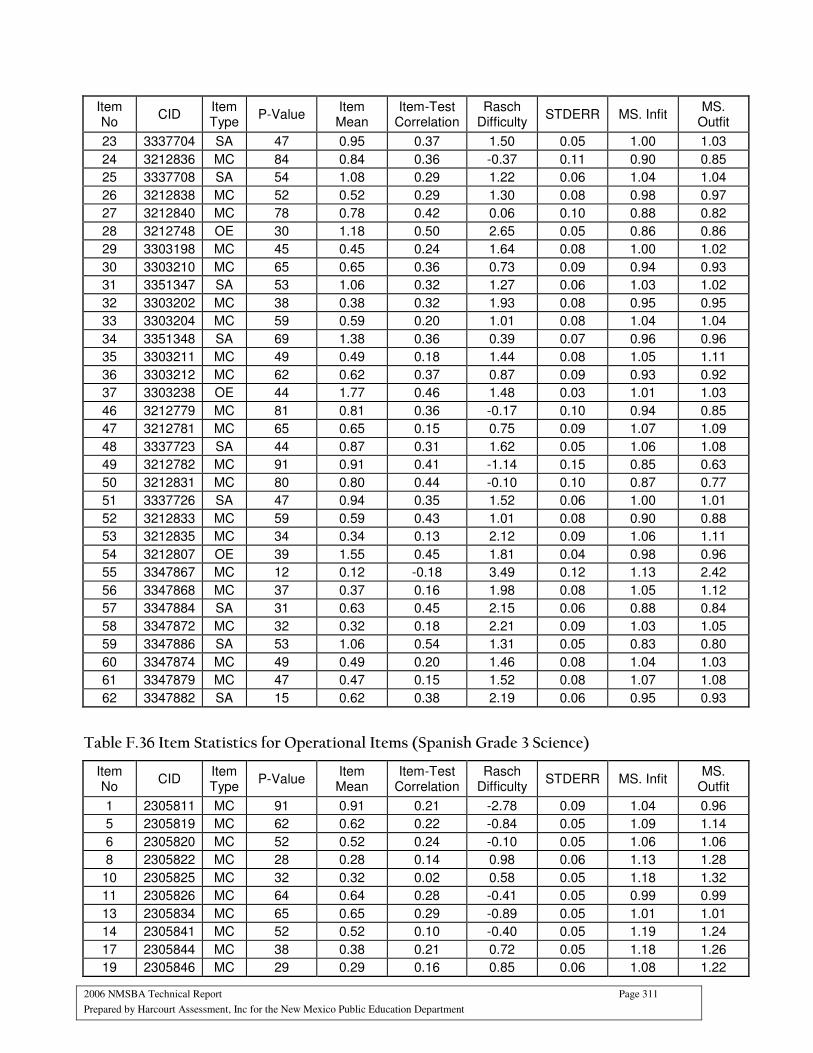
2006 NMSBA Technical Report Page 311
Prepared by Harcourt Assessment, Inc for the New Mexico Public Education Department
Item No
CID Item Type
P-Value Item Mean
Item-Test Correlation
Rasch Difficulty
STDERR MS. Infit MS.
Outfit
23 3337704 SA 47 0.95 0.37 1.50 0.05 1.00 1.03
24 3212836 MC 84 0.84 0.36 -0.37 0.11 0.90 0.85
25 3337708 SA 54 1.08 0.29 1.22 0.06 1.04 1.04
26 3212838 MC 52 0.52 0.29 1.30 0.08 0.98 0.97
27 3212840 MC 78 0.78 0.42 0.06 0.10 0.88 0.82
28 3212748 OE 30 1.18 0.50 2.65 0.05 0.86 0.86
29 3303198 MC 45 0.45 0.24 1.64 0.08 1.00 1.02
30 3303210 MC 65 0.65 0.36 0.73 0.09 0.94 0.93
31 3351347 SA 53 1.06 0.32 1.27 0.06 1.03 1.02
32 3303202 MC 38 0.38 0.32 1.93 0.08 0.95 0.95
33 3303204 MC 59 0.59 0.20 1.01 0.08 1.04 1.04
34 3351348 SA 69 1.38 0.36 0.39 0.07 0.96 0.96
35 3303211 MC 49 0.49 0.18 1.44 0.08 1.05 1.11
36 3303212 MC 62 0.62 0.37 0.87 0.09 0.93 0.92
37 3303238 OE 44 1.77 0.46 1.48 0.03 1.01 1.03
46 3212779 MC 81 0.81 0.36 -0.17 0.10 0.94 0.85
47 3212781 MC 65 0.65 0.15 0.75 0.09 1.07 1.09
48 3337723 SA 44 0.87 0.31 1.62 0.05 1.06 1.08
49 3212782 MC 91 0.91 0.41 -1.14 0.15 0.85 0.63
50 3212831 MC 80 0.80 0.44 -0.10 0.10 0.87 0.77
51 3337726 SA 47 0.94 0.35 1.52 0.06 1.00 1.01
52 3212833 MC 59 0.59 0.43 1.01 0.08 0.90 0.88
53 3212835 MC 34 0.34 0.13 2.12 0.09 1.06 1.11
54 3212807 OE 39 1.55 0.45 1.81 0.04 0.98 0.96
55 3347867 MC 12 0.12 -0.18 3.49 0.12 1.13 2.42
56 3347868 MC 37 0.37 0.16 1.98 0.08 1.05 1.12
57 3347884 SA 31 0.63 0.45 2.15 0.06 0.88 0.84
58 3347872 MC 32 0.32 0.18 2.21 0.09 1.03 1.05
59 3347886 SA 53 1.06 0.54 1.31 0.05 0.83 0.80
60 3347874 MC 49 0.49 0.20 1.46 0.08 1.04 1.03
61 3347879 MC 47 0.47 0.15 1.52 0.08 1.07 1.08
62 3347882 SA 15 0.62 0.38 2.19 0.06 0.95 0.93
Table F.36 Item Statistics for Operational Items (Spanish Grade 3 Science)
Item No
CID Item Type
P-Value Item Mean
Item-Test Correlation
Rasch Difficulty
STDERR MS. Infit MS.
Outfit
1 2305811 MC 91 0.91 0.21 -2.78 0.09 1.04 0.96
5 2305819 MC 62 0.62 0.22 -0.84 0.05 1.09 1.14
6 2305820 MC 52 0.52 0.24 -0.10 0.05 1.06 1.06
8 2305822 MC 28 0.28 0.14 0.98 0.06 1.13 1.28
10 2305825 MC 32 0.32 0.02 0.58 0.05 1.18 1.32
11 2305826 MC 64 0.64 0.28 -0.41 0.05 0.99 0.99
13 2305834 MC 65 0.65 0.29 -0.89 0.05 1.01 1.01
14 2305841 MC 52 0.52 0.10 -0.40 0.05 1.19 1.24
17 2305844 MC 38 0.38 0.21 0.72 0.05 1.18 1.26
19 2305846 MC 29 0.29 0.16 0.85 0.06 1.08 1.22
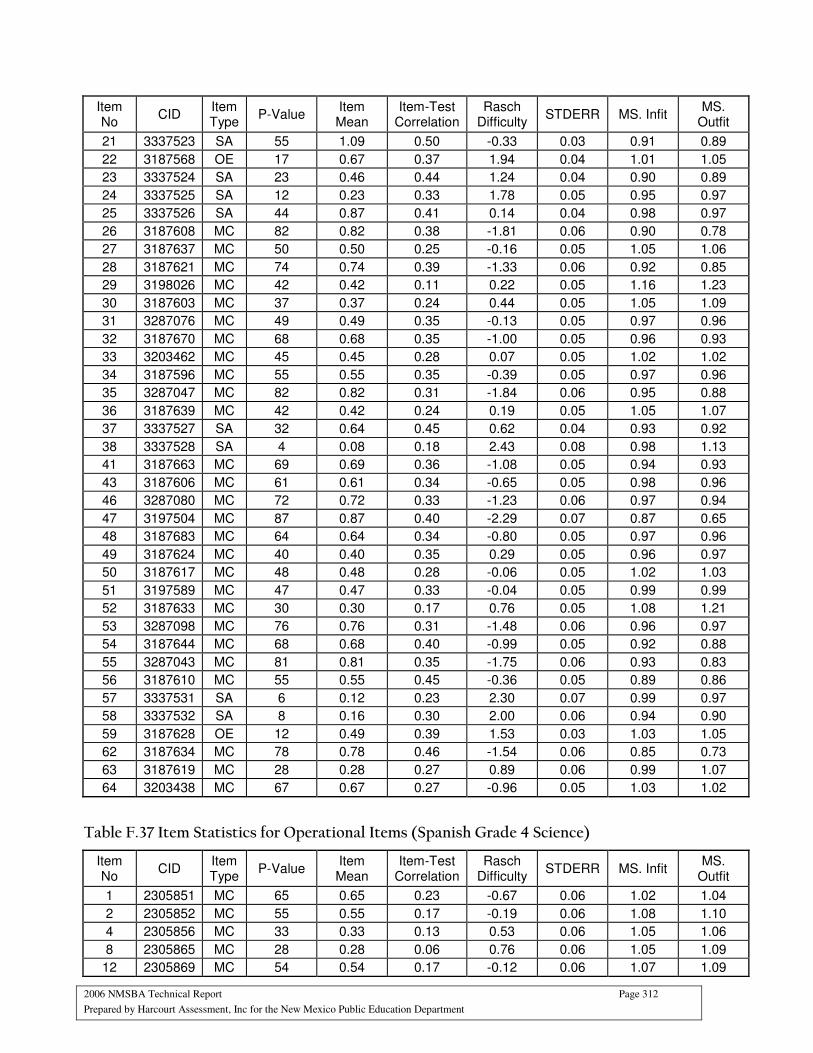
2006 NMSBA Technical Report Page 312
Prepared by Harcourt Assessment, Inc for the New Mexico Public Education Department
Item No
CID Item Type
P-Value Item Mean
Item-Test Correlation
Rasch Difficulty
STDERR MS. Infit MS.
Outfit
21 3337523 SA 55 1.09 0.50 -0.33 0.03 0.91 0.89
22 3187568 OE 17 0.67 0.37 1.94 0.04 1.01 1.05
23 3337524 SA 23 0.46 0.44 1.24 0.04 0.90 0.89
24 3337525 SA 12 0.23 0.33 1.78 0.05 0.95 0.97
25 3337526 SA 44 0.87 0.41 0.14 0.04 0.98 0.97
26 3187608 MC 82 0.82 0.38 -1.81 0.06 0.90 0.78
27 3187637 MC 50 0.50 0.25 -0.16 0.05 1.05 1.06
28 3187621 MC 74 0.74 0.39 -1.33 0.06 0.92 0.85
29 3198026 MC 42 0.42 0.11 0.22 0.05 1.16 1.23
30 3187603 MC 37 0.37 0.24 0.44 0.05 1.05 1.09
31 3287076 MC 49 0.49 0.35 -0.13 0.05 0.97 0.96
32 3187670 MC 68 0.68 0.35 -1.00 0.05 0.96 0.93
33 3203462 MC 45 0.45 0.28 0.07 0.05 1.02 1.02
34 3187596 MC 55 0.55 0.35 -0.39 0.05 0.97 0.96
35 3287047 MC 82 0.82 0.31 -1.84 0.06 0.95 0.88
36 3187639 MC 42 0.42 0.24 0.19 0.05 1.05 1.07
37 3337527 SA 32 0.64 0.45 0.62 0.04 0.93 0.92
38 3337528 SA 4 0.08 0.18 2.43 0.08 0.98 1.13
41 3187663 MC 69 0.69 0.36 -1.08 0.05 0.94 0.93
43 3187606 MC 61 0.61 0.34 -0.65 0.05 0.98 0.96
46 3287080 MC 72 0.72 0.33 -1.23 0.06 0.97 0.94
47 3197504 MC 87 0.87 0.40 -2.29 0.07 0.87 0.65
48 3187683 MC 64 0.64 0.34 -0.80 0.05 0.97 0.96
49 3187624 MC 40 0.40 0.35 0.29 0.05 0.96 0.97
50 3187617 MC 48 0.48 0.28 -0.06 0.05 1.02 1.03
51 3197589 MC 47 0.47 0.33 -0.04 0.05 0.99 0.99
52 3187633 MC 30 0.30 0.17 0.76 0.05 1.08 1.21
53 3287098 MC 76 0.76 0.31 -1.48 0.06 0.96 0.97
54 3187644 MC 68 0.68 0.40 -0.99 0.05 0.92 0.88
55 3287043 MC 81 0.81 0.35 -1.75 0.06 0.93 0.83
56 3187610 MC 55 0.55 0.45 -0.36 0.05 0.89 0.86
57 3337531 SA 6 0.12 0.23 2.30 0.07 0.99 0.97
58 3337532 SA 8 0.16 0.30 2.00 0.06 0.94 0.90
59 3187628 OE 12 0.49 0.39 1.53 0.03 1.03 1.05
62 3187634 MC 78 0.78 0.46 -1.54 0.06 0.85 0.73
63 3187619 MC 28 0.28 0.27 0.89 0.06 0.99 1.07
64 3203438 MC 67 0.67 0.27 -0.96 0.05 1.03 1.02
Table F.37 Item Statistics for Operational Items (Spanish Grade 4 Science)
Item No
CID Item Type
P-Value Item Mean
Item-Test Correlation
Rasch Difficulty
STDERR MS. Infit MS.
Outfit
1 2305851 MC 65 0.65 0.23 -0.67 0.06 1.02 1.04
2 2305852 MC 55 0.55 0.17 -0.19 0.06 1.08 1.10
4 2305856 MC 33 0.33 0.13 0.53 0.06 1.05 1.06
8 2305865 MC 28 0.28 0.06 0.76 0.06 1.05 1.09
12 2305869 MC 54 0.54 0.17 -0.12 0.06 1.07 1.09
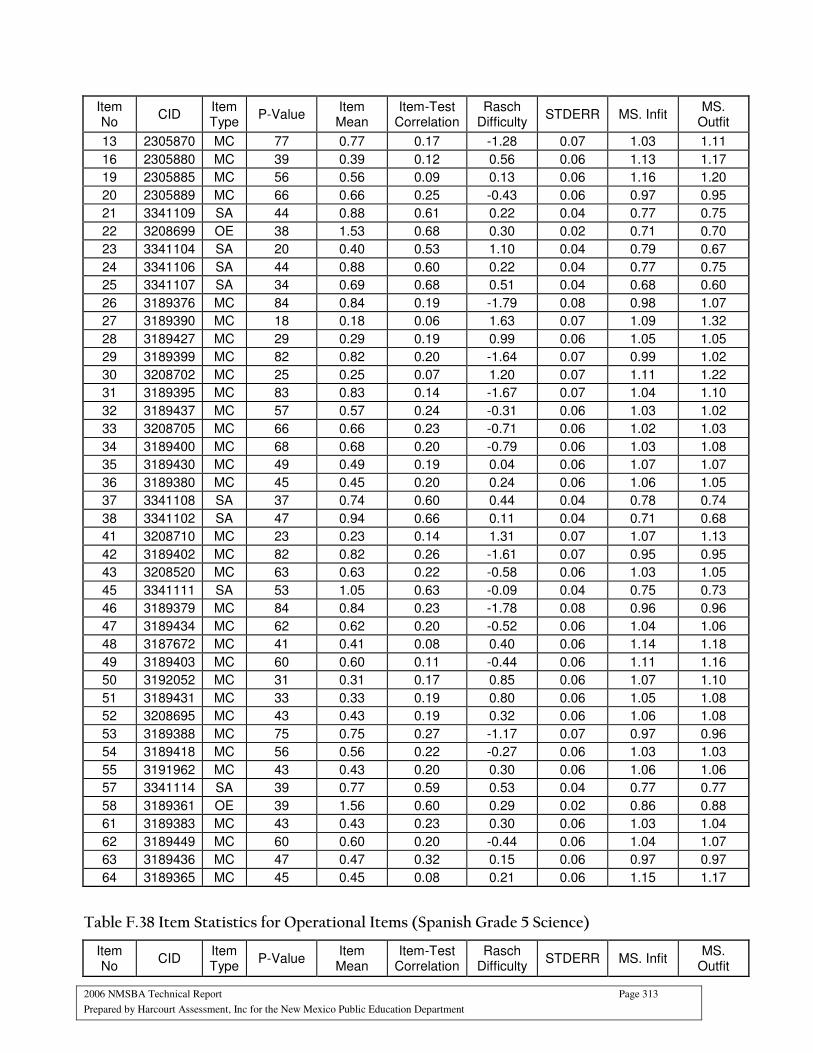
2006 NMSBA Technical Report Page 313
Prepared by Harcourt Assessment, Inc for the New Mexico Public Education Department
Item No
CID Item Type
P-Value Item Mean
Item-Test Correlation
Rasch Difficulty
STDERR MS. Infit MS.
Outfit
13 2305870 MC 77 0.77 0.17 -1.28 0.07 1.03 1.11
16 2305880 MC 39 0.39 0.12 0.56 0.06 1.13 1.17
19 2305885 MC 56 0.56 0.09 0.13 0.06 1.16 1.20
20 2305889 MC 66 0.66 0.25 -0.43 0.06 0.97 0.95
21 3341109 SA 44 0.88 0.61 0.22 0.04 0.77 0.75
22 3208699 OE 38 1.53 0.68 0.30 0.02 0.71 0.70
23 3341104 SA 20 0.40 0.53 1.10 0.04 0.79 0.67
24 3341106 SA 44 0.88 0.60 0.22 0.04 0.77 0.75
25 3341107 SA 34 0.69 0.68 0.51 0.04 0.68 0.60
26 3189376 MC 84 0.84 0.19 -1.79 0.08 0.98 1.07
27 3189390 MC 18 0.18 0.06 1.63 0.07 1.09 1.32
28 3189427 MC 29 0.29 0.19 0.99 0.06 1.05 1.05
29 3189399 MC 82 0.82 0.20 -1.64 0.07 0.99 1.02
30 3208702 MC 25 0.25 0.07 1.20 0.07 1.11 1.22
31 3189395 MC 83 0.83 0.14 -1.67 0.07 1.04 1.10
32 3189437 MC 57 0.57 0.24 -0.31 0.06 1.03 1.02
33 3208705 MC 66 0.66 0.23 -0.71 0.06 1.02 1.03
34 3189400 MC 68 0.68 0.20 -0.79 0.06 1.03 1.08
35 3189430 MC 49 0.49 0.19 0.04 0.06 1.07 1.07
36 3189380 MC 45 0.45 0.20 0.24 0.06 1.06 1.05
37 3341108 SA 37 0.74 0.60 0.44 0.04 0.78 0.74
38 3341102 SA 47 0.94 0.66 0.11 0.04 0.71 0.68
41 3208710 MC 23 0.23 0.14 1.31 0.07 1.07 1.13
42 3189402 MC 82 0.82 0.26 -1.61 0.07 0.95 0.95
43 3208520 MC 63 0.63 0.22 -0.58 0.06 1.03 1.05
45 3341111 SA 53 1.05 0.63 -0.09 0.04 0.75 0.73
46 3189379 MC 84 0.84 0.23 -1.78 0.08 0.96 0.96
47 3189434 MC 62 0.62 0.20 -0.52 0.06 1.04 1.06
48 3187672 MC 41 0.41 0.08 0.40 0.06 1.14 1.18
49 3189403 MC 60 0.60 0.11 -0.44 0.06 1.11 1.16
50 3192052 MC 31 0.31 0.17 0.85 0.06 1.07 1.10
51 3189431 MC 33 0.33 0.19 0.80 0.06 1.05 1.08
52 3208695 MC 43 0.43 0.19 0.32 0.06 1.06 1.08
53 3189388 MC 75 0.75 0.27 -1.17 0.07 0.97 0.96
54 3189418 MC 56 0.56 0.22 -0.27 0.06 1.03 1.03
55 3191962 MC 43 0.43 0.20 0.30 0.06 1.06 1.06
57 3341114 SA 39 0.77 0.59 0.53 0.04 0.77 0.77
58 3189361 OE 39 1.56 0.60 0.29 0.02 0.86 0.88
61 3189383 MC 43 0.43 0.23 0.30 0.06 1.03 1.04
62 3189449 MC 60 0.60 0.20 -0.44 0.06 1.04 1.07
63 3189436 MC 47 0.47 0.32 0.15 0.06 0.97 0.97
64 3189365 MC 45 0.45 0.08 0.21 0.06 1.15 1.17
Table F.38 Item Statistics for Operational Items (Spanish Grade 5 Science)
Item No
CID Item Type
P-Value Item Mean
Item-Test Correlation
Rasch Difficulty
STDERR MS. Infit MS.
Outfit
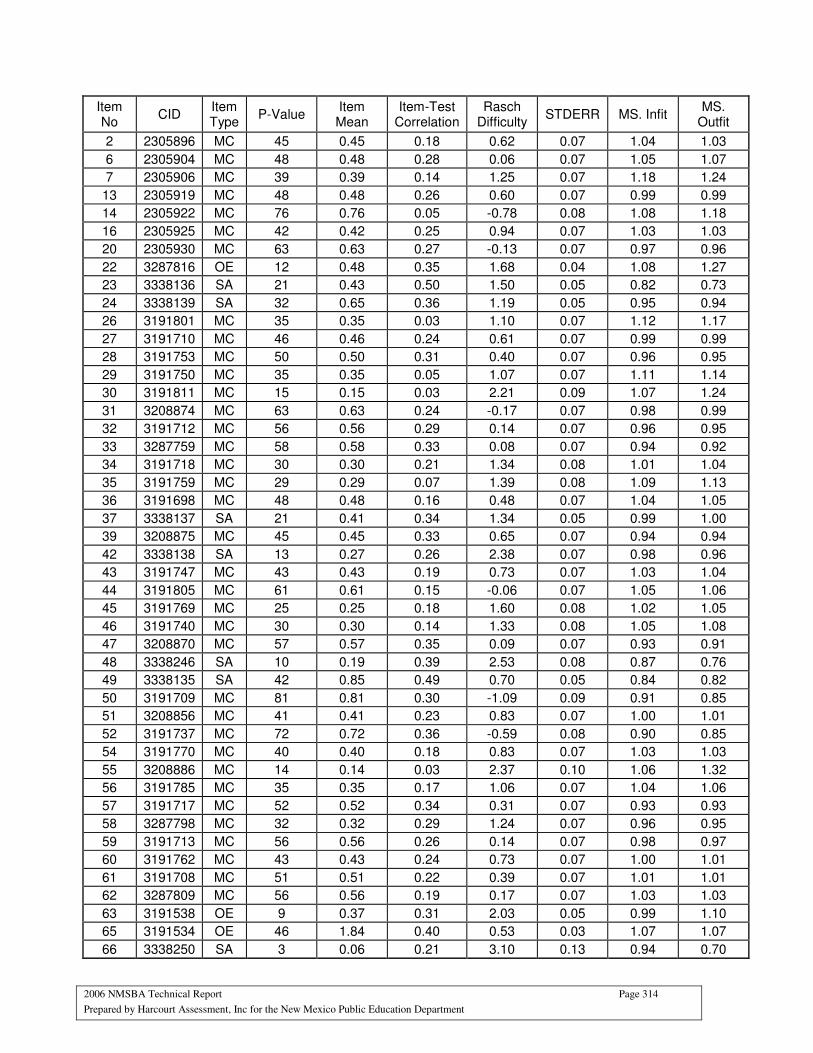
2006 NMSBA Technical Report Page 314
Prepared by Harcourt Assessment, Inc for the New Mexico Public Education Department
Item No
CID Item Type
P-Value Item Mean
Item-Test Correlation
Rasch Difficulty
STDERR MS. Infit MS.
Outfit
2 2305896 MC 45 0.45 0.18 0.62 0.07 1.04 1.03
6 2305904 MC 48 0.48 0.28 0.06 0.07 1.05 1.07
7 2305906 MC 39 0.39 0.14 1.25 0.07 1.18 1.24
13 2305919 MC 48 0.48 0.26 0.60 0.07 0.99 0.99
14 2305922 MC 76 0.76 0.05 -0.78 0.08 1.08 1.18
16 2305925 MC 42 0.42 0.25 0.94 0.07 1.03 1.03
20 2305930 MC 63 0.63 0.27 -0.13 0.07 0.97 0.96
22 3287816 OE 12 0.48 0.35 1.68 0.04 1.08 1.27
23 3338136 SA 21 0.43 0.50 1.50 0.05 0.82 0.73
24 3338139 SA 32 0.65 0.36 1.19 0.05 0.95 0.94
26 3191801 MC 35 0.35 0.03 1.10 0.07 1.12 1.17
27 3191710 MC 46 0.46 0.24 0.61 0.07 0.99 0.99
28 3191753 MC 50 0.50 0.31 0.40 0.07 0.96 0.95
29 3191750 MC 35 0.35 0.05 1.07 0.07 1.11 1.14
30 3191811 MC 15 0.15 0.03 2.21 0.09 1.07 1.24
31 3208874 MC 63 0.63 0.24 -0.17 0.07 0.98 0.99
32 3191712 MC 56 0.56 0.29 0.14 0.07 0.96 0.95
33 3287759 MC 58 0.58 0.33 0.08 0.07 0.94 0.92
34 3191718 MC 30 0.30 0.21 1.34 0.08 1.01 1.04
35 3191759 MC 29 0.29 0.07 1.39 0.08 1.09 1.13
36 3191698 MC 48 0.48 0.16 0.48 0.07 1.04 1.05
37 3338137 SA 21 0.41 0.34 1.34 0.05 0.99 1.00
39 3208875 MC 45 0.45 0.33 0.65 0.07 0.94 0.94
42 3338138 SA 13 0.27 0.26 2.38 0.07 0.98 0.96
43 3191747 MC 43 0.43 0.19 0.73 0.07 1.03 1.04
44 3191805 MC 61 0.61 0.15 -0.06 0.07 1.05 1.06
45 3191769 MC 25 0.25 0.18 1.60 0.08 1.02 1.05
46 3191740 MC 30 0.30 0.14 1.33 0.08 1.05 1.08
47 3208870 MC 57 0.57 0.35 0.09 0.07 0.93 0.91
48 3338246 SA 10 0.19 0.39 2.53 0.08 0.87 0.76
49 3338135 SA 42 0.85 0.49 0.70 0.05 0.84 0.82
50 3191709 MC 81 0.81 0.30 -1.09 0.09 0.91 0.85
51 3208856 MC 41 0.41 0.23 0.83 0.07 1.00 1.01
52 3191737 MC 72 0.72 0.36 -0.59 0.08 0.90 0.85
54 3191770 MC 40 0.40 0.18 0.83 0.07 1.03 1.03
55 3208886 MC 14 0.14 0.03 2.37 0.10 1.06 1.32
56 3191785 MC 35 0.35 0.17 1.06 0.07 1.04 1.06
57 3191717 MC 52 0.52 0.34 0.31 0.07 0.93 0.93
58 3287798 MC 32 0.32 0.29 1.24 0.07 0.96 0.95
59 3191713 MC 56 0.56 0.26 0.14 0.07 0.98 0.97
60 3191762 MC 43 0.43 0.24 0.73 0.07 1.00 1.01
61 3191708 MC 51 0.51 0.22 0.39 0.07 1.01 1.01
62 3287809 MC 56 0.56 0.19 0.17 0.07 1.03 1.03
63 3191538 OE 9 0.37 0.31 2.03 0.05 0.99 1.10
65 3191534 OE 46 1.84 0.40 0.53 0.03 1.07 1.07
66 3338250 SA 3 0.06 0.21 3.10 0.13 0.94 0.70

2006 NMSBA Technical Report Page 315
Prepared by Harcourt Assessment, Inc for the New Mexico Public Education Department
Table F.39 Item Statistics for Operational Items (Spanish Grade 6 Science)
Item No
CID Item Type
P-Value Item Mean
Item-Test Correlation
Rasch Difficulty
STDERR MS. Infit MS.
Outfit
1 2305931 MC 83 0.83 0.22 -0.88 0.09 0.81 0.78
4 2305937 MC 82 0.82 0.17 -0.98 0.10 0.91 0.92
5 2305941 MC 30 0.30 0.16 1.34 0.09 1.04 1.08
8 2305946 MC 40 0.40 0.13 1.12 0.08 1.15 1.19
10 2305948 MC 51 0.51 0.31 0.21 0.08 0.97 0.96
14 2305956 MC 45 0.45 0.24 0.50 0.08 0.99 1.01
15 2305957 MC 36 0.36 -0.05 1.07 0.08 1.18 1.27
17 2305959 MC 16 0.16 0.07 1.95 0.10 0.95 1.05
20 2305968 MC 23 0.23 0.13 1.77 0.10 1.06 1.19
21 3340400 SA 15 0.31 0.24 1.85 0.07 1.00 1.08
23 3340403 SA 12 0.25 0.30 2.25 0.08 0.93 0.90
24 3211514 MC 53 0.53 0.35 0.32 0.08 0.93 0.92
25 3210762 MC 43 0.43 0.23 0.73 0.08 1.01 1.01
26 3340405 SA 4 0.08 0.19 2.91 0.12 0.94 0.94
27 3211493 MC 49 0.49 0.39 0.47 0.08 0.90 0.89
28 3210736 MC 79 0.79 0.36 -0.99 0.10 0.88 0.80
29 3210776 MC 40 0.40 0.23 0.89 0.08 1.00 1.00
30 3211509 MC 50 0.50 0.33 0.43 0.08 0.95 0.94
34 3211276 MC 43 0.43 0.19 0.71 0.08 1.03 1.06
36 3211516 MC 62 0.62 0.27 -0.08 0.08 0.96 0.97
37 3211528 MC 54 0.54 0.30 0.27 0.08 0.95 0.95
38 3191829 MC 51 0.51 0.28 0.41 0.08 0.98 0.98
39 3340544 SA 27 0.54 0.37 1.39 0.06 0.94 0.91
40 3211533 MC 26 0.26 0.13 1.57 0.09 1.05 1.06
41 3211545 MC 24 0.24 0.00 1.64 0.09 1.12 1.26
42 3211507 MC 42 0.42 0.23 0.79 0.08 1.01 1.02
43 3191550 OE 15 0.60 0.38 1.88 0.05 0.93 0.93
44 3191822 MC 36 0.36 0.05 1.07 0.08 1.12 1.12
45 3210775 MC 48 0.48 0.14 0.51 0.08 1.07 1.08
46 3340549 SA 47 0.95 0.40 0.53 0.05 0.92 0.91
47 3191861 MC 69 0.69 0.28 -0.42 0.09 0.96 0.94
49 3211536 OE 17 0.68 0.46 1.69 0.05 0.87 0.85
50 3210764 MC 62 0.62 0.38 -0.07 0.08 0.90 0.88
52 3210779 MC 32 0.32 0.05 1.25 0.09 1.11 1.19
53 3211548 MC 16 0.16 0.13 2.19 0.11 1.02 1.10
54 3340553 SA 10 0.21 0.34 2.47 0.09 0.90 0.80
55 3187647 MC 81 0.81 0.39 -1.06 0.10 0.86 0.73
56 3211529 MC 48 0.48 0.24 0.51 0.08 1.00 0.99
58 3210748 MC 57 0.57 0.29 0.13 0.08 0.96 0.97
59 3191828 MC 47 0.47 0.21 0.54 0.08 1.01 1.02
60 3191849 MC 27 0.27 -0.04 1.50 0.09 1.15 1.28
61 3340565 SA 7 0.15 0.25 2.31 0.09 0.95 0.89
62 3211281 MC 55 0.55 0.25 0.23 0.08 0.99 1.00
63 3210739 MC 59 0.59 0.41 0.07 0.08 0.89 0.86
64 3211479 MC 36 0.36 0.27 1.05 0.08 0.98 0.98
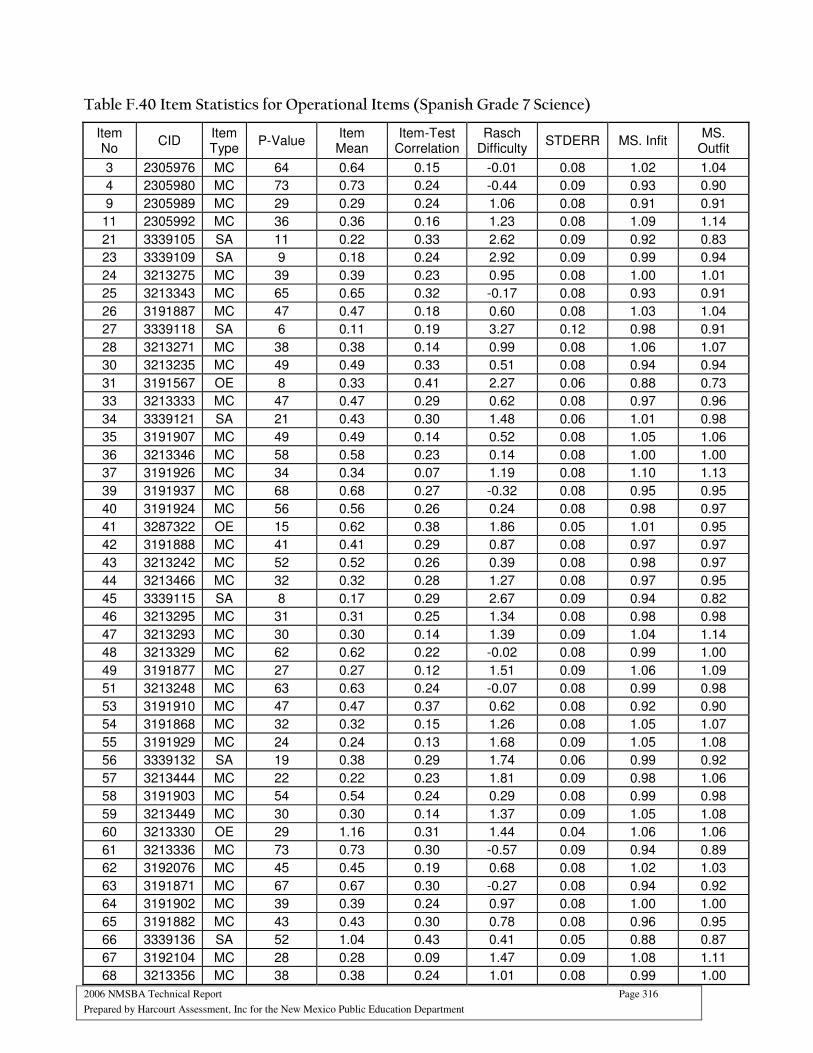
2006 NMSBA Technical Report Page 316
Prepared by Harcourt Assessment, Inc for the New Mexico Public Education Department
Table F.40 Item Statistics for Operational Items (Spanish Grade 7 Science)
Item No
CID Item Type
P-Value Item Mean
Item-Test Correlation
Rasch Difficulty
STDERR MS. Infit MS.
Outfit
3 2305976 MC 64 0.64 0.15 -0.01 0.08 1.02 1.04
4 2305980 MC 73 0.73 0.24 -0.44 0.09 0.93 0.90
9 2305989 MC 29 0.29 0.24 1.06 0.08 0.91 0.91
11 2305992 MC 36 0.36 0.16 1.23 0.08 1.09 1.14
21 3339105 SA 11 0.22 0.33 2.62 0.09 0.92 0.83
23 3339109 SA 9 0.18 0.24 2.92 0.09 0.99 0.94
24 3213275 MC 39 0.39 0.23 0.95 0.08 1.00 1.01
25 3213343 MC 65 0.65 0.32 -0.17 0.08 0.93 0.91
26 3191887 MC 47 0.47 0.18 0.60 0.08 1.03 1.04
27 3339118 SA 6 0.11 0.19 3.27 0.12 0.98 0.91
28 3213271 MC 38 0.38 0.14 0.99 0.08 1.06 1.07
30 3213235 MC 49 0.49 0.33 0.51 0.08 0.94 0.94
31 3191567 OE 8 0.33 0.41 2.27 0.06 0.88 0.73
33 3213333 MC 47 0.47 0.29 0.62 0.08 0.97 0.96
34 3339121 SA 21 0.43 0.30 1.48 0.06 1.01 0.98
35 3191907 MC 49 0.49 0.14 0.52 0.08 1.05 1.06
36 3213346 MC 58 0.58 0.23 0.14 0.08 1.00 1.00
37 3191926 MC 34 0.34 0.07 1.19 0.08 1.10 1.13
39 3191937 MC 68 0.68 0.27 -0.32 0.08 0.95 0.95
40 3191924 MC 56 0.56 0.26 0.24 0.08 0.98 0.97
41 3287322 OE 15 0.62 0.38 1.86 0.05 1.01 0.95
42 3191888 MC 41 0.41 0.29 0.87 0.08 0.97 0.97
43 3213242 MC 52 0.52 0.26 0.39 0.08 0.98 0.97
44 3213466 MC 32 0.32 0.28 1.27 0.08 0.97 0.95
45 3339115 SA 8 0.17 0.29 2.67 0.09 0.94 0.82
46 3213295 MC 31 0.31 0.25 1.34 0.08 0.98 0.98
47 3213293 MC 30 0.30 0.14 1.39 0.09 1.04 1.14
48 3213329 MC 62 0.62 0.22 -0.02 0.08 0.99 1.00
49 3191877 MC 27 0.27 0.12 1.51 0.09 1.06 1.09
51 3213248 MC 63 0.63 0.24 -0.07 0.08 0.99 0.98
53 3191910 MC 47 0.47 0.37 0.62 0.08 0.92 0.90
54 3191868 MC 32 0.32 0.15 1.26 0.08 1.05 1.07
55 3191929 MC 24 0.24 0.13 1.68 0.09 1.05 1.08
56 3339132 SA 19 0.38 0.29 1.74 0.06 0.99 0.92
57 3213444 MC 22 0.22 0.23 1.81 0.09 0.98 1.06
58 3191903 MC 54 0.54 0.24 0.29 0.08 0.99 0.98
59 3213449 MC 30 0.30 0.14 1.37 0.09 1.05 1.08
60 3213330 OE 29 1.16 0.31 1.44 0.04 1.06 1.06
61 3213336 MC 73 0.73 0.30 -0.57 0.09 0.94 0.89
62 3192076 MC 45 0.45 0.19 0.68 0.08 1.02 1.03
63 3191871 MC 67 0.67 0.30 -0.27 0.08 0.94 0.92
64 3191902 MC 39 0.39 0.24 0.97 0.08 1.00 1.00
65 3191882 MC 43 0.43 0.30 0.78 0.08 0.96 0.95
66 3339136 SA 52 1.04 0.43 0.41 0.05 0.88 0.87
67 3192104 MC 28 0.28 0.09 1.47 0.09 1.08 1.11
68 3213356 MC 38 0.38 0.24 1.01 0.08 0.99 1.00
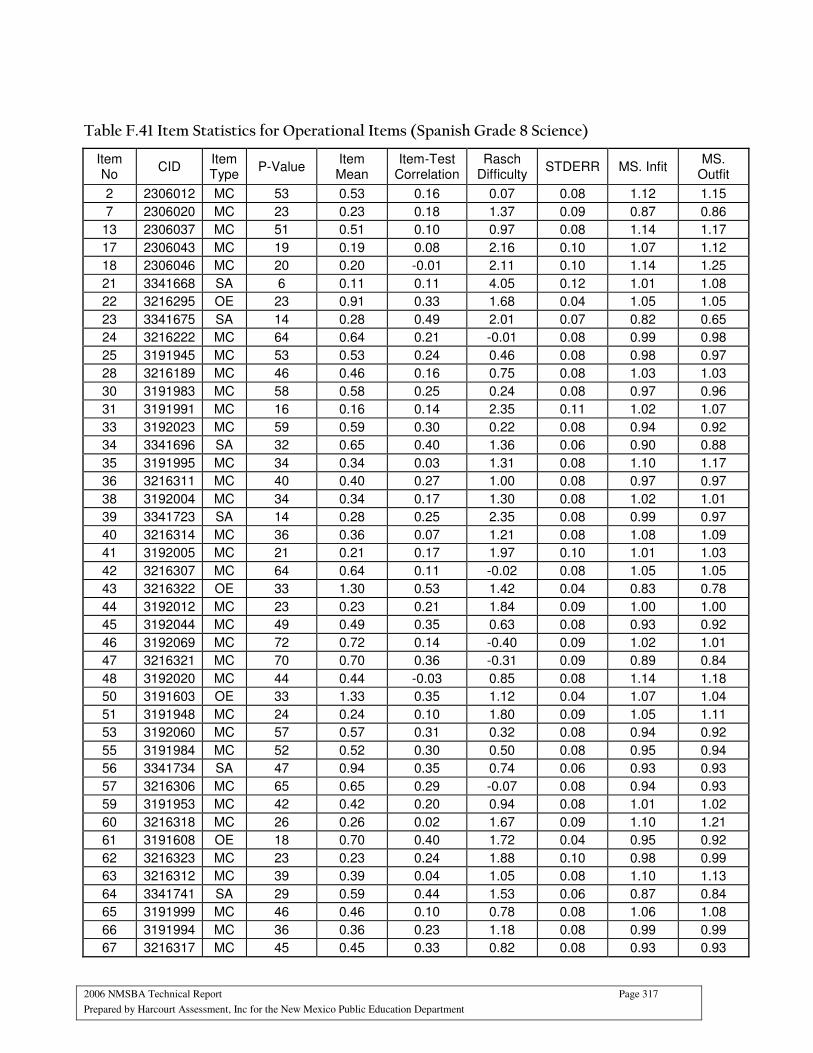
2006 NMSBA Technical Report Page 317
Prepared by Harcourt Assessment, Inc for the New Mexico Public Education Department
Table F.41 Item Statistics for Operational Items (Spanish Grade 8 Science)
Item No
CID Item Type
P-Value Item Mean
Item-Test Correlation
Rasch Difficulty
STDERR MS. Infit MS.
Outfit
2 2306012 MC 53 0.53 0.16 0.07 0.08 1.12 1.15
7 2306020 MC 23 0.23 0.18 1.37 0.09 0.87 0.86
13 2306037 MC 51 0.51 0.10 0.97 0.08 1.14 1.17
17 2306043 MC 19 0.19 0.08 2.16 0.10 1.07 1.12
18 2306046 MC 20 0.20 -0.01 2.11 0.10 1.14 1.25
21 3341668 SA 6 0.11 0.11 4.05 0.12 1.01 1.08
22 3216295 OE 23 0.91 0.33 1.68 0.04 1.05 1.05
23 3341675 SA 14 0.28 0.49 2.01 0.07 0.82 0.65
24 3216222 MC 64 0.64 0.21 -0.01 0.08 0.99 0.98
25 3191945 MC 53 0.53 0.24 0.46 0.08 0.98 0.97
28 3216189 MC 46 0.46 0.16 0.75 0.08 1.03 1.03
30 3191983 MC 58 0.58 0.25 0.24 0.08 0.97 0.96
31 3191991 MC 16 0.16 0.14 2.35 0.11 1.02 1.07
33 3192023 MC 59 0.59 0.30 0.22 0.08 0.94 0.92
34 3341696 SA 32 0.65 0.40 1.36 0.06 0.90 0.88
35 3191995 MC 34 0.34 0.03 1.31 0.08 1.10 1.17
36 3216311 MC 40 0.40 0.27 1.00 0.08 0.97 0.97
38 3192004 MC 34 0.34 0.17 1.30 0.08 1.02 1.01
39 3341723 SA 14 0.28 0.25 2.35 0.08 0.99 0.97
40 3216314 MC 36 0.36 0.07 1.21 0.08 1.08 1.09
41 3192005 MC 21 0.21 0.17 1.97 0.10 1.01 1.03
42 3216307 MC 64 0.64 0.11 -0.02 0.08 1.05 1.05
43 3216322 OE 33 1.30 0.53 1.42 0.04 0.83 0.78
44 3192012 MC 23 0.23 0.21 1.84 0.09 1.00 1.00
45 3192044 MC 49 0.49 0.35 0.63 0.08 0.93 0.92
46 3192069 MC 72 0.72 0.14 -0.40 0.09 1.02 1.01
47 3216321 MC 70 0.70 0.36 -0.31 0.09 0.89 0.84
48 3192020 MC 44 0.44 -0.03 0.85 0.08 1.14 1.18
50 3191603 OE 33 1.33 0.35 1.12 0.04 1.07 1.04
51 3191948 MC 24 0.24 0.10 1.80 0.09 1.05 1.11
53 3192060 MC 57 0.57 0.31 0.32 0.08 0.94 0.92
55 3191984 MC 52 0.52 0.30 0.50 0.08 0.95 0.94
56 3341734 SA 47 0.94 0.35 0.74 0.06 0.93 0.93
57 3216306 MC 65 0.65 0.29 -0.07 0.08 0.94 0.93
59 3191953 MC 42 0.42 0.20 0.94 0.08 1.01 1.02
60 3216318 MC 26 0.26 0.02 1.67 0.09 1.10 1.21
61 3191608 OE 18 0.70 0.40 1.72 0.04 0.95 0.92
62 3216323 MC 23 0.23 0.24 1.88 0.10 0.98 0.99
63 3216312 MC 39 0.39 0.04 1.05 0.08 1.10 1.13
64 3341741 SA 29 0.59 0.44 1.53 0.06 0.87 0.84
65 3191999 MC 46 0.46 0.10 0.78 0.08 1.06 1.08
66 3191994 MC 36 0.36 0.23 1.18 0.08 0.99 0.99
67 3216317 MC 45 0.45 0.33 0.82 0.08 0.93 0.93
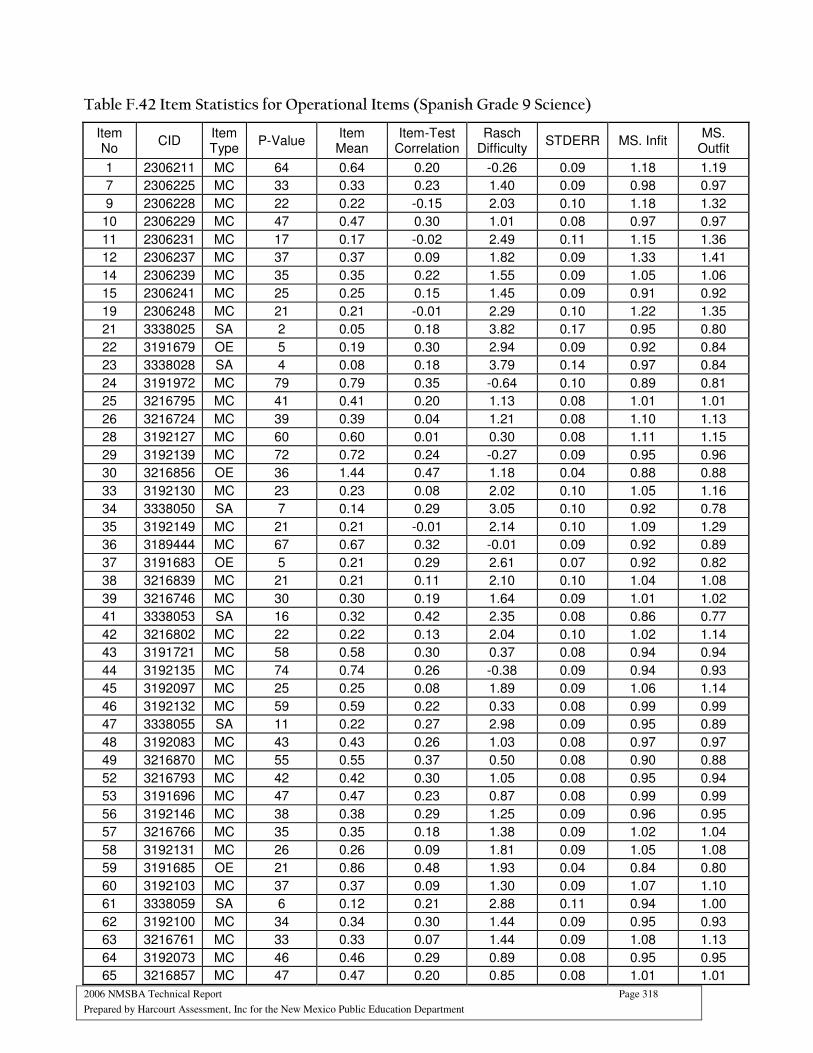
2006 NMSBA Technical Report Page 318
Prepared by Harcourt Assessment, Inc for the New Mexico Public Education Department
Table F.42 Item Statistics for Operational Items (Spanish Grade 9 Science)
Item No
CID Item Type
P-Value Item Mean
Item-Test Correlation
Rasch Difficulty
STDERR MS. Infit MS.
Outfit
1 2306211 MC 64 0.64 0.20 -0.26 0.09 1.18 1.19
7 2306225 MC 33 0.33 0.23 1.40 0.09 0.98 0.97
9 2306228 MC 22 0.22 -0.15 2.03 0.10 1.18 1.32
10 2306229 MC 47 0.47 0.30 1.01 0.08 0.97 0.97
11 2306231 MC 17 0.17 -0.02 2.49 0.11 1.15 1.36
12 2306237 MC 37 0.37 0.09 1.82 0.09 1.33 1.41
14 2306239 MC 35 0.35 0.22 1.55 0.09 1.05 1.06
15 2306241 MC 25 0.25 0.15 1.45 0.09 0.91 0.92
19 2306248 MC 21 0.21 -0.01 2.29 0.10 1.22 1.35
21 3338025 SA 2 0.05 0.18 3.82 0.17 0.95 0.80
22 3191679 OE 5 0.19 0.30 2.94 0.09 0.92 0.84
23 3338028 SA 4 0.08 0.18 3.79 0.14 0.97 0.84
24 3191972 MC 79 0.79 0.35 -0.64 0.10 0.89 0.81
25 3216795 MC 41 0.41 0.20 1.13 0.08 1.01 1.01
26 3216724 MC 39 0.39 0.04 1.21 0.08 1.10 1.13
28 3192127 MC 60 0.60 0.01 0.30 0.08 1.11 1.15
29 3192139 MC 72 0.72 0.24 -0.27 0.09 0.95 0.96
30 3216856 OE 36 1.44 0.47 1.18 0.04 0.88 0.88
33 3192130 MC 23 0.23 0.08 2.02 0.10 1.05 1.16
34 3338050 SA 7 0.14 0.29 3.05 0.10 0.92 0.78
35 3192149 MC 21 0.21 -0.01 2.14 0.10 1.09 1.29
36 3189444 MC 67 0.67 0.32 -0.01 0.09 0.92 0.89
37 3191683 OE 5 0.21 0.29 2.61 0.07 0.92 0.82
38 3216839 MC 21 0.21 0.11 2.10 0.10 1.04 1.08
39 3216746 MC 30 0.30 0.19 1.64 0.09 1.01 1.02
41 3338053 SA 16 0.32 0.42 2.35 0.08 0.86 0.77
42 3216802 MC 22 0.22 0.13 2.04 0.10 1.02 1.14
43 3191721 MC 58 0.58 0.30 0.37 0.08 0.94 0.94
44 3192135 MC 74 0.74 0.26 -0.38 0.09 0.94 0.93
45 3192097 MC 25 0.25 0.08 1.89 0.09 1.06 1.14
46 3192132 MC 59 0.59 0.22 0.33 0.08 0.99 0.99
47 3338055 SA 11 0.22 0.27 2.98 0.09 0.95 0.89
48 3192083 MC 43 0.43 0.26 1.03 0.08 0.97 0.97
49 3216870 MC 55 0.55 0.37 0.50 0.08 0.90 0.88
52 3216793 MC 42 0.42 0.30 1.05 0.08 0.95 0.94
53 3191696 MC 47 0.47 0.23 0.87 0.08 0.99 0.99
56 3192146 MC 38 0.38 0.29 1.25 0.09 0.96 0.95
57 3216766 MC 35 0.35 0.18 1.38 0.09 1.02 1.04
58 3192131 MC 26 0.26 0.09 1.81 0.09 1.05 1.08
59 3191685 OE 21 0.86 0.48 1.93 0.04 0.84 0.80
60 3192103 MC 37 0.37 0.09 1.30 0.09 1.07 1.10
61 3338059 SA 6 0.12 0.21 2.88 0.11 0.94 1.00
62 3192100 MC 34 0.34 0.30 1.44 0.09 0.95 0.93
63 3216761 MC 33 0.33 0.07 1.44 0.09 1.08 1.13
64 3192073 MC 46 0.46 0.29 0.89 0.08 0.95 0.95
65 3216857 MC 47 0.47 0.20 0.85 0.08 1.01 1.01
2006 NMSBA Technical Report Page 319
Prepared by Harcourt Assessment, Inc for the New Mexico Public Education Department