new mexico 2017 state of the workforce report mexico 2017 state of the workforce report a report...
TRANSCRIPT
New Mexico 2017State of the Workforce ReportA Report Highlighting New Mexico’s Current and Future Workforce
June 2017
www.dws.state.nm.us
Population
Industries, Occupations
& Wages
Workforce
Skills & Education
Future Workforce

2 NEW MEXICO DEPARTMENT OF WORKFORCE SOLUTIONS
New Mexico 2017 State of the
Workforce Report
Susana Martinez Governor
State of New Mexico
New Mexico Department of
Workforce Solutions
Celina Bussey Cabinet Secretary
Joy Forehand Deputy Cabinet Secretary
Contributors:
Rachel Moskowitz Bureau Chief
Ashley Leach Economist
Randall McElroy III Economist
For further information contact: New Mexico Department of
Workforce Solutions Economic Research &
Analysis Bureau
P.O. Box 1928 Albuquerque, NM 87103
Phone: (505) 383-2729
Email: NMDWS.EconomicResearch@
state.nm.us
Published June 2017
General Note: All information presented in this report was compiled by the New Mexico Department of Workforce Solutions’ (NMDWS) Economic Research and Analysis Bureau (ER&A). Much of the data presented are produced in conjunction with the U.S. Department of Labor, Bureau of Labor Statistics. This report looks at data for multiple geographies, including the state, workforce regions, Metropolitan Statistics Areas (MSA), and counties. New Mexico has four MSAs: Albuquerque (Bernalillo, Sandoval, Torrance, and Valencia Counties), Farmington (San Juan County), Las Cruces (Doña Ana County), and Santa Fe (Santa Fe County). New Mexico’s four regions include the Central, Eastern, Northern, and Southwestern Regions. For geographic information on counties within each region, refer to the corresponding map. Non-historical data in this report represent the most recent data available at the time of publishing and vary by data source.
STATE OF THE WORKFORCE 2017 3
SUMMARY OF FINDINGS 4
NEW MEXICO’S POPULATION 8A SNAPSHOT OF POPULATION ACROSS THE STATE 8
State, Regional, and County Population Estimates 8
Age of the Population 12
Race and Ethnicity 14
Income 15
Poverty 16
NEW MEXICO’S WORKFORCE 17WHAT IT LOOKS LIKE 17
Labor Force Participation 17
Labor Force Participation by Age Group 18
Age and Gender of the Labor Force 19
Race and Ethnicity of the Labor Force 21
Labor Force Participation by Educational Attainment 22
HOW IT’S GROWING 23Labor Force Growth 23
Employment Growth 25
Unemployment Growth 28
INDUSTRIES, OCCUPATIONS, AND WAGES 31Employment in New Mexico’s Industries 31
Occupational Employment of the Workforce 34
SKILLS AND EDUCATION 36Educational Attainment of the Population and Labor Force 36
NEW MEXICO’S FUTURE WORKFORCE 40THE GROWTH TO COME 40
Projected Employment Growth in New Mexico’s Industries 40
Projected Employment Growth in Regional Industries 42
Projected Employment Growth by Occupation 44
Table of Contents

4 NEW MEXICO DEPARTMENT OF WORKFORCE SOLUTIONS
New Mexico’s Population • Population growth in New Mexico was essentially
flat, increasing by fewer than 700 people from 2015 to 2016. The 0.03 percent growth rate was the tenth-slowest in the 50 states and the District of Columbia. However, this reversed the two previous years of very slight negative growth. Two-thirds of the state’s population lived in its four MSAs. The Albuquerque MSA accounted for over 43 percent of New Mexico residents.
• Most of the state’s population growth from 2010 to 2015 occurred in the Central Region (i e , the Albuquerque MSA). The Eastern Region also saw comparatively growth (2.3 percent). The Northern Region’s population declined by 1.2 percent, primarily driven by decreases in the Farmington MSA, along with losses in many other northern counties. Those losses were only partially offset by increases in McKinley and Santa Fe Counties, and to a much lesser degree, Taos. The Southwestern Region’ population remained almost neutral between 2010 and 2015.
• New Mexico has relatively large proportions of both young and aging residents. The state’s share of residents of ages 25 to 64, who constitute the majority of the working-age population, was smaller than those of all neighboring states and the nation as of 2015. Almost 29 percent of the population was 55 or older in 2015, 1.3 percentage points higher than the national average of 27.6 percent. The state’s share of residents
under 25 was 33.9 percent, 1.2 percentage point higher than the national average.
• New Mexico’s unique demographic mix and substantial racial and ethnic diversity is characterized by a large concentration of Hispanic/Latino and American Indian residents. In 2015, Hispanics/Latinos made up 48.0 percent of the population. This share, the highest in the U.S., was over 30 percentage points higher than the national average. The share of American Indians and Alaska Natives in the population was 9.3 percent, higher than the share of any state except Alaska.
• The median income in New Mexico was lower than the incomes of all neighboring states and the sixth-lowest of the 50 states and the District of Columbia. More than one-fifth of the state’s population lived below the poverty level, the second-largest share in the country in 2015. Approximately one-third of American Indians and one-quarter of Hispanics/Latinos lived below the poverty level, as did more than one in three New Mexico residents with less than a high school diploma or equivalent.
New Mexico’s Workforce• Between 2011 and 2015, participation in the labor
force declined in the nation as a whole and in New Mexico, though New Mexico’s decline was larger than that of the nation and those of neighboring states. In
Summary of Findings

STATE OF THE WORKFORCE 2017 5
2011, 61.0 percent of the population aged 16 years and over participated in the labor force; this number dropped to 58 4 percent in 2015
• From 2011 to 2015, the labor force participation rate of people aged 25 to 44 dropped slightly, from 78.9 percent to 77.0 percent. Workers from 45 to 54 years old had the second-highest rate of labor force participation in 2011, at 75.6 percent, though this declined to 73 6 percent in 2015
• Labor force participation dropped the most among New Mexico’s youngest and middle age cohorts between 2011 and 2015. Labor force participation rates for workers 25 to 44 and 45 to 54 dropped by 1.9 and 2.0 percentage points, respectively. The labor force participation rate of the 16-to-19 cohort decreased from 41.6 percent in 2011 to 37.0 percent in 2015, a fall of 4.6 percent, which was the largest decrease among the age categories. This cohort is traditionally the least skilled and may be facing greater competition for jobs. The labor force participation of persons aged 55 and older dropped by 0 1 percentage point to 1 1 percentage points. Residents aged 20 to 24 were the only group to increase labor force participation, from 70 4 percent in 2011 to 73 1 percent in 2015
• There are slightly more women than men in New Mexico, although men make up a greater share of the labor force in almost all age categories. Only in the oldest category, 75 years and above, do women participate at a greater rate than men.
• American Indians continue to face some of the greatest challenges in the labor market. Labor force participation for this group was the lowest among all races and ethnicities in New Mexico, at 56.1 percent, and unemployment was highest, at 16.0 percent. Persons identifying as Black/African-American or two or more races also experienced relatively high unemployment (8.8 percent and 9.2 percent, respectively).
How it’s Growing
• Labor force growth was weakly positive in the nation from 2012 to 2016. Growth in New Mexico was weakly negative from 2012 to 2014, turning slightly positive in
2015 and 2016. For most of the period, New Mexico’s neighboring states experienced robust labor force growth, with only a few exceptions in Arizona and Oklahoma. The labor force in Colorado, Texas, and especially Utah grew faster than the national labor force in almost all of the past five years.
• Between 2012 and 2014, labor force and employment gains were concentrated in the Eastern Workforce Region, primarily due to growth in the oil industry. In 2015 and 2016, labor force and employment growth in the Central Region drove growth in the state, with a downturn in the oil industry affecting the Eastern Region. The Eastern Region’s -1.9 percent labor force growth and -2.9 percent employment growth in 2016 were the largest regional changes. The Northern Region’s labor force and employment shrank in most years in the period. The Southwestern Region’s labor force and employment grew in 2012 and 2016 and decreased from 2013 to 2015, exhibiting no clear short-term pattern.
• Prior to and during the Great Recession, New Mexico’s unemployment rate was lower than the national average. However, recovery was slower in the state than in the nation overall, and in 2014, the national rate of unemployment dropped below New Mexico’s rate. Annual unemployment in New Mexico has been at or above 6.6 percent since 2012, following decreases from higher rates during the recession and early recovery. The state’s annual rate has been higher than the nation’s rate and the rates of most neighboring states since 2014. Other labor market indicators have followed a similar pattern: labor force growth and employment growth have been low relative to growth in the region and the nation.
• Over-the-year unemployment rate changes were typically small in most counties between 2012 and 2016, with noteworthy exceptions in Lea, Eddy, and San Juan Counties, due to swings in the oil and gas industry. Counties that reported the largest decreases in unemployment rates over the five-year period included: Luna (-5.3 percentage points), Guadalupe (-3.5 percentage points), and Mora (-2.3 percentage points).
Summary of Findings
6 NEW MEXICO DEPARTMENT OF WORKFORCE SOLUTIONS
Industries, Occupations, and Wages
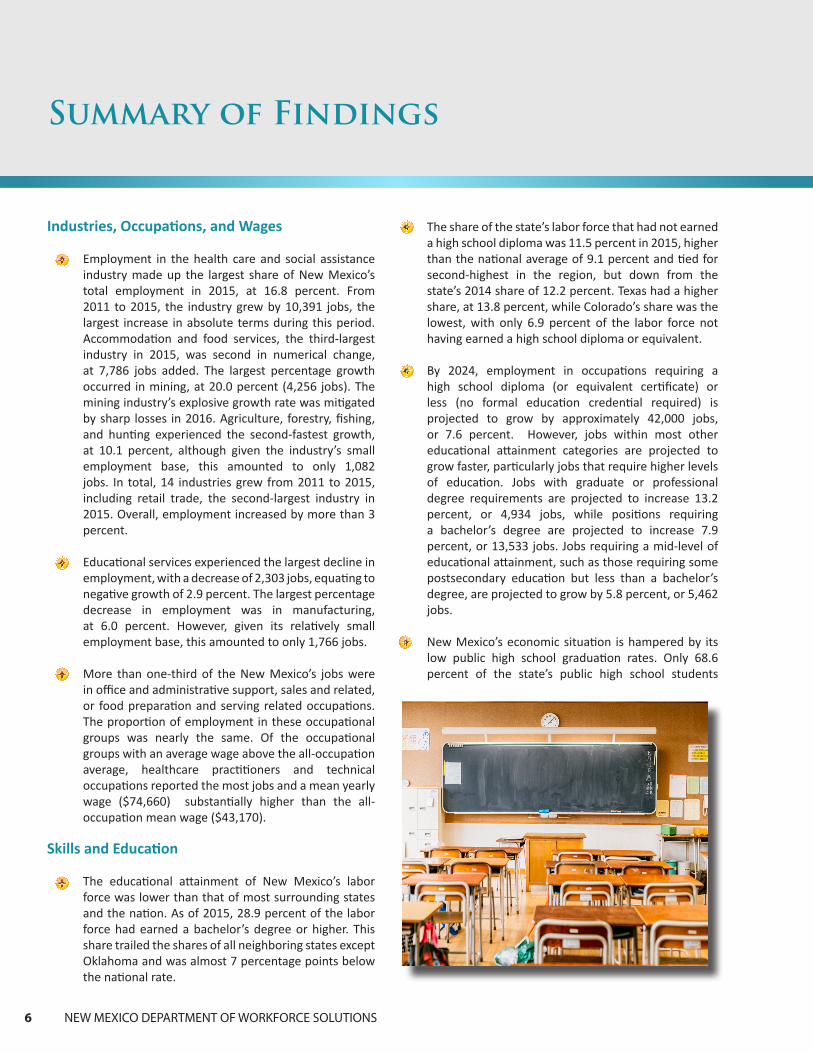
• Employment in the health care and social assistance industry made up the largest share of New Mexico’s total employment in 2015, at 16.8 percent. From 2011 to 2015, the industry grew by 10,391 jobs, the largest increase in absolute terms during this period. Accommodation and food services, the third-largest industry in 2015, was second in numerical change, at 7,786 jobs added. The largest percentage growth occurred in mining, at 20.0 percent (4,256 jobs). The mining industry’s explosive growth rate was mitigated by sharp losses in 2016. Agriculture, forestry, fishing, and hunting experienced the second-fastest growth, at 10.1 percent, although given the industry’s small employment base, this amounted to only 1,082 jobs. In total, 14 industries grew from 2011 to 2015, including retail trade, the second-largest industry in 2015. Overall, employment increased by more than 3 percent
• Educational services experienced the largest decline in employment, with a decrease of 2,303 jobs, equating to negative growth of 2.9 percent. The largest percentage decrease in employment was in manufacturing, at 6.0 percent. However, given its relatively small employment base, this amounted to only 1,766 jobs.
• More than one-third of the New Mexico’s jobs were in office and administrative support, sales and related, or food preparation and serving related occupations. The proportion of employment in these occupational groups was nearly the same. Of the occupational groups with an average wage above the all-occupation average, healthcare practitioners and technical occupations reported the most jobs and a mean yearly wage ($74,660) substantially higher than the all-occupation mean wage ($43,170).
Skills and Education
• The educational attainment of New Mexico’s labor force was lower than that of most surrounding states and the nation. As of 2015, 28.9 percent of the labor force had earned a bachelor’s degree or higher. This share trailed the shares of all neighboring states except Oklahoma and was almost 7 percentage points below the national rate.
• The share of the state’s labor force that had not earned a high school diploma was 11.5 percent in 2015, higher than the national average of 9.1 percent and tied for second-highest in the region, but down from the state’s 2014 share of 12.2 percent. Texas had a higher share, at 13.8 percent, while Colorado’s share was the lowest, with only 6.9 percent of the labor force not having earned a high school diploma or equivalent.
• By 2024, employment in occupations requiring a high school diploma (or equivalent certificate) or less (no formal education credential required) is projected to grow by approximately 42,000 jobs, or 7.6 percent. However, jobs within most other educational attainment categories are projected to grow faster, particularly jobs that require higher levels of education. Jobs with graduate or professional degree requirements are projected to increase 13.2 percent, or 4,934 jobs, while positions requiring a bachelor’s degree are projected to increase 7.9 percent, or 13,533 jobs. Jobs requiring a mid-level of educational attainment, such as those requiring some postsecondary education but less than a bachelor’s degree, are projected to grow by 5.8 percent, or 5,462 jobs.
• New Mexico’s economic situation is hampered by its low public high school graduation rates. Only 68.6 percent of the state’s public high school students
Summary of Findings

STATE OF THE WORKFORCE 2017 7
graduated in four years as of the 2014–2015 school year. This was more than 14 percentage points lower than the national average and almost 9 percentage points lower than in Colorado, the neighboring state with the next-lowest rate.
The Future Workforce
• Employment in New Mexico is projected to grow by 7.7 percent by 2024, representing an increase of 65,829 jobs from the 2014 employment estimate of 853,914. The most recent round of employment projections reported a slower growth rate than previously projected. This reduction was primarily tied to recent job losses in the mining industry in the southeastern and northwestern corners of the state.
• The health care and social assistance industry is yet again projected to be the main driver of job growth over the projection period. Growth is projected to reach 23.2 percent, representing 28,465 jobs. New jobs at ambulatory health care services establishments are anticipated to contribute the most to the major industry sector’s growing employment total, although all four health care and social assistance industry subsectors are expected to experience significant job growth.
• The Southwestern Region is projected to experience the highest percentage employment growth (8.8 percent) of all four New Mexico regions, even if most new jobs will be in the most-populated Central Region. Growth in the Las Cruces MSA (9.6 percent) is anticipated to be the primary driver of the Southwestern Region’s growth. Employment in the Eastern Region is projected to grow the slowest of all the regions (6.7 percent). In general, employment growth is projected to be strongest in New Mexico’s urban areas and less robust in its rural areas.
• Some regions are projected to experience more significant employment growth in select industries. Federal government job growth is expected to be concentrated in the Central Region and more rural areas of the state. New jobs in the agriculture industry are primarily anticipated to develop in the Las Cruces MSA. Manufacturing employment is projected to
Summary of Findings
continue shrinking, with some potential growth in rural areas of the state. Job growth in the professional, scientific, and technical services industry is expected to be concentrated in urban areas, with less measurable growth in rural locations of the state.
• Around one in every two new jobs created between 2014 and 2024 is expected to be a personal care and service or food preparation and serving related job. Employment in each of the two major occupational groups is projected to grow by around 11,000 to 11,700. Personal care and service jobs are of particular significance; they are also projected to grow at a faster rate than jobs in any other major occupational group and provide more new job openings than replacement openings (existing vacant positions).
• Healthcare practitioners and technical jobs, as well as healthcare support jobs, are projected to grow quickly over the projection period, with respective percentage growth projected to reach 15.9 and 18.8 percent. These growth rates are the second- and third-fastest rates of all 22 major occupational groups. Nine specific health care occupations are not only projected to see the largest number of new jobs, but also some of the fastest job growth. These specific occupations are led by registered nurses and home health aides.

8 NEW MEXICO DEPARTMENT OF WORKFORCE SOLUTIONS
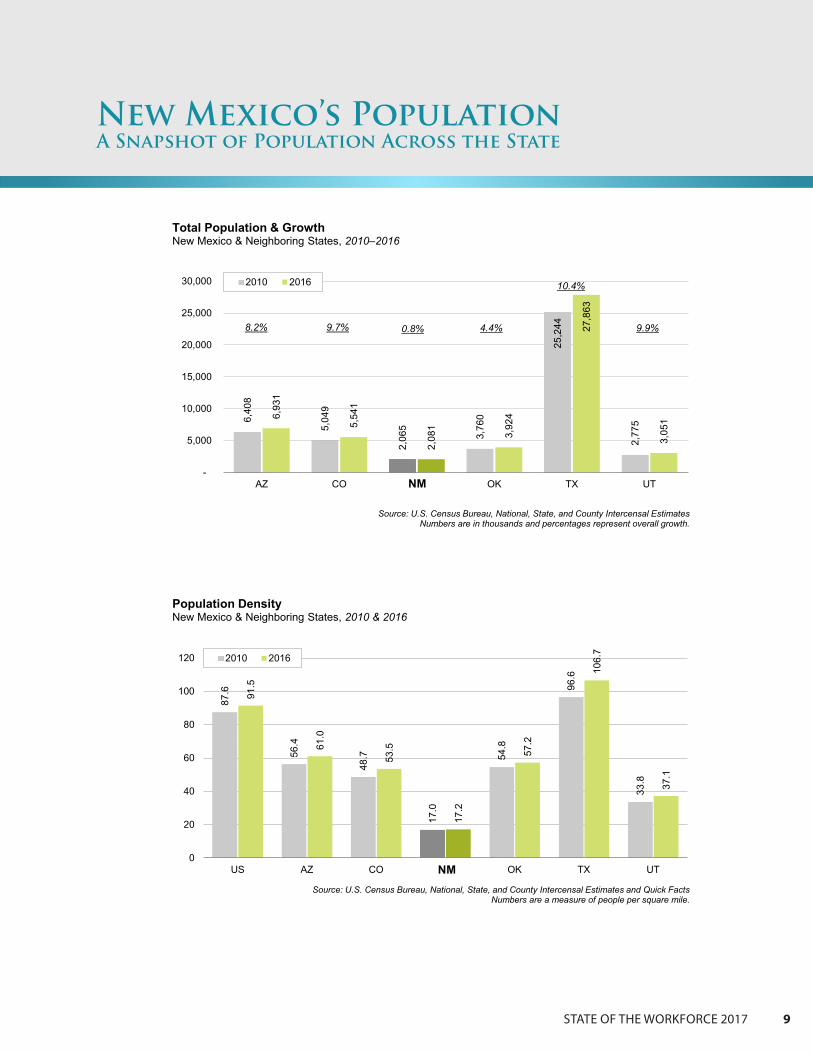
New Mexico’s estimated population in July 2016 was 2,081,015. The state had the smallest population among neighboring states and ranked thirty-sixth among all states in the U.S. To provide some perspective, between 2011 and 2016, Texas added more people than the current population of New Mexico.
In 2016, population growth was effectively neutral, with an increase of 0.03 percent from the estimated population in 2015, representing a gain of about 700 people. Though slight, this was the first increase since 2013. Among New Mexico’s neighboring states, all but Oklahoma ranked in the top ten in yearly population growth, and Utah ranked first in the country. The national growth rate from 2015 to 2016 was 0.7 percent. Over the longer period of 2010 to 2016, New Mexico’s population growth rate of 0.8 percent ranked
forty-first among the 50 states and the District of Columbia. The national growth rate in this period was 4.5 percent. The neighboring states of Texas (10.4 percent), Utah (9.9 percent), Colorado (9.7 percent), and Arizona (8.2 percent) were all in the top ten over the period.
Not only does New Mexico have the smallest population when compared to the populations of neighboring states, but it also has a significantly lower population density. In 2016, there were 17.2 residents per square mile in the state, up from 17.0 in 2010. Among neighboring states, Utah had the next lowest population density, with 37.1 people per square mile, and Texas had the highest population density, with 106.7 people per square mile. New Mexico’s population density was also much lower than that of the overall nation (91.5 people per square mile).
New Mexico’s PopulationA Snapshot of Population Across the State
State, Regional, and County Population EstimatesNew Mexico’s population stagnated in 2016, following two years of steady population losses.
6,81
8
5,44
9
2,08
0 3,90
7
27,4
30
2,99
1
6,93
1
5,54
1
2,08
1 3,92
4
27,8
63
3,05
1
-
5,000
10,000
15,000
20,000
25,000
30,000
AZ CO NM OK TX UT
2015 2016
Source: U.S. Census Bureau, National, State, and County Intercensal EstimatesNumbers are in thousands and percentages represent overall growth.
1.7% 1.7% 0.0% 2.0%
1.6%
0.4%
Total Population & GrowthNew Mexico & Neighboring States, 2015–2016
NM
STATE OF THE WORKFORCE 2017 9
New Mexico’s PopulationA Snapshot of Population Across the State
6,40
8
5,04
9
2,06
5
3,76
0
25,2
44
2,77
5
6,93
1
5,54
1
2,08
1
3,92
4
27,8
63
3,05
1
-
5,000
10,000
15,000
20,000
25,000
30,000
AZ CO NM OK TX UT
2010 2016
Source: U.S. Census Bureau, National, State, and County Intercensal EstimatesNumbers are in thousands and percentages represent overall growth.
8.2% 9.7% 0.8% 9.9%
10.4%
4.4%
Total Population & GrowthNew Mexico & Neighboring States, 2010–2016
NM
87.6
56.4
48.7
17.0
54.8
96.6
33.8
91.5
61.0
53.5
17.2
57.2
106.
7
37.1
0
20
40
60
80
100
120
US AZ CO NM OK TX UT
2010 2016
Source: U.S. Census Bureau, National, State, and County Intercensal Estimates and Quick FactsNumbers are a measure of people per square mile.
Population DensityNew Mexico & Neighboring States, 2010 & 2016
NM

10 NEW MEXICO DEPARTMENT OF WORKFORCE SOLUTIONS
New Mexico’s PopulationA Snapshot of Population Across the State
2,065
890
359513
303
2,081
910
366502
303
0
500
1,000
1,500
2,000
2,500
New Mexico Central Eastern Northern Southwestern
2010 2016
Source: U.S. Census Bureau, State and County Intercensal EstimatesNumbers are in thousands and percentages represent overall growth.
1.0%
-0.1%-2.1%2.3% 2.0%
Total Population & GrowthNew Mexico & Its Regions, 2010–2016
New Mexico
0.7
1.8
3.5
4.24.3
115.1
142.0
148.7
214.2
0.0 50.0 100.0 150.0 200.0 250.0 300.0 350.0 400.0
Harding
De Baca
Catron
Union
Hidalgo
San Juan
Sandoval
Santa Fe
Doña Ana
Bernalillo
Total Population Most & Least Populated Counties, 2016
Source: U.S. Census Bureau, State and County Intercensal Estimates* Bernalillo employment exceeds the chart maximum for comparative purposes. Numbers are in thousands.
677.0*

STATE OF THE WORKFORCE 2017 11
New Mexico’s PopulationA Snapshot of Population Across the State
With Albuquerque’s large population within its bounds, it is estimated that 676,953 people were living in Bernalillo County in 2016, more than three times as many as the next most populous county, Doña Ana (equivalent to the Las Cruces MSA), which had an estimated population of 214,207. The next three most populous counties—Santa Fe (or the Santa Fe MSA), Sandoval, and San Juan (or the Farmington MSA)—each had estimated populations within the 115,000–150,000 range. In 2016, the least populous counties—Harding, De Baca, Catron, Union, and Guadalupe—each had between 650 and 4,500 residents.
The populations of New Mexico’s four MSAs (Albuquerque, Farmington, Santa Fe, and Las Cruces) make up two-thirds of the entire population of New Mexico. The Central Region is equivalent to the Albuquerque MSA and comprises Bernalillo, Sandoval, Valencia, and Torrance Counties. In 2016, it had 909,906 residents, which amounted to approximately 44 percent of the state’s population. The area’s population grew 2.3 percent from 2010 to 2016. The Las Cruces MSA’s population grew by 1.9 percent during the same period, covering losses in other parts of the Southwestern Region, which shrank by -0.1 percent overall. The Eastern Region’s population grew by 2.0 percent. In the Northern Region, the Santa Fe MSA’s 2.9 percent increase was countered by the Farmington MSA’s 11.6 percent decrease—the largest increase and decrease among the MSAs—leading to a 2.1 percent decline overall in the region
Between 2010 and 2016, 13 counties gained and 20 counties lost population. The greatest changes occurred in Lea County (+7.9 percent) and San Juan County (-11.6 percent). Statewide, growth tended to be concentrated in more populous urban counties, although there were exceptions.
7.9%
7.3%
6.9%
4.4%
2.9%
2.7%
1.9%
1.9%
1.6%
0.8%
0.7%
0.6%
0.5%
-0.7
%-0
.7%
-1.5
%-2
.6%
-3.2
%-3
.8%
-4.4
%-4
.6%
-5.1
%-5
.6%
-6.2
%-6
.6%
-6.7
%-7
.0%
-7.7
%-7
.8%
-8.0
%-1
0.8%
-11.
2%-1
1.4%
-11.
6%
-18%
-13%
-8%
-3%
2%
7%
12%
Lea
Sand
oval
Eddy
McK
inle
ySa
nta
FeC
urry
Bern
alillo
Doñ
a An
aO
tero
New
Mex
ico
Los
Alam
osC
ibol
aTa
osR
io A
rriba
Cha
ves
Vale
ncia
Luna
Har
ding
Gra
ntSo
corro
Roo
seve
ltLi
ncol
nSa
n M
igue
lC
atro
nTo
rranc
eG
uada
lupe
Sier
raQ
uay
Mor
aU
nion
Col
fax
De
Baca
Hid
algo
San
Juan
Source: U.S. Census Bureau, State and County Intercensal Estimates
Population GrowthTop Growing & Shrinking Counties, 2010–2016
New
Mex
ico
The Role of Population in Economic AssessmentPopulation estimates, and the characteristics of a population, are fundamental measures available
in assessing an area’s economy and labor market. Whether economic mobility, purchasing power, industry composition, demand for public services, or some other measure is being evaluated, population goes hand-in-hand with other variables to see where business and policy investments can and should be made to support and capitalize on current and projected economic activity related to an evolving population base.
12 NEW MEXICO DEPARTMENT OF WORKFORCE SOLUTIONS
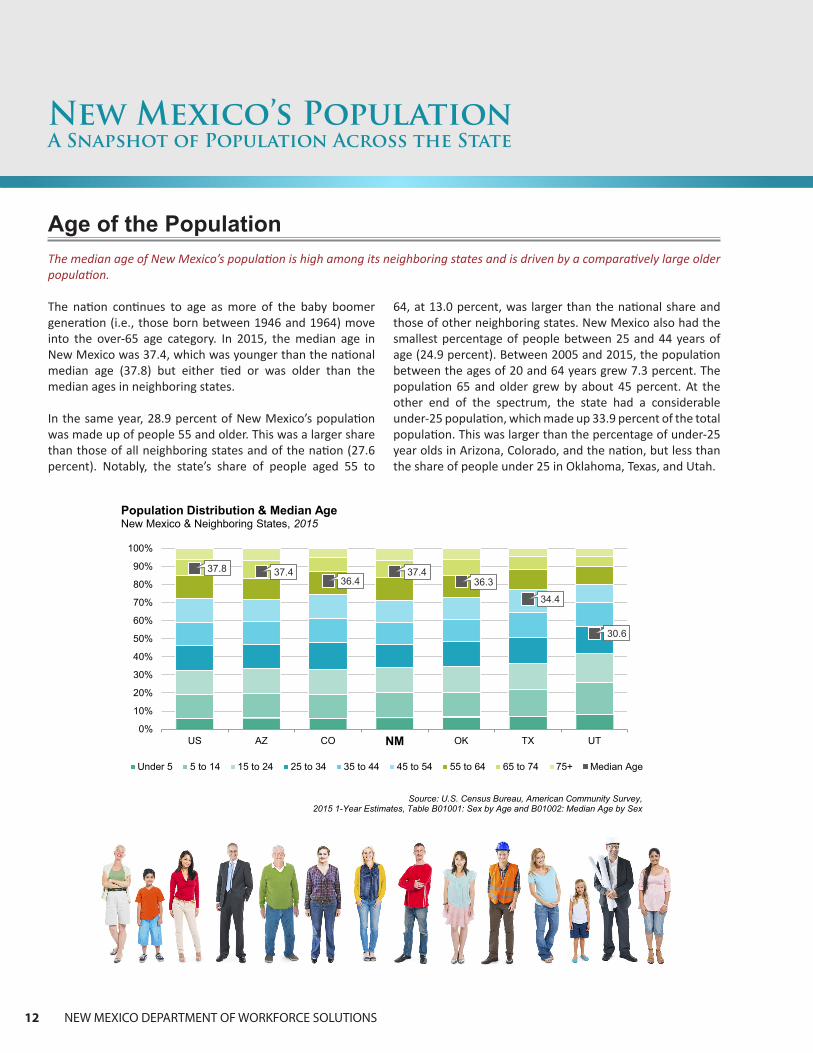
The nation continues to age as more of the baby boomer generation (i.e., those born between 1946 and 1964) move into the over-65 age category. In 2015, the median age in New Mexico was 37.4, which was younger than the national median age (37.8) but either tied or was older than the median ages in neighboring states.
In the same year, 28.9 percent of New Mexico’s population was made up of people 55 and older. This was a larger share than those of all neighboring states and of the nation (27.6 percent). Notably, the state’s share of people aged 55 to
64, at 13.0 percent, was larger than the national share and those of other neighboring states. New Mexico also had the smallest percentage of people between 25 and 44 years of age (24.9 percent). Between 2005 and 2015, the population between the ages of 20 and 64 years grew 7.3 percent. The population 65 and older grew by about 45 percent. At the other end of the spectrum, the state had a considerable under-25 population, which made up 33.9 percent of the total population. This was larger than the percentage of under-25 year olds in Arizona, Colorado, and the nation, but less than the share of people under 25 in Oklahoma, Texas, and Utah.
New Mexico’s PopulationA Snapshot of Population Across the State
Age of the PopulationThe median age of New Mexico’s population is high among its neighboring states and is driven by a comparatively large older population.
37.8 37.436.4
37.436.3
34.4
30.6
20
22
24
26
28
30
32
34
36
38
40
0%
10%
20%
30%
40%
50%
60%
70%
80%
90%
100%
US AZ CO NM OK TX UT
Population Distribution & Median AgeNew Mexico & Neighboring States, 2015
Under 5 5 to 14 15 to 24 25 to 34 35 to 44 45 to 54 55 to 64 65 to 74 75+ Median Age
Source: U.S. Census Bureau, American Community Survey, 2015 1-Year Estimates, Table B01001: Sex by Age and B01002: Median Age by Sex
NM

STATE OF THE WORKFORCE 2017 13
New Mexico’s PopulationA Snapshot of Population Across the State
80,000 60,000 40,000 20,000 0 20,000 40,000 60,000 80,000
Under 55 to 9
10 to 1415 to 1920 to 2425 to 2930 to 3435 to 3940 to 4445 to 4950 to 5455 to 5960 to 6465 to 6970 to 7475 to 7980 to 84
85 and over
Source: U.S. Census Bureau, American Community Survey, 2005 and 2015 1-Year Estimates, Table B01001: Sex by Age
2015
FemaleMale
80,000 60,000 40,000 20,000 0 20,000 40,000 60,000 80,000
Under 55 to 9
10 to 1415 to 1920 to 2425 to 2930 to 3435 to 3940 to 4445 to 4950 to 5455 to 5960 to 6465 to 6970 to 7475 to 7980 to 84
85 and over 2005
FemaleMale
Population by AgeNew Mexico, 2005 & 2015
A population’s age profile helps to determine the composition of its current and future labor force, as well as demands on education resources, social programs, and other components often funded through the state’s budget. Policymakers and educators require detailed and accurate age data to plan for the future needs of employers and employees.
The Role of Age in Planning for the Future

14 NEW MEXICO DEPARTMENT OF WORKFORCE SOLUTIONS
Relative to neighboring states, New Mexico is very diverse in terms of both race and ethnicity. In 2015, the percentage of people in New Mexico identifying as non-White was 26.6 percent, slightly less than that of the nation (26.9 percent) and only exceeded among neighboring states by Oklahoma, with 27.4 percent. American Indians in New Mexico comprised 9.3 percent of the state’s population in 2015, which was the largest share of all neighboring states and the second largest of all U.S. states (behind Alaska, at 13.7 percent); this population represented 7.5 percent of the national total of American Indians. Among neighboring states, Oklahoma had the next largest share (7.3 percent), followed by Arizona (4.5 percent). New Mexico also had the largest proportion of
New Mexico’s PopulationA Snapshot of Population Across the State
Race & EthnicityNew Mexico’s large Hispanic/Latino and Native American populations and related heritage contribute to a population that is racially and ethnically unique.
people identifying as two or more races (15.0 percent). On the other hand, the state had the second smallest share of African Americans in its population (2.3 percent), ahead of only Utah (1.2 percent), in the region.
New Mexico is also ethnically unique—being one of only four states identified in the 2010 Decennial Census as a majority-minority state (i.e., the population contains less than 50 percent non-Hispanic Whites). Hispanics and Latinos of all races made up 48.0 percent of New Mexico’s total population, a significantly larger share than those of neighboring states and one that exceeded the national average by 30 percentage points.
73.1
%
77.4
% 84.4
%
73.4
%
72.6
%
74.9
% 87.2
%
12.7
%
4.4%
4.1%
2.3% 7.
3% 12.0
%
1.2%
0.8% 4.
5%
0.9%
9.3%
7.3%
0.5%
1.2%
13.4
%
13.7
%
10.5
%
15.0
%
12.8
%
12.6
%
10.5
%17.6
% 30.7
%
21.3
%
48.0
%
10.1
%
38.9
%
13.7
%
0%
10%
20%
30%
40%
50%
60%
70%
80%
90%
US AZ CO NM OK TX UT
White Black/African American American Indian Other or Two or More Races Hispanic/Latino (All Races)
Source: U.S. Census Bureau, American Community Survey, 2015 1-Year Estimates,Table B02001: Race and Table B03001: Hispanic or Latino Origin by Specific Origin
Other includes those that are Asian, Native Hawaiian/Other Pacific, or other race not mentioned.
Racial & Ethnic DiversityNew Mexico & Neighboring States, 2015
NM
The Role of Diversity in Understanding Regional EconomiesThe cultural and linguistic composition of a population impacts the needs, perspectives, opportunities, and challenges of a specific geography. Diverse populations are especially well-positioned to support a variety of business and employment opportunities in an interconnected world. At the same time, some minority groups face greater challenges within the labor force. Recognizing those challenges is necessary in identifying approaches to improving economic opportunities for all labor force participants.

STATE OF THE WORKFORCE 2017 15
New Mexico’s PopulationA Snapshot of Population Across the State
New Mexico has the lowest average (mean) and median household incomes among states in the southwest region. In 2015, the state’s average household income was $62,747, which was 19.9 percent less than the national average of $78,378. Of the average household incomes of neighboring
states, those of Colorado ($85,915), Texas ($78,862), and Utah ($79,860), exceeded the national average. New Mexico’s median household income ($45,382) was also the lowest in the region and was 18.6 percent less than the national median household income ($55,775).
IncomeHistorically, New Mexico’s average household income has been lower than the incomes of other states, and recent years have been no exception; New Mexico’s 2015 income was lower than the incomes of all neighboring states.
$78,378$70,638
$85,915
$62,747 $66,260
$78,862 $79,860
$55,775$51,492
$63,909
$45,382 $48,568$55,653
$62,912
$0
$10,000
$20,000
$30,000
$40,000
$50,000
$60,000
$70,000
$80,000
$90,000
$100,000
US AZ CO NM OK TX UT
Average Household Income Median Household Income
Source: U.S. Census Bureau, American Community Survey, 2015 1-Year Estimates, Table CP03: Comparative Economic Characteristics
Income is measured in inflation-adjusted dollars.
Average and Median Household IncomeNew Mexico & Neighboring States, 2015
NM
Using Income to Measure Economic HealthHousehold income is a measure of the combined incomes of all people sharing a place of residence and is used to measure the economic well-being of an area’s residents. Household income directly corresponds to greater purchasing power, economic security, and economic mobility, all factors in a robust economy. As such, household income is used by a variety of groups, including policymakers, seeking to measure economic opportunity and identify and influence factors that impact the lives of residents.
16 NEW MEXICO DEPARTMENT OF WORKFORCE SOLUTIONS
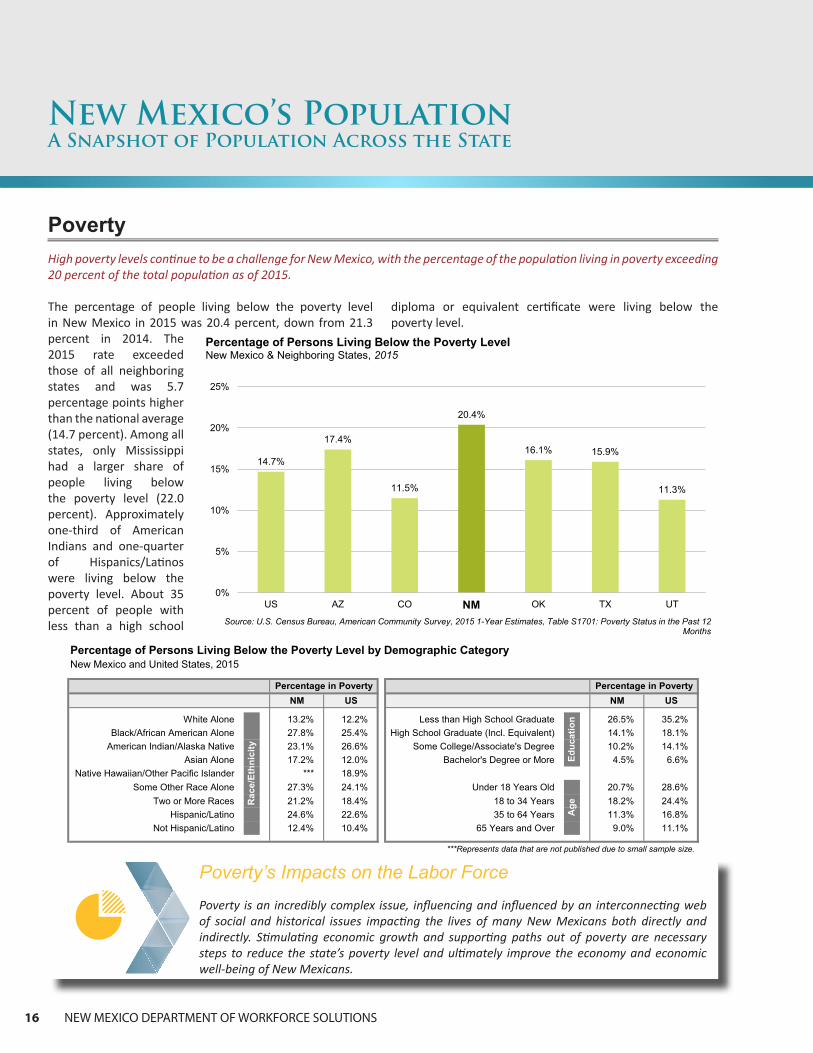
The percentage of people living below the poverty level in New Mexico in 2015 was 20.4 percent, down from 21.3 percent in 2014 The 2015 rate exceeded those of all neighboring states and was 5.7 percentage points higher than the national average (14.7 percent). Among all states, only Mississippi had a larger share of people living below the poverty level (22 0 percent). Approximately one-third of American Indians and one-quarter of Hispanics/Latinos were living below the poverty level About 35 percent of people with less than a high school
New Mexico’s PopulationA Snapshot of Population Across the State
PovertyHigh poverty levels continue to be a challenge for New Mexico, with the percentage of the population living in poverty exceeding 20 percent of the total population as of 2015.
diploma or equivalent certificate were living below the poverty level
14.7%
17.4%
11.5%
20.4%
16.1% 15.9%
11.3%
0%
5%
10%
15%
20%
25%
US AZ CO NM OK TX UT
Source: U.S. Census Bureau, American Community Survey, 2015 1-Year Estimates, Table S1701: Poverty Status in the Past 12 Months
Percentage of Persons Living Below the Poverty LevelNew Mexico & Neighboring States, 2015
NM
Poverty’s Impacts on the Labor Force
Poverty is an incredibly complex issue, influencing and influenced by an interconnecting web of social and historical issues impacting the lives of many New Mexicans both directly and indirectly. Stimulating economic growth and supporting paths out of poverty are necessary steps to reduce the state’s poverty level and ultimately improve the economy and economic well-being of New Mexicans.
Percentage of Persons Living Below the Poverty Level by Demographic CategoryNew Mexico and United States, 2015
NM US NM US
White Alone 13.2% 12.2% Less than High School Graduate 26.5% 35.2%Black/African American Alone 27.8% 25.4% High School Graduate (Incl. Equivalent) 14.1% 18.1%
American Indian/Alaska Native 23.1% 26.6% Some College/Associate's Degree 10.2% 14.1%Asian Alone 17.2% 12.0% Bachelor's Degree or More 4.5% 6.6%
Native Hawaiian/Other Pacific Islander *** 18.9%Some Other Race Alone 27.3% 24.1% Under 18 Years Old 20.7% 28.6%
Two or More Races 21.2% 18.4% 18 to 34 Years 18.2% 24.4%Hispanic/Latino 24.6% 22.6% 35 to 64 Years 11.3% 16.8%
Not Hispanic/Latino 12.4% 10.4% 65 Years and Over 9.0% 11.1%
***Represents data that are not published due to small sample size.
Percentage in Poverty
Educ
atio
nA
ge
Percentage in Poverty
Rac
e/Et
hnic
ity
STATE OF THE WORKFORCE 2017 17
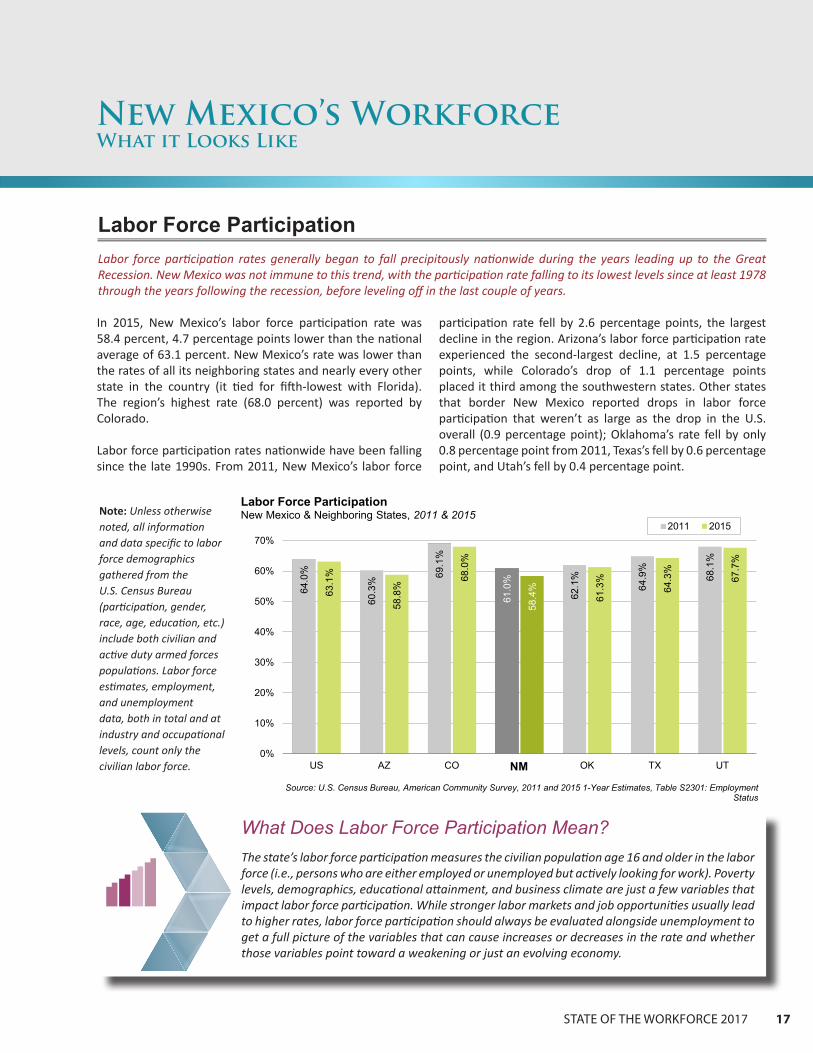
In 2015, New Mexico’s labor force participation rate was 58.4 percent, 4.7 percentage points lower than the national average of 63.1 percent. New Mexico’s rate was lower than the rates of all its neighboring states and nearly every other state in the country (it tied for fifth-lowest with Florida). The region’s highest rate (68.0 percent) was reported by Colorado
Labor force participation rates nationwide have been falling since the late 1990s. From 2011, New Mexico’s labor force
Note: Unless otherwise noted, all information and data specific to labor force demographics gathered from the U.S. Census Bureau (participation, gender, race, age, education, etc.) include both civilian and active duty armed forces populations. Labor force estimates, employment, and unemployment data, both in total and at industry and occupational levels, count only the civilian labor force.
New Mexico’s WorkforceWhat it Looks Like
Labor Force ParticipationLabor force participation rates generally began to fall precipitously nationwide during the years leading up to the Great Recession. New Mexico was not immune to this trend, with the participation rate falling to its lowest levels since at least 1978 through the years following the recession, before leveling off in the last couple of years.
participation rate fell by 2.6 percentage points, the largest decline in the region. Arizona’s labor force participation rate experienced the second-largest decline, at 1.5 percentage points, while Colorado’s drop of 1.1 percentage points placed it third among the southwestern states. Other states that border New Mexico reported drops in labor force participation that weren’t as large as the drop in the U.S. overall (0.9 percentage point); Oklahoma’s rate fell by only 0.8 percentage point from 2011, Texas’s fell by 0.6 percentage point, and Utah’s fell by 0.4 percentage point.
What Does Labor Force Participation Mean? The state’s labor force participation measures the civilian population age 16 and older in the labor force (i.e., persons who are either employed or unemployed but actively looking for work). Poverty levels, demographics, educational attainment, and business climate are just a few variables that impact labor force participation. While stronger labor markets and job opportunities usually lead to higher rates, labor force participation should always be evaluated alongside unemployment to get a full picture of the variables that can cause increases or decreases in the rate and whether those variables point toward a weakening or just an evolving economy.
64.0
%
60.3
%
69.1
%
61.0
%
62.1
%
64.9
%
68.1
%
63.1
%
58.8
%
68.0
%
58.4
%
61.3
%
64.3
%
67.7
%
0%
10%
20%
30%
40%
50%
60%
70%
US AZ CO NM OK TX UT
2011 2015
Source: U.S. Census Bureau, American Community Survey, 2011 and 2015 1-Year Estimates, Table S2301: Employment Status
Labor Force ParticipationNew Mexico & Neighboring States, 2011 & 2015
NM
18 NEW MEXICO DEPARTMENT OF WORKFORCE SOLUTIONS
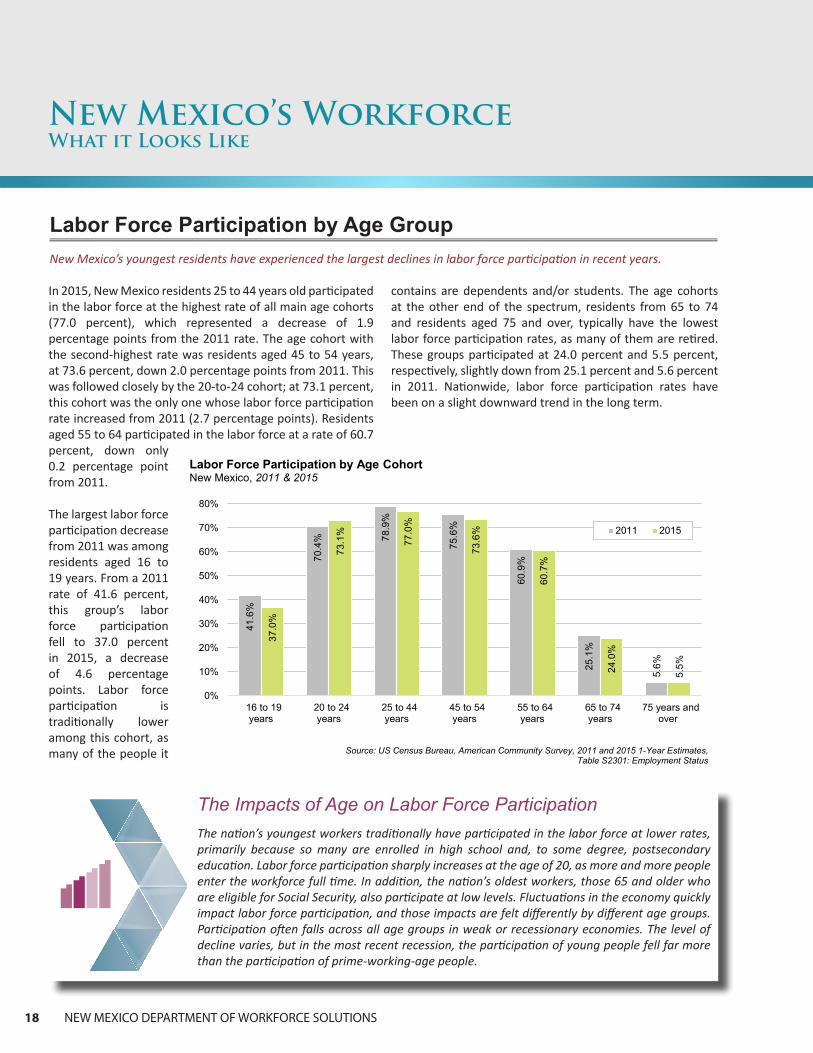
In 2015, New Mexico residents 25 to 44 years old participated in the labor force at the highest rate of all main age cohorts (77.0 percent), which represented a decrease of 1.9 percentage points from the 2011 rate. The age cohort with the second-highest rate was residents aged 45 to 54 years, at 73.6 percent, down 2.0 percentage points from 2011. This was followed closely by the 20-to-24 cohort; at 73.1 percent, this cohort was the only one whose labor force participation rate increased from 2011 (2.7 percentage points). Residents aged 55 to 64 participated in the labor force at a rate of 60.7 percent, down only 0 2 percentage point from 2011.
The largest labor force participation decrease from 2011 was among residents aged 16 to 19 years. From a 2011 rate of 41 6 percent, this group’s labor force participation fell to 37 0 percent in 2015, a decrease of 4 6 percentage points. Labor force participation is traditionally lower among this cohort, as many of the people it
New Mexico’s WorkforceWhat it Looks Like
Labor Force Participation by Age Group New Mexico’s youngest residents have experienced the largest declines in labor force participation in recent years.
The Impacts of Age on Labor Force ParticipationThe nation’s youngest workers traditionally have participated in the labor force at lower rates, primarily because so many are enrolled in high school and, to some degree, postsecondary education. Labor force participation sharply increases at the age of 20, as more and more people enter the workforce full time. In addition, the nation’s oldest workers, those 65 and older who are eligible for Social Security, also participate at low levels. Fluctuations in the economy quickly impact labor force participation, and those impacts are felt differently by different age groups. Participation often falls across all age groups in weak or recessionary economies. The level of decline varies, but in the most recent recession, the participation of young people fell far more than the participation of prime-working-age people.
41.6
%
70.4
% 78.9
%
75.6
%
60.9
%
25.1
%
5.6%
37.0
%
73.1
%
77.0
%
73.6
%
60.7
%
24.0
%
5.5%
0%
10%
20%
30%
40%
50%
60%
70%
80%
16 to 19years
20 to 24years
25 to 44years
45 to 54years
55 to 64years
65 to 74years
75 years andover
2011 2015
Source: US Census Bureau, American Community Survey, 2011 and 2015 1-Year Estimates, Table S2301: Employment Status
Labor Force Participation by Age CohortNew Mexico, 2011 & 2015
contains are dependents and/or students. The age cohorts at the other end of the spectrum, residents from 65 to 74 and residents aged 75 and over, typically have the lowest labor force participation rates, as many of them are retired. These groups participated at 24.0 percent and 5.5 percent, respectively, slightly down from 25.1 percent and 5.6 percent in 2011. Nationwide, labor force participation rates have been on a slight downward trend in the long term.

STATE OF THE WORKFORCE 2017 19
The median age of New Mexico’s labor force was 39.8 years in 2015, down from 40.3 in 2011. This represented the highest median age among New Mexico’s neighboring states and was only slightly less than the median age of the U.S. labor force of 40.0 years. The lowest median age among neighboring states was Utah’s 36.2 years (the lowest in the country), while the second-highest was Arizona’s 39.3 years.
The median age of New Mexico’s labor force decreased by 0.5 years from 2011 to 2015, the same decrease as in the U.S. overall during this period. However, the years from 2010 to 2012 were characterized by higher-than-average median ages when considering the trend since 2005. The average from 2005 to 2015 was 39.9 years. Out of the 50 states and the District of Columbia, the only state to experience an increase since 2011 was Utah, which, despite the increase of 0.4 years, still had the lowest median age in 2015. Alaska’s
New Mexico’s WorkforceWhat it Looks Like
Age and Gender of the Labor ForceThe median age of New Mexico’s labor force was higher than the median ages of its neighboring states, likely reflecting the older population of the state.
median age decreased the most since 2011, by 1.9 years, to reach 37.6 years in 2015.
New Mexico’s distribution of labor force participation by age group was more weighted towards older workers than those of neighboring states. Among the older age cohorts, workers from 60 to 64 years old made up 7.1 percent of the state’s labor force, and workers aged 65 to 74 years made up 4.9 percent. These rates were higher than the respective U.S. averages of 6.6 and 4.3 percent and higher than the rates of neighboring states. Among those neighboring states, Colorado had the second-highest labor force participation rate of workers aged 60 to 64, at 6.7 percent, while Oklahoma had the second-highest rate of workers aged 65 to 74, at 4.6 percent of its labor force. Workers 75 years old and above represented 0.8 percent of the labor force, equal to the national rate for this cohort and behind only Oklahoma (1.0 percent) in the region.
40.0
39.339.0
39.8
38.9 39.0
36.2
34.0
35.0
36.0
37.0
38.0
39.0
40.0
41.0
0%
10%
20%
30%
40%
50%
60%
70%
80%
90%
100%
US AZ CO NM OK TX UT
16–21 22–29 30–44 45–59 60–64 65–74 75+ Median Age
Source: U.S. Census Bureau, American Community Survey, 2015 1-Year Estimates,Table B23001: Sex by Age by Employment Status, Table B23013: Median Age by Sex for Workers 16 to 64 Years
Data are for the labor force population 16 years and older. Median age is for workers 16 to 64.
Labor Force Distribution & Workforce Median AgeNew Mexico & Neighboring States, 2015
NM

20 NEW MEXICO DEPARTMENT OF WORKFORCE SOLUTIONS
New Mexico’s WorkforceWhat it Looks Like
Among the younger and middle-age cohorts, New Mexico workers from 22 to 29 years old accounted for 17.8 percent of the state’s labor force, a share that was equal to the national average but lower than the shares of all neighboring states. Workers from 30 to 44 years old constituted 30.6 percent of the labor force, lower than in neighboring states and the nation as a whole. The share of the labor force that was 16 to 21 years old was 1.3 percentage points higher than the national average, and the share from 45 to 59 years old was 1.2 percentage points lower.
In 2015, men made up a larger percentage of New Mexico’s labor force than women in all age cohorts except for 75 years and above, comprising 53.5 percent of the total labor force. The lower levels in female share of the labor force are often partially attributed to more women than men within multiple age categories being the primary providers of parental care to dependent children. However, women typically have longer life spans than men, partially accounting for their majority in the 75 and over category, although the absolute number of all such workers is low.
Age of the Population and Age of the Labor ForceThe age of a state’s population is generally reflected in the age of its labor force. New Mexico has both an older population and an older labor force than its neighboring states, when measuring median age. On the other hand, the state has a large share of residents who are 25 years old and younger. Many of these residents will be entering the labor force in the near future. Depending on the mobility of people to and from other states and the health of the state’s economy, the age composition of the labor force will begin to evolve and reflect the demographic changes within the population.
53.5% 51.2% 56.4% 54.8% 51.6% 52.6% 52.4% 47.4%
46.5% 48.8% 43.6% 45.2% 48.4% 47.4% 47.6% 52.6%
0%
10%
20%
30%
40%
50%
60%
70%
80%
90%
100%
All 16 &Older
16-21 22-29 30-44 45-59 60-64 65-74 75+
Male Female
Source: U.S. Census Bureau, American Community Survey 2015 1-Year Estimates,Table B23001: Sex by Age by Employment Status
Data are for the labor force population 16 years and older.
Labor Force Distribution by GenderNew Mexico, 2015

STATE OF THE WORKFORCE 2017 21
In 2015, labor force participation by most racial and ethnic groups in New Mexico was lower than the national average for each group, excepting only persons identifying as Asian. Labor force participation rates for all racial/ethnic groups in New Mexico were equal to or higher than the state average (58.4 percent), except for that of American Indians (56.1 percent, 2.3 percentage points lower than the New Mexico average and 2.0 percentage points lower than the national average of 58.1 percent for all American Indians and Alaska Natives). This group, along with those persons identifying as Black/African American in New Mexico, also experienced some of the highest unemployment rates in 2015. American Indians in New Mexico had a 16.0 percent unemployment rate, the highest of all racial and ethnic groups, and 8.8 percent of Black/African Americans in New Mexico’s labor force were unemployed, though this was lower than the national average of 11.3 percent. New Mexicans identifying as Asian had the highest percentage of labor force participation, at 66.6 percent, and the state’s lowest unemployment rate, at 5.0 percent. This was also the only group in New Mexico with a lower unemployment rate than the national average of 6.3 percent. New Mexicans of two or more races had the second-highest unemployment rate in the state, at 9.2 percent, but also the second-highest rate of labor force participation, at 61.8 percent
New Mexico’s WorkforceWhat it Looks Like
Race and Ethnicity of the Labor Force Racial groups in New Mexico that face greater challenges and barriers to employment include persons who identify as American Indian, Black/African American, and two or more races.
Addressing Employment Challenges of
Minority GroupsSeveral minority groups in New Mexico face substantial challenges within the workforce. Persons
identifying as American Indian, Black/African American, or two or more races not only had some of the highest levels of unemployment in recent years, but have also had some of the highest levels of unemployment historically. Recognizing the unique challenges of different racial groups is necessary in effectively addressing the significant disparities in the labor force and reducing unemployment and poverty levels across the board.
58.4
%
58.4
%
58.9
%
56.1
% 66.6
%
58.8
%
61.8
%
60.0
%
7.4%
6.4% 8.8% 16
.0%
5.0% 7.
7% 9.2%
7.7%
0.0%
10.0%
20.0%
30.0%
40.0%
50.0%
60.0%
70.0%
All R
aces
/Eth
nici
ties
Whi
te
Blac
k/Af
rican
Amer
ican
Amer
ican
Indi
an Asia
n
Oth
er R
ace
Two/
Mor
e R
aces
His
pani
c/La
tino
(All
Rac
es)
In Labor Force Unemployed
Source: U.S. Census Bureau, American Community Survey, 2015 1-Year Estimates, Table S2301:Employment Status
Labor Force Participation & Unemployment by Race/EthnicityNew Mexico, 2015
All R
aces
/Eth
nici
ties
22 NEW MEXICO DEPARTMENT OF WORKFORCE SOLUTIONS
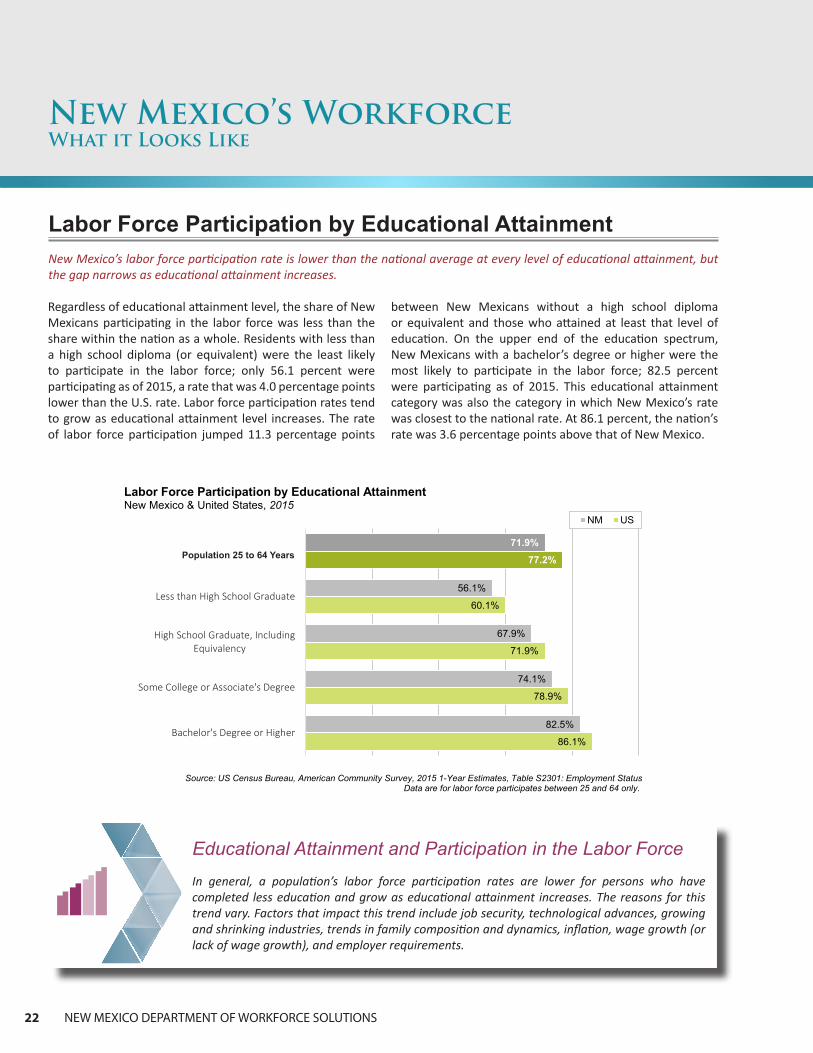
Regardless of educational attainment level, the share of New Mexicans participating in the labor force was less than the share within the nation as a whole. Residents with less than a high school diploma (or equivalent) were the least likely to participate in the labor force; only 56.1 percent were participating as of 2015, a rate that was 4.0 percentage points lower than the U.S. rate. Labor force participation rates tend to grow as educational attainment level increases. The rate of labor force participation jumped 11.3 percentage points
Labor Force Participation by Educational AttainmentNew Mexico’s labor force participation rate is lower than the national average at every level of educational attainment, but the gap narrows as educational attainment increases.
between New Mexicans without a high school diploma or equivalent and those who attained at least that level of education. On the upper end of the education spectrum, New Mexicans with a bachelor’s degree or higher were the most likely to participate in the labor force; 82.5 percent were participating as of 2015. This educational attainment category was also the category in which New Mexico’s rate was closest to the national rate. At 86.1 percent, the nation’s rate was 3.6 percentage points above that of New Mexico.
New Mexico’s WorkforceWhat it Looks Like
Educational Attainment and Participation in the Labor ForceIn general, a population’s labor force participation rates are lower for persons who have completed less education and grow as educational attainment increases. The reasons for this trend vary. Factors that impact this trend include job security, technological advances, growing and shrinking industries, trends in family composition and dynamics, inflation, wage growth (or lack of wage growth), and employer requirements.
86.1%
78.9%
71.9%
60.1%
77.2%
82.5%
74.1%
67.9%
56.1%
71.9%
Bachelor's Degree or Higher
Some College or Associate's Degree
High School Graduate, IncludingEquivalency
Less than High School Graduate
Population 25 to 64 Years
NM US
Source: US Census Bureau, American Community Survey, 2015 1-Year Estimates, Table S2301: Employment StatusData are for labor force participates between 25 and 64 only.
Labor Force Participation by Educational AttainmentNew Mexico & United States, 2015
Population 25 to 64 Years
STATE OF THE WORKFORCE 2017 23
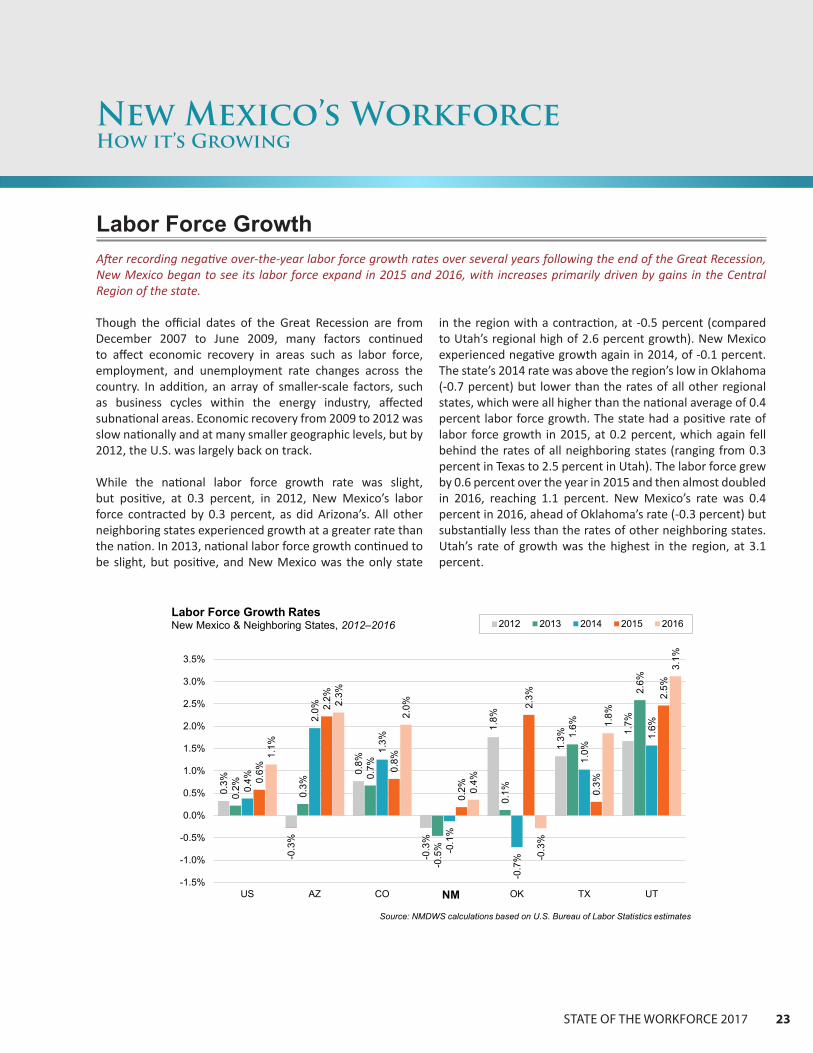
Though the official dates of the Great Recession are from December 2007 to June 2009, many factors continued to affect economic recovery in areas such as labor force, employment, and unemployment rate changes across the country. In addition, an array of smaller-scale factors, such as business cycles within the energy industry, affected subnational areas. Economic recovery from 2009 to 2012 was slow nationally and at many smaller geographic levels, but by 2012, the U.S. was largely back on track.
While the national labor force growth rate was slight, but positive, at 0.3 percent, in 2012, New Mexico’s labor force contracted by 0.3 percent, as did Arizona’s. All other neighboring states experienced growth at a greater rate than the nation. In 2013, national labor force growth continued to be slight, but positive, and New Mexico was the only state
in the region with a contraction, at -0.5 percent (compared to Utah’s regional high of 2.6 percent growth). New Mexico experienced negative growth again in 2014, of -0.1 percent. The state’s 2014 rate was above the region’s low in Oklahoma (-0.7 percent) but lower than the rates of all other regional states, which were all higher than the national average of 0.4 percent labor force growth. The state had a positive rate of labor force growth in 2015, at 0.2 percent, which again fell behind the rates of all neighboring states (ranging from 0.3 percent in Texas to 2.5 percent in Utah). The labor force grew by 0.6 percent over the year in 2015 and then almost doubled in 2016, reaching 1.1 percent. New Mexico’s rate was 0.4 percent in 2016, ahead of Oklahoma’s rate (-0.3 percent) but substantially less than the rates of other neighboring states. Utah’s rate of growth was the highest in the region, at 3.1 percent
New Mexico’s WorkforceHow it’s Growing
Labor Force GrowthAfter recording negative over-the-year labor force growth rates over several years following the end of the Great Recession, New Mexico began to see its labor force expand in 2015 and 2016, with increases primarily driven by gains in the Central Region of the state.
0.3%
-0.3
%
0.8%
-0.3
%
1.8%
1.3%
1.7%
0.2% 0.3%
0.7%
-0.5
%
0.1%
1.6%
2.6%
0.4%
2.0%
1.3%
-0.1
%
-0.7
%
1.0%
1.6%
0.6%
2.2%
0.8%
0.2%
2.3%
0.3%
2.5%
1.1%
2.3%
2.0%
0.4%
-0.3
%
1.8%
3.1%
-1.5%
-1.0%
-0.5%
0.0%
0.5%
1.0%
1.5%
2.0%
2.5%
3.0%
3.5%
US AZ CO NM OK TX UT
2012 2013 2014 2015 2016
Source: NMDWS calculations based on U.S. Bureau of Labor Statistics estimates
Labor Force Growth RatesNew Mexico & Neighboring States, 2012–2016
NM

24 NEW MEXICO DEPARTMENT OF WORKFORCE SOLUTIONS
New Mexico’s WorkforceHow it’s Growing
Labor force growth was distributed unevenly among the workforce regions within New Mexico between 2012 and 2016. In 2012, the state’s labor force contracted by 0.3 percent. The labor force in the Central and Northern Regions contracted as well, by 0.9 percent and 0.4 percent, respectively, but these losses were partially offset by gains in the Eastern (0.7 percent) and Southwestern (0.6 percent) Regions. The state’s labor force continued to contract through 2013 and 2014, hitting -0.1 percent in the latter year. Oil industry growth helped the Eastern Region’s labor force grow at a rate of 0.8 percent in 2013 and 1.4 percent in 2014. In the state’s other regions, however, the labor force contracted during the two-year period, with the Northern Region’s 2014 rate of -0.8 percent
being the largest decline. In 2015, however, labor force growth rebounded, expanding by 0.2 percent statewide. The Central and Northern Regions’ labor forces grew at a rate of 0.3 percent, and the Southwestern Region was the only region to report a contraction in its labor force. Growth continued at a muted pace in 2016, with the state’s labor force expanding by 0.4 percent. The Central Region led the charge, with a 1.5 percent rate of growth, followed by the Southwestern Region, with a 1.0 percent rate of growth. A downturn in the oil industry that begin in late 2015, however, led to a 1.9 percent decrease in the Eastern Region’s and a 0.6 percent decrease in the Northern Region’s labor forces.
Bright Spots and Areas of Continued FocusNew Mexico’s labor force expanded at a slow, but positive, pace in 2015 and 2016. While the state continued to trail its neighbors in labor force growth, a strengthening growth rate in New Mexico’s most populous region, the Central Region/Albuquerque MSA, was a positive sign. Labor force losses that were concentrated primarily in the Eastern and Northern Regions in 2015 and 2016, and that were driven by the downturn in the oil and gas extraction industry, have dampened statewide growth.
-0.3
%
-0.9
%
0.7%
-0.4
%
0.6%
-0.5
%
-0.5
%
0.8%
-1.1
% -0.6
%-0.1
%
-0.2
%
1.4%
-0.8
%
-0.7
%
0.2% 0.3%
0.1% 0.
3%
-0.2
%
0.4%
1.5%
-1.9
%
-0.6
%
1.0%
-3.0%
-2.0%
-1.0%
0.0%
1.0%
2.0%
New Mexico Central Eastern Northern Southwestern
2012 2013 2014 2015 2016
Source: NMDWS calculations based on U.S. Bureau of Labor Statistics estimates
Labor Force Growth RatesNew Mexico & Regions, 2012–2016
New Mexico
STATE OF THE WORKFORCE 2017 25
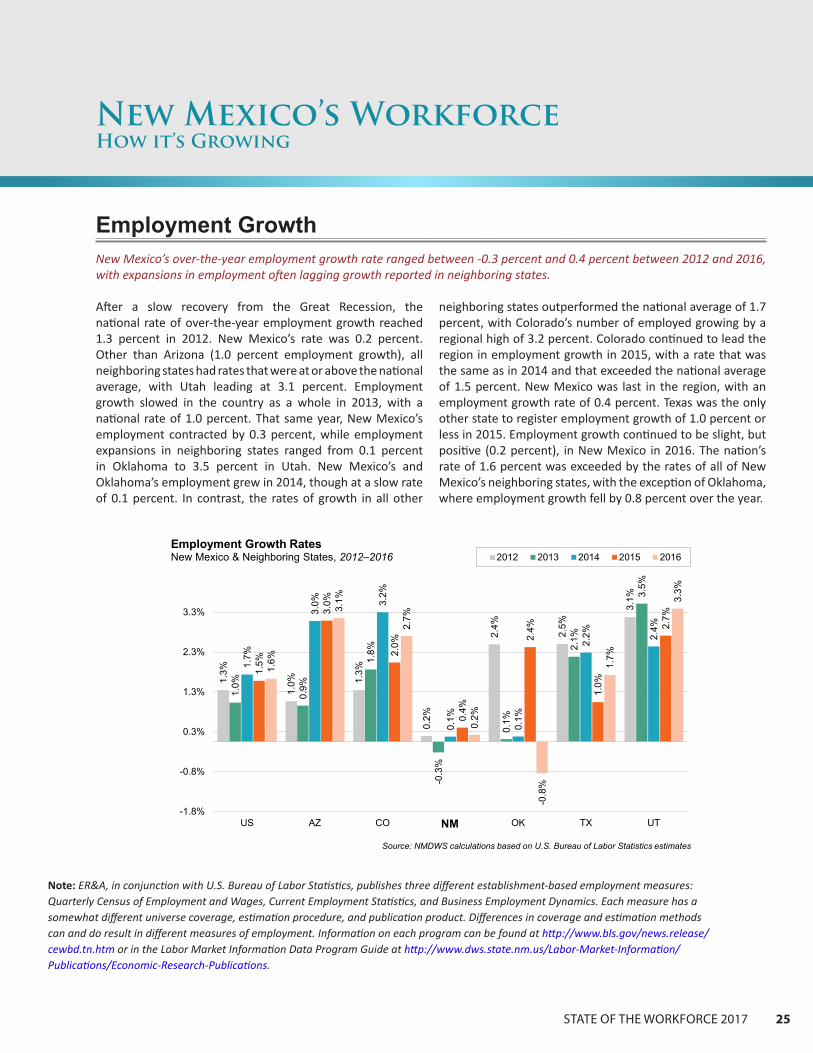
After a slow recovery from the Great Recession, the national rate of over-the-year employment growth reached 1.3 percent in 2012. New Mexico’s rate was 0.2 percent. Other than Arizona (1.0 percent employment growth), all neighboring states had rates that were at or above the national average, with Utah leading at 3.1 percent. Employment growth slowed in the country as a whole in 2013, with a national rate of 1.0 percent. That same year, New Mexico’s employment contracted by 0.3 percent, while employment expansions in neighboring states ranged from 0.1 percent in Oklahoma to 3.5 percent in Utah. New Mexico’s and Oklahoma’s employment grew in 2014, though at a slow rate of 0.1 percent. In contrast, the rates of growth in all other
neighboring states outperformed the national average of 1.7 percent, with Colorado’s number of employed growing by a regional high of 3.2 percent. Colorado continued to lead the region in employment growth in 2015, with a rate that was the same as in 2014 and that exceeded the national average of 1.5 percent. New Mexico was last in the region, with an employment growth rate of 0.4 percent. Texas was the only other state to register employment growth of 1.0 percent or less in 2015. Employment growth continued to be slight, but positive (0.2 percent), in New Mexico in 2016. The nation’s rate of 1.6 percent was exceeded by the rates of all of New Mexico’s neighboring states, with the exception of Oklahoma, where employment growth fell by 0.8 percent over the year.
New Mexico’s WorkforceHow it’s Growing
Employment GrowthNew Mexico’s over-the-year employment growth rate ranged between -0.3 percent and 0.4 percent between 2012 and 2016, with expansions in employment often lagging growth reported in neighboring states.
Note: ER&A, in conjunction with U.S. Bureau of Labor Statistics, publishes three different establishment-based employment measures: Quarterly Census of Employment and Wages, Current Employment Statistics, and Business Employment Dynamics. Each measure has a somewhat different universe coverage, estimation procedure, and publication product. Differences in coverage and estimation methods can and do result in different measures of employment. Information on each program can be found at http://www.bls.gov/news.release/cewbd.tn.htm or in the Labor Market Information Data Program Guide at http://www.dws.state.nm.us/Labor-Market-Information/Publications/Economic-Research-Publications.
1.3%
1.0% 1.
3%
0.2%
2.4%
2.5%
3.1%
1.0%
0.9%
1.8%
-0.3
%
0.1%
2.1%
3.5%
1.7%
3.0% 3.
2%
0.1%
0.1%
2.2% 2.
4%
1.5%
3.0%
2.0%
0.4%
2.4%
1.0%
2.7%
1.6%
3.1%
2.7%
0.2%
-0.8
%
1.7%
3.3%
-1.8%
-0.8%
0.3%
1.3%
2.3%
3.3%
US AZ CO NM OK TX UT
2012 2013 2014 2015 2016
Source: NMDWS calculations based on U.S. Bureau of Labor Statistics estimates
Employment Growth RatesNew Mexico & Neighboring States, 2012–2016
NM

26 NEW MEXICO DEPARTMENT OF WORKFORCE SOLUTIONS
New Mexico’s WorkforceHow it’s Growing
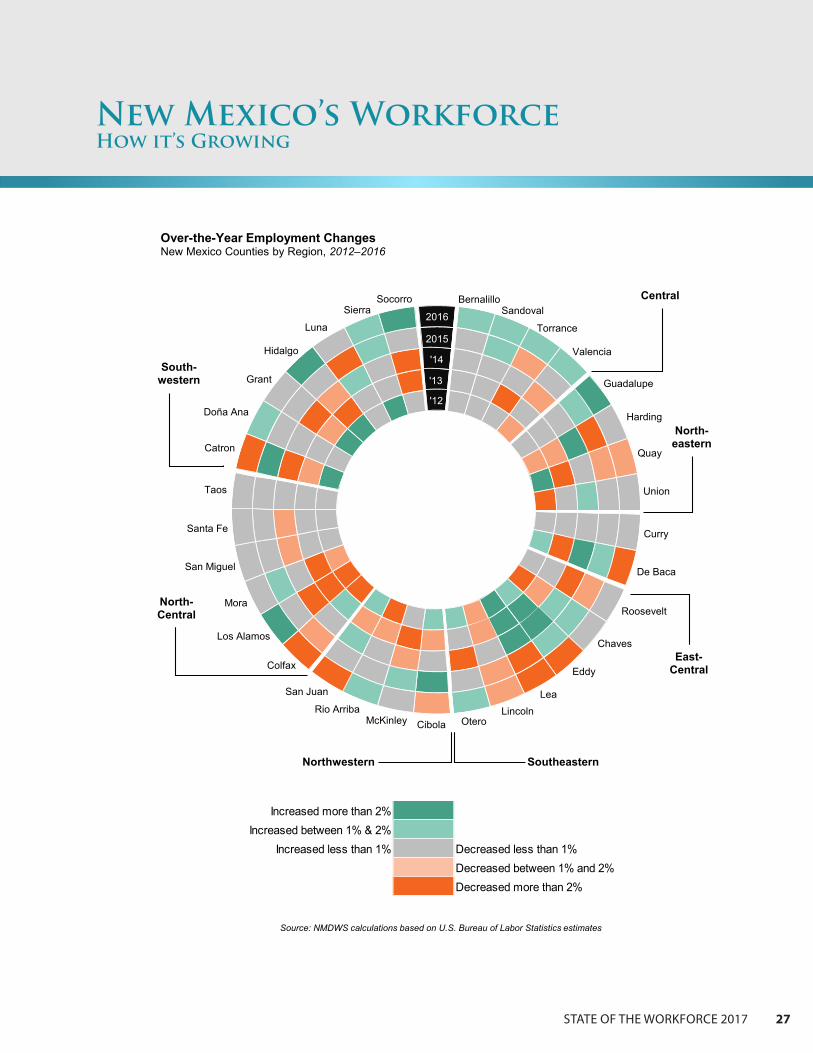
Employment growth in New Mexico was centered in the Eastern Region between 2012 and 2014 and in the Central Region between 2015 and 2016. In 2012, the Central Region was the only region in which employment didn’t expand over the year. Employment fell by 0.5 percent, while growth in the other regions ranged from 0.1 percent (Northern Region) to 1.1 percent (Eastern Region). Only the Eastern Region experienced growth in 2013 (0.9 percent). Employment in the Central Region decreased by 0.1 percent, while declines were sharper in the Northern Region (-1.1 percent) and the Southwestern Region (-0.7 percent). The state rebounded slightly in 2014, with employment growing by 0.1 percent. Over-the-year employment gains were largest in the Eastern Region (1.5 percent), while over-the-year losses were largest in the Northern Region (-0.5 percent). In 2015, regional
employment changes began to shift, primarily driven by employment losses in the mining and oil and gas industries and the regions in which those industries dominate. Decreases in the Eastern (-0.3 percent) and Southwestern (-0.1 percent) Regions were more than offset by growth in the Central (0.7 percent) and Northern (0.4 percent) Regions. Finally, 2016 was a year of contrasts. The Central Region led all regions, with 1.6 percent growth in employment, followed closely by the Southwestern Region, at 1.4 percent growth in employment. The Eastern Region’s strong growth early in the five-year period began to be countered, as employment declines in the oil and gas industry accelerated; employment declined by 2.9 percent over the year. The Northern Region, which is also a major energy-producing part of the state, reported a decline in employment of 1.0 percent.
0.2%
-0.5
%
1.1%
0.1%
1.0%
-0.3
%
-0.1
%
0.9%
-1.1
% -0.7
%
0.1%
0.1%
1.5%
-0.5
%
-0.4
%
0.4% 0.
7%
-0.3
%
0.4%
-0.1
%
0.2%
1.6%
-2.9
%
-1.0
%
1.4%
-4.0%
-3.0%
-2.0%
-1.0%
0.0%
1.0%
2.0%
3.0%
New Mexico Central Eastern Northern Southwestern
2012 2013 2014 2015 2016
Source: NMDWS calculations based on U.S. Bureau of Labor Statistics estimates
Employment Growth RatesNew Mexico & Regions, 2012–2016
New Mexico
Bright Spots and Areas of Continued Focus
New Mexico’s over-the-year employment growth rate, like its labor force growth rate, has been muted, but positive, in recent years (ranging from 0.1 to 0.4 percent between 2014, 2015, and 2016). Recent increases in employment in the Central and Southwestern Regions have helped counter losses in the Eastern and Northern Regions that were driven by a downturn in the oil and gas industry. As of 2016, nine of the state’s 33 counties reported over-the-year employment losses of more than 1 percent.
STATE OF THE WORKFORCE 2017 27
New Mexico’s WorkforceHow it’s Growing
Increased more than 2%Increased between 1% & 2%
Increased less than 1% Decreased less than 1%Decreased between 1% and 2%Decreased more than 2%
Source: NMDWS calculations based on U.S. Bureau of Labor Statistics estimates
Bernalillo Sandoval
Torrance
Valencia
Guadalupe
Harding
Quay
Union
Curry
De Baca
Roosevelt
Chaves
Eddy
Lea Lincoln
Otero Cibola McKinley Rio Arriba
San Juan
Colfax
Los Alamos
Mora
San Miguel
Santa Fe
Taos
Catron
Doña Ana
Grant
Hidalgo
Luna
Sierra Socorro
2015
'12
'13
2016
'14
Over-the-Year Employment ChangesNew Mexico Counties by Region, 2012–2016
North-eastern
East-Central
Northwestern Southeastern
South-western
Central
North-Central
28 NEW MEXICO DEPARTMENT OF WORKFORCE SOLUTIONS
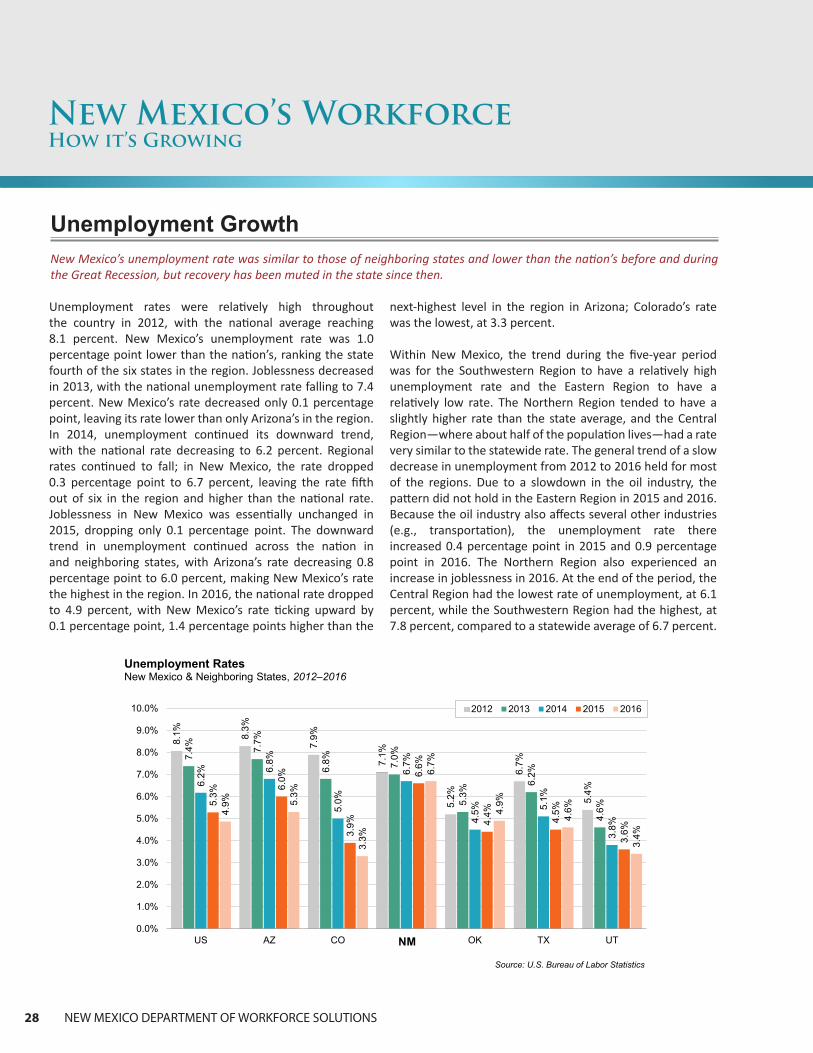
Unemployment rates were relatively high throughout the country in 2012, with the national average reaching 8.1 percent. New Mexico’s unemployment rate was 1.0 percentage point lower than the nation’s, ranking the state fourth of the six states in the region. Joblessness decreased in 2013, with the national unemployment rate falling to 7.4 percent. New Mexico’s rate decreased only 0.1 percentage point, leaving its rate lower than only Arizona’s in the region. In 2014, unemployment continued its downward trend, with the national rate decreasing to 6.2 percent. Regional rates continued to fall; in New Mexico, the rate dropped 0.3 percentage point to 6.7 percent, leaving the rate fifth out of six in the region and higher than the national rate. Joblessness in New Mexico was essentially unchanged in 2015, dropping only 0.1 percentage point. The downward trend in unemployment continued across the nation in and neighboring states, with Arizona’s rate decreasing 0.8 percentage point to 6.0 percent, making New Mexico’s rate the highest in the region. In 2016, the national rate dropped to 4.9 percent, with New Mexico’s rate ticking upward by 0.1 percentage point, 1.4 percentage points higher than the
next-highest level in the region in Arizona; Colorado’s rate was the lowest, at 3.3 percent.
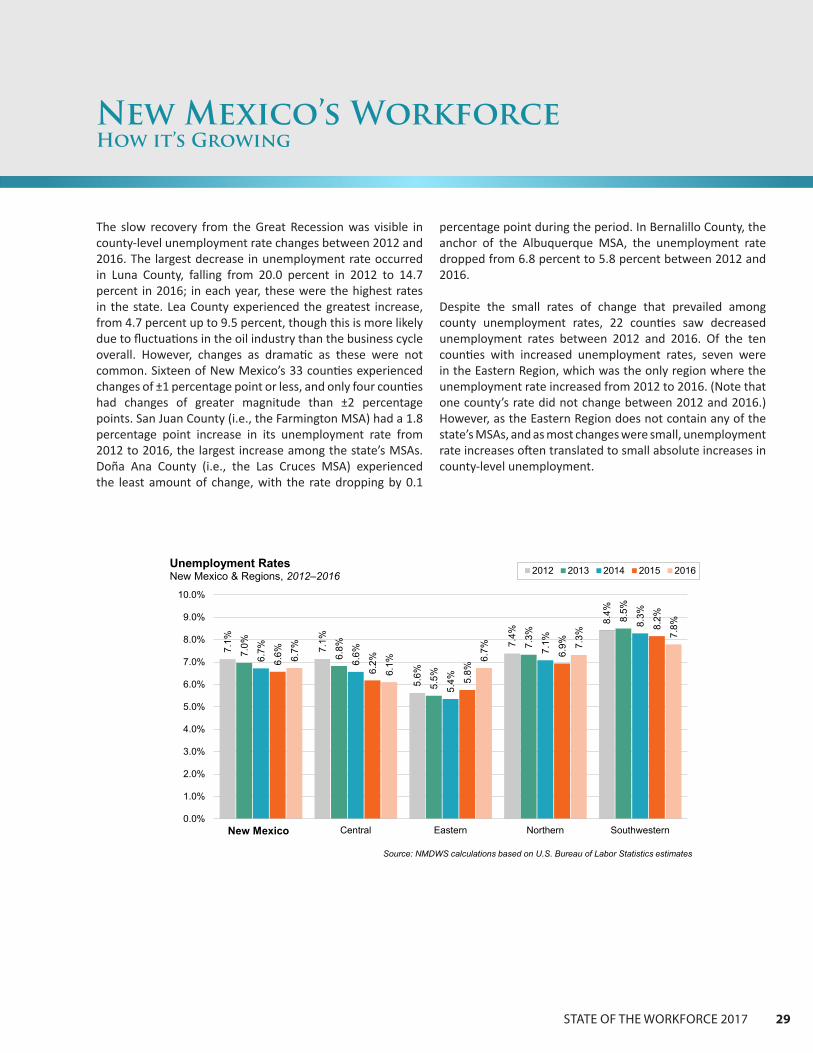
Within New Mexico, the trend during the five-year period was for the Southwestern Region to have a relatively high unemployment rate and the Eastern Region to have a relatively low rate. The Northern Region tended to have a slightly higher rate than the state average, and the Central Region—where about half of the population lives—had a rate very similar to the statewide rate. The general trend of a slow decrease in unemployment from 2012 to 2016 held for most of the regions. Due to a slowdown in the oil industry, the pattern did not hold in the Eastern Region in 2015 and 2016. Because the oil industry also affects several other industries (e.g., transportation), the unemployment rate there increased 0.4 percentage point in 2015 and 0.9 percentage point in 2016. The Northern Region also experienced an increase in joblessness in 2016. At the end of the period, the Central Region had the lowest rate of unemployment, at 6.1 percent, while the Southwestern Region had the highest, at 7.8 percent, compared to a statewide average of 6.7 percent.
New Mexico’s WorkforceHow it’s Growing
Unemployment GrowthNew Mexico’s unemployment rate was similar to those of neighboring states and lower than the nation’s before and during the Great Recession, but recovery has been muted in the state since then.
8.1% 8.3%
7.9%
7.1%
5.2%
6.7%
5.4%
7.4% 7.
7%
6.8% 7.0%
5.3%
6.2%
4.6%
6.2% 6.
8%
5.0%
6.7%
4.5% 5.
1%
3.8%
5.3%
6.0%
3.9%
6.6%
4.4% 4.5%
3.6%
4.9% 5.
3%
3.3%
6.7%
4.9%
4.6%
3.4%
0.0%
1.0%
2.0%
3.0%
4.0%
5.0%
6.0%
7.0%
8.0%
9.0%
10.0%
US AZ CO NM OK TX UT
2012 2013 2014 2015 2016
Source: U.S. Bureau of Labor Statistics
Unemployment RatesNew Mexico & Neighboring States, 2012–2016
NM
Future Workforce Supply
STATE OF THE WORKFORCE 2017 29
The slow recovery from the Great Recession was visible in county-level unemployment rate changes between 2012 and 2016. The largest decrease in unemployment rate occurred in Luna County, falling from 20.0 percent in 2012 to 14.7 percent in 2016; in each year, these were the highest rates in the state. Lea County experienced the greatest increase, from 4.7 percent up to 9.5 percent, though this is more likely due to fluctuations in the oil industry than the business cycle overall. However, changes as dramatic as these were not common. Sixteen of New Mexico’s 33 counties experienced changes of ±1 percentage point or less, and only four counties had changes of greater magnitude than ±2 percentage points. San Juan County (i.e., the Farmington MSA) had a 1.8 percentage point increase in its unemployment rate from 2012 to 2016, the largest increase among the state’s MSAs. Doña Ana County (i.e., the Las Cruces MSA) experienced the least amount of change, with the rate dropping by 0.1
percentage point during the period In Bernalillo County, the anchor of the Albuquerque MSA, the unemployment rate dropped from 6.8 percent to 5.8 percent between 2012 and 2016
Despite the small rates of change that prevailed among county unemployment rates, 22 counties saw decreased unemployment rates between 2012 and 2016. Of the ten counties with increased unemployment rates, seven were in the Eastern Region, which was the only region where the unemployment rate increased from 2012 to 2016. (Note that one county’s rate did not change between 2012 and 2016.) However, as the Eastern Region does not contain any of the state’s MSAs, and as most changes were small, unemployment rate increases often translated to small absolute increases in county-level unemployment.
New Mexico’s WorkforceHow it’s Growing
7.1%
7.1%
5.6%
7.4%
8.4%
7.0%
6.8%
5.5%
7.3%
8.5%
6.7%
6.6%
5.4%
7.1%
8.3%
6.6%
6.2%
5.8%
6.9%
8.2%
6.7%
6.1% 6.
7% 7.3% 7.
8%
0.0%
1.0%
2.0%
3.0%
4.0%
5.0%
6.0%
7.0%
8.0%
9.0%
10.0%
New Mexico Central Eastern Northern Southwestern
2012 2013 2014 2015 2016
Source: NMDWS calculations based on U.S. Bureau of Labor Statistics estimates
Unemployment RatesNew Mexico & Regions, 2012–2016
New Mexico

30 NEW MEXICO DEPARTMENT OF WORKFORCE SOLUTIONS
New Mexico’s WorkforceHow it’s Growing
6.8%
8.8%
4.7%
10.0
%
7.1%
11.1
%
7.0%
20.0
%
5.8% 7.
2%
9.5%
6.5%
8.9%
8.8%
7.5%
14.7
%
0.0%
5.0%
10.0%
15.0%
20.0%
2012 2016
Source: NMDWS calculations based on U.S. Bureau of Labor Statistics estimates
Central SouthwesternEastern Northern
Unemployment Rates for Counties With Largest/Smallest Percentage Point Changes by Region, 2012–2016
Bright Spots and Areas of Continued FocusThe unemployment rate is one of the most closely watched economic indicators. While New Mexico’s rate has fallen since the end of the Great Recession, it has stagnated at around 6.6/6.7 percent in the last three years (2014–2016), remaining well above the rates of its neighboring states. The Eastern Region’s uptick in rate of 0.9 percentage point between 2015 and 2016 was indicative of the region’s struggles with impacts from oil price drops and layoffs in the oil and gas industry. As oil prices increase in the future, it is expected that companies will begin to hire and employment in the region will rebound.
STATE OF THE WORKFORCE 2017 31
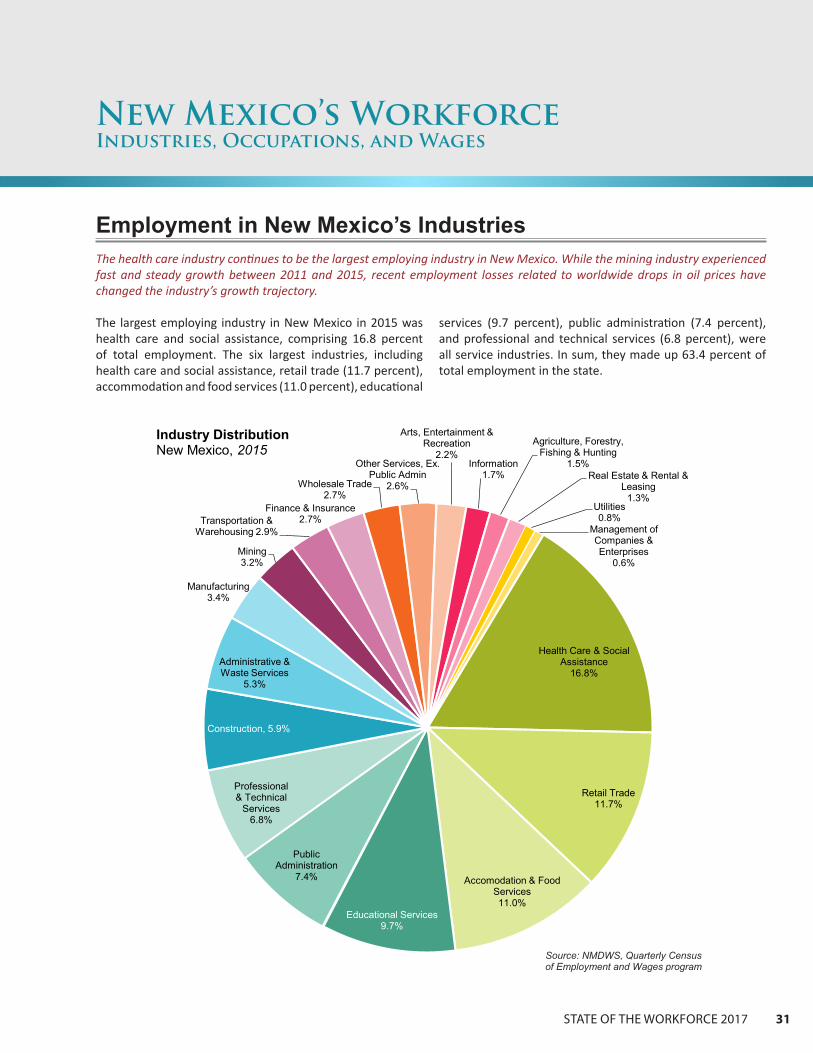
The largest employing industry in New Mexico in 2015 was health care and social assistance, comprising 16.8 percent of total employment. The six largest industries, including health care and social assistance, retail trade (11.7 percent), accommodation and food services (11.0 percent), educational
services (9.7 percent), public administration (7.4 percent), and professional and technical services (6.8 percent), were all service industries. In sum, they made up 63.4 percent of total employment in the state.
New Mexico’s WorkforceIndustries, Occupations, and Wages
Employment in New Mexico’s IndustriesThe health care industry continues to be the largest employing industry in New Mexico. While the mining industry experienced fast and steady growth between 2011 and 2015, recent employment losses related to worldwide drops in oil prices have changed the industry’s growth trajectory.
Health Care & Social Assistance
16.8%
Retail Trade 11.7%
Accomodation & Food Services11.0%
Educational Services9.7%
Public Administration
7.4%
Professional & Technical
Services6.8%
Construction, 5.9%
Administrative & Waste Services
5.3%
Manufacturing3.4%
Mining3.2%
Transportation & Warehousing 2.9%
Finance & Insurance 2.7%
Wholesale Trade2.7%
Other Services, Ex. Public Admin
2.6%
Arts, Entertainment & Recreation
2.2%Information
1.7%
Agriculture, Forestry, Fishing & Hunting
1.5%Real Estate & Rental &
Leasing1.3%
Utilities0.8%
Management of Companies & Enterprises
0.6%
Industry DistributionNew Mexico, 2015
Source: NMDWS, Quarterly Census of Employment and Wages program

32 NEW MEXICO DEPARTMENT OF WORKFORCE SOLUTIONS
Overall, employment increased by 3.3 percent, representing about 25,000 jobs, from 2011 to 2015. The largest absolute increase occurred in health care and social assistance, with the industry adding 10,391 jobs. As the largest industry in the state, this represented an 8.3 percent increase, fourth among all industry growth rates. The largest percentage increase in employment occurred in mining, with a gain of 4,256 jobs translating to a 20.0 percent increase. Accommodation and food services ranked second in terms of absolute growth. Employment expanded by 7,786, or 9.6 percent. Retail trade ranked fourth in absolute increase, expanding by 3.6 percent, or 3,279 jobs. Ten other industries experienced smaller, though positive, gains.
The greatest absolute loss of jobs occurred in educational services. Employment decreased by 2,303; however, as a large sector, this only represented a 2.9 percent decrease. Manufacturing saw the greatest percentage decrease, at 6.0 percent, shedding 1,766 jobs. In the larger sector of public
administration, a similar absolute loss (1,707) represented a 2 8 percent decline
Health care and social assistance experienced the largest employment increase statewide, driven by its lead growth in the Central and Southwestern Regions. It also reported the second-largest increase in the Northern Region and the second-fastest increases in the Central and Southwestern Regions. Accommodation and food services showed strong growth in all regions, leading all industries in numeric growth in the Northern Region and all but one industry in the other three, while ranking in the top five industries for growth rate in all regions. Mining was the fastest-growing industry in the Eastern and Southwestern Regions and the largest-growing industry in the Eastern Region. Agriculture, forestry, fishing, and hunting led the Central and Northern Regions in growth rate, mainly due to its relatively small employment base. Arts, entertainment, and recreation experienced moderate growth in the Central and Northern Regions.
New Mexico’s WorkforceIndustries, Occupations, and Wages
Industry Employment GrowthNew Mexico, 2011–2015
Health Care & Social Assistance 10,391 20.0% MiningAccommodation & Food Services 7,786 10.1% Agriculture, Forestry, Fishing & Hunting
Mining 4,256 9.6% Accommodation & Food ServicesRetail Trade 3,279 8.3% Health Care & Social Assistance
Transportation & Warehousing 1,601 7.5% Transportation & WarehousingConstruction 1,446 5.9% Arts, Entertainment & Recreation
Agriculture, Forestry, Fishing & Hunting 1,082 4.5% Real Estate & Rental & LeasingArts, Entertainment & Recreation 977 4.4% Finance & Insurance
Finance & Insurance 923 3.6% Retail TradeWholesale Trade 455 3.2% Construction
Real Estate & Rental & Leasing 439 2.2% Wholesale TradeProfessional & Technical Services 174 1.9% Mgmt. of Companies & Enterprises
Mgmt. of Companies & Enterprises 97 0.3% Professional & Technical ServicesUtilities 19 0.3% Utilities
Other Services, Ex. Public Admin -252 -1.2% Administrative & Waste ServicesAdministrative & Waste Services -511 -1.2% Other Services, Ex. Public Admin
Information -828 -2.8% Public AdministrationPublic Administration -1,707 -2.9% Educational Services
Manufacturing -1,766 -5.7% InformationEducational Services -2,303 -6.0% Manufacturing
Source: NMDWS, Quarterly Census of Employment & Wages program
PERCENT CHANGENUMERIC CHANGE

STATE OF THE WORKFORCE 2017 33
New Mexico’s WorkforceIndustries, Occupations, and Wages
Comparatively Significant Industries in New MexicoMajor industry sectors in which the share of employment in New Mexico is notably greater than the share in the nation include: mining, quarrying, and oil and gas extraction; agriculture, forestry, fishing, and hunting; public administration; and utilities. Major industry sectors that have comparatively smaller shares of employment include: manufacturing; management of companies and enterprises; wholesale trade; finance and insurance; and transportation and warehousing.
Largest and Fastest Growing IndustriesNew Mexico's Regions, 2011–2015
Largest Growth Fastest GrowthHealth Care & Social Assistance Agriculture, Forestry, Fishing & HuntingAccommodation & Food Services Health Care & Social Assistance
Retail Trade Accommodation & Food ServicesFinance & Insurance Arts, Entertainment & Recreation
Arts, Entertainment & Recreation Utilities
Largest Growth Fastest GrowthMining Mining
Accommodation & Food Services Transportation & WarehousingRetail Trade Accommodation & Food Services
Transportation & Warehousing Administration & Waste ServicesAdministration & Waste Services Retail Trade
Largest Growth Fastest GrowthAccommodation & Food Services Agriculture, Forestry, Fishing & HuntingHealth Care & Social Assistance Transportation & Warehousing
Retail Trade Management of Companies & EnterprisesArts, Entertainment & Recreation Accommodation & Food ServicesTransportation & Warehousing Arts, Entertainment & Recreation
Largest Growth Fastest GrowthHealth Care & Social Assistance MiningAccommodation & Food Services Health Care & Social Assistance
Manufacturing Agriculture, Forestry, Fishing & HuntingMining Accommodation & Food Services
Management of Companies & Enterprises Real Estate & Rental & Leasing
Source: NMDWS, Quarterly Census of Employment and Wages program
SOUTHWESTERN
NORTHERN
CENTRAL
EASTERN

34 NEW MEXICO DEPARTMENT OF WORKFORCE SOLUTIONS
In 2016, administrative and sales positions made up about one-quarter of all New Mexico jobs. Positions within the largest major occupational group, office and administrative support, made up 15.3 percent of jobs in New Mexico. Employment within each of sales and related occupations
and food preparation and serving occupations made up about 10 percent of employment statewide. Almost half of all employment in the state (47.8 percent) fell into the five largest major occupational groups. The other half was divided among the remaining 17 groups.
New Mexico’s WorkforceIndustries, Occupations, and Wages
Occupational Employment of the WorkforceNew Mexico’s occupational composition is similar to that of the nation. Employment in three of the 22 major occupational groups—office and administrative support, sales and related, and food preparation and serving related—represented about 35 percent of all employment in the state and in the nation as of 2016.
Office & Administrative Support15.3%
Food Preparation & Serving Related
10.1%
Sales & Related, 9.8%
Education, Training & Library, 6.5%
Construction & Extraction, 6.1%
Healthcare Practitioners &
Technical5.9%
Transportation & Material
Moving5.5%
Personal Care & Service
4.9%
Management4.8%
Business & Financial Operations
4.4%
Installation, Maintenance & Repair
4.1%
Building & Grounds Cleaning &
Maintenance3.3%
Healthcare Support3.2%
Production3.2%
Protective Service3.1%
Architecture & Engineering2.6%
Computer & Mathematical1.9%
Community & Social Service
1.7%
Life, Physical & Social Science
1.3%
Arts, Design, Entertainment, Sports & Media
1.1%Legal0.7%Farming, Fishing
& Forestry0.3%
Occupational DistributionNew Mexico, 2016
Source: NMDWS, Occupational Employment Statistics program
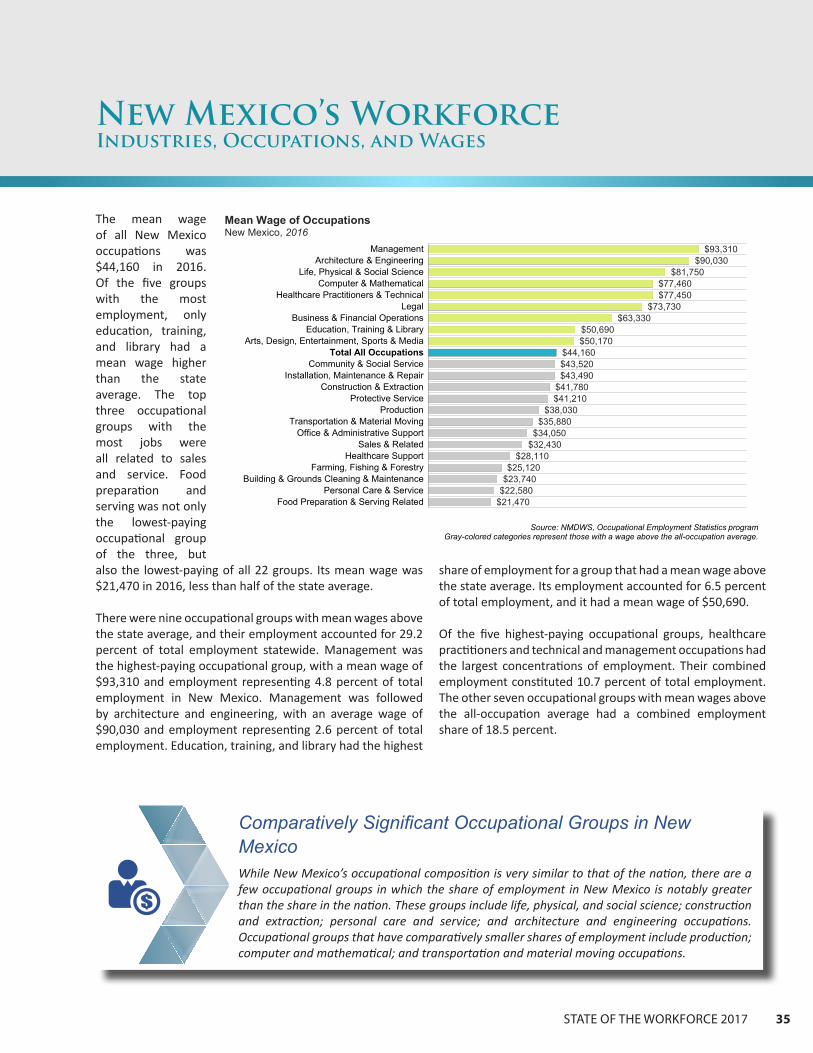
STATE OF THE WORKFORCE 2017 35
New Mexico’s WorkforceIndustries, Occupations, and Wages
The mean wage of all New Mexico occupations was $44,160 in 2016. Of the five groups with the most employment, only education, training, and library had a mean wage higher than the state average The top three occupational groups with the most jobs were all related to sales and service. Food preparation and serving was not only the lowest-paying occupational group of the three, but also the lowest-paying of all 22 groups. Its mean wage was $21,470 in 2016, less than half of the state average.
There were nine occupational groups with mean wages above the state average, and their employment accounted for 29.2 percent of total employment statewide. Management was the highest-paying occupational group, with a mean wage of $93,310 and employment representing 4.8 percent of total employment in New Mexico. Management was followed by architecture and engineering, with an average wage of $90,030 and employment representing 2.6 percent of total employment. Education, training, and library had the highest
share of employment for a group that had a mean wage above the state average. Its employment accounted for 6.5 percent of total employment, and it had a mean wage of $50,690.
Of the five highest-paying occupational groups, healthcare practitioners and technical and management occupations had the largest concentrations of employment. Their combined employment constituted 10.7 percent of total employment. The other seven occupational groups with mean wages above the all-occupation average had a combined employment share of 18.5 percent.
$93,310 $90,030
$81,750 $77,460 $77,450
$73,730 $63,330
$50,690 $50,170
$44,160 $43,520 $43,490
$41,780 $41,210
$38,030 $35,880
$34,050 $32,430
$28,110 $25,120
$23,740 $22,580
$21,470
ManagementArchitecture & Engineering
Life, Physical & Social ScienceComputer & Mathematical
Healthcare Practitioners & TechnicalLegal
Business & Financial OperationsEducation, Training & Library
Arts, Design, Entertainment, Sports & MediaTotal All Occupational Groups
Community & Social ServiceInstallation, Maintenance & Repair
Construction & ExtractionProtective Service
ProductionTransportation & Material Moving
Office & Administrative SupportSales & Related
Healthcare SupportFarming, Fishing & Forestry
Building & Grounds Cleaning & MaintenancePersonal Care & Service
Food Preparation & Serving Related
Mean Wage of OccupationsNew Mexico, 2016
Source: NMDWS, Occupational Employment Statistics programGray-colored categories represent those with a wage above the all-occupation average.
Total All Occupations
Comparatively Significant Occupational Groups in New MexicoWhile New Mexico’s occupational composition is very similar to that of the nation, there are a few occupational groups in which the share of employment in New Mexico is notably greater than the share in the nation. These groups include life, physical, and social science; construction and extraction; personal care and service; and architecture and engineering occupations. Occupational groups that have comparatively smaller shares of employment include production; computer and mathematical; and transportation and material moving occupations.

36 NEW MEXICO DEPARTMENT OF WORKFORCE SOLUTIONS
In 2015, 28.9 percent of New Mexico’s labor force had earned a bachelor’s degree or higher. This share was lower than the national average of 35.7 percent and trailed the shares of all neighboring states except Oklahoma. Colorado had the largest share of its labor force possessing at least a bachelor’s degree, at 42.9 percent. On the flip side, 26.0 percent of New Mexico’s labor force had earned a high school diploma or equivalent certificate, a share that was 1.5 percentage points over the national average. About 88.5 percent of the labor force had at least a high school diploma or equivalent certificate; 11.5 percent of the labor force had not attained that level of education. New Mexico’s share of the labor force that hadn’t completed high school or received an equivalent certificate exceeded the national average (9.1 percent) and was second-highest in the region after Texas’s share (13.8 percent).
Almost 29 percent of New Mexico’s workforce had earned a bachelor’s degree or higher as of 2015, but only about one-fourth of jobs in the state required that level of education, assuming standard minimum education requirements by occupation, as of 2014. While this might indicate that some workers who have attained a high level of education may be underemployed, i.e., they possess more education than is needed for their job, it is likely that the standard minimum education requirements are not capturing all the nuances of demand within the labor market. Employers may require more than the typical minimum education in order to draw from a more competitive pool of applicants. Additionally, it is important to note that education level is only one requirement for a particular position; there may be other required skills or experience. Because of these other factors, typical education requirement data only serve as part of the overall evaluation of how well the workforce aligns with demand.
New Mexico’s WorkforceSkills and Education
Educational Attainment of the Population and Labor ForceNew Mexico’s workers, on average, have less education than workers in neighboring states and across the nation.
14.6%
27.4%
32.7%
25.4%
11.5%
26.0%
33.6%
28.9%
0%
10%
20%
30%
40%
Less than High School High School Some College orAssociate's Degree
Bachelor's Degree orHigher
% of Population % of Labor Force
Source: U.S. Census Bureau, American Community Survey, 2015 1-Year Estimates,Table B23006: Educational Attainment by Employment Status for the Population 25 to 64 Years
Data for civilian labor force (ages 25–64); military has specific educational requirements that may impact analysis.
Educational Attainment of the Population & Labor ForceNew Mexico, 2015
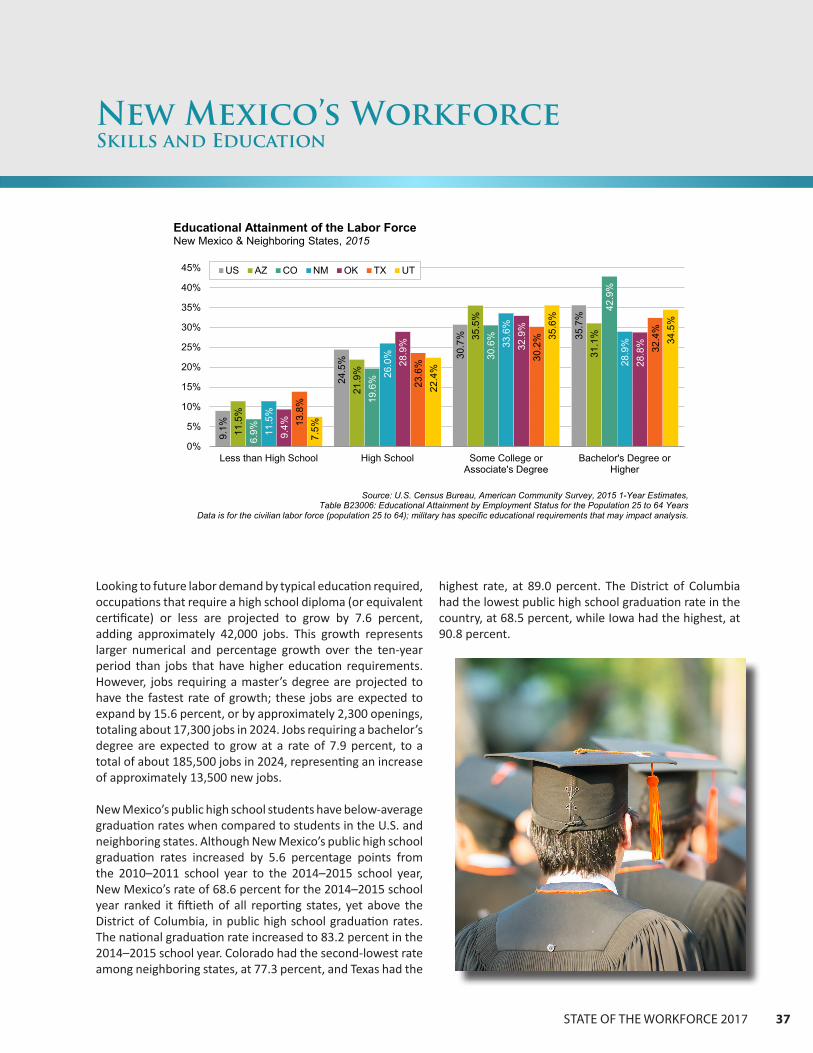
STATE OF THE WORKFORCE 2017 37
Looking to future labor demand by typical education required, occupations that require a high school diploma (or equivalent certificate) or less are projected to grow by 7.6 percent, adding approximately 42,000 jobs. This growth represents larger numerical and percentage growth over the ten-year period than jobs that have higher education requirements. However, jobs requiring a master’s degree are projected to have the fastest rate of growth; these jobs are expected to expand by 15.6 percent, or by approximately 2,300 openings, totaling about 17,300 jobs in 2024. Jobs requiring a bachelor’s degree are expected to grow at a rate of 7.9 percent, to a total of about 185,500 jobs in 2024, representing an increase of approximately 13,500 new jobs.
New Mexico’s public high school students have below-average graduation rates when compared to students in the U.S. and neighboring states. Although New Mexico’s public high school graduation rates increased by 5.6 percentage points from the 2010–2011 school year to the 2014–2015 school year, New Mexico’s rate of 68.6 percent for the 2014–2015 school year ranked it fiftieth of all reporting states, yet above the District of Columbia, in public high school graduation rates. The national graduation rate increased to 83.2 percent in the 2014–2015 school year. Colorado had the second-lowest rate among neighboring states, at 77.3 percent, and Texas had the
New Mexico’s WorkforceSkills and Education
9.1%
24.5
% 30.7
% 35.7
%
11.5
%
21.9
%
35.5
%
31.1
%
6.9%
19.6
%
30.6
%
42.9
%
11.5
%
26.0
%
33.6
%
28.9
%
9.4%
28.9
% 32.9
%
28.8
%
13.8
%
23.6
%
30.2
%
32.4
%
7.5%
22.4
%
35.6
%
34.5
%
0%
5%
10%
15%
20%
25%
30%
35%
40%
45%
Less than High School High School Some College orAssociate's Degree
Bachelor's Degree orHigher
US AZ CO NM OK TX UT
Source: U.S. Census Bureau, American Community Survey, 2015 1-Year Estimates,Table B23006: Educational Attainment by Employment Status for the Population 25 to 64 Years
Data is for the civilian labor force (population 25 to 64); military has specific educational requirements that may impact analysis.
Educational Attainment of the Labor ForceNew Mexico & Neighboring States, 2015
highest rate, at 89.0 percent. The District of Columbia had the lowest public high school graduation rate in the country, at 68.5 percent, while Iowa had the highest, at 90 8 percent

38 NEW MEXICO DEPARTMENT OF WORKFORCE SOLUTIONS
New Mexico’s WorkforceSkills and Education
No Formal Education
Requirement29.8%
HS Diploma/Equiv.34.8%
Some College, No Degree
2.6%
Postsecondary Non-Degree Award
5.7%
Associate's2.7%
Bachelor's20.1%
Master's 1.8%
Doctoral/ Professional
2.6%
Source: NMDWSEmployment Projections
program
Employment by Educational RequirementNew Mexico, 2014
7.7%
10.9%
4.8%
0.6%
8.1%
6.2%7.9%
15.6%
11.6%
0.0%
2.0%
4.0%
6.0%
8.0%
10.0%
12.0%
14.0%
16.0%
18.0%
Tota
l Gro
wth
No
Form
alEd
ucat
ion
Req
.
HS
Dip
lom
a or
Equi
v.
Som
e C
olle
ge,
No
Deg
ree
Post
sec.
,N
on-D
egre
e Aw
ard
Asso
ciat
e's
Bach
elor
's
Mas
ter's
Doc
tora
l/Pro
f.
Source: NMDWS Employment Projections program
Employment Growth by Educational Attainment RequiredNew Mexico, 2014–2024
Tota
l Gro
wth
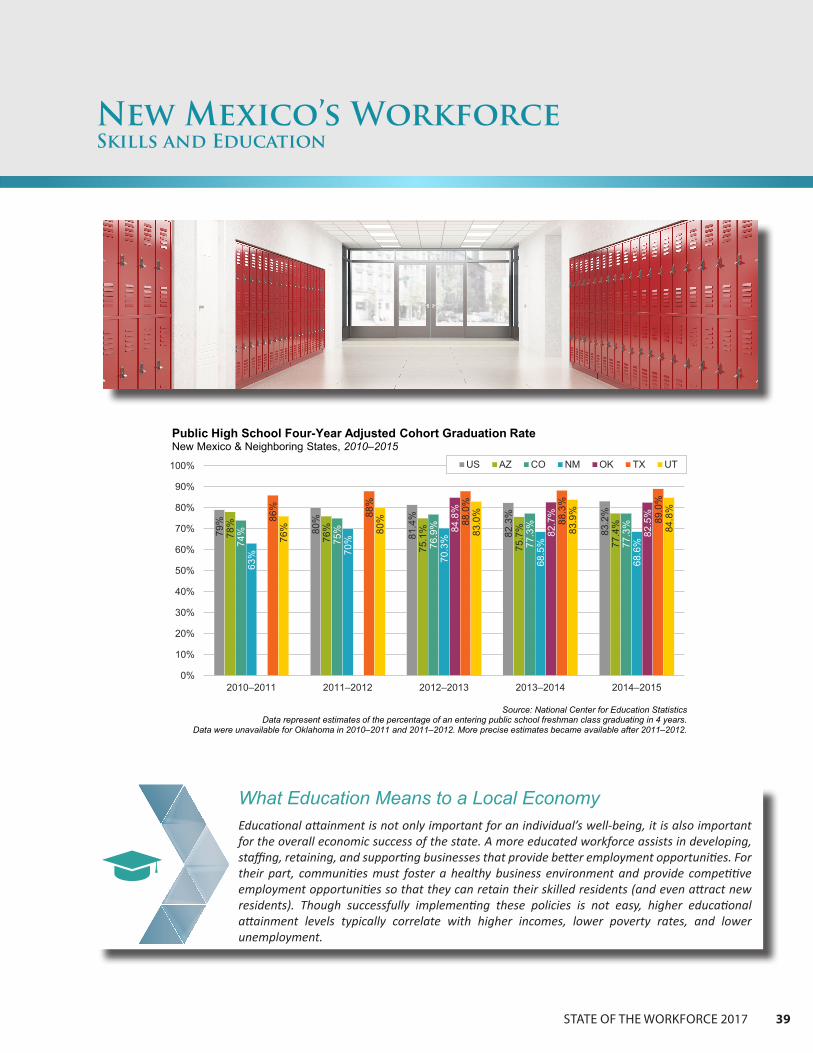
STATE OF THE WORKFORCE 2017 39
New Mexico’s WorkforceSkills and Education
79%
80%
81.4
%
82.3
%
83.2
%
78%
76%
75.1
%
75.7
%
77.4
%
74%
75%
76.9
%
77.3
%
77.3
%
63% 70
%
70.3
%
68.5
%
68.6
%
84.8
%
82.7
%
82.5
%86%
88%
88.0
%
88.3
%
89.0
%
76% 80
%
83.0
%
83.9
%
84.8
%0%
10%
20%
30%
40%
50%
60%
70%
80%
90%
100%
2010–2011 2011–2012 2012–2013 2013–2014 2014–2015
US AZ CO NM OK TX UT
Source: National Center for Education StatisticsData represent estimates of the percentage of an entering public school freshman class graduating in 4 years.
Data were unavailable for Oklahoma in 2010–2011 and 2011–2012. More precise estimates became available after 2011–2012.
Public High School Four-Year Adjusted Cohort Graduation RateNew Mexico & Neighboring States, 2010–2015
What Education Means to a Local EconomyEducational attainment is not only important for an individual’s well-being, it is also important for the overall economic success of the state. A more educated workforce assists in developing, staffing, retaining, and supporting businesses that provide better employment opportunities. For their part, communities must foster a healthy business environment and provide competitive employment opportunities so that they can retain their skilled residents (and even attract new residents). Though successfully implementing these policies is not easy, higher educational attainment levels typically correlate with higher incomes, lower poverty rates, and lower unemployment.
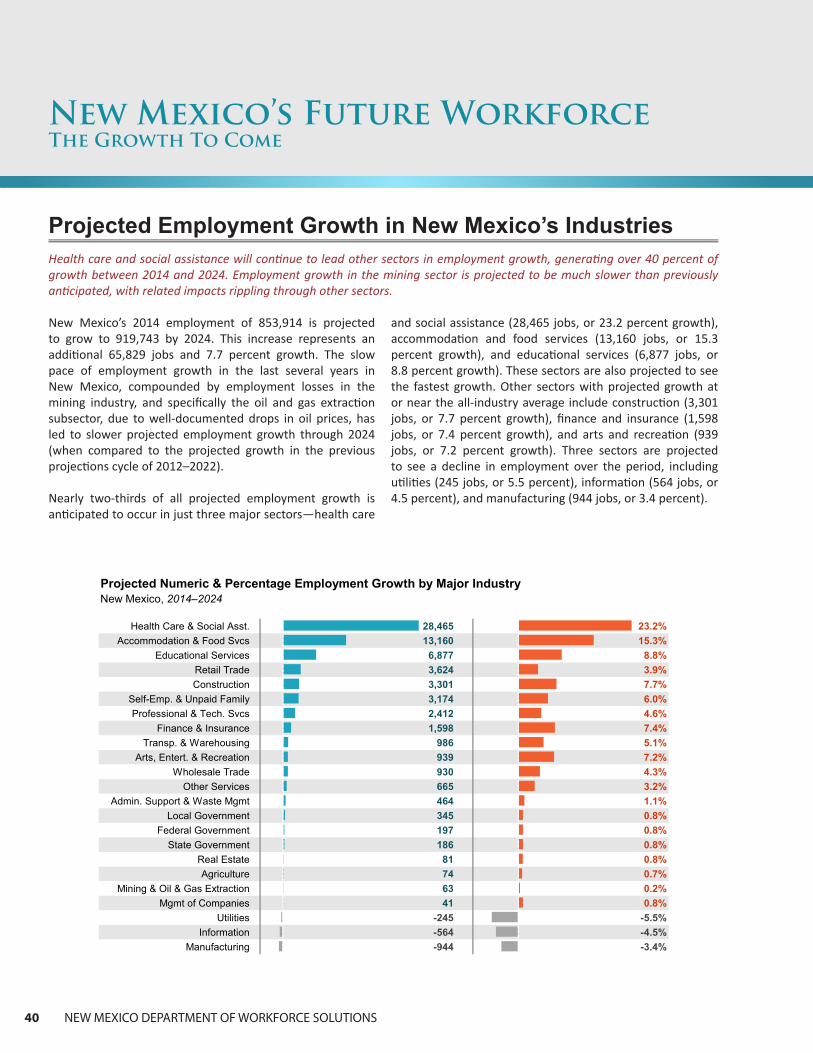
40 NEW MEXICO DEPARTMENT OF WORKFORCE SOLUTIONS
New Mexico’s 2014 employment of 853,914 is projected to grow to 919,743 by 2024. This increase represents an additional 65,829 jobs and 7.7 percent growth. The slow pace of employment growth in the last several years in New Mexico, compounded by employment losses in the mining industry, and specifically the oil and gas extraction subsector, due to well-documented drops in oil prices, has led to slower projected employment growth through 2024 (when compared to the projected growth in the previous projections cycle of 2012–2022).
Nearly two-thirds of all projected employment growth is anticipated to occur in just three major sectors—health care
New Mexico’s Future WorkforceThe Growth To Come
Projected Employment Growth in New Mexico’s IndustriesHealth care and social assistance will continue to lead other sectors in employment growth, generating over 40 percent of growth between 2014 and 2024. Employment growth in the mining sector is projected to be much slower than previously anticipated, with related impacts rippling through other sectors.
and social assistance (28,465 jobs, or 23.2 percent growth), accommodation and food services (13,160 jobs, or 15.3 percent growth), and educational services (6,877 jobs, or 8.8 percent growth). These sectors are also projected to see the fastest growth. Other sectors with projected growth at or near the all-industry average include construction (3,301 jobs, or 7.7 percent growth), finance and insurance (1,598 jobs, or 7.4 percent growth), and arts and recreation (939 jobs, or 7.2 percent growth). Three sectors are projected to see a decline in employment over the period, including utilities (245 jobs, or 5.5 percent), information (564 jobs, or 4.5 percent), and manufacturing (944 jobs, or 3.4 percent).
Projected Numeric & Percentage Employment Growth by Major IndustryNew Mexico, 2014–2024
Health Care & Social Asst. 28,465 23.2%Accommodation & Food Svcs 13,160 15.3%
Educational Services 6,877 8.8%Retail Trade 3,624 3.9%Construction 3,301 7.7%
Self-Emp. & Unpaid Family 3,174 6.0%Professional & Tech. Svcs 2,412 4.6%
Finance & Insurance 1,598 7.4%Transp. & Warehousing 986 5.1%
Arts, Entert. & Recreation 939 7.2%Wholesale Trade 930 4.3%
Other Services 665 3.2%Admin. Support & Waste Mgmt 464 1.1%
Local Government 345 0.8%Federal Government 197 0.8%
State Government 186 0.8%Real Estate 81 0.8%Agriculture 74 0.7%
Mining & Oil & Gas Extraction 63 0.2%Mgmt of Companies 41 0.8%
Utilities -245 -5.5%Information -564 -4.5%
Manufacturing -944 -3.4%

STATE OF THE WORKFORCE 2017 41
The sizable growth in the health care and social assistance industry sector is projected to be driven primarily by growth in employment at ambulatory health care services establishments (15,233 jobs, or 32.3 percent), followed by social assistance establishments (9,242 jobs, or 34.8 percent), hospitals (3,285 jobs, or 9.3 percent), and nursing and residential care facilities (705 jobs, or 5.1 percent). All four industry subsectors are among the top 20 industries projected to grow the most between 2014 and 2024.
There are several industry subsectors projected to see percentage growth in employment that exceeds the all-
industry growth of 7.7 percent. The beverage and tobacco product manufacturing subsector is projected to see faster employment growth than any other subsector in the state. The sector, with 2014 employment of 684, is only projected to produce 274 more jobs over the period, however. The percentage growth in ambulatory health care services and social assistance, both with 2014 employment of more than 26,000, is more notable, as is projected percentage growth in food services and drinking places. All three government subsectors—federal, state, and local—are projected to see minimal growth of 0.8 percent between 2014 and 2024.
New Mexico’s Future WorkforceThe Growth To Come
New Mexico, 2014–2024
Industry Sector Industry Subsector Num. Pct.
Agriculture Support Activities for Agriculture & Forestry 226 8.2%Construction Construction of Buildings 952 9.7%
Specialty Trade Contractors 2,278 9.4%Manufacturing Beverage & Tobacco Product Manufacturing 274 40.1%Wholesale Trade Wholesale Electronic Markets & Agents & Brokers 438 24.6%Retail Trade Electronics & Appliance Stores 373 14.9%
Building Material & Garden Equipment & Supplies Dealers 798 10.2%Health & Personal Care Stores 683 13.9%Sporting Goods, Hobby, Musical Instrument & Book Stores 458 13.4%Support Activities for Transportation 170 8.0%Warehousing & Storage 437 31.2%
Information Motion Picture & Sound Recording Industries 278 10.5%Other Information Services 89 30.6%
Finance & Insurance Securities, Commodity Contracts & Other Financial Investments & Related Activities 382 22.4%Insurance Carriers & Related Activities 967 12.0%
Educational Services Educational Services 6,877 8.8%Ambulatory Health Care Services 15,233 32.3%Hospitals 3,285 9.3%Social Assistance 9,242 34.8%
Arts, Entertainment & Rec. Amusement, Gambling & Recreation Industries 858 7.8%Accommodation 2,446 13.5%Food Services & Drinking Places 10,714 15.8%
Subsectors with 2014 employment of at least 3,000 and growth above the all-industry average of 7.7 percent.
Health Care & Social Assistance
Accommodation & Food Services
Growth
Transportation & Warehousing
Leading Industry Subsectors by Major Industry Sector & Numeric & Percentage Growth
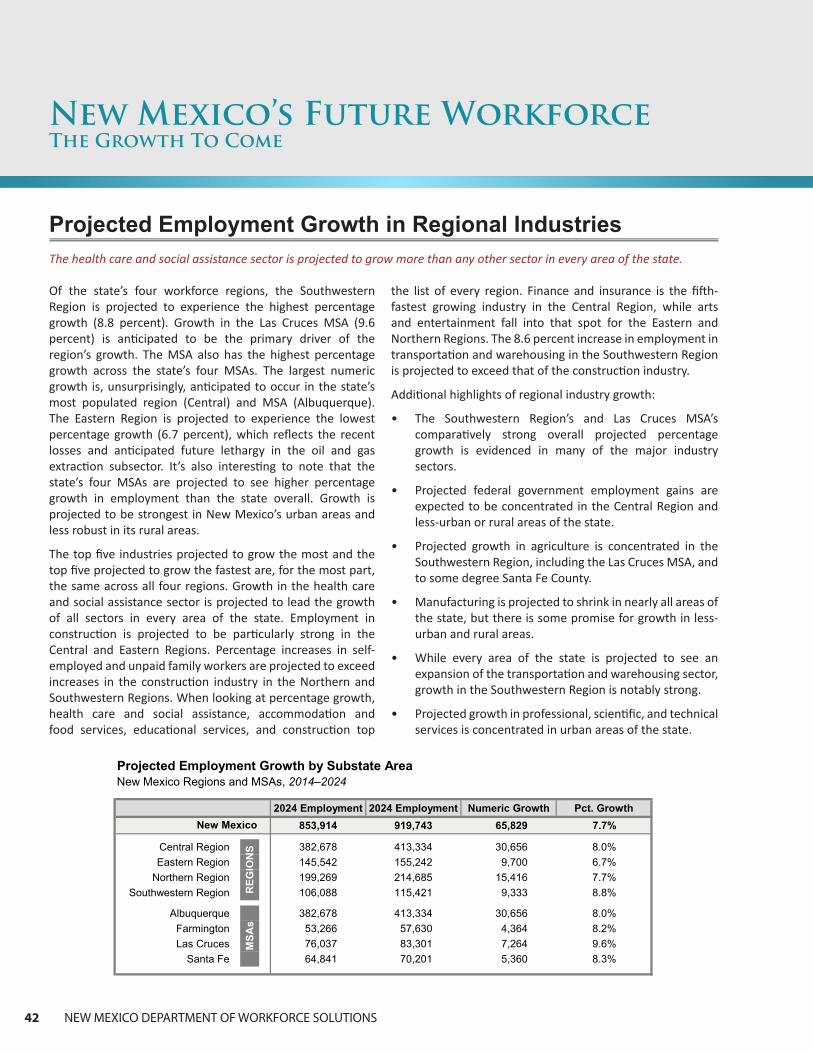
42 NEW MEXICO DEPARTMENT OF WORKFORCE SOLUTIONS
Of the state’s four workforce regions, the Southwestern Region is projected to experience the highest percentage growth (8.8 percent). Growth in the Las Cruces MSA (9.6 percent) is anticipated to be the primary driver of the region’s growth. The MSA also has the highest percentage growth across the state’s four MSAs. The largest numeric growth is, unsurprisingly, anticipated to occur in the state’s most populated region (Central) and MSA (Albuquerque). The Eastern Region is projected to experience the lowest percentage growth (6.7 percent), which reflects the recent losses and anticipated future lethargy in the oil and gas extraction subsector. It’s also interesting to note that the state’s four MSAs are projected to see higher percentage growth in employment than the state overall. Growth is projected to be strongest in New Mexico’s urban areas and less robust in its rural areas.
The top five industries projected to grow the most and the top five projected to grow the fastest are, for the most part, the same across all four regions. Growth in the health care and social assistance sector is projected to lead the growth of all sectors in every area of the state. Employment in construction is projected to be particularly strong in the Central and Eastern Regions. Percentage increases in self-employed and unpaid family workers are projected to exceed increases in the construction industry in the Northern and Southwestern Regions. When looking at percentage growth, health care and social assistance, accommodation and food services, educational services, and construction top
New Mexico’s Future WorkforceThe Growth To Come
Projected Employment Growth in Regional Industries The health care and social assistance sector is projected to grow more than any other sector in every area of the state.
the list of every region. Finance and insurance is the fifth-fastest growing industry in the Central Region, while arts and entertainment fall into that spot for the Eastern and Northern Regions. The 8.6 percent increase in employment in transportation and warehousing in the Southwestern Region is projected to exceed that of the construction industry.
Additional highlights of regional industry growth:
• The Southwestern Region’s and Las Cruces MSA’s comparatively strong overall projected percentage growth is evidenced in many of the major industry sectors.
• Projected federal government employment gains are expected to be concentrated in the Central Region and less-urban or rural areas of the state.
• Projected growth in agriculture is concentrated in the Southwestern Region, including the Las Cruces MSA, and to some degree Santa Fe County.
• Manufacturing is projected to shrink in nearly all areas of the state, but there is some promise for growth in less-urban and rural areas.
• While every area of the state is projected to see an expansion of the transportation and warehousing sector, growth in the Southwestern Region is notably strong.
• Projected growth in professional, scientific, and technical services is concentrated in urban areas of the state.
Projected Employment Growth by Substate AreaNew Mexico Regions and MSAs, 2014–2024
2024 Employment 2024 Employment Numeric Growth Pct. Growth853,914 919,743 65,829 7.7%
Central Region 382,678 413,334 30,656 8.0%Eastern Region 145,542 155,242 9,700 6.7%
Northern Region 199,269 214,685 15,416 7.7%Southwestern Region 106,088 115,421 9,333 8.8%
Albuquerque 382,678 413,334 30,656 8.0%Farmington 53,266 57,630 4,364 8.2%Las Cruces 76,037 83,301 7,264 9.6%
Santa Fe 64,841 70,201 5,360 8.3%
MSA
s
New Mexico
REG
ION
S

STATE OF THE WORKFORCE 2017 43
New Mexico’s Future WorkforceThe Growth To Come
Major Industry Sectors With the Largest and Fastest Projected Employment GrowthNew Mexico Regions, 2014–2024
Health Care & Social Asst. 13,631 22.6% Health Care & Social Asst.Accommodation & Food Svcs 6,001 15.4% Accommodation & Food Svcs
Educational Services 2,829 8.8% Educational ServicesRetail Trade 1,749 8.2% ConstructionConstruction 1,610 8.2% Finance & Insurance
Health Care & Social Asst. 3,548 23.0% Health Care & Social Asst.Retail Trade 615 15.3% Accommodation & Food SvcsConstruction *** *** 8.9% Educational Services
Educational Services *** *** 6.9% ConstructionAccommodation & Food Svcs *** *** *** *** Arts & Entertainment
Health Care & Social Asst. 6,553 23.0% Health Care & Social Asst.Educational Services 1,678 15.2% Accommodation & Food Svcs
Retail Trade 848 8.8% Educational ServicesSelf-Emp./Unpaid Family Wkrs 661 7.4% ConstructionAccommodation & Food Svcs *** *** 7.1% Arts & Entertainment
Health Care & Social Asst. 4,237 25.0% Health Care & Social Asst.Accommodation & Food Svcs 1,520 15.5% Accommodation & Food Svcs
Self-Emp./Unpaid Family Wkrs 610 8.9% Educational ServicesRetail Trade 429 8.6% Transportation & Warehousing
Educational Services *** *** 8.2% Construction*** represents data that are suppressed.
Eastern
Northern
Southwestern
CentralMOST GROWTH FASTEST GROWTH
Key Users of Industry Employment ProjectionsBusinesses, workforce and economic development professionals, researchers, and government use industry employment projections to identify business activities that are expected to contribute significantly and positively to an area’s economy. With such information, these stakeholders outline economic goals, strategies, and investments that can bolster the economy, ensure the future workforce can meet the demands of business, and ensure that business can provide meaningful and stable employment opportunities to area residents.
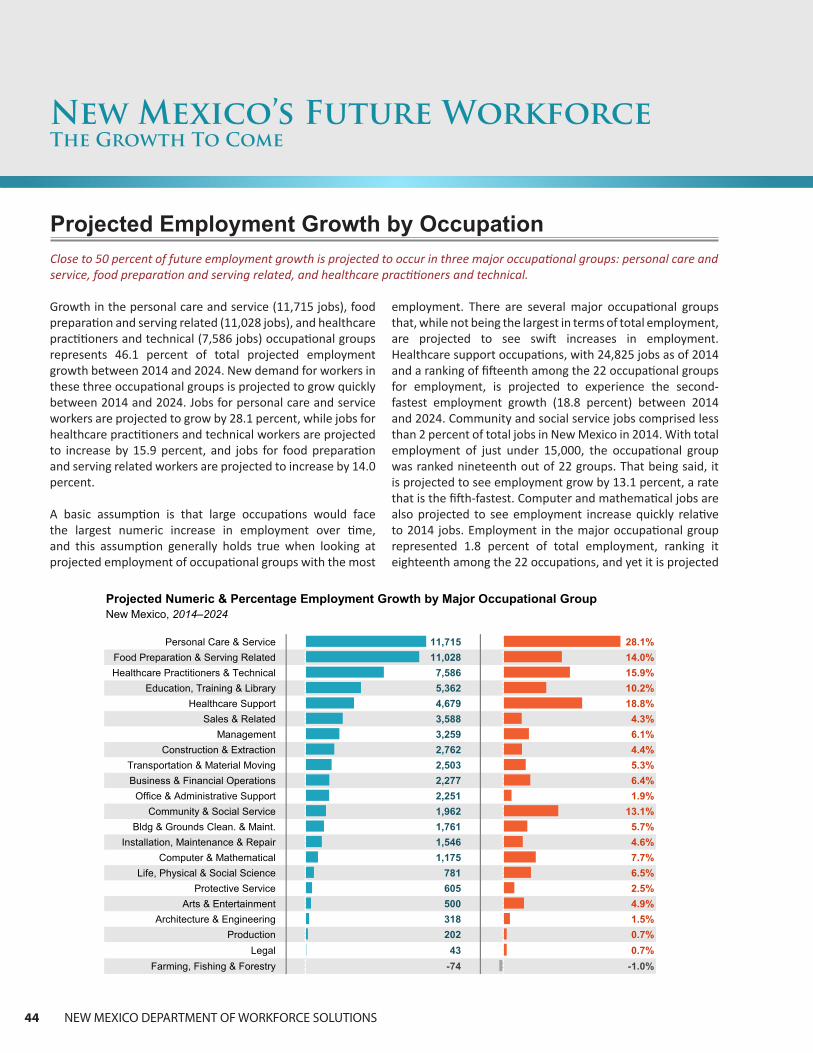
44 NEW MEXICO DEPARTMENT OF WORKFORCE SOLUTIONS
Growth in the personal care and service (11,715 jobs), food preparation and serving related (11,028 jobs), and healthcare practitioners and technical (7,586 jobs) occupational groups represents 46.1 percent of total projected employment growth between 2014 and 2024. New demand for workers in these three occupational groups is projected to grow quickly between 2014 and 2024. Jobs for personal care and service workers are projected to grow by 28.1 percent, while jobs for healthcare practitioners and technical workers are projected to increase by 15.9 percent, and jobs for food preparation and serving related workers are projected to increase by 14.0 percent
A basic assumption is that large occupations would face the largest numeric increase in employment over time, and this assumption generally holds true when looking at projected employment of occupational groups with the most
employment. There are several major occupational groups that, while not being the largest in terms of total employment, are projected to see swift increases in employment. Healthcare support occupations, with 24,825 jobs as of 2014 and a ranking of fifteenth among the 22 occupational groups for employment, is projected to experience the second-fastest employment growth (18.8 percent) between 2014 and 2024. Community and social service jobs comprised less than 2 percent of total jobs in New Mexico in 2014. With total employment of just under 15,000, the occupational group was ranked nineteenth out of 22 groups. That being said, it is projected to see employment grow by 13.1 percent, a rate that is the fifth-fastest. Computer and mathematical jobs are also projected to see employment increase quickly relative to 2014 jobs. Employment in the major occupational group represented 1.8 percent of total employment, ranking it eighteenth among the 22 occupations, and yet it is projected
Projected Employment Growth by OccupationClose to 50 percent of future employment growth is projected to occur in three major occupational groups: personal care and service, food preparation and serving related, and healthcare practitioners and technical.
New Mexico’s Future WorkforceThe Growth To Come
Projected Numeric & Percentage Employment Growth by Major Occupational GroupNew Mexico, 2014–2024
Personal Care & Service 11,715 28.1%Food Preparation & Serving Related 11,028 14.0%Healthcare Practitioners & Technical 7,586 15.9%
Education, Training & Library 5,362 10.2%Healthcare Support 4,679 18.8%
Sales & Related 3,588 4.3%Management 3,259 6.1%
Construction & Extraction 2,762 4.4%Transportation & Material Moving 2,503 5.3%Business & Financial Operations 2,277 6.4%
Office & Administrative Support 2,251 1.9%Community & Social Service 1,962 13.1%
Bldg & Grounds Clean. & Maint. 1,761 5.7%Installation, Maintenance & Repair 1,546 4.6%
Computer & Mathematical 1,175 7.7%Life, Physical & Social Science 781 6.5%
Protective Service 605 2.5%Arts & Entertainment 500 4.9%
Architecture & Engineering 318 1.5%Production 202 0.7%
Legal 43 0.7%Farming, Fishing & Forestry -74 -1.0%
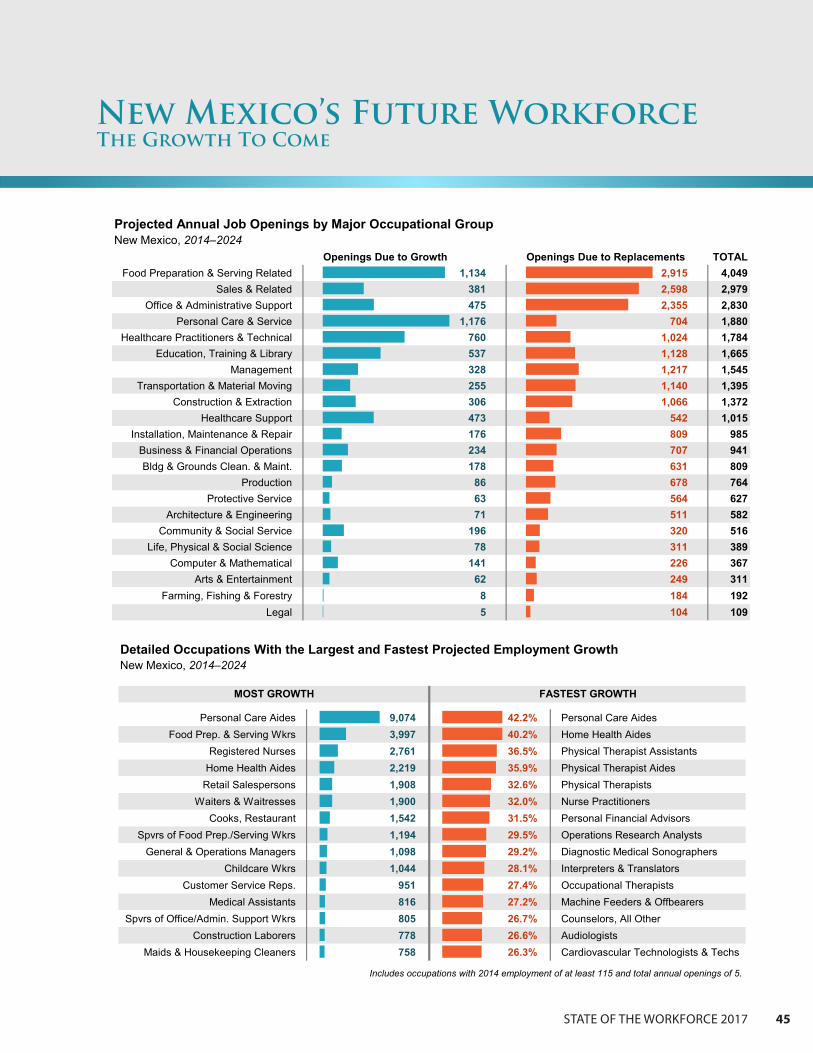
STATE OF THE WORKFORCE 2017 45
New Mexico’s Future WorkforceThe Growth To Come
Projected Annual Job Openings by Major Occupational GroupNew Mexico, 2014–2024
Openings Due to Growth Openings Due to Replacements TOTALFood Preparation & Serving Related 1,134 2,915 4,049
Sales & Related 381 2,598 2,979Office & Administrative Support 475 2,355 2,830
Personal Care & Service 1,176 704 1,880Healthcare Practitioners & Technical 760 1,024 1,784
Education, Training & Library 537 1,128 1,665Management 328 1,217 1,545
Transportation & Material Moving 255 1,140 1,395Construction & Extraction 306 1,066 1,372
Healthcare Support 473 542 1,015Installation, Maintenance & Repair 176 809 985
Business & Financial Operations 234 707 941Bldg & Grounds Clean. & Maint. 178 631 809
Production 86 678 764Protective Service 63 564 627
Architecture & Engineering 71 511 582Community & Social Service 196 320 516
Life, Physical & Social Science 78 311 389Computer & Mathematical 141 226 367
Arts & Entertainment 62 249 311Farming, Fishing & Forestry 8 184 192
Legal 5 104 109
Detailed Occupations With the Largest and Fastest Projected Employment GrowthNew Mexico, 2014–2024
Personal Care Aides 9,074 42.2% Personal Care AidesFood Prep. & Serving Wkrs 3,997 40.2% Home Health Aides
Registered Nurses 2,761 36.5% Physical Therapist AssistantsHome Health Aides 2,219 35.9% Physical Therapist Aides
Retail Salespersons 1,908 32.6% Physical TherapistsWaiters & Waitresses 1,900 32.0% Nurse Practitioners
Cooks, Restaurant 1,542 31.5% Personal Financial AdvisorsSpvrs of Food Prep./Serving Wkrs 1,194 29.5% Operations Research Analysts
General & Operations Managers 1,098 29.2% Diagnostic Medical SonographersChildcare Wkrs 1,044 28.1% Interpreters & Translators
Customer Service Reps. 951 27.4% Occupational TherapistsMedical Assistants 816 27.2% Machine Feeders & Offbearers
Spvrs of Office/Admin. Support Wkrs 805 26.7% Counselors, All OtherConstruction Laborers 778 26.6% Audiologists
Maids & Housekeeping Cleaners 758 26.3% Cardiovascular Technologists & Techs
Includes occupations with 2014 employment of at least 115 and total annual openings of 5.
MOST GROWTH FASTEST GROWTH

46 NEW MEXICO DEPARTMENT OF WORKFORCE SOLUTIONS
New Mexico’s Future WorkforceThe Growth To Come
to see employment increase by 7.7 percent.
Occupational projections data measure projected annual job openings in addition to numeric and percentage growth. Openings data take into account job openings from new positions as well as openings that come from the need to replace workers leaving an occupation.
The food preparation and serving related occupational group is projected to provide the largest number of annual job openings (4,049) between 2014 and 2024, followed by the sales and related, office and administrative support, and personal care and service groups. Many of the occupational groups with the largest number of projected openings also tend to have high turnover rates (e.g., sales and related, food preparation and serving related, and office and administrative support occupations). These high-turnover groups are projected to see a large number of job openings from replacements, which usually leads to a wide margin of difference between projected numeric employment growth and projected annual openings. Many occupations within these groups also typically require less education and experience. Personal care and service is the only occupational group that is projected to have more new job openings than replacement openings. Nearly 63 percent of future annual openings are projected to be new.
As the personal care and service major occupational group is projected to see the most growth, it’s unsurprising that two specific occupations within that group—personal care aides, with an employment increase of 9,074, and childcare workers, with an increase of 1,044—are among the top 15 specific occupations projected to grow the most numerically and in percentage. Four specific occupations within the
food preparation and serving related occupational group are within the top 15: combined food preparation and serving workers, including fast food; waiters and waitresses; restaurant cooks; and supervisors of food preparation and serving workers. Employment growth in these occupations is projected to exceed 8,600 when combined. In general, of the specific occupations that are projected to grow the most between 2014 and 2024, nine are also projected to see employment grow quickly (10 percent or more), pointing towards measurable new demand for workers, not just demand stemming from the replacement of workers. These occupations are led by personal care aides (42.2 percent growth) and home health aides (40.2 percent growth).
Nine specific health care occupations projected to experience the largest numeric growth between 2014 and 2024 are also among the top 15 occupations projected to experience the fastest employment growth. While several of these occupations, among a few others on the list, aren’t projected to provide a comparatively large number of future job openings, the demand for workers in these occupations is anticipated to become increasingly strong.
Just over 50 occupations are projected to see no change in employment between 2014 and 2024, while 171 occupations are projected to shrink over the period. The number of bookkeeping, accounting, and auditing clerks is projected to fall the most, by 897 jobs, or 8.4 percent. The number of telephone operators is projected to shrink by 23 jobs statewide, but this translates to a 43.4 percent decline in the occupation. Switchboard operators, with a projected drop in employment of 35.6 percent, is the only occupation on the list that is projected to see significant numeric and percentage losses.
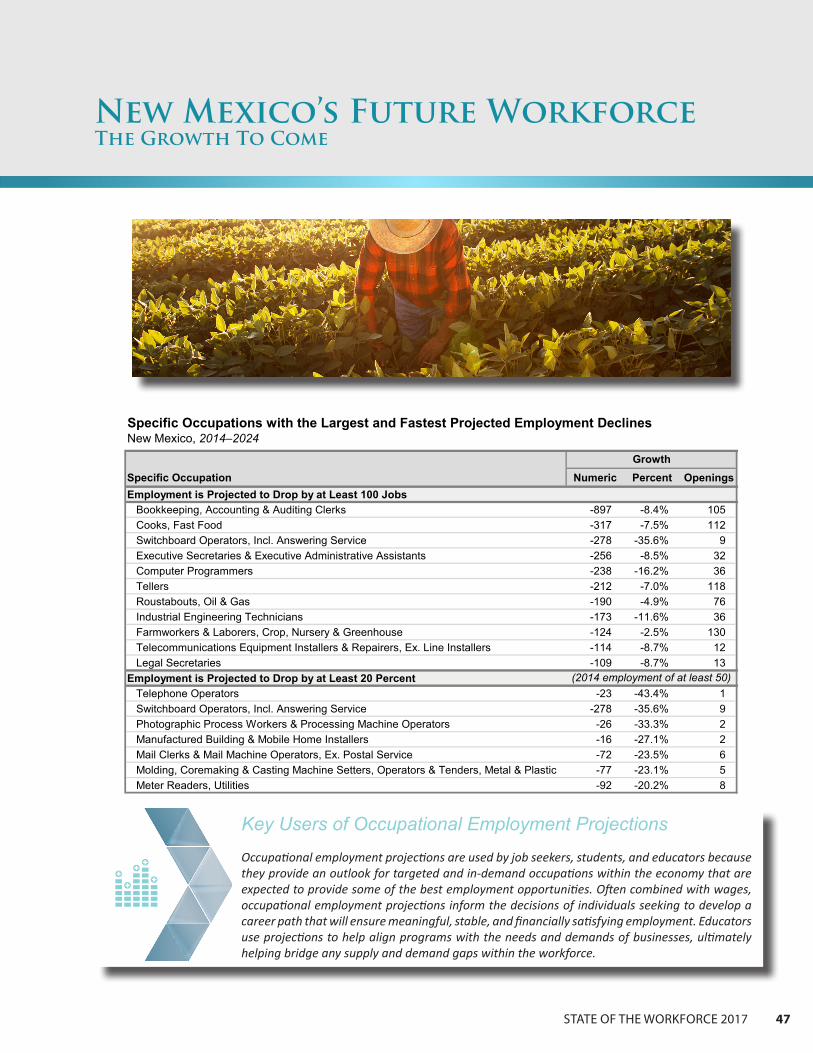
STATE OF THE WORKFORCE 2017 47
Key Users of Occupational Employment Projections
Occupational employment projections are used by job seekers, students, and educators because they provide an outlook for targeted and in-demand occupations within the economy that are expected to provide some of the best employment opportunities. Often combined with wages, occupational employment projections inform the decisions of individuals seeking to develop a career path that will ensure meaningful, stable, and financially satisfying employment. Educators use projections to help align programs with the needs and demands of businesses, ultimately helping bridge any supply and demand gaps within the workforce.
New Mexico’s Future WorkforceThe Growth To Come
New Mexico, 2014–2024
Specific Occupation Numeric Percent OpeningsEmployment is Projected to Drop by at Least 100 Jobs
Bookkeeping, Accounting & Auditing Clerks -897 -8.4% 105Cooks, Fast Food -317 -7.5% 112Switchboard Operators, Incl. Answering Service -278 -35.6% 9Executive Secretaries & Executive Administrative Assistants -256 -8.5% 32Computer Programmers -238 -16.2% 36Tellers -212 -7.0% 118Roustabouts, Oil & Gas -190 -4.9% 76Industrial Engineering Technicians -173 -11.6% 36Farmworkers & Laborers, Crop, Nursery & Greenhouse -124 -2.5% 130Telecommunications Equipment Installers & Repairers, Ex. Line Installers -114 -8.7% 12Legal Secretaries -109 -8.7% 13
Employment is Projected to Drop by at Least 20 PercentTelephone Operators -23 -43.4% 1Switchboard Operators, Incl. Answering Service -278 -35.6% 9Photographic Process Workers & Processing Machine Operators -26 -33.3% 2Manufactured Building & Mobile Home Installers -16 -27.1% 2Mail Clerks & Mail Machine Operators, Ex. Postal Service -72 -23.5% 6Molding, Coremaking & Casting Machine Setters, Operators & Tenders, Metal & Plastic -77 -23.1% 5Meter Readers, Utilities -92 -20.2% 8
(2014 employment of at least 50)
Growth
Specific Occupations with the Largest and Fastest Projected Employment Declines

New Mexico Department of Workforce SolutionsP.O. Box 1928
Albuquerque, NM 87103www.dws.state.nm.us
This workforce product was funded by a grant awarded by the U.S. Department of Labor’s Employment and Training Administration. The product was created by the recipient and does not necessarily reflect the official position of the U.S. Department of Labor. The Department of Labor makes no guarantees, warranties, or assurances of any kind, express or implied, with respect to such information, including any information on linked sites and including, but not limited to, accuracy of the information or its completeness, timeliness, usefulness, adequacy, continued availability, or ownership. This product is copyrighted by the institution that created it. Internal use by an organization and/or personal use by an individual for non-commercial purposes is permissible. All other uses require the prior authorization of the copyright owner.