new methods and advanced analytics at the bank of...
TRANSCRIPT

New methods and advanced analytics at the Bank of England
James Brookes, Andreas Joseph, Eryk Walczak*
Advanced Analytics Division
8th ESRC Research Methods Festival 2018, University of Bath, 3 July 2018
*Disclaimer: Our views do not necessarily reflect those of the Bank of England (BoE) or any of its committees.

Outline
1. The Bank of England and Advanced Analytics (I)
2. Machine learning in a central banking context (I)
3. Sending firm messages: Text mining PSM letters (II)
4. Enhancing central bank communications with behavioural insights (III)
Every session (I - III) is 20min + 10min Q&A.
2

Bank of England (BoE)
• Banknotes (e.g. new polymer notes)
• Monetary policy (e.g. interest rates, QE)
• Financial Stability (e.g. stress testing)
• Gold storage (“the vault”)
• Markets (MP implementation)
• Payment & Settlement (e.g. CHAPS)
• Prudential regulation (e.g. banking
supervision)
• Research (e.g. SWPs, conferences, Bank
Underground)
• Statistics
“Promoting the good of the people of the United Kingdom
by maintaining monetary and financial stability.”
Advanced Analytics (AA) connects to most of these tasks.
3

The “AA Team’s” interlocking tasks
• Analytics
• Research
• Outreach
• Technology
AA is kind of an “internal consultancy”
mostly collaborating with other parts of the institution.
4

Machine learning in a central banking context*
Chiranjit Chakraborty & Andreas Joseph
* SWP 674: “Machine learning at central banks” (2017), BU post “New machines for the old lady” (2017).

Introduction to machine learning (ML) *
“Econometrics from computer scientists”
Models as universal approximators (non-parametric non-linearities)
Focus on prediction (correlation, not causation)
Few asymptotic results (research needed!) **
General policy problem includes a prediction component ***
* “Economists are prone to fads, and the latest is machine learning”, The Economist, 26. Nov 2016
** “Why does deep and cheap learning work so well?”, Lin and Tegmark, arXiv:1608.08225, 2016
*** “Prediction policy problems”, Kleinberg et al, AER 105(5):491-95, 2015.
6

ML modelling protocol (simplified) 1. Fit model on training
data.
2. Set hyper-parameters
(𝜆) by testing model on
new data (cross-
validation)
3. Final model test via out-
of-sample testing (no
asymptotics)
𝛃 𝛌 Gold standard
out-of-sample testing
7

General policy problem***
*** “Prediction policy problems”, Kleinberg et al, AER 105(5):491-95, 2015.
𝜋: payoff/welfare, 𝑋: policy variable, 𝑌: outcome, 𝑍: controls
Examples:
𝑋: umbrella, 𝑌: weather, 𝜋: wellbeing
𝑋: bank capital buffers, 𝑌: growth , 𝜋: welfare
8

Potential central banking applications of ML
1. Non/semi-structural modelling (e.g. forecasting)
2. Operational process optimisation (e.g. supervision, conduct)
3. Pattern recognition in large datasets (e.g. variable extraction)
4. Policy analysis (e.g. payoff evaluations, often microeconomic issues)
5. Dynamic policy simulation (e.g. dynamically learning agents; similar to
DeepMind’s Mastering the game of Go (2016))
9
SWP case studies
1. Banking supervision: prudential regulation, financial stability
2. Inflation forecasting: monetary policy
3. Investigating Fintech funding structures: financial stability
10
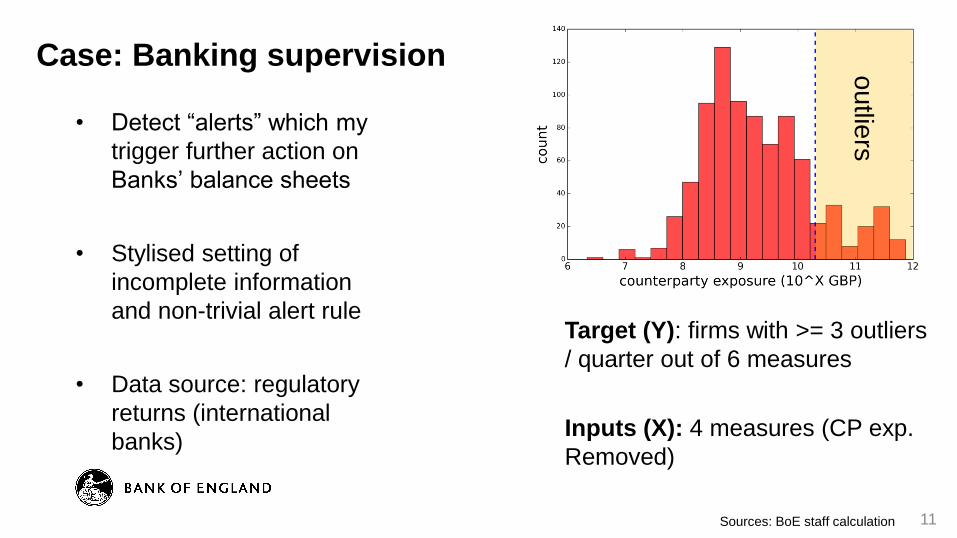
Case: Banking supervision
Sources: BoE staff calculation
• Detect “alerts” which my
trigger further action on
Banks’ balance sheets
• Stylised setting of
incomplete information
and non-trivial alert rule
• Data source: regulatory
returns (international
banks)
outlie
rs
Target (Y): firms with >= 3 outliers
/ quarter out of 6 measures
Inputs (X): 4 measures (CP exp.
Removed)
11

Sources: BoE staff calculation
Data
Su
mm
ary
12

Model Comparison
Sources: BoE staff calculation 13

Conditional predictions & feature importance
Sources: BoE staff calculation
Tree models allows to calculate feature
importance: error reduction across tree
branches due to each variable
14

Thanks – Q&A
15
Sending firm messages: Text mining PSM letters*
David Bholat, James Brookes, Chris Cai, Katy Grundy and Jakob Lund
*SWP 688: “Sending firm messages: text mining letters from PRA supervisors to banks and building societies they regulate”
(2017), BU post “Open letters: Laying bare linguistic patterns in PRA messages using machine learning” (2018)

17

Primary research question and hypotheses
Are PSM letters written differently to firms with different risk profiles?
• If so, what linguistic features distinguish sub-genres of PSM
letters?
We expected PSM letters to vary depending on firm riskiness
• consistent with the PRA’s principle of proportionality
We expected higher risk firms to receive letters that were:
• more complex
• more negative in sentiment
• more directive
18

‘Intrinsic risk’ = Potential Impact = Firm Category
Category 1 Most significant deposit-takers capable of very significant disruption
Category 2 Significant deposit-takers capable of some disruption
Category 3 Deposit-takers capable of minor disruption
Category 4 Deposit-takers capable of very little disruption
Category 5 Deposit-takers capable of almost no disruption
Increasing
risk
19

‘Imminent risk’ = PIF stage = proximity to resolution
Stage 1 Low risk to viability of firm
Stage 2 Moderate risk to viability of firm
Stage 3 Risk to viability absent action by the firm
Stage 4 Imminent risk to viability of firm
Stage 5 Firms in resolution or being actively wound up
Increasing
risk
20

Secondary research question and hypotheses
Has supervisory communication measurably changed post-crisis?
• If so, how do PRA PSM letters differ from FSA ARROW letters?
Compared to the ARROW letters, we expected the PSM letters to be:
• more complex
• more directive
• more forward-looking
21
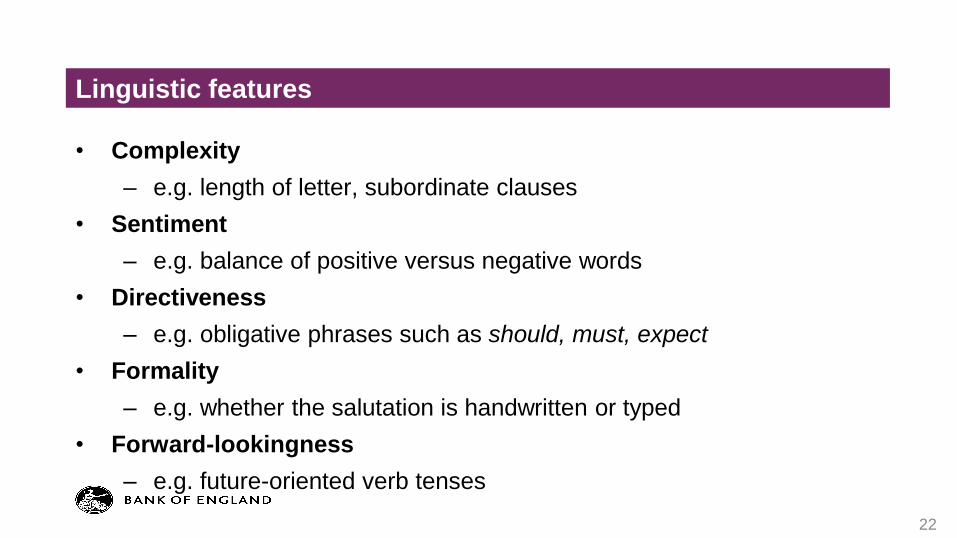
Linguistic features
• Complexity
– e.g. length of letter, subordinate clauses
• Sentiment
– e.g. balance of positive versus negative words
• Directiveness
– e.g. obligative phrases such as should, must, expect
• Formality
– e.g. whether the salutation is handwritten or typed
• Forward-lookingness
– e.g. future-oriented verb tenses
22

Random Forests
1. Category 1 vs. Category 2-4
2. PIF 1-2 vs. PIF 3-4
3. PSM letter vs. ARROW letter
~ 25 linguistic features
23
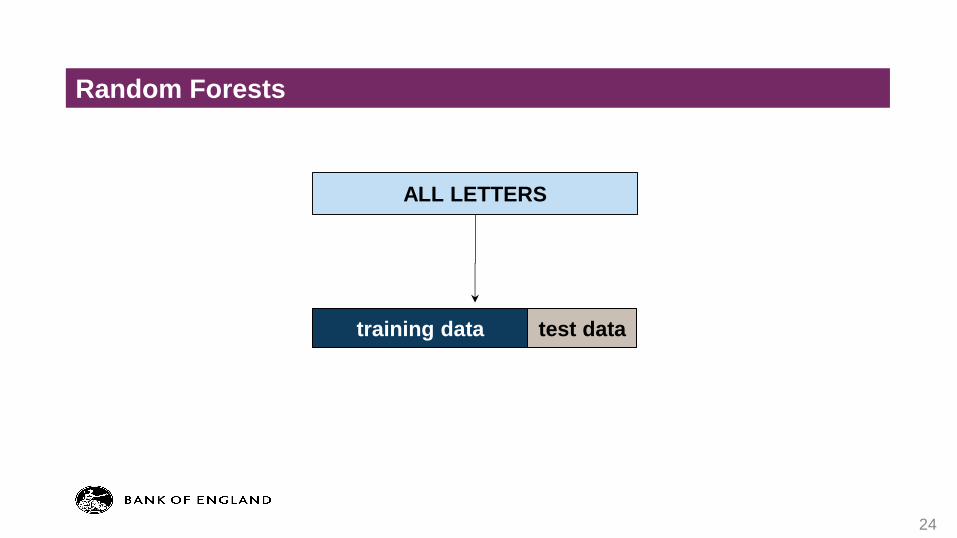
Random Forests
ALL LETTERS
training data test data
24

letters with handwritten salutation letters with typed salutation
CAT 1
CAT2-4
CAT 1
CAT2-4
< 1% ‘risky’ vocab > 1% ‘risky’ vocab
CAT 1
CAT2-4
CAT 1
CAT2-4
training data
25

ALL LETTERS
training test training test training test training test training test …
1 2 3 4 2000
26

CAT 1 PSM letters different from CAT 2-4 letters
• More complex
• Less directive
• Less formal
• No differences in sentiment
27

1 2-4
-0.1
0-0
.05
0.00
0.05
0.10
Sentiment with financial context - Year 2015
Category
Sen
timen
t sco
re
28

PIF 3-4 PSM letters different from PIF 1-2 letters
• More complex
• More ‘high-risk’ vocabulary
• Less directive
• Less formal
29

PSM letters different from ARROW letters linguistically
• More complex
• More directive
• More forward-looking
30

PSM letters different from ARROW letters in content
9.3
0.9
0.9
1.2
1.2
1.2
1.2
1.5
1.9
1.9
3.1
3.4
4.6
5.6
8.6
9.3
9.6
9.9
10.8
13.9
Other non-generic headings
Basis Risk
People Risk
Internal Audit
Internal Models
Management Information
Supervisory Strategy
CEO and Executives
Authorisations
Risk Appetite
IT and Operational Risk
Relationship with regulators
Credit Risk and Lending
Treasury and Asset Liability Management
Business Model and Strategy
Recovery and Resolution Planning
Board Management and Governance
Liquidity
Risk Management and Controls
Capital Adequacy
0 5 10 15 20
Percent
Sec
tion
head
ing
Others
Common to both ARROW & PSM
Unique
Normalized frequency (%) of PSM 2015 section headings
31

Summary
• Are PSM letters written differently to firms with different risk
profiles?
Yes
• Has supervisory communication measurably changed post-crisis?
Yes
32

Thanks – Q&A
33

Enhancing central bank communications
with behavioural insights*
David Bholat,(1) Nida Broughton,(2) Alice Parker,(1) Janna Ter Meer(2) and Eryk Walczak(1)
(1)Bank of England - Advanced Analytics
(2)Behavioural Insights Team
*forthcoming SWP

Central bank communications matter
• Good communication is powerful for central banks because it
improves the effectiveness of our policies e.g. anchoring inflation
expectations
• Good communication could potentially:
- build awareness of what the Bank of England does and why
- increase interaction and engagement with the content
- enhance public trust and understanding
35

The Bank of England’s Vision 2020 strategy
36

• Measure the extent to which the Visual Summary improved
public comprehension and trust in key messages from the Bank’s
Inflation Report compared to the Monetary Policy Summary
• Our experiment also tested two new versions – one version with
Reduced Text and one that restructures the information and
uses Relatable content
Research Objectives
37

Monetary Policy Summary
38

Visual
Summary
Reduced Text
Summary
39

Relatable Summary
40

Treatments
Word count Flesch-Kincaid grade
level
Number of Visuals
(charts / icons)
Monetary Policy
Summary 879 15.26 0
Visual Summary 1069 7.34 14
Reduced Text Summary 535 6.18 14
Relatable Summary 407 4.98 9
Word count, readability and visual of different arms of the experiment
41

Contributions
• Central bank communication literature and Vision 2020
Identify new strategies for external communication
Expand literature on central bank communications
Expand the Bank’s methodological range
• Behavioural economics literature
From micro to macro decision-making
Central banks
Contributions
42

Representative sample (2275 respondents) of UK population based on
gender, age, income and regional location,
assigned to one of the four groups
43

1. In what way does the Bank of England support the UK economy?
2. Based on what you have read, which of these is true about prices at the
moment?
3. Based on what you have read, what has happened to the amount of people
that are out of work recently?
4. Based on what you have read, what is likely to happen to how much people
can afford to buy this year?
5. What is the Bank of England’s current interest rate?
Direct Comprehension questions
44

Contributions
Model specification
𝑌𝑖𝑐𝑜𝑚𝑝= 𝛼 + 𝛽1𝑇1𝑖+ 𝛽2𝑇2𝑖+ 𝛽3𝑇3𝑖+𝛽4Γ𝐴𝑖+ 𝜀𝑖
•where 𝑌𝑖
𝑐𝑜𝑚𝑝 is treated as a continuous variable representing the number of correct answers to the comprehension questions for the
participant 𝑖
•𝑇1𝑖 is a binary variable which indicates the treatment for participant 𝑖 with a value of 1 if the participant is in the Visual Summary
condition and 0 otherwise
•𝑇2𝑖 is a binary variable which indicates the treatment for participant 𝑖 with a value of 1 if the participant is in the Reduced Text Summary
condition and 0 otherwise
•𝑇3𝑖 is a binary variable which indicates the treatment for participant 𝑖 with a value of 1 if the participant is in the Relatability Summary
condition and 0 otherwise
•Ai is a vector of controls indicating the gender, age bracket, income bracket, region, and economics engagement level of participant 𝑖
•𝛼 is the regression constant
• Γ is the coefficient of each control in Ai
•𝜀𝑖 is the error term
45

Results – Direct Comprehension
46

Groceries
Salary
Results – Applied Comprehension
“Your friend spends £100 a week on groceries.
They are planning their household finances for
next year, and are thinking about how much they
need to budget for groceries. They want to keep
buying the same things as they are now.
Based on what you have read, what do you think
they should budget for their weekly grocery shop
next year? What your friend spends each week
on groceries now: £ 100”
“Your friend earns £100 per day. They will have a
chance to ask for a pay rise at the end of this year
to cover increases in the cost of living.
Based on what you have read, how much should
they ask for, just to cover increases in the cost of
living? Your friend’s daily rate (what your friend
currently earns): £100 per day”
47

Results – Self-reported Comprehension
(Haldane & McMahon measure)
“To what extent are you able to understand the content
and messages of the material you just read?”
48

Results – Trust
“Imagine someone is looking for trustworthy information about the economy.
How would you rate the information on the website you have just seen?”
(0-10 point scale)
49
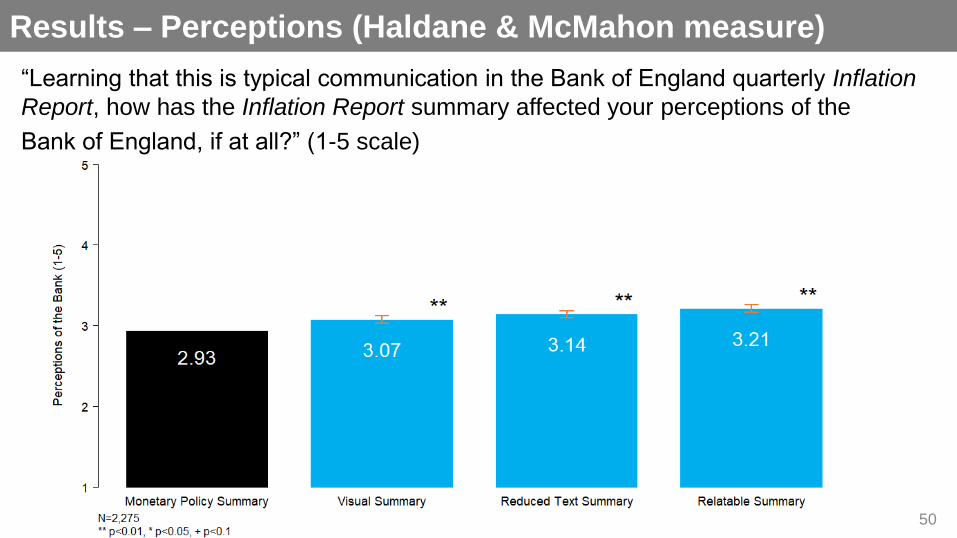
Results – Trust Results – Perceptions (Haldane & McMahon measure)
“Learning that this is typical communication in the Bank of England quarterly Inflation
Report, how has the Inflation Report summary affected your perceptions of the
Bank of England, if at all?” (1-5 scale)
50

Summary findings and implications
• The Visual Summary improves public comprehension
relative to the Monetary Policy Summary
• The Visual Summary could be made more relatable to
increase public comprehension and trust in the Bank’s
policy messages.
51

Future research
• Relatability
• Trust
• Behavioural biases
• Media sources
52

Thanks – Q&A
53