data analytics methods and techniques forschungskolleg
TRANSCRIPT

© Prof. Dr.-Ing. Wolfgang Lehner |
Data Analytics Methods and Techniques
Forschungskolleg
Martin Hahmann, Gunnar Schröder, Phillip Grosse

© Martin Hahmann | | 2
Why do we need it?
“We are drowning in data, but starving for knowledge!” John Naisbett
23 petabyte/second of raw data 1 petabyte/year
Data Analytics Methods and Techniques

© Martin Hahmann | | 3
Data Analytics
The Big Four
Data Analytics Methods and Techniques
Classification Association Rules
Prediction
23.11.
Clustering

© Martin Hahmann | | 4
Clustering
Clustering
automated grouping of objects into so called clusters objects of the same group are similar different groups are dissimilar
Problems
applicability versatility support for non-expert users
Data Analytics Methods and Techniques

© Martin Hahmann | | 5
Clustering Workflow
algorithm selection
algorithm setup
adjustment
result interpretation
Data Analytics Methods and Techniques
>500

© Martin Hahmann | | 6
Feedback Algorithmics
Clustering Workflow
algorithm selection adjustment
algorithm setup result interpretation
Which algorithm fits my data?
Which parameters fit my data?
How good is the obtained result?
How to improve result quality?
Data Analytics Methods and Techniques
© Martin Hahmann | | 7
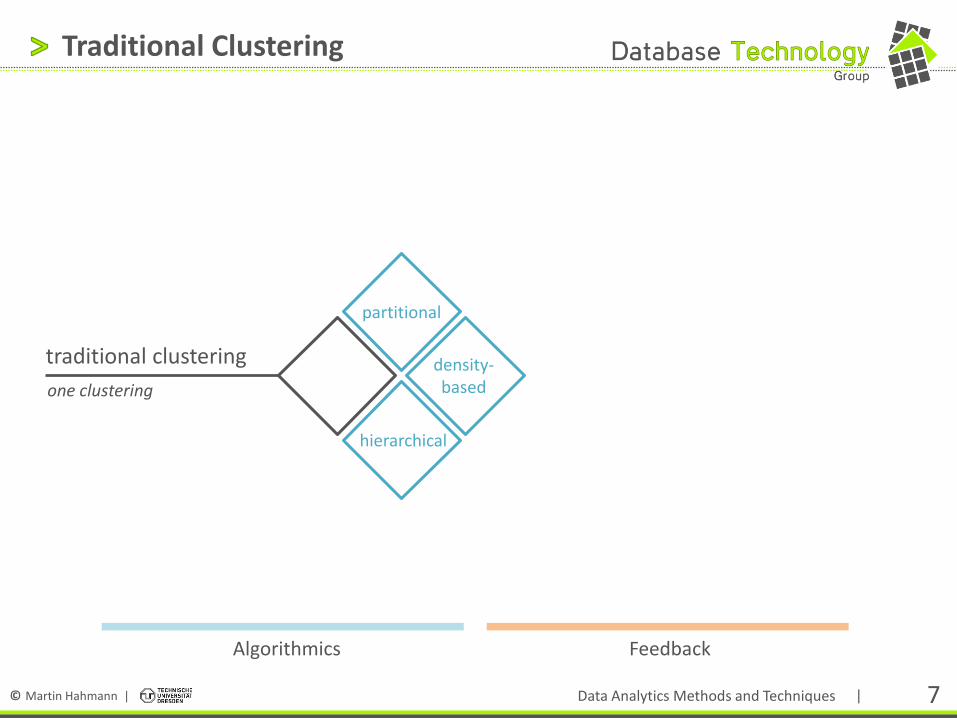
Traditional Clustering
one clustering
hierarchical
traditional clustering density- based
partitional
Algorithmics
Data Analytics Methods and Techniques
Feedback

© Martin Hahmann | | 8
Traditional Clustering
Partitional Clustering
clusters represented by prototypes objects are assigned to most similar prototype similarity via distance function
k-means[Lloyd, 1957]
partitions dataset into k disjoint subsets minimizes sum-of-squares criterion parameters: k, seed
Data Analytics Methods and Techniques

© Martin Hahmann | | 9
Traditional Clustering
Partitional Clustering
clusters represented by prototypes objects are assigned to most similar prototype similarity via distancefunction
k-means[Lloyd, 1957]
partitions dataset into k disjoint subsets minimizes sum-of-squares criterion parameters: k, seed
ISODATA[Ball & Hall, 1965]
adjusts number of clusters merges, splits, deletes according to thresholds 5 additional parameters
k=4
k=4
k=7
Data Analytics Methods and Techniques

© Martin Hahmann | | 10
Traditional Clustering
Partitional Clustering
clusters represented by prototypes objects are assigned to most similar prototype similarity via distancefunction
k-means[Lloyd, 1957]
partitions dataset into k disjoint subsets minimizes sum-of-squares criterion parameters: k, seed
ISODATA[Ball & Hall, 1965]
adjusts number of clusters merges, splits, deletes according to thresholds 5 additional parameters
k=7
k=7
Data Analytics Methods and Techniques

© Martin Hahmann | | 11
Traditional Clustering
Density-Based Clustering
clusters are modelled as dense areas separated by less dense areas density of an object = number of objects satisfying a similarity threshold
DBSCAN [Ester & Kriegel et al., 1996]
dense areas core objects object count in defined ε-neighbourhood connection via overlapping neighbourhood parameters: ε, minPts
DENCLUE[Hinneburg, 1998]
density via gaussian kernels cluster extraction by hill climbing
ε=1.0; minPts=5
Data Analytics Methods and Techniques

© Martin Hahmann | | 12
Traditional Clustering
Density-Based Clustering
clusters are modelled as dense areas separated by less dense areas density of an object = number of objects satisfying a similarity threshold
DBSCAN [Ester & Kriegel et al., 1996]
dense areas core objects object count in defined ε-neighbourhood connection via overlapping neighbourhood parameters: ε, minPts
DENCLUE[Hinneburg, 1998]
density via gaussian kernels cluster extraction by hill climbing
ε=0.5; minPts=5
Data Analytics Methods and Techniques

© Martin Hahmann | | 13
Traditional Clustering
Density-Based Clustering
clusters are modelled as dense areas separated by less dense areas density of an object = number of objects satisfying a similarity threshold
DBSCAN [Ester & Kriegel et al., 1996]
dense areas core objects object count in defined ε-neighbourhood connection via overlapping neighbourhood parameters: ε, minPts
DENCLUE[Hinneburg, 1998]
density via gaussian kernels cluster extraction by hill climbing
ε=0.5; minPts=20
Data Analytics Methods and Techniques
© Martin Hahmann | | 14
Traditional Clustering
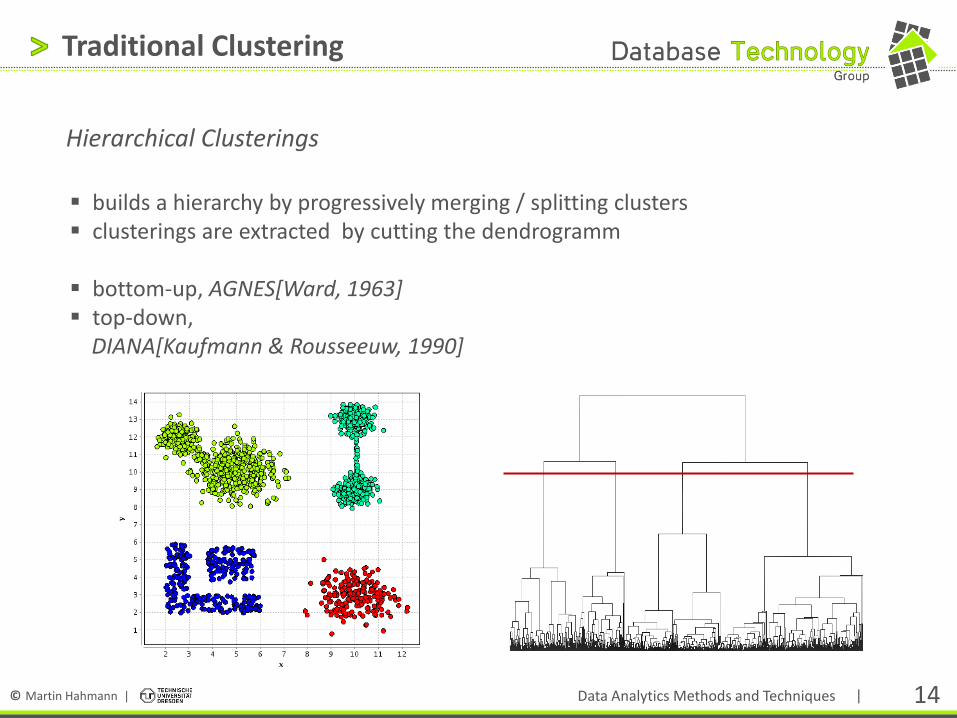
Hierarchical Clusterings
builds a hierarchy by progressively merging / splitting clusters clusterings are extracted by cutting the dendrogramm
bottom-up, AGNES[Ward, 1963] top-down, DIANA[Kaufmann & Rousseeuw, 1990]
Data Analytics Methods and Techniques

© Martin Hahmann | | 15
Multiple Clusterings
traditional clustering
multi-solution clustering
Algorithmics
ensemble clustering
multiple clusterings
Data Analytics Methods and Techniques
Feedback

© Martin Hahmann | | 16
Multi-Solution Clustering
traditional clustering
multi-solution clustering
multiple clusterings
subspace alternative
Algorithmics
Data Analytics Methods and Techniques
Feedback

© Martin Hahmann | | 17
Multi-Solution Clustering
Alternative Clustering
generate initial clustering with traditional algorithm utilize given knowledge to find alternative clusterings generate a dissimilar clustering
initial clustering alternative 1 alternative 2
Data Analytics Methods and Techniques

© Martin Hahmann | | 18
Multi-Solution Clustering
Alternative Clustering: COALA[Bae & Bailey, 2006]
generate alternative with same number of clusters high dissimilarity to initial clustering(cannot-link constraint) high quality alternative (objects in cluster still similar) trade-off between two goals controlled by parameter w if dquality< w*ddissimilarity choose quality else dissimilarity
CAMI[Dang & Bailey, 2010]
clusters as gaussian mixture quality by likelihood dissimilarity by mutual information
Orthogonal Clustering[Davidson & Qi, 2008]
iterative transformation of database use of constraints
Data Analytics Methods and Techniques

© Martin Hahmann | | 19
Multi-Solution Clustering
Subspace Clustering
high dimensional data clusters can be observed in arbitrary attribute combinations (subspaces) detect multiple clusterings in different subspaces
CLIQUE [Agarawal et al. 1998]
based on grid cells find dense cells in all subspaces
FIRES[Kriegel et al.,2005]
stepwise merge of base clusters (1D) max. dimensional subspace clusters
DENSEST[Müller et al.,2009]
estimation of dense subspaces correlation based (2D histograms)
Data Analytics Methods and Techniques
© Martin Hahmann | | 20
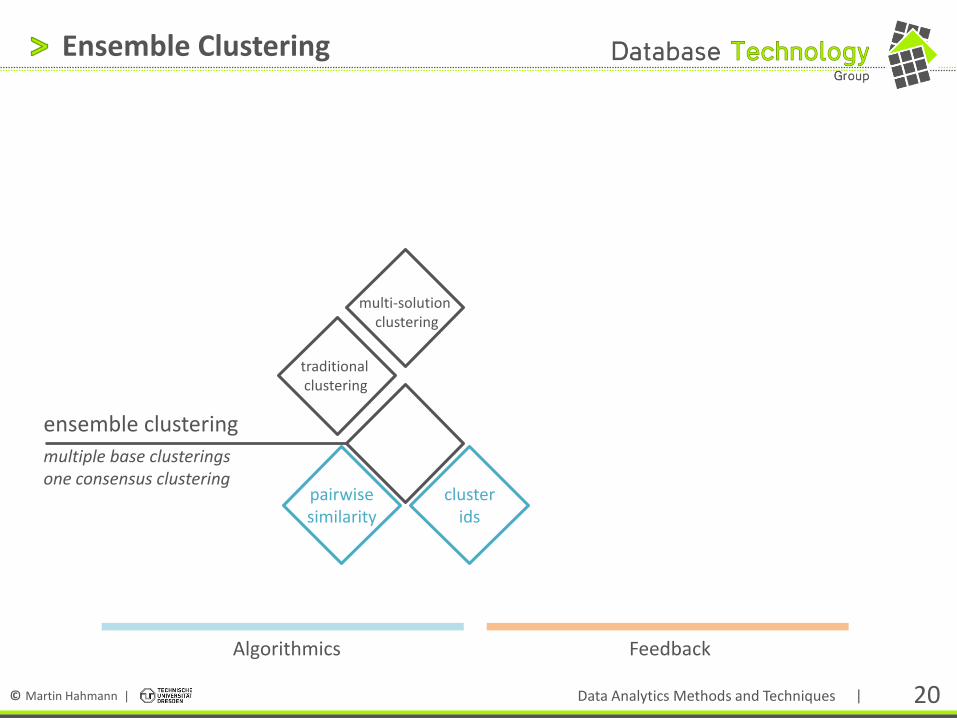
Ensemble Clustering
traditional clustering
multi-solution clustering
ensemble clustering
multiple base clusterings one consensus clustering
pairwise similarity
cluster ids
Algorithmics
Data Analytics Methods and Techniques
Feedback

© Martin Hahmann | | 21
Ensemble Clustering
General Idea
generate multiple traditional clusterings employ different algorithms / parameters ensemble combine ensemble to single robust consensus clustering
different consensus mechanisms [Strehl & Ghosh, 2002], [Gionis et al., 2007]
Data Analytics Methods and Techniques

© Martin Hahmann | | 22
Ensemble Clustering
Pairwise Similarity
a pair of objects belongs to: the same or different cluster(s) pairwise similarities represented as coassociation matrices
Data Analytics Methods and Techniques
x1 x2 x3 x4 x5 x6 x7 x8 x9
x1 - 1 1 0 0 0 0 0 0
x2 - - 1 0 0 0 0 0 0
x3 - - - 0 0 0 0 0 0
x4 - - - - 1 1 0 0 0
x5 - - - - - 1 0 0 0
x6 - - - - - - 0 0 0
x7 - - - - - - - 1 1
x8 - - - - - - - - 1
x9 - - - - - - - - -

© Martin Hahmann | | 23
Ensemble Clustering
Pairwise Similarity
a pair of objects belongs to: the same or different cluster(s) pairwise similarities represented as coassociation matrices
simple example based on [Gionis et al., 2007] goal: generate consensus clustering with maximal similarity to ensemble
Data Analytics Methods and Techniques
x1 x2 x3 x4 x5 x6 x7 x8 x9
x1 - 1 1 0 0 0 0 0 0
x2 - - 1 0 0 0 0 0 0
x3 - - - 0 0 0 0 0 0
x4 - - - - 1 0 0 0 0
x5 - - - - - 0 0 0 0
x6 - - - - - - 0 1 0
x7 - - - - - - - 0 1
x8 - - - - - - - - 0
x9 - - - - - - - - -
x1 x2 x3 x4 x5 x6 x7 x8 x9
x1 - 0 1 1 1 0 0 0 0
x2 - - 0 0 0 0 0 0 0
x3 - - - 1 1 0 0 0 0
x4 - - - - 1 0 0 0 0
x5 - - - - - 0 0 0 0
x6 - - - - - - 0 0 0
x7 - - - - - - - 1 1
x8 - - - - - - - - 1
x9 - - - - - - - - -
x1 x2 x3 x4 x5 x6 x7 x8 x9
x1 - 1 1 0 0 0 0 0 0
x2 - - 1 0 0 0 0 0 0
x3 - - - 0 0 0 0 0 0
x4 - - - - 1 0 1 0 1
x5 - - - - - 0 1 0 1
x6 - - - - - - 0 1 0
x7 - - - - - - - 0 1
x8 - - - - - - - - 0
x9 - - - - - - - - -
x1 x2 x3 x4 x5 x6 x7 x8 x9
x1 - 1 1 0 0 0 0 0 0
x2 - - 1 0 0 0 0 0 0
x3 - - - 0 0 0 0 0 0
x4 - - - - 1 1 0 0 0
x5 - - - - - 1 0 0 0
x6 - - - - - - 0 0 0
x7 - - - - - - - 1 1
x8 - - - - - - - - 1
x9 - - - - - - - - -
© Martin Hahmann | | 24
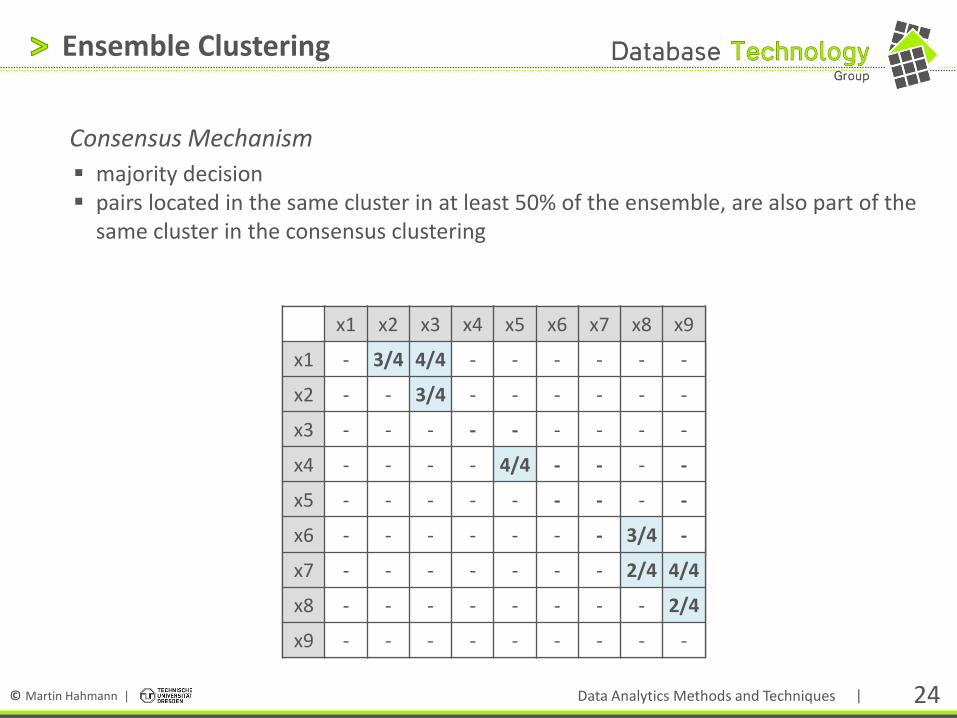
Ensemble Clustering
Consensus Mechanism
majority decision pairs located in the same cluster in at least 50% of the ensemble, are also part of the
same cluster in the consensus clustering
x1 x2 x3 x4 x5 x6 x7 x8 x9
x1 - 0 1 1 1 0 0 0 0
x2 - - 0 0 0 0 0 0 0
x3 - - - 1 1 0 0 0 0
x4 - - - - 1 0 0 0 0
x5 - - - - - 0 0 0 0
x6 - - - - - - 0 0 0
x7 - - - - - - - 1 1
x8 - - - - - - - - 1
x9 - - - - - - - - -
x1 x2 x3 x4 x5 x6 x7 x8 x9
x1 - 3/4 4/4 1/4 1/4 0 0 0 0
x2 - - 3/4 0 0 0 0 0 0
x3 - - - 1/4 1/4 0 0 0 0
x4 - - - - 4/4 1/4 1/4 0 1/4
x5 - - - - - 1/4 1/4 0 1/4
x6 - - - - - - 1/4 3/4 1/4
x7 - - - - - - - 2/4 4/4
x8 - - - - - - - - 2/4
x9 - - - - - - - - -
x1 x2 x3 x4 x5 x6 x7 x8 x9
x1 - 3/4 4/4 - - - - - -
x2 - - 3/4 - - - - - -
x3 - - - - - - - - -
x4 - - - - 4/4 - - - -
x5 - - - - - - - - -
x6 - - - - - - - 3/4 -
x7 - - - - - - - 2/4 4/4
x8 - - - - - - - - 2/4
x9 - - - - - - - - -
Data Analytics Methods and Techniques

© Martin Hahmann | | 25
Ensemble Clustering
Consensus Mechanism
majority decision pairs located in the same cluster in at least 50% of the ensemble, are also part of the
same cluster in the consensus clustering more consensus mechanisms exist e.g. graph partitioning via METIS [Karypis et al., 1997]
Data Analytics Methods and Techniques

© Martin Hahmann | | 26
Our Research Area
Algorithm Integration in databases
the R Project for Statistical Computing free software environment for statistical computing and graphics includes lots of standard math functions/libraries function- and object-oriented flexible/extensible
Data Analytics Methods and Techniques
Dipl.-Inf. Phillip Grosse [email protected]

© Martin Hahmann | | 27
Our Research Area
Vector: basic datastructure in R
> x <- 1 # vector of size 1 > x <- c(1,2,3) # vector of size 3 > x <- 1:10 # vector of size 10 > "abc" -> y # vector of size 1
Vector output
> x
[1] 1 2 3 4 5 6 7 8 9 10
> sprintf("y is %s", y)
[1] "y is abc"
Data Analytics Methods and Techniques

© Martin Hahmann | | 28
Our Research Area
Vector arithmetic
element-wise basic operators (+ - * / ^) > x <- c(1,2,3,4) > y <- c(2,3,4,5) > x*y [1] 2 6 12 20 vectorrecycling (short vectors) > y <- c(2,7) > x*y [1] 2 14 6 28 arithmetic functions log, exp, sin, cos, tan, sqrt, min, max, range, length, sum, prod, mean, var
Data Analytics Methods and Techniques

© Martin Hahmann | | 29
R as HANA operator (R-OP)
Data Analytics Methods and Techniques
Database
R Client
SHM Manager
SHM
R
RICE
SHM Manager
Rserve TCP/IP
6
1
4
write data
access data
3
7
fork R process
2
access data
write data
5
pass R Script
[Urbanek03]

© Martin Hahmann | | 30
R scripts in databases
Data Analytics Methods and Techniques
## Creates some dummy data CREATE INSERT ONLY COLUMN TABLE Test1(A INTEGER, B DOUBLE); INSERT INTO Test1 VALUES(0, 2.5); INSERT INTO Test1 VALUES(1, 1.5); INSERT INTO Test1 VALUES(2, 2.0); CREATE COLUMN TABLE "ResultTable" AS TABLE "TEST1" WITH NO DATA; ALTER TABLE "ResultTable" ADD ("C" DOUBLE); ## Creates an SQL-script function including the R script CREATE PROCEDURE ROP(IN input1 "Test1", OUT result "ResultTable" ) LANGUAGE RLANG AS BEGIN A <- input1$A ; B <- input1$B ; C <- A * B; result <- cbind(A, B, C) ; END; ## execute SQL-script function and retrieve result CALL ROP(Test1, "ResultTable"); SELECT * FROM "ResultTable";
R-Op
Dataset
calcModel
A B C
0 2.5 0.0
1 1.5 1.5
2 2.0 4.0

© Martin Hahmann | | 31
parallel R operators
Data Analytics Methods and Techniques
## call ROP in parallel DROP PROCEDURE testPartition1; CREATE PROCEDURE testPartition1 (OUT result "ResultTable") AS SQLSCRIPT BEGIN
input1 = select * from Test1; p = CE_PARTITION([@input1@],[],'''HASH 3 A'''); CALL ROP(@p$$input1@, r); s = CE_MERGE([@r@]); result = select * from @s$$r@;
END; CALL testPartition1(?);
R-Op R-Op R-Op
... ...
Split-Op
...
Merge
Dataset
calcModel

© Martin Hahmann | | 32
Result Interpretation
Algorithmics Feedback
result interpretation visualization traditional
clustering
multi-solution clustering
ensemble clustering
quality measures
Data Analytics Methods and Techniques

© Martin Hahmann | | 33
Result Interpretation
Quality measures
„How good is the obtained result?“ Problem: There is no universally valid definition of clustering quality multiple approaches and metrics
Rand index [Rand , 1971]
comparison to known solution
Dunns Index[Dunn, 1974]
ratio intercluster / intracluster distances higher score is better
Davis Bouldin Index[Davies & Bouldin, 1979]
ratio intercluster / intracluster distances lower score is better
Data Analytics Methods and Techniques

© Martin Hahmann | | 34
Result Interpretation
Visualization
use visual representations to evaluate clustering quality utilize perception capacity of humans result interpretation left to user subjective quality evaluation communicate information about structures data-driven visualize whole dataset
Data Analytics Methods and Techniques

© Martin Hahmann | | 35
Result Interpretation
Visualization: examples
all objects and dimensions are visualized scalability issues for large scale data display multiple dimensions on a 2D screen
scatterplot matrix parallel coordinates[Inselberg, 1985]
Data Analytics Methods and Techniques

© Martin Hahmann | | 36
Result Interpretation
Visualization: Heidi Matrix[Vadapali et al.,2009]
visualize clusters in high dimensional space show cluster overlap in subspaces pixel technique based on k-nearest neighbour relations pixel= object pair, color= subspace
Data Analytics Methods and Techniques

© Martin Hahmann | | 37
Feedback
Algorithmics Feedback
result interpretation visualization
quality measures
adjustment
Data Analytics Methods and Techniques
traditional clustering
multi-solution clustering
ensemble clustering
© Martin Hahmann | | 38
Feedback
Result adjustment
best practise: adjustment via re-parameterization or algorithm swap to infer modifications from result interpretation adjust low-level parameters only indirect
Clustering with interactive Feedback [Balcan & Blum, 2008]
theoretical proof of concept user adjustsments via high-level feedback: split and merge limitations: 1d data, target solution available to the user
Data Analytics Methods and Techniques
© Martin Hahmann | | 39
Our Research Area
Data Analytics Methods and Techniques
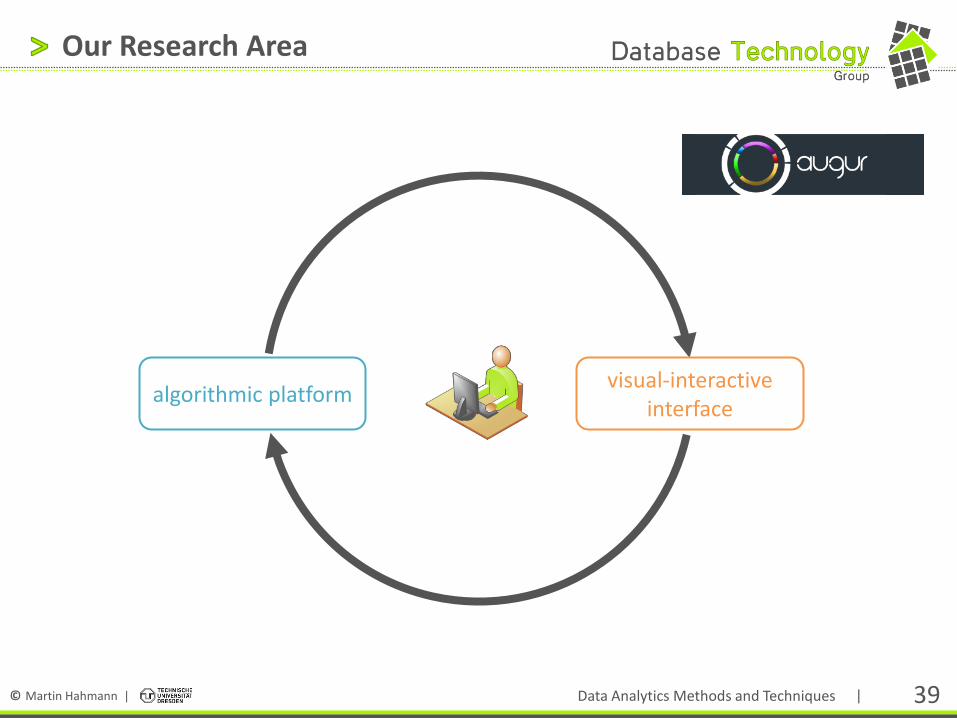
algorithmic platform visual-interactive
interface

© Martin Hahmann | | 40
Augur
Generalized Process
based on Shneidermann information seeking mantra Visualization, Interaction, algorithmic platform based on multiple clustering solutions
Data Analytics Methods and Techniques

© Martin Hahmann | | 41
Our Research Area
A complex use-case scenario
self-optimising recommender systems
Data Analytics Methods and Techniques
Dipl.-Inf. Gunnar Schröder [email protected]
© Martin Hahmann | | 42
Our Research Area
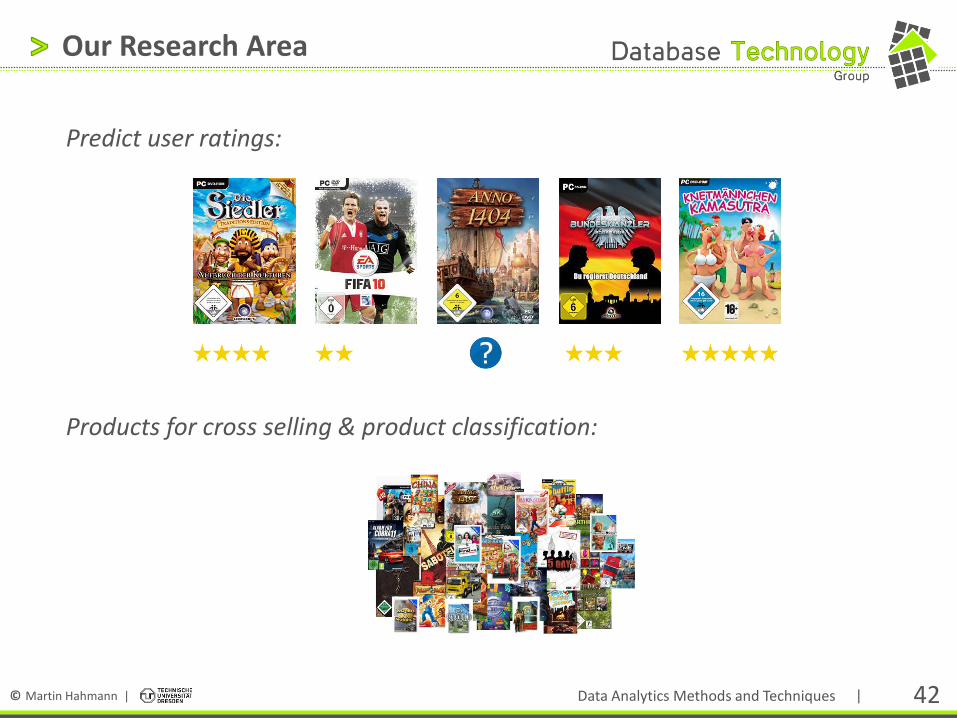
Predict user ratings:
Products for cross selling & product classification:
Data Analytics Methods and Techniques

© Martin Hahmann | | 43
Our Research Area
Similar items & similar users
Data Analytics Methods and Techniques

© Martin Hahmann | | 44
Challenges
Huge amounts of data
building recommender models is expensive!
Dynamic
models age user preferences change new users & items
Parameterization
data and domain dependent support automatic model maintenance
Data Analytics Methods and Techniques
Personalize User-Interface
Monitor User Actions
Evaluate Model
Optimize Model Parameters
(Re-)Build Model
Calculate Recommendations
© Martin Hahmann | | 45
>
Questions?
Data Analytics Methods and Techniques