new jersey nonprofits 2017: trends ... - center for nonprofits · 4 background and methodology the...
TRANSCRIPT

NEW JERSEY
NON-PROFITS 2017
Trends and Outlook
April 2017 A publication of www.njnonprofits.org
Generously supported by
2
New Jersey Non-Profits 2017 Trends and Outlook
Executive Summary
This report is the latest in a series of annual surveys designed to gauge trends, experiences and expectations among
New Jersey non-profit organizations, and to explore the effects of the economy on New Jersey’s charitable
community. The Center for Non-Profits conducted this year’s survey online in mid-March 2017 to assess how non-
profits fared in 2016 and to determine their outlook for the coming year. This analysis is based on the 301
responses from 501(c)(3) organizations submitted during the survey period.
Among the key findings:
• Continuing, Rising Demand: Three-fourths (75%) of responding organizations reported that demand for
services had increased during the past year, and a similar proportion (76%) expected demand to continue
rising in 2017.
• Funding Gap:
o Two-fifths (40%) reported receiving more total funding in 2016 vs. 2015, but more than half (51%)
reported that their expenses were higher than in the previous year, and 29% indicated that expenses had
exceeded support and revenue during their most recently completed fiscal year.
o Nearly two-thirds (64%) expected their total expenses to increase in 2017, but only 50% expected total
2017 funding to increase. About one-third (31%) expected total funding to remain the same as 2016, and
14% anticipated a decrease. Only a small percentage predicted decreased funding from a particular type of
funder, but in most categories projections of flat funding were at least as prevalent as expected increases.
Respondents were most optimistic about donations from individuals and most uncertain about funding
from government.
• Actions Taken: Organizations continued to seek additional resources such as funding and volunteers to
support their work. New partnerships or collaborations had been launched or were under consideration by a
sizeable percentage of respondents. Efforts to increase organizational advocacy and recruit new volunteers
were also frequently reported. While significant numbers reported that program and staff additions might
occur in 2017 (40% and 33% respectively), far fewer indicated that these actions would definitely occur or had
already happened. At the same time, program or staff cuts were under consideration by 27% and 22% of
respondents – an indicator of the significant uncertainty of the current economic and funding landscape.
• Partnerships and Collaborations: Consistent with previous surveys, half of respondents (51%) reported
launching new partnerships or collaborations, most commonly with other non-profit organizations, although
partnerships with government and business were also reported. Thirteen percent said that they might, or
definitely would, explore a merger in 2017 and 5% said that they definitely would or might complete one.
• Challenges Faced by Individual Organizations: Asked to identify the issues presenting the greatest
challenges to the viability of their own organizations, non-profits most frequently mentioned:
o financial uncertainty (60%)
o the need for better branding/communications (50%)
o the need for a stronger board (44%)
o the inability to afford enough good staff (33%)
o increased demand for program services (32%)
o increased benefits/insurance costs (31%)

3
• Non-Profit Sector Issues: Similar to prior surveys, issues related to infrastructure, governance and funding
dominated the concerns about the non-profit community overall. Regarding the issues most important to
maintaining and improving the viability of the non-profit sector in the coming decade, non-profits most
frequently selected:
o foundation/corporate funding (54%)
o non-profit infrastructure/capacity building (51%)
o attracting/retaining capable, committed board members (51%)
o federal funding/federal budget (39%)
o attracting/retaining qualified workers (37%)
o state fiscal policy/budget (34%)
• Overall Outlook: Roughly half (48%) of non-profits indicated that their overall circumstances had improved
over the past year, a proportion comparable to our 2016 survey, but notably less than 2015. Their outlook
for the coming year was also markedly less positive than two years ago. About half (53%) expected their
organization’s circumstances to improve in the coming year (down from 64% two years ago), while 10%
predicted that it would worsen, and 28% said they did not know or it was too early to tell.
Implications
This year’s survey findings underscore the resiliency and perseverance of New Jersey’s non-profit community as
well as the acute need for the programs and services non-profits provide. While numerous organizations report
important organizational successes and significant program impact, public policy and funding uncertainties, both
public and private, are weighing heavily on the minds of many. The modest post-recession improvements
reported in 2014 and 2015 have slowed over the past two years, and the gap between escalating demand for
non-profit services and lagging resources remains a continuing and deeply concerning trend.
Supporting the ability of non-profits to pursue their missions is more important than ever to addressing the short-
and long-term needs that our society is facing. Financial investments, vigorous advocacy for sound public policies,
and strong partnerships among stakeholders will all be essential, now and for the future.
The Center for Non-Profits will continue to share the latest information about the economic, social and policy
environment for non-profits, and will work cooperatively to help tackle the collective challenges we face.

4
Background and Methodology
The New Jersey Non-Profit Issues and Trends Survey is conducted annually by the Center for Non-Profits in
order to gauge trends, experiences and views of our state’s non-profit community.
The Center conducted this year’s survey online during mid-March 2017 to assess how non-profits fared in 2016 and
to determine their outlook for the coming year. An email announcement with a link to the survey was sent to
approximately 4,500 subscribers of the Center’s email list, and additional outreach was made via social media
(Facebook, Twitter and LinkedIn), non-profit listserves and to funders or other umbrella organizations serving non-
profits in the state. All communications encouraged recipients to share the survey notice/instrument broadly within
their own networks. The 301 responses from New Jersey 501(c)(3) organizations that were submitted as of March
20, 2017, were included in this analysis.
Responding Organizations
Primary Purpose
Respondents were asked to select their organization’s primary
purpose from a list of 8 classifications (Chart 1). Although
survey respondents represent the broad diversity of non-profit
organizations, human services organizations are
overrepresented in our survey compared with the New
Jersey’s non-profit community overall, while religious and
educational organizations are underrepresented.
Budget Size
(Chart 2)
Although a wide range of budget sizes are present in the
respondent profiles, organizations with budgets of less
than $500,000, which make up the vast majority of New
Jersey’s non-profits, are underrepresented in our survey,
while organizations with budgets of $5 million or more are
overrepresented.
Geographic Location
Organizations from North Jersey (Bergen, Essex, Hudson, Morris, Passaic, Sussex, Union and Warren Counties)
comprised 44% of the survey respondents, Central Jersey (Hunterdon, Mercer, Middlesex, Monmouth and
Somerset) made up 35%, while approximately 16% were located in the Southern region (Atlantic, Burlington,
Camden, Cape May, Cumberland, Gloucester, Ocean and Salem).
Religion-related, 1%
Environment Animals, 5%
Arts, Culture, Humanities,
14%
Education, 12%
Public, Societal
Benefit, 15%
Health, 11%
Human Services, 40%
Other, 2%
Chart 1: Primary Service Focus (N=267)
Under $50,000, 10%
$50,000 to 199,999, 7%
$200,000 to 499,999, 7%
$500,000 to $999,999, 12%
$1 million to $2.499 million,
23%
$2.5 million -$4.99 million,
15%$5 million - 9.9
million, 9%
$10 million -$20 million, 9%
Over $20 million, 8%
Chart 2: Annual Operating Budget(N=267)
5
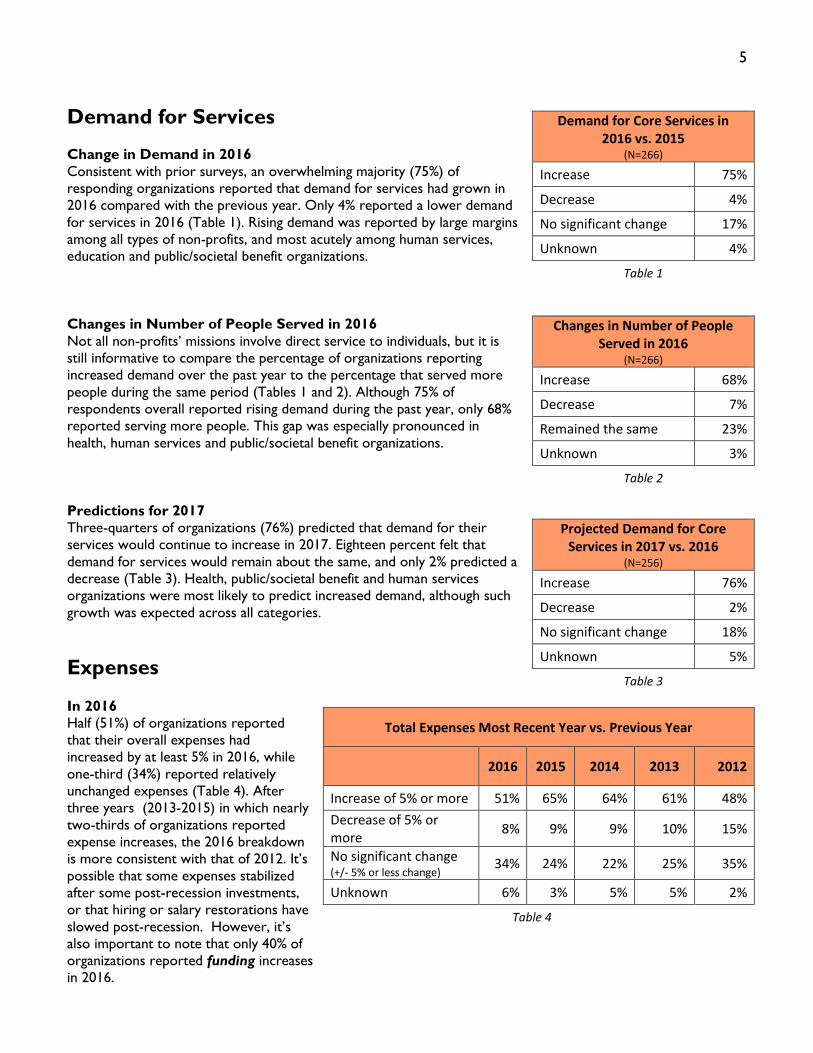
Demand for Services
Change in Demand in 2016
Consistent with prior surveys, an overwhelming majority (75%) of
responding organizations reported that demand for services had grown in
2016 compared with the previous year. Only 4% reported a lower demand
for services in 2016 (Table 1). Rising demand was reported by large margins
among all types of non-profits, and most acutely among human services,
education and public/societal benefit organizations.
Changes in Number of People Served in 2016
Not all non-profits’ missions involve direct service to individuals, but it is
still informative to compare the percentage of organizations reporting
increased demand over the past year to the percentage that served more
people during the same period (Tables 1 and 2). Although 75% of
respondents overall reported rising demand during the past year, only 68%
reported serving more people. This gap was especially pronounced in
health, human services and public/societal benefit organizations.
Predictions for 2017
Three-quarters of organizations (76%) predicted that demand for their
services would continue to increase in 2017. Eighteen percent felt that
demand for services would remain about the same, and only 2% predicted a
decrease (Table 3). Health, public/societal benefit and human services
organizations were most likely to predict increased demand, although such
growth was expected across all categories.
Expenses In 2016
Half (51%) of organizations reported
that their overall expenses had
increased by at least 5% in 2016, while
one-third (34%) reported relatively
unchanged expenses (Table 4). After
three years (2013-2015) in which nearly
two-thirds of organizations reported
expense increases, the 2016 breakdown
is more consistent with that of 2012. It’s
possible that some expenses stabilized
after some post-recession investments,
or that hiring or salary restorations have
slowed post-recession. However, it’s
also important to note that only 40% of
organizations reported funding increases
in 2016.
Demand for Core Services in 2016 vs. 2015
(N=266)
Increase 75%
Decrease 4%
No significant change 17%
Unknown 4%
Table 1
Changes in Number of People Served in 2016
(N=266)
Increase 68%
Decrease 7%
Remained the same 23%
Unknown 3%
Table 2
Projected Demand for Core Services in 2017 vs. 2016
(N=256)
Increase 76%
Decrease 2%
No significant change 18%
Unknown 5%
Table 3
Total Expenses Most Recent Year vs. Previous Year
2016 2015 2014 2013 2012
Increase of 5% or more 51% 65% 64% 61% 48%
Decrease of 5% or more
8% 9% 9% 10% 15%
No significant change (+/- 5% or less change)
34% 24% 22% 25% 35%
Unknown 6% 3% 5% 5% 2%
Table 4

6
Expense Predictions for 2017
Nearly two-thirds (64%) of respondents expected expenses to rise in 2017
(Table 5), with staffing expenses (hiring, salaries, benefits), likely the main
driver. It’s important to note that only half (50%) of organizations expected
their total funding to rise in 2017 (see Table 8, page 7).
Revenue/Expense Comparisons
One-third of organizations (34%) reported that revenues had exceeded
expenses in their most recent fiscal year, a slight uptick compared with our
survey of a year ago (27%). However, more than one-quarter (29%)
reported spending more money than they took in. (Table 6)
Cash Reserves/Lines of Credit Cash reserves or lines of credit can help organizations stabilize cash flow fluctuations and meet expenses when
funding payments are late or when other unexpected shortages occur. Two-thirds (67%) of survey respondents
reported that they had a cash reserve (defined in the survey as an unrestricted amount of funds set aside to provide
a cushion against future unexpected cash flow shortages, expenses or losses), and 38% reported having a line of
credit.
Among organizations with cash reserves, 34% reported having a reserve of 1-3 months of operating funds; 27%
reported 3-6 months' worth; and 35% reported over six months of operating funds. Nearly half (49%) indicated that
their cash reserve remained relatively constant over the past year, while 24% said it was smaller than one year ago
and 27% said that their reserve was larger.
Among organizations with lines of credit, 48% reported having to borrow against the line of credit in 2016; 17%
reported that they had to borrow more in 2016 than in the previous year, and 32% reported borrowing less. By
comparison, in last year’s survey, 22% of respondents had borrowed less against their line of credit than the year
before. Fifty-three percent of respondents with a line of credit indicated that it was "essential" or "very important"
to their organizations' continued ability to provide core programs and services.
Trends in Funding
Total Funding 2016 vs. 2015
For 40% of our respondents, overall funding
increased in 2016 compared with the previous
year, with 36% reporting that funding had held
steady and 24% reporting decreases (Table 7).
Breaking down these trends by type of funding
source, organizations reported the biggest
successes with donations from individuals and
special events. Foundation and corporate
contributions remained level for the biggest
proportion of respondents. (Chart 3, next page)
Projected Expenses in 2017 vs. 2016
(N=249)
Increase 64%
Decrease 7%
Remain the same 27%
Unknown 3%
Table 5
Total Income vs. Expenses for Most Recent Fiscal Year-End
(N=248)
Surplus 34%
Break-even 37%
Deficit 29%
Table 6
Funding in Most Recent Year vs. Previous Year
2016 2015 2014 2013 2012
Increase of 5% or more
40% 42% 50% 52% 33%
Decrease of 5% or more
24% 20% 15% 20% 24%
No significant change (+/- 5% or less change)
36% 33% 29% 24% 40%
Unknown 3% 4% 5% 3% 2%
Table 7

7
6%
9%
6%
9%
12%
12%
9%
7%
38%
13%
9%
32%
40%
21%
25%
3%
3%
7%
9%
12%
12%
10%
2%
3%
11%
4%
2%
6%
11%
19%
20%
16%
15%
22%
29%
35%
24%
16%
17%
24%
26%
36%
17%
26%
36%
40%
40%
0% 10% 20% 30% 40% 50% 60% 70% 80% 90% 100%
Other
Bus. Ventures/Commercial Activity
Local government
County government
State government
Federal government
United Way
Endowment
Planned Giving
Special Events
Investment Income
Membership Dues
Fees for service
Donations from individuals
Corporate donations
Private foundations
% responses reporting funding change per category (N=225)
Chart 3: Funding Changes 2016 vs 2015
Increase Decrease No significant change

8
Denials/Reductions by Previous
Funders
Forty-three percent of respondents
reported that a previous funding source
had informed them in 2016 that they
either would not be giving to their
organization or that they would be
giving less, a proportion consistent with
the past three years. Among those who
had funding denied or reduced, private
foundations (62%) were cited most
frequently, followed by corporations
(36%) and individuals (32%). (Chart 4)
The most frequent reason given for a
denial was a shift in giving priorities (55%
of those reporting denials/reductions),
followed by general cutbacks (30%).
Changes in government leadership or
administrations (6%) or other reasons
(12%) were also cited.
Funding Outlook for 2017
Non-profits’ projections for their overall levels of
funding in the coming year were roughly the same
as one year ago, with 50% predicting that their
funding would increase, 31% predicting steady
funding and 14% projecting decreases. (Table 8)
Projected Funding from Specific Sources in 2017
Asked about their likely funding prospects from a variety of specific sources, respondents were most optimistic
that projected donations from individuals would increase in the coming year. They tended to split between
predicted increases and level funding from foundations and corporations. Organizations receiving government
funds were the least optimistic about those sources for 2017. However, many expressed uncertainty about
specific sources, especially federal and state government, the budgets of which have yet to be determined.
(Chart 5, next page)
Projected Funding - Upcoming vs. Previous Year
2017 2016 2015 2014 2013
Increase 50% 47% 57% 58% 42%
Decrease 14% 14% 9% 8% 19%
Remain the same 31% 32% 26% 28% 34%
Unknown/not
reported 5% 7% 8% 6% 5%
Table 8
5%
5%
11%
15%
8%
10%
9%
32%
36%
62%
0% 20% 40% 60%
Other
Local government
County government
State government
Federal government
United Way
Patrons at events
Individual donors
Corporate
donations
Private foundations
% Responses Indicating Each Source (N=101)
Chart 4: Decreases/Denials from Prior
Funding Sources

9
2%
14%
9%
8%
13%
12%
4%
8%
13%
36%
17%
12%
30%
49%
36%
35%
1%
2%
4%
10%
11%
13%
8%
1%
3%
1%
1%
3%
3%
4%
5%
11%
8%
11%
21%
27%
32%
20%
13%
17%
21%
34%
31%
18%
25%
30%
35%
32%
0% 10% 20% 30% 40% 50% 60% 70% 80% 90%
Other
Business venture/commercial activity
Local government
County government
State government
Federal government
United Way
Endowment
Planned Giving
Special Events
Investment Income
Membership dues
Fees for service
Donations from individuals
Corporate donations
Private foundations
% responses reporting funding change per category
(N=214)
Chart 5: Predicted Funding 2017 vs 2016
Increase Decrease No significant change

10
Organization Reactions to Emerging Trends Consistent with prior surveys, a large percentage of organizations continued to seek additional sources of revenue
to support their work, whether through new fundraising appeals, or seeking funding from alternative sources. New
partnerships or collaborations had been launched or were under consideration by a sizeable percentage of
respondents. Efforts to increase organizational advocacy and recruit new volunteers were also frequently reported.
While significant numbers reported that program and staff additions might occur in 2017 (40% and 33%
respectively), far fewer indicated that these actions would definitely occur or had already happened. At the same
time, program or staff cuts were under consideration by 27% and 22% of respondents – an indicator of the
significant uncertainty of the current economic and funding landscape. (Chart 6)
0% 5% 10% 15% 20% 25% 30% 35% 40% 45% 50%
Reduced number of volunteers
Recruited additional volunteers
Increased advocacy for org funding, field, or constituency
Ended a bus. venture or dissolved a for-profit subsidiary
Started new bus. venture or for-profit subsidiary
Completed a merger
Explored a merger
Ended a partnership/collaboration
Entered a partnership/collaboration
Added programs
Curtailed programs
Increased employee benefits
Reduced employee benefits
Raised salaries (above any pre-cut levels)
Restored previous salary cuts
Froze/Reduced salaries
Increased staff hours
Reduced staff hours (incl. short work weeks, furloughs)
Added staff
Cut staff
Postponed fundraising appeals
Added a special event
Canceled a special event
Introduced/increased fees for service
Sought funds from alternative sources
Initiated new fundraising appeals
% Responses Indicating Type of Action (N=206)
Chart 6: Organization Reactions to Current Trends
Might do in 2017
Definitely will do in 2017
Have already done

11
Partnerships/Collaborations Partnerships are commonly reported by our survey respondents and in the non-profit community generally, and this
year was no exception. Half (51%) reported launching new partnerships or collaborations in 2016, mostly with other
non-profits, although partnerships with government and business were also reported. Examples included
partnerships among parks and health/wellness interests; school-based programs to address behavioral health needs;
shared space and shared personnel; a non-profit/city partnership to provide food service for seniors and healthy
cooking classes for youth; a foundation-convened, multi-organization collaborative to provide whole family services
in South Jersey; partnerships between arts and health organizations; and many others.
Changes in Program/Service Focus Respondents reported making a wide array of changes in program or service focus made in response to the trends
they had experienced. Examples included increased investment in diversity and cultural competence training;
launching mission-based revenue-generating ventures; increased oral health services to uninsured children and
perinatal women; expansion of mental health services; various program adjustments, expansions or curtailments in
response to funding changes; and many others.
Issues Facing New Jersey’s Non-Profits Respondents were asked to
identify which issues, aside from
funding, presented the greatest
challenges to the viability and
effectiveness of their individual
organizations, and to select the
five issues that they felt were
most important to improving
the viability of the non-profit
sector in the coming decade.
Challenges Faced by
Individual Organizations
Financial uncertainty, selected by
nearly 60% of respondents, was
the most frequently identified
challenge for individual
organizations, as it was in our
2016 survey. This was followed
by the need for better
branding/communi-cations
(50%), and the need for a
stronger board (44%). The
inability to afford enough good
staff (33%), increased demand
for program services (32%), and
increased benefits/ insurance
costs (31%) were also cited
frequently.
(Chart 7)
5%
3%
32%
16%
24%
24%
17%
44%
20%
26%
50%
28%
9%
10%
12%
7%
22%
31%
11%
33%
59%
0% 10% 20% 30% 40% 50% 60% 70%
Other
Decreased demand for program services
Increased demand for program services
Improve p'ships with for-profits or gov't
Improve partnerships with other non-profits
Need for strategic planning
Need for leadership development
Need for stronger board
Need to evaluate organizational effectiveness
Need to increase advocacy/public policy…
Need for better branding/communications
Low organization visibility
Need to improve diversity/cultural…
High employee turnover
Need for training other than technology
Need for technology training
Need for new technology/equipment
Increased benefits/insurance costs
Cannot find enough good staff
Cannot afford enough good staff
Financial uncertainty
% Responses per Item (N=212)
Chart 7: Challenges to Organization
Viability/Effectiveness

12
Non-Profit Sector Issues
Similar to the past couple of years, issues related to infrastructure, governance and funding dominated the
concerns about the non-profit community overall. Foundation/corporate funding was named by more than half of
the respondents (54%), followed by non-profit infrastructure/capacity building and attracting/retaining capable,
committed board members (51% each). Federal funding/federal budget (39%), attracting/retaining qualified
workers (37%), and state fiscal policy/budget (34%) were also cited frequently. (Chart 8)
6%
51%
37%
19%
3%
6%
8%
27%
15%
1%
12%
21%
51%
20%
7%
34%
54%
39%
26%
16%
22%
9%
15%
0% 10% 20% 30% 40% 50% 60%
Other
Attracting/retaining capable, committed board members
Attracting/retaining qualified workers
Reducing competition between non-profits
Reducing competition from for-profits
Taxation/tax reform
Restoring public trust in non-profits
Improving public understanding about non-profits
Ensuring non-profit accountability/effectiveness
Privatization
Paperwork reduction (reducing red tape)
Non-profit advocacy/lobbying rights
Non-profit infrastructure/capacity building
Access to technology
Insurance and liability
State fiscal policy/state budget
Foundation/corporate funding
Federal funding/federal budget
Giving and volunteering incentives
Diversity and inclusion within non-profits
Civil society/civic engagement
Contracting
Charitable registration/solicitation laws and regulations
% Responses per Item (N=213)
Chart 8: Most Important Issues in Maintaining and Improving the
Non-Profit Sector in the Next Decade

13
Overall Circumstances and Outlook
Comparison with One Year Ago
Respondents’ assessments of their organizations’ overall circumstances over the past year were comparable to
our 2016 survey and less positive than two years ago. Fewer than half (48%) reported that their organization’s
circumstances had improved over the past year (down from 57% two years ago), while 15% said that their
situation was worse and 37% said it was no different. (Table 9)
Overall, would you describe your organization’s circumstances as better,
worse, or no different than the same time a year ago?
Response 2017 2016 2015 2014 2013 2012 2011 2010 2009 2008
Better 48% 49% 57% 58% 43% 38% 32% 30% 31% 51%
Worse 15% 15% 13% 12% 22% 23% 29% 36% 34% 15%
No different 37% 36% 31% 30% 35% 40% 38% 34% 36% 35% Table 9
Outlook for 2017
Predictions by survey respondents regarding whether their overall circumstances in one year would be better,
worse, no different or "unknown/too early to tell" were slightly less optimistic as one year ago, and markedly less
optimistic than the previous two years. Although a significant proportion remained uncertain in their outlook, 53%
expected their organization’s circumstances to improve (down from 64% two years ago) and 10% predicted that it
would worsen. (Table 10)
Overall, one year from now, do you think your organization’s circumstances will be better,
worse or no different than they are currently?
Response 2017 2016 2015 2014 2013 2012 2011 2010 2009 2008
Better 53% 57% 64% 62% 46% 44% 45% 43% 41% 68%
Worse 10% 9% 6% 3% 7% 8% 10% 14% 33% 8%
No different 9% 6% 7% 11% 15% 16% 11% 9% 26% 24%
Unknown/Too
early to tell
28% 28% 23% 25% 32% 32% 34% 34% n/a n/a
Table 10
Other Trends/Observations by Respondents Throughout the survey, non-profits were provided with opportunities to share experiences and opinions not
otherwise covered in the questionnaire. Among the many observations volunteered by our respondents:
• A high degree of uncertainty about proposed government budget cuts and public policies and their impact
on non-profit programs in communities
• The need to shore up non-profit infrastructure and the importance of adequate funding for non-profit
overhead
• The need to simplify the government contracting system and provide for payments that cover the costs of
providing services
• Concern about federal proposals to weaken the existing ban on partisan political activity by 501(c)(3)
organizations
• Concerns about the possible curtailing of federal tax incentives for charitable giving as part of future tax
reform efforts in Washington
• Desire to diversify organization funding
• Shifts in organizational leadership, leadership development, adaptability to the changing environment

14
Interpretation/Implications This year’s survey findings underscore the resiliency and perseverance of New Jersey’s non-profit community as
well as the acute need for the programs and services non-profits provide. While numerous organizations report
important organizational successes and significant program impact, public policy and funding uncertainties, both
public and private, are weighing heavily on the minds of many. The modest post-recession improvements
reported in 2014 and 2015 have slowed over the past two years, and the gap between escalating demand for
non-profit services and lagging resources remains a continuing and deeply concerning trend.
Supporting the ability of non-profits to pursue their missions is more important than ever to addressing the short-
and long-term needs that our society is facing. Financial investments, vigorous advocacy for sound public policies,
and strong partnerships among stakeholders will all be essential, now and for the future.
The Center for Non-Profits will continue to share the latest information about the economic, social and policy
environment for non-profits, and will work cooperatively to help tackle the collective challenges we face.
About the Center for Non-Profits The Center for Non-Profits is New Jersey's statewide umbrella organization for the charitable community. Our
mission is to build the power of New Jersey's non-profit community to improve the quality of life for the people
of our state.
Since its founding in 1982, the Center has been, and remains, New Jersey's only umbrella organization for all
charities in the state. Through public policy, capacity building, education, and training programs the Center gives
non-profits the information and tools they need to pursue their missions more effectively, strengthening non-
profits as individual organizations and as a community.
What We Do
For more information about the Center, our programs, membership, or supporting our work, visit
www.njnonprofits.org, or call 732-227-0800.
Center for Non-Profits 3575 Quakerbridge Road, Suite 102 | Mercerville, NJ 08619
732 227 0800 | fax: 732 227 0087
www.njnonprofits.org | [email protected]
www.facebook.com/njnonprofits
www.twitter.com/NJ_Nonprofits
www.linkedin.com/company/center-for-nonprofits
www.njnonprofits.org/blog