new features in maxqda 12
TRANSCRIPT

New Features in
MAXQDA 12

Content
1. One Software for Windows and Mac OS X ............................................ 1
2. Focus Group Analysis ............................................................................ 2
3. Second Document Browser ................................................................... 3
4. Creative Coding ................................................................................... 4
5. Overview of Summaries ........................................................................ 5
6. Similarity Analysis ................................................................................. 6
7. Twitter Import ...................................................................................... 7
8. Better Survey Import ............................................................................. 8
9. Codebook ............................................................................................ 9
10. Enhanced Document Portraits ........................................................... 10
Additional new Features … ..................................................................... 11

1
One Software for Windows and Mac OS X
MAXQDA 12 is designed from the ground up for both Windows and Mac computers, providing
researchers with an identical user experience and access to our rich set of features. This makes
MAXQDA the only full featured QDA software that works seamlessly across both platforms.
Our unified software comes with a unified new user interface that combines clarity and
efficiency with modern software design, looking equally stunning on Windows and Mac OS X.
We made sure that every icon and every element follows an intuitive design language that is
easy to understand and efficient to use while looking sharp and colorful on large high-resolution
monitors as well as small notebooks.
How to use it:
Universal MAXQDA 12 license allows installation on Windows and/or Mac OS X
Universal MAXQDA 12 project files (.mx12) can be opened on Windows and/or Mac OS X
Both versions offer identical features and an identical user interface
2
Focus Group Analysis
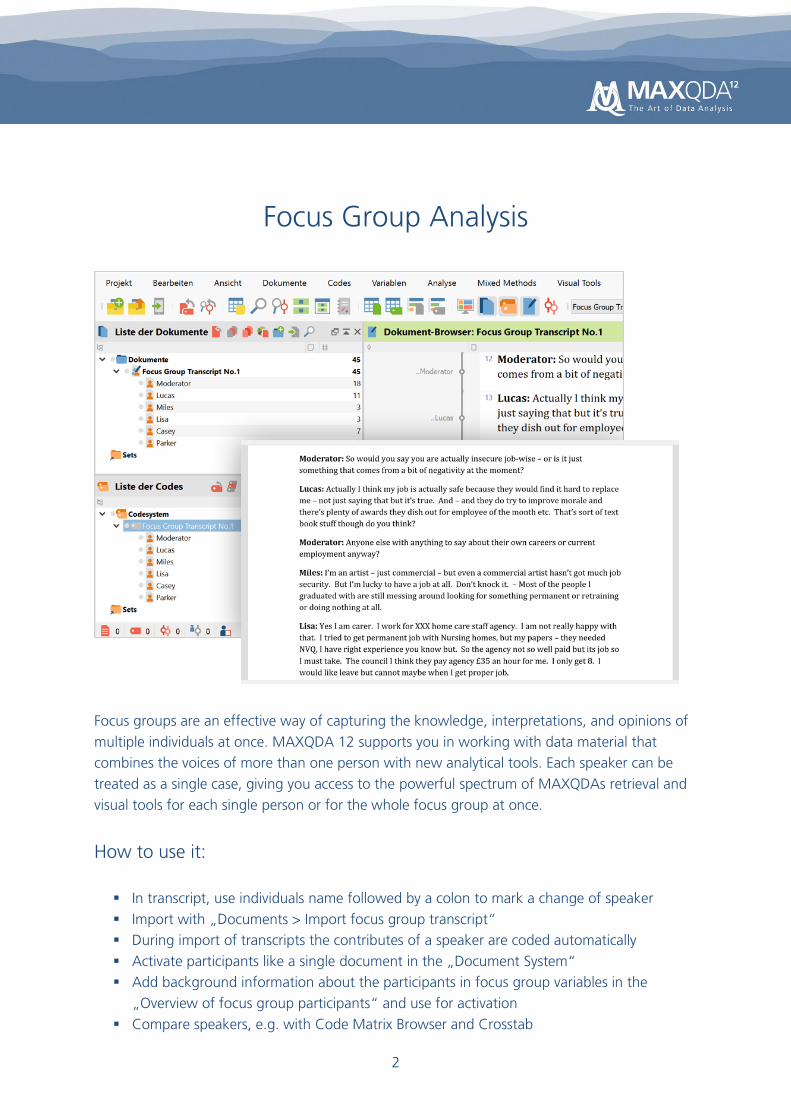
Focus groups are an effective way of capturing the knowledge, interpretations, and opinions of
multiple individuals at once. MAXQDA 12 supports you in working with data material that
combines the voices of more than one person with new analytical tools. Each speaker can be
treated as a single case, giving you access to the powerful spectrum of MAXQDAs retrieval and
visual tools for each single person or for the whole focus group at once.
How to use it:
In transcript, use individuals name followed by a colon to mark a change of speaker
Import with „Documents > Import focus group transcript“
During import of transcripts the contributes of a speaker are coded automatically
Activate participants like a single document in the „Document System“
Add background information about the participants in focus group variables in the
„Overview of focus group participants“ and use for activation
Compare speakers, e.g. with Code Matrix Browser and Crosstab

3
Second Document Browser
Tabs are already a great way for working with more than one document. But with MAXQDA 12
it is now possible to open up a second document window to view two documents side by side.
This is especially useful for creating links between documents or for summarizing and reviewing
literature.
How to use it:
Right click on a document and select „Open document in second Document Browser“
Read and code two documents simultaneously
Create links between two documents easily
Create your systematic or literature review: open your PDF article in one browser, make
notes in the second one, and code both documents at the same time

4
Creative Coding
Creative Coding supports open coding and helps you to build categories: Visually arrange and
structure codes and themes on a blank canvas. Relations are easily created via drag and drop
and the finalized structure can be transformed into the MAXQDA Code System you can then
use to continue your analysis. Perfect for open coding and Grounded Theory!
How to use it:
Start Creative Coding with „Codes > Creative Coding“
Drag the top level codes you which to arrange on the map
Start code organization and arrange the codes on the map: use arrows to create
relationships, add new codes, change colors, merge two codes
End Creative Coding and transfer the changes into the existing code system

5
Overview of Summaries
Allowing you to summarize data into your own words is one of the strong points of MAXQDA.
The new version takes this feature even further. MAXQDA 12 improves the way variables are
displayed in Summary Tables and links your summaries deep into the original data, making them
quick to read, export and present to others. The new “Overview of summaries” enables you to
display all your summaries for one document, a group of documents, or a code, while easily
putting them together in compact lists.
How to use it:
Right click on document or code to open up „Overview of summaries“
Export this overview table to Excel, HTML, or Word
Create new Summary Tables with the optimized dialog
Display document variables in their own columns of a Summary Table
Reduce columns to columns with activated codes only
Note: Grid Tables are called „Summary Tables“ now.
6
Similarity Analysis
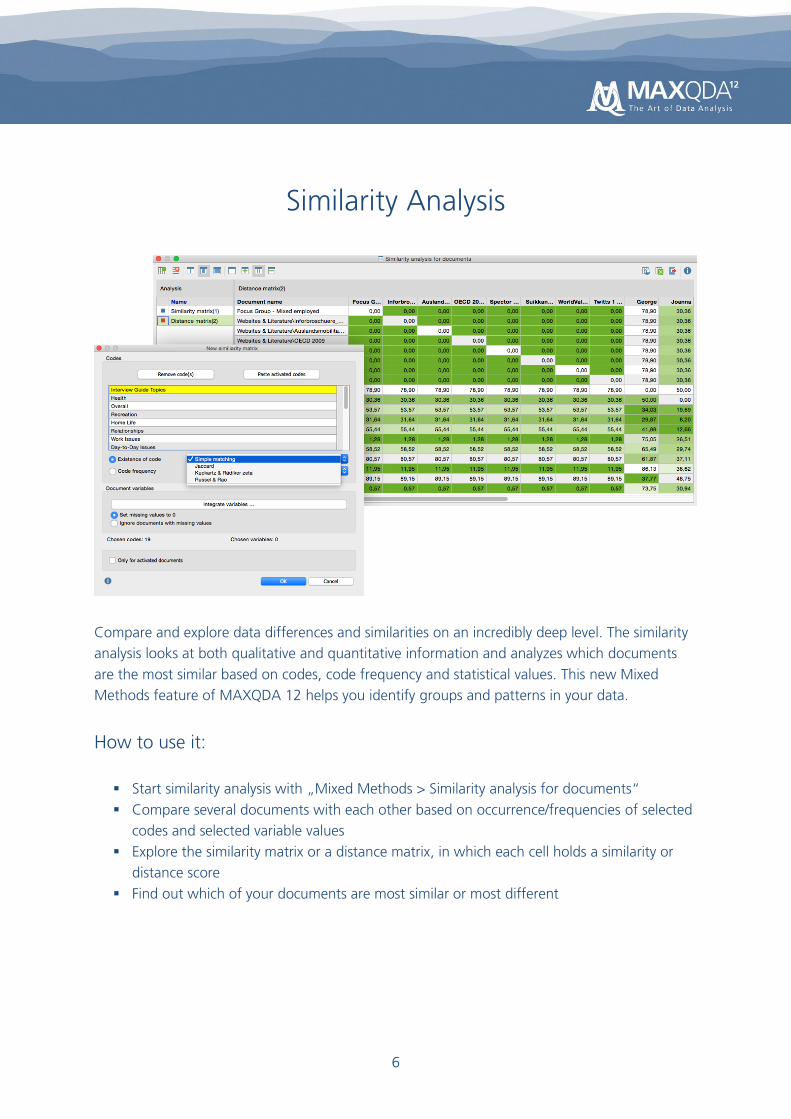
Compare and explore data differences and similarities on an incredibly deep level. The similarity
analysis looks at both qualitative and quantitative information and analyzes which documents
are the most similar based on codes, code frequency and statistical values. This new Mixed
Methods feature of MAXQDA 12 helps you identify groups and patterns in your data.
How to use it:
Start similarity analysis with „Mixed Methods > Similarity analysis for documents“
Compare several documents with each other based on occurrence/frequencies of selected
codes and selected variable values
Explore the similarity matrix or a distance matrix, in which each cell holds a similarity or
distance score
Find out which of your documents are most similar or most different

7
Twitter Import
We know that twitter is an important data source for a growing number of researchers. From
now on you can search and import tweets using all of Twitters powerful advanced filter options
from right inside MAXQDA. Automatic coding options for authors and hashtags will save time
and boost your social media research.
How to use it:
Connect and import tweets with „Documents > Import data from twitter“
Search for words, hashtags, users and import up to 10,000 tweets at once
MAXQDA creates table documents for the twitter feeds, one row per feed
Autocode the imported twitter feeds with up to 100 user names or hashtags, so you can
easily display and analyze the feeds of selected authors

8
Better Survey Import
The new survey import creates new flexibility for your survey data. Don’t worry about naming
and ordering columns or marking variables with special characters. Just import your Excel table
and MAXQDA helps you take care of the rest. For long term studies it is now also easier to add
multiple waves of data to your already existing analysis.
How to use it:
Import survey data, containing answers to open ended questions and variable values, with
„Documents > Import documents from spreadsheet“
Select document names and (optional) document groups columns during import
Choose which columns to import as variables and/or automatically coded text
Add new data to existing documents

9
Codebook
MAXQDA 12 offers a new feature that makes it easy to present your code system to others.
Export your code system and all existing code memos with one click into a Codebook document,
for example to attach it to your research reports.
How to use it:
Write down code definitions in code memos
Export with „Reports > Codebook“
MAXQDA creates a codebook document that contains all selected codes and their memos
Perfect for creating an appendix with code definitions

10
Enhanced Document Portraits
Using document portraits to visualize codes and to characterize single cases? MAXQDA 12 adds
new visual retrieval opportunities. You can now “clean up” portraits to be neatly organize by
code color, retrieve coded segments from inside document portraits, and stack colors into bars
which enables you to immediately see which codes take up the most space.
How to use it:
Right click on a document and select „Document portrait“
Use the buttons in the toolbar to
o sort by document
o sort by color
o sort by color frequency
Right click on a tile and retrieve coded segments coded with the same color

11
Additional new Features …
Coding
Property menu for codes
Define individual keyboard shortcuts for most used codes
Multiple page coding in PDF documents
Autocode
Autocode multiple words with MAXDictio Coder
Autocode xy words before and after a search hit
Intercoder
Calculate Kappa
Code System and Document System
Activate documents and codes by single click on the circle next to the code or document
icon; also works with a single click on frequency display of coded segments
Collapse all documents and subcodes
Sort subcodes by frequency
Coding Query
Optimized dialog for simple and complex coding query
List all codes assigned to a coded segment in the “Retrieved Segments” window
Teamwork
Ignore existing documents when merging projects
Import and Export
Import ODT document from Open Office in Windows, if you have installed Word

12
Include a list of codes assigned to each coded segment when exporting coded segments
Memos
Text search inside the opened memo
Define individual labels for different memo icons
Assign memo not only to a single position, but to the range of a highlighted segment
Visual Tools
One-Case Model for document groups and document sets
Sum for columns and rows in Code Matrix Browser and Code Relations Browser
Quote Matrix for Code Relations Browser
Drag and drop columns in Code Matrix Browser and Code Relations Browser
Mixed Methods
Optimized selection of variable value, e.g. for activating via document variables
Typology Table: Highlight highest and lowest value per row; double click on cell to list all
assigned coded segments
Configuration Table: analyze the combination of up to 10 codes (formerly 5); double click
on row to list all assigned coded segments; create frequency tables and diagrams for the
results
Descriptive statistics for frequency tables
Drag and drop columns in Crosstab and Typology Table
Overview Tables
New “Overview of Codes” displaying the used codes in documents, document groups, or
document sets
Filter “Only activated documents” and “Only activated codes” in overview tables
Filter for overview tables
Audio and Video
New transcription mode and easier assigning of media files to text documents
Media Browser: Copy screenshot of video image to clipboard, or create new image
document with the displayed video image