new digital terrain modeling (dtm) tools … digital terrain modeling (dtm) tools for cable route...
TRANSCRIPT

NEW DIGITAL TERRAIN MODELING (DTM) TOOLS FOR CABLE ROUTE PLANNING by Dr. Jose M. Andres
Makai Ocean Engineering Inc. EXISTING CABLE ROUTE PLANNING TOOLS In recent years, methods used for submarine cable route planning have been completely transformed. Paper charts and simple spreadsheet-based tools have been replaced by accurate PC-based software that operates in a Geographical Information System (GIS) environment. All data critical to the design are stored in a single database and are readily retrievable and viewed as layers on a GIS map. This software has become the standard for cable route planning. Typical data sources that are accessed and geo-referenced by a single software package include bathymetry, soil types, side-scan images, aerial photographs of landing sites, CAD drawings, marine charts, Route Position Lists (as designed, as laid, and as repaired), cable assemblies, and installation notes. Of all these data sources, good quality bathymetry is most essential for proper route planning. Before a final cable route can be selected, system providers must complete a detailed multibeam survey along the selected preliminary cable route. This survey is critical in areas where the cable must be buried (depths up to 2,000 m deep). For a given project, final bathymetric data could easily consist of 20 to 80 million data points. Surveyors usually provide these data in several gridded files with grid sizes varying from 2 to 10+ m resolution depending on the water depth. Before the introduction of GIS planning software, the planner did not have the tools to properly make use of large amounts of bathymetric data collected by the surveyor. Instead, the planner simply estimated the bottom profile along the selected preliminary route and made use of marine charts to detect the presence of large features and side slopes along the route. With the introduction of GIS planning software, a more complete and automated use of the bathymetric data has been achieved. Using the collected point data, surveyors are able to provide the planner with bottom contours along the entire surveyed swath. With these contour data, GIS planning software is able to automatically generate the bottom profile and slopes along the selected route. As the cable planner makes modifications to the cable route to avoid large slopes and hazardous areas, the GIS planning software computes a new bottom profile and slopes along the entire route. This iterative procedure is facilitated by properly linking Plan and Profile views of the cable route, where any changes in one of the views are immediately reflected in the other view (Fig. 1). Following this procedure, an optimal cable route can be identified. Despite these important advances in cable route planning, which have allowed users to drastically decrease planning time, the current GIS software still does not make optimum use of all the collected bathymetric data. Bottom contours do not always provide the planner with the most accurate representation of the true bottom features and the lateral slopes between adjacent contours. Where cables are buried using plows, detailed knowledge of along and across track slopes is particularly important. In the last few years, several cases have been reported where plows have been damaged and even lost at-sea as a result of hazardous seafloor features not detected by using only bathymetric contour lines (Palmer-Felgate, 2002). Therefore, it is essential that the selected route take into account the existence of any such hazards.
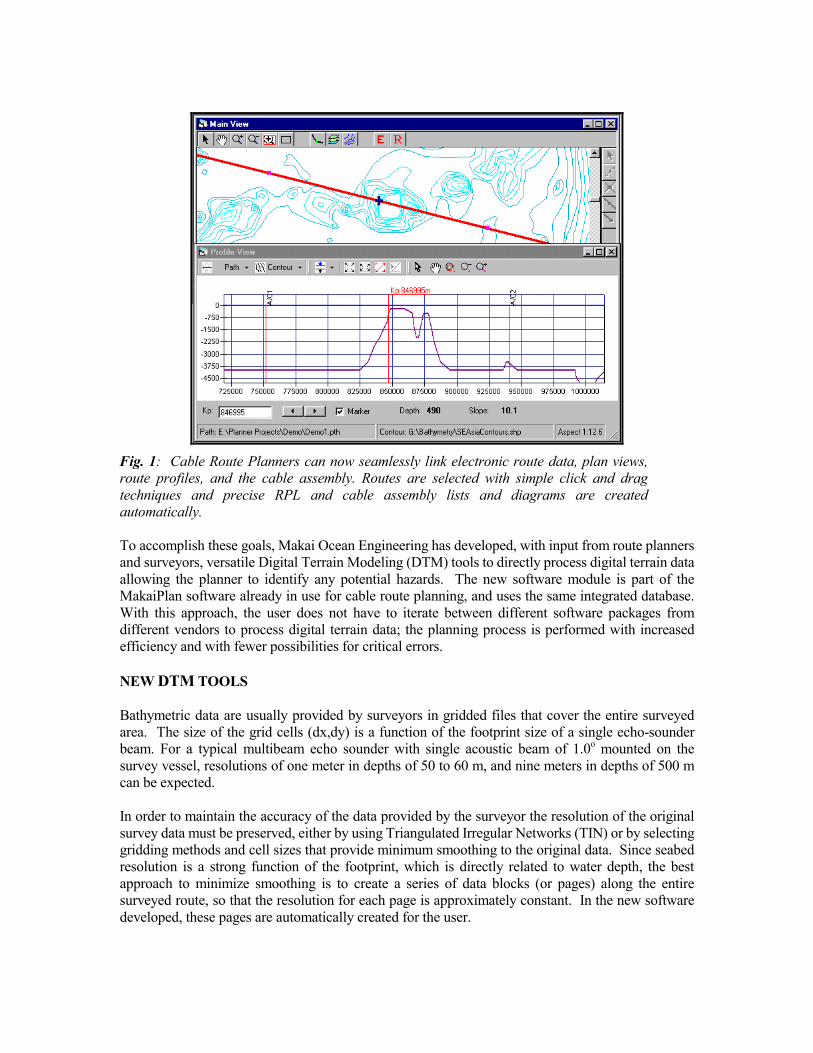
Fig. 1: Cable Route Planners can now seamlessly link electronic route data, plan views, route profiles, and the cable assembly. Routes are selected with simple click and drag techniques and precise RPL and cable assembly lists and diagrams are created automatically. To accomplish these goals, Makai Ocean Engineering has developed, with input from route planners and surveyors, versatile Digital Terrain Modeling (DTM) tools to directly process digital terrain data allowing the planner to identify any potential hazards. The new software module is part of the MakaiPlan software already in use for cable route planning, and uses the same integrated database. With this approach, the user does not have to iterate between different software packages from different vendors to process digital terrain data; the planning process is performed with increased efficiency and with fewer possibilities for critical errors. NEW DTM TOOLS Bathymetric data are usually provided by surveyors in gridded files that cover the entire surveyed area. The size of the grid cells (dx,dy) is a function of the footprint size of a single echo-sounder beam. For a typical multibeam echo sounder with single acoustic beam of 1.0o mounted on the survey vessel, resolutions of one meter in depths of 50 to 60 m, and nine meters in depths of 500 m can be expected. In order to maintain the accuracy of the data provided by the surveyor the resolution of the original survey data must be preserved, either by using Triangulated Irregular Networks (TIN) or by selecting gridding methods and cell sizes that provide minimum smoothing to the original data. Since seabed resolution is a strong function of the footprint, which is directly related to water depth, the best approach to minimize smoothing is to create a series of data blocks (or pages) along the entire surveyed route, so that the resolution for each page is approximately constant. In the new software developed, these pages are automatically created for the user.

Creating final gridded files within each page can be done by using either a fast triangulation method or a minimum curvature method. Gridded files with approximately one million points can be generated in 1 or 2 minutes using either of these methods. The grid size for each page is automatically selected by the software to match the smallest footprint of the data in each page in order to accurately maintain the shape of the seabed features detected by the survey, while avoiding the creation of high frequency, non-existent features. The generation of all the pages along the surveyed route, including reading the raw data files, generating the gridded data and creating shaded relief images for each page is completed in a batch process. For a typical survey with 20 to 50 million data points, the entire process can take two hours. A sample of a large single page generated along a route, which includes a shaded relief image created during batch processing and several smaller pages of soil type data are shown in Fig. 2.
Fig. 2: GeoTiff images, pictures that are geo-referenced into the GIS database, enhance the quality of the information available on any given site.
To meet the requirements for submarine route planning, the mapping tools developed are able to:
• Create contour colored maps (colors, number and spacing of contour lines are user defined and maps can be directly loaded into the GIS database), which allow the user to visualize either water depths or the maximum seabed slopes.
• Create color shaded relief maps with user definable sun elevation and azimuth (Fig. 3) • Superimpose the RPL on any of the created maps and quickly generate accurate slope
graphs along and across any desired route section. These along and across path profiles are

generated by cutting an accurate slice through the entire grid, and therefore, can be used to compute more accurate values of seabed distances and slacks than those computed using the conventional method of intersecting bathymetric contours (Fig. 3).
• All maps must be automatically geo-referenced as Geotiffs and be viewable as layers on the main GIS window (Fig. 2).
• Optionally, the capability to load and visualize sections of the survey data in 3D may be desirable (Fig. 4).
Fig. 3. Shaded Relief Map showing RPL and seabed profile and slopes. The generated image can
be automatically geo-referenced and viewed on the GIS Plan View window . CONCLUSIONS The new mapping tools for DTM developed within the GIS planning software allow the user to accurately process and visualize the large amounts of point data collected along an entire survey area. With these new techniques, accurate slopes along and across track can be easily computed and incorporated in the calculation of seabed slack. Colored shaded relief images in conjunction with detailed color contour maps can be automatically geo-referenced and incorporated in the overall GIS database to further facilitate the selection of the optimum cable route. These new developments are also being incorporated into GIS software designed to guide the at-sea installation and maintenance of submarine cables.

Fig. 4. 3D surface visualization showing route and seabed profile.