new core curriculum foundations of scientific process current environmental problems
TRANSCRIPT

New Core CurriculumNew Core Curriculum
Foundations of Scientific ProcessFoundations of Scientific Process
Current Environmental ProblemsCurrent Environmental Problems
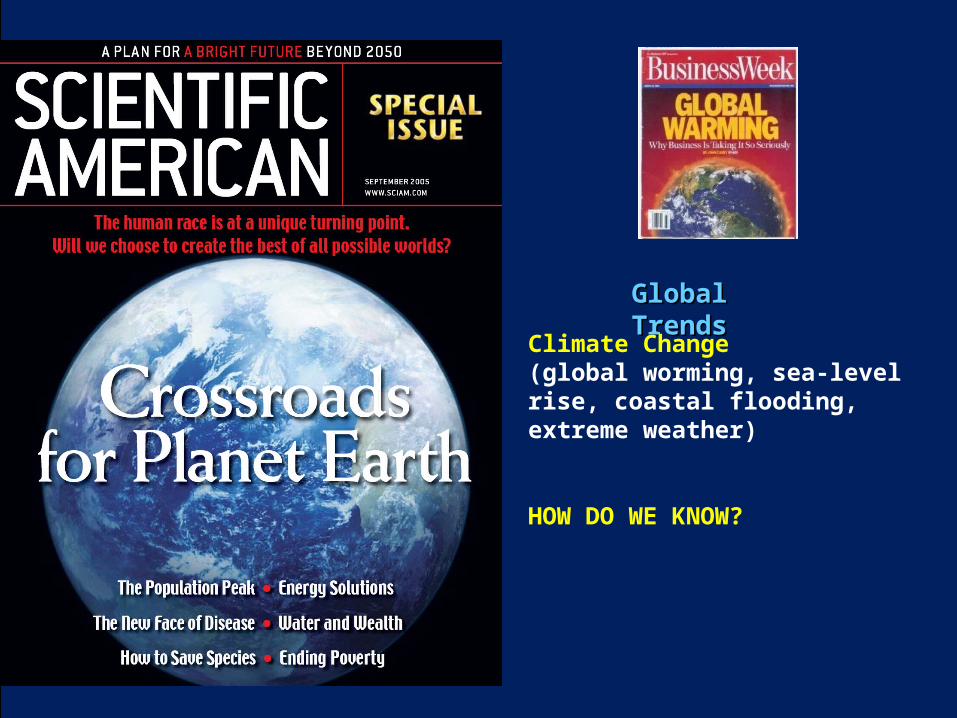
Global TrendsGlobal Trends
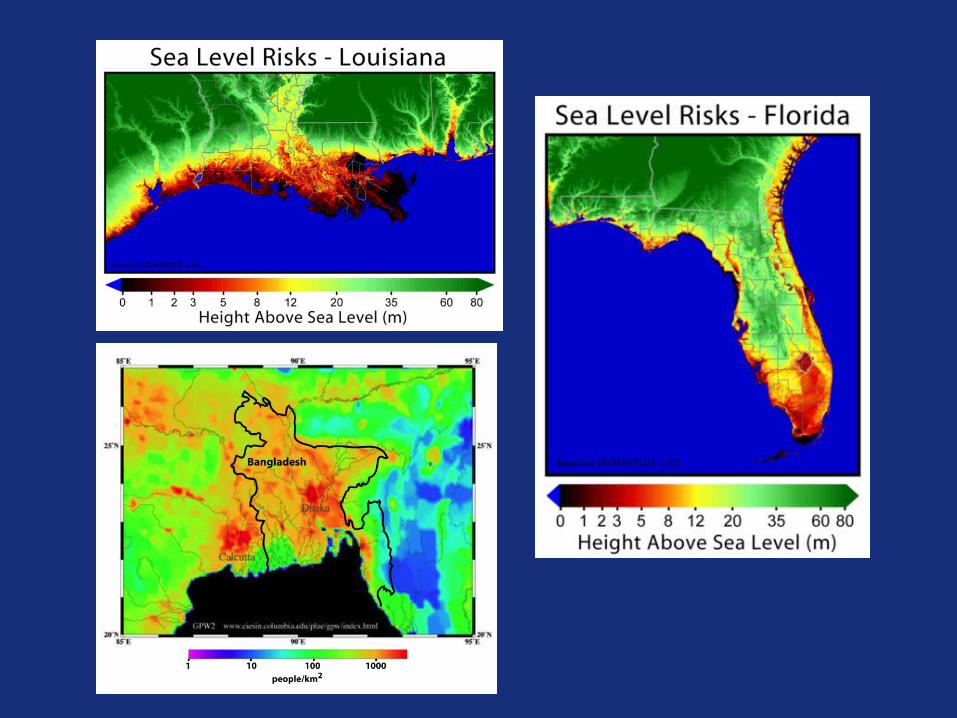
Climate Change(global worming, sea-level rise, coastal flooding, extreme weather)
HOW DO WE KNOW?

Climate Models as Evidence:Climate Models as Evidence:
Modern Climate Changes dominated by Human
Influence
Testing models against past climate: The last ~ 100 years
“Natural”
Influences
Human Influenc
es

IPCC Models
The Intergovernmental Panel on Climate Change (IPCC) was established by the World Meteorological Organization (WMO) and the United Nations Environment Program (UNEP) to assess scientific, technical and socio- economic information relevant for the understanding of climate change, its potential impacts, and options for adaptation and mitigation.
http://www.ipcc.ch/

The Nobel Peace Prize 2007
"for their efforts to build up and disseminate greater knowledge about man-made climate change, and to lay the foundations for the measures that are needed to counteract such change"
IPCC Albert Arnold Gore Jr.

(a)Monthly CO2 concentration and its trend line at Mauna Loa, Hawaii (blue) up to January 2007.
Rahmstorf et al. (2007)
What have we learned? Changes in key global climate parameters since 1973, compared to the scenarios of the IPCC [shown as dashed lines (A1FI, light
blue; A1B, purple; A1T, blue; A2, red; B1, yellow; and B2, green) and gray ranges in all panels].

(b) Annual global-mean land and ocean combined surface temperature from two different data sources (red and blue) up to 2006, with their trends.
Rahmstorf et al. (2007)
What have we learned? Changes in key global climate parameters since 1973, compared to the scenarios of the IPCC [shown as dashed lines (A1FI, light
blue; A1B, purple; A1T, blue; A2, red; B1, yellow; and B2, green) and gray ranges in all panels].

(c) Sea-level data based primarily on tide gauges (annual, red) and from satellite altimeter (blue) and their trends. Rahmstorf et al. (2007)
What have we learned? Changes in key global climate parameters since 1973, compared to the scenarios of the IPCC [shown as dashed lines (A1FI, light
blue; A1B, purple; A1T, blue; A2, red; B1, yellow; and B2, green) and gray ranges in all panels].

http://www.scientificamerican.com/article.cfm?id=polar-ice-sheets-melting-faster-than-predicted

Evolution of Arctic sea-ice extent in July and August from 1979 until 2011.
http://www.guardian.co.uk/environment/2011/sep/09/other-arctic-sea-ice-melt
http://www.350resources.org.uk/2011/09/10/arctic-ice-melt-1979-to-2011-clear-downward-trend/

Is rapid sea level rise a Is rapid sea level rise a concern?concern?

World GlaciersActivity

Total volume of Ice = 2.6 x 10⁶ km3 in Greenland 29.3 x 10⁶ km3 in Antarctica
Total Ocean Surface Area = 36.1 x 10⁷ km2
Density of Water = 1000 kg m-3, or = 1 x10¹² kg km-3
Density of Ice = 900 kg m-3, or = 9 x 10¹¹ kg km-3
With the statistics given above, calculate the amount of sea level rise that would occur if all of the ice in these two ice sheets melted. Remember that no mass is lost as ice converts to water, however there is a density change. You'll need to first get a water equivalent volume that the ice would produce.

With the statistics given above, calculate the amount of sea level rise that would occur if all of the ice in these two ice sheets melted. Remember that no mass is lost as ice converts to water, however there is a density change. You'll need to first get a water equivalent volume that the ice would produce.
Density conversions: d(ice)=m(ice)/vol(ice) substituting values gives mass of all ice as 2.871 x 10¹⁹ kg
Since mass remains the same, we subs this into d(H2O)=m(ice)/vol(H2O) to give volume of water 2.8 x 10⁷ km3
Sea level rise = volume H2O / surface area of ocean
= 0.07756 km
= 80 m (approx 260 ft) rise in sea level if both polar ice sheets melted.
http://www.msnbc.msn.com/id/19463513/?open=antarctica

What about sea ice?
The relationship between sea ice and sea level is analogous to a drinking glass filled with ice cubes and water. If the ice in the glass melts, the amount of liquid in the glass increases but the total volume of water in the glass remains the same, since the glass does not overflow. Similarly, sea ice melting merely represents a change of state. No new water is created so there should be no increase in sea level.
Melting of Glacial (land) ice contributes to the increase in sea-volume.
polar-bears habitat

Climate Debate

1. Efficiency gains2. Stop old coal3. Capture CO2 at point
sources4. Carbon sequestration5. Biofuels6. Nuclear7. Wind8. Solar9. Geothermal10.H - fuels
WHAT CAN BE DONE TO FIGHT GLOBAL WARMING

New Core CurriculumNew Core Curriculum
Foundations of Scientific ProcessFoundations of Scientific Process
Week 6: Current Environmental Problems Week 6: Current Environmental Problems Based on what you have heard / read from the media: Based on what you have heard / read from the media: What are currently the worlds most pressing problems ?What are currently the worlds most pressing problems ?
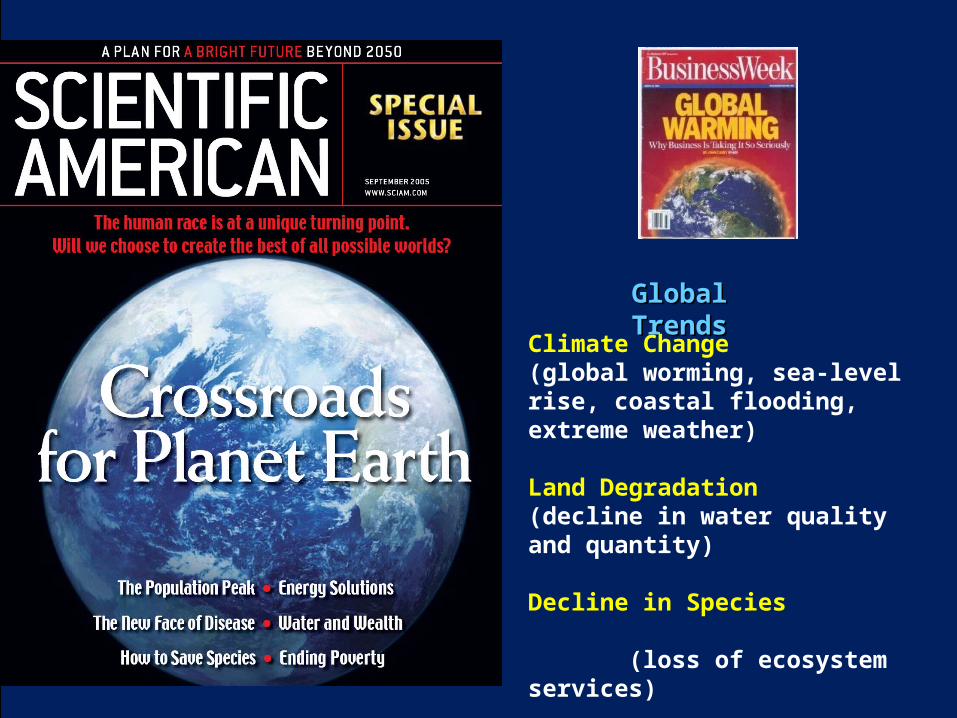
Global TrendsGlobal Trends
Climate Change(global worming, sea-level rise, coastal flooding, extreme weather)
Land Degradation (decline in water quality and quantity)
Decline in Species (loss of ecosystem services)
Increased emergence of infections diseases

(CNN) -- Since March 11, the six reactors at the Fukushima Daiichi nuclear power plant have been in various states of disrepair after being battered by a 9.0-magnitude earthquake and subsequent tsunami.
Earthquakes remnants of Earth’s internal heat
http://www.cnn.com/2011/WORLD/asiapcf/03/26/japan.nuclear.status/index.html
Japan: Sea radiation 1,250 times normal

Life – Atmospheric Conditions – ClimateLife – Atmospheric Conditions – Climate
Proxies- needed to infer past climate-related changes
Time before present (billions of years)
Atmospheric CO2
Atmospheric O2

Extinction rates are higher than we would expect from fossil evidence
The History of Life on Earth