nevada labor market briefing: september 2014
DESCRIPTION
Department of Employment, Training & Rehabilitation Don Soderberg, Director Dennis Perea, Deputy Director Bill Anderson, Chief Economist Prepared by the Research and Analysis Bureau. Nevada Labor Market Briefing: September 2014. State Unemployment Rate. 7.3% Unemployment Rate (SA 1 ) - PowerPoint PPT PresentationTRANSCRIPT

The Nevada Department of Employment, Training and Rehabilitation is a proactive workforce & rehabilitation agency
Nevada Labor Market Briefing:September 2014
Department of Employment, Training & Rehabilitation
Don Soderberg, Director
Dennis Perea, Deputy Director
Bill Anderson, Chief Economist
Prepared by the Research and Analysis Bureau

The Nevada Department of Employment, Training and Rehabilitation is a proactive workforce & rehabilitation agency
State Unemployment Rate
7.3% Unemployment Rate (SA1) Down 0.3 percentage point from August; down from
9.6% a year ago Off from a recession peak of 13.9% The unemployment rate has declined or held steady, relative
to the prior month, for 39 straight months Lowest reading since July 2008
Compares to a 5.9% rate for the U.S.—1.4 points higher Lowest differential since mid-2008
1seasonally adjusted

The Nevada Department of Employment, Training and Rehabilitation is a proactive workforce & rehabilitation agency
Unemployment Rate at 7.3%; Lowest Since July 2008NV vs. the U.S. Unemployment Rate (SA)
0%
2%
4%
6%
8%
10%
12%
14%
16%
'05 '06 '07 '08 '09 '10 '11 '12 '13 '14
NV U.S.

The Nevada Department of Employment, Training and Rehabilitation is a proactive workforce & rehabilitation agency
Long-Term Unemployment Half of PeakNevadans Unemployed for 27+ Weeks (CPS data; 12-month moving average)
0
10,000
20,000
30,000
40,000
50,000
60,000
70,000
80,000
90,000
100,000
'05 '06 '07 '08 '09 '10 '11 '12 '13 '14
The Nevada Department of Employment, Training and Rehabilitation is a proactive workforce & rehabilitation agency
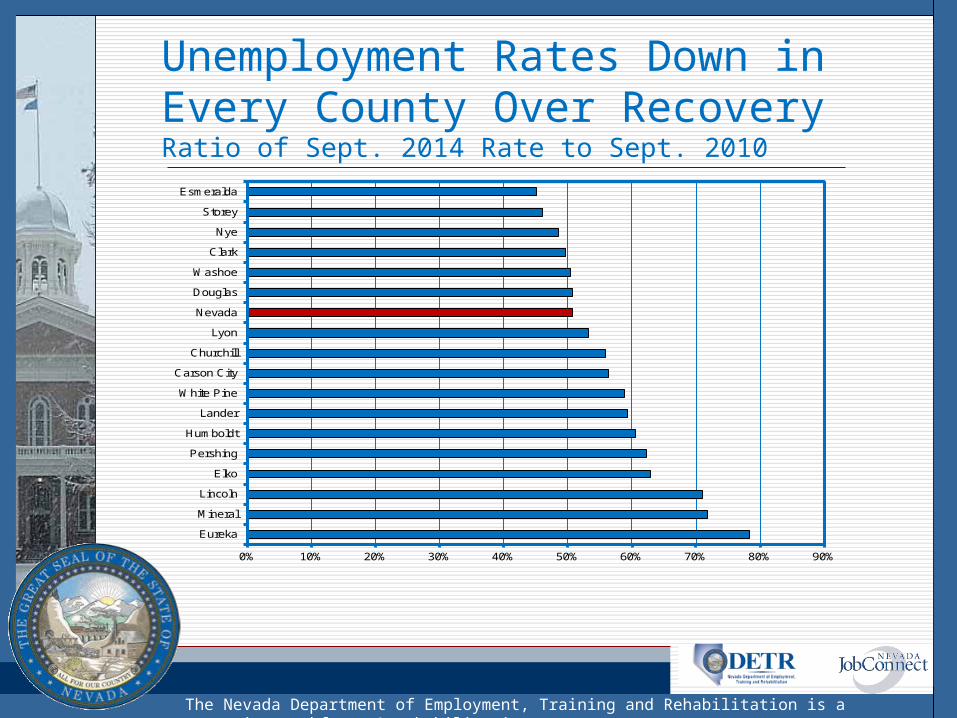
Unemployment Rates Down in Every County Over RecoveryRatio of Sept. 2014 Rate to Sept. 2010
0% 10% 20% 30% 40% 50% 60% 70% 80% 90%
Eureka
Mineral
Lincoln
Elko
Pershing
Humboldt
Lander
White Pine
Carson City
Churchill
Lyon
Nevada
Douglas
Washoe
Clark
Nye
Storey
Esmeralda

The Nevada Department of Employment, Training and Rehabilitation is a proactive workforce & rehabilitation agency
FT Employment Rises; PT Holds SteadyFull-Time vs. Part-Time Employment (CPS data; 12-month moving average)
0
200,000
400,000
600,000
800,000
1,000,000
1,200,000
'05 '06 '07 '08 '09 '10 '11 '12 '13 '14
Full-Time Part-Time

The Nevada Department of Employment, Training and Rehabilitation is a proactive workforce & rehabilitation agency
State Employment (SA)
Non-Farm Job Levels Up 38,200 Relative to a Year Ago 3.2% gain compares to 1.9% in the nation 45 consecutive months of year-over-year gains
Down -1,800 Over the Month 8,600 (NSA2) jobs were expected to be added based
upon historical trends, but 6,800 were actually added, resulting in the seasonally adjusted decline
2nd consecutive monthly decline…estimation model may be correcting for over-estimates during prior months
2not seasonally adjusted

The Nevada Department of Employment, Training and Rehabilitation is a proactive workforce & rehabilitation agency
NV Adds 38,200 Jobs Relative to Year-Ago; Trending up for 45 monthsNonfarm Jobs in Nevada (SA)
1,000,000
1,050,000
1,100,000
1,150,000
1,200,000
1,250,000
1,300,000
1,350,000
1,400,000
'04 '05 '06 '07 '08 '09 '10 '11 '12 '13 '14

The Nevada Department of Employment, Training and Rehabilitation is a proactive workforce & rehabilitation agency
Job Growth Hovering in 3-4% Range the Past Year; Some Signs of EasingJob Growth (SA; year-over-year)
0.0%
0.5%
1.0%
1.5%
2.0%
2.5%
3.0%
3.5%
4.0%
4.5%
0
5,000
10,000
15,000
20,000
25,000
30,000
35,000
40,000
45,000
50,000
O N D J F M A M J J A S O N D J F M A M J J A S
2012 2013 2014
perc
ent c
hange
jobs
Jobs Pct. Change

The Nevada Department of Employment, Training and Rehabilitation is a proactive workforce & rehabilitation agency
NV on Pace to Add Close to 100K Jobs Since 2010Nevada Job Growth Since 2010
Total(Private+Public) Private Sector
2010 Baseline 1,117,800 964,000
Calculation of 2011 Growth2011 1,125,700 975,500Growth from 2010 7,900 11,500
Calculation of 2012 Growth2012 1,144,800 995,500Growth from 2011 19,100 20,000
Calculation of 2013 Growth2013 1,175,700 1,024,700Growth from 2012 30,900 29,200
Calculation of 2014 Year-to-Date Growth2013 Year-to-Date (through September) 1,167,600 1,017,5002014 Year-to-Date (through September) 1,209,400 1,058,800Year-to-Date Growth from 2013 41,800 41,300
Total Growth Since 2010 (2011 Growth + 2012 Growth + 2013 Growth + 2014 YTD Growth) 99,700 102,000

The Nevada Department of Employment, Training and Rehabilitation is a proactive workforce & rehabilitation agency
Job Gains > Losses in 13 Straight Qtrs.Business Employment Dynamics: Private Sector Gross Job Gains vs. Gross Job Losses (SA)
0
20,000
40,000
60,000
80,000
100,000
120,000
'04 '05 '06 '07 '08 '09 '10 '11 '12 '13
gross job gains gross job losses

The Nevada Department of Employment, Training and Rehabilitation is a proactive workforce & rehabilitation agency
Opening Gains > Closing LossesBusiness Employment Dynamics: Gross Job Gains vs. Gross Losses in New & Closing Establishments (SA)
6,000
8,000
10,000
12,000
14,000
16,000
18,000
'04 '05 '06 '07 '08 '09 '10 '11 '12 '13
gains from openings losses from closings

The Nevada Department of Employment, Training and Rehabilitation is a proactive workforce & rehabilitation agency
Nearly All Sectors Contributing; PBS Leads the Way; Construction up 6,100YTD Job Growth by Sector
-2,000 0 2,000 4,000 6,000 8,000 10,000 12,000
Mining & Logging
Government
Other Services
Financial Activities
Manufacturing
Education & Health Services
Construction
Trade, Transportation, & Utilities
Leisure & Hospitality
Professional & Business Services

The Nevada Department of Employment, Training and Rehabilitation is a proactive workforce & rehabilitation agency
Seasonal Holiday Hiring Could Approach Last Year’s 13,500September-December Growth in Trade/Transportation Jobs
-2,000
0
2,000
4,000
6,000
8,000
10,000
12,000
14,000
'04 '05 '06 '07 '08 '09 '10 '11 '12 '13
The Nevada Department of Employment, Training and Rehabilitation is a proactive workforce & rehabilitation agency
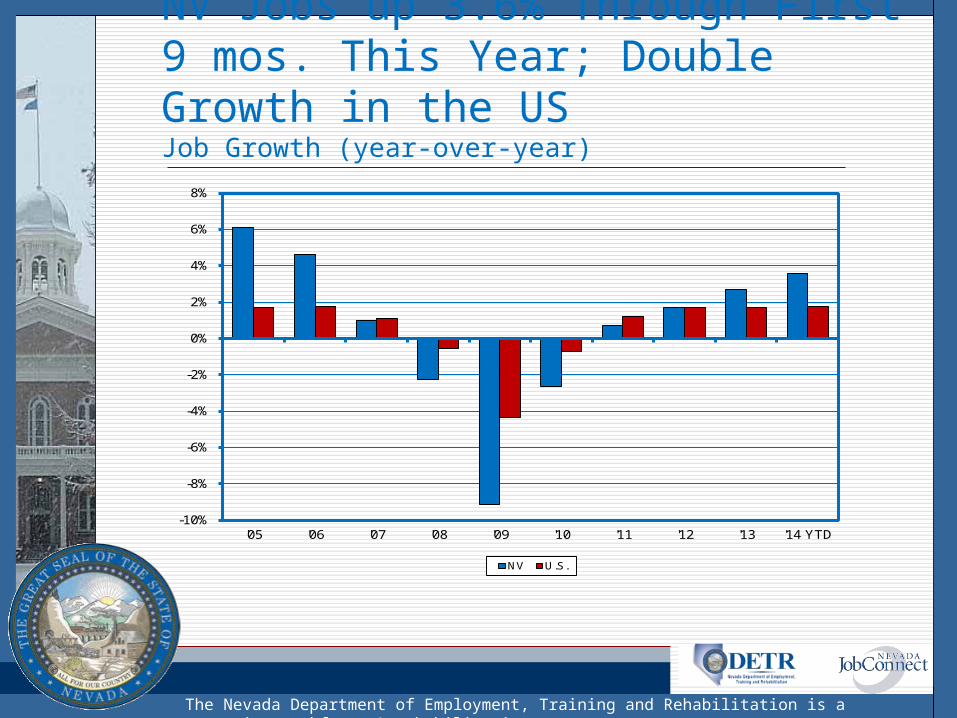
NV Jobs up 3.6% Through First 9 mos. This Year; Double Growth in the USJob Growth (year-over-year)
-10%
-8%
-6%
-4%
-2%
0%
2%
4%
6%
8%
'05 '06 '07 '08 '09 '10 '11 '12 '13 '14 YTD
NV U.S.

The Nevada Department of Employment, Training and Rehabilitation is a proactive workforce & rehabilitation agency
Job Growth Stronger Than in 48 StatesQCEW Job Growth Rankings (# of states with slower private sector job growth than NV; 2014 YTD through IQ)
50 49
46
14
20 0
14
24
38
48
0
10
20
30
40
50
'04 '05 '06 '07 '08 '09 '10 '11 '12 '13 '14 YTD

The Nevada Department of Employment, Training and Rehabilitation is a proactive workforce & rehabilitation agency
Small Business Adding Employment Since 2010Employment in Establishments with less than 100 Workers
450,000
470,000
490,000
510,000
530,000
550,000
570,000
590,000
610,000
2005 2006 2007 2008 2009 2010 2011 2012 2013 2014

The Nevada Department of Employment, Training and Rehabilitation is a proactive workforce & rehabilitation agency
Affordable Care Act: No Anecdotal Evidence that Businesses are ShrinkingBusinesses Crossing the 50-Employee Threshold (2013-2014)
Business Size Relative to the 50-Employee ACA Threshold Number of BusinessesStayed Above 3,773 Stayed Below 52,764 Fell Below 271 Rose Above 345 Total 57,153

The Nevada Department of Employment, Training and Rehabilitation is a proactive workforce & rehabilitation agency
For Additional Information, Please Contact:
Nevada Department of Employment, Training and Rehabilitation
Research and Analysis Bureau
Bill Anderson
Chief Economist
(775) 684-0450
http://www.nevadaworkforce.com
follow us on Twitter @nvlabormarket