neurophysiological and behavioral measures of musical ...neurophysiological and behavioral measures...
TRANSCRIPT

Neurophysiological and Behavioral Measures of Musical Engagement Blair Kaneshiro,*1 Duc T. Nguyen,* Jacek P. Dmochowski, #† Anthony M. Norcia, # Jonathan Berger*2
*Center for Computer Research in Music and Acoustics, Stanford University, USA #Department of Psychology, Stanford University, USA
†Department of Biomedical Engineering, City College of New York, USA [email protected], [email protected]
ABSTRACT Inter-subject correlations (ISCs) of cortical responses have been shown to index audience engagement with narrative works. In parallel lines of research, continuous self-reports and physiological measures have linked listener engagement and arousal with specific musical events. Here we combine EEG-ISCs, physiological responses, and continuous self-reports to assess listener engagement and arousal in response to a full-length musical excerpt. The temporal resolution of these measures permits connections to be drawn among them, and also to corresponding musical events in the stimulus. Simultaneous 128-channel EEG, ECG, and respiratory inductive plethysmography were recorded from 13 musicians who heard the first movement of Elgar’s E-Minor Cello Concerto in original and reversed conditions. Continuous self-reports of engagement with each excerpt were collected in a separate listen. ISCs of EEG responses were computed in the subspace of its maximally correlated component. Temporally resolved measures of activity and synchrony were computed from heart rate, respiratory rate, respiratory amplitude, and continuous behavioral responses. Results indicate that all but one of the response measures (heart rate activity) achieves statistical significance over the course of the original excerpt. Furthermore, regions of statistical significance can be linked to salient musical events. Finally, activity and synchrony of a given physiological or behavioral response at times occur in alternation, highlighting the utility of considering both measures. These findings constitute a first step toward relating EEG-based measures of engagement to physiology and behavior, while also helping to further disentangle engagement and arousal.
I. INTRODUCTION The enjoyment of music is ubiquitous among humans. Its experience varies in the quality and intensity of engagement with the sound, ranging from passive and subconscious to deeply engrossed and attentive. In addition to audition – whether active or passive – music can serve to organize and coordinate movement, and also serves a variety of other utilitarian and hedonistic functions. As a result, both qualitative and quantitative measures of engagement are elusive. Here we introduce an integrated approach to measure musical engagement through cortical responses, physiological markers associated with arousal and emotional response to music, and continuous self-reports.
In recent years, the use of inter-subject correlations of cortical responses has facilitated the study of neural processing of naturalistic stimuli. In addition to providing a data-driven approach toward identifying brain regions that activate reliably across individuals, this technique has also highlighted the promise of using neural synchrony as a measure of attentive engagement. For example, inter-subject correlations (ISCs) of responses recorded using functional magnetic resonance imaging (fMRI) have been shown to
increase during emotionally arousing film scenes (Hasson et al., 2004) and in response to rhetorically powerful (as opposed to rhetorically weak) speeches (Schmälzle et al., 2015). While electroencephalographic (EEG) responses provide superior temporal resolution, on the same time scale as musical events, the low signal-to-noise ratio and high dimensionality of this data modality have historically limited its feasibility in analyzing responses to full-length, naturalistic musical works (Kaneshiro & Dmochowski, 2015). However, a recently developed spatial filtering technique for EEG has been successfully applied in an ISC analysis paradigm to study engagement with naturalistic stimuli. This technique, termed Reliable Components Analysis (RCA), computes maximally correlated components across a collection of EEG records (Dmochowski et al., 2012, 2014; Dmochowski, Greaves, & Norcia, 2015). EEG-ISCs computed in one-dimensional subspaces of maximally reliable components have been shown to reflect suspense, tension, and engagement with audiovisual film excerpts (Dmochowski et al., 2012, 2014). EEG-ISCs have also been shown to be higher for intact excerpts of vocal music than for phase-scrambled controls (Kaneshiro et al., 2014). Importantly, this method permits an experimental paradigm in which EEG responses can be compared across audience members, and stimuli representing full works can be presented to experimental participants in a single-exposure paradigm.
A parallel line of research has explored physiological responses to music under the general assumption that music does, indeed, evoke physiological responses in listeners. Studies have often focused on physiological correlates of emotion or arousal in response to naturalistic music excerpts. Distinct changes in continuous physiological measurements that correspond with particularly noticeable musical events (such as a significant structural demarcation or a violated expectation) are noted. Assessing synchrony of physiological responses, the approach taken with cortical ISCs, has to our knowledge not been attempted in music studies, though a relationship between synchrony of heart rate and skin conductance and subsequent charitable contributions has been demonstrated in the setting of viewing an emotional video excerpt (Bracken et al., 2014).
A variety of physiological responses have been employed to characterize and measure fluctuations in arousal or emotional valence associated with music listening. One response of interest is the galvanic skin response (GSR), which is generally found to increase with arousal (Gomez & Danuser, 2004; Gomez & Danuser, 2007; Rickard 2004), harmonic and melodic unexpectedness (Steinbeis, Koelsch, & Sloboda, 2006; Koelsch et al., 2008; Egermann et al., 2013), and in conjunction with musical ‘chills’ (Grewe et al., 2010). Respiratory rate has also been found to increase for faster and more arousing musical excerpts (Gomez & Danuser, 2004;

Gomez & Danuser 2007; Russo, Vempala, & Sandstrom, 2013), while heart rate sometimes increased in response to more arousing music (Russo, Vempala, & Sandstrom, 2013), but often produced no statistically significant change from baseline measures (Gomez & Danuser, 2004; Rickard, 2004; Steinbeis, Koelsch, & Sloboda, 2006; Gomez & Danuser 2007; Koelsch et al., 2008).
Ongoing behavioral responses to music along various dimensions, including locus of attention (Madsen & Geringer, 1990), ‘aesthetic experiences’ (Madsen, Brittin, & Capperella-Sheldon, 1993), and combined valence and arousal measures (Schubert 2004), have been collected using continuous response interfaces. A recent study of particular relevance to the present study involves continuous behavioral ratings of engagement with a live dance performance (Schubert, Vincs, & Stevens, 2013). This study utilizes a definition of engagement that we will use here. The authors additionally consider both the level of engagement and the agreement among participant responses over time. One finding, which we will return to later, is that so-called ‘gem moments’ – in that study described as moments of surprise – bring about sudden rises in engagement level, but periods of heightened agreement tend to occur more when audience expectations have been established and are not interrupted.
In the present study, we aim to validate the application of RCA and EEG-ISCs to study cortical responses to a complete and self-contained musical excerpt from the classical repertoire (in this case a movement from a concerto). Our proposed collection of responses will lead to measures intended to index both engagement (EEG, continuous behavioral responses) and arousal (physiological responses). The responses can additionally be categorized as objective (neurophysiological responses) or subjective (continuous behavioral responses). As our stimulus of interest expresses large fluctuations in arousal, we further seek to interpret the cortical responses among both the levels and the synchronicity of physiological and continuous behavioral responses. Our present analysis focuses on specific periods of very high or low arousal within the musical excerpt, as well as with passages of increasing harmonic and melodic tension, and the introductions of principal and salient musical themes.
II. EXPERIMENTAL DESIGN A. Stimuli
Stimuli for this experiment were drawn from the first movement of Elgar’s Cello Concerto in E Minor, Op. 85, composed in 1919. This work has been shown to induce chills in past experiments (Grewe et al., 2007b; Grewe et al., 2010). The version used here is the recording of the 1965 Jacqueline du Pré performance with sir John Barbirolli and the London Symphony Orchestra, considered to be a definitive and influential performance of the piece (Solomon, 2009).
In descriptive music analysis, salient events are often designated as structurally relevant. These events can include climactic ‘highpoints’ (Agawu, 1984); the introduction and reprise of principal thematic materials; a sudden, generally unexpected pause; and significant changes of timbre or texture, such as a change in orchestration or the entrance of a soloist. Moments of this type in the Barbirolli/Du Pré recording of the Elgar concerto are noted in Table 1.
To prepare the experimental stimuli, we used Audacity software to remix the original digital .m4a audio file of the recording to mono and export to .wav format. We then loaded the .wav file in Matlab and added a linear fade-in and fade-out to the first and last 1000 msec of the piece, respectively. A reversed condition was then created by reversing the stimulus waveform. Finally, we added a second audio channel containing intermittent clicks, which were sent directly to the EEG amplifier for precise time-stamping of the stimuli and were not heard by participants, and saved the outputs as stereo .wav files.
Table 1. Points of interest in Elgar’s Cello Concerto. We identify a set of salient musical events in the excerpt, including points at which the primary theme is introduced (A1, A2) and the start of sections of buildup (B1, B2), which later culminate in highpoints of the piece (C1, C2). We additionally identify a point of low arousal (D). Labels correspond to the labels in Figure 3.
Time Event Label 1:23 Entrance of cello theme A1 2:07 Cello theme, building to high point B1 2:31 Highpoint C1 3:19 Break in content D 6:15 Entrance of cello theme A2 6:39 Orchestral theme, building to high point B2 7:02 High point C2
B. Participants For this experiment we sought healthy, right-handed
participants between 18-35 years old, with normal hearing, who were fluent in English, and who had no cognitive or decisional impairments. As formal musical training has been shown to produce enhanced cortical responses to music (Pantev et al., 1998), we sought participants with at least five years of formal training in classical music. Qualifying forms of training included private lessons, AP or college-level music theory courses, and composition lessons. Years of training did not need to be continuous. Because we wished to avoid involuntary motor activations found to occur in response to hearing music played by one’s own instrument (Haueisen & Knösche, 2001), we recruited participants who had no training or experience with the cello. Finally, as we are interested in listener engagement, we sought participants who reported that they enjoyed listening to classical music, at least occasionally.
We collected usable data from 13 participants (four males, nine females) ranging from 18-34 years of age (mean 23.08 years). All participants met the eligibility requirements for the experiment. Years of formal musical training ranged from 7-17 years (mean 11.65 years). Eight participants were currently involved in musical activities at the time of their experimental session. Music listening ranged from 3-35 hours per week (mean 13.96 hours). Data from three additional participants were excluded during preprocessing due to gross noise artifacts. This study was approved by Stanford University’s Institutional Review Board, and all participants delivered written informed consent prior to their participation in the experiment.
C. Experimental Procedure The experiment was organized in two blocks. The first
block involved the simultaneous EEG and physiological recordings. Here, the participant was instructed to sit still and

listen attentively to the stimuli as they played (no other task was performed) while viewing a fixation image on the monitor in front of him. Each stimulus was presented once in random order and was always preceded by a 1-minute baseline recording, during which time pink noise was played at a low volume. At the conclusion of each trial, the participant used a computer keyboard to rate the pleasantness, arousal, interestingness, predictability, and familiarity of the excerpt just heard. We additionally collected a rating of genre exposure after the original stimulus only.
In the second block, continuous behavioral measures of engagement were recorded. We used the definition from the Schubert, Vincs, & Stevens (2013) study: Being ‘compelled, drawn in, connected to what is happening, interested in what will happen next.’ Participants were shown this definition prior to the trials in this block, and indicated their understanding of the definition and the task before proceeding with the trials. The participant operated a mouse-controlled slider whose position was displayed on the computer monitor. Each stimulus was presented once in random order.
The continuous behavioral block was always second in the experimental session because we did not want the specific definition of engagement presented there to influence participants’ listening behavior during the neurophysiological block, which was intended to involve no cognitive task or effort on the part of the participant beyond listening to the stimuli. This of course introduces a potential confound into the present study, but we found it to be the most appropriate design, as we wanted to collect the full set of responses from each participant. We note that Steinbeis, Koelsch, & Sloboda (2006), who also employed separate neurophysiological and continuous behavioral recordings, presented the continuous behavioral block first. However, participants in that study were given a separate task during the latter block (comparing lengths of stimuli), and thus were likely not impacted by the task of the previous block.
D. Stimulus Delivery and Data Acquisition Experiments for both blocks were programmed using the
Matlab Psychophysics Toolbox (Brainard, 1997) with Matlab R2013b on a Dell Inspiron 3521 laptop computer running the Windows 7 Professional operating system. Audio was output from the stimulus computer via USB to a Native Instruments Komplete Audio 6 sound card, from which the audio channel containing the stimulus was sent to a Behringer Xenyx 502 mixer, split, and presented through two magnetically shielded Genelec 1030A speakers. The second audio channel, containing the timing clicks, was sent directly to the EEG amplifier through one pin of a modified DB-9 cable, which also sent stimulus trigger labels from Matlab and key press events from the participant. The slider interface for the continuous behavioral response block was programmed using a custom implementation within the Psychophysics Toolbox scheme.
Neurophysiological responses were recorded using the Electrical Geodesics, Inc. (EGI) GES 300 system. Dense-array EEG was recorded with vertex reference using unshielded HCGSN 110 and 130 nets. ECG responses were recorded using a two-lead configuration with hydrocel Ag-Cl snap electrodes. Respiratory activity was measured using thorax and abdomen belts that plugged into a Z-Rip Belt
Transducer Module. The ECG and respiratory sensors, leads, and apparatus were obtained from EGI and were approved for use with their Polygraph Input Box (PIB); the electrode net provided the ground for these inputs. While EGI does not currently provide an apparatus for measuring GSR, we attempted to collect it using a custom apparatus which plugged into the PIB. The electrode net and the PIB connected to the Net Amps 300 amplifier. All responses were recorded simultaneously at a sampling rate of 1 kHz. The following filters were applied to the physiological responses at acquisition: • ECG and respiratory: Highpass 0.1 Hz, lowpass 100 Hz,
notch 60 Hz; • GSR: Highpass 0.05 Hz, lowpass 3 Hz, notch 60 Hz.
No filtering was applied to the EEG responses at acquisition. Physiological signals and amplified EEG signals were recorded using EGI Net Station software, version 4.5.7, on a Power Mac G5 desktop computer running the OSX operating system, version 10.6.8. Continuous behavioral responses were recorded to the stimulus laptop at a sampling rate of 20 Hz.
III. DATA ANALYSIS E. EEG Preprocessing and Analysis
Initial preprocessing steps were performed using EGI’s Net Station software. EEG recordings were bandpass filtered between 0.3-50 Hz and temporally downsampled by a factor of 8 to a sampling rate of 125 Hz. Data records were then exported to .mat format.
All subsequent analyses were performed in Matlab using a custom software implementation. Individual recordings were annotated, and trials were epoched using the precisely timed click events sent from the secondary audio channel directly to the EEG amplifier. Despite the filtering step described above, we found it necessary to DC-correct and detrend each trial epoch of data. Following these procedures, we retained electrodes 1 through 124 for analysis, excluding electrodes on the face. Bad electrodes were identified and removed from the data frame (i.e., the number of rows in the data decreased). Ocular artifacts were removed from concatenated trials of each EEG recording in a semi-automatic procedure using Extended Infomax ICA (Bell & Sejnowski, 1995; Jung et al., 1998), as implemented in the Matlab EEGLAB Toolbox (Delorme & Makeig, 2004). Following this, any electrode for which at least 10% of voltage magnitudes exceeded 50 µV across the recording was flagged as a bad electrode; if any such electrodes were identified, the preprocessing process was re-started with these channels of data removed. Once no further electrodes were identified in this stage, any electrode for which at least 10% of voltage magnitudes exceeded 50 µV for a given trial were removed from that trial only. As final preprocessing steps, we removed noisy transient spikes from the data in an iterative procedure, setting to NaN any data samples whose magnitude voltage exceeded four standard deviations of its channel’s mean power. Next, the removed rows corresponding to bad electrodes were reconstituted with rows of NaNs. Finally, a row of zeros representing the reference channel was added to the data matrix, and the data were converted to average reference.
Data from 3 (out of 16) participants who completed the experiment had to be excluded from further analysis, resulting

in the 13 usable datasets. Excluded participants were identified during preprocessing on the basis of gross noise artifacts (20 or more bad electrodes). We also excluded the physiological and behavioral responses collected from these participants so that the comparison of results would always involve the same population of participants.
Cleaned data frames for each stimulus were aggregated across participants into time-by-electrodes-by-participant matrices. RCA was computed over responses to both stimuli using a publicly available Matlab implementation (Dmochowski, Greaves, & Norcia, 2015), according to the procedure described in Dmochowski et al. (2012). This is the RCA output that we use in the computation of ISCs. For visual comparison of the topographies only, we also ran RCA separately for the set of responses corresponding to each stimulus condition.
F. Physiological Response Preprocessing Over the course of data collection, we discovered that the
GSR apparatus was not working correctly. This response is therefore excluded from analysis. It appears that the apparatus also introduced substantial noise into the EEG recordings. However, we used the GSR apparatus with all participants in order to maintain a consistent experimental procedure.
The Net Station waveform tool used to filter and downsample the EEG data would perform only the downsampling step on physiological responses. Therefore, to avoid possible aliasing artifacts that could result from downsampling without a prior lowpass filtering step, we exported the physiological responses at the original sampling rate (1 kHz) and performed all filtering operations in Matlab.
Full recordings of ECG responses (prior to epoching) were lowpass filtered to 50 Hz using a zero-phase 8th-order Chebyshev Type I filter, and then downsampled by a factor of 8. We then epoched the data into baseline and stimulus trials. Each ECG signal was converted to a time-resolved measure of heart rate (HR), in beats per minute, using time intervals between successive R peaks, and then spline interpolated to a sampling rate of 125 Hz. We baseline corrected each HR vector by subtracting out the mean bpm across 25-55 seconds of the corresponding baseline recording.
We found the chest and abdomen respiratory activations to be highly correlated, and focus our analyses here on the chest activations only, which tended to be larger in amplitude. Full recordings of respiratory responses were lowpass filtered using a zero-phase 8th-order Butterworth filter with a cutoff frequency of 1 Hz, and then temporally downsampled by a factor of 8. The data were then epoched into baseline and stimulus trials. While from the ECG responses we computed only HR, we can derive two measures of interest from the respiratory activations: Respiratory rate and respiratory amplitude. Our first step in computing these measures over time was to employ a peak-finding algorithm to identify the positive and negative peaks in the response. From these, respiratory rate over time (RRate) was computed from the time intervals between successive positive peaks. Respiratory amplitude over time (RAmpl) was computed from successive peak-to-trough and trough-to-peak amplitude differences. Finally, both response vectors were spline-interpolated to a sampling rate of 125 Hz. As with the HR data, these measures
were baseline corrected using mean values computed from 25-55 seconds of the respective baseline recording.
Due to possible orienting responses at the start of a trial (Lundqvist et al., 2009), as well as spline-interpolation artifacts at the start and end of the trials, we discarded the first and last 5 seconds of data from all physiological responses.
G. Continuous Behavioral Response Preprocessing Continuous behavioral (CB) responses were aggregated
across participants into a time-by-participants matrix. While the interpolation artifacts mentioned above were not an issue here, this type of response is known to suffer from reliability issues at the start and end of the stimulus (Schubert, 2013). Therefore, to account for that and for any orienting responses, we discarded the first and last 10 seconds of response from further analysis. Once these potentially transient portions of the data were removed, we z-scored each response.
H. Inter-Subject Correlations Inter-subject correlations of EEG, HR, RAmpl, RResp, and
CB responses were each computed using a 10-second sliding window that advanced in 1-second increments, resulting in an effective temporal resolution of 1 Hz. In each time window, ISCs were computed across all unique pairs of participants; for 13 participants, this comes out to n-choose-13=78 pairs. We present mean ISCs across participant pairs for every temporal window, mapped to the midpoint times of the windows.
I. Statistical Analyses We performed paired two-tailed t-tests on the participant
ratings that were delivered after each trial of the neurophysiological block, using the Bonferroni correction for multiple comparisons (McDonald, 2014).
To assess the statistical significance of mean HR, RAmpl, RRate, and CB activity responses, we performed two-tailed Wilcoxon signed-rank tests (Lehmann, 2006) across the collection of responses at every time point. This assessed whether the sample of responses at a given time point was drawn from a zero-median distribution. We report statistically significant results at α=0.05 after controlling for False Discovery Rate (Benjamini & Yekutieli, 2001).
Statistical significance of time-resolved ISCs was assessed using a permutation test (Fisher, 1971). In every permutation iteration, each participant’s response vector was shuffled according to non-overlapping 5-second segments. ISCs were then computed over the collection of the shuffled responses. This procedure was repeated for 500 iterations. The 0.95 quantile of mean ISCs across all permutation iterations designates the statistical significance threshold.
IV. RESULTS J. Behavioral Ratings
We first analyzed the behavioral ratings collected during the neurophysiological block to determine whether participant ratings of pleasantness, arousal, interestingness, predictability, and familiarity differed significantly according to stimulus condition. The distribution of responses, along with responses from individual participants and p-values from the tests, are shown in Figure 1. Using the Bonferroni-corrected p-value
threshold of 0.01, only the dimensions of pleasantness and predictability are found to vary significantly according to the stimulus condition. In both cases, the original (forward) stimulus garners higher ratings. Interestingly, we note that while familiarity with the stimuli was low overall, two of the 13 participants reported that they were at least moderately familiar with the reversed stimulus. Finally, ratings of genre exposure range from 2-9 with a mean value of 5.08, verifying that all participants met the inclusion criterion of listening to classical music at least occasionally.
Figure 1. Behavioral ratings of the stimuli. Participants delivered ratings along dimensions of pleasantness, arousal, interestingness, predictability, and familiarity after hearing each stimulus for the first time. Participants reported their exposure to the genre of the original stimulus only. Boxplots as well as individual participant ratings are shown. Ratings of Pleasantness and Predictability are found to differ significantly by stimulus condition using a corrected p-value threshold of 0.01.
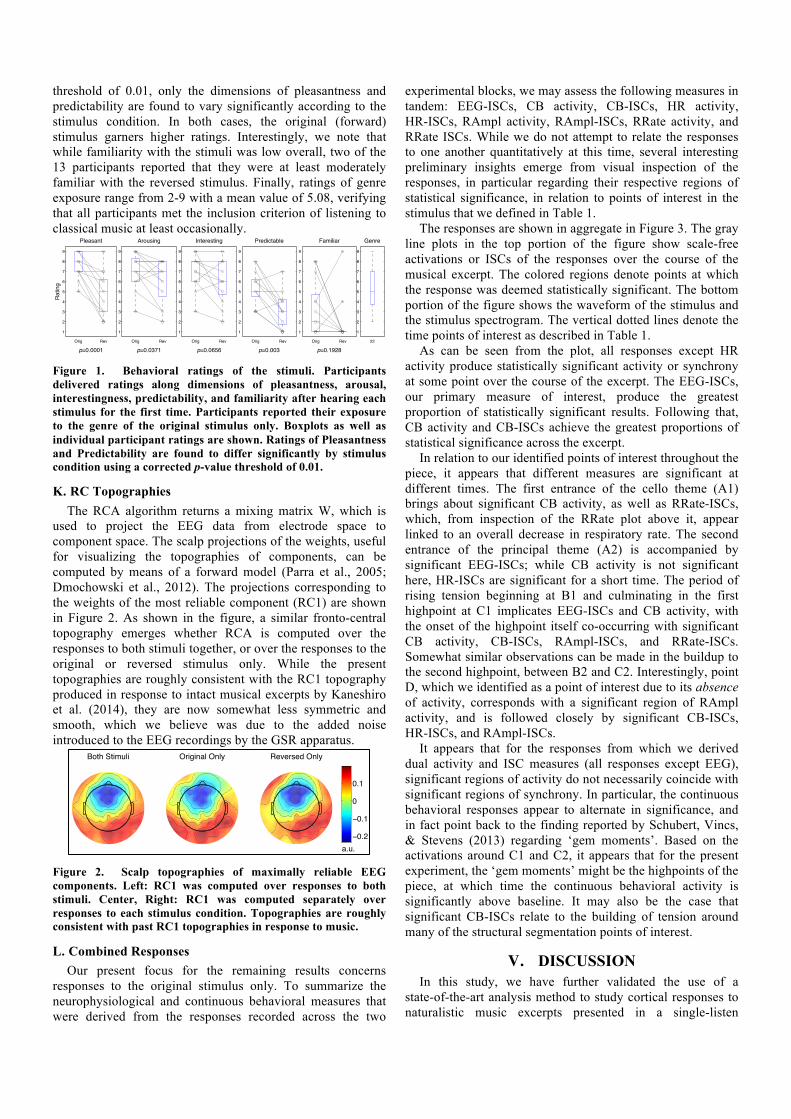
K. RC Topographies The RCA algorithm returns a mixing matrix W, which is
used to project the EEG data from electrode space to component space. The scalp projections of the weights, useful for visualizing the topographies of components, can be computed by means of a forward model (Parra et al., 2005; Dmochowski et al., 2012). The projections corresponding to the weights of the most reliable component (RC1) are shown in Figure 2. As shown in the figure, a similar fronto-central topography emerges whether RCA is computed over the responses to both stimuli together, or over the responses to the original or reversed stimulus only. While the present topographies are roughly consistent with the RC1 topography produced in response to intact musical excerpts by Kaneshiro et al. (2014), they are now somewhat less symmetric and smooth, which we believe was due to the added noise introduced to the EEG recordings by the GSR apparatus.
Figure 2. Scalp topographies of maximally reliable EEG components. Left: RC1 was computed over responses to both stimuli. Center, Right: RC1 was computed separately over responses to each stimulus condition. Topographies are roughly consistent with past RC1 topographies in response to music.
L. Combined Responses Our present focus for the remaining results concerns
responses to the original stimulus only. To summarize the neurophysiological and continuous behavioral measures that were derived from the responses recorded across the two
experimental blocks, we may assess the following measures in tandem: EEG-ISCs, CB activity, CB-ISCs, HR activity, HR-ISCs, RAmpl activity, RAmpl-ISCs, RRate activity, and RRate ISCs. While we do not attempt to relate the responses to one another quantitatively at this time, several interesting preliminary insights emerge from visual inspection of the responses, in particular regarding their respective regions of statistical significance, in relation to points of interest in the stimulus that we defined in Table 1.
The responses are shown in aggregate in Figure 3. The gray line plots in the top portion of the figure show scale-free activations or ISCs of the responses over the course of the musical excerpt. The colored regions denote points at which the response was deemed statistically significant. The bottom portion of the figure shows the waveform of the stimulus and the stimulus spectrogram. The vertical dotted lines denote the time points of interest as described in Table 1.
As can be seen from the plot, all responses except HR activity produce statistically significant activity or synchrony at some point over the course of the excerpt. The EEG-ISCs, our primary measure of interest, produce the greatest proportion of statistically significant results. Following that, CB activity and CB-ISCs achieve the greatest proportions of statistical significance across the excerpt.
In relation to our identified points of interest throughout the piece, it appears that different measures are significant at different times. The first entrance of the cello theme (A1) brings about significant CB activity, as well as RRate-ISCs, which, from inspection of the RRate plot above it, appear linked to an overall decrease in respiratory rate. The second entrance of the principal theme (A2) is accompanied by significant EEG-ISCs; while CB activity is not significant here, HR-ISCs are significant for a short time. The period of rising tension beginning at B1 and culminating in the first highpoint at C1 implicates EEG-ISCs and CB activity, with the onset of the highpoint itself co-occurring with significant CB activity, CB-ISCs, RAmpl-ISCs, and RRate-ISCs. Somewhat similar observations can be made in the buildup to the second highpoint, between B2 and C2. Interestingly, point D, which we identified as a point of interest due to its absence of activity, corresponds with a significant region of RAmpl activity, and is followed closely by significant CB-ISCs, HR-ISCs, and RAmpl-ISCs.
It appears that for the responses from which we derived dual activity and ISC measures (all responses except EEG), significant regions of activity do not necessarily coincide with significant regions of synchrony. In particular, the continuous behavioral responses appear to alternate in significance, and in fact point back to the finding reported by Schubert, Vincs, & Stevens (2013) regarding ‘gem moments’. Based on the activations around C1 and C2, it appears that for the present experiment, the ‘gem moments’ might be the highpoints of the piece, at which time the continuous behavioral activity is significantly above baseline. It may also be the case that significant CB-ISCs relate to the building of tension around many of the structural segmentation points of interest.
V. DISCUSSION In this study, we have further validated the use of a
state-of-the-art analysis method to study cortical responses to naturalistic music excerpts presented in a single-listen
1
2
3
4
5
6
7
8
9
Orig Rev
Pleasant
Rating
p=0.0001
1
2
3
4
5
6
7
8
9
Orig Rev
Arousing
p=0.0371
1
2
3
4
5
6
7
8
9
Orig Rev
Interesting
p=0.0656
1
2
3
4
5
6
7
8
9
Orig Rev
Predictable
p=0.003
1
2
3
4
5
6
7
8
9
Orig Rev
Familiar
p=0.1928
1
2
3
4
5
6
7
8
9
22
Genre
Both Stimuli Original Only Reversed Only
a.u.−0.2
−0.1
0
0.1

paradigm using EEG. Furthermore, we took first steps toward analyzing these responses alongside various physiological and behavioral responses, seeking points of correspondence among the responses and in relation to the musical stimulus. We analyzed both the activity and the synchrony of the physiological and continuous behavioral responses, and found that these dual measures reached statistical significance at times in tandem, at times in alternation. Finally, by assessing measures intended to denote engagement in conjunction with measures intended to denote arousal, we took a first step toward disentangling these two constructs.
A number of issues can be improved upon in future iterations of this research. First, more work is needed to integrate a GSR recording modality into the EGI PIB for simultaneous collection with the EEG responses. Next, given that our stimulus was chosen for its variation in arousal, which is arguably related to loudness, it may be useful to introduce other control stimuli that retain the amplitude envelope of the original version while manipulating the musicality and temporal coherence of the underlying content. Finally, it is important to note that each response analyzed here occurs at some point after its corresponding musical event; these lags vary according to the measure and have not been definitively determined. For example, while we may assume that EEG responses occur within 500 msec of a stimulus and, in the context of the 10-second ISC window, can be treated as concurrent with the stimulus, more care must be taken with the other responses. Stimulus-to-response time has been estimated to range from 1-5 seconds for physiological responses (Schubert & Dunsmuir, 1999; Grewe et al., 2007a; Grewe, Kopiez, & Altenmüller, 2009; Bracken
et al., 2014), and roughly 1-3 seconds for behavioral responses (Krumhansl, 1996; Schubert, 2004; Sammler et al., 2007; Egermann et al., 2013). From inspection of the regions of significance in Figure 3, it appears that shifting the continuous behavioral and physiological responses back in time by such amounts (to the corresponding stimulus events), might in fact improve their alignment with our musical events of interest in some cases, and lead to alternate interpretations in others. Thus, this will be an interesting topic to consider further in future research.
In conclusion, EEG-ISCs, physiological responses, and continuous self-reports suggest a promising combined framework with which to characterize musical engagement. Fluctuations in the quantitative physiological measures reflect fluctuation in arousal levels, which, when changing in approximate simultaneity across measures, and correspondent with changes in the musical signal (such as changes in spectral energy or intensity, or a rise in musical tension), can be interpreted in conjunction with both cortical and continuous behavioral measures of engagement.
ACKNOWLEDGMENT This research was supported by a grant from the
Wallenberg Network Initiative: Culture, Brain Learning. The authors thank Jay Kadis for his assistance with the custom GSR apparatus.
REFERENCES Agawu, V. K. (1984) Structural ‘Highpoints’ in Schumann’s
‘Dichterliebe’. Music Analysis, 3(2) 159-180.
Figure 3. Aggregate neurophysiological and continuous behavioral measures. Top: The measures, in order, are EEG inter-subject correlations (EEG-ISCs), continuous behavioral median z-scored activity and inter-subject correlations (CB, CB-ISC), heart rate median deviation from baseline and inter-subject correlations (HR, HR-ISC), respiratory amplitude median deviation from baseline and inter-subject correlations (RAmpl, RAmpl-ISC), and respiratory rate median deviation from baseline and inter-subject correlations (RRate, RRate-ISC). The colored regions on each line plot denote periods of statistically significant activity or synchrony. Middle/Bottom: The stimulus waveform and spectrogram are plotted for reference. Dashed vertical lines correspond to musical events of interest. Annotations at the top of the plot (A1, B1, C1, D, A2, B2, C2) correspond to the labels in Table 1.

Benjamini, Y., & Yekutieli, D. (2001). The control of the false discovery rate in multiple testing under dependency. Annals of Statistics, 29(4), 1165-1188.
Bell, A. J., & Sejnowski, T. J. (1995). An information-maximization approach to blind separation and blind deconvolution. Neural computation, 7(6), 1129-1159.
Bracken, B. K., Alexander, V., Zak, P. J., Romero, V., & Barraza, J. A. (2014). Physiological synchronization is associated with narrative emotionality and subsequent behavioral response. In Foundations of Augmented Cognition, 3-13. Springer.
Brainard, D. H. (1997). The psychophysics toolbox. Spatial Vision, 10, 433-436.
Delorme, A., & Makeig, S. (2004). EEGLAB: an open source toolbox for analysis of single-trial EEG dynamics including independent component analysis. Journal of neuroscience methods, 134(1), 9-21.
Dmochowski, J. P., Sajda, P., Dias, J., & Parra, L. C. (2012). Correlated components of ongoing EEG point to emotionally laden attention–a possible marker of engagement? Frontiers in human neuroscience, 6(112).
Dmochowski, J. P., Bezdek, M. A., Abelson, B. P., Johnson, J. S., Schumacher, E. H., & Parra, L. C. (2014). Audience preferences are predicted by temporal reliability of neural processing. Nature communications, 5.
Dmochowski, J. P., Greaves, A. S., & Norcia, A. M. (2015). Maximally reliable spatial filtering of steady state visual evoked potentials. Neuroimage, 109, 63-72.
Egermann, H., Pearce, M. T., Wiggins, G. A., & McAdams, S. (2013). Probabilistic models of expectation violation predict psychophysiological emotional responses to live concert music. Cognitive, Affective, & Behavioral Neuroscience 13, 533-553.
Fisher, R. A. (1971). The Design of Experiments. New York: Macmillan Publishing Co.
Gomez, P., & Danuser, B. (2004). Affective and physiological responses to environmental noises and music. International Journal of Psychophysiology 53, 91-103.
Gomez, P., & Danuser, B. (2007). Relationships between musical structure and psychophysiological measures of emotion. Emotion 7(2), 377-387.
Grewe, O., Nagel, F., Kopiez, R., & Altenmüller, E. (2007a). Emotions over time: Synchronicity and development of subjective, physiological, and facial affective reactions to music. Emotion 7(4), 774-778.
Grewe, O., Nagel, F., Kopiez, R., & Altenmüller, E. (2007b). Listening to music as a re-creative process: Physiological, psychological, and psychoacoustical correlates of chills and strong emotions. Music Perception, 24(3), 297-314.
Grewe, O., Kopiez, R., & Altenmüller, E. (2009). The chill parameter: Goose bumps and shivers as promising measures in emotion research. Music Perception, 27(1), 61-74.
Grewe, O., Katzur, B., Kopiez, R., & Altenmüller, E. (2010). Chills in different sensory domains: Frisson elicited by acoustical, visual, tactile and gustatory stimuli. Psychology of Music 39(2), 220-239.
Hasson, U., Nir, Y., Levy, I., Fuhrmann, G., & Malach, R. (2004). Intersubject synchronization of cortical activity during natural vision. Science, 303(5664), 1634-1640.
Haueisen, J., & Knösche, T. R. (2001). Involuntary motor activity in pianists evoked by music perception. Journal of cognitive neuroscience, 13(6), 786-792.
Jung, T. P., Humphries, C., Lee, T. W., Makeig, S., McKeown, M. J., Iragui, V., & Sejnowski, T. J. (1998). Extended ICA removes artifacts from electroencephalographic recordings. Advances in neural information processing systems, 894-900.
Kaneshiro, B., Dmochowski, J. P., Norcia, A. M., & Berger, J. (2014). Toward an objective measure of listener engagement with natural music using inter-subject EEG correlation. In ICMPC13-APSCOM5.
Kaneshiro, B., & Dmochowski, J. P. (2015). Neuroimaging methods for music information retrieval: Current findings and future prospects. In ISMIR’15.
Koelsch, S., Kilches, S., Steinbeis, N., & Schelinski, S. (2008). Effects of unexpected chords and of performer's expression on brain responses and electrodermal activity. PLoS ONE 3:7, e2631.
Krumhansl, C. L. (1996). A perceptual analysis of Mozart's Piano Sonata K. 282: Segmentation, tension, and musical ideas. Music Perception, 13(3), 401-432.
Lehmann, E. L. (2006). Nonparametrics: Statistical Methods Based on Ranks. Springer.
Lundqvist, L. O., Carlsson, F., Hilmersson, P., & Juslin, P. (2009). Emotional responses to music: Experience, expression, and physiology. Psychology of Music 37(1), 61-90.
Madsen, C. K., & Geringer, J. M. (1990). Differential patterns of music listening: Focus of attention of musicians versus nonmusicians. Bulletin of the Council for Research in Music Education, 45-57.
Madsen, C. K., Brittin, R. V., & Capperella-Sheldon, D. A. (1993). An empirical method for measuring the aesthetic experience to music. Journal of Research in Music Education, 41(1), 57-69.
McDonald, J. H. (2014). Handbook of Biological Statistics. Baltimore: Sparky House Publishing.
Pantev, C., Oostenveld, R., Engelien, A., Ross, B., Roberts, L. E., & Hoke, M. (1998). Increased auditory cortical representation in musicians. Nature, 392(6678), 811-814.
Parra, L. C., Spence, C. D., Gerson, A. D., & Sajda, P (2005). Recipes for the linear analysis of EEG. NeuroImage, 28(2), 326-341.
Rickard, N. S. (2004). Intense emotional responses to music: A test of the physiological arousal hypothesis. Psychology of Music 32(4), 371-388.
Russo, F. A., Vempala, N. N., & Sandstrom, G. M. (2013). Predicting musically induced emotions from physiological inputs: linear and neural network models. Frontiers in Psychology, 4, article 468.
Sammler, D., Grigutsch, M., Fritz, T., & Koelsch, S. (2007). Music and emotion: electrophysiological correlates of the processing of pleasant and unpleasant music. Psychophysiology, 44(2), 293-304.
Schmälzle, R., Häcker, F. E., Honey, C. J., & Hasson, U. (2015). Engaged listeners: shared neural processing of powerful political speeches. Social cognitive and affective neuroscience, nsu168.
Schubert, E., & Dunsmuir, W. (1999). Regression modelling continuous data in music psychology. Music, mind, and science, 298-352.
Schubert, E. (2004). Modeling perceived emotion with continuous musical features. Music Perception: An Interdisciplinary Journal, 21(4), 561-585.
Schubert, E. (2013). Reliability issues regarding the beginning, middle and end of continuous emotion ratings to music. Psychology of music, 41(3), 350-371.
Schubert, E., Vincs, K., & Stevens, C. J. (2013). Identifying regions of good agreement among responders in engagement with a piece of live dance. Empirical Studies of the Arts, 31(1), 1-20.
Solomon, J. (2009). Deconstructing the definitive recording: Elgar’s Cello Concerto and the influence of Jacqueline du Pré. Unpublished manuscript.
Steinbeis, N., Koelsch, S., & Sloboda, J. A. (2006). The role of harmonic expectancy violations in musical emotions: Evidence from subjective, physiological, and neural responses. Journal of Cognitive Neuroscience 18(8), 1380-1393.