neuron glia biology, 2007, 3, 335–351. 2008 cambridge
TRANSCRIPT

Reactive astrocytosis and glial glutamatetransporter clustering are early changes in aspinocerebellar ataxia type 1 transgenic mousemodel
roberto giovannoni1
nicola maggio2
maria rosaria bianco2
carlo cavaliere2
giovanni cirillo2
marialuisa lavitrano1 , 3
and
michele papa2 , 3
Spinocerebellar ataxia type 1 (SCA1) is a neurodegenerative disorder caused by an expanded CAG trinucleotide repeats within
the coding sequence of the ataxin-1 protein. In the present study, we used a conditional transgenic mouse model of SCA1 to
investigate very early molecular and morphological changes related to the behavioral phenotype. In mice with neural deficits
detected by rotarod performance, and simultaneous spatial impairments in exploratory activity and uncoordinated gait, we
observed both significant altered expression and patchy distribution of excitatory amino acids transporter 1. The molecular
changes observed in astroglial compartments correlate with changes in synapse morphology; synapses have a dramatic
reduction of the synaptic area external to the postsynaptic density. By contrast, Purkinje cells demonstrate preserved structure.
In addition, severe reactive astrocytosis matches changes in the glial glutamate transporter and synapse morphology. We
propose these morpho-molecular changes are the cause of altered synaptic transmission, which, in turn, determines the onset
of the neurological symptoms by altering the synaptic transmission in the cerebellar cortex of transgenic animals. This model
might be suitable for testing drugs that target activated glial cells in order to reduce CNS inflammation.
Keywords: EAAT1, synaptic plasticity, SCA1, neurodegeneration
INTRODUCTION
The contribution of non-neuronal cells to the pathogenesisof neurodegenerative diseases has been described althoughthe mechanism remains poorly understood. The role ofneuron–glia interactions is also being investigated in neuro-degenerative diseases such as amyotrophic lateral sclerosis(ALS) and Alzheimer’s disease (Sheldon and Robinson,2007). Moreover, glial dysfunction is likely to contribute tothe pathogenesis of cerebellar ataxia in a mouse model ofspinocerebellar ataxia type 7 (SCA7) (Custer et al., 2006).
Excitatory amino acids transporter 1 (EAAT1, also knownas GLAST) is the major glutamate transporter in thecerebellum (Lehre and Danbolt, 1998). It is expressed stronglyby astrocytes in the molecular layer of the cerebellum and isat highest density on Bergmann glia. EAAT1 is not detected inneurons (Ginsberg et al., 1995). EAAT1 present on the plasmamembrane of the astrocytic processes and cell bodies(Chaudhry et al., 1995). Targeting of EAAT1 is regulatedcarefully on astroglial membranes facing the neuropil, largedendrites, cell bodies and capillary endothelium (Danbolt,2001). Therefore, its distribution follows the morphological
changes of astrocytes during inflammatory processes.Recently, in a mouse model of reactive astrocytosis in thespinal cord, it has been reported that this glial processincludes a marked proteolytic cascade having as substratesglial transporters. Subsequent changes in neurotransmitteruptake represent the basis of morphological and functionalchanges that sustain central plasticity (Cavaliere et al., 2008).Moreover, glial activation involves changes in cell phenotypeand gene expression that might trigger glial-induced neuronaldeath (Bal-Price and Brown, 2001). Glial-mediated inflam-matory responses appear to have a key role in thepathophysiology of several neurodegenerative disorders thatinvolve early activation of microglia and astrocytes (Mrakand Griffin, 2005). In general, overexpression of cytokinesappears several years before pathological changes are evident(Griffin et al., 2006). The time needed for glial activationmight explain the mid-life onset of many neurodegenerativedisorders, even those that are genetically determined, beforethe patient displays the full clinical symptoms of the disease(Unger, 1998).
Spinocerebellar ataxia type 1 (SCA1) is a dominantlyinherited, progressive, neurological disorder, that is char-
Neuron Glia Biology, 2007, 3, 335–351. �2008 Cambridge University Press
doi:10.1017/S1740925X08000185 Printed in the United Kingdom
335
acterized clinically by ataxia and cranial motor neuropathiesin the absence of cognitive deficits. SCA1 belongs to thepolyglutamine disorders, a group of inherited neurodegen-erative diseases caused by expansion of a translated CAGrepeat in the coding region of the SCA1 gene (Schols et al.,2004; Orr and Zoghbi, 2007). The characterization of SCA1(Banfi et al., 1994) allowed ataxin-1 (ATAXIN1) the protein itencodes, to be identified as the molecule responsible fordisease pathogenesis and progression. ATAXIN1 is expressedin the CNS throughout life, localized mainly in the nucleus,both in its normal and mutated configuration, with somecytoplasmic localization in cerebellar Purkinje cells (Servadioet al., 1995). Characteristic neuropathological findings inSCA1 are the loss of Purkinje cells in the cerebellum andneurons in the inferior olivary complex (Robitaille et al.,1995). As described for other polyglutamine diseases such asHuntingdon’s disease (HD) (DiFiglia et al., 1997; Davies et al.,1997), the presence of neuronal intranuclear inclusions (NIs)in Purkinje cells in human patients (Servadio et al., 1995) andin a transgenic mouse model (Skinner et al., 1997) representsa pathological hallmark of SCA 1. Recent evidence shows thatcompounds that increase inclusion formation might reducecellular pathology in several neurodegenerative disorders(Bodner et al., 2006).
Several animal models have been generated and investi-gated (Burright et al., 1995; Fernandez-Funez et al., 2000;Watase et al., 2002; Emamian et al., 2003; Chen et al., 2003) inorder to understand the processes that underlie the onset andprogression of SCA1. Data show that mutant ATAXIN1protein levels have a key role in modulating diseasepathogenesis. The expanded tracts are relatively resistant toproteasomal degradation (Paulson, 1999), which leads to theaccumulation of polyglutamine-containing peptide fragmentswithin the cell. To define the role of different proteindomains in the onset and progression of the disease, modelsthat differ in either the length of the polyQ tract inserted(Lorenzetti et al., 2000) or the specific mutation induced(Klement et al., 1998) have been generated. To investigate thecellular pathways that influence disease progression, SCA1transgenic mice have been crossed with either transgenic miceor mice that are deficient in genes involved specifically inprotein degradation or stress responses (Cummings et al.,1999; Shahbazian et al., 2001; Cummings et al., 2001; Okuda etal., 2003). Recently, it has been demonstrated that blockingthe expression of mutant ATAXIN1 in a conditional mousemodel of SCA1 modifies the progression of the disease (Zuet al., 2004; Serra et al., 2006). The majority of these modelsare somewhat limited because they involve the expression ofthe polyQ tract mainly in cerebellar Purkinje cells. Inhumans, SCA1 is expressed throughout the brain, includingnon-neuronal cells. In a HD mouse model expressing 77CAG repeats, glial fibrillary acidic protein (GFAP)-positivecells increase in the brains without any signs of neuronaldegeneration (Ishiguro et al., 2001) and in geneticallymodified models of SCA7 it has been demonstrated thatdysfunction of Bergmann glia leads to non-cell autonomousPurkinje cell degeneration in the absence of expression ofmutant ataxin-7 in Purkinje cells. Moreover, GLAST-deficient mice fail motor challenging tasks and GLAST hasactive roles in synapse formation of cerebellar climbing fibreand in preventing excitotoxic cerebellar damage (Wataseet al., 1998).
OBJECTIVE
To identify and better clarify each step in the pathogenesis ofSCA1 we generated a conditional mouse model using thetetracycline-responsive gene (TET) system to control theexpression of ATAXIN1 containing different polyQ repeats(either 32Q or 100Q). To fully reproduce the molecular andgenetic features of this devastating condition we used a brain-specific promoter to induce ATXIN1 throughout braintissues, as occurs in humans. We have used this model toanalyze the modifications that affect the neuro-glial network(mainly the tripartite synapse) to clarify the early alterationsthat lead to death of Purkinje cells at advanced stages.
METHODS
Transgenic constructs
Two different responder constructs have been generated.cDNAs encoding normal and expanded ATAXIN1 (32 and100 CAG repeats, respectively; TRE-nSCA and TRE-eSCAconstructs) with a short 59UTR region from the SCA1 gene,were subcloned independently downstream of the TET-responsive element (TRE) promoter in the pUHD10–3plasmid (Gossen and Bujard, 1992). In both constructs ac-myc tag sequence was fused in-frame to the coding region.These two constructs have been used successfully in vitro(Rimoldi et al., 2001).
Production and maintenance of TETtransgenic mice
Following removal of the vector backbone by digestion withSsp I and Nsp I, the TRE-nSCA (3.7 Kb) and the TRE-eSCA(3.9 Kb) constructs were microinjected independently intooocyte pronuclei from C57BL/6J 6 DBA2 F1 hybrids (BDF1).Founder mice were identified by PCR and Southern blotanalyses. Nine of the 11 TRE-nSCA and 14 out of 19 TRE-eSCA founder mice bred successfully, originating transgeniclines. Responder Tg mice analyzed in this study werehemizygous for the transgene. A few transgenic strains werethen transferred to a FVB/N inbred genetic background. Toinduce expression of human ATAXIN1 in the brains oftransgenic mice, the PrP-tTA (F959 line) (Tremblay et al.,1998) transgenic line was used, which expresses tTA at highlevels in all brain regions (Boy et al., 2006).
Doxycycline treatment
Doxycycline (Dox) treatment was performed as follows: PrP-tTA and TRE-SCA transgenic females were given 0.5 mg ml21
Dox in 5% sucrose solution instead of the normal drinkingwater for 7 days before mating. Dox was then eitherwithdrawn [ATAXIN1 expression in young, double trans-genic mice (DTg)] or continued (constitutive repression ofATAXIN1 expression). Dox solution was maintained in darkbottles and changed three times a week.
Genotype analysis
Genotyping analyses were performed using DNA extractedfrom mouse tail biopsies. SCA1 responder Tg mice: specific
336 roberto giovannoni et al.

primers that anneal to the TRE promoter (oligo forward: 59-ACCCGGGTCGAGTAGGCG-39) and after the CAG repeatsequence (oligo reverse: 59-GCTCTTCTCCATCTCACCGT-39) were used, resulting in fragments of either 1228 bp (32CAG Repeats) or 1432 bp (100 CAG Repeats). Southern blotanalyses used the TRE sequence as probe.
TET activator Tg mice: Specific primers (oligo forward:59-AAGTAAAGTGATTAACAGCGC-39; oligo reverse: 59-CTACCCACCGTACTCGTC-39) were used, resulting in a1042 bp amplification fragment.
RT-PCR analyses
Total RNA was extracted from half of the cerebellum or brainusing Trizol reagent (Invitrogen), following the manufac-turer’s recommended protocol. cDNA was prepared fromeither 1 mg (TRE-SCA transgene products) or 40 ng (GFAPand EAAT1 endogenous genes) of total RNA with oligo dTprimers (Promega) using SuperScript III reverse transcriptase(Invitrogen), following the manufacturer’s recommendedprotocol. The cDNA (1/10 of the final volume) was amplifiedby PCR as follows: 1 cycle of 9 min at 94uC; 25–33 cycles of30 sec at 94uC, 30 sec at a primer pair-specific temperatureand 30 sec at 72uC; 1 cycle of 10 min at 72uC. Primerswere designed for each endogenous gene using Primer3software (Rozen and Skaletsky, 2000): GFAP, forward59-AGAAAACCGCATCACCATTC-39, reverse 59-TCACAT-CACCACGTCCTTGT-39; EAAT1, forward 59-CCAAAAGC-AACGGAGAAGAG-39, reverse 59-ACCTCCCGGTAG-CTCATTTT-39; b-actin, forward 59-GTGGGCCGCCC-TAGGCACCAG-39, oligo 59-GAAATCGTGCGTGACATC-AAAGAG-39. The linear range of PCR amplification for eachprimer pair was determined. In all PCR reactions b-actin
gene was used as the endogenous control. Amplificationproducts were run on 1.5–2% agarose Tris acetate EDTA gel,stained with ethidium bromide and gel images capturedwith GelDoc System (Bio-Rad Laboratories). Bands werequantified using Quantity One software (Bio-RadLaboratories). Genomic DNA contamination was checked.
Immunoblot analyses
Tissues were homogenized in 50 mM Hepes pH 7.5, 10%glycerol, 10 mM NaCl, 10 mM dithiothreitol, 1% SDS, 5 mMEDTA and protease inhibitors (Sigma Aldrich). Proteinextracts (10 mg) were run on a 10% Tris-glycine gel andtransferred to nitrocellulose (Amersham Biosciences). Afterblocking non-specific sites (5% milk in TBST, 20 mM Tris-HCl, pH 7.4, 100 mM NaCl, 0.2% Tween 20), membraneswere incubated with either anti-ATAXIN1 11NQ (Servadioet al., 1995) or anti-b-actin (Table 1) for 2 hours at roomtemperature, washed in TBST, and incubated with perox-idase-conjugated (anti-rabbit for 11NQ or anti-mouse foranti-b-actin) secondary Ab (1:5000; Amersham Biosciences)for 1 hour. Immunoreactivity was detected with enhancedchemiluminescence (Amersham Biosciences).
Animals
Mice were housed four–five per cage with food and wateravailable ad libitum and maintained in a temperature- andhumidity-controlled environment on a 12-hour light/darkcycle. Experiments were carried out according to a protocolapproved by the animal care committee of the Minister ofPublic Health, and in accordance with guidelines from theEuropean Union and NIH guide for care and use oflaboratory animals. In all experiments, control mice were
Table 1. Antibodies used for immunohistochemistry
Antiserum Immunogen Source/cat. no. Dilution Antigen Reference
Guinea pig
anti-glutamate
transporter
(EAAT1)
Synthetic peptide from
carboxy-terminus of rat EAAT1
Chemicon
International
# AB 1782
1:4000 Glutamate
transporters expressed
in glial cells
(Suarez, 2000)
Mouse anti-glial
fibrillary acidic
protein (GFAP)
Purified GFAP from pig spinal cord Sigma # G3893 1:400 Specific intermediate
filaments protein in
astrocytes
(Franke, 1991)
Mouse anti c-myc A synthetic peptide
corresponding to residues
408–439 of the human p-62c-myc,
protein conjugated to KLH
Sigma # M4439 1:400 Epitope located within
the sequence EQKLISEEL
(residues 410–419) of the
product of the human
oncogene c-myc, known
as the c-myc tag
(Campbell, 1992)
Mouse
anti-calbindin-
D-28K (Cb28K)
Purified bovine kidney
calbindin-D-28K
Sigma # C9848 1:15 000 Cb28K (28 kDA) (Chard, 1995)
Rabbit anti-Cb28K Recombinant rat calbindin D-28k Swant # CB-38a 1:10 000 Cb28K (Oh et al., 2007)
Mouse anti-b actin A slightly modified synthetic
b-cytoplasmatic actin N-terminal
peptide Ac-Asp-Asp-Asp-Ile-Ala-
Leu-Val-Ile-Asp-Asn-Gly-Ser-Gly-lys
conjugated to KLH.
Sigma # A5441 1:5000 Epitope located on the
N-terminal end of the
b-isoform of actin
(North, 1993)
Rabbit anti-
ATAXIN1 (11NQ)
N-terminal peptide (amino acids
164–197) of ATAXIN1
conjugated through its N-terminus
to keyhole limpet haemocyanin
Kind donation
from Drs
Servadio and
Zoghbi
1:6000 Epitope located on the
N-terminal peptide of
ATAXIN1
(Skinner, 1997)
neuro-glial dysfunctions in a sca1 mouse model 337

wild-type mice and single transgenic, expressing only theactivator tTA protein or carrying the responder transgene,because these did not show any difference in all thebehavioral and morphological analyses performed.
Behavioral analysis
Neurological alterations were detected until 20 weeks afterthe birth. To characterize the early alterations in rearrange-ment of the neuro–glial network we analyzed 11-week-oldDTg mice when the phenotype alterations become stable.
Open-field test
This test was performed to assess exploratory behavior andgeneral locomotor activity. We analyzed DTg and controlmice. Mice were placed into the center of a 70 6 100 cmopen arena containing a 10 6 10 cm gridded floor, for 15 minper test for six consecutive days (Clark et al., 1997). On thefourth day of testing, an enriched open-field test wasperformed by placing three different objects in the arena.These objects remained in the same position on the fifth day,but we changed their location on the sixth day. Activities ofanimals were videotaped for 15 min. Each trial was dividedinto 5-min intervals so that the total number of grid crossingsand the latency to reach the periphery of the arena, after theanimal was introduced, could be analyzed. Data wereanalyzed by one-way ANOVA, followed by post hocBonferroni’s multiple comparison tests; P,0.0001 wasconsidered statistically significant (StatView; AbacusConcepts).
Accelerating rotarod test
We used the rotarod test to assess the ability of mice toimprove their motor skill performance by training. Thisstudy was performed on naıve animals only. Mice wereplaced on the rotarod apparatus (Ugo Basile) for four trialsper day for 4 consecutive days (Clark et al., 1997). Each triallasted a maximum of 10 min, divided into an initial partin which the rotarod underwent a linear acceleration from 4–40 rpm over the first 5 min of the trial and then remainedat maximum speed for the remaining 5 min. Animals werescored for their latency to fall and for the number and timespent in holding for each trial. Data were analyzed by one-way ANOVA, followed by post hoc Bonferroni’s multiplecomparison tests; P,0.0001 was considered statisticallysignificant (StatView).
Footprint analysis
After coating the hind feet of the mice with a non-toxic paint,animals were allowed to walk through a dark, 40-cm long,9-cm wide, 6-cm high tunnel, and the footprint patternsmade on the paper lining the floor of the tunnel were scoredfor four step parameters (Clark et al., 1997). Step length: theaverage distance of forward movement between alternatesteps. Gait width: the average lateral distance betweenopposite left and right steps. Alternation coefficient: thevalue describing the uniformity of step alternation. Linearmovement: the average change in angle between consecutiveright-right steps. A large linear movement measurement
indicates non-linear movement, or weaving, through thetunnel. Statistical significance was calculated by Student’s t-test.
Cerebellar injury
The experiments were performed on five male FVB mice atthe age of 2.5–3 months. The surgery was performed underchlorydrate tiletamine (Zoletyl) (40 mg kg21) anesthesia.Animals were mounted in a stereotaxic apparatus. Afteropening the skin, a sterile disposable needle (21G) wasinserted into the paravermal cerebellar cortex through a burrhole of the skull (Ajtai and Kalman, 1998). The volume of thecone-like injury was ,0.08 mm3, bleeding stopped withinseveral seconds and the rate of respiratory movementsquickly normalized spontaneously.
After surgery and suturing muscles and skin over thewound, each of the five animals was kept with great care,including prevention of infection and free access to food andwater during a 12-hour light/dark cycle. At 4 days post-surgery the animals showed motor deficits resulting fromcerebellar impairment. On the same day the mice weresacrificed and the brains processed.
Histological examination andimmunocytochemistry
DTg and control mice were anesthetized deeply with anintraperitoneal injection (300 mg kg21 body weight) of chloralhydrate and perfused transcardially with standard Ringerssolution followed by 4% paraformaldehyde in 0.01 Mphosphate-buffered saline (PBS), pH 7.4 at 4uC. The brainswere removed and post-fixed for 2 hours in the same fixative,soaked in 30% sucrose PBS and frozen in chilled isopentaneon dry ice. Immunocytochemical staining was performed onserial sections, as reported previously (Papa et al., 2003),using both polyclonal and monoclonal antibodies. Free-floating sections were preincubated in PBS containing 10%normal serum and 0.25% Triton X-100 for 1 hour at 4uC andthen incubated in either rabbit anti-ATAXIN1 antiserum11NQ (Table 1) or guinea pig anti-glutamate transporterEAAT1 (Table 1) for 48 hours. For monoclonal antibodystaining, sections were incubated in a mouse Ig-blockingreagent, then preincubated in a ‘Protein Concentrate’solution (MOM kit, Vector Labs). Sections were incubatedin either mouse anti-GFAP monoclonal antibody (Table 1),mouse anti-calbindin D-28k (CbD28k) monoclonal antibody(Table 1), or mouse anti-c-myc monoclonal antibody (Table1). Sections were incubated with the appropriate biotinylatedsecondary antibody (Vector Labs; 1:200). Sections for bothmonoclonal and polyclonal immunostaining were processedusing the Vectastain avidin-biotin peroxidase kit (ABC),(Vector Labs), and reacted with 3,39-diaminobenzidinetetrahydrochloride (DAB; 0.5 mg ml21 Tris-HCl; Sigma)and 0.01% hydrogen peroxide. Sections were mounted onchrome-alume gelatin coated slides and cover slipped.Adjacent sections were Nissl-stained. DAB-stained sectionswere imaged with a Zeiss Axioskope 2 light microscope(Zeiss) equipped with high-resolution digital camera (C4742–95, Hamamatsu Photonics). Double staining was performedas reported (Papa et al., 2003). Sections were incubated withanti-ATAXIN1 (11NQ) and anti-CbD28k, anti-ATAXIN1(11NQ) and anti-c-myc, or anti-calbindin D28k and
338 roberto giovannoni et al.

anti-EAAT1. To analyze the spatial neuro–glial arrangement,triple staining was performed in which sections wereincubated with anti-calbindin D28k, anti-GFAP and anti-EAAT1. 2-hour incubations with a cocktail of Alexa fluor 488antirabbit IgG (1:200) and Alexa Fluor 546 antimouse IgG(1:200; Molecular Probes) was used for double staining, andan Alexa Fluor 647 antiguinea pig IgG (1:200) added for triplestaining. Sections were mounted and cover-slipped withVectashield (Vector Labs) and imaged with a laser-scanningconfocal microscope (Meta-LSM 510; Zeiss). Confocal imageswere acquired from the cerebellar cortex region using 206and oil-immersion 406 objective lenses (Zeiss). Appropriatecontrols lacking primary antibodies were performed for eachantibody. For double immunostaining, slices were processedcompletely through the first series of reactions, rinsed andfollowed by the second series of immunoreactions. Imageswere captured at a resolution of 512 6 512 pixels. Theappropriate argon laser fluorescence for visualization of theAlexa Fluor 488 was used with an excitation wavelength of488 nm and emission filter BP 505–530. The HeNe laserfluorescence for the visualization of Alexa Fluor 546, with anexcitation wavelength of 543 nm and emission filter LP 560.For triple localization the emission filter BP 560–615 for AlexaFluor 546, and the HeNe laser fluorescence for the visualiz-ation of Alexa Fluor 647, with an excitation wavelength of633 nm, and emission filter LP 638 was used. A series (n = 57)of single sections were acquired at 0.54 mm apart.
Cytology of Purkinje cells and analysis of spinedensity
Purkinje cells from 11- and 20-week-old DTg mice wererecognized by Calbindin staining conjugated with thefluorescent dye Alexa-546 (absorption at 556 nm, emissionat 573 nm; Molecular Probes). Fluorescent slices were imagedusing a laser-scanning confocal microscope (Meta-LSM 510;Zeiss) with a 636 oil-immersion lens. Optical z-sections wereacquired at 0.5-mm steps through the apical dendritic tree ofPurkinje cells. Dendritic projections of length 1–3 mm wereidentified as spines and counted off-line using computerassisted image analysis system (MCID 7.0; Imaging Res. Inc.);care was taken to ensure that each spine was counted onlyonce by following its course through the optical z-sectionreconstruction. Purkinje cell dendrites were divided into aproximal category of dendrites (with a diameter >1.5 mm)and a distal category (with a diameter ,1.5 mm). Spinedensity was calculated by dividing the total number of spinesper dendrite by the length of the dendrite (Papa et al., 1995;Tyler et al., 2006). Statistical significance was calculated byStudent’s t-test.
Electron microscopy
Mice were perfused transcardially with saline followed by 2.5%glutaraldehyde, 2% paraformaldehyde, 1 mM CaCl2 and 2 mMMgCl2 at pH 7.4, 40–45uC. The brains were removed and post-fixed in 2% paraformaldehyde overnight at 4uC. Vibratomesections (70 mm thick) were osmicated in 2% OsO4 in PB for 20min, small parts were dissected from the vermian, paravermianand hemispheric cerebellum, and dehydrated through increas-ing gradients of ethanol, followed by acetone and embedded inAraldite. Ultrathin sections (90 nm) were lightly counterstained
with 5% aqueous uranyl acetate and examined with a ZeissEFTEM Lybra 120 electron microscope (Zeiss).
Measurements and statistical analysis
Light microscopy
The analysis of the markers and electron micrographs, wasaccomplished by a computer assisted image analysis system(MCID 7.0; Imaging Res. Inc.). The image analysis at lightmicroscope was performed as reported previously (Saulleet al., 2004). Briefly, to analyze the activated glia we measuredthe area labeled by GFAP expression as the proportional areawithin the molecular layer of the cerebellum; this valueexpress the total target area relative to the scanned area. Theaverages were obtained from six, randomly selected cerebellarsections for each animal, and comparisons made betweenDTg and control groups. In the same region, to analyze theexpression of EAAT1 we measured the mean density(Density-ROD); ROD is an inverse logarithmic function ofgray-level values. To evaluate the distribution of the EAAT1in the cerebellar molecular layer of DTg and controls, wecalculated the ratio between the mean density value of all thepixels in the area (IOD-levels) and the standard deviation ofthe value (IOD/SD).
Electron microscopy
For electron microscopy analysis, we chose a previouslyreported systematic sampling method to reduce samplingbias (French and Totterdell, 2004). This was achieved bycollecting five sections per grid on three grids, then 4 mm ofthe block was removed and the collection repeated, thisprocedure was repeated eight times. This technique allowssampling throughout the depth of the sample. The middlesection of the middle grid in each collection of three gridswas photographed. As an alternative, on one section weacquired four pictures proceeding from the top left corner tothe bottom right corner; on the following section, we inverteddirection of acquisition from the top right corner to thebottom left one.
In each electron micrograph, all asymmetric synapses(Peters et al., 1991) were analyzed. Synaptic complexes weredefined as structures that met two criteria: (1) restricted zoneof two membranes in apposition, either one or both of whichexhibited increased thickness or electron contrast; and (2) thepresence of vesicles, 30–50 nm in size, in one or both of thetwo cytoplasmic domains separated by the opposingmembranes. We performed two measures of the length ofthe axon–spine interfaces. The first one was limited to theactive zone (AZ), composed of the synaptic cleft bordered byvesicles on the presynaptic axonal bouton and correspondingto the postsynaptic density (PSD) on the dendritic spine(Schikorski and Stevens, 1997). The second measure, includ-ing the active zone, was extended to the nonsynapticinterface, characterized by the thin extracellular spacebordered by spine and bouton membranes without special-ization. Digital images were analyzed using a computerassisted image analysis system (MCID 7.0; Imaging Res. Inc.).The quantitative analysis was blind with the person doing theanalysis unaware of the genotypes of the mice.
All data were exported and converted to a frequencydistribution histogram using the Sigma-Plot 8.0 program(SPSS-Erkrath). A paired t-test was used to compare DTg and
neuro-glial dysfunctions in a sca1 mouse model 339

control groups. A difference was accepted as significant if theprobability was less or equal than 5% (P(0.05). All data areexpressed as mean ± S.E.M.
Individual images of control and transgenic mice wereassembled and the same adjustments were made for bright-ness, contrast, and sharpness using Adobe Photoshop (AdobeSystems).
RESULTS
Derivation of conditional SCA1 transgenicmice
We used the TET system (Furth et al., 1994) to obtain in vivoregulatable expression of ATAXIN1 in mouse tissues. Thissystem is well-known and characterized and is enables eitherinduction or suppression of expression of a gene of interest invivo. Modulation of expression is achieved by a combinationof specifically interacting prokaryotic sequences inserted intwo different elements (Fig. 1a). Transgenic mice with atetracycline transactivator (tTA)-expressing transgene and aTET-responder transgene (Double transgenic mice, DTg)constitutively express ATAXIN1 protein. The expression ismodulated in vivo by tetracycline administration/withdrawal.
Production and selection of SCA1 TET-transgenic mice
In one group of transgenic mice the TRE was followed bycDNA encoding a myc-tagged normal ATAXIN1 protein (32repeats) whereas in another group it was followed by cDNAencoding a myc-tagged expanded ATAXIN1 protein (100repeats) (Fig. 1b). Founders and transgenic mice wereidentified by PCR analysis. The integrity of the transgeneswas verified by Southern-blot analyses on EcoR I digestedgenomic DNA from transgenic mice. Transgene copy numberfor each transgenic line was determined by computer analysis(Quantity One Software, Bio-Rad Laboratories) of hybridiz-ation signal intensity on Southern blots. The transgenicresponder line TRE-nSCA74 (transgene copy number 44–56)and the transgenic responder line TRE-eSCA62 (transgenecopy number 2–4) were selected because of high levels ofATAXIN1 expression in the CNS when crossed to a CNS-specific tTA-expressing transgenic line (data not shown).
These two transgenic lines were then crossed with the PrP-tTA transgenic line, which is known to express high levels oftTA mainly in the CNS (Boy et al., 2006).
Analysis of PrP-tTA/TRE-SCA1 DTg mice
PrP-tTA/TRE-SCA1 DTg mice were produced by crossingDox-treated transgenic females with transgenic males. In theabsence of Dox treatment of mothers, DTg embryos diedearly, which indicates toxicity of ATAXIN1 during mouseembryonic development. To bypass this embryo-lethalityand to obtain post-natal expression of ATAXIN1, trans-genic activator or responder females were treated with Dox(0.5 mg/ml in 5% sucrose for 1 week before mating, as des-cribed in the Methods section).
Transgene expression
To test the time-course of the induction of ATAXIN1expression, DTg and littermate-control animals were sacri-ficed at different ages. The in situ ATAXIN1 expression wasdetected by immunohistochemistry at 11-weeks old, followingbehavioral analyses and phenotypic characterization.Expression of the transgene was scattered throughout theCNS. Considerable levels of transgenic ATAXIN1 weredetected in frontal cortex, striatum, hippocampus andcerebellum of DTg animals (Fig. 2a–d). In all CNS regionsthe expression of the ATAXIN1 colocalizes with theexpression of c-myc tag (Fig. 3). Highest expression of thetransgene was detected in cerebellar cortex, mainly inPurkinje cell and granular cell layers (Fig. 4a). Confocalanalyses of double immunohistochemistry against ATAXIN1and calbindin D-28k, a specific marker of cerebellar Purkinjecells, were performed to better characterize this expression incerebellum. In Purkinje cells, the expression of ATAXIN1 is
Fig. 1. The binary tetracycline-regulated gene expression system (a)
and transgenic constructs (b). Atx1, ataxin-1; DOX, doxycycline; TRE,
tetracycline-responsive element; tTA, tetracycline-responsive transactivator.
Fig. 2. Ataxin-1 distribution in the brain. (a–d) Brain sections from 11-
week-old DTg mice were immunostained with anti-ATAXIN1 (11NQ
antibody). Cells positive for ATAXIN1 were scattered in different layers of
the frontal cortex (a), widely distributed in the striatum (b), in all
hippocampal regions (c) and in the cerebellar cortex (d). Scale bar, 200 mm.
340 roberto giovannoni et al.

both cytoplasmic and nuclear. Moreover, the morphology ofthe Purkinje cells appears well preserved, as it will bedescribed in the next section (Fig. 4b). To distinguishbetween endogenous and transgenic ATAXIN1, doublestaining for c-myc tag and human ATAXIN1 was performed,which demonstrates colocalization of the signals (Fig. 3c).Western blot and RT-PCR inticates expression in thecerebellum (Fig. 4d,e) and brains of DTg mice. Theexpression of transgenic ATAXIN1 started in 2-week-oldDTg mice and reached the full expression in 3-week-old DTgmice. After this age, RT-PCR analysis of ATAXIN1 mRNAdemonstrates that transcription of the transgene remainsstable.
Purkinje cell morphology
As revealed by calbindin staining (Fig. 5a,b), the dendrites ofPurkinje cells of DTg and control mice appeared normal byconfocal microscopy analysis. The spine densities of distaldendrites with an average diameter ,1.5 mm were1.64 ± 0.09 spines per mm (mean ± SD) and 1.76 ± 0.17spines per mm in 11-week-old DTg mice (n = 6) and control(n = 6), respectively (t = 0.65; P = 0.58) (Fig. 5c). Likewise,the spine density in dendritic fragments with an averagediameter .1.5 mm (proximal category) (Fig. 5a) was 2.7 ± 0.1
spines per mm in 11-week-old DTg mice and2.65 ± 0.08 spines per mm in control (t = 21; P = 0.39)(Fig. 5c). Thus, the spine density of Purkinje cells in DTgmice did not differ significantly from that of controllittermates (distal versus distal, P.0.5; proximal versusproximal, P.0.5; total versus total, P.0.5; Student’s t-test).
In contrast, in 20-week-old DTg mice the dendritic arborand the number of Purkinje cells are reduced as shown by thecalbindin staining of cerebellar cortex (Fig. 5e,g) compared tocontrol mice (Fig. 5d,f).
Neurological alteration in SCA1 transgenicmice
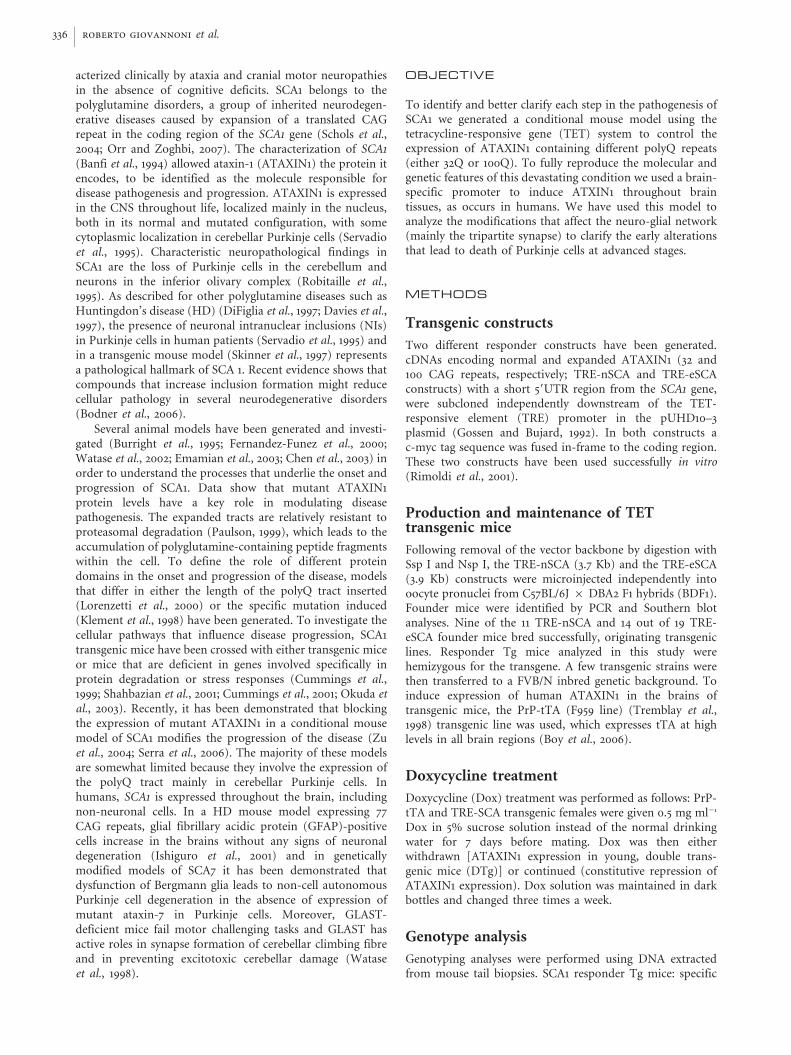
DTg mice started to show behavioral abnormalities at,9 weeks of age. Neurological alterations were assayed until20 weeks after birth (Fig. 6). In a home cage-behavior study,they showed mild dystonic head movements and spatialincoordination during walking. These symptoms worsenedprogressively during the next week and gait abnormalitiesstarted to appear. DTg mice expressing ATAXIN1 alsoshowed a decrease in growth rate starting from 6 weeks ofage. This decrease became statistically significant startingfrom 9 weeks of age compared to control mice (t = 25.76,P = 0.01 in 9-week-old mice; t = 210.8, P = 0.04 at the end
Fig. 3. Mutant ATAXIN1 in brains of DTg mice. (a–c) Most cells that express human ATAXIN1 in the frontal cortex (a), striatum (b) and hippocampus
(c) stain for the c-myc tag. Scale bar, 100 mm.
neuro-glial dysfunctions in a sca1 mouse model 341

of the study) (Fig. 7). We performed several motor behavioraltests to further clarify the neurological phenotype of thesemice.
Performance in the open-field test
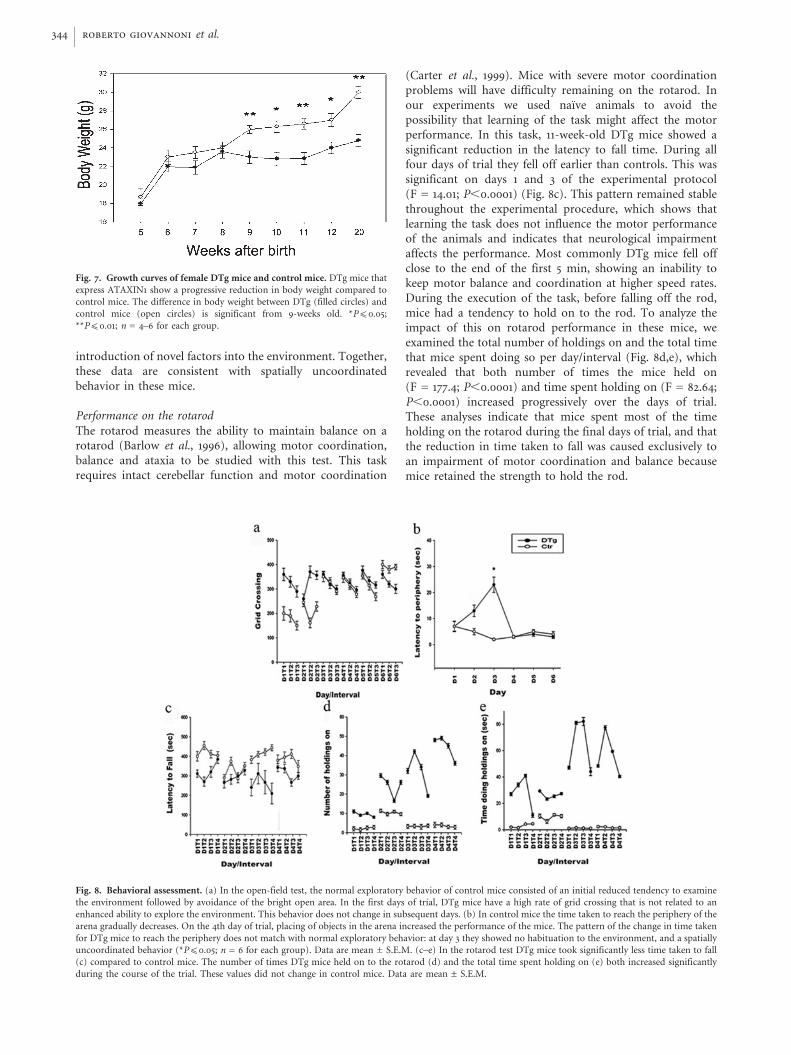
This test is mainly used to study novelty induced exploratorybehavior, but it can also used to evaluate locomotor activity(Karl et al., 2003). The number of grids crossing per day/interval was analyzed in 11-week-old mice (Fig. 8a). Followingexposure to a novel environment, control mice showed aclassic exploratory behavior consisting of a reduced tendencyto examine the environment and trying to avoid the brightopen area. In the following days, mice got used to the
environment and they showed no fear in exploring theenvironment and walking in the bright fields of the arena.DTg mice showed a different behavior. Even in the first twodays of trial there was a significant difference in grid-crossingcompared to the control (F = 7.87; P,0.0001), which was notrelated to an enhanced ability in exploring the environment.During the days that followed the grid-crossing patterns didnot change compared to the first two days. In addition, themice showed no preference for avoiding bright open fields inthe first days. In summary, their behavior in the arena did notchange during the trial. They explored the arena without anyclue related to the environment: over trials, many times, theyrecrossed the same grids without exploring the sides of the
Fig. 4. Transgenic ATAXIN1 is expressed in the cerebellum. (a) Immunolabeling of sagittal sections for transgenic ATAXIN1 show Purkinje cells and granule
cells positive for ATAXIN1. Calbindin D-28k (CbD28k)-positive Purkinje cells are positive for ATAXIN1. (b) The morphology of dendritic tree branching and
spine distribution is normal in CbD28k-positive Purkinje cells that express ATAXIN1. (c) In a single Z plane of the cerebellar cortex, immunolabeling of
transgenic ATAXIN1 colocalizes with expression of the c-myc tag. (d) Western blots showing expression of transgenic ATAXIN1 in the cerebellum of DTg mice.
ATAXIN1 is not detected in control mice. (e) RT-PCR analyses of the expression of transgenic ATAXIN1 mRNA in the cerebellum of DTg mice at different ages
and in response to DOX treatment. Scale bars, 50 mm in a; 10 mm in b and c.
342 roberto giovannoni et al.

arena. This indicates lack of spatial coordination in thebehavior of these mice. This hypothesis is confirmed bythe latency to periphery analysis (Fig. 8b). In control mice thetime taken to reach the periphery of the arena decreased inconsecutive trials (F = 10.12; P,0.0001). On the 4th day oftrial, placing objects in the arena increased the time taken toreach the periphery but this difference was not significantcompared to the first days of the trial. DTg mice showedlatency to periphery pattern that does not match with aclassic exploratory behavior, because at day 3 they showed nohabituation to the environment. At day 4, placing objects inthe arena significantly reduced the time to reach theperiphery rather than increasing it because of the
Fig. 5. Purkinje spine density. (a) Confocal microscopy image of a
representative plane of the dendritic tree of a Purkinje cell labeled for
calbindin D-28k in an 11-week-old DTg mouse. The pattern of ramifications
and spine number is normal. (b) The well-preserved spine density is evident
in a third-order dendrite. (c) Quantitative analysis of the number of dendritic
spines in proximal (average diameter .1.5 mm) (2.65 ± 0.08 and 2.7 ± 0.1)
and distal (average diameter ,1.5 mm) (1.76 ± 0.17 and 1.64 ± 0.09) dendrites
of control and DTg mice, respectively. (d–g) Confocal microscopy at different
magnification of a representative region of interest of the cerebellar cortex of
labeled for calbindin D-28k in 20-week-old control (Ctr) (d,f) and DTg (e,g)
mice. The normal, extensive pattern of dendritic arborization is evident in the
sagittal section of the Ctr animal. In DTg mice, at 20 weeks of age, there is a
decrease of Purkinje cells and Purkinje cells show a reduced dendritic
arborisation,. Abbreviations: Pc, Purkinje cells; Ml, molecular layer. Scale
bars, 10 mm in a; 5 mm in b; 50 mm in d; 20 mm in f.
Fig. 6. Neurological assessment during the development of SCA1. (a) Time
course of the performances in the rotarod. At 3-weeks old DTg mice (filled
circles) fell off sooner than control mice (open circles). The main difference in
the rotarod performances is evident at 9-weeks old and remains constant until
20-weeks old. Data are mean ± S.E.M. (b–e) Analysis of gait during
progression of SCA1. (b) In linear-movement analysis, DTg mice showed a
progressive increase in the linear movement score at 9- and 20-weeks old
(56.42 ± 3.15 and 59.5 ± 2.45, respectively) compared to control mice
(18.46 ± 2.74 and 17.9 ± 1.65, respectively). (c) In the step alternation
coefficient study, DTg mice showed a progressively more shuffling gate with
a higher score at 9-weeks old (3.1 ± 0.18) than control animals (1.3 ± 0.25).
This difference became greater at 20 weeks (4.0 ± 0.29 and 1.52 ± 0.31, Ctr
and DTg, respectively). (d) In DTg mice there was a progressive reduction in
step length, which was significantly different to control mice at 9- and 14-
weeks old (27.98 ± 2.76 compared to 37.12 ± 2.12, and 30.12 ± 2.25 compared
to 40.45 ± 3.01, respectively). (e) In the gait-width analysis there was an
increase in gait width in DTg mice compared to control mice. At 9-weeks old
the gait width of DTg mice was significantly larger than that of controls
(27.7 ± 0.57 compared to 16.68 ± 0.85), and the difference increased at 20-
weeks old (23.75 ± 0.58 compared to 19.18 ± 0.78). *P(0.05; **P(0.01;
n = 6; data, mean ± S.E.M.
neuro-glial dysfunctions in a sca1 mouse model 343
introduction of novel factors into the environment. Together,these data are consistent with spatially uncoordinatedbehavior in these mice.
Performance on the rotarod
The rotarod measures the ability to maintain balance on arotarod (Barlow et al., 1996), allowing motor coordination,balance and ataxia to be studied with this test. This taskrequires intact cerebellar function and motor coordination
(Carter et al., 1999). Mice with severe motor coordinationproblems will have difficulty remaining on the rotarod. Inour experiments we used naıve animals to avoid thepossibility that learning of the task might affect the motorperformance. In this task, 11-week-old DTg mice showed asignificant reduction in the latency to fall time. During allfour days of trial they fell off earlier than controls. This wassignificant on days 1 and 3 of the experimental protocol(F = 14.01; P,0.0001) (Fig. 8c). This pattern remained stablethroughout the experimental procedure, which shows thatlearning the task does not influence the motor performanceof the animals and indicates that neurological impairmentaffects the performance. Most commonly DTg mice fell offclose to the end of the first 5 min, showing an inability tokeep motor balance and coordination at higher speed rates.During the execution of the task, before falling off the rod,mice had a tendency to hold on to the rod. To analyze theimpact of this on rotarod performance in these mice, weexamined the total number of holdings on and the total timethat mice spent doing so per day/interval (Fig. 8d,e), whichrevealed that both number of times the mice held on(F = 177.4; P,0.0001) and time spent holding on (F = 82.64;P,0.0001) increased progressively over the days of trial.These analyses indicate that mice spent most of the timeholding on the rotarod during the final days of trial, and thatthe reduction in time taken to fall was caused exclusively toan impairment of motor coordination and balance becausemice retained the strength to hold the rod.
Fig. 7. Growth curves of female DTg mice and control mice. DTg mice that
express ATAXIN1 show a progressive reduction in body weight compared to
control mice. The difference in body weight between DTg (filled circles) and
control mice (open circles) is significant from 9-weeks old. *P(0.05;
**P(0.01; n = 4–6 for each group.
Fig. 8. Behavioral assessment. (a) In the open-field test, the normal exploratory behavior of control mice consisted of an initial reduced tendency to examine
the environment followed by avoidance of the bright open area. In the first days of trial, DTg mice have a high rate of grid crossing that is not related to an
enhanced ability to explore the environment. This behavior does not change in subsequent days. (b) In control mice the time taken to reach the periphery of the
arena gradually decreases. On the 4th day of trial, placing of objects in the arena increased the performance of the mice. The pattern of the change in time taken
for DTg mice to reach the periphery does not match with normal exploratory behavior: at day 3 they showed no habituation to the environment, and a spatially
uncoordinated behavior (*P(0.05; n = 6 for each group). Data are mean ± S.E.M. (c–e) In the rotarod test DTg mice took significantly less time taken to fall
(c) compared to control mice. The number of times DTg mice held on to the rotarod (d) and the total time spent holding on (e) both increased significantly
during the course of the trial. These values did not change in control mice. Data are mean ± S.E.M.
344 roberto giovannoni et al.

Gait abnormalities in DTg mice
To assess whether gait was abnormal in 11-week-old DTgmice, we performed a footprint test that evaluates the walkingpattern of mice. Footprint patterns were assayed quantita-tively by four measurements: linearity of movement; stepalternation coefficient; step length; and gait width (Clarket al., 1997). There was a significant difference in all fourparameters in the DTg mice compared to control mice. In thelinear movement analysis, the average change in anglebetween consecutive right-right steps was assayed. In thistest, a large linear movement score (Clark et al., 1997)indicates non-linear movement and DTg mice clearly showedthis abnormality (Fig. 9a) because they received a score of57.5 ± 5.0 compared to 17.5 ± 3.5 for controls (t = 214.14;P = 0.0007). The step alternation coefficient (Fig. 9b), anindication of the uniformity of step alternation, indicates thatDTg mice had a shuffling gate because they scored 3.58 ± 0.3,compared to 1.42 ± 0.2 (t = 20.86; P = 0.04) in controls.Step-length analysis also confirmed an ataxic gait in the DTgmice (Fig. 9c), with a score of 27.2 ± 4.2 compared to thescore of 36 ± 4 for control mice. This indicates that DTg micerequired more steps than controls to cover a fixed traveldistance (t = 24.9; P = 0.04). In the last study (Fig. 9d), gait-width analysis identified a highly significant difference(t = 28.69; P = 0.0003) between DTg and control mice withgait width larger in DTg mice than controls (22.28 ± 2.16compared to 19.16 ± 1.01). Together, these analyses confirmataxic gait in DTg mice.
EAAT1 clustering modifies the glutamateuptake apparatus in DTg mice
EAAT1 has a key role in controlling the extracellularconcentration of glutamate in the cerebellum, is mainly
expressed on astrocyte membranes (Danbolt, 2001). Incontrol mice, EAAT1 expression measured as mean density(Density-ROD) was similar (0.69 ± 0.007) to DTg mice(0.74 ± 0.005) (t = 24.3; P = 0.001) (Fig. 10c). EAAT1 isdistributed homogeneously over the molecular layer in thecerebellar cortex of control mice (Fig. 10a). In fact, the ratioIOD:SD (18.14 ± 1.84) indicates a very low SD value (t = 2.95;P = 0.01) (Fig. 10d). EAAT1 expression changed dramaticallyin DTg mice, forming clusters in defined areas around thedendritic tree of the Purkinje cells (Fig. 10b) and the ratioIOD:SD (7.04 ± 0.1) indicates a very high SD value (Fig. 10d).This finding is confirmed by RT-PCR analyses of EAAT1mRNA, which demonstrate that gene expression isunchanged (Fig. 10e). Confocal analyses indicate that incontrol mice EAAT1 surrounds the Purkinje cell soma (Fig.11a). By contrast, in DTg mice, the localization of EAAT1 isless defined, with redistribution and clustering of thetransporter along the Purkinje cell layer (Fig. 11b). To analyzeclearly the spatial distribution of EAAT1 on glial cells and toexclude its expression on neurons we examined serial sections0.54-mm apart stained for GFAP, CbD28K and EAAT1,
Fig. 9. Analysis of gait. (a) In the linear movement analysis, DTg mice
scored higher than control mice (57.5 ± 5 compared to 17.5 ± 3.5). (b) In the
step alternation coefficient study DTg mice showed a shuffling gate and
achieved a higher score (3.5814 ± 0.3) than control animals (1.4226 ± 0.2).
(c) In step-length analysis DTg mice scored higher (27.2 ± 4.2) than control
mice (36 ± 4). (d) In gait-width analysis DTg mice had a wider gait
(22.2857 ± 2.1647) than controls (19.1667 ± 1.0138). (*P(0.05; n = 6 for each
group). Data are mean ± S.E.M.
Fig. 10. Clustering of EAAT1 in DTg mice. (a) EAAT1 expression in the
cerebellar cortex of control mice appears homogeneous. Scale bar, 50 mm. (b)
In DTg mice EAAT1 forms clusters. (c) The total expression in control and
DTg mice is similar. (d) The ratio IOD:SD in control mice is high, which
indicates homogeneous distribution. The low ratio in DTg mice indicates that
the marker is expressed mainly in aggregates. (e) RT-PCR analyses of EAAT1
mRNA confirms that gene expression does not change. **P(0.01. Data are
mean ± S.E.M. Control mice, open columns; DTg mice, filled columns.
neuro-glial dysfunctions in a sca1 mouse model 345

finding that EAAT1 clusters decorated GFAP-positive cellcontours (Fig. 11c).
Evaluation of possible reactive astrocytosis was performedon DTg mice and controls. The reactive astrocytosis wasdetected using a monoclonal antibody against GFAP, themajor glial type III intermediate filament protein. In thecerebellum of DTg mice there was strong GFAP immuno-reactivity (0.21 ± 0.01) (Fig. 12b,c) compared to age-matchedcontrols (0.08 ± 0.01) (t = 25; P = 0.00002) (Fig. 12a,c).These data were confirmed by RT-PCR analyses on total RNAfrom the cerebellum of DTg mice and controls (Fig. 12d),which revealed an increase in GFAP expression in DTg mice.The reactive astrocytosis represents overexpression of GFAP,which supports an increase of astrocytic-specific intermediatefilament causing the transformation of astrocytes from theprotoplasmic to the fibrillary type. These cells appear to giverise to several ascending processes that are arranged tightly ina palisade fashion and traverse the molecular layer, which
resembles aspects of Bergmann’s glia (Altman and Bayer,1997). In DTg mice, signs of reactive astrocytosis are apparentonly in the cerebellum, although ATAXIN1 is expressed inother areas of the brain.
Reactive astrocytosis is associated with EAAT1clustering
To evaluate the role of reactive astrocytosis in the rearrange-ment of EAAT1 we surgically injured the cerebellar cortex(Ajtai and Kalman, 1998) and we analyzed the glial reaction4 days later. GFAP immunopositivity of Bergmann gliaappeared to increase in the lesioned area (Fig. 13a,c)and EAAT1 immunopositivity increased with a patchydistribution in the area of the reactive astrocytosis. Incontrast, in control mice the level of GFAP is low and EAAT1staining homogenous (Fig. 13b). These results indicate thatresident Bergmann glia are the main component of the glial
Fig. 11. Clustering of EAAT1. (a) Confocal microscopy of double labeling for EAAT1 and calbindin D-28k confirms that EAAT1 surrounds the Purkinje cell
soma and labels the molecular layer homogeneously in control mice. (b) In DTg mice EAAT1 labeling is not homogeneous and appears to coalesce into several
clusters. (c) EAAT1 (blue) does not colocalize to the soma of Purkinje cells (green) (211.34 mm), but covers it (218.36 mm), outlining the shape of glial processes
(GFAP in red) (223.76 mm). Scale bars: 50 mm in a,b; 20 mm in c.
346 roberto giovannoni et al.

reaction, and that upregulation of GFAP expression in thishighly developed glial architecture is associated with glial cellhypertrophy and rearrangement of distribution of EAAT1 onglial membranes, which results in clustering of this aminoacid transporter.
Reduction of the axon–spine interfaceinterferes with uptake and dilution ofglutamate in the extracellular space
The axon–spine interface includes both synaptic and non-synaptic components (Fig. 14a,b). The non-synaptic interfacehas a key role in synaptic function; it is engaged inneuronal glutamate transport and endocytosis, whereas thenon-synaptic area constitutes a channel through whichmolecules might escape from the synaptic cleft, spilling overto neighboring neurons and astrocytes (Ventura and Harris,1999). In DTg mice, the number of cerebellar synapses in thecontact zone (which includes synaptic and non-synapticinterface) is reduced by 20% compared to controls(0.32 ± 0.02 and 0.40 ± 0.02, respectively; t = 21.14;P = 0.04) (Fig. 14c). The length of the active zone ofcerebellar synapses is similar in DTg (0.22 ± 0.01) andcontrol mice (0.22 ± 0.02) (t = 21.13; P = 0.05) (Fig. 14d).Therefore, we infer that the reduction occurs exclusively inthe synaptic interface compartment at the side of thepostsynaptic density area, and that this constitutes the veryearly changes that are accountable for the behavioralphenotype.
Fig. 12. GFAP expression indicates reactive astrocytosis. (a) GFAP
immunoreactivity in the cerebellum of control mice is low. Scale bar,
50 mm. (b) In DTg mice, GFAP expression is strong in Bergmann glia in the
cerebellar cortex. (c) In mice that express transgenic ATAXIN1 (filled
column), reactive astrocytosis measured as the proportional area labeled for
GFAP is higher (0.21 ± 0.01) than age-matched controls (open column)
(0.08 ± 0.01). (d) RT-PCR analyses of total RNA confirms the increase in
GFAP expression in DTg mice (filled column) compared to controls (open
column). **P(0.01. Data are mean ± S.E.M. DTg mice, filled column;
control mice, open column.
Fig. 13. Correlation between reactive astrocytosis and EAAT1 redistribu-
tion in FVB mice at age 2.5–3 months. (a) GFAP immunoreactivity increases
on Bergmann glia in the lesioned area. There is no demarcation of the
molecular layer, unlike the usual appearance of reactive astrocytosis, which is
observed in the granular layer and in the white matter. In the area of
cerebellar cortex affected by reactive astrocytosis redistribution of EAAT1 into
clusters correlates with over-expression of GFAP in astroglia. (b,c) Higher
magnification showing the normal distribution of GFAP and EAAT1 labeling
in the cerebellar cortex of control mice (b) and the altered pattern in a mouse
with a cerebellar injury (CI). Scale bars, 50 mm in a; 20 mm in b,c.
Fig. 14. Changes in synaptic structure. (a) The axon–spine interface
includes synaptic (arrow) and non-synaptic components (arrowhead). Scale
bar, 0.3 mm. (b) The contact zone, including the synaptic (arrow) and non-
synaptic (arrowhead) interface is reduced in DTg mice. (c) In DTg mice the
total length of cerebellar synapses (0.32 ± 0.02) is reduced significantly
(P = 0.04) compared to control mice (0.40 ± 0.02). (d) The active zone
length (postsynaptic density) of the cerebellar synapses is the same in DTg
(0.22 ± 0.01) and control mice (0.22 ± 0.02). DTg mice, filled columns;
control mice, open columns.
neuro-glial dysfunctions in a sca1 mouse model 347

CONCLUSIONS
N Using this model we have demonstrated that ATAXIN1,which is expressed ubiquitously in the CNS, is associatedwith cerebellar motor deficits.
N In the cerebellum, we identified peculiar clustering of theEAAT1glutamate transporter, a significant reduction in thesynaptic interface compartment beside the postsynapticdensity area, and reactive astrocytosis (GFAP upregula-tion).
N We consider it likely that these early alterations incerebellar tripartite synapses lead to the main feature ofthis neurodegenerative disease: the death of Purkinje cells.
DISCUSSION
Several animal models of SCA1 have been generated using aPcP-2 expression cassette (Vandaele et al., 1991) to driveexpression of human mutant ATAXIN1 mainly in Purkinjecells. This approach has identified several steps in thepathogenesis of SCA1 and provided fundamental informationabout Purkinje disease progression, one of the cerebellarcomponents of the human disease. However, this approachrestricts the onset and progression of experimental disease tothis type of brain cells. In an alternative approach, Wataseet al. (2002) have inserted a long CAG repeat in the murineendogenous Sca1 locus, which mimics the human pathology,to investigate this Purkinje cell disease in a more complexcontext. Our model reproduces the human features ofATAXIN1 expression, which allows us to investigate changesin cerebellar circuitry caused when different cells express themutant protein. The expression of ATAXIN1 occurs in cellsother than Purkinje cells, including neurons in the cerebellargranular layer. In our study, the complete rescue ofembryonic lethality by administering DOX to the mothersbefore mating demonstrates the efficiency of DOX-dependentactivation of tTA. Moreover, the embryonic phenotypeobserved in this SCA1 model indicates that expression ofmutant ATAXIN1 during embryonic development increasesthe severity of the disease, as reported recently by others(Serra et al., 2006). The first appearance of ATAXIN1 mRNAis detected in 2-week-old DTg mice. The maximumconcentration of mRNA and protein occurs at 3 weeks ofage in the DTg mice. This highlights a gap between theexposure of the nervous tissues to ATAXIN1 and the onset ofsymptoms (at 9–10 weeks), which is consistent with othergenetically modified models of polyQ diseases (Zu et al.,2004). In this model of ataxia, the combination of motorimbalance and spatial incoordination in the absence ofmuscle weakness indicates that motor deficits might berelated to cerebellar dysfunction. The phenotype of this SCA1mouse model parallels that of another SCA1 mouse modelthat has been reported previously (Clark et al., 1997). Ourresults show early changes in the absence of significantPurkinje cell pathology. The expression and spatial distribu-tion of EAAT1, a glial glutamate transporter (Danbolt, 2001)with key roles in neuron–glia interaction (Watanabe, 2002)and in other neurodegenerative diseases (Ikegaya et al., 2002),is disarranged in our study, presenting with a cluster-likeappearance in DTg mice. This finding indicates a that there isa change in glutamate signaling, which is in accordance with
microarray studies that report alteration of the expression ofgenes that encode proteins involved in glutamate signalingpathways in Purkinje cells (Serra et al., 2004). It is possible toenvisage two scenarios: either the change in localization ofEAAT1 is caused by local changes in glutamate concentration;or EAAT1 distribution is part of a reactive astrocytosis-relatedresponse. In a chronic constriction injury model in mice wehave reported the appearance of reactive astrocytosisassociated with a strong reduction in glial transporters forglycine and glutamate, and a net increase of both theseneurotransmitters. These changes might represent the basis ofthe morphological and functional changes that sustain centralplasticity via NMDA receptors (Cavaliere et al., 2008).Experiments in which we injured the cerebellum directlyindicate that reactive astrocytosis of Bergman’s radial glia,which differs from common reactive reactive astrocytosis asreported by Ajtai and Kalman (1998), induces spatialredistribution of EAAT1. These data are related to theremarkable change identified in our model: the reduction ofthe non-synaptic area at the axon–spine interface. Thisprovides a channel through which molecules might escapefrom the synaptic cleft, spill-over to neighboring neurons andastrocytes and reduce synaptic input specificity. Whether aparticular synapse will sense the glutamate that escapes fromthe perimeter of its neighbor depends on uptake and dilutionin the extracellular space between them. Because most of theneighboring synapses occur on different presynaptic boutons,glutamate that diffuses between them will reduce inputspecificity. In the cerebellum of DTg mice, and related tothese two early changes, we found overexpression of theastrocytic intermediate filament protein GFAP in Bergmann’sglia. According to data from the first mouse model of SCA1(Burright et al., 1995), reactive astrocytosis was observed inassociation with the degeneration of Purkinje cells. In ourmodel, although the DTg mice developed motor impairments,no clear signs of cellular degeneration were detected, whichindicates that the reactive astrocytosis observed in our modelwas probably not caused by degeneration of Purkinje cells but toa state of suffering in these cells. In addition, in another mousemodel of polyQ syndrome it has been reported that neuronaldysfunction precedes any evident neuronal degeneration(Adachi et al., 2001). Moreover, inflammation of activated gliain most CNS pathologies contributes to neuronal cell death(Bal-Price and Brown, 2001). The location and distribution ofastrocytic processes are important for regulating the extra-cellular milieu in the CNS. Glia occupy 50% of the total volumeof the brain (Peters et al., 1991), and glial volume correlates withthe number of synapses (Anderson et al., 1994) but glialprocesses are not uniformly distributed. In fact, in the cerebellarcortex, most of the parallel and climbing fiber synapses areensheathed by processes of the Bergmann glia that expressEAAT1 (Spacek, 1985), forming several independent compart-ments that control glutamate concentration and interactautonomously with the particular groups of synapses theyensheath (Grosche et al., 1999). The structural relationshipsbetween astrocytes and synapses can change in response toglutamate and with altered neuronal function (Carmignoto,2000). Astrocytes modulate the formation and efficacy ofsynapses (Smith, 1998), and regulate extracellular glutamate viaglutamate transporters. By clearing excess glutamate from theextracellular space, astrocytes protect against excitotoxicglutamate concentrations that might lead to neuronal cell
348 roberto giovannoni et al.

death (Rothstein, 1996). Recently it has become clear that achange in glial properties is the key trigger that causes synapticperturbation in several neuropathic disorders (Watkins andMaier, 2003).
Together, our results indicate that, as in other transgenicmodels of CAG repeat diseases, expression of ATAXIN1 isfollowed by the onset and progression of motor deficits thatmight be related directly to cerebellar dysfunction of bothPurkinje cells and Bergmann glia. In this regard, neuronaldegeneration might be the ultimate step of the neuropathol-ogy, when rescue from the disease is no longer possible.Recently, this hypothesis has been partly confirmed byshowing that dysfunction of Purkinje cells associatedspecifically with precise mutation of K+ channels causescerebellar ataxia (Shakkottai et al., 2004; Sausbier et al.,2004). By contrast, a complex neurological disorder like SCA1where cerebellar ataxia is only one component of the diseasemight be associated with multiple cellular dysfunctionswithin the cerebellum, as indicated by our study. Althoughmore studies are needed to clarify this assumption, wepropose that this conditional mouse model is a key tool withwhich to identify different steps in the pathology of SCA1because modulating the expression of the transgene makes itpossible to correlate each of these steps with expressionATAXIN1. Our findings provide evidence that this mousemodel exhibits features of inflammatory pathology and that itmight be useful for studying the role of inflammatorypathways in CAG triplet diseases. Moreover, Colangelo et al.(2008), have reported a novel, crucial role of intrathecaladministration of nerve growth factor as a strong modulatorof plasticity in the neuronal–glial network by reducingreactive astrocytosis. Therefore, our model might alsoprovide a new approach for testing glial-specific drugs thatare designed to reduce CNS inflammatory process in thehope of curing this devastating disease.
ACKNOWLEDGEMENTS
We wish to express our gratitude to M. Palomba and A. DeSimone for helping in electron microscopy procedures. Thiswork was supported by grants from the Italian Minister ofResearch and University (PRIN2002 to M.P. and M.L., and DD21.09.99, n462 ric to M.L.), Italian Telethon Foundation (Grant#GSP010316 to R.G.), Regione Campania (Prog. Spec art12 E.F. 2000 to M.P. and RF2002 to M.L.), the CNR(Neurobiotecnologie 2003 to M.P.), Regione Campania (L.R.N.5 Bando 2003 to M.P.). M.R. Bianco was supported by apostdoctoral fellowship from the Associazione Levi-Montalcini.
STATEMENT OF INTERESTS
None.
REFERENCES
Adachi H., Kume A., Li M., Nakagomi Y., Niwa H., Do J. et al. (2001)
Transgenic mice with an expanded CAG repeat controlled by the
human AR promoter show polyglutamine nuclear inclusions and
neuronal dysfunction without neuronal cell death. Human Molecular
Genetics 10, 1039–1048.
Ajtai B.M. and Kalman M. (1998) Glial fibrillary acidic protein
expression but no glial demarcation follows the lesion in the
molecular layer of cerebellum. Brain Research 802, 285–288.
Altman J. and Bayer S.A. (1997) Basic cellular organization and circuitry
of the cerebellar cortex. In Altman J. and Bayer S.A. (eds)
Development of the Cerebellar System in Relation to its Evolution,
Structure, and Functions. CRC Press, pp. 26–43.
Anderson B.J., Li X., Alcantara A.A., Isaacs K.R., Black J.E. and
Greenough W.T. (1994) Glial hypertrophy is associated with
synaptogenesis following motor-skill learning, but not with angio-
genesis following exercise. Glia 11, 73–80.
Bal-Price A. and Brown G.C. (2001) Inflammatory neurodegeneration
mediated by nitric oxide from activated glia-inhibiting neuronal
respiration, causing glutamate release and excitotoxicity. Journal of
Neuroscience 21, 6480–6491.
Banfi S., Servadio A., Chung M.Y., Kwiatkowski T.J. Jr, McCall A.E.,
Duvick L.A. et al. (1994) Identification and characterization of the
gene causing type 1 spinocerebellar ataxia. Nature Genetics 7, 513–520.
Barlow C., Hirotsune S., Paylor R., Liyanage M., Eckhaus M., Collins
F. et al. (1996) Atm-deficient mice: a paradigm of ataxia
telangiectasia. Cell 86, 159–171.
Bodner R.A., Outeiro T.F., Altmann S., Maxwell M.M., Cho S.H.,
Hyman B.T. et al. (2006) Pharmacological promotion of inclusion
formation: a therapeutic approach for Huntington’s and Parkinson’s
diseases. Proceedings of the National Academy of Sciences of the U.S.A.
103, 4246–4251.
Boy J., Leergaard T.B., Schmidt T., Odeh F., Bichelmeier U., Nuber S.
et al. (2006) Expression mapping of tetracycline-responsive prion
protein promoter: digital atlasing for generating cell-specific disease
models. Neuroimage 33, 449–462.
Burright E.N., Clark H.B., Servadio A., Matilla T., Feddersen R.M.,
Yunis W.S. et al. (1995) SCA1 transgenic mice: a model for
neurodegeneration caused by an expanded CAG trinucleotide repeat.
Cell 82, 937–948.
Carmignoto G. (2000) Reciprocal communication systems between
astrocytes and neurones. Progress in Neurobiology 62, 561–581.
Carter R.J., Lione L.A., Humby T., Mangiarini L., Mahal A., Bates G.P.
et al. (1999) Characterization of progressive motor deficits in mice
transgenic for the human Huntington’s disease mutation. Journal of
Neuroscience 19, 3248–3257.
Cavaliere C., Cirillo G., Bianco M.R., Rossi F., De Novellis V., Maione
S. et al. (2008) Gliosis alters expression and uptake of spinal glial
amino acid transporters in a mouse neuropathic pain model. Neuron
Glia Biology 3, 1–14.
Chaudhry F.A., Lehre K.P., van Lookeren C.M., Ottersen O.P., Danbolt
N.C. and Storm-Mathisen J. (1995) Glutamate transporters in glial
plasma membranes: highly differentiated localizations revealed by
quantitative ultrastructural immunocytochemistry. Neuron 15, 711–720.
Chen H.K., Fernandez-Funez P., Acevedo S.F., Lam Y.C., Kaytor M.D.,
Fernandez M.H. et al. (2003) Interaction of Akt-phosphorylated
ataxin-1 with 14-3-3 mediates neurodegeneration in spinocerebellar
ataxia type 1. Cell 113, 457–468.
Clark H.B., Burright E.N., Yunis W.S., Larson S., Wilcox C., Hartman
B. et al. (1997) Purkinje cell expression of a mutant allele of SCA1 in
transgenic mice leads to disparate effects on motor behaviors,
followed by a progressive cerebellar dysfunction and histological
alterations. Journal of Neuroscience 17, 7385–7395.
Colangelo A.M., Bianco M.R., Vitagliano L., Cavaliere C., Cirillo G.,
De Gioia L. et al. (2008) A new nerve growth factor (NGF)-mimetic
peptide active on neuropathic pain in rats. Journal of Neuroscience 28,
2698–2709.
neuro-glial dysfunctions in a sca1 mouse model 349

Cummings C.J., Orr H.T. and Zoghbi H.Y. (1999) Progress in
pathogenesis studies of spinocerebellar ataxia type 1. Philosophical
transactions of the Royal Society of London. Series B, Biological Sciences
354, 1079–1081.
Cummings C.J., Sun Y., Opal P., Antalffy B., Mestril R., Orr H.T. et al.
(2001) Over-expression of inducible HSP70 chaperone suppresses
neuropathology and improves motor function in SCA1 mice. Human
Molecular Genetics 10, 1511–1518.
Custer S.K., Garden G.A., Gill N., Rueb U., Libby R.T., Schultz C. et al.
(2006) Bergmann glia expression of polyglutamine-expanded ataxin-
7 produces neurodegeneration by impairing glutamate transport.
Nature Neuroscience 9, 1302–1311.
Danbolt N.C. (2001) Glutamate uptake. Progress in Neurobiology 65,
1–105.
Davies S.W., Turmaine M., Cozens B.A., DiFiglia M., Sharp A.H., Ross
C.A. et al. (1997) Formation of neuronal intranuclear inclusions
underlies the neurological dysfunction in mice transgenic for the HD
mutation. Cell 90, 537–548.
DiFiglia M., Sapp E., Chase K.O., Davies S.W., Bates G.P., Vonsattel
J.P. et al. (1997) Aggregation of huntingtin in neuronal intranuclear
inclusions and dystrophic neurites in brain. Science 277, 1990–1993.
Emamian E.S., Kaytor M.D., Duvick L.A., Zu T., Tousey S.K.,
Zoghbi H.Y. et al. (2003) Serine 776 of ataxin-1 is critical for
polyglutamine-induced disease in SCA1 transgenic mice. Neuron 38,
375–387.
Fernandez-Funez P., Nino-Rosales M.L., de Gouyon B., She W.C.,
Luchak J.M., Martinez P. et al. (2000) Identification of genes
that modify ataxin-1-induced neurodegeneration. Nature 408,
101–106.
French S.J. and Totterdell S. (2004) Quantification of morphological
differences in boutons from different afferent populations to the
nucleus accumbens. Brain Research 1007, 167–177.
Furth P.A., St O.L., Boger H., Gruss P., Gossen M., Kistner A. et al.
(1994) Temporal control of gene expression in transgenic mice by a
tetracycline-responsive promoter. Proceedings of the National
Academy of Sciences of the U.S.A. 91, 9302–9306.
Ginsberg S.D., Martin L.J. and Rothstein J.D. (1995) Regional
deafferentation down-regulates subtypes of glutamate transporter
proteins. Journal of Neurochemistry 65, 2800–2803.
Gossen M. and Bujard H. (1992) Tight control of gene expression in
mammalian cells by tetracycline-responsive promoters. Proceedings of
the National Academy of Sciences of the U.S.A. 89, 5547–5551.
Griffin W.S., Liu L., Li Y., Mrak R.E. and Barger S.W. (2006)
Interleukin-1 mediates Alzheimer and Lewy body pathologies. Journal
of Neuroinflammation 3, 5.
Grosche J., Matyash V., Moller T., Verkhratsky A., Reichenbach A. and
Kettenmann H. (1999) Microdomains for neuron-glia interaction:
parallel fiber signaling to Bergmann glial cells. Nature Neuroscience 2,
139–143.
Ikegaya Y., Matsuura S., Ueno S., Baba A., Yamada M.K., Nishiyama
N. et al. (2002) Beta-amyloid enhances glial glutamate uptake activity
and attenuates synaptic efficacy. Journal of Biological Chemistry 277,
32180–32186.
Ishiguro H., Yamada K., Sawada H., Nishii K., Ichino N., Sawada M.
et al. (2001) Age-dependent and tissue-specific CAG repeat instability
occurs in mouse knock-in for a mutant Huntington’s disease gene.
Journal of Neuroscience Research 65, 289–297.
Karl T., Pabst R. and von Horsten S. (2003) Behavioral phenotyping of
mice in pharmacological and toxicological research. Experimental
Toxicology and Pathology 55, 69–83.
Klement I.A., Skinner P.J., Kaytor M.D., Yi H., Hersch S.M., Clark H.B.
et al. (1998) Ataxin-1 nuclear localization and aggregation: role in
polyglutamine-induced disease in SCA1 transgenic mice. Cell 95, 41–53.
Lehre K.P. and Danbolt N.C. (1998) The number of glutamate
transporter subtype molecules at glutamatergic synapses: chemical
and stereological quantification in young adult rat brain. Journal of
Neuroscience 18, 8751–8757.
Lorenzetti D., Watase K., Xu B., Matzuk M.M., Orr H.T. and Zoghbi
H.Y. (2000) Repeat instability and motor incoordination in mice
with a targeted expanded CAG repeat in the Sca1 locus. Human
Molecular Genetics 9, 779–785.
Mrak R.E. and Griffin W.S. (2005) Glia and their cytokines in
progression of neurodegeneration. Neurobiology of Aging 26, 349–354.
Okuda T., Hattori H., Takeuchi S., Shimizu J., Ueda H., Palvimo J.J.
et al. (2003) PQBP-1 transgenic mice show a late-onset motor neuron
disease-like phenotype. Human Molecular Genetics 12, 711–725.
Orr H.T. and Zoghbi H.Y. (2007) Trinucleotide repeat disorders. Annual
Reveiw of Neuroscience 30, 575–621.
Papa M., Boscia F., Canitano A., Castaldo P., Sellitti S., Annunziato L.
et al. (2003) Expression pattern of the ether-a-gogo-related (ERG) K+channel-encoding genes ERG1, ERG2, and ERG3 in the adult rat central
nervous system. Journal of Comparative Neurology 466, 119–135.
Papa M., Bundman M.C., Greenberger V. and Segal M. (1995)
Morphological analysis of dendritic spine development in primary
cultures of hippocampal neurons. Journal of Neuroscience 15, 1–11.
Paulson H.L. (1999) Protein fate in neurodegenerative proteinopathies:
polyglutamine diseases join the (mis)fold. American Journal of
Human Genetics 64, 339–345.
Peters A., Palay S.L. and Webster H.deF. (1991). The Fine Structure of the
Nervous System. Oxford University Press.
Rimoldi M., Servadio A. and Zimarino V. (2001) Analysis of heat shock
transcription factor for suppression of polyglutamine toxicity. Brain
Research Bulletin 56, 353–362.
Robitaille Y., Schut L. and Kish S.J. (1995) Structural and immuno-
cytochemical features of olivopontocerebellar atrophy caused by the
spinocerebellar ataxia type 1 (SCA-1) mutation define a unique
phenotype. Acta Neuropathologica 90, 572–581.
Rothstein J.D. (1996) Excitotoxicity hypothesis. Neurology 47, S19–S25.
Rozen S. and Skaletsky H. (2000) Primer3 on the WWW for general
users and for biologist programmers. Methods in Molecular Biology
132, 365–386.
Saulle E., Gubellini P., Picconi B., Centonze D., Tropepi D., Pisani A.
et al. (2004) Neuronal vulnerability following inhibition of
mitochondrial complex II: a possible ionic mechanism for
Huntington’s disease. Molecular and Cellular Neuroscience 25, 9–20.
Sausbier M., Hu H., Arntz C., Feil S., Kamm S., Adelsberger H. et al.
(2004) Cerebellar ataxia and Purkinje cell dysfunction caused by
Ca2+-activated K+ channel deficiency. Proceedings of the National
Academy of Sciences of the U.S.A. 101, 9474–9478.
Schikorski T. and Stevens C.F. (1997) Quantitative ultrastructural
analysis of hippocampal excitatory synapses. Journal of Neuroscience
17, 5858–5867.
Schols L., Bauer P., Schmidt T., Schulte T. and Riess O. (2004)
Autosomal dominant cerebellar ataxias: clinical features, genetics,
and pathogenesis. Lancet Neurology 3, 291–304.
Serra H.G., Byam C.E., Lande J.D., Tousey S.K., Zoghbi H.Y. and Orr
H.T. (2004) Gene profiling links SCA1 pathophysiology to glutamate
signaling in Purkinje cells of transgenic mice. Human Molecular
Genetics 13, 2535–2543.
350 roberto giovannoni et al.

Serra H.G., Duvick L., Zu T., Carlson K., Stevens S., Jorgensen N. et al.
(2006) RORalpha-mediated Purkinje cell development determines
disease severity in adult SCA1 mice. Cell 127, 697–708.
Servadio A., Koshy B., Armstrong D., Antalffy B., Orr H.T. and Zoghbi
H.Y. (1995) Expression analysis of the ataxin-1 protein in tissues from
normal and spinocerebellar ataxia type 1 individuals. Nature Genetics
10, 94–98.
Shahbazian M.D., Orr H.T. and Zoghbi H.Y. (2001) Reduction of
Purkinje cell pathology in SCA1 transgenic mice by p53 deletion.
Neurobiology of Disease 8, 974–981.
Shakkottai V.G., Chou C.H., Oddo S., Sailer C.A., Knaus H.G.,
Gutman G.A. et al. (2004) Enhanced neuronal excitability in the
absence of neurodegeneration induces cerebellar ataxia. Journal of
Clinical Investigation 113, 582–590.
Sheldon A.L. and Robinson M.B. (2007) The role of
glutamate transporters in neurodegenerative diseases and potential
opportunities for intervention. Neurochemistry International 51,
333–355.
Skinner P.J., Koshy B.T., Cummings C.J., Klement I.A., Helin K.,
Servadio A. et al. (1997) Ataxin-1 with an expanded glutamine tract
alters nuclear matrix-associated structures. Nature 389, 971–974.
Smith S.J. (1998) Glia help synapses form and function. Current Biology
8, R158–R160.
Spacek J. (1985) Relationships between synaptic junctions, puncta
adhaerentia and the spine apparatus at neocortical axo-
spinous synapses. A serial section study. Anatomy and Embryology
173, 129–135.
Tremblay P., Meiner Z., Galou M., Heinrich C., Petromilli C., Lisse T.
et al. (1998) Doxycycline control of prion protein transgene
expression modulates prion disease in mice. Proceedings of the
National Academy of Sciences of the U.S.A. 95, 12580–12585.
Tyler W.J., Zhang X.L., Hartman K., Winterer J., Muller W., Stanton
P.K. et al. (2006) BDNF increases release probability and the size of a
rapidly recycling vesicle pool within rat hippocampal excitatory
synapses. Journal of Physiology 574, 787–803.
Unger J.W. (1998) Glial reaction in aging and Alzheimer’s disease.
Microscopy Research and Technique 43, 24–28.
Vandaele S., Nordquist D.T., Feddersen R.M., Tretjakoff I., Peterson
A.C. and Orr H.T. (1991) Purkinje cell protein-2 regulatory regions
and transgene expression in cerebellar compartments. Genes and
Development 5, 1136–1148.
Ventura R. and Harris K.M. (1999) Three-dimensional relationships
between hippocampal synapses and astrocytes. Journal of
Neuroscience 19, 6897–6906.
Watanabe M. (2002) Glial processes are glued to synapses via Ca(2+)-
permeable glutamate receptors. Trends in Neurosciences 25, 5–6.
Watase K., Hashimoto K., Kano M., Yamada K., Watanabe M., Inoue
Y. et al. (1998) Motor discoordination and increased susceptibility to
cerebellar injury in GLAST mutant mice. European Journal of
Neuroscience 10, 976–988.
Watase K., Weeber E.J., Xu B., Antalffy B., Yuva-Paylor L., Hashimoto
K. et al. (2002) A long CAG repeat in the mouse Sca1 locus replicates
SCA1 features and reveals the impact of protein solubility on selective
neurodegeneration. Neuron 34, 905–919.
Watkins L.R. and Maier S.F. (2003) Glia: a novel drug discovery target
for clinical pain. Nature Reviews Drug Discovery 2, 973–985.
Zu T., Duvick L.A., Kaytor M.D., Berlinger M.S., Zoghbi H.Y., Clark
H.B. et al. (2004) Recovery from polyglutamine-induced neuro-
degeneration in conditional SCA1 transgenic mice. Journal of
Neuroscience 24, 8853–8861.
AUTHORS’ ADDRESSES
1 Department of Surgical Sciences
University of Milano-Bicocca
Italy
2 Laboratorio di Morfologia delle reti Neuronali
Department of Medicina Pubblica Clinica e Preventiva
Seconda Universita di Napoli
Italy
3 These authors contributed equally to this work
Correspondence should be addressed to:
Prof. Michele Papa
Seconda Universita di Napoli
Via L. Armanni
5 80138, Napoli
Italy
phone: +39 081 5666011
fax: +39 081 5666011
email: [email protected]
neuro-glial dysfunctions in a sca1 mouse model 351