network global navigation satellite system survey to ... · 2. brenda k. densmore, 1. and justin...
TRANSCRIPT

U.S. Department of the InteriorU.S. Geological Survey
Scientific Investigations Report 2016–5109
Prepared in cooperation with Natural Resources Canada, the International Joint Commission, and the National Park Service
Network Global Navigation Satellite System Survey to Harmonize Water-Surface Elevation Data for the Rainy River Basin

Front cover photograph: Namakan Lake near International Falls, Minnesota.
Back cover photograph: Rainy Lake near International Falls, Minnesota.

Network Global Navigation Satellite System Survey to Harmonize Water-Surface Elevation Data for the Rainy River Basin
By Jeffrey R. Ziegeweid, R. Jason Silliker, Brenda K. Densmore, and Justin Krahulik
Prepared in cooperation with Natural Resources Canada, the International Joint Commission, and the National Park Service
Scientific Investigations Report 2016–5109
U.S. Department of the InteriorU.S. Geological Survey

U.S. Department of the InteriorSALLY JEWELL, Secretary
U.S. Geological SurveySuzette M. Kimball, Director
U.S. Geological Survey, Reston, Virginia: 2016
For more information on the USGS—the Federal source for science about the Earth, its natural and living resources, natural hazards, and the environment—visit http://www.usgs.gov or call 1–888–ASK–USGS.
For an overview of USGS information products, including maps, imagery, and publications, visit http://www.usgs.gov/pubprod/.
Any use of trade, firm, or product names is for descriptive purposes only and does not imply endorsement by the U.S. Government.
Although this information product, for the most part, is in the public domain, it also may contain copyrighted materials as noted in the text. Permission to reproduce copyrighted items must be secured from the copyright owner.
Suggested citation:Ziegeweid, J.R., Silliker, R.J., Densmore, B.K., and Krahulik, Justin, 2016, Network Global Navigation Satellite System survey to harmonize water-surface elevation data for the Rainy River Basin: U.S. Geological Survey Scientific Investi-gations Report 2016–5109, 20 p., http://dx.doi.org/10.3133/sir20165109.
ISSN 2328-0328 (online)

iii
Acknowledgments
Gail Faveri (Environment Canada) helped coordinate the joint field efforts between the United States and Canada, as well as the joint funding through the United States and Canadian offices of the International Joint Commission. Ryan Maki and Chuck Remus (Voyageurs National Park) coordinated the support of the National Park Service and logistical support to complete the field data collection. Jaime LeDuc and Claire Kissane (Voyageurs National Park) led a field crew to remote areas of Voyageurs National Park. Michael Craymer (Natural Resources Canada), Marc Véronneau (Natural Resources Canada), Jean Morin (Environment Canada), and Aaron Thomp-son (Environment Canada) provided input to improve the design of the survey and the presenta-tion of the study results. Drs. Mark Colosimo and Wayne Jenkinson (International Joint Com-mission) approved the study and participated in regular progress reviews. Bill Odell (U.S. Army Corps of Engineers) provided reference mark and elevation data for the streamgage on Crane Lake. James Wilcox (Environment Canada) participated in field collection efforts and quality-assurance checks of collected data. Mark Schenewerk (National Oceanic and Atmospheric Administration) reviewed the report.
Chris Sanocki and Catherine Christenson of the U.S. Geological Survey participated in field data collection efforts. Scott Adolphson of the U.S. Geological Survey created the study area maps. Dave Lorenz (retired) and Jared Trost of the U.S. Geological Survey helped create and format report figures. Adam Mosbrucker of the U.S. Geological Survey reviewed the report.
iv
Contents
Abstract ...........................................................................................................................................................1Introduction.....................................................................................................................................................1
Purpose and Scope ..............................................................................................................................4Physical Setting.....................................................................................................................................4
Methods...........................................................................................................................................................6Field Data Collection.............................................................................................................................6Data Processing ....................................................................................................................................6Development of Streamgage Datum Offsets ....................................................................................7Application of Streamgage Datum Offsets .......................................................................................7
Global Navigation Satellite System Surveys .............................................................................................8Survey Comparisons....................................................................................................................................10
Namakan Reservoir ............................................................................................................................10Rainy Lake ............................................................................................................................................10Rivers 102012 Namakan Reservoir Data .........................................................................................................10
Limitations of the Study...............................................................................................................................13Summary........................................................................................................................................................16References Cited..........................................................................................................................................16Appendixes 1–3 ............................................................................................................................................19
Appendix 1. Global Navigation Satellite System Data Collection Information ........................20Appendix 2. Processing of Raw Data Collected for 16 Atreamgage Reference Marks
and 1 National Geodetic Survey Cooperative Base Network Control Station Using Global Navigation Satellite Systems .......................................................................20
Appendix 3. Surveyor Level Loop Information for Selected Sites ..............................................20
Figures
1. Maps showing water-level streamgage locations for Rainy Lake, Namakan Reservoir, and selected rivers ....................................................................................................2
2. Map showing locations of the National Geodetic Survey cooperative base network control station, Canadian Active Control Stations, and Continuously Operating Reference Stations used to postprocess data collected from global navigation satellite system receivers in this study .................................................................5
3. Graph showing water-surface elevation data referenced to the Canadian Geodetic Vertical Datum of 2013 for the data collection period at active streamgages in Namakan Reservoir, which are identified using map and station numbers associated with data in table 1 ...................................................................11
4. Graph showing water-surface elevation data referenced to the Canadian Geodetic Vertical Datum of 2013 for the data collection period at active streamgages in Rainy Lake, which are identified using map and station numbers associated with data in table 1 ................................................................................12
v
5. Graph showing mean water-surface elevations referenced to the Canadian Geodetic Vertical Datum of 2013 for the data collection period at active streamgages on the Vermilion, Turtle, and Rainy Rivers; streamgages are identified using map and station numbers associated with data in table 1 ......................13
6. Graph showing monthly water-surface elevation data for all active and discontinued streamgages in Namakan Reservoir during the open water period of 2012, converted from streamgage datums to the Canadian Geodetic Vertical Datum of 2013 using offsets presented in table 4; streamgages are identified using map numbers associated with data in table 1. ..........................................14
7. Graph showing published mean daily water-surface elevations for discontinued U.S. Geological Survey water-level streamgages on Sand Point Lake above and below Harrison Narrows in 2012 ..............................................................................................15
Tables
1. Information about streamgages in Rainy Lake, Namakan Reservoir, and selected rivers in Minnesota, Unites States, and Ontario, Canada. .....................................................3
2. Location information for the National Geodetic Survey cooperative base network control station, Canadian Active Control Stations, and Continuously Operating Reference Stations used to postprocess data collected from global navigation satellite system receivers in this study .....................................................................................4
3. Global Navigation Satellite System survey results for 16 streamgage reference marks and National Geodetic Survey cooperative base network control station AC4984, processed using Natural Resources Canada and U.S. Geological Survey methods. .........................................................................................................................................8
4. Offsets to convert published water levels to water-surface elevations referenced to the Canadian Geodetic Vertical Datum of 2013 for streamgages in Rainy Lake, Namakan Reservoir, and selected rivers. .................................................................................9
Appendix Table
1–1. Summary of collected satellite data for 16 streamgage reference marks and 1 National Geodetic Survey cooperative base network control station surveyed in this study ..................................................................................................................................20
vi
Conversion Factors
[International System of Units to U.S. customary units]
Multiply By To obtain
Length
millimeter (mm) 0.03937 inch (in.)meter (m) 3.281 foot (ft)[U.S. customary units to International System of Units]
Multiply By To obtain
Length
foot (ft) 0.3048 meter (m)
Datum
Vertical coordinate information is referenced to the Canadian Geodetic Vertical Datum of 2013 (CGVD2013) or North American Vertical Datum of 1988 (NAVD 88).
Horizontal coordinate information is referenced to the North American Datum of 1983 (NAD 83) or Canadian Gravimetric Geoid of 2013 (CGG2013).
Elevation, as used in this report, refers to distance above the vertical datum.
Abbreviations
BSW Bernese GNSS Software v5.2CACS Canadian Active Control SystemCORS Continuously-Operating Reference StationCSRS Canadian Spatial Reference SystemEC Environment CanadaGLONASS Global Orbiting Navigation Satellite System
(Russian)GNSS Global Navigation Satellite SystemIJC International Joint CommissionNGS National Geodetic SurveyNRCan Natural Resources CanadaOPUS Online Positioning Users ServiceUSACE U.S. Army Corps of EngineersUSGS U.S. Geological Survey

Network Global Navigation Satellite System Survey to Harmonize Water-Surface Elevation Data for the Rainy River BasinBy Jeffrey R. Ziegeweid,1 R. Jason Silliker,2 Brenda K. Densmore,1 and Justin Krahulik1
1U.S. Geological Survey.2Natural Resources Canada.
AbstractContinuously recording water-level streamgages in Rainy
Lake and Namakan Reservoir are used to regulate water levels according to rule curves established in 2000 by the Interna-tional Joint Commission; however, water levels at streamgages were referenced to a variety of vertical datums, confounding efforts to model the flow of water through the system, regu-late water levels during periods of high inflow, and evaluate the effectiveness of the rule curves. In October 2014, the U.S. Geological Survey, Natural Resources Canada, Interna-tional Joint Commission, and National Park Service began a joint field study with the goal of obtaining precise elevations referenced to a uniform vertical datum for all reference marks used to set water levels at streamgages throughout Rainy Lake and Namakan Reservoir. This report was prepared by the U.S. Geological Survey in cooperation with Natural Resources Canada, International Joint Commission, and National Park Service.
Three field crews deployed Global Navigation Satellite System receivers statically over 16 reference marks colo-cated with active and discontinued water-level streamgages throughout Rainy River, Rainy Lake, Namakan Reservoir, and select tributaries of Rainy Lake and Namakan Reser-voir. A Global Navigation Satellite System receiver also was deployed statically over a National Geodetic Survey coopera-tive base network control station for use as a quality-control reference mark. Satellite data were collected simultaneously during a 5-day period and processed independently by the U.S. Geological Survey and Natural Resources Canada to obtain accurate positioning and elevations for the 17 surveyed reference marks. Processed satellite data were used to convert published water levels to elevations above sea level referenced to the Canadian Geodetic Vertical Datum of 2013 in order to compare water-surface elevations referenced to a uniform vertical datum throughout the study area. In this report, an “offset” refers to the correction applied to published data from a particular streamgage to produce elevation data referenced to a specified vertical datum.
Offsets were applied to water-level data from surveyed streamgages to further evaluate the accuracy and utility of updated reference mark elevations presented in this report. Daily mean water levels from active streamgages surveyed in this study were converted to water-surface elevations referenced to the Canadian Geodetic Vertical Datum of 2013. Graphical comparisons of water-surface elevations for streamgages in Namakan Reservoir, Rainy Lake, and selected rivers are presented (referencing the Canadian Geodetic Vertical Datum of 2013). Offsets presented in this report can be used in the evaluation of rule curves and in flood damage curves that fully assess the benefits of one regulation approach over another. In addition, offsets may be used to calibrate hydraulic models developed for four narrows that connect lakes of Namakan Reservoir, refine digital elevation models, and support modeling studies designed to assess the effects of rule curves on aquatic vegetation, benthic invertebrates, northern pike, and walleye.
IntroductionThe Rainy River Basin of northern Minnesota and
southwestern Ontario is a complex system of lakes and rivers (Kallemeyn and others, 2003), including Namakan Reservoir, Rainy Lake, and several rivers that feed these lake systems (fig. 1). Namakan Reservoir includes Crane, Little Vermilion, Sand Point, Kabetogama, and Namakan Lakes. Rainy Lake drains into the Rainy River near the towns of Fort Frances, Ontario, and International Falls, Minnesota. Rainy River, the southern basin of Rainy Lake, and Namakan Reservoir form the international border between the United States and Canada.
Water levels in Rainy Lake and Namakan Reservoir are managed according to rule curves established by the Inter-national Joint Commission (IJC) with the assistance of the International Rainy Lake Board of Control (International Rainy Lake Board of Control, 1999). Rule curves established in 2000 (hereafter referred to as the 2000 Rule Curves) set maximum and minimum allowable water levels on an annual basis (Kallemeyn and others, 2003). The 2000 Rule Curves

2 Network Global Navigation Satellite System Survey to Harmonize Water-Surface Elevation Data
Figure 1. Water-level streamgage locations for Rainy Lake, Namakan Reservoir, and selected rivers.
90°93°96°
LakeSuperior
Inset 2 Inset 1
Manitoba
Rainy River Basin
Base from Minnesota Department of Natural Resources 1:24,000Universal Transverse Mercator projection, zone 15North American Datum of 1983Esri Data and Maps for 9.3.1. 2006.
Rapid River
Rainy River
¬«72
¬«11
94°94°20'94°40'
Lake of the Woods
Ontario
MinnesotaMinnesota
Ontario
Rainy River
2
1
Inset 2
0 105 MILES
0 105 KILOMETERS
##
#
#
#
#
#
#
#
#
#
#
#
#
#
#¬«11
gg
g
¬«332
¬«53¬«71
¬«65
¬«11
¬«217
92°20'92°40'93°93°20'93°40'
48°40'
48°20'
49°
48°
51°
48°40"
Ontario
Ontario
Minnesota
Kabetogama Lake
RainyLake
NamakanLake
Sand PointLake
LittleVermilionLake
CraneLake
RainyLake
Seine River
Turtl
e Rive
r
Ontario
CANADAUNITED STATES
CANADA
CANADA
UNITED STATESUNITED STATES
RiverVe
rmili
on
Rainy River
Little Fork River
Fort Frances
International Falls
Kettle Falls Dam
Squirrel Falls Dam
Koochiching Falls Dam
Bear Portage
Gold Portage
8
1614
15
1312
11
109
7
6
5
4
3
0 105 MILES
0 105 KILOMETERS
Inset 1
EXPLANATION
Active streamgage with map number (table 1)
Discontinued streamgage with map number (table 1)
1
16#
#
#
#
Introduction 3
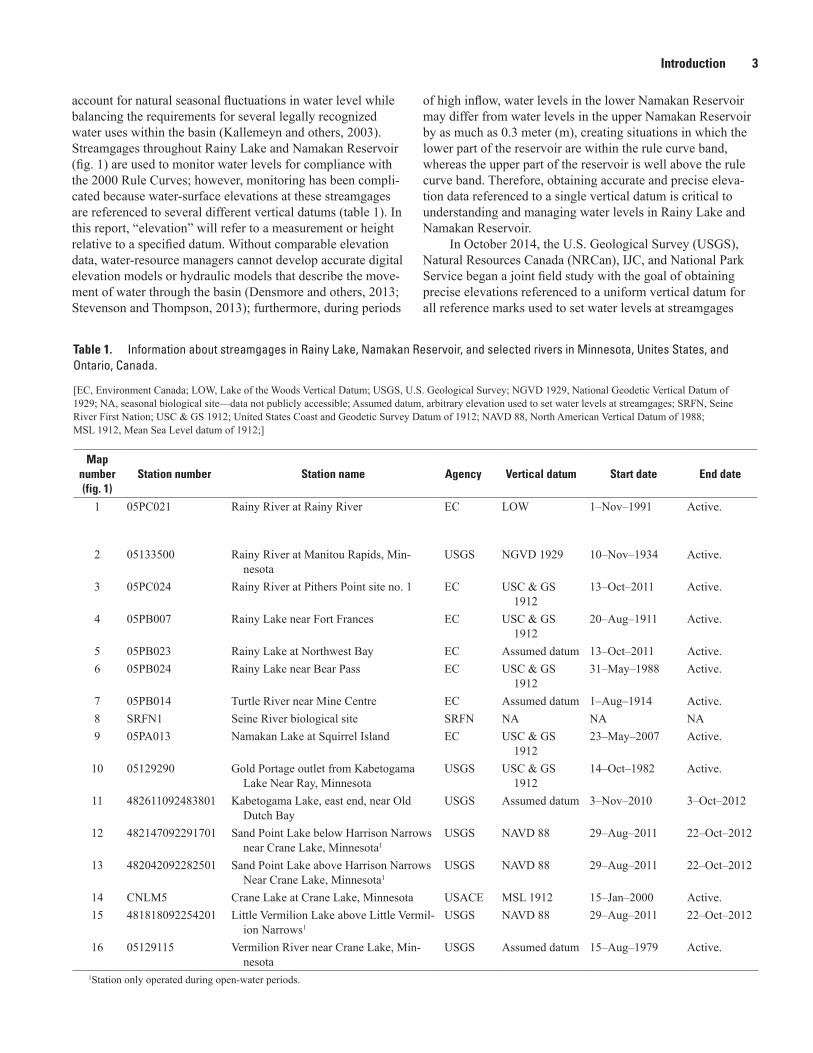
account for natural seasonal fluctuations in water level while balancing the requirements for several legally recognized water uses within the basin (Kallemeyn and others, 2003). Streamgages throughout Rainy Lake and Namakan Reservoir (fig. 1) are used to monitor water levels for compliance with the 2000 Rule Curves; however, monitoring has been compli-cated because water-surface elevations at these streamgages are referenced to several different vertical datums (table 1). In this report, “elevation” will refer to a measurement or height relative to a specified datum. Without comparable elevation data, water-resource managers cannot develop accurate digital elevation models or hydraulic models that describe the move-ment of water through the basin (Densmore and others, 2013; Stevenson and Thompson, 2013); furthermore, during periods
of high inflow, water levels in the lower Namakan Reservoir may differ from water levels in the upper Namakan Reservoir by as much as 0.3 meter (m), creating situations in which the lower part of the reservoir are within the rule curve band, whereas the upper part of the reservoir is well above the rule curve band. Therefore, obtaining accurate and precise eleva-tion data referenced to a single vertical datum is critical to understanding and managing water levels in Rainy Lake and Namakan Reservoir.
In October 2014, the U.S. Geological Survey (USGS), Natural Resources Canada (NRCan), IJC, and National Park Service began a joint field study with the goal of obtaining precise elevations referenced to a uniform vertical datum for all reference marks used to set water levels at streamgages
Table 1. Information about streamgages in Rainy Lake, Namakan Reservoir, and selected rivers in Minnesota, Unites States, and Ontario, Canada.
[EC, Environment Canada; LOW, Lake of the Woods Vertical Datum; USGS, U.S. Geological Survey; NGVD 1929, National Geodetic Vertical Datum of 1929; NA, seasonal biological site—data not publicly accessible; Assumed datum, arbitrary elevation used to set water levels at streamgages; SRFN, Seine River First Nation; USC & GS 1912; United States Coast and Geodetic Survey Datum of 1912; NAVD 88, North American Vertical Datum of 1988; MSL 1912, Mean Sea Level datum of 1912;]
Map number (fig. 1)
Station number Station name Agency Vertical datum Start date End date
1 05PC021 Rainy River at Rainy River EC LOW 1–Nov–1991 Active.
2 05133500 Rainy River at Manitou Rapids, Min-nesota
USGS NGVD 1929 10–Nov–1934 Active.
3 05PC024 Rainy River at Pithers Point site no. 1 EC USC & GS 1912
13–Oct–2011 Active.
4 05PB007 Rainy Lake near Fort Frances EC USC & GS 1912
20–Aug–1911 Active.
5 05PB023 Rainy Lake at Northwest Bay EC Assumed datum 13–Oct–2011 Active.6 05PB024 Rainy Lake near Bear Pass EC USC & GS
191231–May–1988 Active.
7 05PB014 Turtle River near Mine Centre EC Assumed datum 1–Aug–1914 Active.8 SRFN1 Seine River biological site SRFN NA NA NA9 05PA013 Namakan Lake at Squirrel Island EC USC & GS
191223–May–2007 Active.
10 05129290 Gold Portage outlet from Kabetogama Lake Near Ray, Minnesota
USGS USC & GS 1912
14–Oct–1982 Active.
11 482611092483801 Kabetogama Lake, east end, near Old Dutch Bay
USGS Assumed datum 3–Nov–2010 3–Oct–2012
12 482147092291701 Sand Point Lake below Harrison Narrows near Crane Lake, Minnesota1
USGS NAVD 88 29–Aug–2011 22–Oct–2012
13 482042092282501 Sand Point Lake above Harrison Narrows Near Crane Lake, Minnesota1
USGS NAVD 88 29–Aug–2011 22–Oct–2012
14 CNLM5 Crane Lake at Crane Lake, Minnesota USACE MSL 1912 15–Jan–2000 Active.15 481818092254201 Little Vermilion Lake above Little Vermil-
ion Narrows1USGS NAVD 88 29–Aug–2011 22–Oct–2012
16 05129115 Vermilion River near Crane Lake, Min-nesota
USGS Assumed datum 15–Aug–1979 Active.
1Station only operated during open-water periods.

4 Network Global Navigation Satellite System Survey to Harmonize Water-Surface Elevation Data
throughout Rainy Lake and Namakan Reservoir. In this study, the USGS and NRCan used geodetic-quality global navigation satellite system (GNSS) receivers to complete simultaneous static surveys on 16 streamgage reference marks and 1 National Geodetic Survey cooperative base network control station in the Rainy River, Rainy Lake, Namakan Reservoir, and tributaries of Rainy and Crane Lakes using established methodologies (Canadian Geodetic Survey, 2003, 2013; Rydlund and Densmore, 2012).
The objective of this study was to obtain precise eleva-tions referenced to the Canadian Geodetic Vertical Datum of 2013 (CGVD2013) for 16 streamgage reference marks used to establish water levels at streamgages throughout the Rainy River Basin (table 1). In total, 11 of the reference marks were used to establish water levels for active streamgages that provide real-time, continuous water-level data; 5 of the refer-ence marks surveyed were used to establish water levels for discontinued, temporary streamgages operated during previ-ous studies. Discontinued streamgages used transducers that recorded changes in water levels by measuring changes in the pressure and temperature of the water surrounding the trans-ducer. Three of the four discontinued, temporary streamgages only operated during open-water periods. Active streamgages are operated by the USGS, U.S. Army Corps of Engineers (USACE), and Environment Canada (EC). The final reference mark surveyed was National Geodetic Survey (NGS) coopera-tive base network control station AC4984 (map number 17), a reference mark of known elevation that was used as a quality-control reference mark (table 2; fig. 2).
Purpose and Scope
This report was prepared by the USGS in cooperation with NRCan, the IJC, and the National Park Service. The pur-poses of this report are to (1) describe the field surveys used to collect GNSS data for 17 reference marks in the Rainy River Basin (fig. 1), (2) describe how GNSS data were processed to determine water-surface elevations for all streamgages sur-veyed in this study, (3) present corrections to convert water-level data previously collected at the streamgages to water-surface elevations referenced to a uniform vertical datum, and (4) outline factors to consider when applying corrections to previously collected water-level data. The study is limited to the 16 streamgages in the Rainy River Basin associated with reference marks that were surveyed in this study; however, additional studies could expand the scope of this study to include additional tributary streamgages within the Rainy River Basin. In addition, a similar approach could be used in other basins that have streamgages referenced to a variety of vertical datums.
Physical Setting
The study area includes the Rainy, Turtle, Seine, and Vermilion Rivers; Rainy Lake; and the five lakes that compose Namakan Reservoir: Crane, Little Vermilion, Sand Point, Kabetogama, and Namakan Lakes (fig. 1). The Vermilion River flows into Crane Lake at the upper end of Namakan Res-ervoir. Crane and Little Vermilion Lakes flow into Sand Point
Table 2. Location information for the National Geodetic Survey cooperative base network control station, Canadian Active Control Stations, and Continuously Operating Reference Stations used to postprocess data collected from global navigation satellite system receivers in this study
[Station ID, alpha-numeric descriptor assigned to each station; NGS, National Geodetic Survey cooperative base network control station; CACS, Canadian Active Control Station; CORS, Continuously Operating Reference Station]
Map number (fig. 2)
Station ID Station location Type of stationLatitude
(degree/minute/second)
Longitude (degree/minute/
second)17 AC4984 Crane Lake, Minnesota NGS N 48 15 09.72616 W 92 29 14.9655518 ALGO Algonquin Park, Ontario CACS N 45 57 20.84731 W 78 04 16.9064819 DUBO Lac Du Bonnet, Manitoba CACS N 50 15 31.68253 W 95 51 58.2077720 FLIN Flin Flon, Manitoba CACS N 54 43 32.07415 W 101 58 40.8683221 PICL Pickle Lake, Ontario CACS N 51 28 47.27895 W 90 09 43.0693422 GDMA Grand Marais, Minnesota CORS N 47 44 54.75711 W 90 20 28.4714423 MNAS Ash Lake, Minnesota CORS N 48 17 38.54626 W 92 58 13.4265024 MNBD Birchdale, Minnesota CORS N 48 37 39.67691 W 94 04 02.1572925 MNMG Margie, Minnesota CORS N 48 08 04.54490 W 93 52 42.5077826 MNRV Roosevelt, Minnesota CORS N 48 47 21.79724 W 95 03 04.4595027 MNSQ Squaw Lake, Minnesota CORS N 47 36 13.44132 W 94 07 36.2090728 MNVI Virginia, Minnesota CORS N 47 31 23.77164 W 92 33 41.4335629 MNWH Waskish, Minnesota CORS N 48 09 00.63600 W 94 30 42.9968930 ROSS Rossport, Ontario CORS N 48 50 01.39381 W 87 31 10.5223831 YWG1 Winnipeg, Manitoba CORS N 49 54 02.06942 W 97 15 33.82364

Introduction 5
Lake; Sand Point Lake flows into Namakan Lake; and water moves bidirectionally between Namakan and Kabetogama Lakes depending on lake levels, wind direction, inflows from tributaries, and dam regulation (Christensen and others, 2013). Water flows from Namakan and Kabetogama Lakes into Rainy Lake from outflows at Kettle and Squirrel Falls Dams and at Gold Portage outlet, respectively. Rainy Lake is fed by Namakan Reservoir and several tributary rivers. The Seine and Turtle Rivers are the two largest tributaries that enter Rainy Lake downstream from the outflows from Namakan Reservoir into Rainy Lake (Kallemeyn and others, 2003). Rainy Lake drains into Rainy River at the southwestern corner of Rainy Lake, and the Rainy River flows northwest into Lake of the Woods. Rainy River, the southern basin of Rainy Lake, and
Namakan Reservoir form the international border between the United States and Canada.
Water levels in Rainy River, Rainy Lake, and Namakan Reservoir are controlled by three dams. The Koochiching Falls Dam controlling Rainy River flow out of Rainy Lake is located between Fort Frances, Ontario, and International Falls, Minnesota. This dam is the source of hydroelectric power for the Boise Cascade Corporation’s paper pulp industrial facili-ties. Two dams control the flow of water from Namakan Lake into Rainy Lake: Kettle Falls and Squirrel Falls Dams (Inter-national Rainy Lake Board of Control, 1999). The parts of Kettle Falls and Koochiching Falls Dams located in the United States are owned by the Boise Cascade Corporation, and the Canadian part is owned by Abitibi Consolidated Incorporated.
!(
!(
!(
!(
!(
!(
!(
!(
!(
!(
!( !(
!(
!(
!(
Saskatchewan
Pennsylvania
31
30
292827
2625
24
23 22
21
20
19
18
17
Iowa
South Dakota
Wisconsin
North Dakota
New YorkMichigan
Michigan
Ontario
Manitoba
75°80°85°90°095°100°105°
55°
50°
45°
!(
Minnesota
Lake of the Woods
Rainy River Basin
Quebec
Hudson Bay
Lake Superior
Lake Michigan
Lake Huron
Lake Erie
Lake Ontario
GeorgianBay
17
31
0 250125 MILES
0 300150 KILOMETERS
EXPLANATION
Continuously-operating reference station with map number (table 2)
Canadian active control system station with map number (table 2)
Cooperative base network control station with map number (table 2)
21(!
(!
(!
Base from Minnesota Department of Natural Resources 1:24,000Universal Transverse Mercator projection, zone 15North American Datum of 1983Esri Data and Maps for 9.3.1. 2006.
CANADAUNITED STATES
fig02.ai Figure 2. Locations of the National Geodetic Survey cooperative base network control station, Canadian Active Control Stations, and Continuously Operating Reference Stations used to postprocess data collected from global navigation satellite system receivers in this study.

6 Network Global Navigation Satellite System Survey to Harmonize Water-Surface Elevation Data
In addition to the regulated outflows at Kettle and Squirrel Falls, overflows from Namakan Lake into Rainy Lake happen at Bear and Gold Portages.
MethodsMethods are described in the following four sections
of this report. The first section details how GNSS receivers were deployed and how field data were collected. The second section details the processing methods used by NRCan and USGS to obtain elevations for the surveyed reference marks. All elevations reported in the second section were measured to the nearest 0.001 m. The third section describes how eleva-tions of reference marks were used to develop offsets, which are values added to or subtracted from published water levels in order to convert water-level data to elevations referenced to CGVD2013. The fourth section details how offsets were applied to published water levels and how corrected elevations were used to compare and evaluate collected water-level data from streamgages throughout the study area.
Field Data Collection
Three field crews deployed 17 geodetic-quality global positioning system GNSS receivers paired with choke ring antennas statically for satellite data collection. The GNSS units for data collection were deployed from October 5, 2014 (day of year 278), through October 9, 2014 (day of year 282), at 16 specified streamgage locations (fig. 1) and 1 NGS coop-erative base network control station (map number 17; fig. 2) for additional quality assurance. The exact start and end dates and times for each GNSS unit are available electronically in table 1–1 of appendix 1; GNSS units were deployed to provide as much simultaneous data collection time as possible among all surveyed sites and minimize variability related to weather conditions and satellite positions. The log files from the GNSS surveys are available electronically in appendix 1.
Field data-collection procedures used during the survey followed guidelines established for static network surveys as described by compatible methods from NRCan (Canadian Geodetic Survey, 2003, 2013) and the USGS (Rydlund and Densmore, 2012). When a clear view of surrounding satel-lites was possible, GNSS units were deployed directly above existing reference marks used to establish water levels at streamgages; however, at locations where a clear view of sur-rounding satellites was obstructed by tree cover or topographi-cal relief, GNSS units were deployed nearby to improve the quality of satellite signal reception and reduce satellite signal multipath. Multipath is a condition in which the accuracy of collected satellite data diminishes because the satellite signal arrives at the receiver antenna by way of several different paths (Georgiadou and Kleusberg, 1988). Bodies of water can create reflective surfaces that cause multipath issues. For view-obstructed locations where reference marks could not
be surveyed directly, surveyor level loops (also referred to as spirit level circuits) were used to accurately measure eleva-tion differences between points surveyed with GNSS and streamgage reference marks (Kenney, 2010; Canadian Geo-detic Survey, 2013). Instantaneous water levels were obtained at each site using either readings from operating streamgages (Environment Canada, 2015; U.S. Army Corps of Engineers, 2015; U.S. Geological Survey, 2015) or direct measurement from an established reference mark using surveyor level loops.
Data Processing
Elevations as defined by ellipsoid, geoid, and orthometric heights are all attempts to model the shape of the Earth using real world coordinates. An ellipsoid is a spherical shape with a polar radius that is shorter in length than the equatorial radius, and the overall shape of the Earth is best predicted using an ellipsoid (Li and Götze, 2001). Ellipsoid heights are offsets above or below a reference ellipsoid. A geoid is a model that represents the Earth’s mean global sea level under the influ-ence of gravitation and rotation alone (Milbert and Smith, 1996), and each vertical datum is associated with a particular geoid. Geoid heights are applied to ellipsoid heights to obtain orthometric heights, which refer to elevations above sea level referenced to the vertical datum associated with the geoid model.
The GNSS data collected at control and reference stations (fig. 2; table 2) were used to determine three-dimensional coordinates (latitude, longitude, and ellipsoid heights). Both NRCan and USGS postprocessed GNSS data were collected in receiver independent exchange (also known as RINEX) format independently using different methods in order to provide a quality comparison. The horizontal reference frames used by Canada (North American Datum of 1983 [NAD 83]; Canadian Spatial Reference System [CSRS]) and the United States (NAD 83 [2011] reference frame in epoch 2010.00) are compatible and equivalent for the purposes of this study.
Satellite data were processed by NRCan staff using Bernese GNSS Software v5.2 (BSW; Dach and others, 2007; Dach and Walser, 2015), a relative positioning method whereby coordinated differences between pairs of points (baselines) are computed. Although BSW is capable of processing data from the Russian Global Orbiting Naviga-tion Satellite System (GLONASS), the GLONASS data were not processed in this study. Using BSW, three-dimensional coordinates (latitude, longitude, and ellipsoid heights) were determined for the 16 streamgage reference marks and NGS cooperative base network control station AC4984 in the geo-metric reference frame of NAD 83 (CSRS) Velocity Grid v6 for epoch 2010.0.
Data from four Canadian Active Control System (CACS; Natural Resources Canada, 2016) stations were included to provide a connection to the NAD 83 reference frame and the international terrestrial reference frame (also known as ITRF) in order to obtain specific coordinates (table 2); the CACS
Methods 7
stations included ALGO (Algonquin Park, Ontario), DUBO (Lac Du Bonnet, Manitoba), FLIN (Flin Flon, Manitoba), and PICL (Pickle Lake, Ontario). Seven other CACS stations and NGS Continuously Operating Reference Stations (CORS; National Geodetic Survey, 2014a) were included as local quality-control points; however, a substantial part of avail-able data from these stations could not be used because signal obstructions prohibited common satellites from being in view at both ends of the baseline, and these seven stations were not used in the study.
Session baselines from BSW were corrected for relative crustal motion between the observation epoch and the 2010.0 reference epoch using the adopted NAD 83 (CSRS) Veloc-ity Grid v6 (Craymer and others, 2011). Such crustal motions between local stations and CACS stations that are much far-ther away can substantially affect reference frame realization. Estimated session baselines were combined into a network adjustment using NRCan GHOST software (Beattie, 1987), and CACS stations were weighted to known NAD 83 (CSRS) Velocity Grid v6 coordinates at epoch 2010.0 using known accuracies. The Canadian Gravimetric Geoid model of 2013 (CGG2013) was applied to postprocessed ellipsoid heights to obtain orthometric heights referenced to CGVD2013 for all streamgage reference marks and NGS cooperative base network control station AC4984 (Huang and Véronneau, 2013; Véronneau and others, 2014a, 2014b).
The USGS postprocessed the GNSS data through the NGS Online Positioning Users Service (OPUS; National Geodetic Survey, 2014b), a service that uses the NGS PAGES processing software (National Geodetic Survey, 2015a), with baseline processing methodology similar to BSW. Using OPUS-Projects (National Geodetic Survey, 2014c), a net-work adjustment was applied to the 16 streamgage reference marks and NGS cooperative base network control station AC4984 using 10 CORS to define the NAD 83 (2011) refer-ence frame in epoch 2010.0 (table 2); the CORS used in the network adjustment included GDMA (Grand Marais, Minne-sota), MNAS (Ash Lake, Minn.), MNBD (Birchdale, Minn.), MNMG (Margie, Minn.), MNRV (Roosevelt, Minn.), MNSQ (Squaw Lake, Minn.), MNVI (Virginia, Minn.), MNWH (Waskish, Minn.), ROSS (Rossport, Ontario), and YWG1 (Winnipeg, Manitoba; National Geodetic Survey, 2014a).
Using OPUS, the USGS established known geodetic-quality coordinates for each reference mark (Rydlund and Densmore, 2012); coordinate information for each reference mark includes NAD 83 (2011 epoch 2010.00), latitude, longi-tude, and ellipsoid heights (National Geodetic Survey, 2012). Geoid model 12A (National Geodetic Survey, 2015b) was applied to postprocessed ellipsoid heights to obtain orthomet-ric heights referenced to the North American Vertical Datum of 1988 (NAVD 88; Zilkoski and others, 1992); however, after processing session baselines, more than one-half of the available data were omitted by OPUS based on automated data quality criteria established by the NGS. As a result, as little as 13 hours of data were used to process session baselines for some reference marks. In addition, the CORS of MNAS,
MNBD, MNMG, MNRV, MNSQ, and MNWH have modeled velocities that do not include vertical velocities; therefore, corrections for vertical crustal motion cannot be applied uni-formly across the area covered by the CORS for data pro-cessed in OPUS-Projects by the USGS. In contrast, processing completed by NRCan using BSW included corrections for vertical crustal motion applied to all processed baselines and estimated coordinates.
Development of Streamgage Datum Offsets
Orthometric heights obtained from processing collected GNSS data were used to develop offsets that convert pub-lished water levels to elevations referenced to CGVD2013, either through direct streamgage reference mark surveys or surveyor level loops between surveyed points and streamgage reference marks. Offsets are based on published water levels, so the magnitude of each offset depends on whether water levels are published as actual elevations or as local datums that allow smaller numbers to be used for publication. For example, USGS station 05129290 (Gold Portage outlet from Kabetogama Lake near Ray, Minnesota; map number 10) (fig. 1) was established using the U.S. Coast and Geodetic Survey Datum of 1912; however, water levels are published as eleva-tions minus 1,100 feet (U.S. Geological Survey, 2015). The offset for USGS station 05129290, therefore, will be much larger compared to the offset for USACE station CNLM5 (Crane Lake at Crane Lake, Minnesota; map number 14) (fig. 1), which are published as elevations in 1912 Mean Sea Level datum (U.S. Army Corps of Engineers, 2015). Off-set data are presented in metric (International System) and English (U.S. customary) units. The vertical datums used to establish water levels for streamgages examined in this study are presented in table 1.
Application of Streamgage Datum Offsets
Streamgage datum offsets were applied to surveyed streamgages, and water-surface elevations referenced to CGVD2013 were compared among active streamgages in Namakan Reservoir; Rainy Lake; and the Vermilion, Turtle, and Rainy Rivers (fig. 1). In addition, because three of the four temporary streamgages in the Namakan Reservoir were only operated during open water periods between the start and end dates shown in table 1, the period from May 1, 2012, through September 30, 2012, was used to compare water-surface elevations among all active and discontinued streamgages in Namakan Reservoir. This period represents the most recent period when all active and discontinued streamgages in Namakan Reservoir operated simultaneously. Monthly mean water-surface elevations (referenced to CGVD2013) were compared among all streamgages in Namakan Reservoir in order to average variability in the data associated with the tem-porary streamgage installations.
8 Network Global Navigation Satellite System Survey to Harmonize Water-Surface Elevation Data
Global Navigation Satellite System Surveys
Deployment times for GNSS units ranged from 29 to 68 hours, with a mean deployment time of 46 hours. Satellite data quality was generally good during the GNSS surveys. Despite the best efforts of the field crews to find locations with a clear view of surrounding satellites, steep terrain and dense tree cover surrounding some of the streamgage locations inter-fered with satellite coverage during certain times of the day. In addition, proximity of the GNSS units to the water surface created multipath issues that had to be accounted for during data processing. Surveyor level loops between GNSS survey
points and reference marks of known elevation referenced to a specified vertical datum likely introduced a small amount of error (less than or equal to 0.005 m) into the elevation data.
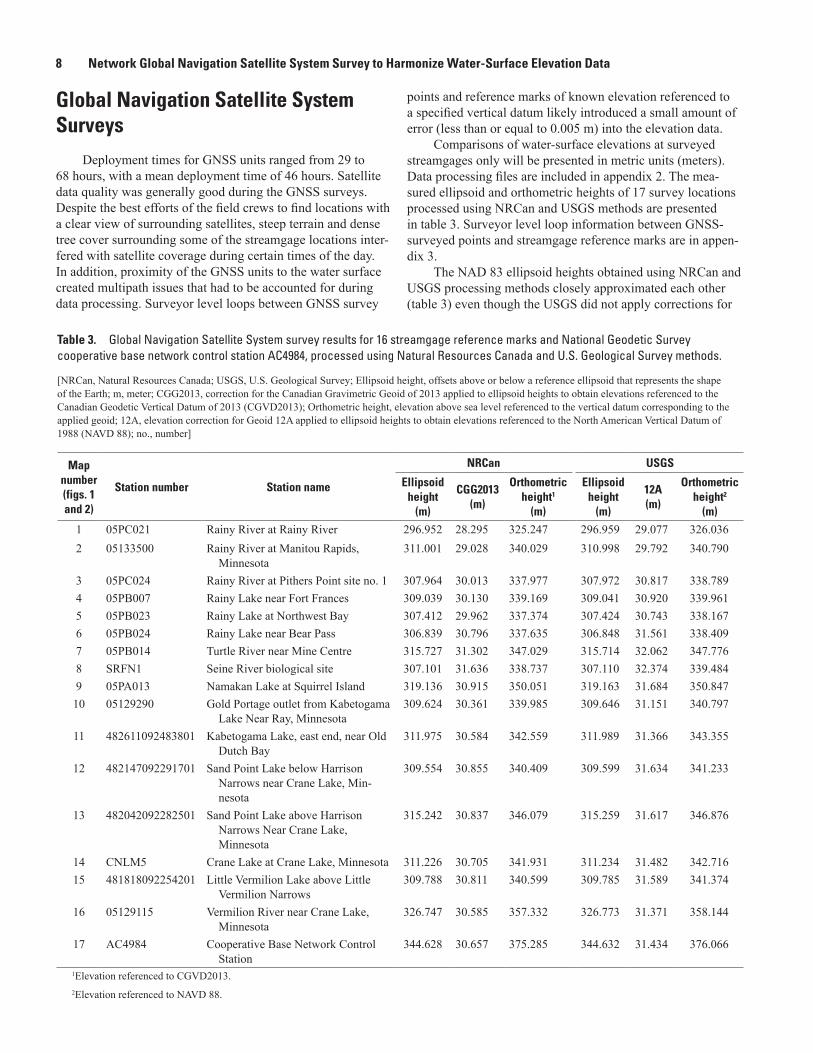
Comparisons of water-surface elevations at surveyed streamgages only will be presented in metric units (meters). Data processing files are included in appendix 2. The mea-sured ellipsoid and orthometric heights of 17 survey locations processed using NRCan and USGS methods are presented in table 3. Surveyor level loop information between GNSS-surveyed points and streamgage reference marks are in appen-dix 3.
The NAD 83 ellipsoid heights obtained using NRCan and USGS processing methods closely approximated each other (table 3) even though the USGS did not apply corrections for
Table 3. Global Navigation Satellite System survey results for 16 streamgage reference marks and National Geodetic Survey cooperative base network control station AC4984, processed using Natural Resources Canada and U.S. Geological Survey methods.
[NRCan, Natural Resources Canada; USGS, U.S. Geological Survey; Ellipsoid height, offsets above or below a reference ellipsoid that represents the shape of the Earth; m, meter; CGG2013, correction for the Canadian Gravimetric Geoid of 2013 applied to ellipsoid heights to obtain elevations referenced to the Canadian Geodetic Vertical Datum of 2013 (CGVD2013); Orthometric height, elevation above sea level referenced to the vertical datum corresponding to the applied geoid; 12A, elevation correction for Geoid 12A applied to ellipsoid heights to obtain elevations referenced to the North American Vertical Datum of 1988 (NAVD 88); no., number]
Map number (figs. 1 and 2)
Station number Station name
NRCan USGS
Ellipsoid height
(m)
CGG2013 (m)
Orthometric height1
(m)
Ellipsoid height
(m)
12A (m)
Orthometric height2
(m)1 05PC021 Rainy River at Rainy River 296.952 28.295 325.247 296.959 29.077 326.0362 05133500 Rainy River at Manitou Rapids,
Minnesota311.001 29.028 340.029 310.998 29.792 340.790
3 05PC024 Rainy River at Pithers Point site no. 1 307.964 30.013 337.977 307.972 30.817 338.7894 05PB007 Rainy Lake near Fort Frances 309.039 30.130 339.169 309.041 30.920 339.9615 05PB023 Rainy Lake at Northwest Bay 307.412 29.962 337.374 307.424 30.743 338.1676 05PB024 Rainy Lake near Bear Pass 306.839 30.796 337.635 306.848 31.561 338.4097 05PB014 Turtle River near Mine Centre 315.727 31.302 347.029 315.714 32.062 347.7768 SRFN1 Seine River biological site 307.101 31.636 338.737 307.110 32.374 339.4849 05PA013 Namakan Lake at Squirrel Island 319.136 30.915 350.051 319.163 31.684 350.84710 05129290 Gold Portage outlet from Kabetogama
Lake Near Ray, Minnesota309.624 30.361 339.985 309.646 31.151 340.797
11 482611092483801 Kabetogama Lake, east end, near Old Dutch Bay
311.975 30.584 342.559 311.989 31.366 343.355
12 482147092291701 Sand Point Lake below Harrison Narrows near Crane Lake, Min-nesota
309.554 30.855 340.409 309.599 31.634 341.233
13 482042092282501 Sand Point Lake above Harrison Narrows Near Crane Lake, Minnesota
315.242 30.837 346.079 315.259 31.617 346.876
14 CNLM5 Crane Lake at Crane Lake, Minnesota 311.226 30.705 341.931 311.234 31.482 342.71615 481818092254201 Little Vermilion Lake above Little
Vermilion Narrows309.788 30.811 340.599 309.785 31.589 341.374
16 05129115 Vermilion River near Crane Lake, Minnesota
326.747 30.585 357.332 326.773 31.371 358.144
17 AC4984 Cooperative Base Network Control Station
344.628 30.657 375.285 344.632 31.434 376.066
1Elevation referenced to CGVD2013.2Elevation referenced to NAVD 88.
Global Navigation Satellite System Surveys 9
vertical crustal motion to processed baselines or estimated coordinates; corrections for vertical crustal motion may be plus or minus (±) 0.003 meter per year depending on the loca-tion within the study area (Henton and others, 2006; Craymer, 2006; Snay and Pearson, 2010). Ellipsoid heights obtained using USGS methods generally were higher than ellipsoid heights obtained using NRCan methods. Differences between methods ranged from -0.003 to +0.045 m, with a mean differ-ence of 0.011 m; furthermore, determined ellipsoid heights for NGS cooperative base network control station AC4984 (map number 17) closely approximate published values (National Geodetic Survey, 2015c). An ellipsoid height of 344.633 m was determined for station AC4984 during the last static GNSS survey done by the NGS in 1996 (National Geodetic Survey, 2015c). Ellipsoid heights of AC4984 determined using NRCan and USGS processing methods were 344.628 m and 344.632 m, respectively. Offsets were developed using GNSS survey point elevations and surveyor leveling information (appendix 3).
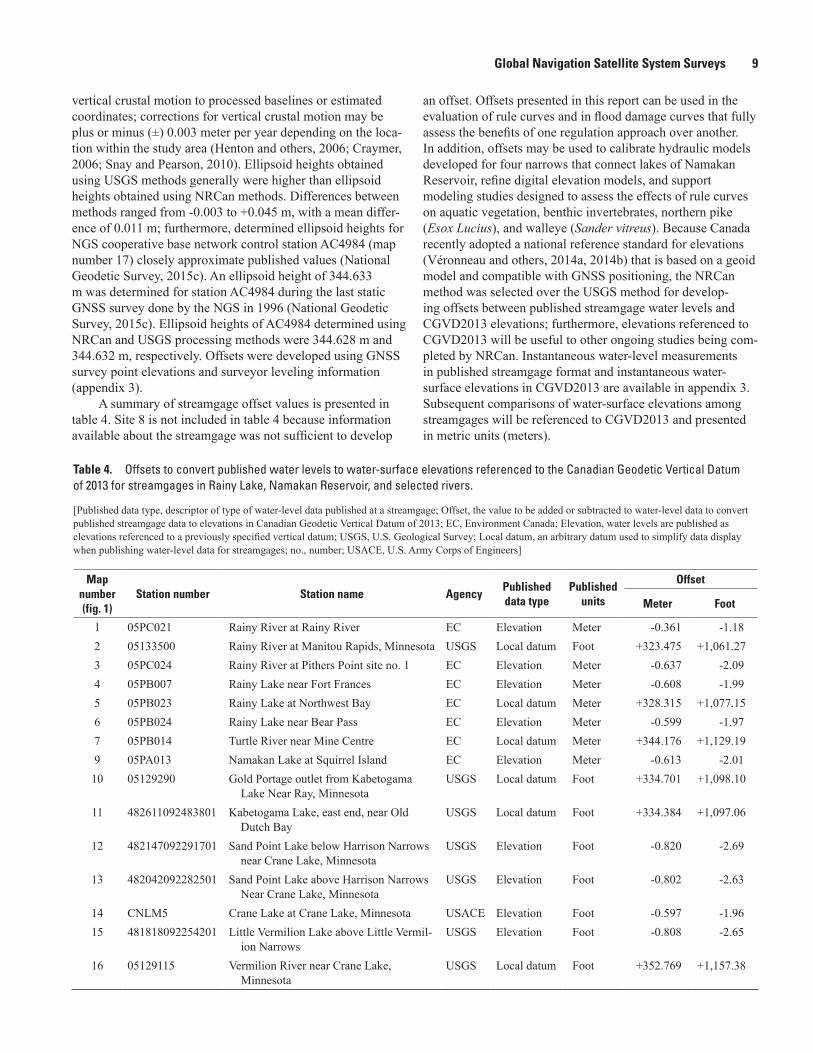
A summary of streamgage offset values is presented in table 4. Site 8 is not included in table 4 because information available about the streamgage was not sufficient to develop
an offset. Offsets presented in this report can be used in the evaluation of rule curves and in flood damage curves that fully assess the benefits of one regulation approach over another. In addition, offsets may be used to calibrate hydraulic models developed for four narrows that connect lakes of Namakan Reservoir, refine digital elevation models, and support modeling studies designed to assess the effects of rule curves on aquatic vegetation, benthic invertebrates, northern pike (Esox Lucius), and walleye (Sander vitreus). Because Canada recently adopted a national reference standard for elevations (Véronneau and others, 2014a, 2014b) that is based on a geoid model and compatible with GNSS positioning, the NRCan method was selected over the USGS method for develop-ing offsets between published streamgage water levels and CGVD2013 elevations; furthermore, elevations referenced to CGVD2013 will be useful to other ongoing studies being com-pleted by NRCan. Instantaneous water-level measurements in published streamgage format and instantaneous water-surface elevations in CGVD2013 are available in appendix 3. Subsequent comparisons of water-surface elevations among streamgages will be referenced to CGVD2013 and presented in metric units (meters).
Table 4. Offsets to convert published water levels to water-surface elevations referenced to the Canadian Geodetic Vertical Datum of 2013 for streamgages in Rainy Lake, Namakan Reservoir, and selected rivers.
[Published data type, descriptor of type of water-level data published at a streamgage; Offset, the value to be added or subtracted to water-level data to convert published streamgage data to elevations in Canadian Geodetic Vertical Datum of 2013; EC, Environment Canada; Elevation, water levels are published as elevations referenced to a previously specified vertical datum; USGS, U.S. Geological Survey; Local datum, an arbitrary datum used to simplify data display when publishing water-level data for streamgages; no., number; USACE, U.S. Army Corps of Engineers]
Map number (fig. 1)
Station number Station name AgencyPublished data type
Published units
Offset
Meter Foot
1 05PC021 Rainy River at Rainy River EC Elevation Meter -0.361 -1.182 05133500 Rainy River at Manitou Rapids, Minnesota USGS Local datum Foot +323.475 +1,061.273 05PC024 Rainy River at Pithers Point site no. 1 EC Elevation Meter -0.637 -2.094 05PB007 Rainy Lake near Fort Frances EC Elevation Meter -0.608 -1.995 05PB023 Rainy Lake at Northwest Bay EC Local datum Meter +328.315 +1,077.156 05PB024 Rainy Lake near Bear Pass EC Elevation Meter -0.599 -1.977 05PB014 Turtle River near Mine Centre EC Local datum Meter +344.176 +1,129.199 05PA013 Namakan Lake at Squirrel Island EC Elevation Meter -0.613 -2.0110 05129290 Gold Portage outlet from Kabetogama
Lake Near Ray, MinnesotaUSGS Local datum Foot +334.701 +1,098.10
11 482611092483801 Kabetogama Lake, east end, near Old Dutch Bay
USGS Local datum Foot +334.384 +1,097.06
12 482147092291701 Sand Point Lake below Harrison Narrows near Crane Lake, Minnesota
USGS Elevation Foot -0.820 -2.69
13 482042092282501 Sand Point Lake above Harrison Narrows Near Crane Lake, Minnesota
USGS Elevation Foot -0.802 -2.63
14 CNLM5 Crane Lake at Crane Lake, Minnesota USACE Elevation Foot -0.597 -1.9615 481818092254201 Little Vermilion Lake above Little Vermil-
ion NarrowsUSGS Elevation Foot -0.808 -2.65
16 05129115 Vermilion River near Crane Lake, Minnesota
USGS Local datum Foot +352.769 +1,157.38

10 Network Global Navigation Satellite System Survey to Harmonize Water-Surface Elevation Data
Survey ComparisonsOffsets developed to correct measured water-level data
to elevations above sea level referenced to CGVD2013 were applied to collected water-level data from active and dis-continued streamgages in the study area. Daily mean water levels during the survey period were compared among active streamgages on Namakan Reservoir, Rainy Lake, and sur-veyed rivers (fig. 1). In addition, monthly mean water levels from 2012 were compared for all active and discontinued streamgages in Namakan Reservoir. Monthly mean water levels were used to reduce variability associated with tempo-rary installations, and data from 2012 were used because 2012 represents the most recent period when all active and discon-tinued streamgages ran simultaneously.
Namakan Reservoir
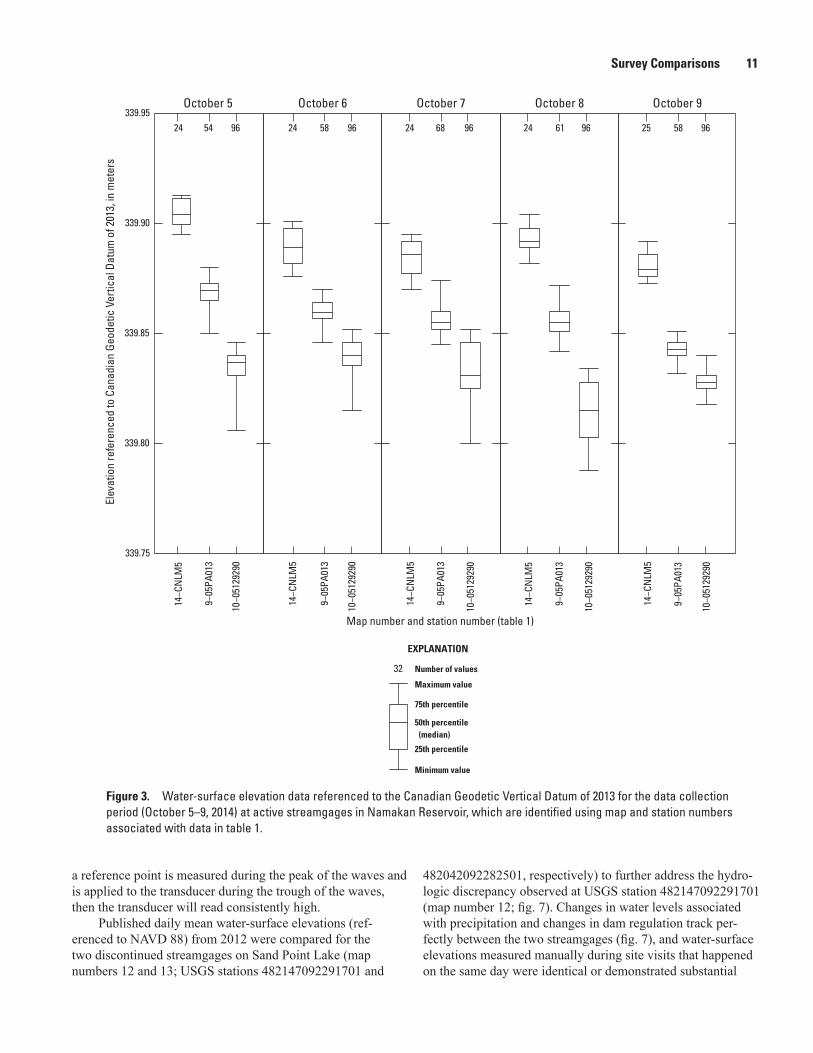
Active, continuous streamgages for Namakan Reser-voir operate at Crane Lake (map number 14; USACE sta-tion CNLM5), the Gold Portage outlet of Kabetogama Lake (map number 10; USGS station 05129290), and Squirrel Island near the outlet of Namakan Lake (map number 9; EC station 05PA013) (fig. 1). Boxplots of water-surface eleva-tions (referenced to CGVD2013) during the data collection period (October 5–9, 2014) at active streamgages in Namakan Reservoir are presented in figure 3. Mean water-surface eleva-tions decreased from upstream to downstream among all three stations.
Rainy Lake
Active streamgages in Rainy Lake operate near Bear Pass (map number 6; EC station 05PB024), at Northwest Bay (map number 5; EC station 05PB023), and near Fort Frances (map number 4; EC station 05PB007) (fig. 1). Water-surface eleva-tion data (referenced to CGVD2013) for the data collection period (October 5–9, 2014) at active streamgages in Rainy Lake are presented in figure 4. Mean water-surface elevations during the data collection period were similar among all three stations.
Rivers
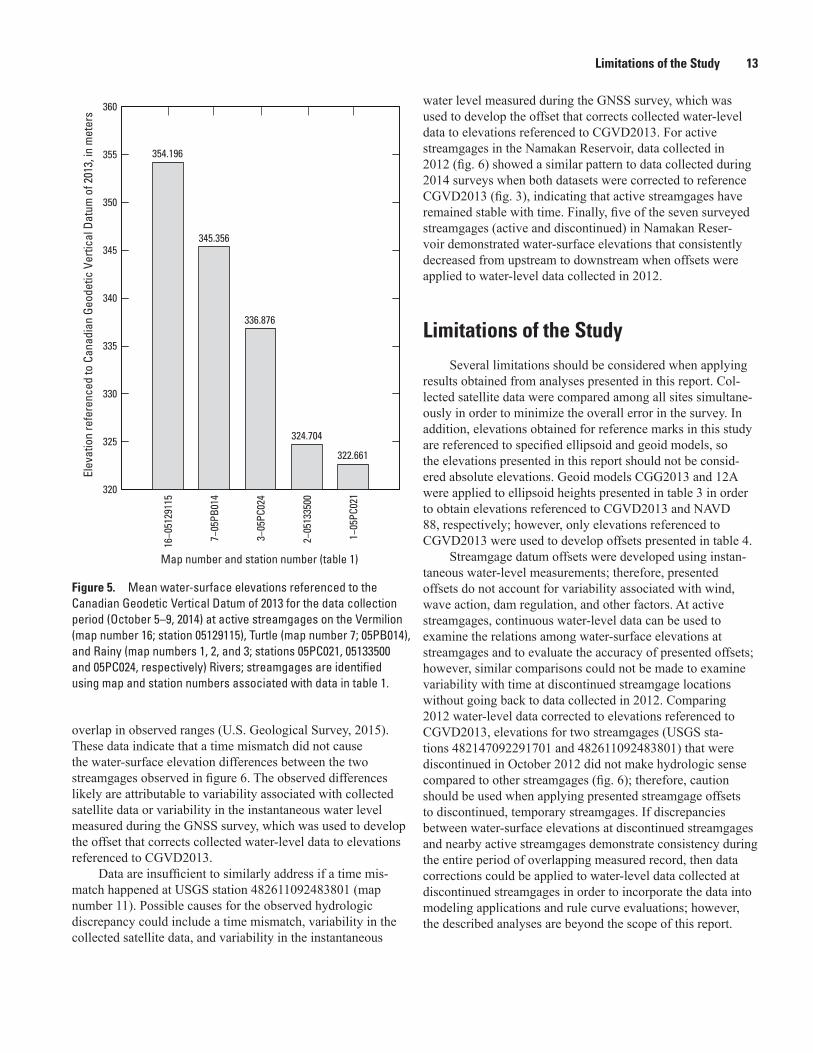
Rivers with active streamgages surveyed in this study include the Vermilion, Turtle, and Rainy Rivers (fig. 1). A bar chart of mean water-surface elevations (referenced to CGVD2013) for active river streamgages surveyed in this study are presented in figure 5; mean water-surface elevations were determined by taking the mean of continuous water level data collected October 5–9, 2014, at each streamgage and applying the appropriate offsets. Vermilion River near Crane Lake, Minnesota (map number 16; USGS station 05129115)
and the Turtle River near Mine Centre (map number 7; EC station 05PB014) represent inflow streamgages to Namakan Reservoir and Rainy Lake, respectively. Water-surface eleva-tions at the inflow streamgages are substantially higher than the water-surface elevations of Namakan Reservoir (fig. 3) and Rainy Lake (fig. 4). Starting at the outlet of Rainy Lake and moving downstream towards Lake of the Woods, Rainy River streamgages were surveyed at Pithers Point (map number 3; EC station 05PC024), Manitou Rapids (map number 2; USGS station 05133500), and the town of Rainy River, Ontario (map number 1; EC station 05PC021) (fig. 1). Water-surface eleva-tions at the outlet of Rainy Lake (map number 3; EC station 05PC024) were slightly lower in elevation than Rainy Lake (fig. 4), and a substantial drop in elevation (more than 10 m) was observed between Pithers Point (map number 3; EC sta-tion 05PC024) and Manitou Rapids (map number 2; USGS station 05133500). A smaller drop in elevation (about 2 m) was observed between Manitou Rapids (map number 2; USGS station 05133500) and the town of Rainy River, Ontario (map number 1; EC station 05PC021).
2012 Namakan Reservoir Data
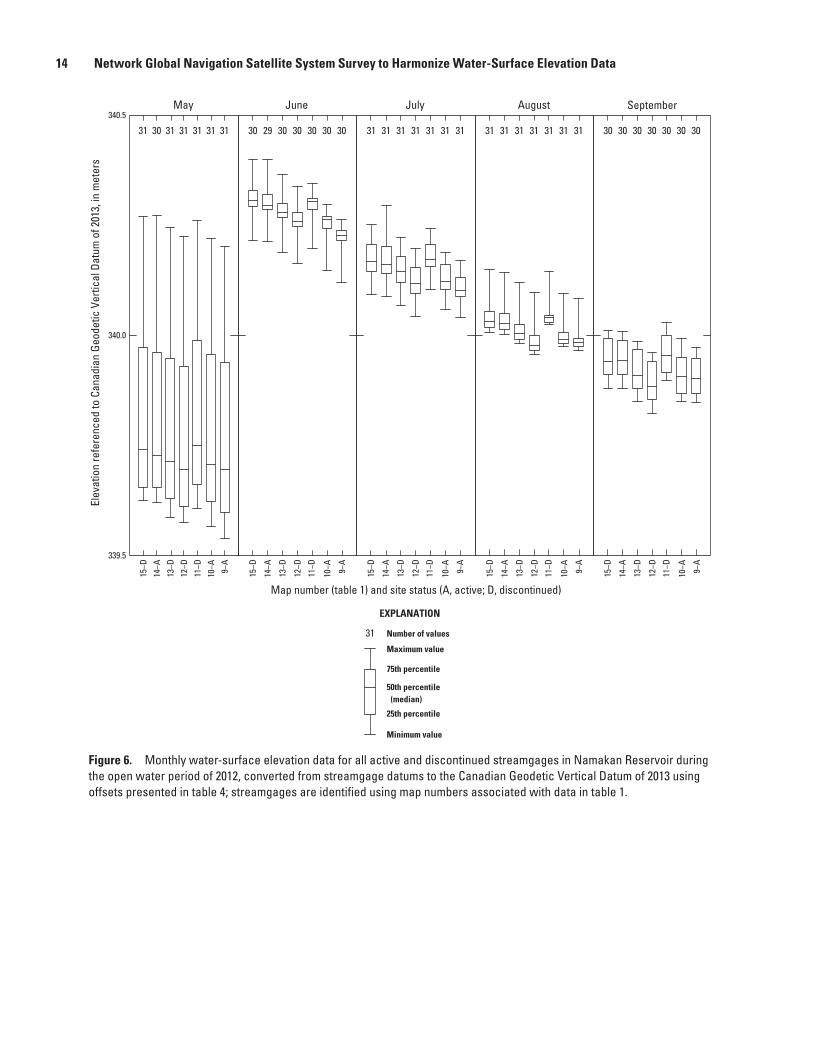
Because surveyed temporary streamgages were discon-tinued, boxplots of monthly water-level data collected in 2012 were compared for all active and discontinued streamgages in the Namakan Reservoir (fig. 1). Boxplots of monthly water-surface elevations referenced to CGVD2013 for May through September of 2012 are presented in figure 6. Eleva-tions generally decrease from upstream to downstream, with the most notable exception being the temporary index-velocity streamgage used to measure flow between Namakan and Kabetogama Lakes (map number 11; USGS station 482611092483801). In addition, water-surface elevations for the temporary streamgage at Sand Point Lake below Harrison Narrows (map number 12; USGS station 482147092291701) seem to be lower than elevations at the outlet sites at Squirrel Island (map number 9; EC station 05PA013) and Gold Portage (map number 10; USGS station 05129290).
The observed water levels at discontinued streamgages 482611092483801 (map number 11) and 482147092291701 (map number 12) do not make sense hydrologically given the direction of flowing water, which indicates that the transduc-ers may have shifted on the lake bottoms or that initial water levels may have been established incorrectly. A time mismatch could have happened when programming the water levels into the transducers based on a measurement from a reference point of known elevation. During windy and wavy condi-tions, water levels can vary by as much as ±0.060 m (U.S. Geological Survey, 2015), and there is a delay associated with programming water levels into the transducers. If a refer-ence point is measured during the trough of the waves and is applied to the transducer during the peak of the waves, then the transducer readings will read consistently low. Similarly, if
Survey Comparisons 11
a reference point is measured during the peak of the waves and is applied to the transducer during the trough of the waves, then the transducer will read consistently high.
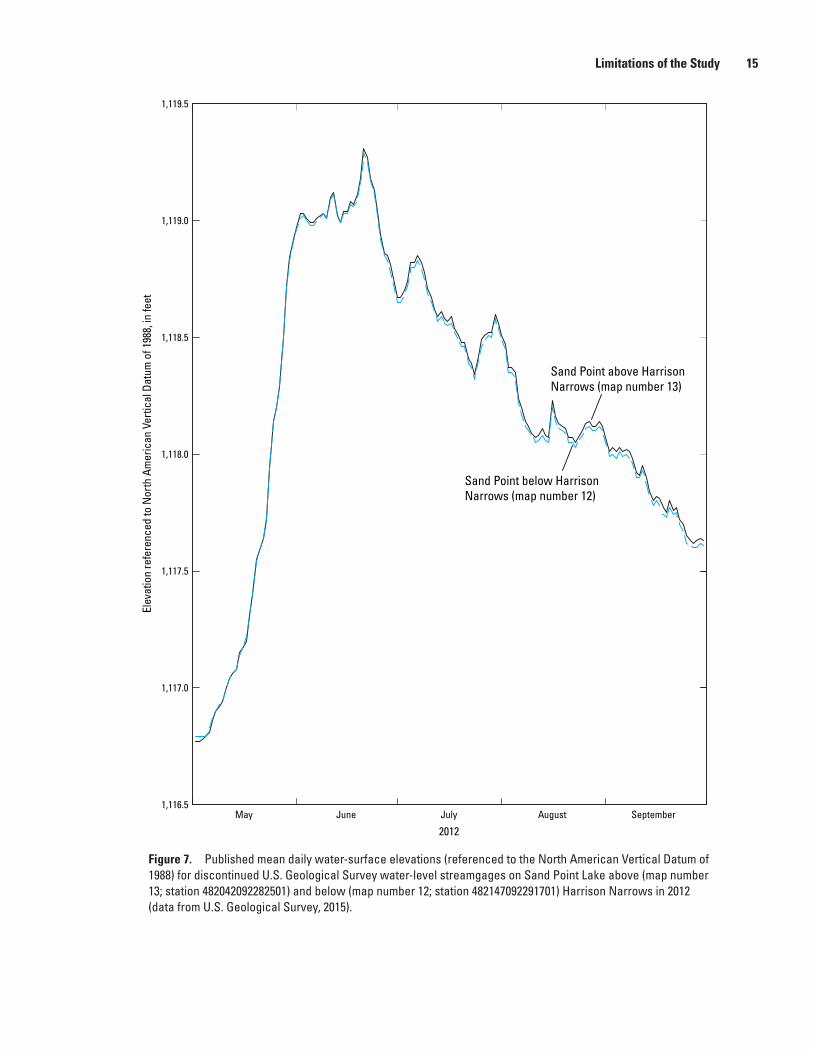
Published daily mean water-surface elevations (ref-erenced to NAVD 88) from 2012 were compared for the two discontinued streamgages on Sand Point Lake (map numbers 12 and 13; USGS stations 482147092291701 and
482042092282501, respectively) to further address the hydro-logic discrepancy observed at USGS station 482147092291701 (map number 12; fig. 7). Changes in water levels associated with precipitation and changes in dam regulation track per-fectly between the two streamgages (fig. 7), and water-surface elevations measured manually during site visits that happened on the same day were identical or demonstrated substantial
14−C
NLM
5
9−05
PA01
3
10−0
5129
290
339.75
339.80
339.85
339.90
339.95El
evat
ion
refe
renc
ed to
Can
adia
n Ge
odet
ic V
ertic
al D
atum
of 2
013,
in m
eter
s
24 54 96
October 5 October 6 October 7 October 8 October 9
14−C
NLM
5
9−05
PA01
3
10−0
5129
290
24 58 96
14−C
NLM
5
9−05
PA01
3
10−0
5129
290
24 68 96
Map number and station number (table 1)
14−C
NLM
5
9−05
PA01
3
10−0
5129
290
24 61 96
14−C
NLM
5
9−05
PA01
3
10−0
5129
290
25 58 96
fig03.ai
32 Number of values
EXPLANATION
Maximum value
75th percentile
50th percentile (median)
25th percentile
Minimum value
Figure 3. Water-surface elevation data referenced to the Canadian Geodetic Vertical Datum of 2013 for the data collection period (October 5–9, 2014) at active streamgages in Namakan Reservoir, which are identified using map and station numbers associated with data in table 1.

12 Network Global Navigation Satellite System Survey to Harmonize Water-Surface Elevation Data
Figure 4. Water-surface elevation data referenced to the Canadian Geodetic Vertical Datum of 2013 for the data collection period (October 5–9, 2014) at active streamgages in Rainy Lake, which are identified using map and station numbers associated with data in table 1.
6−05
PB02
4
5−05
PB02
3
4−05
PB00
7
336.85
336.90
336.95
337.00
337.05
67 288 288
6−05
PB02
4
5−05
PB02
3
4−05
PB00
7
60 288 276
6−05
PB02
4
5−05
PB02
3
4−05
PB00
7
63 288 288
6−05
PB02
4
5−05
PB02
3
4−05
PB00
7
62 276 288
6−05
PB02
4
5−05
PB02
3
4−05
PB00
7
66 288 288
Elev
atio
n re
fere
nced
to C
anad
ian
Geod
etic
Ver
tical
Dat
um o
f 201
3, in
met
ers
Map number and station number (table 1)
October 5 October 6 October 7 October 8 October 9
fig04.ai
63 Number of values
EXPLANATION
Maximum value
75th percentile
50th percentile (median)
25th percentile
Minimum value
Limitations of the Study 13
overlap in observed ranges (U.S. Geological Survey, 2015). These data indicate that a time mismatch did not cause the water-surface elevation differences between the two streamgages observed in figure 6. The observed differences likely are attributable to variability associated with collected satellite data or variability in the instantaneous water level measured during the GNSS survey, which was used to develop the offset that corrects collected water-level data to elevations referenced to CGVD2013.
Data are insufficient to similarly address if a time mis-match happened at USGS station 482611092483801 (map number 11). Possible causes for the observed hydrologic discrepancy could include a time mismatch, variability in the collected satellite data, and variability in the instantaneous
water level measured during the GNSS survey, which was used to develop the offset that corrects collected water-level data to elevations referenced to CGVD2013. For active streamgages in the Namakan Reservoir, data collected in 2012 (fig. 6) showed a similar pattern to data collected during 2014 surveys when both datasets were corrected to reference CGVD2013 (fig. 3), indicating that active streamgages have remained stable with time. Finally, five of the seven surveyed streamgages (active and discontinued) in Namakan Reser-voir demonstrated water-surface elevations that consistently decreased from upstream to downstream when offsets were applied to water-level data collected in 2012.
Limitations of the StudySeveral limitations should be considered when applying
results obtained from analyses presented in this report. Col-lected satellite data were compared among all sites simultane-ously in order to minimize the overall error in the survey. In addition, elevations obtained for reference marks in this study are referenced to specified ellipsoid and geoid models, so the elevations presented in this report should not be consid-ered absolute elevations. Geoid models CGG2013 and 12A were applied to ellipsoid heights presented in table 3 in order to obtain elevations referenced to CGVD2013 and NAVD 88, respectively; however, only elevations referenced to CGVD2013 were used to develop offsets presented in table 4.
Streamgage datum offsets were developed using instan-taneous water-level measurements; therefore, presented offsets do not account for variability associated with wind, wave action, dam regulation, and other factors. At active streamgages, continuous water-level data can be used to examine the relations among water-surface elevations at streamgages and to evaluate the accuracy of presented offsets; however, similar comparisons could not be made to examine variability with time at discontinued streamgage locations without going back to data collected in 2012. Comparing 2012 water-level data corrected to elevations referenced to CGVD2013, elevations for two streamgages (USGS sta-tions 482147092291701 and 482611092483801) that were discontinued in October 2012 did not make hydrologic sense compared to other streamgages (fig. 6); therefore, caution should be used when applying presented streamgage offsets to discontinued, temporary streamgages. If discrepancies between water-surface elevations at discontinued streamgages and nearby active streamgages demonstrate consistency during the entire period of overlapping measured record, then data corrections could be applied to water-level data collected at discontinued streamgages in order to incorporate the data into modeling applications and rule curve evaluations; however, the described analyses are beyond the scope of this report.
Figure 5. Mean water-surface elevations referenced to the Canadian Geodetic Vertical Datum of 2013 for the data collection period (October 5–9, 2014) at active streamgages on the Vermilion (map number 16; station 05129115), Turtle (map number 7; 05PB014), and Rainy (map numbers 1, 2, and 3; stations 05PC021, 05133500 and 05PC024, respectively) Rivers; streamgages are identified using map and station numbers associated with data in table 1.
320
325
330
335
340
345
350
355
360
Elev
atio
n re
fere
nced
to C
anad
ian
Geod
etic
Ver
tical
Dat
um o
f 201
3, in
met
ers
16−0
5129
115
7−05
PB01
4
3−05
PC02
4
2−05
1335
00
1−05
PC02
1
Map number and station number (table 1)
354.196
345.356
336.876
324.704
322.661
fig05.ai
14 Network Global Navigation Satellite System Survey to Harmonize Water-Surface Elevation Data
15−D
14−A
13−D
12−D
11−D
10−A 9−
A
15−D
14−A
13−D
12−D
11−D
10−A 9−
A
15−D
14−A
13−D
12−D
11−D
10−A 9−
A
15−D
14−A
13−D
12−D
11−D
10−A 9−
A
15−D
14−A
13−D
12−D
11−D
10−A 9−
A
339.5
340.0
340.5
Elev
atio
n re
fere
nced
to C
anad
ian
Geod
etic
Ver
tical
Dat
um o
f 201
3, in
met
ers
31 30 31 31 31 31 31
May
30 29 30 30 30 30 30
June
Map number (table 1) and site status (A, active; D, discontinued)
31 31 31 31 31 31 31
July
31 31 31 31 31 31 31
August
30 30 30 30 30 30 30
September
31 Number of values
EXPLANATION
Maximum value
75th percentile
50th percentile (median)
25th percentile
Minimum value
Figure 6. Monthly water-surface elevation data for all active and discontinued streamgages in Namakan Reservoir during the open water period of 2012, converted from streamgage datums to the Canadian Geodetic Vertical Datum of 2013 using offsets presented in table 4; streamgages are identified using map numbers associated with data in table 1.
Limitations of the Study 15
Figure 7. Published mean daily water-surface elevations (referenced to the North American Vertical Datum of 1988) for discontinued U.S. Geological Survey water-level streamgages on Sand Point Lake above (map number 13; station 482042092282501) and below (map number 12; station 482147092291701) Harrison Narrows in 2012 (data from U.S. Geological Survey, 2015).
1,116.5
1,117.0
1,117.5
1,118.0
1,118.5
1,119.0
1,119.5
Elev
atio
n re
fere
nced
to N
orth
Am
eric
an V
ertic
al D
atum
of 1
988,
in fe
et
May
fig07.ai
June July August September
2012
Sand Point above Harrison Narrows (map number 13)
Sand Point below Harrison Narrows (map number 12)

16 Network Global Navigation Satellite System Survey to Harmonize Water-Surface Elevation Data
SummaryContinuously recording water-level streamgages in Rainy
Lake and Namakan Reservoir are used to regulate water levels according to rule curves established in 2000 by the Interna-tional Joint Commission; however, streamgage water levels were referenced to a variety of vertical datums, confounding efforts to model the flow of water through the system, regulate water levels during periods of high inflow, and evaluate the effectiveness of the rule curves. In October 2014, the U.S. Geological Survey, Natural Resources Canada, International Joint Commission, and National Park Service began a joint field study with the goal of obtaining precise elevations refer-enced to a uniform vertical datum for all reference marks used to establish water-level streamgages throughout Rainy Lake and Namakan Reservoir.
This report was prepared by the U.S. Geological Survey in cooperation with Natural Resources Canada, the Interna-tional Joint Commission, and the National Park Service. The purposes of this report are to (1) describe the field surveys used to collect Global Navigation Satellite System (GNSS) data for 16 streamgage reference marks in the Rainy River Basin, (2) describe how collected GNSS data were processed to determine water-surface elevations for all streamgages sur-veyed in this study, (3) present corrections to convert water-level data previously collected at the streamgages to water-surface elevations referenced to a uniform vertical datum, and (4) outline factors to consider when applying corrections to previously collected water-level data.
Three field crews deployed static GNSS receivers over 16 reference marks colocated with active and discontinued water-level streamgages throughout Rainy River, Rainy Lake, Namakan Reservoir, and select tributaries of Rainy Lake and Namakan Reservoir. A static GNSS receiver also was deployed over a National Geodetic Survey cooperative base network control station that was used as a quality-control reference mark, resulting in a total of 17 surveyed reference marks in this study. Satellite data were collected simultane-ously during a 5-day period and processed independently by the U.S. Geological Survey and Natural Resources Canada to obtain accurate positioning and elevations for the 17 reference marks. Deployment times for GNSS receivers ranged from 29 to 68 hours, with a mean deployment time of 46 hours. Satellite data were processed using two different methods, and the results were compared as a measure of quality assurance. Results were similar between compared methods. Processed satellite data were used to convert published water levels to elevations referenced to the Canadian Vertical Datum of 2013 in order to compare water-surface elevations in a uniform vertical datum throughout the study area.
Offsets were applied to water-level data from surveyed streamgages to further evaluate the accuracy and utility of updated reference mark elevations presented in this study. In this report, an “offset” refers to the correction that needs to be applied to published data from a particular streamgage to produce elevation data referenced to a specified vertical
datum. Daily mean water levels from active streamgages surveyed in this study were converted to water-surface eleva-tions referenced to the Canadian Geodetic Vertical Datum of 2013; graphical comparisons of water-surface elevations for streamgages in Namakan Reservoir, Rainy Lake, and selected rivers are presented. Active, permanent streamgages dem-onstrated strong hydrologic agreement throughout Namakan Reservoir, Rainy Lake, and surveyed river streamgages; water-surface elevations consistently decreased from upstream to downstream. Discontinued, temporary streamgages had more variability and less hydrologic agreement among water-surface elevations than active, permanent streamgages. Offsets presented in this report can be used in the evaluation of rule curves and in flood damage curves that fully assess the benefits of one regulation approach over another. In addition, offsets may be used to calibrate hydraulic models developed for four narrows that connect lakes of Namakan Reservoir, refine a digital elevation model, and support modeling studies designed to assess the effects of rule curves on aquatic vegeta-tion, benthic invertebrates, northern pike, and walleye.
References Cited
Beattie, D.S., 1987, Program GHOST User Documentation: Ottawa, Ontario, Canada, Geodetic Survey of Canada, August 1987.
Canadian Geodetic Survey, 2003, Standard operational pro-cedure—Static GPS surveys: Ottawa, Canadian Geodetic Survey, Natural Resources Canada, document number GGN–04, v. 1.0.
Canadian Geodetic Survey, 2013, Standard operational proce-dure—Field operations: Ottawa, Canadian Geodetic Survey, Natural Resources Canada, document number GGN–18, v. 1.4.
Christensen, V.G., Maki, R.P., and Kiesling, R.L., 2013, Evaluation of internal loading and water level changes—Implications for phosphorus, algal production, and nuisance blooms in Kabetogama Lake, Voyageurs National Park, Minnesota: Lake and Reservoir Management, v. 29, no. 3, p. 202–215. [Also available at http://dx.doi.org/10.1080/10402381.2013.831148.]
Craymer, M.R., 2006, The evolution of NAD83 in Canada: Geomatica, v. 60, no. 2, p. 151–164. [Also available at http://www.naref.org/transf/nad83_geomatica2006.pdf.]
Craymer, M.R., Henton, J.A., Piraszewski, M., and Lapelle, E., 2011, An updated GPS velocity field for Canada: Eos Transactions, v. 92, no. 51, American Geophysical Union, Fall Meeting 2011, Abstract G21A–0793.

References Cited 17
Dach, R., Hugentobler, U., Fridez, P., and Meindl, M., eds., 2007, Bernese GPS software version 5.0: Bern, Switzerland, University of Bern, Astronomical Institute.
Dach, R., and Walser, P., 2015, Bernese GNSS software ver-sion 5.2—Tutorial: Bern, Switzerland, University of Bern, Astronomical Institute.
Densmore, B.K., Strauch, K.R., and Ziegeweid, J.R., 2013, Hydrographic surveys of four narrows within the Namakan reservoir system, Voyageurs National Park, Minnesota, 2011: U.S. Geological Survey Data Series 792, 12 p. [Also available at http://pubs.usgs.gov/ds/792/.]
Environment Canada, 2015, Wateroffice: Environment Canada Web page, real-time hydrometric data map search, accessed November 30, 2015, at http://wateroffice.ec.gc.ca/.
Georgiadou, Y., and Kleusberg, A., 1988, On carrier signal multipath effects in relative GPS positioning: Manuscripta Geodaetica, v. 13, p. 172–179.
Henton, J.A., Craymer, M.R., Dragert, H., Mazzoti, S., Fer-land, R., and Forbes, D.L., 2006, Crustal motion and defor-mation monitoring of the Canadian landmass: Geomatica v. 60, no. 2, p. 173–191.
Huang, J. and Véronneau, M., 2013, Canadian gravimet-ric geoid model 2010: Journal of Geodesy, v. 87, no. 8, p. 771–79. [Also available at http://dx.doi.org/10.1007/s00190-013-0645-0.]
International Rainy Lake Board of Control, 1999, Final report-Review of the IJC order for Rainy and Namakan Lakes: St. Paul, Minn., and Burlington, Ontario, Canada, International Rainy Lake Board of Control, accessed September 19, 2012, at http://www.ijc.org/rel/boards/rainylake/19991026_e.pdf.
Kallemeyn, L.W., Holmberg, K.L., Perry, J.A., and Odde, B.Y., 2003, Aquatic synthesis for Voyageurs National Park: U.S. Geological Survey Information and Technology Report 2003–001, 95 p. [Also available at http://pubs.er.usgs.gov/publication/itr030001/.]
Kenney, T.A., 2010, Levels at gaging stations: U.S. Geological Survey Techniques and Methods, book 3, chap. A19, 60 p. [Also available at http://pubs.usgs.gov/tm/tm3A19/.]
Li, Xiong, and Götze, H.J., 2001, Tutorial—Ellipsoid, geoid, gravity, geodesy, and geophysics: Geophysics, v. 66, no. 6, p. 1660–1668. [Also available at http://dx.doi.org/10.1190/1.1487109.]
Milbert, D.G., and Smith D.A., 1996, Converting GPS height into NAVD88 elevation with the Geoid96 geoid height model: GIS LIS-International Conference, v. 1, p. 681–692 [Also available at http://www.ngs.noaa.gov/PUBS_LIB/gislis96.html.]
National Geodetic Survey, 2012, The National Adjustment of 2011 Project: National Geodetic Survey Web page, accessed February 2, 2015, at http://www.ngs.noaa.gov/web/surveys/NA2011/.
National Geodetic Survey, 2014a, Continuously Operating Reference Station (CORS): National Geodetic Survey Web page, accessed February 2, 2015, at http://www.ngs.noaa.gov/CORS/.
National Geodetic Survey, 2014b, OPUS—Online positioning user service: National Geodetic Survey Web page, accessed February 2, 2015, at http://www.ngs.noaa.gov/OPUS/about.jsp.
National Geodetic Survey, 2014c, OPUS Projects: National Geodetic Survey, accessed February 2, 2015, at http://www.ngs.noaa.gov/OPUS-Projects/OpusProjects.shtml.
National Geodetic Survey, 2015a, PAGES software, table of contents: National Geodetic Survey Web page, accessed February 15, 2015, at http://www.ngs.noaa.gov/GRD/GPS/DOC/toc.html.
National Geodetic Survey, 2015b, GEOID12A: National Geodetic Survey Web page, accessed October 16, 2015, at http://www.ngs.noaa.gov/GEOID/GEOID12A/.
National Geodetic Survey, 2015c, Geodetic Data Sheet, GSID Station # 28366: National Geodetic Survey Web page, accessed February 15, 2015, at ftp://ftp.olmweb.dot.state.mn.us/Geod/PDF%20Metric%20Sheet/M_GSID_28366.pdf.
Natural Resources Canada, 2016, Canadian Active Control System (CACS): Natural Resources Canada Web page, accessed May 11, 2016, at https://webapp.geod.nrcan.gc.ca/geod/data-donnees/cacs-scca.php.
Rydlund, P.H., Jr., and Densmore, B.K., 2012, Methods of practice and guidelines for using survey-grade global navi-gation satellite systems (GNSS) to establish vertical datum in the United States Geological Survey: U.S. Geological Survey Techniques and Methods Report, book 11, chap. D1, 120 p. with appendixes [Also available at http://pubs.er.usgs.gov/publication/tm11D1.]
Snay, R., and Pearson, C., 2010, Coping with tectonic motion: American Surveyor, v. 7, no. 9, p. 28–42.
Stevenson, D. and Thompson, A.F., 2013, Namakan chain of lakes pinch point modelling: report prepared for the Inter-national Joint Commission, Rainy Lake Board of Control, 87 p.
U.S. Army Corps of Engineers, 2015, St. Paul District Water Control Center: U.S. Army Corps of Engineers Web page, real time water resources data, accessed November 30, 2015, at http://www.mvp-wc.usace.army.mil/dcp/.

18 Network Global Navigation Satellite System Survey to Harmonize Water-Surface Elevation Data
U.S. Geological Survey, 2015, USGS surface-water data for the Nation: U.S. Geological Survey National Water Infor-mation System Web page, accessed November 30, 2015, at http://waterdata.usgs.gov/nwis/sw.
Véronneau, M., Huang, J., Smith, D.A., and Roman, D.R., 2014a, Canada’s new vertical datum—CGVD2013: xyHT, October 2014, p. 43–45, accessed May 16, 2016, at http://www.xyht.com/surveying/canadas-new-vertical-datum-cgvd2013/.
Véronneau, M., Huang, J., Smith, D.A., and Roman, D.R., 2014b, CGVD2013, part 2: xyHT, November 2014, p. 41–43.
Zilkoski, D.B., Richards, J.H., and Young, G.M., 1992, Spe-cial report results of the general adjustment of the North American Vertical Datum of 1988: Surveying and Land Information Systems, v. 52, no. 3, p. 133–149.

Appendixes 1–3

20 Network Global Navigation Satellite System Survey to Harmonize Water-Surface Elevation Data
Appendix 1. Global Navigation Satellite System Data Collection Information
Appendix 1 is available for download as an Excel® file at http://dx.doi.org/10.3133/sir20165109.
This appendix contains data collection information for the Global Navigation Satellite System (GNSS) as a Microsoft® Excel spreadsheet. The first worksheet (tab) in the spreadsheet is table 1–1, which provides a summary of collected satellite data for the 16 streamgage reference marks and the 1 National Geodetic Survey control station surveyed in this study. The other worksheets (tabs) in the spreadsheet contain the log files from the GNSS surveys for each of the reference marks and are pre-sented in order of map number and are named according to the station numbers (table 1–1).
Table 1–1. Summary of collected satellite data for 16 streamgage reference marks and 1 National Geodetic Survey cooperative base network control station surveyed in this study.
Appendix 2. Processing of Raw Data Collected for 16 Streamgage Reference Marks and 1 National Geodetic Survey Cooperative Base Network Control Station Using Global Navigation Satellite Systems
Appendix 2 is available for download as an Excel® file at http://dx.doi.org/10.3133/sir20165109.
This appendix contains the data processing files collected for reference marks at the 16 streamgages and the National Geodetic Survey control station using Global Navigation Satellite Systems (GNSS) as a zipped file. The data were processed by Natural Resources Canada (NRCan) and the U.S. Geological Survey (USGS) using different methods. The zipped file contains a READ_ME file with information about the data processing files. The zipped file contains two folders (NRCan_Processing_Files and USGS_Processing_Files) for the processing file outputs from NRCan and the USGS, respectively.
Appendix 3. Surveyor Level Loop Information for Selected Sites
Appendix 3 is available for download as an Excel® file at http://dx.doi.org/10.3133/sir20165109.
This appendix contains surveyor level loop information as a Microsoft® Excel spreadsheet for the nine streamgage sites with reference marks that could not be surveyed directly using global navigation satellite systems. The first worksheet (tab) in the spreadsheet is titled “Read_Me” and provides a summary of the spreadsheet. The other worksheets (tabs) in the spreadsheet contain the surveyor level loop information for each of the nine sites and are presented in order of map number and are named according to the station numbers (see the “Introduction” section, table 1).
Publishing support provided by: Rolla Publishing Service Center
For more information concerning this publication, contact: Director, USGS Minnesota Water Science Center 2280 Woodale Drive Mounds View, Minnesota 55112 (763) 783–3100
Or visit the Minnesota Water Science Center Web site at: http://mn.water.usgs.gov/

ISSN 2328-0328 (online)http://dx.doi.org/10.3133/sir20165109
Ziegeweil and others—
Netw
ork Global N
avigation Satellite System Survey to H
armonize W
ater-Surface Elevation Data—
Scientific Investigations Report 2016–5109