nes reading data - university of new mexicocoencate.unm.edu/common/pdf/nes-reading-report.pdf10/2013...
TRANSCRIPT
!
!10/2013 1
!
NES Reading Data
!
!10/2013 2
!
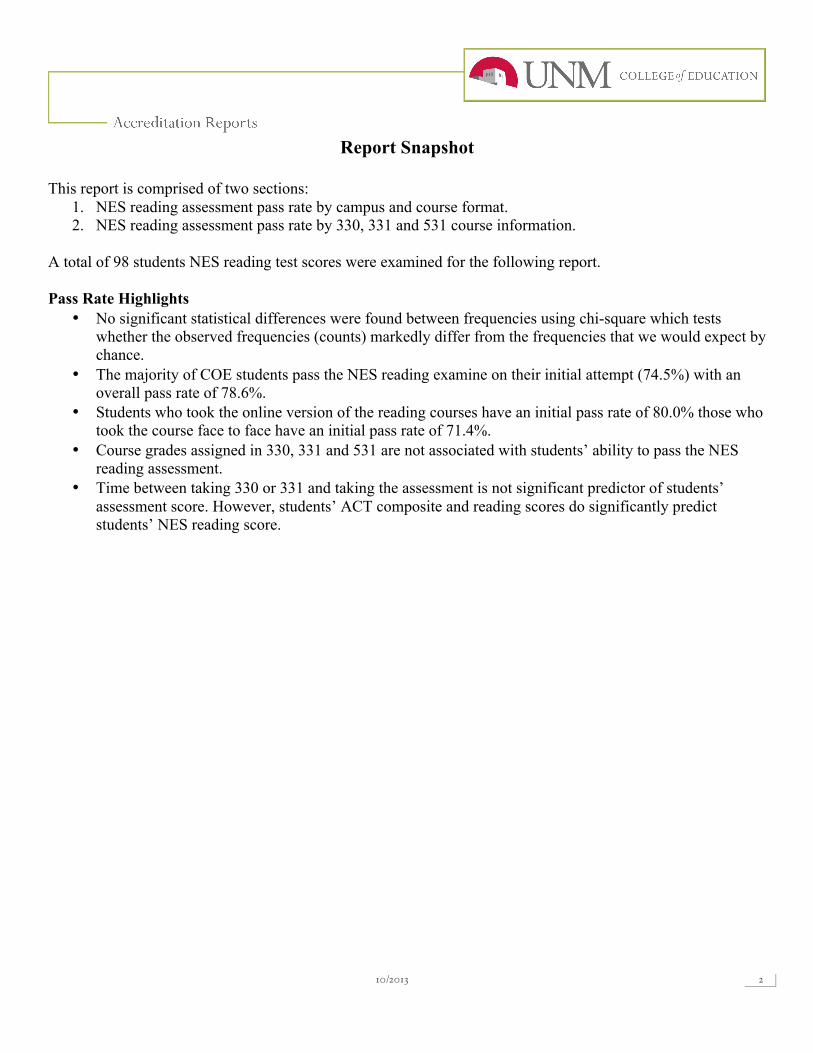
Report Snapshot This report is comprised of two sections:
1. NES reading assessment pass rate by campus and course format. 2. NES reading assessment pass rate by 330, 331 and 531 course information.
A total of 98 students NES reading test scores were examined for the following report. Pass Rate Highlights
• No significant statistical differences were found between frequencies using chi-square which tests whether the observed frequencies (counts) markedly differ from the frequencies that we would expect by chance.
• The majority of COE students pass the NES reading examine on their initial attempt (74.5%) with an overall pass rate of 78.6%.
• Students who took the online version of the reading courses have an initial pass rate of 80.0% those who took the course face to face have an initial pass rate of 71.4%.
• Course grades assigned in 330, 331 and 531 are not associated with students’ ability to pass the NES reading assessment.
• Time between taking 330 or 331 and taking the assessment is not significant predictor of students’ assessment score. However, students’ ACT composite and reading scores do significantly predict students’ NES reading score.

!
!10/2013 3
!
NES Pass Rate
Count First Test Attempt
Second Test Attempt
Third Test Attempt
Fourth Test Attempt
Fifth Test Attempt
Overall Pass Rate
Overall COE COE 98 74.5% 20.0% 50.0% 0.0% 0.0% 78.6%
Campus Breakdown
ABQ Campus 56 71.4% 25.0% 33.3% 0.0% 0.0% 76.8% Online 35 80.0% 0.0% - - - 80.0%
San Juan 1 100.0% - - - - 100.0% UNM West 6 66.7% 0.0% 100.0% - - 83.3%
Online Yes 35 80.0% 0.0% - - - 80.0% No 55 71.4% 22.2% 50.0% 0.0% 0.0% 77.8%
Ethnicity Hispanic 39 74.4% 33.3% 0.0% 0.0% 0.0% 76.9%
Non-Hispanic 57 73.7% 14.3% 100.0% 78.9% Not reported 2 100.0% - - - - 100.0%
Primary Race
American Indian or Native Alaskan 5 60.0% 100.0% - - - 80.0%
Asian 1 100.0% - - - - 100.0% Black or African
American 1 100.0% - - - - 100.0% Hawaiian 2 100.0% - - - - 100.0%
Navajo Dine 4 75.0% - - - - 75.0% White 61 78.7% 0.0% 50.0% 0.0% 0.0% 80.3%
Not reported 24 62.5% 33.3% 50.0% - - 70.8%
Gender Female 90 75.6% 20.0% 50.0% 0.0% 0.0% 80.0% Male 8 62.5% - - - - 62.5%
Note: 0.0% indicates that students sat for the exam but did not pass whereas a “-“ indicates that there was no data for that category.
!
!10/2013 4
!
NES Pass Rate
Count First Test Attempt
Second Test Attempt
Third Test Attempt
Fourth Test Attempt
Fifth Test Attempt
Overall Pass Rate
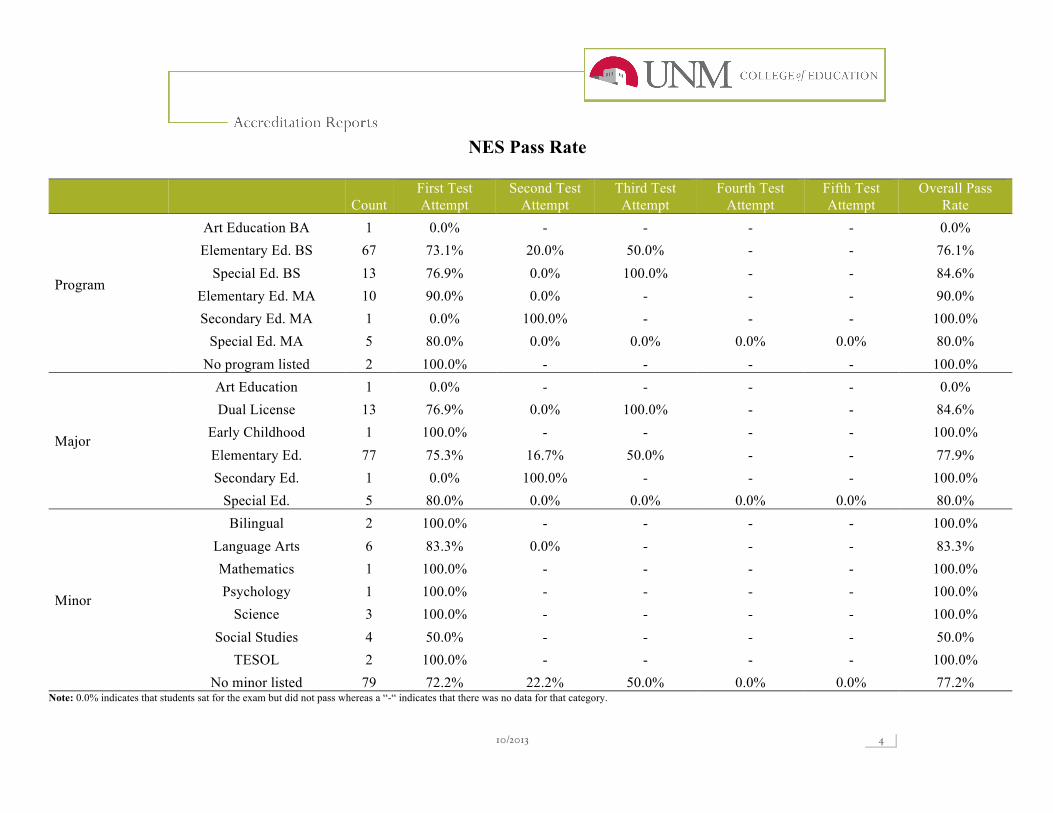
Program
Art Education BA 1 0.0% - - - - 0.0% Elementary Ed. BS 67 73.1% 20.0% 50.0% - - 76.1%
Special Ed. BS 13 76.9% 0.0% 100.0% - - 84.6% Elementary Ed. MA 10 90.0% 0.0% - - - 90.0% Secondary Ed. MA 1 0.0% 100.0% - - - 100.0%
Special Ed. MA 5 80.0% 0.0% 0.0% 0.0% 0.0% 80.0% No program listed 2 100.0% - - - - 100.0%
Major
Art Education 1 0.0% - - - - 0.0% Dual License 13 76.9% 0.0% 100.0% - - 84.6%
Early Childhood 1 100.0% - - - - 100.0% Elementary Ed. 77 75.3% 16.7% 50.0% - - 77.9% Secondary Ed. 1 0.0% 100.0% - - - 100.0%
Special Ed. 5 80.0% 0.0% 0.0% 0.0% 0.0% 80.0%
Minor
Bilingual 2 100.0% - - - - 100.0% Language Arts 6 83.3% 0.0% - - - 83.3% Mathematics 1 100.0% - - - - 100.0% Psychology 1 100.0% - - - - 100.0%
Science 3 100.0% - - - - 100.0% Social Studies 4 50.0% - - - - 50.0%
TESOL 2 100.0% - - - - 100.0% No minor listed 79 72.2% 22.2% 50.0% 0.0% 0.0% 77.2%
Note: 0.0% indicates that students sat for the exam but did not pass whereas a “-“ indicates that there was no data for that category.
!
!10/2013 5
!
NES Pass Rate
Count First Test Attempt
Second Test Attempt
Third Test Attempt
Fourth Test Attempt
Fifth Test Attempt
Overall Pass Rate
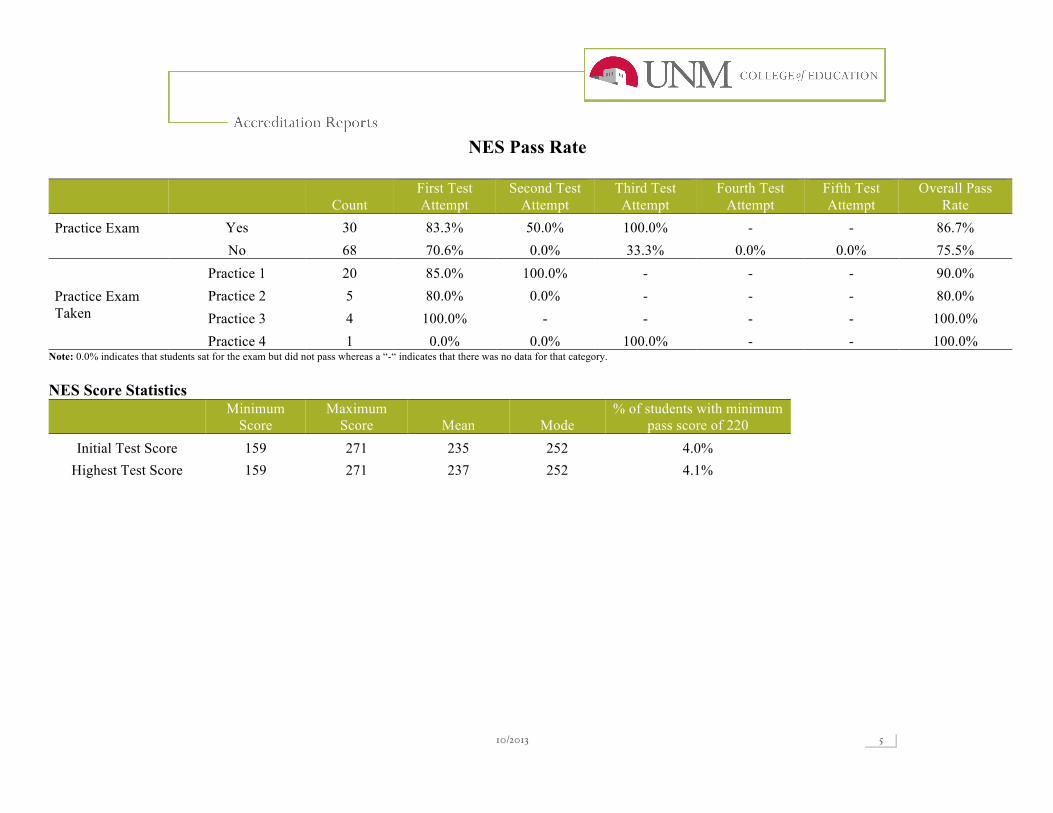
Practice Exam
Yes 30 83.3% 50.0% 100.0% - - 86.7% No 68 70.6% 0.0% 33.3% 0.0% 0.0% 75.5%
Practice Exam Taken
Practice 1 20 85.0% 100.0% - - - 90.0% Practice 2 5 80.0% 0.0% - - - 80.0% Practice 3 4 100.0% - - - - 100.0% Practice 4 1 0.0% 0.0% 100.0% - - 100.0%
Note: 0.0% indicates that students sat for the exam but did not pass whereas a “-“ indicates that there was no data for that category. NES Score Statistics
Minimum
Score Maximum
Score Mean Mode % of students with minimum
pass score of 220 Initial Test Score 159 271 235 252 4.0%
Highest Test Score 159 271 237 252 4.1% !! !
!
!10/2013 6
!
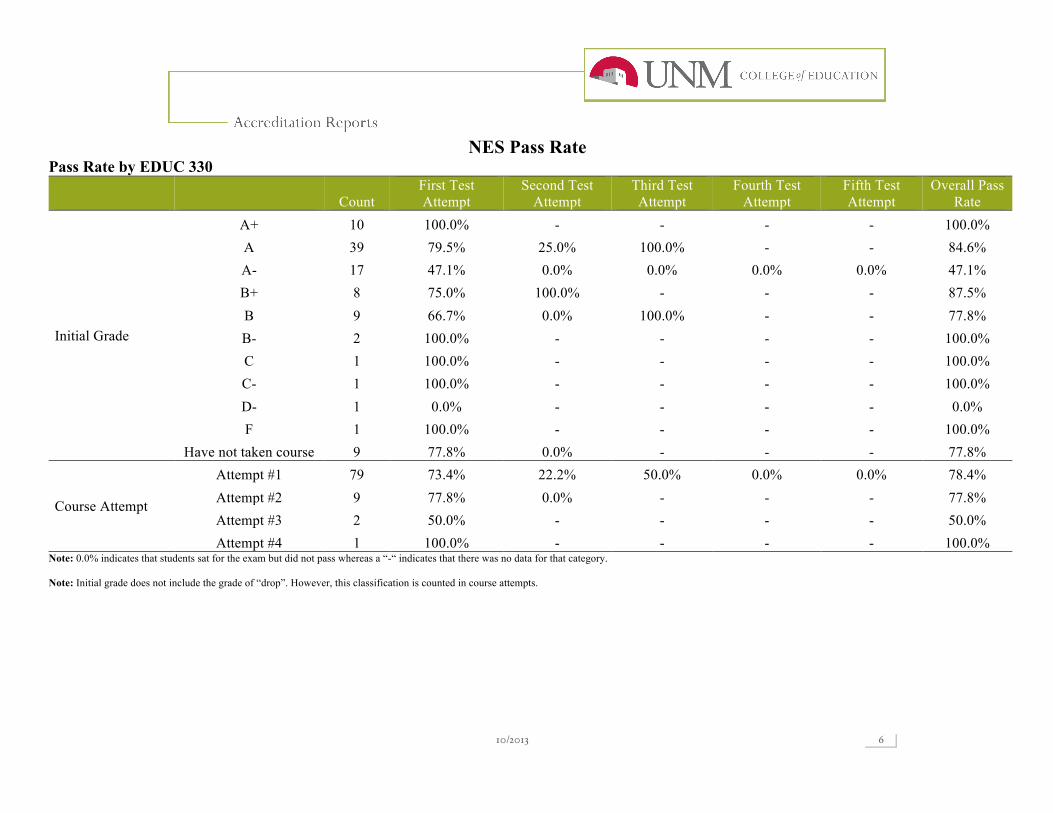
NES Pass Rate Pass Rate by EDUC 330
Count First Test Attempt
Second Test Attempt
Third Test Attempt
Fourth Test Attempt
Fifth Test Attempt
Overall Pass Rate
Initial Grade
A+ 10 100.0% - - - - 100.0% A 39 79.5% 25.0% 100.0% - - 84.6% A- 17 47.1% 0.0% 0.0% 0.0% 0.0% 47.1% B+ 8 75.0% 100.0% - - - 87.5% B 9 66.7% 0.0% 100.0% - - 77.8% B- 2 100.0% - - - - 100.0% C 1 100.0% - - - - 100.0% C- 1 100.0% - - - - 100.0% D- 1 0.0% - - - - 0.0% F 1 100.0% - - - - 100.0%
Have not taken course 9 77.8% 0.0% - - - 77.8%
Course Attempt
Attempt #1 79 73.4% 22.2% 50.0% 0.0% 0.0% 78.4% Attempt #2 9 77.8% 0.0% - - - 77.8% Attempt #3 2 50.0% - - - - 50.0% Attempt #4 1 100.0% - - - - 100.0%
Note: 0.0% indicates that students sat for the exam but did not pass whereas a “-“ indicates that there was no data for that category. Note: Initial grade does not include the grade of “drop”. However, this classification is counted in course attempts. ! !
!
!10/2013 7
!
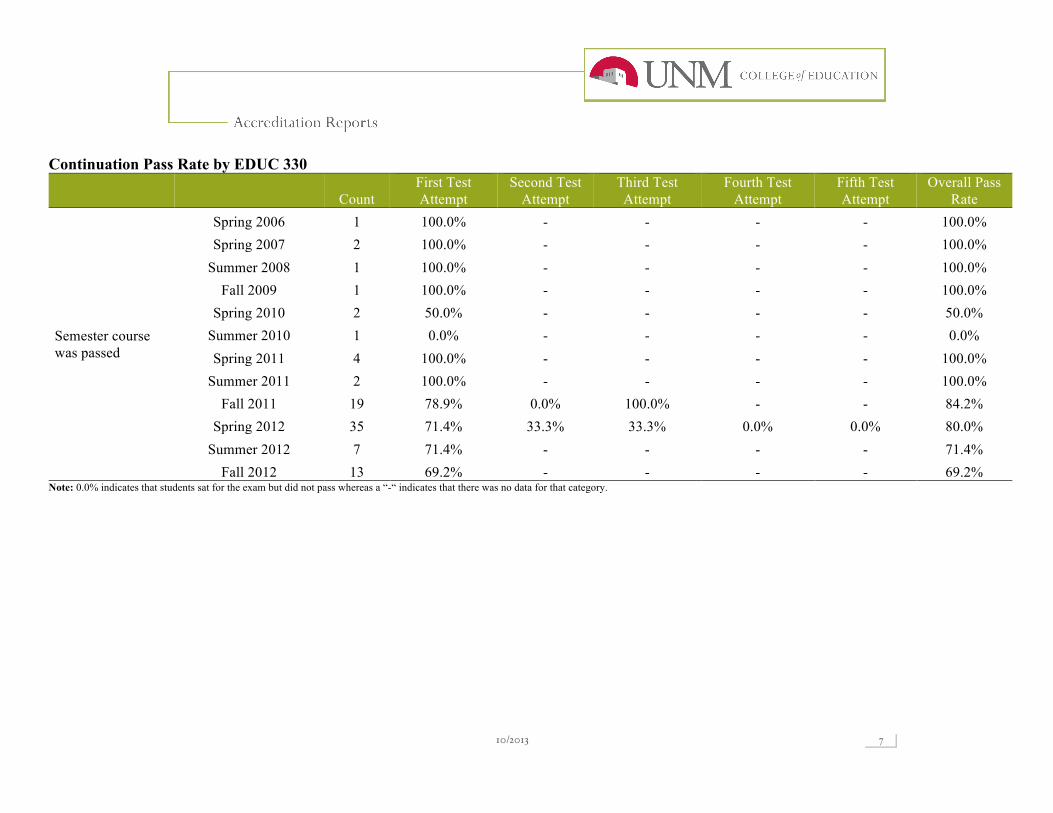
!Continuation Pass Rate by EDUC 330
Count First Test Attempt
Second Test Attempt
Third Test Attempt
Fourth Test Attempt
Fifth Test Attempt
Overall Pass Rate
Semester course was passed
Spring 2006 1 100.0% - - - - 100.0% Spring 2007 2 100.0% - - - - 100.0%
Summer 2008 1 100.0% - - - - 100.0% Fall 2009 1 100.0% - - - - 100.0%
Spring 2010 2 50.0% - - - - 50.0% Summer 2010 1 0.0% - - - - 0.0% Spring 2011 4 100.0% - - - - 100.0%
Summer 2011 2 100.0% - - - - 100.0% Fall 2011 19 78.9% 0.0% 100.0% - - 84.2%
Spring 2012 35 71.4% 33.3% 33.3% 0.0% 0.0% 80.0% Summer 2012 7 71.4% - - - - 71.4%
Fall 2012 13 69.2% - - - - 69.2% Note: 0.0% indicates that students sat for the exam but did not pass whereas a “-“ indicates that there was no data for that category.
!
!10/2013 8
!
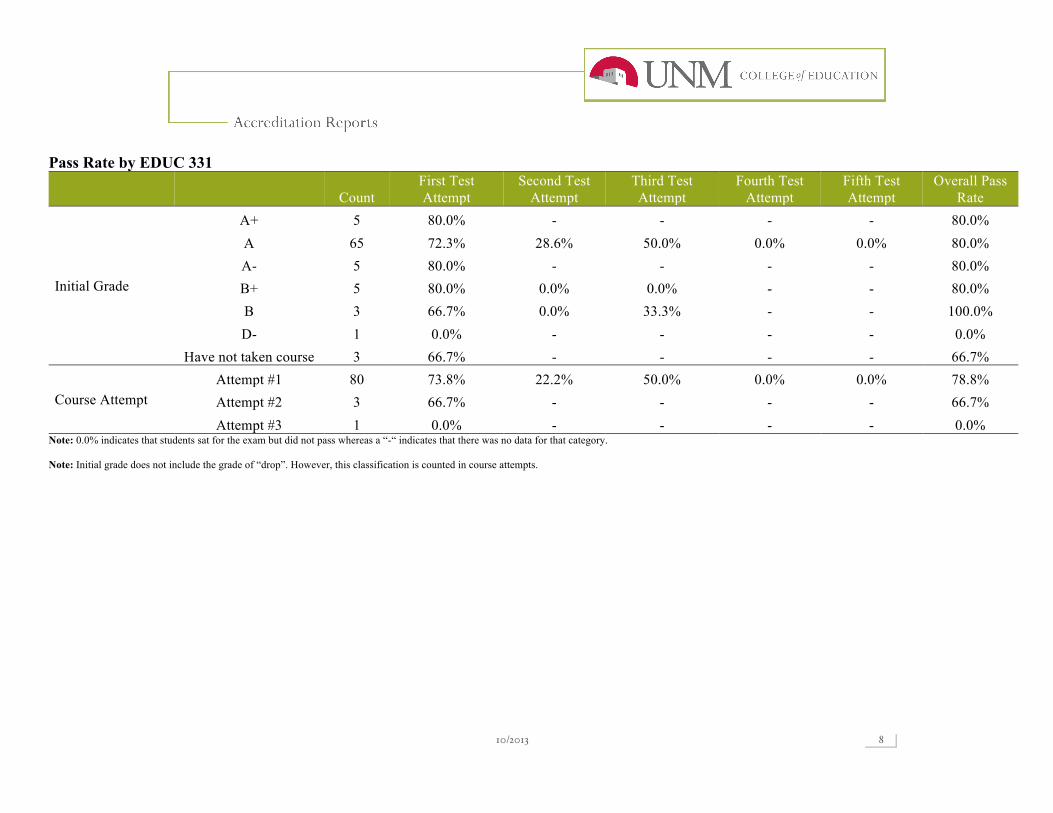
!Pass Rate by EDUC 331
Count First Test Attempt
Second Test Attempt
Third Test Attempt
Fourth Test Attempt
Fifth Test Attempt
Overall Pass Rate
Initial Grade
A+ 5 80.0% - - - - 80.0% A 65 72.3% 28.6% 50.0% 0.0% 0.0% 80.0% A- 5 80.0% - - - - 80.0% B+ 5 80.0% 0.0% 0.0% - - 80.0% B 3 66.7% 0.0% 33.3% - - 100.0% D- 1 0.0% - - - - 0.0%
Have not taken course 3 66.7% - - - - 66.7%
Course Attempt Attempt #1 80 73.8% 22.2% 50.0% 0.0% 0.0% 78.8% Attempt #2 3 66.7% - - - - 66.7% Attempt #3 1 0.0% - - - - 0.0%
Note: 0.0% indicates that students sat for the exam but did not pass whereas a “-“ indicates that there was no data for that category. Note: Initial grade does not include the grade of “drop”. However, this classification is counted in course attempts. !! !
!
!10/2013 9
!
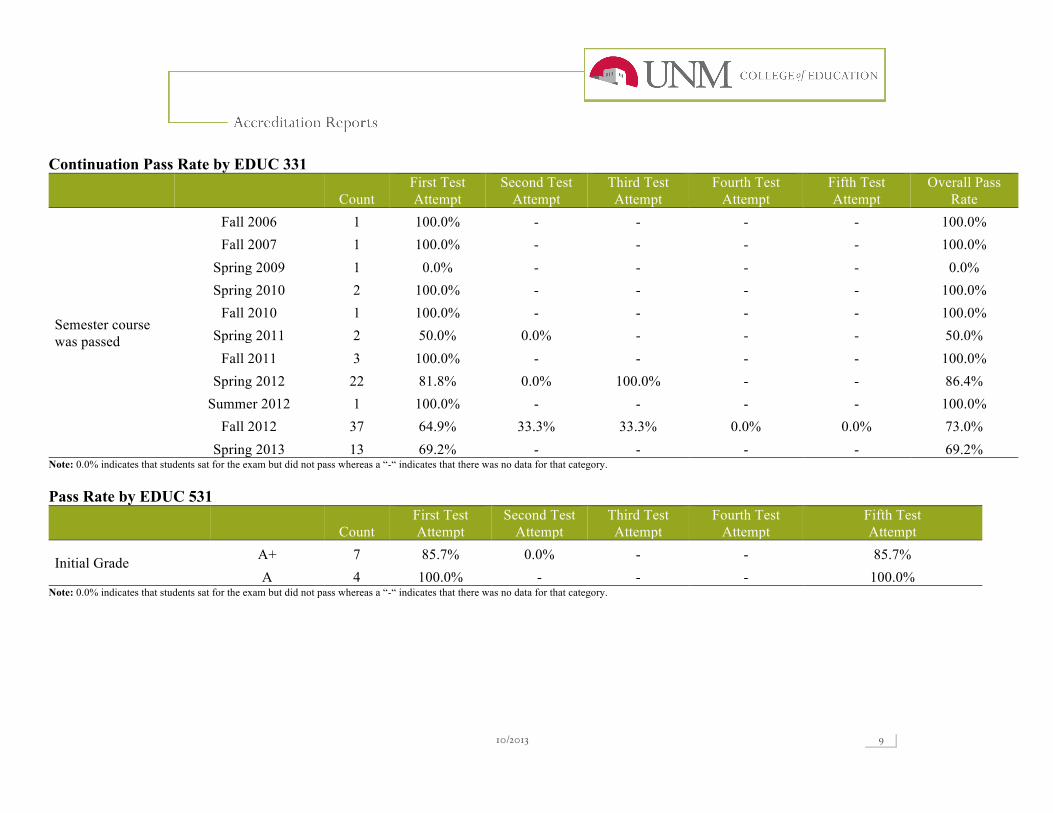
!Continuation Pass Rate by EDUC 331
Count First Test Attempt
Second Test Attempt
Third Test Attempt
Fourth Test Attempt
Fifth Test Attempt
Overall Pass Rate
Semester course was passed
Fall 2006 1 100.0% - - - - 100.0% Fall 2007 1 100.0% - - - - 100.0%
Spring 2009 1 0.0% - - - - 0.0% Spring 2010 2 100.0% - - - - 100.0%
Fall 2010 1 100.0% - - - - 100.0% Spring 2011 2 50.0% 0.0% - - - 50.0%
Fall 2011 3 100.0% - - - - 100.0% Spring 2012 22 81.8% 0.0% 100.0% - - 86.4%
Summer 2012 1 100.0% - - - - 100.0% Fall 2012 37 64.9% 33.3% 33.3% 0.0% 0.0% 73.0%
Spring 2013 13 69.2% - - - - 69.2% Note: 0.0% indicates that students sat for the exam but did not pass whereas a “-“ indicates that there was no data for that category. Pass Rate by EDUC 531
Count First Test Attempt
Second Test Attempt
Third Test Attempt
Fourth Test Attempt
Fifth Test Attempt
Initial Grade A+ 7 85.7% 0.0% - - 85.7% A 4 100.0% - - - 100.0%
Note: 0.0% indicates that students sat for the exam but did not pass whereas a “-“ indicates that there was no data for that category.

!
!10/2013 10
!
Regression Analyses
Predictor B SE B β F p R2
Time in days between completing 330 and taking test -.002 .01 -.03 .09 .76 .00 Time in days between completing 331 and taking test -.004 .01 -.07 .46 .49 .01 ACT Composite Score 4.5 .53 .75 70.5 <.001 .56 ACT Reading Score 3.1 .47 .65 41.1 <.001 .43
!
!10/2013 11
!
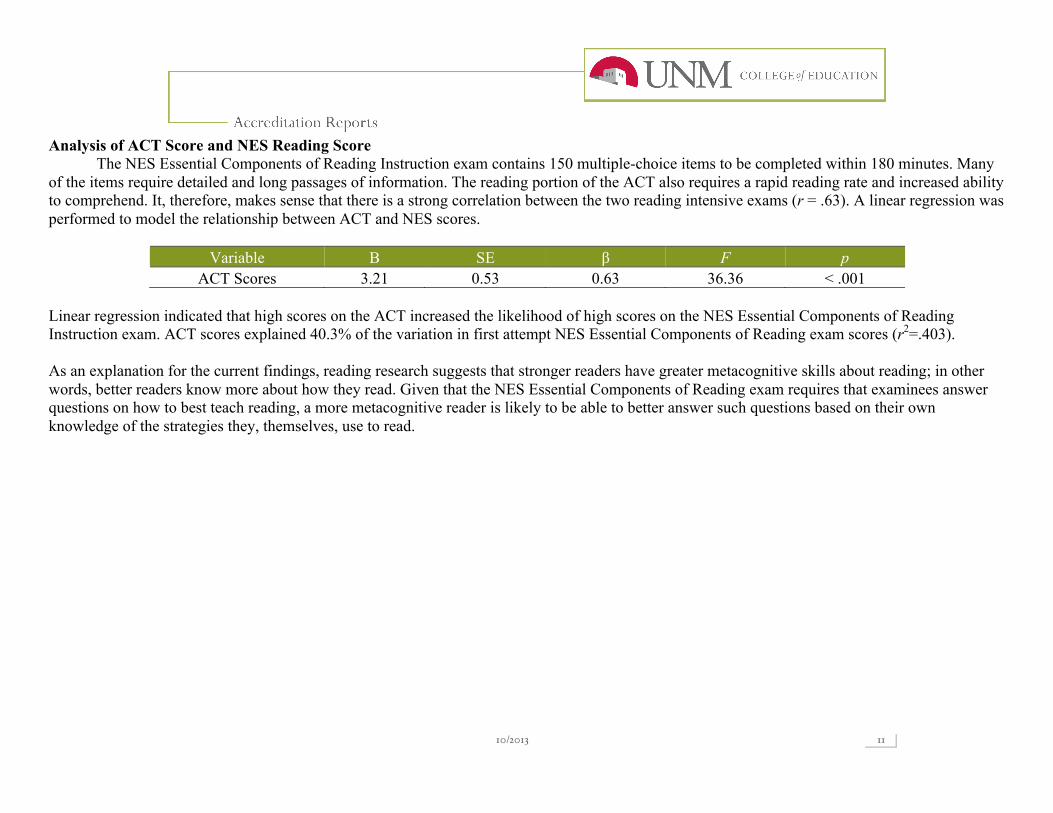
Analysis of ACT Score and NES Reading Score The NES Essential Components of Reading Instruction exam contains 150 multiple-choice items to be completed within 180 minutes. Many
of the items require detailed and long passages of information. The reading portion of the ACT also requires a rapid reading rate and increased ability to comprehend. It, therefore, makes sense that there is a strong correlation between the two reading intensive exams (r = .63). A linear regression was performed to model the relationship between ACT and NES scores.
Variable B SE β F p ACT Scores 3.21 0.53 0.63 36.36 < .001
Linear regression indicated that high scores on the ACT increased the likelihood of high scores on the NES Essential Components of Reading Instruction exam. ACT scores explained 40.3% of the variation in first attempt NES Essential Components of Reading exam scores (r2=.403). As an explanation for the current findings, reading research suggests that stronger readers have greater metacognitive skills about reading; in other words, better readers know more about how they read. Given that the NES Essential Components of Reading exam requires that examinees answer questions on how to best teach reading, a more metacognitive reader is likely to be able to better answer such questions based on their own knowledge of the strategies they, themselves, use to read.