nepp etw 2014: halt to qualify electronic packages - … - 09-03...ram resistance of pbga daisy...
TRANSCRIPT

HALT to Qualify Electronic
Packages – A Proof of Concept*
Rajeshuni Ramesham Ph.D.
Jet Propulsion Laboratory
Reliability Engineering, Office of Safety and Mission Success
California Institute of Technology
Pasadena, CA 91109
Tel.: 818 354 7190
E-mail: [email protected]
June 18, 2014
National Aeronautics and Space
Administration
Jet Propulsion Laboratory
California Institute of Technology
*Copyright 2014 California Institute of Technology. Government sponsorship acknowledged. 1

Acknowledgements• The research work described in this paper was carried out at the Jet
Propulsion Laboratory, Caltech, Pasadena, CA.
• NEPP program is highly appreciated for supporting me to work on
HALT task. MSL Project has generated the interest in me in obtaining
the experimental data for SMT packages in a short duration for present
and future JPL/NASA projects.
• This paper was presented at the SPIE Reliability conference in Feb 2014.
• Thanks are due to
– Dr. Chuck Barnes, Dr. Doug Sheldon, Mr. Mike Sampson, and Mr. Ken
Label for their interest and support under NEPP packaging program.
– Mr. Russel Kido of Practical Components for his support during the test
board manufacturing.
– Emilio Vazquez for his help in the data logging system.
– John Forgrave and Mark Boyles for their comments/suggestions on the
presentation.
2
National Aeronautics and Space
Administration
Jet Propulsion Laboratory
California Institute of Technology
Ram5th NEPP Electronic Technology Workshop June 16, 2014
2

Outline
• Life Testing Requirements
• Introduction
• Objectives
• Experimental Approach and Details
• Test Results
• Summary
• Acknowledgements
Ram5th NEPP Electronic Technology Workshop June 16, 2014
National Aeronautics and Space
Administration
Jet Propulsion Laboratory
California Institute of Technology
3

Life Testing Requirement
The following requirement is from the JPL Design Principles.
Thermal cycling -
– Electronic hardware design shall be capable of surviving power ON-OFF temperature cycling and/or solar exposure cycling of three times the number of worst-case expected mission cycles with worst-case flight temperature excursions.
Ram
National Aeronautics and Space
Administration
Jet Propulsion Laboratory
California Institute of Technology
5th NEPP Electronic Technology Workshop June 16, 2014
4

Ram
Mars Family of Rovers and Lander: Pathfinder,
Spirit/Opportunity, Curiosity, & Phoenix
5
National Aeronautics and Space
Administration
Jet Propulsion Laboratory
California Institute of Technology
90 sol mission
Test: 270 thermal cycles
28 days of testing
670 sol mission
Test: 2010 thermal cycles
209 days of testing
90 sol mission
Test: 270 thermal cycles
28 days of testing
7 sol mission
Test: 21 thermal cycles
2.2 days of testing
5th NEPP Electronic Technology Workshop June 16, 2014

Introduction
• Explore a proof of concept of Highly Accelerated
Life Testing (HALT) technique to assess packaging
designs for long duration deep space missions in a
wide temperature range (–150oC to +125oC).
• HALT is a custom hybrid package suite of testing
technique, such as extreme temperature down to -
150oC to +125oC and vibration step processing up
to 50g acceleration.
• HALT testing implements repetitive multiple-axis
vibration combined with thermal cycles testing of
the test article to precipitate defects.
5th NEPP Electronic Technology Workshop June 16, 2014 Ram
National Aeronautics and Space
Administration
Jet Propulsion Laboratory
California Institute of Technology
6

Objective
• Predict reliability, failure mechanism and
survivability of selected advanced electronic
interconnect packages (Ball Grid Arrays, Flip-
chips, surface mount packages, etc.) for long
duration deep space missions in a shorter
duration.
• Reduce the development cycle time for
improvements to the packaging design.
5th NEPP Electronic Technology Workshop June 16, 2014 Ram
National Aeronautics and Space
Administration
Jet Propulsion Laboratory
California Institute of Technology
7
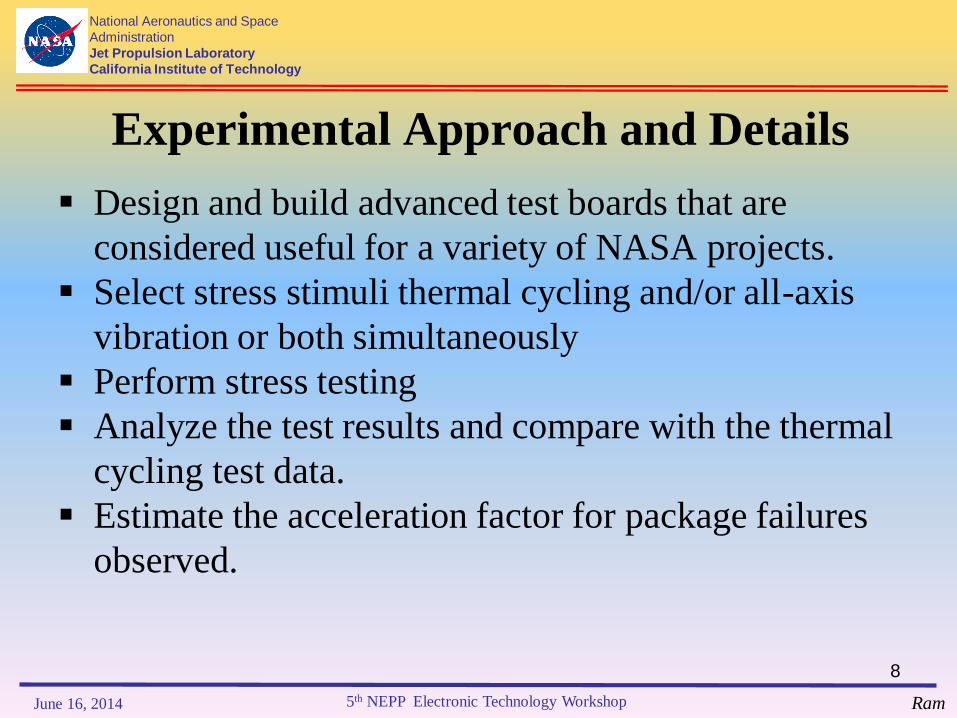
Experimental Approach and Details
Design and build advanced test boards that are
considered useful for a variety of NASA projects.
Select stress stimuli thermal cycling and/or all-axis
vibration or both simultaneously
Perform stress testing
Analyze the test results and compare with the thermal
cycling test data.
Estimate the acceleration factor for package failures
observed.
5th NEPP Electronic Technology Workshop June 16, 2014 Ram
National Aeronautics and Space
Administration
Jet Propulsion Laboratory
California Institute of Technology
8

Ram
9
National Aeronautics and Space
Administration
Jet Propulsion Laboratory
California Institute of Technology
Schematic diagram for the solder joint
continuity monitoring HALT test system
5th NEPP Electronic Technology Workshop June 16, 2014
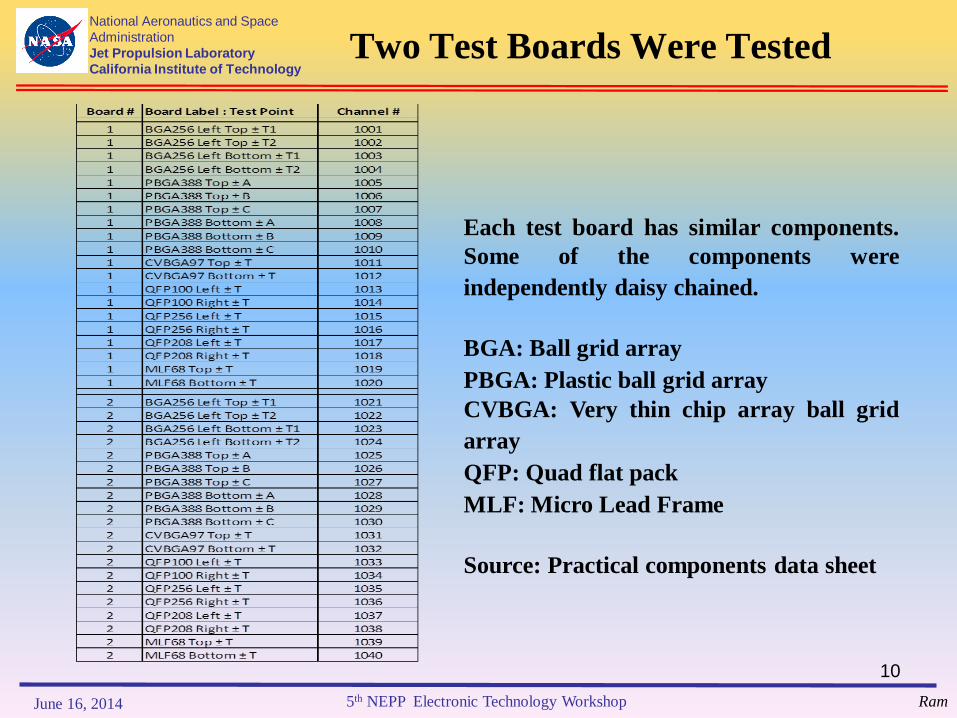
Two Test Boards Were Tested
10
Ram
National Aeronautics and Space
Administration
Jet Propulsion Laboratory
California Institute of Technology
Each test board has similar components.
Some of the components were
independently daisy chained.
BGA: Ball grid array
PBGA: Plastic ball grid array
CVBGA: Very thin chip array ball grid
array
QFP: Quad flat pack
MLF: Micro Lead Frame
Source: Practical components data sheet
5th NEPP Electronic Technology Workshop June 16, 2014
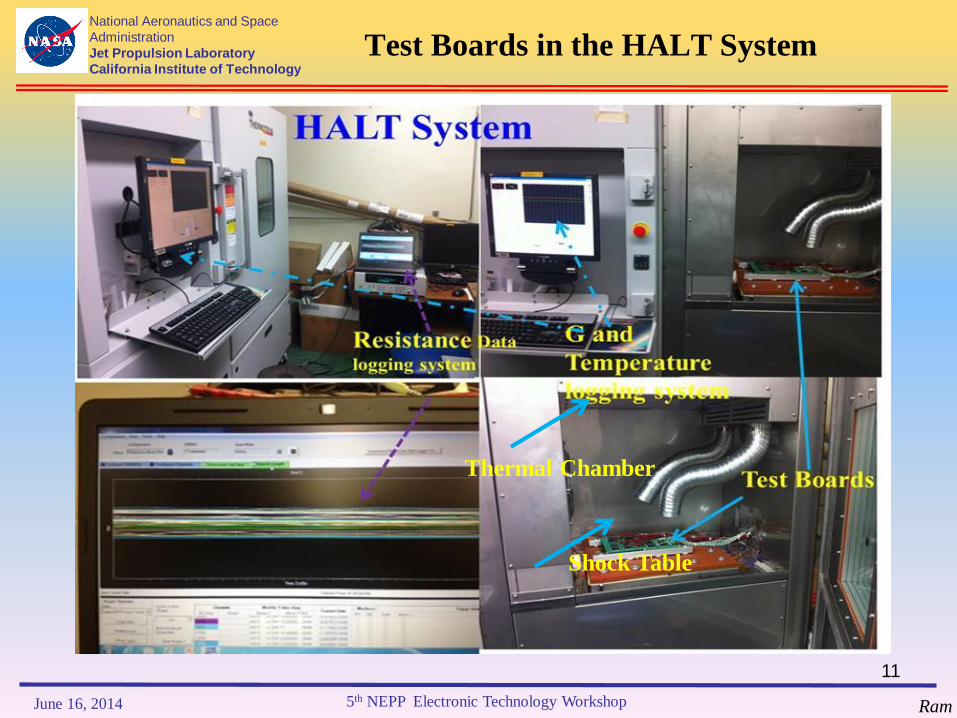
Test Boards in the HALT SystemNational Aeronautics and Space
Administration
Jet Propulsion Laboratory
California Institute of Technology
Ram
Shock Table
Thermal Chamber
5th NEPP Electronic Technology Workshop June 16, 2014
11
National Aeronautics and Space
Administration
Jet Propulsion Laboratory
California Institute of Technology
Ram
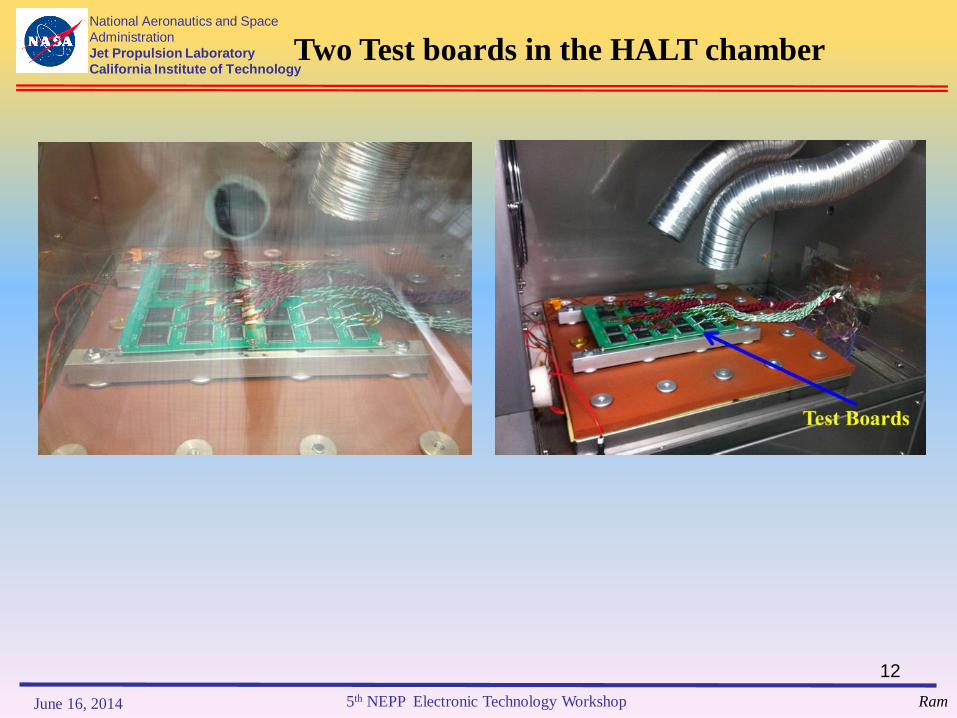
Two Test boards in the HALT chamber
5th NEPP Electronic Technology Workshop June 16, 2014
12
National Aeronautics and Space
Administration
Jet Propulsion Laboratory
California Institute of Technology
Ram
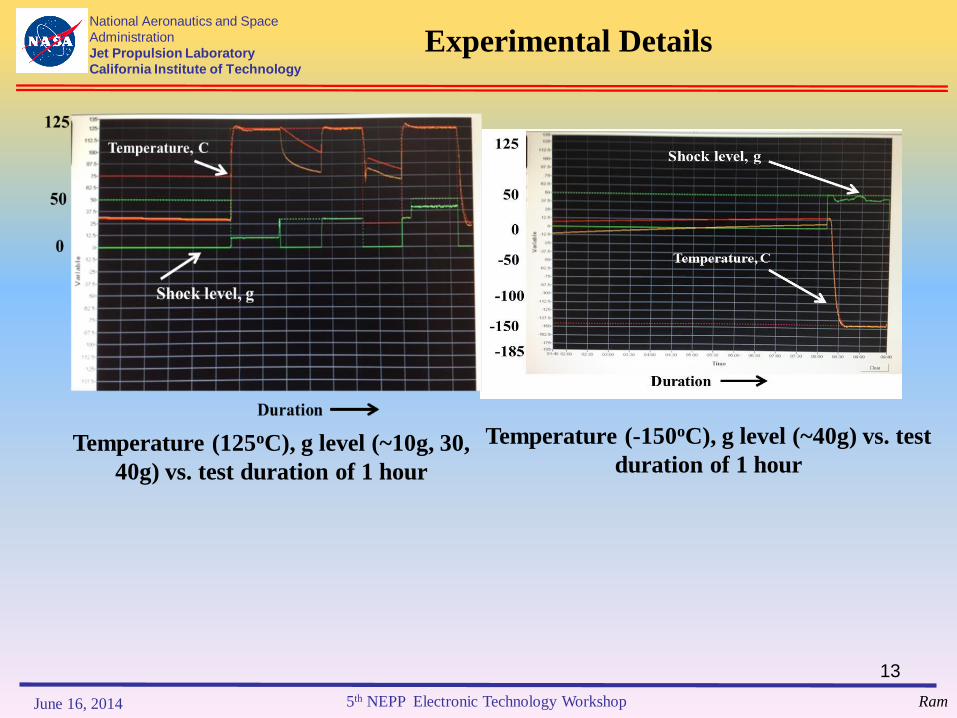
Temperature (-150oC), g level (~40g) vs. test
duration of 1 hour
Experimental Details
Temperature (125oC), g level (~10g, 30,
40g) vs. test duration of 1 hour
5th NEPP Electronic Technology Workshop June 16, 2014
13
National Aeronautics and Space
Administration
Jet Propulsion Laboratory
California Institute of Technology
Ram
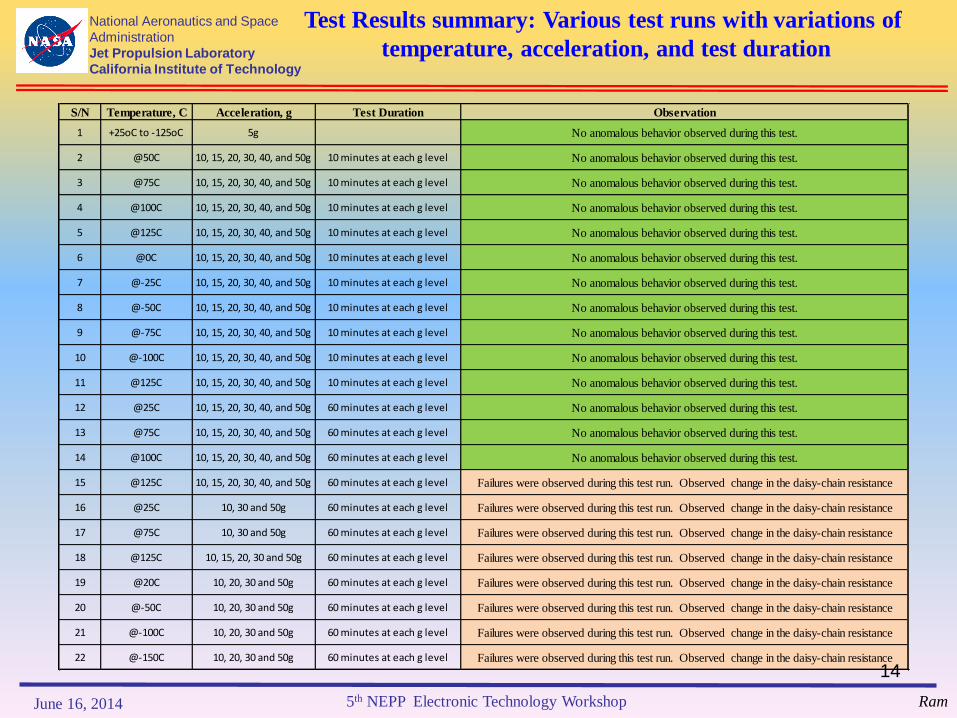
Test Results summary: Various test runs with variations of
temperature, acceleration, and test duration
S/N Temperature, C Acceleration, g Test Duration Observation
1 +25oC to -125oC 5g No anomalous behavior observed during this test.
2 @50C 10, 15, 20, 30, 40, and 50g 10 minutes at each g level No anomalous behavior observed during this test.
3 @75C 10, 15, 20, 30, 40, and 50g 10 minutes at each g level No anomalous behavior observed during this test.
4 @100C 10, 15, 20, 30, 40, and 50g 10 minutes at each g level No anomalous behavior observed during this test.
5 @125C 10, 15, 20, 30, 40, and 50g 10 minutes at each g level No anomalous behavior observed during this test.
6 @0C 10, 15, 20, 30, 40, and 50g 10 minutes at each g level No anomalous behavior observed during this test.
7 @-25C 10, 15, 20, 30, 40, and 50g 10 minutes at each g level No anomalous behavior observed during this test.
8 @-50C 10, 15, 20, 30, 40, and 50g 10 minutes at each g level No anomalous behavior observed during this test.
9 @-75C 10, 15, 20, 30, 40, and 50g 10 minutes at each g level No anomalous behavior observed during this test.
10 @-100C 10, 15, 20, 30, 40, and 50g 10 minutes at each g level No anomalous behavior observed during this test.
11 @125C 10, 15, 20, 30, 40, and 50g 10 minutes at each g level No anomalous behavior observed during this test.
12 @25C 10, 15, 20, 30, 40, and 50g 60 minutes at each g level No anomalous behavior observed during this test.
13 @75C 10, 15, 20, 30, 40, and 50g 60 minutes at each g level No anomalous behavior observed during this test.
14 @100C 10, 15, 20, 30, 40, and 50g 60 minutes at each g level No anomalous behavior observed during this test.
15 @125C 10, 15, 20, 30, 40, and 50g 60 minutes at each g level Failures were observed during this test run. Observed change in the daisy-chain resistance
16 @25C 10, 30 and 50g 60 minutes at each g level Failures were observed during this test run. Observed change in the daisy-chain resistance
17 @75C 10, 30 and 50g 60 minutes at each g level Failures were observed during this test run. Observed change in the daisy-chain resistance
18 @125C 10, 15, 20, 30 and 50g 60 minutes at each g level Failures were observed during this test run. Observed change in the daisy-chain resistance
19 @20C 10, 20, 30 and 50g 60 minutes at each g level Failures were observed during this test run. Observed change in the daisy-chain resistance
20 @-50C 10, 20, 30 and 50g 60 minutes at each g level Failures were observed during this test run. Observed change in the daisy-chain resistance
21 @-100C 10, 20, 30 and 50g 60 minutes at each g level Failures were observed during this test run. Observed change in the daisy-chain resistance
22 @-150C 10, 20, 30 and 50g 60 minutes at each g level Failures were observed during this test run. Observed change in the daisy-chain resistance
5th NEPP Electronic Technology Workshop June 16, 2014
14

National Aeronautics and Space
Administration
Jet Propulsion Laboratory
California Institute of Technology
Ram
Test Results: Resistance of various daisy chains vs. time
at a given dynamic load of g and temperature
No anomalies were observed in all the daisy-chains of advanced electronic packages since
the resistance is constant vs test time
5th NEPP Electronic Technology Workshop June 16, 2014
15
National Aeronautics and Space
Administration
Jet Propulsion Laboratory
California Institute of Technology
Ram
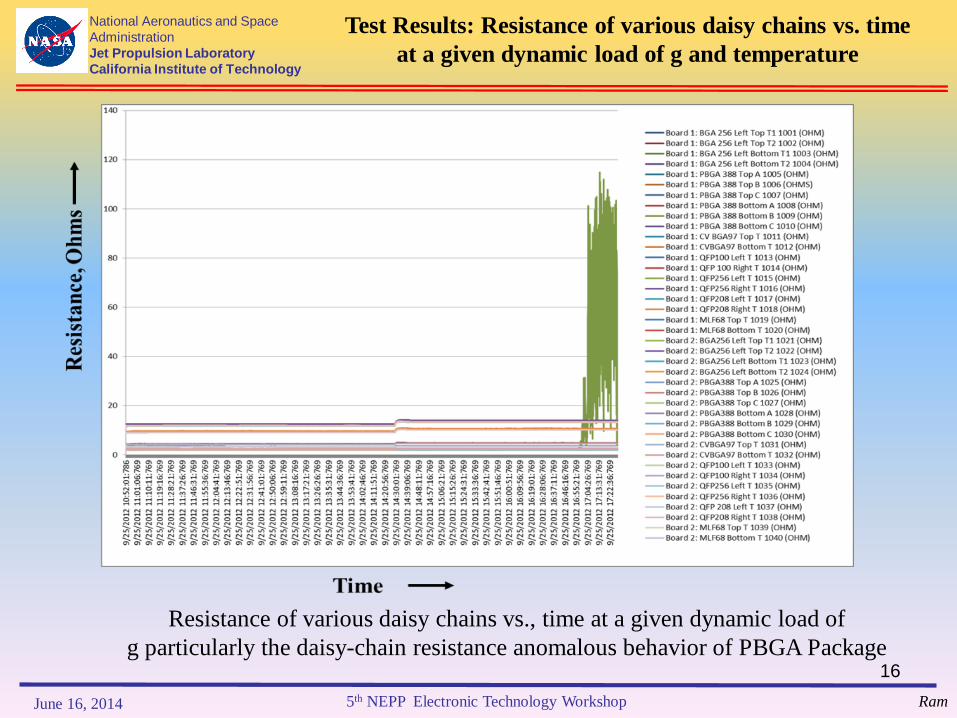
Resistance of various daisy chains vs., time at a given dynamic load of
g particularly the daisy-chain resistance anomalous behavior of PBGA Package
Test Results: Resistance of various daisy chains vs. time
at a given dynamic load of g and temperature
5th NEPP Electronic Technology Workshop June 16, 2014
16
National Aeronautics and Space
Administration
Jet Propulsion Laboratory
California Institute of Technology
Ram
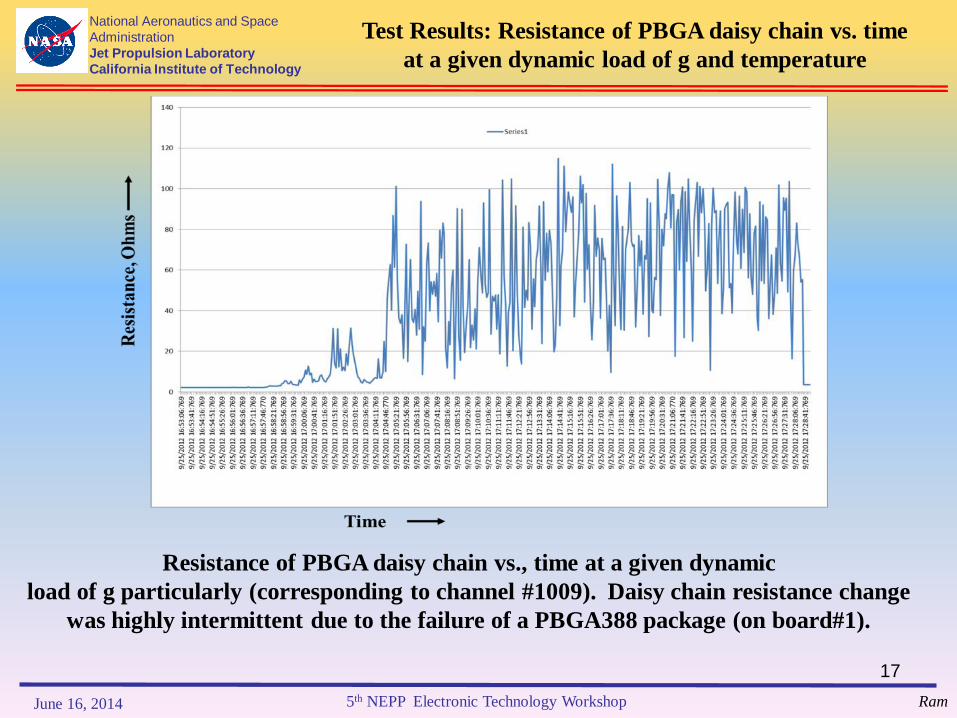
Resistance of PBGA daisy chain vs., time at a given dynamic
load of g particularly (corresponding to channel #1009). Daisy chain resistance change
was highly intermittent due to the failure of a PBGA388 package (on board#1).
Test Results: Resistance of PBGA daisy chain vs. time
at a given dynamic load of g and temperature
5th NEPP Electronic Technology Workshop June 16, 2014
17

National Aeronautics and Space
Administration
Jet Propulsion Laboratory
California Institute of Technology
Ram
Resistance of PBGA daisy chains vs., time at a given dynamic
load of g particularly (corresponding to channel #1009 (board 1), 1025, 1024, 1027 (board#2)). Daisy
chain resistance change was highly intermittent due to the failure of a PBGA388 package on board#1
and small variations in daisy chain resistance of BGA256, PBGA388 of board#2.
Test Results: Resistance of various daisy chains vs. time
at a given dynamic load of g and temperature
5th NEPP Electronic Technology Workshop June 16, 2014
18

National Aeronautics and Space
Administration
Jet Propulsion Laboratory
California Institute of Technology
Ram
PBGA388 (channel 1009) has failed completely and
daisy chain resistance is infinity or open circuit.
Test Results: Resistance of various daisy chains vs. time
at a given dynamic load of g and temperature
5th NEPP Electronic Technology Workshop June 16, 2014
19

National Aeronautics and Space
Administration
Jet Propulsion Laboratory
California Institute of Technology
Ram
PBGA388 (channel 1009) has failed completely and daisy chain resistance
is very high. Resistance is normal when no stress is applied on test board.
Test Results: Resistance of various daisy chains vs. time
at a given dynamic load of g and temperature
5th NEPP Electronic Technology Workshop June 16, 2014
20
National Aeronautics and Space
Administration
Jet Propulsion Laboratory
California Institute of Technology
Ram
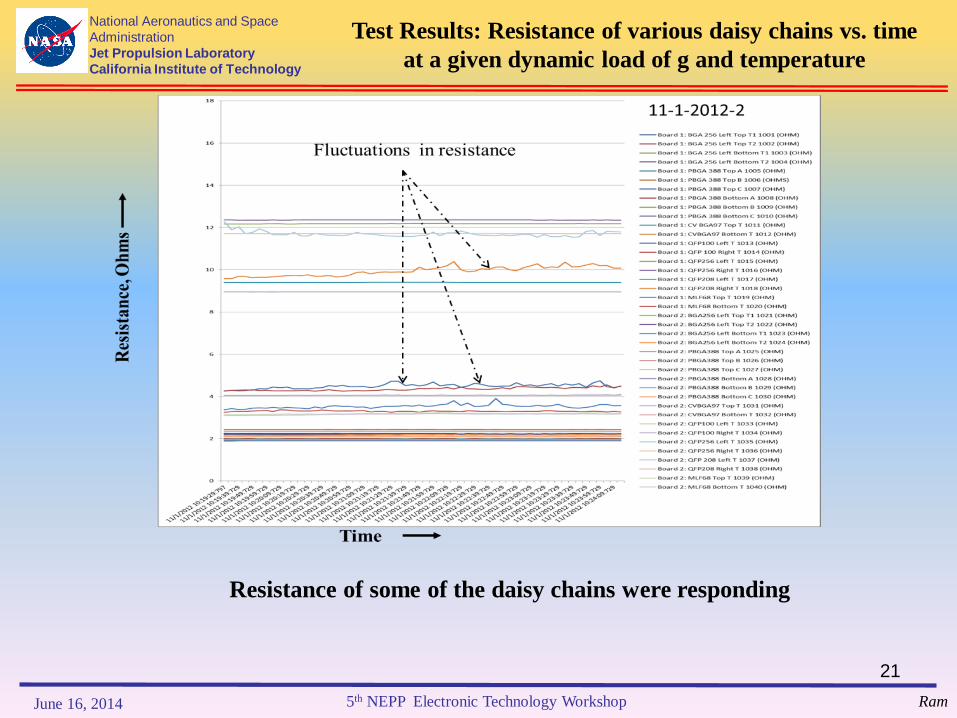
Resistance of some of the daisy chains were responding
Test Results: Resistance of various daisy chains vs. time
at a given dynamic load of g and temperature
5th NEPP Electronic Technology Workshop June 16, 2014
21

National Aeronautics and Space
Administration
Jet Propulsion Laboratory
California Institute of Technology
Ram
Change is daisy chain resistance of QFP208, QFP100, QFP100, MLF68 as a
result of combined stresses of thermal and dynamic loads on board #1.
Test Results: Resistance of various daisy chains vs. time
at a given dynamic load of g and temperature
5th NEPP Electronic Technology Workshop June 16, 2014
22
National Aeronautics and Space
Administration
Jet Propulsion Laboratory
California Institute of Technology
Ram
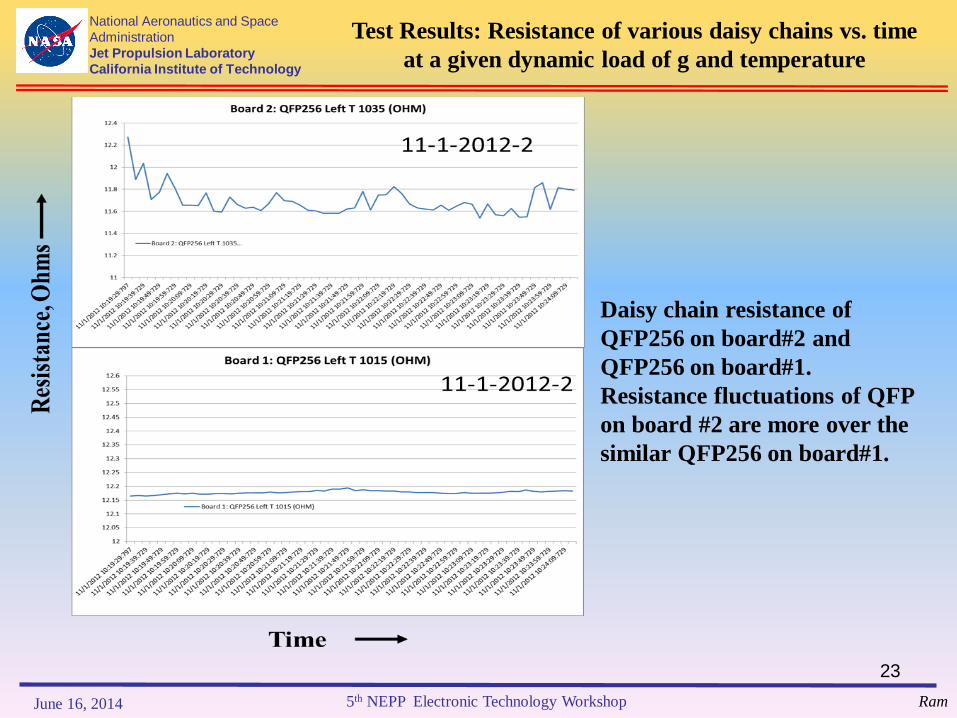
Daisy chain resistance of
QFP256 on board#2 and
QFP256 on board#1.
Resistance fluctuations of QFP
on board #2 are more over the
similar QFP256 on board#1.
Test Results: Resistance of various daisy chains vs. time
at a given dynamic load of g and temperature
5th NEPP Electronic Technology Workshop June 16, 2014
23
National Aeronautics and Space
Administration
Jet Propulsion Laboratory
California Institute of Technology
Ram
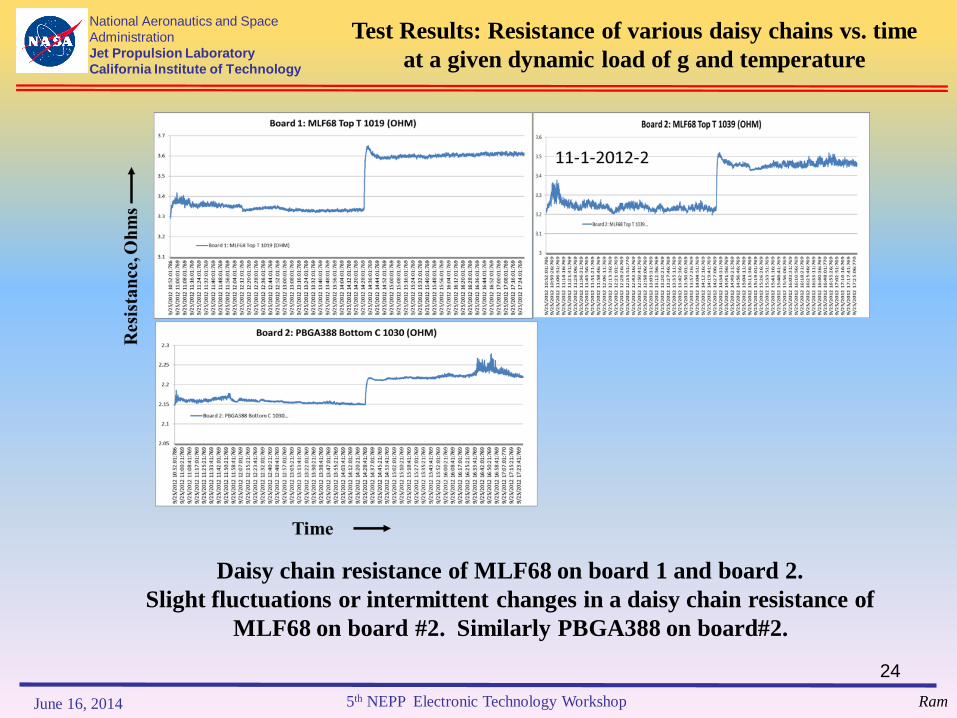
Daisy chain resistance of MLF68 on board 1 and board 2.
Slight fluctuations or intermittent changes in a daisy chain resistance of
MLF68 on board #2. Similarly PBGA388 on board#2.
Test Results: Resistance of various daisy chains vs. time
at a given dynamic load of g and temperature
5th NEPP Electronic Technology Workshop June 16, 2014
24

Ram
National Aeronautics and Space
Administration
Jet Propulsion Laboratory
California Institute of Technology
Captured a screen shot of daisy chain resistance of PBGA on board #1
channel 1009 during the test. The curve indicates the intermittent
failure of daisy chain resistance of PBGA388
Test Results: Resistance of various daisy chains vs. time
at a given dynamic load of g and temperature
5th NEPP Electronic Technology Workshop June 16, 2014
25
National Aeronautics and Space
Administration
Jet Propulsion Laboratory
California Institute of Technology
Ram
Temperature, C T2, min T2, hours G1, g G2, g T2, hours
50 10 0.16667 10 50 5.60326E-06
50 10 0.16667 15 50 7.50628E-05
50 10 0.16667 20 50 0.000473187
50 10 0.16667 30 50 0.006338942
50 10 0.16667 40 50 0.039959925
50 10 0.16667 50 50 0.166666667
75 10 0.16667 10 50 5.60326E-06
75 10 0.16667 15 50 7.50628E-05
75 10 0.16667 20 50 0.000473187
75 10 0.16667 30 50 0.006338942
75 10 0.16667 40 50 0.039959925
75 10 0.16667 50 50 0.166666667
100 10 0.16667 10 50 5.60326E-06
100 10 0.16667 15 50 7.50628E-05
100 10 0.16667 20 50 0.000473187
100 10 0.16667 30 50 0.006338942
100 10 0.16667 40 50 0.039959925
100 10 0.16667 50 50 0.166666667
125 10 0.16667 10 50 5.60326E-06
125 10 0.16667 15 50 7.50628E-05
125 10 0.16667 20 50 0.000473187
125 10 0.16667 30 50 0.006338942
125 10 0.16667 40 50 0.039959925
125 10 0.16667 50 50 0.166666667
0 10 0.16667 10 50 5.60326E-06
0 10 0.16667 15 50 7.50628E-05
0 10 0.16667 20 50 0.000473187
0 10 0.16667 30 50 0.006338942
0 10 0.16667 40 50 0.039959925
0 10 0.16667 50 50 0.166666667
-25 10 0.16667 10 50 5.60326E-06
-25 10 0.16667 15 50 7.50628E-05
-25 10 0.16667 20 50 0.000473187
-25 10 0.16667 30 50 0.006338942
-25 10 0.16667 40 50 0.039959925
-25 10 0.16667 50 50 0.166666667
-50 10 0.16667 10 50 5.60326E-06
-50 10 0.16667 15 50 7.50628E-05
-50 10 0.16667 20 50 0.000473187
-50 10 0.16667 30 50 0.006338942
-50 10 0.16667 40 50 0.039959925
-50 10 0.16667 50 50 0.166666667
-75 10 0.16667 10 50 5.60326E-06
-75 10 0.16667 15 50 7.50628E-05
-75 10 0.16667 20 50 0.000473187
-75 10 0.16667 30 50 0.006338942
-75 10 0.16667 40 50 0.039959925
-75 10 0.16667 50 50 0.166666667
-100 10 0.16667 10 50 5.60326E-06
-100 10 0.16667 15 50 7.50628E-05
-100 10 0.16667 20 50 0.000473187
-100 10 0.16667 30 50 0.006338942
-100 10 0.16667 40 50 0.039959925
-100 10 0.16667 50 50 0.166666667
-125 10 0.16667 10 50 5.60326E-06
-125 10 0.16667 15 50 7.50628E-05
-125 10 0.16667 20 50 0.000473187
-125 10 0.16667 30 50 0.006338942
-125 10 0.16667 40 50 0.039959925
-125 10 0.16667 50 50 0.166666667
25 60 1 50 50 1
75 60 1 10 50 3.36196E-05
75 60 1 30 50 0.03803365
75 60 1 50 50 1
125 60 1 10 50 3.36196E-05
125 60 1 30 50 0.03803365
125 60 1 50 50 1
25 60 1 10 50 3.36196E-05
25 60 1 30 50 0.03803365
25 60 1 50 50 1
75 60 1 10 50 3.36196E-05
75 60 1 30 50 0.03803365
75 60 1 50 50 1
125 60 1 10 50 3.36196E-05
125 60 1 30 50 0.03803365
125 60 1 50 50 1
20 60 1 10 50 3.36196E-05
20 60 1 30 50 0.03803365
20 60 1 50 50 1
-50 60 1 10 50 3.36196E-05
-50 60 1 30 50 0.03803365
-50 60 1 50 50 1
-100 60 1 10 50 3.36196E-05
-100 60 1 30 50 0.03803365
-100 60 1 50 50 1
-150 60 1 10 50 3.36196E-05
-150 60 1 30 50 0.03803365
-150 60 1 50 50 1
12.47779929
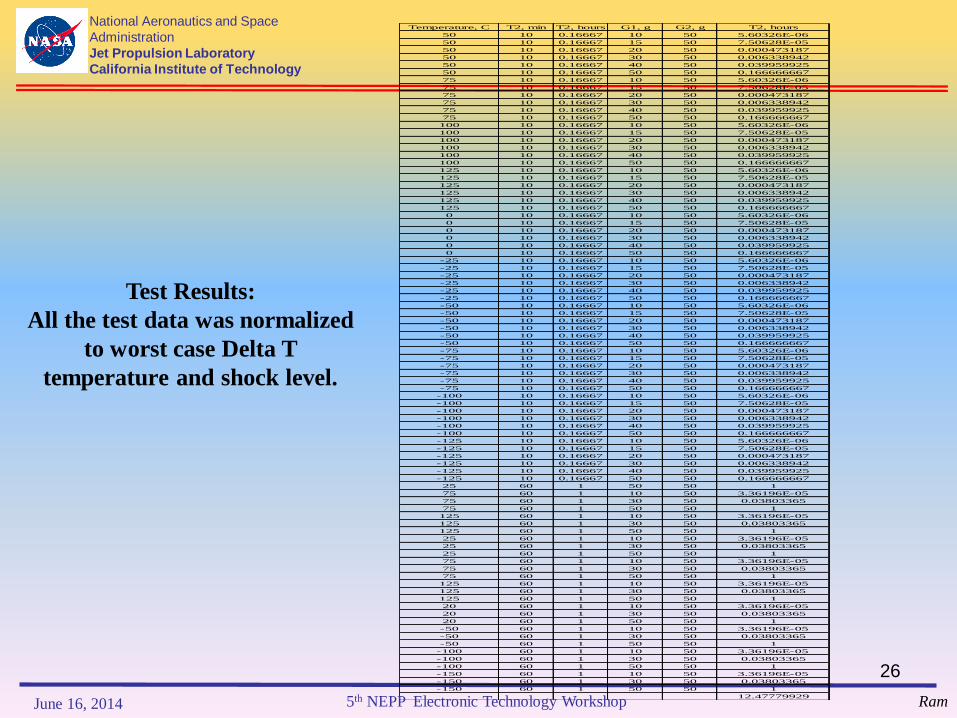
Test Results:
All the test data was normalized
to worst case Delta T
temperature and shock level.
5th NEPP Electronic Technology Workshop June 16, 2014
26

Room
TemperatureEnd of
Thermal Cycle 1
30 minutes dwell
30 minutes
dwell
-185oC
+125oC
Time, hours
T = 310oC
1 Thermal Cycle duration
Begin of
Thermal
Cycle 1 Temp ramp rate:
5oC/minute
Tem
per
atu
re,o
C
Repeat
thermal cycles
National Aeronautics and Space
Administration
Jet Propulsion Laboratory
California Institute of Technology
Ram
Extreme Temperature
Thermal Cycling Profile
5th NEPP Electronic Technology Workshop June 16, 2014
27
National Aeronautics and Space
Administration
Jet Propulsion Laboratory
California Institute of Technology
Ram
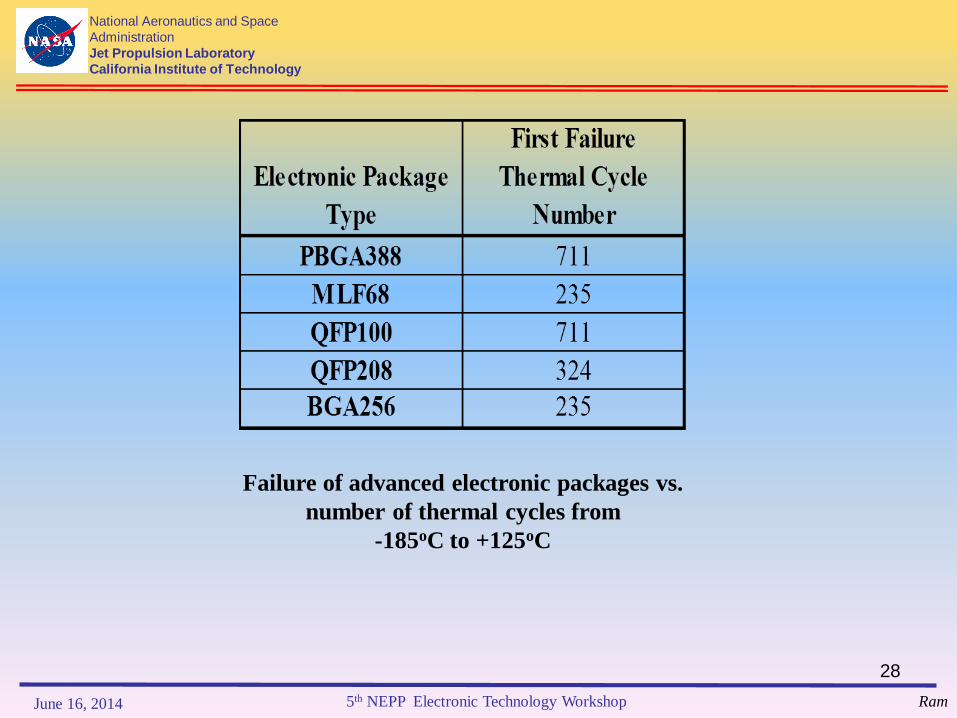
Failure of advanced electronic packages vs.
number of thermal cycles from
-185oC to +125oC
5th NEPP Electronic Technology Workshop June 16, 2014
28

Summary-1
Studied a proof of concept of HALT technique to assess fatigue reliability of
electronic packaging designs:
temperature range: –150oC to +125oC
acceleration range of up to 50g.
The test boards were subjected to various g levels, dwell durations, and the hot and
cold temperature levels. Advanced electronic packages have shown signs of
continuity problems.
plastic ball grid array (PBGA)
ball grid array (BGA)
micro-lead-frame (MLF)
quad flat-pack (QFP)
In this very preliminary study, PBGA package was completely open where as other
package designs have shown signs of continuity variations.
5th NEPP Electronic Technology Workshop June 16, 2014 Ram
National Aeronautics and Space
Administration
Jet Propulsion Laboratory
California Institute of Technology
29

Summary-2
The failure of the PBGA occurred within 12 hours of the start of accelerated testing
using dynamic and thermal loads.
The PBGA package failed during the independent thermal cycling test:
-185oC to +125oC after 711 thermal cycles (test data)
959 cycles of -150oC to +125oC, extrapolated from the test data where m=2.5)
Each thermal cycle requires 2.33 hours and a total test time to fail PBGA was 2,237
hours (or ~3.1 months) due to thermal cycling fatigue alone.
HALT technique required only 12 hours to fail
indicates that there is an acceleration factor of ~186 times (more than 2 orders of
magnitude) to fail the same PBGA component.
We do not know the failure mechanism of PBGA failures yet in HALT technique and is
yet to be determined. Relationship between failure mechanism and HALT test
parameters will be addressed in the future efforts. DPA and X-ray imaging techniques
and others will be employed to understand the failure mechanisms.
One can determine in this preliminary study that the life of the PBGA component in less
than 12 hours of testing using HALT instead of testing for 3.1 months in thermal cycling
alone.
5th NEPP Electronic Technology Workshop June 16, 2014 Ram
National Aeronautics and Space
Administration
Jet Propulsion Laboratory
California Institute of Technology
30
Acknowledgements• The research work described in this paper was carried out at the Jet
Propulsion Laboratory, Caltech, Pasadena, CA.
• NEPP program is highly appreciated for supporting me to work on
HALT task. MSL Project has generated the interest in me in obtaining
the experimental data for SMT packages in a short duration for present
and future JPL/NASA projects.
• This paper was presented at the SPIE Reliability conference in Feb 2014.
• Thanks are due to
– Dr. Chuck Barnes, Dr. Doug Sheldon, Mr. Mike Sampson, and Mr. Ken
Label for their interest and support under NEPP packaging program.
– Mr. Russel Kido of Practical Components for his support during the test
board manufacturing.
– Emilio Vazquez for his help in the data logging system.
– John Forgrave and Mark Boyles for their comments/suggestions on the
presentation.
31
National Aeronautics and Space
Administration
Jet Propulsion Laboratory
California Institute of Technology
Ram5th NEPP Electronic Technology Workshop June 16, 2014
31

Back-up slides
32

Why do we need? Titan (-180oC, for a proposed Titan in-situ mission)
Europa (-160oC, for a proposed Europa surface and subsurface mission)
Asteroids (-185oC, MUSES-CN project)
Comets (-140oC, for a proposed comet nucleus sample return)
Earth’s moon (recorded temperature on the moon: -233oC to +123oC, moon mineralogy and mapper, M3)
Mars Exploration Rover, MER (-120oC to +85oC)
MSL (-135oC to +85oC) large diurnal temperature change/swing from day to night.
Planetary protection requires the hardware to be baked at +125oC for 72hrs to kill microorganisms to avoid any biological contamination, especially for sample return missions.
NASA standard thermal cycling temperature range varies from -55oC to +100oC for 200 thermal cycles
HALT system capability is -160oC to +200oC
The present HALT package reliability research study has encompassed the temperature range of -150oC to +125oC which cover only some potential future NASA space missions.
33
NASA
Ram5th NEPP Electronic Technology Workshop June 16, 2014
National Aeronautics and Space
Administration
Jet Propulsion Laboratory
California Institute of Technology

National Aeronautics and Space
Administration
Jet Propulsion Laboratory
California Institute of Technology
Ram
Test Results: Resistance of various daisy chains vs. time
at a given dynamic load of g and temperature
Resistance of various daisy chains vs., time at a given dynamic load of
g particularly the daisy-chain resistance anomalous behavior of BPGA Package
5th NEPP Electronic Technology Workshop June 16, 2014
34

National Aeronautics and Space
Administration
Jet Propulsion Laboratory
California Institute of Technology
Ram
Temperature (25oC and 75oC) and g level
(10g, 30g, an 40g) vs. test duration of 0.5
hour
Temperature (75oC, 100oC, 125 oC) and g
level (10g, 30g, an 40g) vs. test duration
of 10 minutes
Experimental Details-3
5th NEPP Electronic Technology Workshop June 16, 2014
35
36
National Aeronautics and Space
Administration
Jet Propulsion Laboratory
California Institute of Technology
Ram
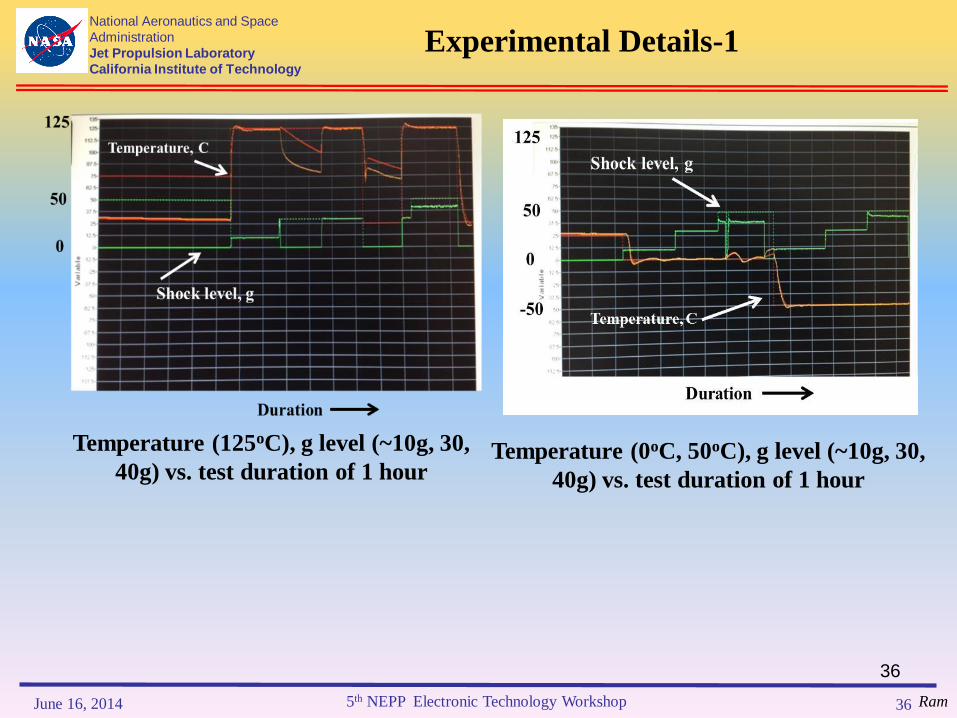
Temperature (125oC), g level (~10g, 30,
40g) vs. test duration of 1 hourTemperature (0oC, 50oC), g level (~10g, 30,
40g) vs. test duration of 1 hour
Experimental Details-1
5th NEPP Electronic Technology Workshop June 16, 2014
36

National Aeronautics and Space
Administration
Jet Propulsion Laboratory
California Institute of Technology
Ram
Temperature (-150oC), g level (~10g)
vs. test duration of 1 hour
Temperature (-150oC), g level (~40g) vs. test
duration of 1 hour
Experimental Details-2
5th NEPP Electronic Technology Workshop June 16, 2014
37

38
N1 [(G1)b-dynamic + (ΔT1)
b-thermal] = N2 [(G2)b-dynamic + (ΔT2)
b-thermal
T1 (G1)b = T2 (G2)
b
T: Test Time, N: Number of stress cycles,
b: fatigue exponent (thermal: 2.5; vibration: 4) for 63/37 Pb/Sn solder
Estimating dynamic/thermal load fatigue
N1 (G1)b-dynamic = N2 (G2)
b-dynamic
N1 (ΔT1)b-thermal = N2 (ΔT2)
b-thermal
Estimating dynamic and thermal load fatigue (assume
the stresses are linear in nature)
5th NEPP Electronic Technology Workshop June 16, 2014 Ram
National Aeronautics and Space
Administration
Jet Propulsion Laboratory
California Institute of Technology