neonatology today · by mitchell goldstein, md; t. allen merritt, md peer reviewed neonatology...
TRANSCRIPT

The Basics
Oxygen is a Chemical Element with the symbol “O” and has an Atomic Number 8. When oxygen was first discovered, it was presumed that all acids had oxygen present in their chemical for-mulation. The name derives from the Greek roots !"#$ (oxys) ("acid”, literally "sharp," referring to the sour taste of acids) and -%&'($ (-g(nos) ("producer," "begetter"). At earth’s standard tem-perature and pressure, two molecules of oxygen combine to form dioxygen, commonly referred to as O2. O2 is colorless, tasteless, and odorless. It is ubiquitous in earth’s atmosphere and is re-quired by the bulk of terrestrial life on the planet. However, free oxygen was almost non-existent before the evolution of photosynthetic bacteria. Most oxygen was bound in geoforms and mineral compositions. The world’s first life forms were predominantly Anaerobes.
The History
The earliest atmosphere was essentially that of a solar nebula and consisted of hydrogen, simple hydrides, relatively sparse water vapor, methane, and ammonia. As the earth cooled, the second atmosphere formed. There was extensive vol-canic activity with predomination of nitrogen, car-bon dioxide, as well as inert or noble gases. As-teroid bombardment was common in this rela-tively sparse atmosphere. Major rainfall led to formation of oceans with subsequent absorption of carbon dioxide. The third atmosphere took
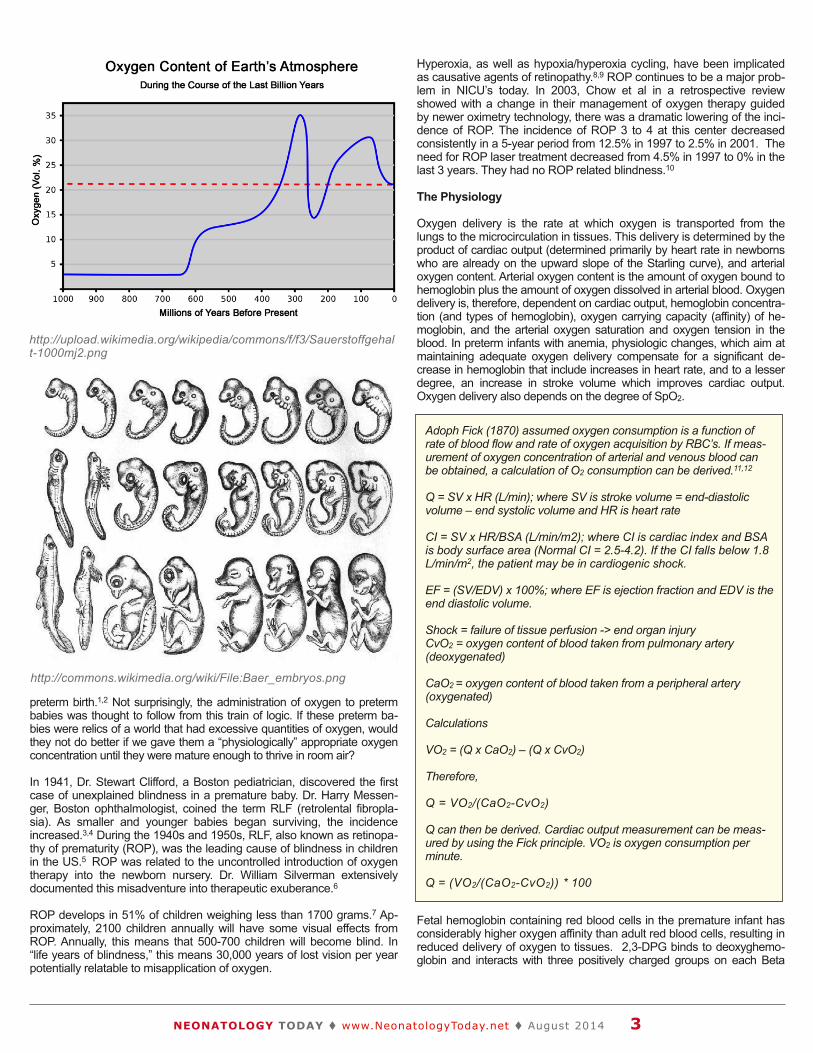
much longer to form. Free oxygen did not exist in substantial quantities until about 1.7 billion years ago. Large surface iron deposits were oxidized by available free oxygen, and it was not until this iron had been oxidized that atmospheric oxygen began to accumulate. Oxygen concentrations increased and decreased until reaching a steady state of more than 15%. Approximately 280 mil-lion years ago, there was a peak when the amount of O2 in the atmosphere rose to signifi-cantly above 30%.
The expansion of life on earth correlated with these oxygen levels. From the Ordovician Period until the end of the Carboniferous Period -- 488 to 299 million years ago — atmospheric oxygen rose 10%, from 15% to 25% and then beyond. Oxygen concentrations at this level supported the emergence of physically massive species. In the late Palezoic era, O2 levels once again de-creased to lower than 15%. Many giant animal populations were killed off in what was the great-est of all mass extinctions on earth. Although oxygen levels later recovered; in the late Meso-zoic period, O2 levels once again fell abruptly. This event was associated with the extinction of the last of the dinosaurs.
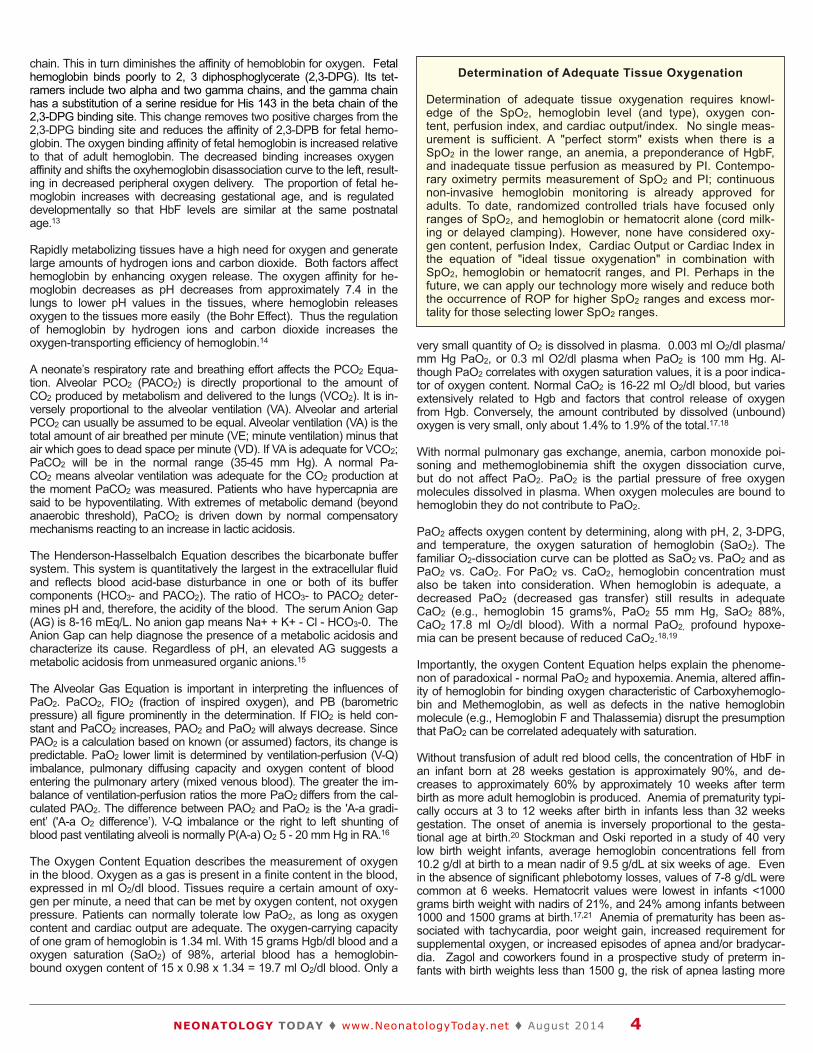
Ernst Heinrich Haeckel (1834-1919), an influen-tial German evolutionist, morphologist, and de-velopmental biologist, was one of the first to cre-ate explicit evolutionary phylogenies of all ani-mals. As an aside, Haeckel's attempt to describe human evolution in racial terms later became a part of the pseudo-scientific basis for Nazism. But the ideals behind ontogeny recapitulating phylogeny were particularly attractive in the context of providing explanation for the basis for fetal development and thus treatment of
NEONATOLOGY TODAYN e w s a n d I n f o r m a t i o n f o r B C / B E N e o n a t o l o g i s t s a n d P e r i n a t o l o g i s t s
Volume 9 / Issue 8August 2014
IN THIS ISSUEOxygen Monitoring in Preterm Infants: Do We Really Know What We Are Doing?By Mitchell Goldstein, MD; T. Allen Merritt, MDPage 1
DEPARTMENT
Medical News, Products & InformationPage 11
NEONATOLOGY TODAY© 2006-2014 by Neonatology Today ISSN: 1932-7129 (print); 1932-7137 (online). Published monthly. All rights reserved.
Company Offices: 8100 Leaward WayPO Box 444Manzanita, OR 97130 USA
Editorial and Subscription Offices16 Cove Rd, Ste. 200Westerly, RI 02891 USAwww.NeonatologyToday.net
Twitter: @neotoday
Upcoming Medical Meetings(See www.Neonate.biz for additional
meetings)
Contemporary Management of Neonatal Pulmonary Disorders Conference
Nov. 6-7, 2014; Tempe, AZ USAwww.nalweb.com/cmnpdconference/
Miami Neonatology - 38th Annual International Conference
Nov. 12-15, 2014; Miami, FL USAhttp://pediatrics.med.miami.edu/neonatolog
y/international-neonatal-conference
The Fetus & NewbornNov.12 - 15, 2014; Las Vegas, NV USA
http://contemporaryforums.com/continuing-education-conferences/2014/fetus-newborn
-november-las-vegas.html
World Symposium of Perinatal MedicineNov. 20-22, 2014; San Diego, CA USA
www.worldsymposium.net
Hot Topics in NeonatologyDec. 8-10, 2014; Washington, DC US
www.hottopics.org
Continuous Quality Improvement Pre-Conference at NEO
Feb. 18, 2015; Orlando, FL USAwww.neoconference.com
NEO: The Conference for NeonatologyFeb. 19-22, 2015; Orlando, FL USA
www.neoconference.com
The 26th Annual Meeting of the European Society of Paediatric and
Neonatal Intensive Care (ESPNIC 2015)Jun. 10-13, 2015; Viliniu, Lithuania
http://espnic.kenes.com
Oxygen Monitoring in Preterm Infants: Do We Really Know What We Are Doing?By Mitchell Goldstein, MD; T. Allen Merritt, MD
Peer reviewed
N E O N A T O L O G Y T O D A YCALL FOR PAPERS, CASE STUDIES
AND RESEARCH RESULTS
Do you have interesting research results, observations, human interest stories, reports of meetings, etc. to share?
Submit your manuscript to: [email protected]

preterm birth.1,2 Not surprisingly, the administration of oxygen to preterm babies was thought to follow from this train of logic. If these preterm ba-bies were relics of a world that had excessive quantities of oxygen, would they not do better if we gave them a “physiologically” appropriate oxygen concentration until they were mature enough to thrive in room air?
In 1941, Dr. Stewart Clifford, a Boston pediatrician, discovered the first case of unexplained blindness in a premature baby. Dr. Harry Messen-ger, Boston ophthalmologist, coined the term RLF (retrolental fibropla-sia). As smaller and younger babies began surviving, the incidence increased.3,4 During the 1940s and 1950s, RLF, also known as retinopa-thy of prematurity (ROP), was the leading cause of blindness in children in the US.5 ROP was related to the uncontrolled introduction of oxygen therapy into the newborn nursery. Dr. William Silverman extensively documented this misadventure into therapeutic exuberance.6
ROP develops in 51% of children weighing less than 1700 grams.7 Ap-proximately, 2100 children annually will have some visual effects from ROP. Annually, this means that 500-700 children will become blind. In “life years of blindness,” this means 30,000 years of lost vision per year potentially relatable to misapplication of oxygen.
Hyperoxia, as well as hypoxia/hyperoxia cycling, have been implicated as causative agents of retinopathy.8,9 ROP continues to be a major prob-lem in NICU’s today. In 2003, Chow et al in a retrospective review showed with a change in their management of oxygen therapy guided by newer oximetry technology, there was a dramatic lowering of the inci-dence of ROP. The incidence of ROP 3 to 4 at this center decreased consistently in a 5-year period from 12.5% in 1997 to 2.5% in 2001. The need for ROP laser treatment decreased from 4.5% in 1997 to 0% in the last 3 years. They had no ROP related blindness.10
The Physiology
Oxygen delivery is the rate at which oxygen is transported from the lungs to the microcirculation in tissues. This delivery is determined by the product of cardiac output (determined primarily by heart rate in newborns who are already on the upward slope of the Starling curve), and arterial oxygen content. Arterial oxygen content is the amount of oxygen bound to hemoglobin plus the amount of oxygen dissolved in arterial blood. Oxygen delivery is, therefore, dependent on cardiac output, hemoglobin concentra-tion (and types of hemoglobin), oxygen carrying capacity (affinity) of he-moglobin, and the arterial oxygen saturation and oxygen tension in the blood. In preterm infants with anemia, physiologic changes, which aim at maintaining adequate oxygen delivery compensate for a significant de-crease in hemoglobin that include increases in heart rate, and to a lesser degree, an increase in stroke volume which improves cardiac output. Oxygen delivery also depends on the degree of SpO2.
Fetal hemoglobin containing red blood cells in the premature infant has considerably higher oxygen affinity than adult red blood cells, resulting in reduced delivery of oxygen to tissues. 2,3-DPG binds to deoxyghemo-globin and interacts with three positively charged groups on each Beta
NEONATOLOGY TODAY ! www.NeonatologyToday.net ! August 2014 3
http://upload.wikimedia.org/wikipedia/commons/f/f3/Sauerstoffgehalt-1000mj2.png
http://commons.wikimedia.org/wiki/File:Baer_embryos.png
Adoph Fick (1870) assumed oxygen consumption is a function of rate of blood flow and rate of oxygen acquisition by RBC’s. If meas-urement of oxygen concentration of arterial and venous blood can be obtained, a calculation of O2 consumption can be derived.11,12
Q = SV x HR (L/min); where SV is stroke volume = end-diastolic volume – end systolic volume and HR is heart rate
CI = SV x HR/BSA (L/min/m2); where CI is cardiac index and BSA is body surface area (Normal CI = 2.5-4.2). If the CI falls below 1.8 L/min/m2, the patient may be in cardiogenic shock.
EF = (SV/EDV) x 100%; where EF is ejection fraction and EDV is the end diastolic volume.
Shock = failure of tissue perfusion -> end organ injuryCvO2 = oxygen content of blood taken from pulmonary artery (deoxygenated)
CaO2 = oxygen content of blood taken from a peripheral artery (oxygenated)
Calculations
VO2 = (Q x CaO2) – (Q x CvO2)
Therefore,
Q = VO2/(CaO2-CvO2)
Q can then be derived. Cardiac output measurement can be meas-ured by using the Fick principle. VO2 is oxygen consumption per minute.
Q = (VO2/(CaO2-CvO2)) * 100
chain. This in turn diminishes the affinity of hemoblobin for oxygen. Fetal hemoglobin binds poorly to 2, 3 diphosphoglycerate (2,3-DPG). Its tet-ramers include two alpha and two gamma chains, and the gamma chain has a substitution of a serine residue for His 143 in the beta chain of the 2,3-DPG binding site. This change removes two positive charges from the 2,3-DPG binding site and reduces the affinity of 2,3-DPB for fetal hemo-globin. The oxygen binding affinity of fetal hemoglobin is increased relative to that of adult hemoglobin. The decreased binding increases oxygen affinity and shifts the oxyhemoglobin disassociation curve to the left, result-ing in decreased peripheral oxygen delivery. The proportion of fetal he-moglobin increases with decreasing gestational age, and is regulated developmentally so that HbF levels are similar at the same postnatal age.13
Rapidly metabolizing tissues have a high need for oxygen and generate large amounts of hydrogen ions and carbon dioxide. Both factors affect hemoglobin by enhancing oxygen release. The oxygen affinity for he-moglobin decreases as pH decreases from approximately 7.4 in the lungs to lower pH values in the tissues, where hemoglobin releases oxygen to the tissues more easily (the Bohr Effect). Thus the regulation of hemoglobin by hydrogen ions and carbon dioxide increases the oxygen-transporting efficiency of hemoglobin.14
A neonate’s respiratory rate and breathing effort affects the PCO2 Equa-tion. Alveolar PCO2 (PACO2) is directly proportional to the amount of CO2 produced by metabolism and delivered to the lungs (VCO2). It is in-versely proportional to the alveolar ventilation (VA). Alveolar and arterial PCO2 can usually be assumed to be equal. Alveolar ventilation (VA) is the total amount of air breathed per minute (VE; minute ventilation) minus that air which goes to dead space per minute (VD). If VA is adequate for VCO2; PaCO2 will be in the normal range (35-45 mm Hg). A normal Pa-CO2 means alveolar ventilation was adequate for the CO2 production at the moment PaCO2 was measured. Patients who have hypercapnia are said to be hypoventilating. With extremes of metabolic demand (beyond anaerobic threshold), PaCO2 is driven down by normal compensatory mechanisms reacting to an increase in lactic acidosis.
The Henderson-Hasselbalch Equation describes the bicarbonate buffer system. This system is quantitatively the largest in the extracellular fluid and reflects blood acid-base disturbance in one or both of its buffer components (HCO3- and PACO2). The ratio of HCO3- to PACO2 deter-mines pH and, therefore, the acidity of the blood. The serum Anion Gap (AG) is 8-16 mEq/L. No anion gap means Na+ + K+ - Cl - HCO3-0. The Anion Gap can help diagnose the presence of a metabolic acidosis and characterize its cause. Regardless of pH, an elevated AG suggests a metabolic acidosis from unmeasured organic anions.15
The Alveolar Gas Equation is important in interpreting the influences of PaO2. PaCO2, FIO2 (fraction of inspired oxygen), and PB (barometric pressure) all figure prominently in the determination. If FIO2 is held con-stant and PaCO2 increases, PAO2 and PaO2 will always decrease. Since PAO2 is a calculation based on known (or assumed) factors, its change is predictable. PaO2 lower limit is determined by ventilation-perfusion (V-Q) imbalance, pulmonary diffusing capacity and oxygen content of blood entering the pulmonary artery (mixed venous blood). The greater the im-balance of ventilation-perfusion ratios the more PaO2 differs from the cal-culated PAO2. The difference between PAO2 and PaO2 is the 'A-a gradi-ent’ ('A-a O2 difference’). V-Q imbalance or the right to left shunting of blood past ventilating alveoli is normally P(A-a) O2 5 - 20 mm Hg in RA.16
The Oxygen Content Equation describes the measurement of oxygen in the blood. Oxygen as a gas is present in a finite content in the blood, expressed in ml O2/dl blood. Tissues require a certain amount of oxy-gen per minute, a need that can be met by oxygen content, not oxygen pressure. Patients can normally tolerate low PaO2, as long as oxygen content and cardiac output are adequate. The oxygen-carrying capacity of one gram of hemoglobin is 1.34 ml. With 15 grams Hgb/dl blood and a oxygen saturation (SaO2) of 98%, arterial blood has a hemoglobin-bound oxygen content of 15 x 0.98 x 1.34 = 19.7 ml O2/dl blood. Only a
very small quantity of O2 is dissolved in plasma. 0.003 ml O2/dl plasma/mm Hg PaO2, or 0.3 ml O2/dl plasma when PaO2 is 100 mm Hg. Al-though PaO2 correlates with oxygen saturation values, it is a poor indica-tor of oxygen content. Normal CaO2 is 16-22 ml O2/dl blood, but varies extensively related to Hgb and factors that control release of oxygen from Hgb. Conversely, the amount contributed by dissolved (unbound) oxygen is very small, only about 1.4% to 1.9% of the total.17,18
With normal pulmonary gas exchange, anemia, carbon monoxide poi-soning and methemoglobinemia shift the oxygen dissociation curve, but do not affect PaO2. PaO2 is the partial pressure of free oxygen molecules dissolved in plasma. When oxygen molecules are bound to hemoglobin they do not contribute to PaO2.
PaO2 affects oxygen content by determining, along with pH, 2, 3-DPG, and temperature, the oxygen saturation of hemoglobin (SaO2). The familiar O2-dissociation curve can be plotted as SaO2 vs. PaO2 and as PaO2 vs. CaO2. For PaO2 vs. CaO2, hemoglobin concentration must also be taken into consideration. When hemoglobin is adequate, a decreased PaO2 (decreased gas transfer) still results in adequate CaO2 (e.g., hemoglobin 15 grams%, PaO2 55 mm Hg, SaO2 88%, CaO2 17.8 ml O2/dl blood). With a normal PaO2, profound hypoxe-mia can be present because of reduced CaO2.18,19
Importantly, the oxygen Content Equation helps explain the phenome-non of paradoxical - normal PaO2 and hypoxemia. Anemia, altered affin-ity of hemoglobin for binding oxygen characteristic of Carboxyhemoglo-bin and Methemoglobin, as well as defects in the native hemoglobin molecule (e.g., Hemoglobin F and Thalassemia) disrupt the presumption that PaO2 can be correlated adequately with saturation.
Without transfusion of adult red blood cells, the concentration of HbF in an infant born at 28 weeks gestation is approximately 90%, and de-creases to approximately 60% by approximately 10 weeks after term birth as more adult hemoglobin is produced. Anemia of prematurity typi-cally occurs at 3 to 12 weeks after birth in infants less than 32 weeks gestation. The onset of anemia is inversely proportional to the gesta-tional age at birth.20 Stockman and Oski reported in a study of 40 very low birth weight infants, average hemoglobin concentrations fell from 10.2 g/dl at birth to a mean nadir of 9.5 g/dL at six weeks of age. Even in the absence of significant phlebotomy losses, values of 7-8 g/dL were common at 6 weeks. Hematocrit values were lowest in infants <1000 grams birth weight with nadirs of 21%, and 24% among infants between 1000 and 1500 grams at birth.17,21 Anemia of prematurity has been as-sociated with tachycardia, poor weight gain, increased requirement for supplemental oxygen, or increased episodes of apnea and/or bradycar-dia. Zagol and coworkers found in a prospective study of preterm in-fants with birth weights less than 1500 g, the risk of apnea lasting more
NEONATOLOGY TODAY ! www.NeonatologyToday.net ! August 2014 4
Determination of Adequate Tissue Oxygenation
Determination of adequate tissue oxygenation requires knowl-edge of the SpO2, hemoglobin level (and type), oxygen con-tent, perfusion index, and cardiac output/index. No single meas-urement is sufficient. A "perfect storm" exists when there is a SpO2 in the lower range, an anemia, a preponderance of HgbF, and inadequate tissue perfusion as measured by PI. Contempo-rary oximetry permits measurement of SpO2 and PI; continuous non-invasive hemoglobin monitoring is already approved for adults. To date, randomized controlled trials have focused only ranges of SpO2, and hemoglobin or hematocrit alone (cord milk-ing or delayed clamping). However, none have considered oxy-gen content, perfusion Index, Cardiac Output or Cardiac Index in the equation of "ideal tissue oxygenation" in combination with SpO2, hemoglobin or hematocrit ranges, and PI. Perhaps in the future, we can apply our technology more wisely and reduce both the occurrence of ROP for higher SpO2 ranges and excess mor-tality for those selecting lower SpO2 ranges.

NEONATOLOGY TODAY ! www.NeonatologyToday.net ! August 2014 5
than 10 seconds rose with decreasing hematocrit values. The frequency of apneic events (as determined by chest wall impedance and oxygen desaturations) ceased after red cell transfusion.20
Bard documented that during intrauterine life, there is an orderly transition from fetal hemoglobin (Hb F) to adult hemoglobin synthesis (Hgb A), and that this orderly transition postnatally in infants born prematurely reflects this in utero transition even though demands for oxygen delivery may be substantially increased. Among infants <30 weeks, 80-95% of the hemo-globin was Hgb F. Hgb F fell to 50% when the infant achieved 38 weeks post-conception.22 Shiao and Ou established a multivariant regression model to predict the decrease in Hgb F based on gestational age, and age post birth. They also reported that Hgb F1 (not involved in oxygen transfer) remained at approximately 10% throughout this transition. In 20 neonates ranging from 25-34 weeks gestation with central lines, without adjusting for the effects of Hgb F, mean SaO2 measurements were elevated by 5%. With the left-shifted oxyhemoglobin dissociation curves in neonates, for critical oxygen tension values between 50-70 torr, SpO2 oxygen ranged from 96-97% compared to 85%-94% in healthy adults. Oxyhemoglobin dissociation curves differed before and after blood transfusions. With oxy-gen tension values of 50-70 torr, and right-shifted oxyhemoglobin dissocia-tion curves, pulse oximetry ranged from 95-98% before transfusion of adult packed red blood cells, but decreased to 94-96% after the blood transfusion. Despite presumed increased oxygen carrying capacity, it is imperative that the differences in SpO2 based on adult hemoglobin trans-late to changes in oxygen management, relative to the decreased propor-tion of Hgb F in the post transfusion circulation.23,24
Whether to transfuse premature infants with adult packed red blood cells based on a specific level of hemoglobin or hematocrit or to wait for signs of anemia is controversal.25 In addition, the decision to transfuse or not must be tempered by the risks of infections (Hepatitis C, cytomegalovirus, (CMV), human immunodeficiency virus (HIV)), as well as excessive fluid, hemolysis, exposure to plasticizers, post-transfusion graft versus host disease and other concerns (including transfusion associated necrotizing enterocolitis). The decision to transfuse must balance these risks with potential benefits.26 Transfusions also transiently lower erythropoiesis and erythropoietin levels, exposing infants to the risk of further transfusion and potentially more donor associated risk.
The “Premature Infant in Need of Transfusion (PINT)” study found that transfusing infants to maintain higher hemoglobin levels (8.5-13.5 g/dL) conferred no benefit in terms of mortality, severe morbidity or apnea inter-vention compared with infants transfused to maintain lower hemoglobin levels (7.5-11.5 g/dL).27 In contrast, Bell et al randomized Extremely Low Birth Weight Infants with birth weights 500-1300 g into a restrictive trans-fusion group or a more liberal group collected from arterial or capillary blood (80% from capillary blood). Infants intubated and receiving assisted ventilation in the liberal groups were transfused when their hematocrits fell to <46% versus those in the restricted group who were not transfused until the hematocrit was <34%. Infants receiving nasal continuous positive air-way pressure or supplemental oxygen were transfused to maintain hema-tocrit >38% in the liberal group versus 28% in the restricted group, while infants requiring neither oxygen nor assisted ventilation had hematocrits maintained at >30% in the liberal versus >22% in the restricted group. Infants in the restrictive-transfusion group were more likely to have intra-parenchymal brain hemorrhage or periventricular leukomalacia, and more frequent episodes of apnea, including both mild and severe episodes. Those in the more liberal transfusion group received on average two more transfusions, as well as greater exposure to a larger number of blood donors.25,28,29 Unlike the PINT study, Bell et al measured physiologic vari-ables prior to the initial transfusion at 6 weeks in infants allocated to the liberal and restrictive transfusion groups. Infants in the liberal transfusion group had significantly elevated systemic oxygen transport and increased arterial oxygen content compared to those in the more restrictive transfu-sion group. Decreased oxygen delivery to the brain may be a mechanism for increased frequency of central nervous system injury and the more frequent apnea in the infants who received an RBC transfusion in the re-strictive group.
Hemoglobin levels in the oxygen content equation are critical when con-sidering oxygen delivery to the tissues. Hemoglobin levels may be af-fected by many perinatal care practices. March et al reported that ex-tremely premature infants 24-28 weeks whose cords were “milked” at delivery compared to immediate cord clamping had significantly higher hematocrit (43.3% versus 40.8%) and hemoglobin (14.9 g/dl versus 13.6 g/dl) in their initial blood evaluation.30 An interesting benefit was that fewer infants in the infants undergoing cord “milking,” fewer infants expe-rienced intraventricular hemorrhage, and no greater need for photother-apy. There was however, no difference in benefit when cord “milking” was compared to delayed cord clamping in 58 premature infants (mean gestational age 29.2 weeks). Mean hemoglobin levels were 17.3 g/dL with clamping for 30 seconds compared to 17.5 g/dL for cord milking.31 A Cochrane review found that among five clinical trials in term infants of late cord clamping versus early cord clamping, hemoglobin levels were increased by a mean difference of 2.17 g/dL (95% CI 0.28-4.06).32 These differences in extremely premature infants, as well as in term infants with delayed cord clamping or milking, results in a substantial increase in oxy-gen carrying capacity and delivery based on the increased hemoglobin levels achieved soon after birth (when cardiac output and SpO2 remain relatively constant). Moreover, the expected benefit is even more pro-nounced in the extremely premature infants where Hbg F predominates.
Adequacy of tissue perfusion is determined by cardiac output, viscosity of the blood, and conditions that might affect an extremity such as ex-treme cold or hyperthermia. Optimal pulse oximetry monitoring is de-pendent on the selection of a monitoring site (fingertip, hand, toes, foot, forehead, ear lobe) and is characterized by normal perfusion with oxy-genated blood. The perfusion index (PI) is the ratio of the pulsatile blood flow to the nonpulsatile or static blood in peripheral tissue, and is deter-mined using the infrared component of the pulse oximetry sensor. PI represents a noninvasive measure of peripheral perfusion that can be reported continuously and noninvasively from a pulse oximeter. When peripheral perfusion drops below the minimum required for tissue oxy-genation and cellular respiration, PI provides an early warning that oxygen delivery may be inadequate. In fact, it may also indicate that the oximeter probe should be repositioned to a site where there is a stable PI. Under stress-free conditions, newborn skin perfusion is high by comparison rela-tive to oxygen demand.33 However, in sick infants, peripheral perfusion is related to redistribution of cardiac output. Oxygen delivery is preferentially shunted to critical organs such as the brain, heart or adrenal glands during the early stages of shock, and thus, peripheral perfusion is affected. A prospective study of 101 neonates to evaluate the relationship was per-formed. Illness severity, PI, SpO2, heart rate, and PI were simultaneously measured using a motion tolerant, low perfusion resistant technology. Forty-three infants were classified as high severity of illness, and 58 were classified as low severity of illness using the SNAPII scores. These two
Oxygen Content (CaO2) of the blood = 1.34 ml oxygen/g hemoglobin x SaO2 + 0.003 x paO2
Examples:
Oxygen Content =15 g/dL hemoglobin x 1.34 ml/g x SaO2 85 x 0.003 x paO2 70 = 17.30 ml (Lower range of Saturation Target)
Oxygen Content =10 g/dL hemoglobin x 1.34 ml/g x SaO2 95 x 0.003 x paO2 70 = 12.94 ml (Upper range of Saturation Target)
In this example, the oxygen content is actually higher in the lower SaO2 target. Unless, hemoglobin and oxygen content are consid-ered, where an infant is targeted for SaO2 may translate to significant differences in oxygen content.
Oxygen Delivery to tissues = Oxygen Content x flow (Cardiac Output) to the tissues for Oxygen Extraction or the CaO2 in arterial blood – CvO2 in venous blood.
NEONATOLOGY TODAY ! www.NeonatologyToday.net ! August 2014 6
groups were similar in terms of gender, gestational age, birth weight, body temperature, mean blood pressure, and use of peripheral vasoconstrictors or vasodiliators. Significantly lower PI values (mean 0.86) were found in the severely ill versus 2.02 of the low illness scores. SpO2 values were 93.3 ± 5.4% versus 95.1 ± 3.9% (p<0.0001) and higher pulse rates (139 ± 16) vs 133 ± 17 bpm p<0.0001). A PI value of < 1.24 may be an accurate predictor of illness severity. These authors also found that when used in conjunction with oxygen saturation and pulse rate, a low PI is an important indicator of maternal chorioamnionitis and, in term newborns, may indicate early onset sepsis.34 In preterm infants who were consid-ered hemodynamically stable, and whose score for Neonatal Acute Physiology Scores were normal, median and interquartile ranges of PI were 0.9 (0.6) on the first day, 1.2 ± 1.0 on the third day, and 1.3 ± 0.9 on the seventh day.35 Zaramella and coworkers assessed calf muscle blood flow, oxygen delivery, fractional oxygen extraction, and PI in the foot in 45 healthy term newborns one to five days of age. They reported mean foot PI of 1.26 ± 0.39; a positive correlation between foot PI and both calf blood flow, oxygen delivery, but no correlation between foot PI and calf muscle fractional oxygen extraction and oxygen consumption.36
Use of PI in conjunction with SpO2 provides one method to determine tissue perfusion and is an “early” sign of illness when low. Coupled with SpO2 measurements, knowledge of hemoglobin level and compo-sition, and reflecting adequacy of cardiac output, PI offers an indirect measure of tissue perfusion with oxygenated hemoglobin that is con-siderably more informative than a single measure of SpO2 at any spe-cific targeted level or range.
In the NEOPROM meta-analysis, Saugstad and Aune combined the data from the SUPPORT, three BOOST II, and the COT clinical trials including a total of 4,911 infants randomized to either a low (85-89%) or high (91-95%) functional oxygen saturation within the first 24 hours after birth, but ending at variable times (when supplemental oxygen was discontinued or upon NICU discharge).37 Relative risks (RR, 95% CIs), comparing low versus high oxygen saturation ranges, were 1.41 (1.14-1.74) for mortality at discharge or at follow-up, 0.74 (0.59-0.92) for severe retinopathy of prematurity, 0.95 (0.86-1.04) for physiologic bronchopulmonary dysplasia, 1.25 (1.05-1.49) for necrotizing enter-coloitis, 1.02 (0.88-1.19) for brain injury, and 1.01 (0.95-1.08) for patent ductus arteriosus.37,38 However, none of these trials controlled for or considered in their multi-variant analysis the hemoglobin concentra-tions of the infant being monitored or the perfusion index displayed by the oximeters. An 18% increased risk of mortality in the low saturation target group was found, and as noted by the authors in the SUPPORT trial there was one extra death for every two cases of severe retinopa-thy of prematurity prevented when targeting the lower saturation range.39 Although the major causes of death did not differ between the two groups, Di Fiore et al demonstrated after analyzing the SUPPORT data that low oxygen saturation target was associated with an in-creased rate of intermittent hypoxemic events.40 This finding was noted during both the early post-natal period, but also up to 57 days of life in which the period of severity of the hypoxemic events increased even further. The BOOST II trials found an increased incidence of death in the low saturation groups up to 70 days after birth. Depending on the hemoglobin levels, transfusion practices, and proportion of adult Hgb in the various NICUs and considering the postnatal age at which some of the deaths occurred; it is reasonable to hypothesize that the practice of achieving hemoglobin levels lower than for optimal oxygen content and delivery and targeting a low saturation range may lead to adverse out-comes in some infants.37,41 Whether a more optimal oxygen content can improve upon the outcome of mortality noted in a low saturation model or an outcome of retinopathy in a high saturation model remains to be tested.
As noted by Saugstad and Aune, “there are still several additional un-answered questions,” and “we do not know whether oxygen saturation should be constant throughout the whole postnatal period or should be increased at a certain age” as suggested by Chen et al.8,37 Whether SpO2 targets should be adjusted differently for infants of differing ges-
tational age, with selected disease processes such as infection, nectro-tizing enterocolitis, or those infants requiring supplemental oxygen after 28 days or after 36 weeks post-conception, or those with various hemoglobin levels remains to be studied.
There is also a contribution of cardiac output in determining the blood pressure of preterm infants. Sixty-seven preterm infants requiring me-chanical ventilation (median birth weight, 1015 gm; median gestational age, 28 weeks) underwent an echocardiographic study at an average age of 19 hours (range, 7 to 31 hours). Left ventricular ejection frac-tion, left and right ventricular outputs by means of pulsed Doppler and the diameter of both the ductal and atrial shunt jets were measured. Simultaneous measurements of intraarterial blood pressures, mean airway pressure, and inspired fraction of oxygen were recorded. The correlation between the left ventricular output and mean arterial blood pressure was significant but weak (r = 0.38). Some infants with low blood pressures had normal cardiac outputs. Some infants with low cardiac outputs had normal blood pressure. The infants with a mean arterial blood pressure of < 30 mm Hg were younger (27 vs 28 weeks), were on more ventilator support (9.0 vs 7.0 cm H2O), had larger ductal diameter (1.6 mm vs 0.7 mm) and manifested a lower systemic vascu-lar resistance (163 vs 184 mm Hg/L/min/kg). Higher mean airway pressure and larger ductal diameter were negatively correlated to mean arterial blood pressure. Conversely, more advanced gestational age and higher left ventricular output were significant positive influ-ences. Normal blood pressure was not synonymous with normal sys-temic flow. The varying systemic vascular resistance as well as other factors is critical in the determination of blood pressure in preterm infants.42
Oxygen administration in the future will be different. Although com-monly regarded as the fifth vital sign, pulse oximetry may only be part of the picture.43 Total Hgb is also important. An Hgb of 8 cannot carry as much oxygen as an Hgb of 16. It follows that oxygen carrying ca-pacity is much more important. We can now obtain non-invasive measurements of co-oximetry parameters formerly available only on high end blood gas equipment. Non-invasive measurement of frac-tional as well as functional oxygen saturations is essential to our un-derstanding of the complex interaction of oxygen moieties and other compounds that bind to Hgb.
Oxyhemoglobin + Carboxyhemoglobin + Methemoglobin = Functional Saturation
Oxygen delivery to tissues is not only influenced by the quantity of he-moglobin, but is also influenced by serum lactate levels, as well as elevated pCO2 levels, which commonly manifest as acidosis. Meas-ures of Fetal Hgb/Adult Hgb are also crucial. Oxygen release to the tissues is dependent on the level of saturation, and also on the type of predominating hemoglobin molecule. The difference manifests itself in the metamorphosis from fetal to adult physiology and begs the question: Is fetal or adult hemoglobin ideally suited to the rela-tively oxygen-rich circulation following birth of a premature infant?
Perfusion index (PI) and Pleth Variability Index (PVI) are also critically important. Perfusion index derives from the infrared component of the pulse oximetry signal PI Infrared component. PVI describes how the PI changes with respect to time. Importantly, these are both expres-sions that characterize the delivery of pulsatile blood to the more distal tissues. In a shock state or where there is a predicate for im-pending sepsis, where peripheral perfusion is altered, PI and PVI can give a valid estimate of the signal strength at the more distal tissues.34
The evidence that current monitoring of SpO2 alone has not suffi-ciently lowered the incidence of ROP or CLD even with meticulous monitoring and attention to oxygen titration suggests that other fac-tors must be integrated to have a major impact on these significant morbidities.)44,45,46 It has been proposed that "closed-loop" automatic

!!Manufactured by Discovery Laboratories, Inc. Warrington, PA 18976 08/2013 MK-012 Rev 01
"#$%&'()*!+!,-.,!/'01#23&%!456#&5*#&'307!891!!
BRIEF SUMMARY OF PRESCRIBING INFORMATION Please see package insert for full prescribing information.
INDICATIONS AND USAGE SURFAXIN® is indicated for the prevention of respiratory distress syndrome (RDS) in premature infants at high risk for RDS. CONTRAINDICATIONS None.
WARNINGS AND PRECAUTIONS Acute Changes in Lung Compliance Administration of exogenous surfactants, including SURFAXIN, can rapidly affect lung compliance and oxygenation. SURFAXIN should be administered only by clinicians trained and experienced in the resuscitation, intubation, stabilization, and ventilatory management of premature infants in a clinical setting with the capacity to care for critically ill neonates. Infants receiving SURFAXIN should receive frequent clinical assessments so that oxygen and ventilatory support can be modified to respond to changes in respiratory status.
Administration-Related Adverse Reactions Frequently occurring adverse reactions related to the administration of SURFAXIN include bradycardia, oxygen desaturation, reflux of drug into the endotracheal tube (ETT), and airway/ETT obstruction.
Increased Serious Adverse Reactions in Adults with Acute Respiratory Distress Syndrome (ARDS) Adults with ARDS who received lucinactant via segmental bronchoscopic lavage had an increased incidence of death, multi-organ failure, sepsis, anoxic encephalopathy, renal failure, hypoxia, pneumothorax, hypotension, and pulmonary embolism. SURFAXIN is not indicated for use in ARDS.
Clinical Trials Experience The efficacy and safety of SURFAXIN for the prevention of RDS in premature infants was demonstrated in a single randomized, double-blind, multicenter, active-controlled, multi-dose study involving 1294 premature infants (Study 1). Infants weighed between 600 g and 1250 g at birth and were 32 weeks or less in gestational age. Infants were randomized to received 1 of 3 surfactants, SURFAXIN (N = 524), colfosceril palmitate (N = 506), or beractant (N = 258). Co-primary endpoints were the incidence of RDS (defined as having a chest x-ray consistent with RDS and an FiO2 ! 0.30) at 24 hours and RDS-related mortality at 14 days. The primary comparison of interest was between SURFAXIN and colfosceril palmitate with the intent of demonstrating superiority. Beractant served as an additional active comparator. Compared to colfosceril palmitate, SURFAXIN demonstrated a statistically significant improvement in both RDS at 24 hours and RDS-related mortality through Day 14. A second multicenter, double-blind, active-controlled study involving 252 premature infants was also conducted to support the safety of SURFAXIN (Study 2). Infants weighed between 600 g and 1250 g and were less than 29 weeks in gestational age. Infants received 1 of 2 surfactants, SURFAXIN (N = 119) or poractant alfa (N = 124).
The safety data described below reflect exposure to SURFAXIN administered intratracheally to infants at a dose of 5.8 mL per kg (up to 4 doses) in either 4 aliquots (Study 1) or 2 aliquots (Study 2) in 643 premature infants.
Comparator surfactants colfosceril palmitate and beractant were administered at the recommended doses (5.0 and 4.0 mL per kg, respectively) while the first dose of poractant alfa administered (2.2 mL per kg) was less than the recommended dose of 2.5 mL per kg. Any subsequent doses of poractant alfa were at the recommended 1.25 mL per kg dose.
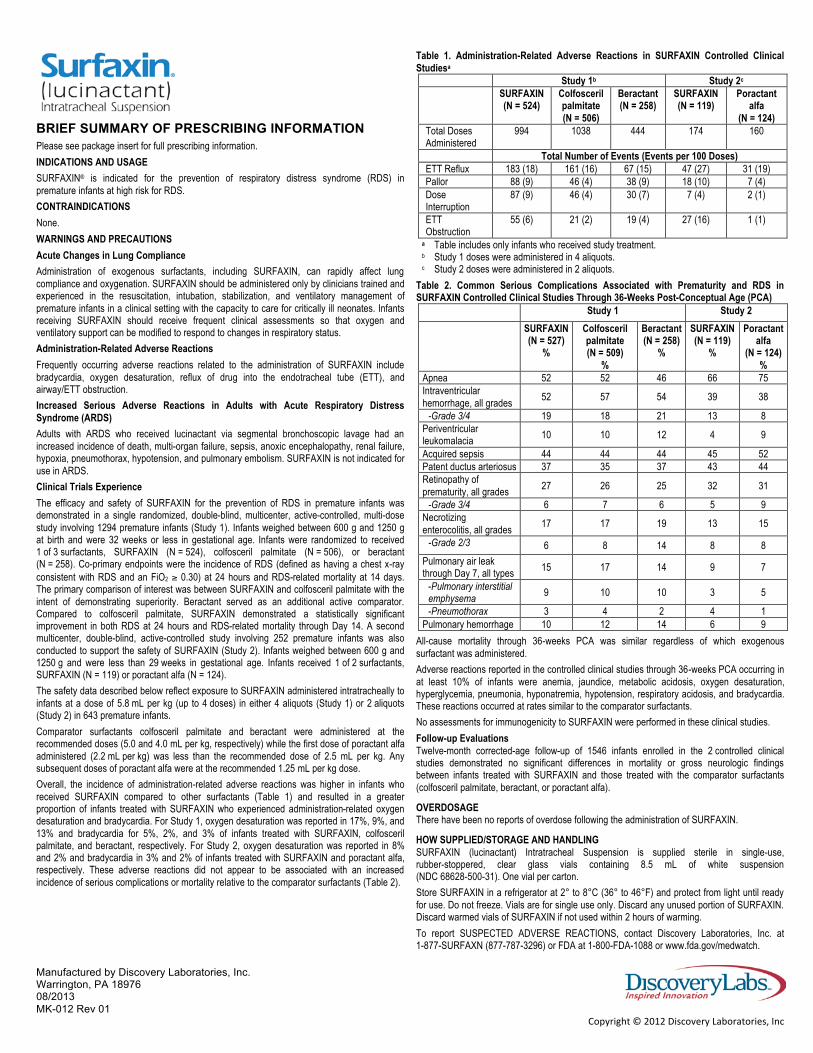
Overall, the incidence of administration-related adverse reactions was higher in infants who received SURFAXIN compared to other surfactants (Table 1) and resulted in a greater proportion of infants treated with SURFAXIN who experienced administration-related oxygen desaturation and bradycardia. For Study 1, oxygen desaturation was reported in 17%, 9%, and 13% and bradycardia for 5%, 2%, and 3% of infants treated with SURFAXIN, colfosceril palmitate, and beractant, respectively. For Study 2, oxygen desaturation was reported in 8% and 2% and bradycardia in 3% and 2% of infants treated with SURFAXIN and poractant alfa, respectively. These adverse reactions did not appear to be associated with an increased incidence of serious complications or mortality relative to the comparator surfactants (Table 2).
Table 1. Administration-Related Adverse Reactions in SURFAXIN Controlled Clinical Studiesa
Study 1b Study 2c SURFAXIN
(N = 524) Colfosceril palmitate (N = 506)
Beractant (N = 258)
SURFAXIN (N = 119)
Poractant alfa
(N = 124) Total Doses Administered
994 1038 444 174 160
Total Number of Events (Events per 100 Doses) ETT Reflux 183 (18) 161 (16) 67 (15) 47 (27) 31 (19) Pallor 88 (9) 46 (4) 38 (9) 18 (10) 7 (4) Dose Interruption
87 (9) 46 (4) 30 (7) 7 (4) 2 (1)
ETT Obstruction
55 (6) 21 (2) 19 (4) 27 (16) 1 (1)
a Table includes only infants who received study treatment. b Study 1 doses were administered in 4 aliquots. c Study 2 doses were administered in 2 aliquots.
Table 2. Common Serious Complications Associated with Prematurity and RDS in SURFAXIN Controlled Clinical Studies Through 36-Weeks Post-Conceptual Age (PCA)
Study 1 Study 2 SURFAXIN
(N = 527) %
Colfosceril palmitate (N = 509)
%
Beractant (N = 258)
%
SURFAXIN (N = 119)
%
Poractant alfa
(N = 124) %
Apnea 52 52 46 66 75 Intraventricular hemorrhage, all grades
52 57 54 39 38
-Grade 3/4 19 18 21 13 8 Periventricular leukomalacia 10 10 12 4 9
Acquired sepsis 44 44 44 45 52 Patent ductus arteriosus 37 35 37 43 44 Retinopathy of prematurity, all grades
27 26 25 32 31
-Grade 3/4 6 7 6 5 9 Necrotizing enterocolitis, all grades
17 17 19 13 15
-Grade 2/3 6 8 14 8 8
Pulmonary air leak through Day 7, all types
15 17 14 9 7
-Pulmonary interstitial emphysema
9 10 10 3 5
-Pneumothorax 3 4 2 4 1 Pulmonary hemorrhage 10 12 14 6 9
All-cause mortality through 36-weeks PCA was similar regardless of which exogenous surfactant was administered.
Adverse reactions reported in the controlled clinical studies through 36-weeks PCA occurring in at least 10% of infants were anemia, jaundice, metabolic acidosis, oxygen desaturation, hyperglycemia, pneumonia, hyponatremia, hypotension, respiratory acidosis, and bradycardia. These reactions occurred at rates similar to the comparator surfactants.
No assessments for immunogenicity to SURFAXIN were performed in these clinical studies.
Follow-up Evaluations Twelve-month corrected-age follow-up of 1546 infants enrolled in the 2 controlled clinical studies demonstrated no significant differences in mortality or gross neurologic findings between infants treated with SURFAXIN and those treated with the comparator surfactants (colfosceril palmitate, beractant, or poractant alfa).
OVERDOSAGE There have been no reports of overdose following the administration of SURFAXIN.
HOW SUPPLIED/STORAGE AND HANDLING SURFAXIN (lucinactant) Intratracheal Suspension is supplied sterile in single-use, rubber-stoppered, clear glass vials containing 8.5 mL of white suspension (NDC 68628-500-31). One vial per carton.
Store SURFAXIN in a refrigerator at 2° to 8°C (36° to 46°F) and protect from light until ready for use. Do not freeze. Vials are for single use only. Discard any unused portion of SURFAXIN. Discard warmed vials of SURFAXIN if not used within 2 hours of warming.
To report SUSPECTED ADVERSE REACTIONS, contact Discovery Laboratories, Inc. at 1-877-SURFAXN (877-787-3296) or FDA at 1-800-FDA-1088 or www.fda.gov/medwatch.
oxygen control (CLAC) in preterm infants is more accurate and precise compared with routine manual control of inspired oxy-gen and may reduce the incidence of retino-pathy of prematurity.47 To date large random-ized controlled trials using this technology have not been performed to unequivocally demonstrate its superiority. Although using the CLAC strategy may ultimately improve some outcomes by improved SpO2 control, without a thorough appreciation of the multi-ple components influencing tissue oxygena-tion including developing retinal vasculature, impact of "closed-loop" oxygen control, he-moglobin level (and type), cardiac output and/or index, and peripheral perfusion (PI/PVI); it is unlikely that a single isolated inter-vention will have a sustained impact on the occurrence of retinopathy or bronchopul-monary dysplasia. Newborns, and especially extremely prematurely born infants, are not physiologic replicas of long bygone creatures that thrived in relatively rich oxygen envi-ronments. The overwhelming evidence of excessive retinopathy and chronic lung dis-ease in the presence of inappropriate oxy-gen titration exemplifies this point. Although saturation is a correlate to oxygen carrying capacity, the challenges of fetal hemoglobin, anemia, and peculiarities of pH related oxy-gen release to tissue confound our best at-tempts to rely on oxygen saturation monitor-ing as an exclusive tool for assessing nor-moxemia. Normoxemia is also relative to the sampling interval. Spot recording of satura-tion does not have the value of monitoring a histogram for oxygen saturation over the course of a 24 hour period. The presumption, therefore, that an intended saturation differ-ence of 3% can result in meaningful differ-ences in retinopathy, chronic lung disease, a n d m o r t a l i t y i n t h i s c o n t e x t i s incorrect.48 SpO2 targets of >90% are insuffi-cient without knowledge and consideration of all parameters (e.g., Hgb, OC, CI, and PI). Only when we leverage the recent deploy-ment of non-invasive hemoglobin monitoring, along with perfusion index assessment to derive a realistic estimate of oxygen carrying and delivery capacity, will we be able to truly avoid the effects of insufficient and excessive oxygen delivery to our preterm infants.
References
1. Ernst Haeckel (1834-1919)--champion of Darwinism. JAMA : the journal of the American Medical Association 196, 449 (1966).
2. Olsson, L., Hossfeld, U. & Breidbach, O. Preface. Between Ernst Haeckel and the homeobox: the role of developmental biology in explaining evolution. Theory in b i o s c i e n c e s = T h e o r i e i n d e n B i o w i s s e n s c h a f t e n 1 2 8 , 1 - 5 , doi:10.1007/s12064-009-0060-5 (2009).
3. Akeson, N. & Bonapart, B. What is the current incidence of RLF. Pediatrics 58, 627 (1976).
4. Stark, D. J., Manning, L. M. & Lenton, L. Retrolental fibroplasia today. The Medical journal of Australia 1, 275-280 (1981).
5. Arnold, L. C. Retrolental fibroplasia (RLF): history and state of the art. Medical trial technique quarterly 23, 297-305 (1977).
6. Silverman, W. A. Retrolental Fibroplasia: A Modern Parable.nMonographs in Neona-tology (1980).
7. Bullard, S. R., Donahue, S. P., Feman, S. S., Sinatra, R. B. & Walsh, W. F. The de-creasing incidence and severity of retino-pathy of prematurity. Journal of AAPOS : the official publication of the American Association for Pediatric Ophthalmology and Strabismus / American Association for Pediatric Ophthalmology and Strabismus 3, 46-52 (1999).
8. Chen, M. L., Guo, L., Smith, L. E., Dam-mann, C. E. & Dammann, O. High or low oxygen saturation and severe retinopathy of prematur i ty: a meta-analysis. P e d i a t r i c s 1 2 5 , e 1 4 8 3 - 1 4 9 2 , doi:10.1542/peds.2009-2218 (2010).
9. Carlo, W. A., Bell, E. F., Walsh, M. C. & Network, S. S. G. o. t. E. K. S. N. N. R. Oxygen-saturation targets in extremely preterm infants. The New England journal o f m e d i c i n e 3 6 8 , 1 9 4 9 - 1 9 5 0 , doi:10.1056/NEJMc1304827 (2013).
10. Chow, L. C., Wright, K. W., Sola, A. & Group, C. O. A. S. Can changes in clinical practice decrease the incidence of severe retinopathy of prematurity in very low birth weight infants? Pediatrics 111, 339-345 (2003).
11. Lequime, J. Cardiac output estimation according to the Fick principle. Malattie cardiovascolari 7, 169-171 (1966).
12. Rose, J. C. The Fick principle and the cardiac output. Gp 14, 115-116 (1956).
13. Freeman, W. H. Vol. section 10.2 (ed Tymeoczko JL Berg JM, Stryer L) (2002).
14. Vidal Melo, M. F. Effect of cardiac output on pulmonary gas exchange: role of diffu-sion limitation with VA/Q mismatch. Respi-ration physiology 113, 23-32 (1998).
15. Rivkees, S. A. & Fine, B. P. The reliability of calculated bicarbonate in clinical prac-tice. Clinical pediatrics 27, 240-242 (1988).
16. Krummel, T. M. et al. Alveolar-arterial oxy-gen gradients versus the Neonatal Pul-monary Insufficiency Index for prediction of mortality in ECMO candidates. Journal of pediatric surgery 19, 380-384 (1984).
17. Oski, F. A. & Gottlieb, A. J. The interrela-tionships between red blood cell metabo-lites, hemoglobin, and the oxygen-equilibrium curve. Progress in hematology 7, 33-67 (1971).
18. Hess, W. [Aff inity of oxygen for hemoglobin--its significance under physio-logical and pathological conditions]. Der Anaesthesist 36, 455-467 (1987).
19. Oski, F. A., Gottlieb, A. J., Miller, W. W. & Delivoria-Papadopoulos, M. The effects of deoxygenation of adult and fetal hemo-globin on the synthesis of red cell 2,3-diphosphoglycerate and its in vivo conse-quences. The Journal of clinical investiga-tion 49, 400-407, doi:10.1172/JCI106249 (1970).
20. Zagol, K. et al. Anemia, apnea of prema-turity, and blood transfusions. The Journal of pediatrics 161, 417-421 e411, doi:10.1016/j.jpeds.2012.02.044 (2012).
21. Oski, F. A., Marshall, B. E., Cohen, P. J., Sugerman, H. J. & Miller, L. D. The role of the left-shifted or right-shifted oxygen-hemoglobin equilibrium curve. Annals of internal medicine 74, 44-46 (1971).
22. Bard, H. Postnatal fetal and adult hemo-globin synthesis in early preterm newborn infants. The Journal of clinical investiga-t i o n 5 2 , 1 7 8 9 - 1 7 9 5 , doi:10.1172/JCI107360 (1973).
23. Shiao, S. Y. & Ou, C. N. Accurate meas-urements of fetal hemoglobin for neonates w i th d i f fe rent ges ta t iona l ages. H e m o g l o b i n 3 0 , 4 1 9 - 4 3 5 , doi:10.1080/03630260600867883 (2006).
24. Shiao, S. Y. Effects of fetal hemoglobin on accurate measurements of oxygen satura-tion in neonates. The Journal of perinatal & neonatal nursing 19, 348-361 (2005).
25. Bell, E. F. When to transfuse preterm ba-bies. Archives of disease in childhood. Fetal and neonatal edition 93, F469-473, doi:10.1136/adc.2007.128819 (2008).
26. Stephenne, X. & Sokal, E. M. Hepatitis C in children and adolescents: mode of ac-quisition, natural history and treatment. Acta gastro-enterologica Belgica 65, 95-98 (2002).
27. Kirpalani, H. et al. The Premature Infants in Need of Transfusion (PINT) study: a randomized, controlled trial of a restrictive (low) versus liberal (high) transfusion threshold for extremely low birth weight infants. The Journal of pediatrics 149, 301-307, doi:10.1016/j.jpeds.2006.05.011 (2006).
28. Bell, E. F. Transfusion thresholds for pre-term infants: how low should we go? The Journal of pediatrics 149, 287-289, doi:10.1016/j.jpeds.2006.06.033 (2006).
29. Bell, E. F. et al. Randomized trial of liberal versus restrictive guidelines for red blood cell transfusion in preterm infants. P e d i a t r i c s 1 1 5 , 1 6 8 5 - 1 6 9 1 , doi:10.1542/peds.2004-1884 (2005).
30. March, M. I., Hacker, M. R., Parson, A. W., Modest, A. M. & de Veciana, M. The ef-fects of umbilical cord milking in extremely
NEONATOLOGY TODAY ! www.NeonatologyToday.net ! August 2014 9
“...current monitoring of SpO2 alone has not sufficiently lowered the incidence of ROP or CLD....”
preterm infants: a randomized controlled trial. Journal of perinatology : official jour-nal of the California Perinatal Association 33, 763-767, doi:10.1038/jp.2013.70 (2013).
31. Rabe, H. et al. Milking compared with delayed cord clamping to increase placen-tal transfusion in preterm neonates: a randomized controlled trial. Obstetrics a n d g y n e c o l o g y 11 7 , 2 0 5 - 2 11 , doi:10.1097/AOG.0b013e3181fe46ff (2011).
32. McDonald, S. J. & Middleton, P. Effect of timing of umbilical cord clamping of term infants on maternal and neonatal out-comes. The Cochrane database of sys-t e m a t i c r e v i e w s , C D 0 0 4 0 7 4 , doi:10.1002/14651858.CD004074.pub2 (2008).
33. Genzel-Boroviczeny, O., Strotgen, J., Har-ris, A. G., Messmer, K. & Christ, F. Or-thogonal polarization spectral imaging (OPS): a novel method to measure the microcirculation in term and preterm in-fants transcutaneously. Pediatr ic r e s e a r c h 5 1 , 3 8 6 - 3 9 1 , doi:10.1203/00006450-200203000-00019 (2002).
34. De Felice, C. et al. Early dynamic changes in pulse oximetry signals in pre-term newborns with histologic chorioam-nionitis. Pediatric critical care medicine : a journal of the Society of Critical Care Medicine and the World Federation of Pediatric Intensive and Critical Care S o c i e t i e s 7 , 1 3 8 - 1 4 2 , doi:10.1097/01.PCC.0000201002.50708.62 (2006).
35. Cresi, F. et al. Perfusion index variations in clinically and hemodynamically stable preterm newborns in the first week of life. Italian journal of pediatrics 36, 6, doi:10.1186/1824-7288-36-6 (2010).
36. Zaramella, P. et al. Foot pulse oximeter perfusion index correlates with calf muscle perfusion measured by near-infrared spectroscopy in healthy neonates. Journal of perinatology : official journal of the Cali-fornia Perinatal Association 25, 417-422, doi:10.1038/sj.jp.7211328 (2005).
37. Saugstad, O. D. & Aune, D. Optimal oxy-genation of extremely low birth weight infants: a meta-analysis and systematic review of the oxygen saturation target studies. Neonatology 105, 55-63, doi:10.1159/000356561 (2014).
38. Schmidt, B., Whyte, R. K. & Roberts, R. S. Trade-Off between Lower or Higher Oxygen Saturations for Extremely Pre-term Infants: The First Benefits of Oxy-gen Saturation Targeting (BOOST) II Trial Reports Its Primary Outcome. The Journa l o f ped ia t r ics 165, 6-8 , do i :10 .1016 / j . j peds .2014 .03 .004 (2014).
39. Network, S. S. G. o. t. E. K. S. N. N. R. et al. Target ranges of oxygen saturation in extremely preterm infants. The New England journal of medicine 362, 1959-
1969, doi:10.1056/NEJMoa0911781 (2010).
40. Di Fiore, J. M. et al. Low oxygen saturation target range is associated with increased incidence of intermittent hypoxemia. The Journal of pediatrics 161, 1047-1052, doi:10.1016/j.jpeds.2012.05.046 (2012).
41. Stark, A. R. et al. Death or neurodevelop-mental impairment at 18 to 22 months corrected age in a randomized trial of early dexamethasone to prevent death or chronic lung disease in extremely low birth weight infants. The Journal of pediatrics 1 6 4 , 3 4 - 3 9 e 3 2 , doi:10.1016/j.jpeds.2013.07.027 (2014).
42. Kluckow, M. & Evans, N. Relationship between blood pressure and cardiac out-put in preterm infants requiring mechani-cal ventilation. The Journal of pediatrics 129, 506-512 (1996).
43. Mower, W. R., Sachs, C., Nicklin, E. L. & Baraff, L. J. Pulse oximetry as a fifth pedi-atric vital sign. Pediatrics 99, 681-686 (1997).
44. Castillo, A, Deulofaut, R., Oritiz, A, Sola, A. Acta Paediatr 2011, 100(2): 186-192.
45. Schmidt B, Whyte, RK, Asztalos, EV, Moddermann D, Poets C, Rabi, Y, So-limano, A, Roberts RS, : Canadian Oxyten Trial (COT) Group JAMA 2013 May 22, 309(20): 2111-20.
46. Bancalari E, Claure N Oxygen Targets and Outcomes in Premature Infants. JAMA 2013 May 22 309(20) 2161.
47. Hallenberger A, Poets CF, Horn W, Sey-land A, Urschiz MS CLAC Study Group. Pediatrics 2014 Feb 133(2): e379-85
48. Shiao, S. Y. & Ou, C. N. Validation of oxygen saturation monitoring in neo-nates. American journal of critical care : an official publication, American Associa-tion of Critical-Care Nurses 16, 168-178 (2007).
NT49.
NEONATOLOGY TODAY ! www.NeonatologyToday.net ! August 2014 10
T. Allen Merritt, MD, MHAProfessorDivision of Neonatal MedicineDepartment of PediatricsLoma Linda University Children’s HospitalLoma Linda, CA USA
Corresponding Author
Mitchell Goldstein, MDAssociate ProfessorDivision of Neonatal MedicineDepartment of PediatricsLoma Linda University Children’s HospitalLoma Linda, CA USAPhone: 909.558.7448Fax: 909.558.0298
N E O N A T O L O G Y T O D A Y
CALL FOR CASES AND OTHER ORIGINAL ARTICLES
Do you have interesting research results, observations, human interest stories, re-
ports of meetings, etc. to share?
Submit your manuscript to: [email protected]
• Title page should contain a brief title and full names of all authors, their professional degrees, and their institutional affiliations. The principal author should be identified as the first author. Contact information for the principal author including phone number, fax number, email address, and mailing address should be included.
• Optionally, a picture of the author(s) may be submitted.
• No abstract should be submitted.• The main text of the article should be written
in informal style using correct English. The final manuscript may be between 400-4,000 words, and contain pictures, graphs, charts and tables. Accepted manuscripts will be published within 1-3 months of receipt. Abbreviations which are commonplace in pediatric cardiology or in the lay literature may be used.
• Comprehensive references are not required. We recommend that you provide only the most important and relevant references using the standard format.
• Figures should be submitted separately as individual separate electronic files. Num-bered figure captions should be included in the main Word file after the references. Captions should be brief.
• Only articles that have not been published previously will be considered for publication.
• Published articles become the property of the Neonatology Today, and may not be published, copied or reproduced elsewhere without permission from Neonatology Today.

Medication Does Not Lower Risk of Fungal Infection, Death Among ELBW Infants
Use of the antifungal medication fluconazole for six weeks for Extremely Low Birth-Weight infants (ELBW) did not significantly reduce the risk of death or invasive candidiasis, a serious infection that occurs when candida (a type of fungus) enters the bloodstream and spreads through the body, according to a study in the May 7th issue of JAMA, a theme issue on child health. This issue was being released early to coincide with the Pediatric Academic Societies Annual Meeting.
Invasive candidiasis is an important cause of infection in premature infants; despite treat-ment with antifungal therapy, invasive candidi-asis has serious effects on premature infants, including severe neurodevelopmental impair-ment and death. Current recommendations include the use of fluconazole for prevention of this infection for infants with a birth weight of less than 1,000 grams (2.2 lbs.) who receive care in neonatal intensive care units (NICUs). However, most NICUs in the United States and the European Union have not uniformly adopted preventive use of fluconazole, based on controversies regarding high-risk patients, resistance, and safety, according to back-ground information in the article.
Daniel K. Benjamin Jr., MD, PhD, of Duke Uni-versity, Durham, NC, and colleagues evaluated the efficacy and safety of fluconazole in pre-venting death or invasive candidiasis in ex-tremely low birth-weight infants (weighing less than 750 grams [1.7 lbs.] at birth). The study included 361 infants from 32 NICUs in the United States who were randomly assigned to receive either fluconazole (6mg/kg of body weight) or placebo twice weekly for 42 days.
The primary composite or endpoint of death or invasive candidiasis by study day 49 was not statistically different between the 2 groups (flu-conazole, 16% vs placebo, 21%). The per-centage of infants who died prior to study day 49 was not different between the groups (14% vs 14%). Fewer infants developed definite or probable invasive candidiasis in the flucona-zole (3%) vs in the placebo group (9%).
"Fluconazole prophylaxis compared with pla-cebo was not associated with a statistically
significant difference in the composite primary end point—death or definite or probable inva-sive candidiasis— although it was associated with a statistically significant reduction in the incidence of definite or probable candidiasis alone. This study adds new evidence regard-ing the efficacy of fluconazole prophylaxis, but raises the question of whether prevention of invasive candidiasis translates into substantial improvements in the outcomes of prematurity."
"Based on both the results of our study in NI-CUs with a low incidence of invasive candidia-sis, and previous prophylaxis trials in high-incidence NICUs, the routine use of flucona-zole prophylaxis should be limited to units with moderate-to-high incidence of invasive candid-iasis. However, additional research is needed to precisely define the incidence at which the benefits of fluconazole prophylaxis outweigh the risks," the authors write.
Dr. James Padbury Receives Mentor of the Year Award from Eastern Society for Pediatric Research James F. Padbury, MD, Pediatrician-in-Chief and Chief of Neonatal/Perinatal Medicine at Women & Infants Hospital of Rhode Island and the Wil-liam and Mary Oh-William and Elsa Zopfi Profes-sor of Pediatrics for Perinatal Research at The Warren Alpert Medical School of Brown Univer-sity, was recently presented with the Mentor of the Year Award at the 26th Annual Meeting of the Eastern Society for Pediatric Research. The Eastern Society for Pediatric Research, part of the Society for Pediatric Research of the American Pediatric Society, fosters the research and career development of investigators en-gaged in the health and well-being of children and youth. The Society also encourages young investigators engaged in research that is of benefit to children. This is accomplished by pro-viding a forum for interchange of ideas and an opportunity for these young investigators to present their work. Every year, one Mentor of the Year Award is presented to an outstanding teacher who has had a major impact on devel-oping research skills in trainees and launching productive research careers. Dr. Padbury’s research awards include: a pro-gram project grant in perinatal biology, estab-lishment of T-32 supported perinatal biology training at Women & Infants Hospital, a grant
from Health Resources and Services Admin-istration for construction of the Kilguss Re-search Institute in Providence, two Center of Biomedical Research Excellence Awards (COBRE) http://med.brown.edu/COBRE/ for Perinatal Biology, and a shared equipment grant for an Illumina high throughput DNA se-quencing platform for the Genomics Core.
Medical News, Products & Information
Help Neonatology Today Go Green!How: Simply change your subscription from print to the New Digitally Enhanced HTML5 version. Benefits Include: Receiving your issue quicker; ability to copy text and pictures; hot links to: authors, recruitment ads, sponsors and meeting websites, plus the issue looks exactly the same as the print edition.Interested? Simply send an email to [email protected], putting “Go Green” in the subject line, and your name, titles, organization and address in the body of the email.
NEONATOLOGY TODAY ! www.NeonatologyToday.net ! August 2014 11
NEONATOLOGY TODAY© 2014 by Neonatology Today ISSN: 1932-7129 (print); 1932-7137 (online). Published monthly. All rights reserved.
Publication Headquarters8100 Leaward WayPO Box 444Manzanita, OR 97130 USAwww.NeonatologyToday.net
Editorial and Subscription Offices16 Cove Rd, Ste. 200Westerly, RI 02891 USA
Publishing Management• Tony Carlson, Founder, President & Senior
Editor - [email protected]• Richard Koulbanis, Group Publisher & Editor-in-
Chief - [email protected]• John W. Moore, MD, MPH, Group Medical
Editor - [email protected] Editorial BoardDilip R. Bhatt, MD; Barry D. Chandler, MD; Anthony C. Chang, MD; K. K. Diwakar, MD; Willa H. Drummond, MD, MS (Informatics); Philippe S. Friedlich, MD; Mitchell Goldstein, MD; Lucky Jain, MD; Patrick McNamara, MD; David A. Munson, MD; Michael A. Posencheg, MD; DeWayne Pursley, MD, MPH; Joseph Schulman, MD, MS; Alan R. Spitzer, MD; Dharmapuri Vidysagar, MD; Leonard E. Weisman, MD; Stephen Welty, MD; Robert White, MD; T.F. Yeh, MD
FREE Subscription - Qualified Professionals
Neonatology Today is available free to qualified medical professionals worldwide in neonatology and perinatology.
Send an email to: [email protected]. Include your name, title(s), organization, address, phone, fax and email. Sponsorships and Recruitment Advertising
For information on sponsorships or recruitment advertising call Tony Carlson at: 301.279.2005 or send an email to [email protected]
By Tony Carlson, Senior Editor, CCT

LK1119 NEW 2/14 ©2014 Mead Johnson & Company, LLC
Exceptional nutrition to nourish premature infants when they need it most
• Nutritional products that help meet ESPGHAN guidelines1 for premature infants
• Portfolio of products proven to support better growth in both formula-fed and breastfed infants born prematurely2,3*
• Expert-recommended level of DHA1
Enfamil Premature Post-discharge Nutrition
For that once in a lifetime opportunity to
make a differenceTrust clinically proven Enfamil® to help you leave a lasting impression on infants’ growth and development
Enfamil® Premature Nutrition
Premature Nutrition
ESPGHAN = European Society of Paediatric Gastroenterology, Hepatology and Nutrition; HMF = human milk fortifier
References: 1. Agostoni C et al. J Pediatr Gastroenterol Nutr. 2010;50:85-91. 2. Clandinin MT et al. J Pediatr. 2005;146:461-468. 3. Moya F et al. Pediatrics. 2012;130:e928-e935.
Enfamil Premature Hospital Nutrition
* vs control discontinued Enfamil formulas without DHA and ARA (formula-fed infants) and vs Enfamil powder HMF (breastfed infants)