negotia 2 2008 - babeș-bolyai university · 2014. 11. 26. · baroque, rococo and art nouveau,...
TRANSCRIPT

NEGOTIA2/2008

ANUL LIII 2008
S T U D I A
UNIVERSITATIS BABE Ş – BOLYAI
NEGOTIA
2
Desktop Editing Office: 51ST B.P. Haşdeu, Cluj-Napoca, Romania, phone + 40 264-40.53.52
CUPRINS – CONTENT – SOMMAIRE – INHALT
ADINA LETI łIA NEGRUŞA, OANA ADRIANA GICĂ, Analysis of Potential Sme’s Role for Developing Tourism in Transylvania ........................3
ŠÁRKA BRYCHTOVÁ, SPA Healing Sources in Czech Republic .....................19
TIBERIU CRISTIAN AVRAMESCU, Romanian Tourism: A Regional Approach ......................................................................................................43
PARTENIE DUMBRAVĂ, IOAN POP, ENIKİ FAZAKAS, JOZSEF FAZAKAS, LUDOVICA BREBAN, The Environmental Impact of Beer Production.....................................................................................................61
MAGDALENA VORZSAK, CARMEN MARIA GUT, Constraints Concerning Investment And Participation In Professional Training In The Companies From The Romanian Manufacturing Industry ................................................73
MANOLE VELICANU, GHEORGHE MATEI, Decision Support Systems: Present and Future Trends .............................................................................81
MIHAELA DRAGAN, ZENOVIA CRISTIANA POP, Criteria for Product Quality in the Frame of Intercultural Market Strategies of Small and Medium Sized Enterprises - A Brief Review of Literature - ...........................95
CRISTINA SILVIA NISTOR, CRINA IOANA FILIP, ADELA DEACONU, Derivative Instruments – Alternatives to Cover the Foreign Exchange Rate in the Case of Import-Export Operations - Accounting Approach for Romania............ 107
ADRIAN GROSANU, PAULA RAMONA RACHISAN, The Implementation of Profit Centres Inside an Economic Entity ................................................ 125
CRISTINA CURUłIU, Methods of Portfolio Management. - A Review Of Literature - .................................................................................................. 135

STUDIA UNIVERSITATIS BABEŞ-BOLYAI, NEGOTIA, LIII, 2, 2008
ANALYSIS OF POTENTIAL SME’S ROLE FOR DEVELOPING
TOURISM IN TRANSYLVANIA
ADINA LETITIA NEGRUSA 1, OANA ADRIANA GICA 2
ABSTRACT . The tourism sector is probably the only service sector that provides concrete and strong trading opportunities for all nations, regardless of their level of development. However, it is also a sector where there is clearly an uneven distribution of benefits, which is threatening the social, economic and environmental sustainability of tourism in some developing countries. For many developing countries tourism is a fundamental sector of their economy and for others tourism is only a source of foreign currency and employment. The paper analyzes the current stage of development of tourism sector from Romania in general, and from Transylvania, in particular. This research intended also to find out the most specific features of this sector, the strengths and weaknesses identified here. Due to the fact that rural tourism is one of the fast developing fields in the Eastern European countries, the paper identifies which are the most important areas from Transylvania with a high potential in this field. Also based on the SME’s development the paper tried to select the most important steps which should be taken in the tourism sector in order to increase its role in the Romanian economy and for attracting new customers for this offers. Keywords: SME’s, tourism, sustainable development, strategies 1. INTRODUCTION
The tourism industry is a sector which affects today the entire society in many ways and has a profound impact on our social, cultural and economic life. Central and Eastern Europe (CEE) has registered a spectacular increase in the number of visitors, starting with the 90’s, leading to a healthy growth of tourism revenues. Following the fall of communism, countries in the CEE region re-opened their borders and thus re-entered the tourism circuit; they became destinations of interest for foreign tourists, especially coming from neighbouring European countries. Furthermore, the region’s stability, economic growth, sizeable investments in the tourism sector, accession to the European Union of some countries and the upcoming accession of other countries contributed to the recovery of the sector, over the past
1 Associate Professor, PhD, Universitatea Babes-Bolyai, Facultatea de Business, Cluj-Napoca, Romania, [email protected]
2 Teaching assistant, Universitatea Babes-Bolyai, Facultatea de Business, Cluj-Napoca, Romania, [email protected]

ADINA LETITIA NEGRUSA, OANA ADRIANA GICA
4
15 years. All of these factors are expected to continue to support growth during the following years. According to a study carried out by the World Tourism Organization, the number of tourists who visited Central and Eastern Europe countries increased from 71.2 million in 2000 to 92.3 million in 2005, higher than the Europe-wide and worldwide increase, an illustration of the growing interest for the CEE region.
Romania has a harmonious, diverse landscape, as well as rich tradition and culture. The country could be considered as one of the most beautiful and resourceful places in Europe. Despite this, Romania’s tourism potential is largely unexplored as WTTC (2006) highlighted in its report. The evolution of tourist arrivals confirms this statement (see Figure 1).
1432
1294
1185
848
856
766
762
833
810
795
867
915
999
1105
1359
1430
5805
5639
5057
4847
4875
4920
510955
52
572765
957070
700575
668015
9603
1229
7
0
2000
4000
6000
8000
10000
12000
14000
199
0
199
1
199
2
199
3
199
4
199
5
199
6
199
7
199
8
199
9
200
0
200
1
200
2
200
3
200
4
200
5
(thousans)
total
foreign tourists
Source: National Institute of Statistics, Annual Statistic Yearbook 2006
Fig. 1. Evolution of tourist arrivals in Romanian accommodation establishments
Romanian tourism has been traditionally centred on the resorts of the
Black Sea coast (WTTC, 2006), where the concentration of bed places represents 41,69% of the total bed places at the country level (NIS, average figure 1993-2005, www.insse.ro). Due to seasonality, the Black Sea coast attracts only 13.18% of total tourist arrivals (NIS, average figure 1993-2005, www.insse.ro).
Other popular destinations, mainly among domestic tourists, are mountain ski resorts and spa resorts. All these resorts combine 28.10% of country total bed places with 26.22% of total tourist arrivals (NIS, average figures 1993-2005, www.insse.ro). Important investments are needed to increase the attractiveness of mountain and spa resorts through modern and various leisure facilities, and new tourist products centred on nature-based tourism and the new trend of wellness lifestyle.

ANALYSIS OF POTENTIAL SME’S ROLE FOR DEVELOPING TOURISM IN TRANSYLVANIA
5
During the same period, 1993-2005, urban tourism became an important part of Romanian travel & tourism sector due to the growing trend in business tourism. The main 40 cities of Romania (county residences) attracted 46.57% of total tourist arrivals (NIS, average figure 1993-2005, www.insse.ro).
Looking briefly at the cultural tourism potential, Romania has over 27 000 locations grouped under different categories, and 151 monuments and archaeological sites of special value (www.mturism.ro). Besides Romanic, Gothic, Renaissance, Baroque, Rococo and Art Nouveau, Romania owns its specific architecture, the Brancovenesc style found mainly in Wallachian castles, palaces and houses. Moldova also has specific architectural traits. Romania can offer a great insight into Europe’s past and present, through the many castles, palaces and houses of which some are as old as the 12th century, through the varied old Orthodox churches, monasteries and cathedrals that provide glimpses of ages of belief, and through the Catholic, Calvinist, and Lutheran churches and cathedrals mainly placed in Transylvania. All of these contribute to the area’s great potential for religious tourism.
Despite of these the balance of travel and tourism account in Romania’s balance of payments has been negative science 1995. It became positive only in 2002 and 2005. In its country report for Romania WTTC forecasts that the country could achieve an annualized real growth of 6, 7% in travel and tourism sector in the next years. But for achieving these goals, infrastructure must be developed, human working capital needs improvements and quality of services must increase.
2. A GENERAL OVERVIEW OF TRANSYLVANIA TOURISM
Transylvania is located in the Central part of Romania and is surrounded by the Carpathian Mountains. It is one of the best-known areas in Romania. The historical region covers 16 nowadays counties, which include nearly 103600 km2, and 3 of the 8 regions of development, created by the National Agency for Regional Development, in order to promote a better and a more appropriate development of each part of the country.
Transylvania is famous for its rich multiethnic heritage as a mix of Germans, Hungarians and Romanians. Numerous ancient sites with medieval fortress and castles can be found in Transylvania region. Some of the sites that attract the most tourists are the Bran Castle (known as Dracula Castle), the citadel of Sighisoara or the medieval towns as Brasov and Sibiu. The foreign tourists, especially European ones, prefer Transylvanian cultural product because it is easier to perceive and understand. They can recover their historic and cultural heritage. From this point of view, Transylvania is a sample of European cultural heritage. Maramures, in the North-western region of Transylvania, is like stepping back in time. The people dress in colourful traditional costumes and maintain rich centuries-old traditions of festivals and religious celebrations.

ADINA LETITIA NEGRUSA, OANA ADRIANA GICA
6
Fig. 2. Transylvania region Our intention was to make an analytical presentation of the development of
tourism sector in Transylvania and the potential of this region for evaluating the strengths and weaknesses of this sector.
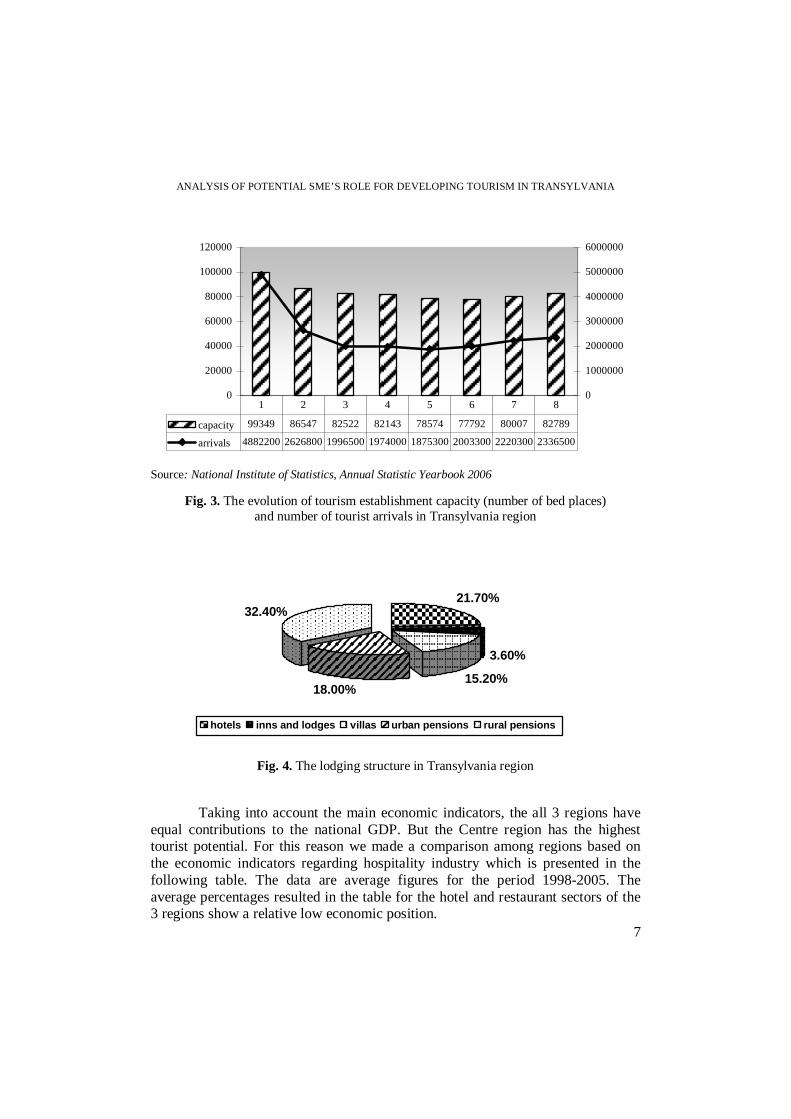
In order to evaluate the tourism development of this region first of all we analysis the evolution of accommodation capacity during in the last 15 years and the number of tourist arrivals. In 2005 from the total national accommodation capacity, as number of beds, almost 30% it was located in Transylvania region and taking into account the number of tourist establishments here could be identified almost 43,5% from the total. These results show the importance of this region for developing the tourism sector in Romania. The increasing number of tourist arrivals from 2003 until now, with an average of 7% each year, was produced mainly by the Centre region increase, and the accommodation capacity increase is a result mainly due to the North-West region increase of capacity.
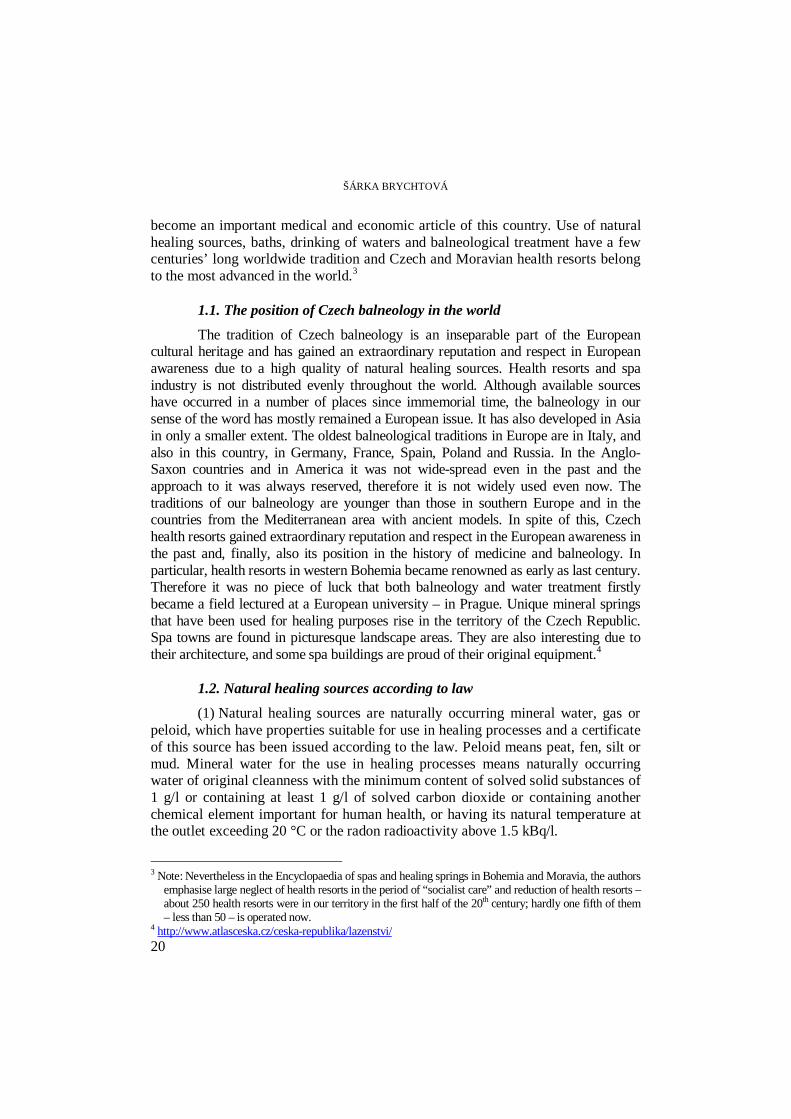
We analysed also the structure of lodging capacity from Transylvania region in order to compare with the national structure and for identifying the main types of establishments developed here. The information from annual statistical yearbook analysed in figure 4 generate the following result: the rural boarding houses represent the most important type of lodging capacity for Transylvania. This result could be explained based on the development of rural tourism in the main parts of Transylvania, like: Bran-Moeciu, Maramures and Apuseni. As a consequence, even if the region includes important cities, well developed from economic and business point of view, these cities being Cluj, Timişoara, Brasov and Sibiu, the hotel lodging capacity came into the second place. This sector it is supported by the number of urban pensions and villas, which play an important role for the development of urban tourism.
ANALYSIS OF POTENTIAL SME’S ROLE FOR DEVELOPING TOURISM IN TRANSYLVANIA
7
0
20000
40000
60000
80000
100000
120000
0
1000000
2000000
3000000
4000000
5000000
6000000
capacity 99349 86547 82522 82143 78574 77792 80007 82789
arrivals 4882200 2626800 1996500 1974000 1875300 2003300 2220300 2336500
1 2 3 4 5 6 7 8
Source: National Institute of Statistics, Annual Statistic Yearbook 2006
Fig. 3. The evolution of tourism establishment capacity (number of bed places) and number of tourist arrivals in Transylvania region
21.70%
3.60%
15.20%18.00%
32.40%
hotels inns and lodges villas urban pensions rural pensions
Fig. 4. The lodging structure in Transylvania region Taking into account the main economic indicators, the all 3 regions have
equal contributions to the national GDP. But the Centre region has the highest tourist potential. For this reason we made a comparison among regions based on the economic indicators regarding hospitality industry which is presented in the following table. The data are average figures for the period 1998-2005. The average percentages resulted in the table for the hotel and restaurant sectors of the 3 regions show a relative low economic position.

ADINA LETITIA NEGRUSA, OANA ADRIANA GICA
8
Table 1 Comparison of the economic importance of hospitality industry
on regional bases
Region Contribution to GDP
(%sector)
Active companies
(% sector)
Turnover of active
companies (% sector)
Investment made by active
companies (% sector)
Average number of employees
(thou) Centre 14.93 14.87 12.62 13.88 14 North-West 10.34 14.04 10.26 8.12 11 West 8.95 11.94 8.98 6.40 10
Source: National Institute of Statistics, Annual Statistic Yearbook 2006 The value of net investments in Hotel and Restaurants section which grew
for 8.5 times from 2000 until 2005 in Romania proves without doubt that tourism is a sector with a great potential of development. Although the weight of investments in Hotel and Restaurants sector in total investments from 2000 until 2003 in the North Western Region remained constant around 1.35%, their value grew for 3.32 times from 174 to 578 billions lei.
Table 2
Net Investments by active companies in Romanian hospitality industry (million RON)
2000 2001 2002 2003 2004 2005
Total 12498 20419.5 27173.5 35851.2 44869.9 54566.0 Hotel and Restaurants 109.8 274.6 331.5 481.5 750.4 936.6
Source: National Institute of Statistics, Annual Statistic Yearbook 2006 We were interested to determine the potential for tourism development by
all of 3 regions from Transylvania. For this reason we analyze the existing conditions and we try to identify the main strength and weaknesses of each region.
The tourism potential of the Centre region is higher due to the fact that it is the home to a large number of mountain and ski resorts, Poiana Brasov and Predeal, and there are some of the most popular areas for rural tourism, Bran and Moeciu. Another important reason for the popularity of these areas is the fact that they are accessible by car, train and bus and the short driving distance from Bucharest. From the cultural tourism point of view, Centre region plays an important role through the UNESCO heritage sites which include the strengthened churches of Brasov, Sibiu, Harghita and Alba county and the historic centre of Sighisoara, Mures county, which are important tourist attractions.

ANALYSIS OF POTENTIAL SME’S ROLE FOR DEVELOPING TOURISM IN TRANSYLVANIA
9
The North-West region have a considerable tourism potential through the SPA and mountain resorts, archaeological sites, natural protected areas and appropriate conditions for leisure tourism, but registers a lower level of tourism infrastructure development and for this reason there are less popular. There are also many ethno-folklore areas that provide the sources for allowing the development of rural tourism in Maramures, Cluj and Bihor counties. The most important areas with a great contribution to the tourism sector are Cluj, Baile Felix and Maramures.
West region has a varied tourist potential, with special endowments for rural and agro tourism, Caras-Severin, as well as for cultural tourism, Sarmisegetusa and medieval town of Timisoara or Deva. There are important sources for SPA tourism in Baile Herculane, Moneasa, Lipova, Buzias, but these are not well valued and developed and for this reason unknown at the national or international level.
Table 3
The analysis of internal regional tourism resources
Strenghts Weaknesses Center Region
- A high touristic potential that can be used during the hole year due to the mountains, traditions, architectural and historical monuments - Touristic and balneary modernized resorts (Poiana Braşov, Predeal, Păltini ş, Sovata, Băile Tuşnad) - Many protected areas, national parks, nature monuments and reservations - A large touristic capacity
- The touristic resources undercapitalized - Touristic thematic networks at the level of the region are poorly developed or inexistent - Low quality of touristic services and information; - The lack of touristic thematic itineraries that capitalize the natural potential; - The regional tourism is not defined as touristic product despite the homogeneous resources and existent patrimony
North West Region - The increase of tourits’ number in the region - The offer of touristic accommodation establishments - The diversification of touristic offer by sectors - The high value of the indices of net using the touristic accommodation capacity - The development of the SPAs in the region - An important potential for niche tourism - The region is an entrance gate from European Union
- The poor diversification of the accommodation infrastructure for rural and youth tourism (agro- tourism, hostels and other low cost establishments) - The lack of touristic products and brands’ sustaining - The low weight of tourism in the regional GDP - The poor development of niche tourism - The lack of funds for investment projects - Insufficient or inexistent promotion and information structure - The low level of specialization of the human resources in tourism

ADINA LETITIA NEGRUSA, OANA ADRIANA GICA
10
- Higher education for hospitality industry in the Region
- The degradation of the cultural patrimony - The decreasing employment rate in tourism
West Region
• The existence of high complexity of natural resources areas • The region possesses an important weight on transit and business tourism market • Traditional touristic centers • The region represents a traditional market for the transfrotier tourism • There are numerous historical and cultural patrimony objectives, industrial sites, barrier lakes, vineyards • The existence of traditional SPAs • Vast protected areas
- The lack of a unitary system for the administration of the protected areas that would allow touristic activities in this areas - Insufficient information centers and touristic maps - The infrastructure that allows the access to the touristic objectives is poorly developed - A small number of specialized human resources in this field - Low quality touristic products offer - The weak representation of niche tourism - Quality price ration is inadequate - The lack of rural population education regarding the possibility of engaging in rural tourism activities and the absence of touristic packages in this segment
Transylvania has an important potential for developing different types of
tourism, and each region can contribute with a specific area for this purpose. We intended also to highlight which are the main differences among regions based on their tourism product.
First of all we take it into account the cultural tourism and we analyse the number of historical monuments on regional basis. A large concentration of them resulted to be located in Transylvania in the following counties: Mures, Sibiu, Cluj, Brasov, Covasna and Hunedoara. In Romania there are 7 heritage sites which are included in the UNESCO patrimony, as are presented in the figure 5, with a set of attraction objectives, and more than half are located in regions from Transylvania.
Secondly, the natural landscape is rich and offers multiple opportunities. For example from a total of 14 natural caves 9 are situated in 2 counties from Transylvania: Bihor and Alba. Also the natural parks and biosphere or scientific reservation, protected natural areas have a great representation in Transylvania through Maramures mountains, Lunca Muresului, Arieseni-Apuseni mountains and Tara Hategului, generated the potential for eco and active tourism. From a number of 9 Riding Holiday centers 8 were developed in the centre of Transylvania, in Cluj, Mures and Brasov.

ANALYSIS OF POTENTIAL SME’S ROLE FOR DEVELOPING TOURISM IN TRANSYLVANIA
11
Fig. 5. The UNESCO heritage sites located in the country
An important event that highlights the Transylvania as tourism destination
in the international market was the Sibiu - European Capital of Culture in 2007. This program beneficiate of 3 years of continuous budgeting by different ministries, for example in 2007 were allocated 5, 7 millions euro by the Romanian Ministry of Culture and Religious Affairs. The program through an impressive media promoting campaign targeted a number of 750000 arrivals tourists, from which 500000 foreign tourists. After a period of neglect, the event from Sibiu turned lights on Romania became in 2007 on the fabulous 50 destinations from the world. This cultural event transformed Transylvania into a cultural destination by excellence.
3. The strengths and vulnerability of the tourism SMEs
The Romanian tourism is largely dominated by SMEs, with more than 99% of the firms employing fewer than 250 people. Putting aside the fact that in many remote and rural areas, as well as urban locations, tourism is seen to be an important part of the economic agenda, the arguments advanced in favour of targeting small tourism businesses are similar to those for SMEs in general, namely:
� Their ability to create new jobs at a time when major operators are downsizing � Improvements of working environments � Diversified and flexible structure � Stimulating competition � Their creativity in introducing new services

ADINA LETITIA NEGRUSA, OANA ADRIANA GICA
12
Table 4 Index number of SME’s growth by service activities sub sectors and size class (%)
Source: National Institute of Statistics, Annual Statistic Yearbook 2006
Based on the data referring to 1999-2003 period, we concluded that the number of SMEs in tourism sector grew with 1% for micro-enterprises, 35.7% for small enterprises and with 34.1 % for medium enterprises.
We analyze also the structure of hospitality industry in all 3 regions from Transylvania in order to make a comparison with the structure existent at the national level. Data collected regarding hospitality industry in 2005 shows that the average number of Hotel and Restaurants in total number of SMEs is 5%. The number of Hotel and Restaurants in both Western and Central Region is above the average (6%) and in the North Western Region is very close to this average being 4.8%. The structure of hospitality industry in Transylvanian Regions is shown in the next graphic.
If we analyze the SMEs structure of hospitality industry in Transylvanian regions in comparison with the Romania’ SMEs sector in 2005 we can draw the conclusion that there are very small difference between the average number of micro-enterprises and small enterprises but there is a difference between the number of medium enterprises from 2.1% in the national SMEs sector to the average of 0.84% in Transylvanian regions. The size class structure in hospitality industry in Transylvania indicates a segmentation of the offer on the tourist market. Also, the important weight of micro-enterprises (91.77%) determines a negative effect for the competitiveness of the Transylvanian tourism sector on the international market.
Year Commerce Tourism Transportation Other services 1999 100 100 100 100
2000 90.9 90.1 101.1 97.6
2001 85.9 85.5 115.4 103.6
2002 82.8 97.7 146.5 105.5 Micro-enterprises
2003 86.9 101.0 175.5 133.0
1999 100 100 100 100
2000 114.2 111.5 131.5 119.5
2001 119.4 115.8 152.0 127.9
2002 115.0 120.1 180.1 99.4 Small enterprises
2003 129.9 135.7 223.5 112.6
1999 100 100 100 100
2000 115.3 109.4 126.3 122.3
2001 116.0 111.6 127.9 129.9
2002 111.4 128.3 123.5 116,8
Medium enterprises
2003 115.2 134.1 145.0 136.4

ANALYSIS OF POTENTIAL SME’S ROLE FOR DEVELOPING TOURISM IN TRANSYLVANIA
13
0%
20%
40%
60%
80%
100%
West Region Centre Region North West Region
Hospitality sector structure
medium enterprises
small enterprises
micro-enterprises
Fig. 6. The SME’s Transylvania structure
According to Shaw and Williams (1990), into the tourism sector there are
two different types of entrepreneurs for SMEs: � The self-employed who use family labour, have little market stability,
low levels of capital investment, weak management skills and are resistant to advice or change
� The small employer who uses family and non-family labour, has a better business foundation, but can share similar behaviour patterns to the self-employed and are therefore equally vulnerable.
Therefore the position of tourism SMEs is vulnerable, due to the negligible market power to influence purchases and sales. Because the owners have a substantial portion of their wealth in the firm and weak management expertise it is difficult for these firms to assure a secure finance level and creativity in introducing new service products. But on the other hand they have a great contribution in offering to tourists a unique atmosphere by providing narratives on local history, culture, folklore and landscape, advising about itineraries, as well as playing an active role in the advancement of the community.
This characteristic of the Romanian tourism sector has determined the government to make some changes into the national administration organization and starting with April 2007 the coordination and implementation of tourism strategic activities came into the tasks charged by the Minister for SMEs, Commerce and Tourism. With this change the government intention was:
� A better development of tourism infrastructure

ADINA LETITIA NEGRUSA, OANA ADRIANA GICA
14
� An integrative strategy for promoting Romanian tourism in internal and external markets
� Facilitating the accessibility of SMEs from tourism to Structural funds offered by European Union
� An efficient protection of the Romanian tourist patrimony The new regional strategy of development approved for implementation in
the next five years at the national level, includes on the third place of the priority directions the development of local and regional tourism. In this way each agency for regional development developed a particular program with specific actions focused on the third priority. Reviewing these strategic programs we were interested to show the main objectives regarding the tourism development in Transylvania.
The strategy for tourism development of the North Western region for 2007-2013 has as general objective “to enhance the competitiveness of the tourism sector by developing and modernizing the infrastructure and the tourist services including investments for the creation of new tourist attractions”. The specific objectives include:
� the preservation of the natural, historical and cultural patrimony in the region, the rehabilitation of the zones with tourist potential;
� the modernization and development of tourist infrastructure; � supporting the business environment by improving tourist services
and support facilities and enhancing tourism promotion; � the promotion of region’s tourist brand; � the development of niche tourism. The Western Region has established for the 2007-2013 a set of strategic
axis for the development of the region. The strategic objective regarding tourism refers to the enhancement of the tourist potential by the superior capitalization of all types of tourism existent in the region. The priorities in this axis are:
� tourism infrastructure; � enhancement of the tourism sector competitiveness; � the revival of the tourism sector by developing the niche tourism. The specific objective of the development strategy of the Central Region
for 2007-2013 for de tourism sector is:” the enhancement of the tourism role in the region’s economy through direct investments, promotion and the improvement of tourist services”. The Central Region intends to pursue this objective taking action in these areas:
� the preservation of the national, historical and cultural patrimony, � the development, diversification and promotion of the tourist offer � the improvement of services provided in the tourism sector. In conclusion it results that for all regions there are targeted objectives like
improving tourism infrastructure, which means to concentrate and orientate investments into this direction, rehabilitation and preservation of the tourist attraction

ANALYSIS OF POTENTIAL SME’S ROLE FOR DEVELOPING TOURISM IN TRANSYLVANIA
15
or cultural patrimony, which could be interpreted as an increasing interest for renewal the attractiveness of tourist destinations, and diversification of tourist offer in the same time with better promotion of a more specific tourism products, even if they are addressed to niche markets.
Because the tourism market will have a higher level of integration, it will become more important for SMEs to match different quality levels. In this direction the Romanian authorities intend to implement measures with positively impact on quality of the service, which could also guarantee to the consumers adequate safety, health and environmental standards. The perspective of increased competition, and especially from the major players present into the tourism sector, stress on the SMEs to be more conscious of their potential in satisfying the customers. All SMEs should be aware of the changing expectations of consumers. Just as any company, SMEs will have to adapt themselves towards a tourist who is more demanding than before. Consumers are much more affluent and mature and expect a more individualised product offering. This need to feel different must be translated by all enterprises and will determine whether or not the company remains successful. In general SMEs need to differentiate from the big players.
Therefore, SMEs will need to work closely together in order to assure their market position. The integration between producers (attraction, transport and accommodation operators) and travel organisers and the integration between different modes within a sector will become vital. This is a logical trend because tourists/travellers are expecting their journey to be a continuous one that is not being set by major gaps in the provision of, or by a lack of integration between, the different modes of transport, the accommodation and attractions. An integrated and thus convenient tourism offering will impact on the way of doing business. For example, a small hotel might propose its customers to make use of their car-rental service, which is delivered by a supplier. Those who meet these requirements will gain in popularity.
For implementing the actions of development programs, the entrepreneurs and SMEs need to be supported with financial opportunities and expertise consultancy. For example in the period of 2004-2005 the Romanian authorities implemented a subprogram called City development through stimulation of SMEs activity. Inside of it 25 projects were fundraising, from which 7 were orientated to tourism activity. The objectives of these projects, which means an investment of 4618000 RON, were focused on the improvement and refreshing the hotels’ capacity of specific units from Brasov, Harghita and Mures counties and development of new capacity, like rural pensions or villas in the rural areas from the same counties.
In the last 4 years it can be observed a progressive involvement of tourism in the programs supported by the European Community. The European Commission recognising the important role of tourism in the European economy, has been increasingly involved in tourism since the early 1980’s in co-operation with Council, the European Parliament, The Economic and Social Committee and the

ADINA LETITIA NEGRUSA, OANA ADRIANA GICA
16
Committee of the regions. While the Romanian tourism budget was oriented more for rehabilitation of resorts and promotion activities into the international market, numerous tourism initiatives have received support from different EU programmes. The possible sources of funding for tourism projects are as follows:
� Structural Funds – the major funds for promoting regional, economic and social development in the Union
� Programmes and actions based on various fields (e.g. environment, training, research and development, promotion of cultural heritage). These often require co-operative efforts between organizations in two or more member states
� Loans from the European Investment Bank Through the European Funds for Regional Development, Romania will
receive for 2007 -2013 approximately 710 million euros for rural and local development. These funds will be focused on programs and projects oriented to fruitful historical and cultural patrimony, especially the tourism potential of UNESCO sites.
4. Conclusions
The new strategy for developing Romanian tourism, presented in the master plan for 2007-2026, highlight the role of various attractions from Transylvania region in increasing the total amount of tourist and the importance of Romanian offers in the European and international markets. The tourism sector remains dependent of small entrepreneurs who invest their own capital for creating a business that it is easier for them to be managed and controlled. Due to this situation we consider that it is needed to include in the strategic actions some principles and conditions for improving the competitive position in terms of:
- development of touristic product in order to provide a superior capitalization of exiting factorial conditions and improvement in terms of quality;
- demand stimulation, in the condition of developing and adapting the touristic offer within a program for the development and the promotion of touristic product;
- the development of tourism research and education necessary for the assurance of touristic offer quality and diversification and for early acknowledgement of market trends for the purpose of internal market adaptation;
- the modernization and development of the infrastructure as a fundamental existence condition for the internal market and for its penetration on their competitors markets;
- ensuring market communications and touristic offers and their conditions dissemination;
- the improvement of general economic climate;

ANALYSIS OF POTENTIAL SME’S ROLE FOR DEVELOPING TOURISM IN TRANSYLVANIA
17
- territorial organization and development through harvesting and preserving in the same time the natural environmental factors as fundamental components of present and future touristic offer;
- the improvement of the general operating framework of the sector in a competitive market economy.
Also, taking into account the entire potential of Transylvania, we conclude that should be developed 3 main type of tourism for the international market: cultural tourism, rural tourism and spa tourism, and especially for internal market the development of ecotourism and ski tourism will be an opportunity.
REFERENCES
1. Cosma, S., 2004, Tourist Destination Marketing – Some Aspects Related to Romania, Studia Universitatis Babes-Bolyai, Seria Negotia, nr. 2, Cluj-Napoca, pag. 69-75.
2. Pop, C., Cosma, S., 2005, Cluj Hotels’ Distinctive Features, International Conference, Small and Medium Size Enterprises in European Economies and all over the world, Cluj-Napoca, pag. 58-68.
3. Negrusa, A., Cosma, S., 2007, Study about hotel industry development from Timisoara, Romania, 3rd International Conference – European Integration – New challenges for the Romanian economy, Analele Universitatii din Oradea, CD-ROM.
4. Negrusa, A., Cosma, S., Romania rural tourism development. Case study – rural tourism in Maramures, 2007, International Journal of Business Research IABE, pg 128-136.
5. Pop, C., et al., 2007, ‘Romania as a tourist destination and the Romanian hotel industry’ Cambridge Scholars Publishing, Newcastle, UK.
6. Shaw, G. and A. Williams, 1990, ‘Tourism, economic development and the role of entrepreneurial activity’, in C. Cooper and A. Lockwood (eds.), Progress in Tourism, Recreation and Hospitality Management, London: Belhaven Press.
7. *** http://www.nord-vest.ro/Document_Files/116_ro-RO_Analiza%20Socio-Economica%20Regiunea%20Nord-Vest.pdf
8. ***Master Plan pentru dezvoltarea turismului in Romania - http://www.mturism.ro/fileadmin/mturism/noutati/masterplan_abcd.pdf
9. ***Romanian Statistical Yearbook 2004, 2005, 2006
10. ***Romanian Hotels Industry Overview by Raiffeisen Capital & Investment - http://rbd.doingbusiness.ro/2006_02/rci_hotels_sept2006.pdf
11. ***World Travel &Tourism Council Report, 2006, Romania: The impact of Travel &Tourism on jobs and the economy – http://www.wttc.org/publications/pdf/06WTTCRomania.pdf

STUDIA UNIVERSITATIS BABEŞ-BOLYAI, NEGOTIA, LIII, 2, 2008
SPA HEALING SOURCES IN CZECH REPUBLIC
ŠÁRKA BRYCHTOVÁ 1
ABSTRACT. The article deals with natural healing sources in the territory of the Czech Republic that are used in balneology and their economic impact at regional level. First of all they include the following sources: natural healing waters (e.g. mineral waters, acidulous waters, thermal springs, etc.); peloids (humolites – i.e.: peat, fen, silt, mud); gases (carbon dioxide, hydrogen sulphide); climate. The article aims at analysing their geographical locations according to regions of cohesion and administrative regions; the individual tables show natural healing sources in combination with indications as well and the article consequently gives a summary of health resorts in our territory, their natural healing sources and medical treatment of certain diseases. Keywords: Spa industry, natural healing sources, health resort, peloids, indications, regions of cohesion, administrative regions.
1. INTRODUCTION - SPA HEALING SOURCES OF THE CZECH REPUBLIC
The use of natural healing source, baths, drinking of healing waters and
balneological treatment have played an important role in medicine as one of the oldest therapeutic methods used since immemorial time until present. Health resorts have gradually been created in the vicinity of sources, above all around springs of mineral and thermal waters for the purposes of baths and drinking. Deposits of peat, fen and mud also provided a valuable material for thermal baths and packs so popular with rheumatic patients. The favourable climate resulted in creation of a number of sought-after healing spots. Natural sources were not always necessary for creation of health resorts. In some cases it was also a strong personality of the reforming healer, a layman in many a case, that enforced new methods using e.g. only common cold waters in varied application form of treatment and contributed to creation of renowned health resorts.2
The Czech Republic is very rich in mineral springs and health resorts. The common work of the nature and people has gained world reputation and has
1 RNDr., Ph.D. Institute of Public Administration and Law, Faculty of Economics and Administration,
University of Pardubice, Czech Rebuplic, [email protected] 2 BUCHAROVIČ, S., WIESNER, S. Encyclopaedia of spas and healing springs in Bohemia, Moravia and
Silesia. Prague: Libri. 2001 p. 15. ISBN 80-7277-049-7
ŠÁRKA BRYCHTOVÁ
20
become an important medical and economic article of this country. Use of natural healing sources, baths, drinking of waters and balneological treatment have a few centuries’ long worldwide tradition and Czech and Moravian health resorts belong to the most advanced in the world.3
1.1. The position of Czech balneology in the world
The tradition of Czech balneology is an inseparable part of the European cultural heritage and has gained an extraordinary reputation and respect in European awareness due to a high quality of natural healing sources. Health resorts and spa industry is not distributed evenly throughout the world. Although available sources have occurred in a number of places since immemorial time, the balneology in our sense of the word has mostly remained a European issue. It has also developed in Asia in only a smaller extent. The oldest balneological traditions in Europe are in Italy, and also in this country, in Germany, France, Spain, Poland and Russia. In the Anglo-Saxon countries and in America it was not wide-spread even in the past and the approach to it was always reserved, therefore it is not widely used even now. The traditions of our balneology are younger than those in southern Europe and in the countries from the Mediterranean area with ancient models. In spite of this, Czech health resorts gained extraordinary reputation and respect in the European awareness in the past and, finally, also its position in the history of medicine and balneology. In particular, health resorts in western Bohemia became renowned as early as last century. Therefore it was no piece of luck that both balneology and water treatment firstly became a field lectured at a European university – in Prague. Unique mineral springs that have been used for healing purposes rise in the territory of the Czech Republic. Spa towns are found in picturesque landscape areas. They are also interesting due to their architecture, and some spa buildings are proud of their original equipment.4
1.2. Natural healing sources according to law
(1) Natural healing sources are naturally occurring mineral water, gas or peloid, which have properties suitable for use in healing processes and a certificate of this source has been issued according to the law. Peloid means peat, fen, silt or mud. Mineral water for the use in healing processes means naturally occurring water of original cleanness with the minimum content of solved solid substances of 1 g/l or containing at least 1 g/l of solved carbon dioxide or containing another chemical element important for human health, or having its natural temperature at the outlet exceeding 20 °C or the radon radioactivity above 1.5 kBq/l.
3 Note: Nevertheless in the Encyclopaedia of spas and healing springs in Bohemia and Moravia, the authors
emphasise large neglect of health resorts in the period of “socialist care” and reduction of health resorts – about 250 health resorts were in our territory in the first half of the 20th century; hardly one fifth of them – less than 50 – is operated now.
4 http://www.atlasceska.cz/ceska-republika/lazenstvi/
SPA HEALING SOURCES IN CZECH REPUBLIC
21
(2) A source of natural mineral water is naturally occurring underground water of the original cleanness, having a constant composition and properties, which has, from the nutrition viewpoint, physiological effects given by the content of mineral substances, trace elements or other components due to which it may be used as a foodstuff and for production of packed mineral waters, and a certificate of this source has been issued according to the law.
(3) A natural spa means a set of medical and other related facilities serving to provide balneological care and designated as a natural spa according to the law.
(4) A health resort means a territory or a part of the territory in a municipality or a few municipalities, in which a natural spa is found and which is designated as a health resort according to this law.5
Essentially, a natural healing source is therefore mineral water, gas or peloid having a property suitable for therapeutic use. Peloid means peat, fen, silt or mud.
A natural climatic spa must comply with climatic conditions suitable for medical treatment by virtue of law.6
Balneotherapy is treatment using natural healing sources: • natural healing waters (e.g. mineral waters, acidulous waters, thermal springs, etc.) • peloids (humolites – i.e.: peat, fen, silt, mud) • gases (carbon dioxide, hydrogen sulphide) • climate7
1.3. Natural healing sources in our territory
• Natural healing water sources In view of the fact that mineral waters are important natural healing sources,
let us have a brief look at the occurrence of mineral waters in the Czech Republic. The geological structure of the Czech Republic is made up by two basic
units – the Bohemian Massif and the Western Carpathians. The map shows a clear difference in distribution of mineral waters in the Bohemian Massif and the Western Carpathians. Mineral waters occur in the Bohemian Massif only in its northern part while in the Western Carpathians they are found practically in the whole territory8 (see the map). 5 Act No. 164/2001 Coll. (Collection of Laws) 6 JANDOVÁ, D. Czech spa medicine (information for MUDr. T. Julínek, minister, Ministry of Health of the
CR). Advisory body – Czech Spa Inspectorate of the Ministry of Health of the Czech Republic. 2007. 7 Note: According to the latest research in Czech balneology we should also classify outputs of trace
elements in a non-filtered form of the mass as locally natural healing resources or in the healing complex of clime-therapy (e.g. geoatmochemistry, inhalations of respirable aerosol of biogenic trace elements).
(Jandová, D. Czech spa medicine (information for MUDr. T. Julínek, minister, Ministry of Health of the CR). Advisory body – Czech Spa Inspectorate of the Ministry of Health of the Czech Republic. 2007.)
8 Note: E.g. occurrences of mineral waters in regional structures are exclusively bound to deep tectonic zones of a regional importance. From the West to the East this includes the Mariánské Lázně, Karlovy Vary and Litoměřice faults, Roven faulty zone, faults predominantly in the NW – SE direction in the area of Jeseník Devon and Culm and in Hornomoravský úval (Upper Moravian Vale).

ŠÁRKA BRYCHTOVÁ
22
.
Source: Czech spas and balneology. Ministry for regional development of the CR. Prague 2007.
Fig. 1. Maps of mineral waters in the Czech Republic * Explanatory text in English:
Territory without presence of mineral waters Territory with presence of carbonic mineral waters Territory with presence of tar of crystallic massif Territory with presence of nitric, nitric-methane and methane mineral waters Territory with presence of nitric-oxygen waters with radon
Mineral waters in the Czech Republic, similarly as in other European countries, are used in balneology for treatment and also as table and healing drinking waters. At present, thermal waters are also used as a source of geothermal energy for heating purposes and for holiday-making in the tourist business. Many sources of mineral waters are used for healing purposes within a district and for holiday-making. Waters in approximately 20 localities within the tourist business are used for the healing purposes. Waters of individual hydro-chemical types are used for the healing purposes as follows: - Of the types of carbonic waters, the sources in the well-known localities such
as Mariánské lázně, Karlovy Vary, Teplice nad Bečvou, Luhačovice, Poděbrady and Františkovy Lázně are used for medical treatment.

SPA HEALING SOURCES IN CZECH REPUBLIC
23
- Acidulous waters are used as table and healing drinking waters in Mariánské lázně, Karlovy Vary, Vratislavice, Luhačovice, Poděbrady, Břvany, Běloves, Bílina, Františkovy Lázně, Horní Moštěnice, Kyselka and at Korunní.
- Of the types of nitrogen thermal crystalline-core areas, the sources in Jánské Lázně, Bludov and Velké Losiny are used for medical treatment.
- Of the types of nitrogen, nitrogen-methane and methane waters of sedimentary basins, waters in health resorts of Teplice and Darkov are used for medical treatment. The sources in the localities of Zaječice and Šaratice are used as healing drinking (bitter) waters.
- Waters in the spa town of Jáchymov are used of the types of nitrogen-oxygen waters with radon in massifs of acid crystalline rocks.
- Thermal waters of the carbonic waters types and nitrogen, nitrogen-methane and methane water types are mainly use for holiday-making in the field of tourist business.9
The current state of using mineral waters in the national economy does not
exhaust the given geological possibilities. The spa base may also be extended with thermal iodine-bromine and hydrogen sulphide waters. Similarly, other geothermal waters and other mineral waters may be verified.
• Natural healing peloid sources
Peloids are the second most important healing source in the territory of our country. Sufficiently rich deposits of such peat, fen, mud and other rocks that have been created as a result of natural geological or biological processes, have constant, scientifically proven effects so useful for human health (based on both their current chemical and physical properties) – like natural healing water sources – that they should be used in general interest for therapeutic purposes either in their original condition or after modifications increasing their healing effects, may be declared natural healing peloid sources. In balneological care they are used for hot baths, packs and compresses after they are pulped and mixed with water.10
Classification of peloids is not entirely unified; the following classification is used as usual, however: - Humolites – they are largely organogenous sediments created mostly from a plant
material, dead bodies of mosses and veined plants through the processes called peating or huminiphication.
They are divided into: 1. peats; 2. fens (simple and sulphur-ferruginous); 3. silts - Muds – they are inorganic sediments that are created in a rural environment,
which is neutral to alkaline, from the rock detritus also containing plankton, algae, especially cyanobacteria.
They are divided into: 1. simple muds; 2. thermal muds; 3. sulphur muds. 9 Czech spas and balneology. Ministry for regional development of the CR, Prague 2007. 10 Chovanec, J. Czechoslovak health resorts and natural healing sources. Prague 1966.

ŠÁRKA BRYCHTOVÁ
24
Peat and fen packs and baths are popular especially with rheumatic patients – Třeboň in the south of Bohemia is one of the most important health resorts without any doubt; peloids are also used in Lázně Bohdaneč, Velichovky, Lázně Bělohrad, Lázně Toušeň and others. Their list is described in detail in the following tables.
• Natural healing gas sources Leaking natural gases are a relatively rear healing source in our territory.
They are used for preparation of natural gaseous baths or for an injection application. E.g. Františkovy Lázně or Karlova Studánka belongs to the best-known ones. Other localities of healing gases are described in tables.
• Other natural healing sources – climate, microclimate The climate is another important factor in our balneological care. There are
a number of favourable climatic spots in our territory. Climatic spots are such places that have favourable climatic conditions, in particular as for the altitude above sea level and position, cleanness, temperature, humidity and movement of air, length and intensity of the sunshine, vegetation (forests, parks, meadows) and excellent hygienic conditions.
In this respect it is the health resort of Jeseník founded by Vincenz Priessnitz, a famous doctor,11 as well as other spa spots located in the Jeseníky Mountains12 (Lipová – spa town) or in other places that are renowned in this country, as shown in the tables. Spa treatment in Zlaté Hory (in the same area of the Jeseníky mountains), which is based on the unique microclimate of abandoned underground mining areas, is an interesting fact; children and young people suffering from respiratory system problems are cured here.
2. Spa natural healing sources according to regions13 2.1. Region of cohesion of Central Bohemia
The region of cohesion of Central Bohemia is a single administrative region of the Czech Republic, which is currently the largest one from the viewpoint of its area – the Central Bohemian Region, which also fulfils the task of a wider background for the capital of Prague.
11 Note: Vincenz Priessnitz (1799-1851) of German nationality, living in Gräfenberk at Frývaldov (now
it is Lázně Jeseník) in the Silesian part of the Jeseníky Mountains, was a founder of natural medicine. He enforced e.g. treatment based on work, fresh air and clear mountain water. He laid down the basis of hydrotherapy. He is a founder of world-renowned health resorts, and he cured e.g. N. V. Gogol. The UNESCO declared the year 1999 an important cultural anniversary on the occasion of the two hundred years after Priessnitz was born.
12 Note: The Jeseníky Mountains were declared a protected landscape area in 1969. Mountain forests and peat-bogs are the main item of protection. Mountain meadows on the main ridge above the forest level are one of the richest localities in the Czech Republic from the botanical viewpoint. The size of the protected landscape area is 744 km2. The clean piedmont climate of the Jeseníky Mountains is used in a number of health resorts of this region.
13 Note: The Czech Republic is administratively into 14 regions; two of these administrative regions (the capital of Prague and the Vysočina region) do not have any health resorts therefore it is only 12 regions that are included in the list of tables.

SPA HEALING SOURCES IN CZECH REPUBLIC
25
Source: www.Czech.Republic.cz
Fig. 2. Spa places on the territory of The Czech Republic
The health resorts are only represented by two spa towns – Poděbrady and Lázně Toušeň. Silt is also an important natural source in Poděbrady – in addition to a strong spring of alkaline-earthy acidulous water with a high content of magnesium and calcium. Lázně Toušeň has used sulphur-ferruginous fen from local sources since 1899.
Source: Czech spas and balneology. Ministry for regional development of the CR, Prague 2007.
Fig. 3. Spa of the territory of Central Bohemia

ŠÁRKA BRYCHTOVÁ
26
• Central Bohemian Region
Central Bohemian Region – natural healing sources and other selected characteristics
Name Municipality(District)
Natural healing sources
Indications and treatment
Lázně Poděbrady
Poděbrady (Nymburk)
Natural carbonic mineral water (Poděbradka) rich in carbon dioxide, other springs and silt
Diseases of circulatory system, heart and vessels, diabetes, diseases of the locomotive system, obesity and overweight, metabolic disorders
Slatinné lázně Toušeň (Toušeň fen spa)
Lázně Toušeň (Prague-East)
Sulphur-ferruginous fen Diseases of the locomotive system, Bechterev’s disease, arthrosis
Source: own processing on the basis of information from literature
2.2. Region of cohesion of the North-West
The region of cohesion of North-West, which consists of the Karlovy Vary Region and the Ústí region, offers an important amount of spa potential.
Health resorts and tourist business sector, which is closely related to the health resorts, have a dominating position in the North-West region. Its territory, especially in the part of the Karlovy Vary Region, is unique in the European standards both due to abundant occurrence of natural springs of mineral waters and gases and due to a great variety of their chemical compositions and characteristics. The number of outlets of mineral waters in this area reaches a few hundreds. The spa town of Teplice in the Ústí Region is one of the most important localities with the renowned protected zones – in addition to Karlovy Vary, Mariánské Lázně, Františkovy Lázně and others. Although this region is unique within Central Europe due to its spa character, the numbers of visitors still show great reserves in use within the tourist business from the statistical viewpoint.14
14 Czech spa towns and health resorts. Ministry for Local Development of the CR. Prague 2007.

SPA HEALING SOURCES IN CZECH REPUBLIC
27
Source: Czech spas and balneology. Ministry for regional development of the CR, Prague 2007.
Fig. 4. Spa of the territory of the North-West
• Karlovy Vary Region
Karlovy Vary Region – natural healing sources and other selected characteristics
Health resort
Municipality (District)
Natural healing sources Indications and treatment
Františkovy Lázně
Františkovy Lázně (Cheb)
Twenty-three quality local springs, strongly alkaline acidulous waters, sulphur-ferruginous fen and natural healing gas
Gynaecological diseases, sterility, oncological programme, heart and vessels diseases, diseases of locomotive system, children gynaecology

ŠÁRKA BRYCHTOVÁ
28
Lázně Jáchymov
Jáchymov (Karlovy Vary)
Natural thermal radon water, (Springs: Běhounek, Curie; Note: all springs are caught in a deep ore mine called Svornost (Concord) in the depth of 500 m)
Diseases of locomotive system, nerve system diseases, metabolic diseases
Lázně Karlovy Vary
Karlovy Vary (Karlovy Vary)
Thermal water – hydrogen-carbonic-sulphur-chlorine-sodium acidulous water (The best-known spring is called Vřídlo, the newest one is Štěpánka. Other springs are: Karla IV., Dolní Zámecký, Horní Zámecký, Tržní, Mlýnský, Rusalčin, pramen knížete Václava, Libušin, Skalní, Svobody, Sadový. – spring of Charles IV, Lower Castle spring, Upper Castle spring, Market spring, Mill spring. Water Nymph’s spring, spring of the Prince Wenceclas, Libuše’s spring, Rock spring, spring of Liberty, Orchard spring)
Diseases of the digestive system, metabolic disorders, diabetes, gout, obesity, periodontitis, diseases of locomotive system, diseases of liver, pancreas, gall bladder and biliary tract, states of oncological diseases
Lázně Kynžvart
Lázně Kynžvart (Cheb)
Climatic conditions, natural acidulous water, fen
Treatment of children suffering from a non-specific disease of the respiratory system, skins diseases and diseases of kidneys and urinary tract
Mariánské Lázně
Mariánské Lázně (Cheb)
Local mineral springs are of different compositions, contain carbon dioxide and also ions of calcium, iron and magnesium. Fen and healing gas are also used during treatment. (Springs: Rudolfův, Karolínin, Křížový, Ferdinandův, Lesní, Ambrožův, Mariin, Hamelika, Medvědí and others – Rudolf’s spring, Caroline’s, Cross, Ferdinand’s spring, Forest spring. Ambrose’s, Mary’s spring, Hamelika, Bear spring)
Diseases of the digestive system, diseases of kidneys and urinary tract, metabolic disorders, nerve system diseases, metabolic diseases, skin problems, diseases of respiratory system, non-specific diseases of respiratory system, diseases of locomotive system, metabolic disorders, oncological diseases, gynaecological problems.
Source: own processing on the basis of information from literature

SPA HEALING SOURCES IN CZECH REPUBLIC
29
• Ústí Region
Ústí Region – natural healing sources and other selected characteristics Name Municipality
(District) Natural healing
sources Indications and treatment
Lázně Mšené
Mšené-lázně (Litoměřice)
Silt from the locality of Vrbko
Neurological diseases, diseases of the locomotive system, states after an operation and after an injury, neuritis, spine function diseases, spinal disc syndromes, occupational diseases, osteoporosis, recondition
Lázně Teplice
Teplice (Teplice)
Natural medium-mineralised healing water
Diseases of locomotive system, locomotive system disorders, after-injury states, muscle diseases, inborn orthopaedic defects, scoliosis, vessel and nerve diseases
Tereziiny lázně DubíTherese’s health resort at Dubí)
Dubí (Teplice)
Appropriate local piedmont climate, slightly irritating
Digestive problems, nerve and heart diseases, diseases of the locomotive system, mental disorders, certain occupational diseases, convalescence, inflammations of the respiratory system, anaemia, states after brain incidents, operations of spine and brain, disseminated sclerosis, inborn polio, painful syndromes of spine, muscle diseases
Source: own processing on the basis of information from literature
2.3. Region of cohesion of South-West
Region of cohesion of South-West consists of two administrative regions – the Plzeň Region and the South-Bohemian Region. Natural beauties of southern Bohemia are one of the most important attractions of the tourist business in the Czech Republic. Health resorts considerably affecting the number of visitors coming to this part of the region (health resorts of Vráž, Bechyně and above all Třeboň) are its essential part.
While Konstantinovy Lázně in the Plzeň Region make use above all of deposits of ferruginous acidulous waters used for preparation of carbonic baths and for drinking cure, South-Bohemian spas provide treatment using local deposits of quality fen above all. The largest peat bogs with enormous deposits of fen and silts of various kinds are found at Třeboň. Sulphur-ferruginous fens are of the best quality. The health resort of Vráž uses simple earthy fen, climate and curative regimen as a healing source.

ŠÁRKA BRYCHTOVÁ
30
Source: Czech spas and balneology. Ministry for regional development of the CR, Prague 2007.
Fig. 5. Spa of the territory of the South-West
• Plzeň Region
Plzeň Region – natural healing sources and other selected characteristics
Health resort Municipality (District)
Natural healing sources
Indications and treatment
Konstantinovy Lázně
Konstantinovy Lázně
(Tachov)
Natural ferruginous hydrogen-carbonic sodium-magnesium acidulous water, carbon dioxide from a natural spring. (Springs: Karlův, Žofiin, Skalní Giselin, Žíhaný and
Diseases of circulatory system, heart and vessels, diseases of the locomotive system, diagnostics and treatment of the cardiovascular system, risk factors and complex educational programme

SPA HEALING SOURCES IN CZECH REPUBLIC
31
Rudolfův – Charles’s, Žofie’s, Rock, Gisela’s, Striped and Rudolph’s). These are springs of natural, simple, ferruginous and hypotonic hydrogen-carbonic-sodium-magnesium acidulous water with an increased content of silica acid.)
Source: own processing on the basis of information from literature
• South-Bohemian Region
South-Bohemian Region – natural healing sources and other selected characteristics
Health resort
Municipality (District)
Natural healing sources
Indications and treatment
Bechyně Bechyně (Tábor)
Local deposits of peloids, favourable climate and fen
Diseases of the locomotive system, progressive polyarthritis, Bechterev disease, metabolic diseases with affected joints, kyxathrosis and other kinds of deforming arthrosis accompanied with function disorders, vertebrogenous painful syndrome, painful syndromes in muscles, sinews, subcutaneous tissues of infectious or after-injury origin, states after orthopaedic operations with use of a joint substitution
Health resort of Třeboň - Aurora
Třeboň (Jindřichův Hradec)
Natural peat containing sodium, potassium, magnesium and calcium as well as other organic substances
Treatment of locomotion system disorders, rheumatic diseases, after- injury and after-operation states and overall recondition of the body and mind
Health resort of Vráž
Vráž (Písek)
Simple earthy fen, piedmont climate
Neurological diseases, diseases of the locomotive system, diseases of the blood circulation system, diseases of the respiratory system, stomach ulcer diseases, neurotic disorders, mental diseases
Source: own processing on the basis of information from literature

ŠÁRKA BRYCHTOVÁ
32
2.4. Region of cohesion of the North-East
Region of cohesion of the North-East consists of three administrative regions, i.e. the Liberec Region, Hradec Králové Region, and Pardubice Region. The region has exceptionally rich sources of underground and surface waters available. Sources of healing waters used in balneology also occur in the region.
Thermal waters in Jánské Lázně, whose springs are found in the altitude of 615 m above sea level and which is collected from the depth of 50 m under the surface, are important. Kunratice uses sulphur-ferruginous fen and healing piedmont climate as basic healing sources. Mineral waters in Lázně Libverda are used primarily for drinking cures. Mineral springs of hydrogen-carbonic-magnesium types, natural ferruginous acidulous waters, are the main natural source.
Lázně Bělohrad uses above all deposits of high-quality mildly mineralised silts. The local piedmont climate also has a considerable effect on the overall treatment and recondition of patients. Velichovky provides cure using silt from its own chalk fen, which is supplied with springs of water containing calcium carbonate and iron.
The health resort of Bohdaneč with two natural healing sources available is the only spa town in the Pardubice Region. These sources are fen coming from local sources and mineral water from a deep Artesian well of the pure alkaline acidulous water. The alkaline thermal water is 21 °C warm and is used for preparation of fen and carbonic baths.
• Liberec Region Liberec Region– natural healing sources and other selected characteristics
Health resort
Municipality (District)
Natural healing sources
Indications and treatment
Lázně Kundratice
Osečná (Liberec)
Sulphur-ferruginous fen from local deposits and favourable piedmont climate
Rheumatic arthritis, Bechterev disease, spine function disorders, chronic spine disc syndromes and states after operations of discs, arthrosis, muscle rheumatism, muscle diseases
Lázně Libverda
Lázně Libverda (Liberec)
Natural simple ferruginous acidulous water. (Springs: Boží voda, Mariin, Ocelový, Kristián, Josefína, Eduard, Nová Marie, Nový Kristián and Hubert – God Water, Mary’s, Steel, Christian, Josephine, Edward, New Mary, New Christiav and Hubert.)
Mental disorders, neurosis, diseases of the circulatory system, heart and vessels, diseases of the locomotive system, after-operation and after-injury states, recondiction
Source: own processing on the basis of information from literature
SPA HEALING SOURCES IN CZECH REPUBLIC
33
Source: Czech spas and balneology. Ministry for regional development of the CR, Prague 2007.
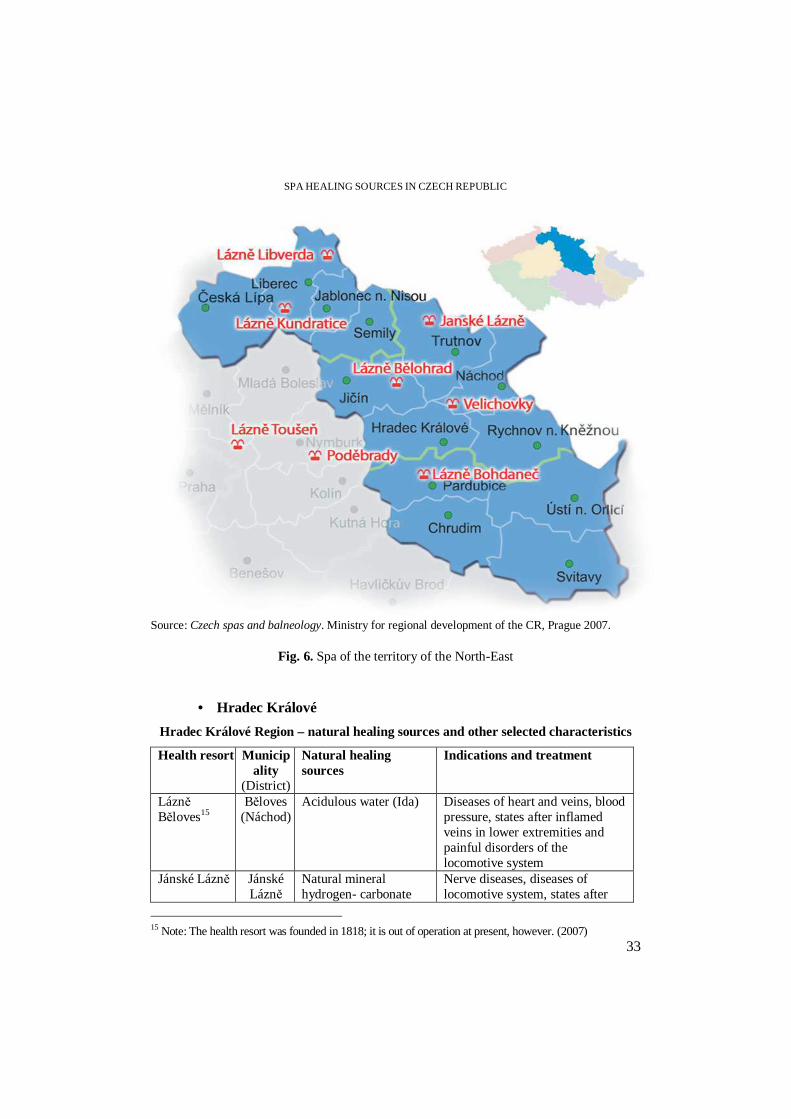
Fig. 6. Spa of the territory of the North-East
• Hradec Králové
Hradec Králové Region – natural healing sources and other selected characteristics
Health resort Municipality
(District)
Natural healing sources
Indications and treatment
Lázně Běloves15
Běloves (Náchod)
Acidulous water (Ida) Diseases of heart and veins, blood pressure, states after inflamed veins in lower extremities and painful disorders of the locomotive system
Jánské Lázně Jánské Lázně
Natural mineral hydrogen- carbonate
Nerve diseases, diseases of locomotive system, states after
15 Note: The health resort was founded in 1818; it is out of operation at present, however. (2007)

ŠÁRKA BRYCHTOVÁ
34
(Trutnov) springs with content of sodium and calcium as well as radioactive components
burns, diseases of the respiratory system, nerve diseases, children polio
Lázně Bělohrad – Ann silt health resort
Lázně Bělohrad (Jičín)
Sulphur-ferruginous silt Skin diseases and after-burn states, neurological diseases, diseases of the locomotive system, obesity and overweight, after-operation and after-injury states, rheumatic diseases, pains in the spine, Bechterev disease, arthrosis, states after injuries and orthopaedic operations, root syndromes in the case of a spine disease and mild peripheral polio, cure of scars after injuries and burns
Health resort of Velichovky
Velichovky
(Náchod)
Chalk silt containing calcium carbonate and iron
Diseases of the locomotive system, nerve diseases, treatment of patients after injuries, before and after operations of bones and joints including joint substitutions
Source: own processing on the basis of information from literature
• Pardubice Region
Pardubice Region – natural healing sources and other selected characteristics
Health resort
Municipality (District)
Natural healing sources
Indications and treatment
Lázně Bohdaneč
Lázně Bohdaneč (Pardubice)
Reed-sedge silt and mineral alkaline acidulous water with a rare content of fluorides
Diseases of the locomotive system above all with focus on inflammatory rheumatologic diseases, arthrosis, vertebrogennous syndromes, Bechterev disease
Source: own processing on the basis of information from literature
2.5. Region of cohesion of Moravia and Silesia
The region of cohesion of Moravia and Silesia coincides with the Moravian – Silesian Region. Health resorts and a number of mineral springs are found in the bordering area of the region with the Olomouc Region, in the area of the Jeseníky Mountains. They include e.g. hydrogen-sulphide mineral springs rising out at Velké Losiny and at Bludov (the Olomouc Region) and hydrogen-carbonate and calcareous

SPA HEALING SOURCES IN CZECH REPUBLIC
35
acidulous waters with an increased content of metasilicic acid at v Karlova Studánka. Other springs – e.g. carbonic acidulous waters – are also found at Bílý potok u Vrbna, at Ludvíkov, Brantice, Michnov, Karlova Pláň, Slezské Pavlovice and Zátor.
It is above all the spa town of Karlova Studánka that may boast of rich history and curative results; the local springs of mildly mineralised hydrogen-carbonate and calcareous acidulous water with an increased content of silicic acid is completed by natural carbon dioxide, peat, and above all unique piedmont healing climate. A new health resort of Klímkovice with iodine-bromine waters is found in the area to the south of Nízký Jeseník. Ostrava-Karviná has an iodine-bromine health resort of Darkov, Ostrava-Hranice has a modern Rehabilitation Sanatorium.
Source: Czech spas and balneology. Ministry for regional development of the CR, Prague 2007.
Fig. 7. Spa of the territory of the Moravian-Silesian
• Moravian – Silesian Region
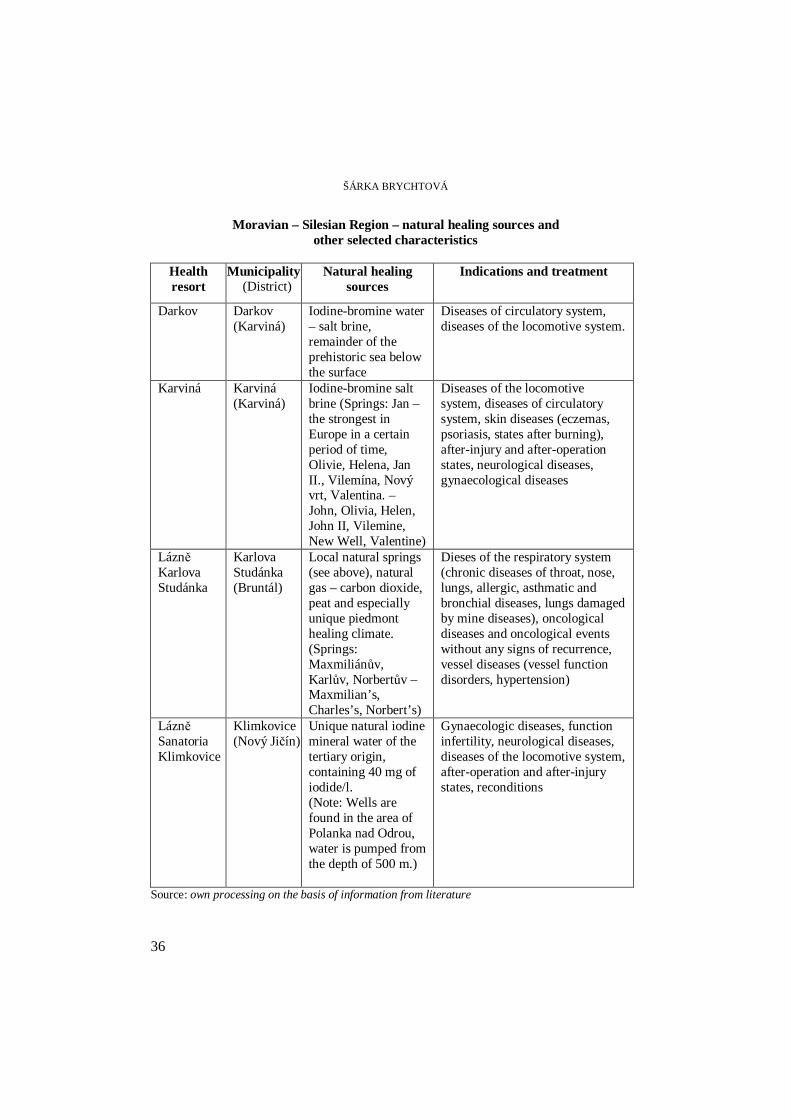
ŠÁRKA BRYCHTOVÁ
36
Moravian – Silesian Region – natural healing sources and other selected characteristics
Health resort
Municipality (District)
Natural healing sources
Indications and treatment
Darkov Darkov (Karviná)
Iodine-bromine water – salt brine, remainder of the prehistoric sea below the surface
Diseases of circulatory system, diseases of the locomotive system.
Karviná Karviná (Karviná)
Iodine-bromine salt brine (Springs: Jan – the strongest in Europe in a certain period of time, Olivie, Helena, Jan II., Vilemína, Nový vrt, Valentina. – John, Olivia, Helen, John II, Vilemine, New Well, Valentine)
Diseases of the locomotive system, diseases of circulatory system, skin diseases (eczemas, psoriasis, states after burning), after-injury and after-operation states, neurological diseases, gynaecological diseases
Lázně Karlova Studánka
Karlova Studánka (Bruntál)
Local natural springs (see above), natural gas – carbon dioxide, peat and especially unique piedmont healing climate. (Springs: Maxmiliánův, Karlův, Norbertův – Maxmilian’s, Charles’s, Norbert’s)
Dieses of the respiratory system (chronic diseases of throat, nose, lungs, allergic, asthmatic and bronchial diseases, lungs damaged by mine diseases), oncological diseases and oncological events without any signs of recurrence, vessel diseases (vessel function disorders, hypertension)
Lázně Sanatoria Klimkovice
Klimkovice (Nový Jičín)
Unique natural iodine mineral water of the tertiary origin, containing 40 mg of iodide/l. (Note: Wells are found in the area of Polanka nad Odrou, water is pumped from the depth of 500 m.)
Gynaecologic diseases, function infertility, neurological diseases, diseases of the locomotive system, after-operation and after-injury states, reconditions
Source: own processing on the basis of information from literature

SPA HEALING SOURCES IN CZECH REPUBLIC
37
2.6. Region of cohesiveness of Central Moravia
The region consists of two administrative regions – the Olomouc Region and the Zlín Region. The northern part of the area, typical of mountain ranges, is also well-known due to health resorts – e.g. Jeseník, Lipová. Other important health resorts are Luhačovice, Velké Losiny, Zlaté Hory, Bludov, Teplice nad Bečvou, Kostelec u Zlína and Ostrožská Nová Ves. Priessnitz’s sanatorium at Jeseník is probably the best-known health resort in the whole area. It is above all Velké Losiny, Lipová and Bludov that have rich history and curative successes.
The main natural sources of the local health resorts are above all mineral waters, and also thermal waters (e.g. Teplice nad Bečvou, Kostelec u Zlína, Velké Losiny), locally also fens (e.g. Ostrožská Nová Ves).
It is above all mountain and piedmont areas of the Jeseníky Mountains that are used for balneological purposes due to their healthy climate; climatic health resorts (e.g. Lipová-lázně, Jeseník, and Zlaté Hory) are found here. The microclimate of closed ore mines (Zlaté Hory) used to cure diseases of the respiratory system using the so-called speleo-therapy is an interesting natural source.
Source: Czech spas and balneology. Ministry for regional development of the CR, Prague 2007.
Fig. 8. Spa of the territory of the Central Moravia
ŠÁRKA BRYCHTOVÁ
38
• Olomouc Region
Olomouc region – natural healing sources and other selected characteristics
Health resort
Municipality (District)
Natural healing sources
Indications and treatment
health resort of Bludov
Bludov (Šumperk)
Natural, strongly alkaline spring of sulphur-chlorine-sodium type with an increased content of fluorides
Children and young people – obesity, catarrhs of upper air passages, diseases of kidneys and urinary tract, adults – diseases of locomotive system
Health resort of Lipová – lázně
Lipová – lázně (Jeseník)
Healthy piedmont climate
Disorders of metabolism and glands with inner secretion, diseases of the locomotive system, skin diseases, psoriasis (also with joint manifestations), eczemas, occupational skin diseases, acne, diabetes, treatment of obesity, increased thyroid activity and states after thyroid operation, disorders of lipid metabolism
Health resort of Skalka
Skalka (Prostějov)
Sulphur containing springs
Rheumatic diseases, pains in back, arthritis, problems with thyroid and anaemia
Health resort of Slatinice
Slatinice (Olomouc)
Natural sulphur –containing water and favourable dry low-land climate
Diseases of locomotive system, obesity and overweight, after-operation and after-injury states, recondition
Health resort of Teplice nad Bečvou
Teplice nad Bečvou (Přerov)
Thermal alkaline earthy acidulous waters with a high content of carbon dioxide with a constant temperature of 22.5 °C; hydrogen-carbonate-calcareous-magnesium- ferruginous acidulous water
Diseases of circulatory system, heart and vessels, diseases of locomotive system, skin diseases
Health resort of Velké Losiny
Velké Losiny (Šumperk)
Sulphur containing thermal mineral water of the sodium-carbonate type with an increased content of fluorites and silicic acid
Neurological diseases, respiratory diseases, rheumatism, arthrosis, pains in back or joints, convalescence after fractures and operations of joint substitutes

SPA HEALING SOURCES IN CZECH REPUBLIC
39
Priessnitz’s health resort of Jeseník
Jeseník (Jeseník)
Climatic health resort in the piedmont zone and springs of mineral or fresh water
Diseases of the upper and lower air passages, diseases of locomotive system, diseases resulting from disorders of metabolism and glands with inner secretion, mental disorders, skin diseases.
Zlaté Hory
Zlaté Hory (Jeseník)
Climatic conditions of the Jeseníky mountains, microclimate of underground spaces in a part of closed ore mines (constant temperature +100% humidity – use in treatment using speleo-therapy)
Allergies of air passages, respiratory diseases, chronic diseases of the respiratory system, the sanatorium focuses on children patients
Source: own processing on the basis of information from literature
• Zlín Region
Zlín region– natural healing sources and other selected characteristics
Health resort
Municipality (District)
Natural healing sources
Indications and treatment
Health resort of Kostelec u Zlína
Zlín (Zlín)
Springs of healing sulphur containing water with a rich content of hydrogen sulphide
Rheumatism and diseases of the locomotive system, sciatica, skin diseases, neuralgia, gynaecological diseases.
Health resort of Luhačovice
Luhačovice (Zlín)
Sulphur spring and 17 kinds of natural mineral waters
Diseases and disorders of the respiratory and digestive system, diseases and disorders of metabolism (diabetes, obesity), disorders of the locomotive system, circulatory system, and oncological diseases
Health resort of Ostrožská Nová Ves
Ostrožská Nová Ves (Uherské Hradiště)
Two mineral sulphur containing springs with water rich in sulphates, silicic acid, calcium, sodium, potassium and iron, silt deposits
Diseases of the locomotive system, in particular of the spine and big (as well as small) joints, skin diseases
Source: own processing on the basis of information from literature

ŠÁRKA BRYCHTOVÁ
40
2.7. Region of cohesion of the South-East
The region of cohesion of the South-East consists of two territorial units – of the Vysočina Region and South-Moravian Region. It is one of the cleanest parts of the Czech Republic from the viewpoint of ecology, but rather poor in occurrence of health resorts. Iodine-bromine water, which is one of the top-quality waters of its kind in Europe due to the content of iodine salts, is a healing source in the spar resort of Hodonín. Unlike chlorine, it occurs in organic complexes and has a significant relationship to facts and amino-acids.16 The natural healing source at Lednice is comparable with the Hodonín spa. In the Vysočina Region, no town has the spa status and the region and the capital of Prague are the only two regions without any health resorts located in their territories.
Source: Czech spas and balneology. Ministry for regional development of the CR, Prague 2007.
Fig. 9. Spa of the territory of the South-East
16 Czech spas and balneology. Ministry for regional development of the CR, Prague 2007.

SPA HEALING SOURCES IN CZECH REPUBLIC
41
• South-Moravian Region
South-Moravian Region – natural healing sources and other selected characteristics
Health resort
Municipality (District)
Natural healing sources
Indications and treatment
Health resort of Hodonín
Hodonín (Hodonín)
Natural iodine-bromine water from the Lužnice wells
Diseases of the locomotive system, root syndromes, diseases of the circulatory system
Lednice Lednice (Břeclav)
Strongly mineralised iodine-bromine mineral waters containing salts of iodine and bromine
Diseases of the circulatory system, diseases of arteries in the extremities, diseases of the locomotive system, rheumatism, states after injuries and orthopaedic operations, Bechterev disease, arthrosis
Source: own processing on the basis of information from literature
3. Conclusions
Czech health resorts have good traditions with a relatively good level in Europe. Numbers of foreign visitors also tend to increase. The average life expectancy in advanced countries of Europe and the world is getting longer and the need to maintain the life quality is becoming urgent. Seniors in advanced countries are not only interested improving in the quality of their lives but the also have sufficient financial resources for this purpose. This is the reason why they often stay in health resorts and use balneotherapeutical care. But, naturally, this does not include seniors only – civilisation diseases, diseases of the locomotive system etc. also affect even much younger generations. Furthermore, the numbers of spa visitors are becoming higher because of those interested in relaxation stays, wellness, etc. At present, both new procedures based on modern knowledge of medicine and curative procedures imported from eastern cultures become extended dynamically in European balneology. On the other hand, standard balneotherapeutical curative procedures using natural resources are still used.
The Czech Republic can make use of a relatively strategic geographical position as well as the natural potential; this is situated in different extent in twelve of the fourteen administrative regional units. The Karlovy Vary Region (Karlovy Vary, Mariánské Lázně, Františkovy Lázně, etc.), which is one of the most important spa destinations within central Europe due to is spa character, naturally occupies a dominating position. But health resorts in other regions also have rich traditions and excellent healing effects (e.g. the South-Bohemian Region – e.g. Třeboň, the Moravian-Silesian Region – e.g. Karlova Studánka, the Olomouc Region – e.g. Jeseník and a number of others (Jánské Lázně, Lázně Bohdaneč, Lázně Bělohrad, Poděbrady, Luhačovice, etc.). Certainly, this country still has reserves and, I hope, also the future in the use of its natural potential.
ŠÁRKA BRYCHTOVÁ
42
REFERENCES
1. BUCHAROVIČ, S., WIESNER, S. Encyclopaedia of spas and healing springs in Bohemia, Moravia and Silesia. Prague: Libri. 2001 p. 15. ISBN 80-7277-049-7
2. Czech spas and balneology. Ministry for regional development of the CR, Prague 2007.
3. CHOVANEC, J. Czechoslovak spas and natural healing sources. Prague 1966.
4. JANDOVÁ, D. Czech spa medicine (information for MUDr. T. Julínek, minister, Ministry of Health of the CR). Advisory body
Other sources:
http://www.atlasceska.cz/ceska-republika/lazenstvi/
http://www.Czech.Republic.cz
http://www.priessnitz.cz/
Act No. 164/2001 Coll.

STUDIA UNIVERSITATIS BABEŞ-BOLYAI, NEGOTIA, LIII, 2, 2008
ROMANIAN TOURISM: A REGIONAL APPROACH
TIBERIU CRISTIAN AVRAMESCU 1
ABSTRACT. The present paper analyzes the situation of the Romanian tourism at regional level, starting with 1991. This is because the sustainable regional development must correlate and integrate the tourism in Romania, among other components of the local economy, taking also into account the lower impact on the environment and the investments needed for its development. The purpose of this analysis is that of identifying the problems that the field of tourism faces at the regional level, the development potential of this field and of establishing the aspects which must be taken into account by the tourism development policies. Keywords: regional economy, sustainable tourism, regional development.
INTRODUCTION
At the world level, the industry of tourism and travels represents the most dynamic sector of activity and, at the same time, the most important generator of jobs. From the economic point of view, tourism can represent for Romania one of the main sources of recovering the national economy, if we take into account the fact that we have at our disposal important natural resources.
It is a well-known fact that regional development is a compulsory condition for the admission of Romania in the European Union. The problems implied by the regional development amplify as the Union expands. That is because the diminishing of the gaps in the development of the various countries which will accede to the European Union is considered a priority. The policies and the regional development plans in the last years have paid more and more attention on the tourism field as a strategic sector for the achievement of a dynamic and sustainable economic growth of some regions that have an important tourism potential.
Tourism can bring both advantages and disadvantages to a region. Through careful planning, tourism can create new jobs and can contribute to an increase of income. The expansion of the tourism activity leads to the creation of new professions and has positive effects on the qualification and training levels of employees.
The prosperity of a region generated by tourism development has several stages: • immediately, as a result of the direct consumption of tourism products; • on short term, by the continuous absorption of employment and by
encouraging the souvenir selling;
1 Lecturer, Faculty of Economic Studies, Piteşti University, Romania, [email protected]

TIBERIU CRISTIAN AVRAMESCU
44
• on the long term, by the concentration of capital for investments in the general infrastructure and in that of tourism, in establishments of tourist reception and in the development of urban services.
Taking into account the economic, social and political importance of tourism, its contribution to the overall development of a region, it is necessary to conceive the promotion of some strategies of tourism development, not only at national but also at regional level. In drawing up these strategies, one must take into account the observation of the sustainable development principles which refer to the development of the tourism sector, the requirements of the natural environment protection, and the consideration of the specific goals of each area or region.
Tourism will continue to be sustainable if its development will be planned rationally, if the development policies and criteria will respect the sustainability principle and it will be achieved by the cooperation of the public institutions and of the private sector. At the same time, this development must be supported by the civil society and the local communities.
The mix of negative factors (the infrastructure condition, the obsolete mentalities, the insufficient professional training, the economic crisis, etc.) to which a certain inertia and superficiality of the local public institutions regarding the local development of tourism is added, explain the difficulties which this field - so dependent on the general state of the national economy - is faced with. Thus, the existence of a national program of regional development is of utmost importance, because it identifies the main goals of less evolved regions from the start.
The regional development strategy, especially that for the regions that have valuable tourism sights, must take into account the fact that an increased number of tourists has positive effects on the regional economy, both directly, by the total value of the proceeds obtained from the tourist consumption, and indirectly, by the contact and local bilateral cultural influences, the knowledge of the local economic values and of the possible business opportunities, the creation of jobs in the tourism field and obtaining a favourable image.
The process of tourism reform in Romania will have to create the necessary background for a sustainable development in this field, having as goals to increase the standard of living in the case of the local communities, to preserve the natural and anthropic touristic resources in view of a continuous utilization in the future, to make the local population and the tourists aware of what preservation means.
The Romanian tourism phenomenon has its own structures and spatial traits. There are regional differences caused by the unequal spreading of the elements with natural and anthropic tourism potential, by the qualitative and quantitative differences in the territory, by the degree and the way in which the existent potential is made profitable or by the different way the tourism regions are equipped. All these lead to the fact that some tourism area or regions stand out. These will then be used for the tourism preparation and the organization of the geographical space and, therefore, for setting the regional development goals in the tourism field.

ROMANIAN TOURISM: A REGIONAL APPROACH
45
The division of the geographical space into tourism regions aims at delimitating some geographical spaces with favourable conditions for the development of the tourism phenomenon, taking into account the quality of the tourism resources and the profile of various spaces. This is based on the complex knowledge of the analyzed territory and on the use of such criteria as: the specific tourism fond, the degree of making profit of the tourism potential by the tourism flows, the criterion of the most important objective for that area or of the functional structure, etc2.
Generally, the national or international programs which support and finance the projects in the tourism sector are managed and carried out at the level of development regions and that is why it is very important, for a fair allocation of resources, to evaluate the development regions from the point of view of the tourism resources they posses and that of the general and tourism existent infrastructure.
The tourism areas or regions and the development regions are territorial units formed and delimited according to different criteria. That is why they can not be compared. The space of a tourism region can be sometimes included in a development region but, in most of the cases, it lies at the border between two or even among several development regions. However, one can establish functional connections among the two types of inferior taxonomic levels of the tourism regions regarding, for example, the financing of some tourism projects in a certain tourism centre or for a tourism goal or area which has a clearly delimitated territorial-administrative position.
Tourism contributes directly and indirectly to the economic development of some places, areas and regions by introducing the natural conditions, the cultural-historic patrimony and the economic achievements in the internal and international tourism tours. Tourism has the capacity to contribute to the internal development of a region, to diminishing the regional imbalances, to the geographical reallocating of welfare from the metropolitan areas towards the poorest, peripherical regions.
Therefore, tourism is a viable development alternative of various regions. In this context, due to its geographical position and to its rich natural and anthropic potential, Romania will be able to become a very attractive region from the tourism point of view, if a series of tourism development strategies will be developed, implemented and promoted both at the national and international level.
MATERIAL AND METHODS
In the present paper, in order to emphasize the evolution of the tourism phenomenon at the national and regional level, we have resorted to the data provided by the National Institute of Statistics and Economic Studies in Romania in the Statistical Yearbook of Romania and Regional Statistics. The analyzed period is 1991-2006. These publications provided primary data about the tourism sector. That is why,
2 Popescu, Claudia Rodica (coordonator), 2004, DisparităŃi regionale în dezvoltarea economico-
socială a României, Editura Meteor Press, Bucureşti, p. 214.

TIBERIU CRISTIAN AVRAMESCU
46
in order to interpret the statistic data correctly, we have resorted to other sources, too, such as the specialised economic publications, interviews with specialists working for governmental institutions or private sector. At the same time, we have appealed to the studies provided by the National Institute of Research and Development in Tourism and by the Tourism National Authority. The National Development Plan, the Regional Operative Plan and the Regional Development Plans drown up for the period 2007-2013, were very useful as they allowed us to see the tendencies in the evolution of tourism for each development region and the development possibilities of this field. Our research is based on the document analyses as well as on the calculations, interpretations and correlations noticed by us.
RESULTS
The scientific method of knowledge applied to any field of activity, phenomenon or process implies the selection of various aspects of reality in order to establish the most appropriate methods for making the respective analysis. Such an analysis of the tourism sector enables the study of the behaviour traits of the consumer of tourism services. It also enables to make appropriate decisions and helps forecasting.
Thus, in the period 1991-2001, the existing accommodation capacity, expressed in number of accommodation places has steadily decreased, from 312,407 existing accommodation places in 1991 to 277,047 in 2001 (Table 1). Among other things, this evolution is due to the serious wear of some equipment and their elimination from the tourism tour (definitively or temporarily) and also to the change of destination of some locations as they have become private property, etc. The fact that, in the last years, many new locations have been brought into operation could not compensate for the elimination of some locations from the tourism tour because the new locations had only a few accommodation places. However, starting with 2002, the number of accommodation places has gradually increased (287,158 places in 2006) which shows the fact that the tourism field becomes attractive for investors.
Table 1.
The existing accommodation capacity by development regions, in the period 1991-2006
- Number of accommodation places - Year Total North-
East South-East
South South- West
West North-West
Centre Bucharest
19911 312407 23321 146527 25955 22230 21036 24732 38600 10006
19921 302533 22647 141917 23398 18766 23713 24270 37632 10190
19931 293036 21134 139281 23506 18046 23335 23357 35244 9133
19942 292479 21779 132505 23583 17875 23096 26259 38794 8588 19952 289539 20250 133739 23082 17462 22919 26044 37584 8459

ROMANIAN TOURISM: A REGIONAL APPROACH
47
19962 288206 18814 134489 23641 17010 22028 26493 36513 9223 19972 287943 19096 133296 23744 17118 22304 26472 36997 8916 19982 287268 19131 133006 23139 16890 22288 27231 36915 8668 19992 282806 18832 133548 22347 15363 21306 26382 36026 9002 20002 280005 17745 134081 22433 15295 21740 25547 35235 7429 20012 277047 16971 132053 21321 15326 22298 25197 34648 9233 20022 272596 17269 130111 21456 14855 20190 24561 33823 10331 20032 273614 17965 130991 21729 15112 20713 24320 32759 10025 20042 275941 17183 130854 22494 13936 21066 24576 34365 11467 20052 282661 18718 132965 22292 14672 21291 26019 35479 11225 20062 287158 18968 134560 20827 14816 21423 26816 37025 12723 1 Accommodation capacities at the end of the respective year 2 Accommodation capacities as of July 31st. Source: Territorial statistics 2002, INSSE, Bucharest, p. 327-336; Statistical Yearbook of Romania, INSSE, Bucharest, 2002, p. 784, 2003, p. 839, 2004, p. 713, 2005, p. 740, 2006, p. 740 and 2007, p. 758.
Among development regions, the regions that have the largest number of
accommodation places are: the South-East region, with 134,560 accommodation places (48%), followed by the Central region, with 37,025 accommodation places (13%) and the North-West region, with 26,816 accommodation places (9%).
We can notice that the South-east region has almost a half of the total of the existing accommodation places at the national level. This fact is explained because the region contains the seaside where the greatest tourism investments have been made in the period 1966-1980.
The analysis of the accommodation capacity evolution by regions in the period 1991-2006 shows the same tendency as that at the national level: in all the development regions the number of accommodation places diminished significantly in the above mentioned period even if one can notice a slight recovery tendency in the last years. In the first years of transition, the diminishing was rapid. After 1994, the diminishing was rather slow. In fact, all the economic indicators in general and the touristic ones in particular have been subjected to such evolution.
In the last years one can notice an obvious tendency of increasing the number of tourist accommodation units. This evolution is accounted for the building or reintegration in the tourism tour of some hotels, motels, villas, chalets, touristic and agritourist boarding houses, camping, holiday villages, camps for pupils and preschool children, etc. This positive evolution of some small-dimensions locations is due to diminishing the tourists’ interest for locations with a large number of accommodation places (hotels, motels) and to increasing tourists’ interest for such units as flats, villas, tourist and agritourist boarding houses, which, besides comfort, provide an individualization of holidays, tendency which can be found on the international level, too.

TIBERIU CRISTIAN AVRAMESCU
48
The analysis of the evolution of the establishments of tourism reception which provide touristic accommodation shows the fact that, on the national level, the most important share is still hold by hotels and motels. However, the touristic villas and bungalows, the urban and rural touristic boarding houses hold an important part. (Table 2).
Table 2.
The establishments of touristic reception which provide touristic accommodation, by development regions, on the 31st of July 2006.
- Number of units -
Tot
al
Hot
els
and
Mot
els
Tou
rist I
nns
Tou
rist C
hale
ts
Cam
ping
and
oth
er h
ouse
let-
type
uni
ts
Tou
ristic
Vill
as a
nd
Bun
galo
ws
Cam
ps fo
r P
upils
and
pr
esch
ool c
hild
ren
Urb
an to
uris
t boa
rdin
g ho
uses
Hol
liday
vill
ages
Rur
al to
uris
t bo
ardi
ng h
ouse
s
Hot
els
for
You
ng P
eopl
e
Hos
tels
Tou
rist h
altin
g pl
aces
Acc
omm
odat
ion
area
s on
sh
ips
TOTAL 4710 1220 9 116 121 1040 128 702 2 1259 34 41 31 7 North-East
435 88 - 10 11 35 16 76 - 177 6 8 7 1
South-East
1278 407 1 5 54 600 25 59 - 103 7 7 6 4
South 433 131 2 23 5 53 15 83 - 110 1 6 2 2 South-West
250 85 - 4 10 47 7 44 - 43 3 5 2 -
West 409 119 4 16 10 69 19 107 - 52 5 2 6 - North-West
543 134 2 20 13 94 21 56 - 193 3 4 3 -
Centre 1223 181 - 37 16 133 20 244 2 573 8 6 3 - Bucharest 139 75 - 1 2 9 5 33 - 8 1 3 2 - Source: Statistical Yearbook of Romania 2007, INSSE, Bucharest, p. 756 – 757. Thus, at the level of the entire country, there are 1029 hotels and motels (28.83% of the total of the tourist accommodation units) and 941 tourist villas and bungalows (26.36%). An important part is played by the rural tourist boarding houses (515, representing 14.42%). These structures have developed a lot lately as they have benefited from the opportunities offered by the rural tourism in many of the regions of the country. Mention must be made of the fact that, if a few years ago the hotels and motels had the greatest share in all the regions of the country, in the present these accommodation units are dominant only in four regions (South, South - West, West and Bucharest).

ROMANIAN TOURISM: A REGIONAL APPROACH
49
Another interesting aspect is the rather high number of rural tourist boarding houses. Almost half of them (259 units that is 50.29%) are located in the Center region which is made up of Alba, Brasov, Covasna, Harghita, Mures and Sibiu counties. This region has a high potential of rural tourism development. At the same time, a large number of rural tourist boarding houses are located in the North-West region (Bihor, Cluj, Bistrita-Nasaud, Maramures, Salaj, Satu-Mare counties), another area that abounds in traditions and with a high potential of rural tourist development. In order to develop, the rural tourism has at its disposal financing programs which aim at developing these rural tourist boarding houses. This, together with the change of the behaviour of the consumer of tourist services, explains the large number of rural tourist pensions that have come up in the last years. From the point of view of the distribution of the establishments of tourist reception which provide accommodation on development regions, in this classification the first place is taken by the South-East region with 30% (it includes the seaside of the Black Sea) and the Centre region with 24% (an important area of practising rural tourism). Just like the number of accommodation places, the index of net use of the functioning capacities had a decreasing evolution (Table 3.). It has decreased at the national level from 49.8% in 1991 to 33.6% in 2006. The same evolution is to be found in territory, the regions that have the lowest value of this index are Bucharest (from 60.6% in 1991 to 38.0% in 2006), North-East (from 46.1% to 28.9%) and South (from 52.6% to 30,5%), that is, except Bucharest, a large part of these “sensible” regions of the country. Among the regions in which the value of this index diminishes slowly mention can be made of: West (from 49.0% to 36.3%) and South-West (from 46.2% to 38.8%), transit regions to the country’s frontiers.
Table 3.
The indexes of the use of the functioning capacities, by development regions, in the period 1991-2006.
- % - Year Total North-
East South-East
South South- West
West North-West
Centre Bucharest
1991 49.8 46.1 52.9 52.6 46.2 49.0 46.1 46.0 60.6 1992 46.7 43.7 52.3 45.5 45.8 43.6 41.9 41.5 58.3 1993 43.1 40.4 49.6 41.1 42.0 36.0 38.1 38.7 57.9 1994 43.7 37.6 48.4 44.6 47.8 40.1 36.3 42.4 52.6 1995 45.0 37.7 51.4 49.5 49.3 38.7 37.5 41.4 52.5
1996 40.7 35.9 47.2 45.1 43.8 33.7 32.0 38.9 43.5 1997 37.7 31.7 43.0 43.2 39.7 31.9 29.7 34.8 47.5 1998 36.1 33.2 44.5 32.6 39.7 31.5 28.6 32.0 40.9 1999 34.5 30.0 41.5 29.5 41.8 35.4 29.0 29.3 38.5 2000 35.2 31.7 44.8 28.9 42.6 36.3 29.9 28.0 36.3 2001 34.9 30.2 42.3 29.2 44.9 36.9 31.9 28.2 32.2 2002 34.0 28.9 38.2 27.1 45.0 39.1 32.8 28.8 31.9

TIBERIU CRISTIAN AVRAMESCU
50
2003 34.6 29.2 37.8 28.7 44.4 38.7 35.5 28.5 35.9 2004 34.3 29.5 39.2 27.7 44.5 35.9 33.2 29.4 35.3 2005 33.4 27.2 37.8 28.1 40.6 34.7 32.2 29.5 38.1 2006 33.6 28.9 36.8 30.5 38.8 36.3 32.1 29.5 38.0
Source: Territorial statistics 2002, INSSE, Bucharest, p. 327-336; Statistical Yearbook of Romania, INSSE, Bucharest, 2002, p. 784, 2003, p. 839, 2004, p. 713, 2005, p. 740, 2006, p. 740 and 2007, p. 758.
If we analyze the data in the above table, taking into account the country and the development regions, we notice a evolution of the index of net use of the functioning capacities which is similar to other tourism indexes: a sudden decrease of the value of this index in the first years of transition (till 1993), followed by slow decreases of its value in the following years and even by slow increases of its value in some periods (1995 and 2000). However, one can say that the degree of use of the accommodation capacities is very low because, in Romania, it is accustomed to practice tourism only in peak seasons not all the year round. That is why the competent officials and the hotel keepers must find solutions for diminishing the seasonal character of tourism and for obtaining optimal levels of number of tourists in extra-season, too. A descendent evolution had the “Arrivals” index, too (Table 4.). This evolution is explained by the modest life conditions which prevented most Romanians from leaving in holidays. At the same time, the increasingly bad quality of the tourism services made those with high incomes to spend their holidays abroad. But, in the last years (2003-2006), as the Romanian economy and the Romanians’ incomes increased, the tourist circulation increased, too. Unlike the previous years, when the Romanians had only one long holiday, in the summer, in the present, the medium and high-level income Romanians have developed another tourism habit: short leaves, especially at the end of the week, but numerous, all the year round. As this habit extends, the problem of the seasonal character of tourism will be solved but only to a certain extent. This problem will not be solved entirely unless the retired people become an active category from the tourism point of view.
Table 4. Tourists’ arrivals in tourist units, by development regions,
in the period 1991-2006
- thousands- Year Total North
-East South-East
South South- West
West North-West
Centre Bucharest
1991 9603.3 1389.5 1789.2 1184.9 793.3 923.8 1099.6 1494.4 928.6 1992 8015.0 1120.3 1517.2 1045.9 642.4 783.4 910.3 1287.1 708.5 1993 7566.2 923.9 1400.1 903.7 576.0 705.9 1053.8 1177.8 825.0 1994 7004.7 846.4 1283.8 763.8 495.4 695.3 850.1 1114.8 955.1 1995 7070.4 820.0 1395.4 816.5 544.6 648.1 805.7 1173.0 867.1 1996 6594.9 780.8 1293.7 729.4 506.3 619.0 781.0 1234.7 649.9

ROMANIAN TOURISM: A REGIONAL APPROACH
51
1997 5727.0 662.8 1129.1 667.0 433.7 515.9 619.3 980.3 718.9 1998 5552.1 635.9 1171.5 641.6 374.3 520.3 605.9 927.5 675.2 1999 5109.4 568.8 1007.5 569.6 343.1 539.4 601.1 855.6 624.4 2000 5920.1 543.0 980.8 552.6 327.1 568.9 559.6 868.0 520.0 2001 4875.0 535.0 994.0 546.0 338.0 541.0 596.0 837.0 488.0 2002 4847.0 535.0 984.0 549.0 350.0 493.0 629.0 753.0 554.0 2003 5057.0 553.0 1019.0 572.0 324.0 520.0 637.0 847.0 585.0 2004 5639.0 619.0 1133.0 576.0 361.0 536.0 698.0 986.0 730.0 2005 5805.0 622.0 1108.0 579.0 334.0 535.0 733.0 1068.0 831.0 2006 6216.0 678.0 1081.0 627.0 371.0 614.0 781.0 1164.0 900.0
Source: Territorial statistics 2001, INSSE, Bucharest, p. 327-336; Statistical Yearbook of Romania, INSSE, Bucharest, 2002, p. 784, 2003, p. 839, 2004, p. 713, 2005, p. 740, 2006, p. 740 and 2007, p. 758.
If we take into account the development regions, the evolution of the index
is similar. We should mention the fact that the most dramatic decrease of the value of the “Arrivals” index, in relative expression, is in the South-West and North-East regions. Thus, if in 2006 the number of arrivals in the entire country was 64.72% of the number of arrivals recorded in 1991, in the South-West region this percent is only 46.76 % and in the North-East region is of 64.72%. Bucharest (96.92%), Centre (77.89%) and North-West (71.02%) are at the other end of this classification. Thus, one can notice the fact that in the poor regions of the country the reduction of arrivals is dramatic whereas in the developed regions the reduction is less dramatic. The situation would have been even worse if we had compared 1991 with 2002 (the year in which the “Arrivals” index had the lowest value).
In the classification obtained taking into account the tourists’ preferences for a certain region, the leader is the Centre region (18.7%), followed by the South-East region (17.4%). This classification is not surprising because these regions include the seaside region, the main mountain areas and many historic regions of the country which abound in old traditions. We think that in the next years the Centre region will become leader and the most important tourism region.
The same decreasing tendency is to be noticed in the case of the “Staying overnight” index (Table 5.).
Table 5.
Staying overnight in the tourist units, by development regions, in the period 1990-2006
Year Total North-East
South-East
South South- West
West North-West
Centre Bucharest
1991 31927.0 3064.0 9505.4 3512.0 2730.0 2936.8 3259.9 4659.3 2259.6 1992 26076.0 2520.0 7642.0 2864.0 2369.0 2344.0 2557.0 3798.0 1982.0 1993 24768.6 2176.1 7655.9 2614.1 2070.0 2101.7 2714.1 3517.2 1919.6 1994 23295.7 2052.9 6926.7 2385.5 1974.9 2220.1 2518.3 3495.5 1721.8
1995 24111.2 1987.3 7733.7 2386.2 2044.1 2239.5 2542.2 3552.0 1626.2

TIBERIU CRISTIAN AVRAMESCU
52
1996 21837.9 1894.9 7114.1 2207.3 1791.9 1892.0 2194.3 3337.7 1405.7 1997 19611.5 1615.8 6097.5 2135.3 1682.1 1712.1 1951.2 3020.2 1397.2 1998 19183.2 1642.1 6205.5 1961.1 1619.0 1749.9 1920.5 2831.2 1253.9 1999 17669.8 1440.4 5335.1 1789.1 1569.8 1827.7 1937.6 2627.8 1142.2 2000 17646.7 1467.8 5451.9 1470.5 1591.2 1878.1 1960.8 2560.3 996.1 2001 18122.0 1406.0 5602.0 1759.0 1745.0 1933.0 2118.0 2591.0 968.0 2002 17277.0 1332.0 5214.0 1623.0 1691.0 1909.0 2132.0 2316.0 1060.0 2003 17845.0 1451.0 5154.0 1704.0 1643.0 2034.0 2251.0 2431.0 1177.0 2004 18501.0 1490.0 5397.0 1782.0 1648.0 1939.0 2221.0 2655.0 1359.0 2005 18373.0 1436.0 5139.0 1807.0 1602.0 1836.0 2290.0 2782.0 1481.0 2006 18992.0 1599.0 4854.0 1941.0 1641.0 2006.0 2363.0 2930.0 1658.0
Source: Territorial statistics 2002, INSSE, Bucharest, p. 327-336; Statistical Directory of Romania, INSSE, Bucharest, 2002, p. 784, 2003, p. 839, 2004, p. 713, 2005, p. 740, 2006, p. 740 and 2007, p. 758.
It is difficult to evaluate the value volume of the tourism activity because in statistical studies the proceeds of hotels are cumulated with the ones of restaurants visited not only by tourists but also by native population. At the same time, from the statistical studies, one can not infer the value volume of the provided tourism services. That is why, in order to present the volume of the tourism activity I have decided to analyze the turnover index of the hotels and restaurants, though this presents only a part of the provided tourism services.
Analyzing the data in Table 6, one can notice that the Bucharest region occupies the first position as regards the turnover of hotels and restaurants (2104 million lei that is a share of 28.70%). Bucharest is an important region for tourism business. This fact accounts for the important share of this region in the total value of the proceeds obtained by restaurants and hotels. Bucharest is followed by the North-East regions, with 1049 million lei, that is a share of 14,30% (transit area), the South-East region, with 982 million lei, that is the sharing of the 13,39% (seaside tourism) and Centre with 942 million lei, that is a share of 12,84% (rural tourism).
Table 6. The turnover of the active locative units in hotels and restaurants, in 2006
- Million lei current prices- Tota
l North-East
South-East
South South-West
West North-West
Centre
Bucharest
Total (mil. lei)
7331 581 982 620 416 637 1049 942 2104
Share (%)
100 7.92 13.39 8.45 5.67 8.68 14.30 12.84 28.70
Source: Calculated according to the Statistical Yearbook of Romania 2007, INSSE, Bucharest, p. 623 – 627.
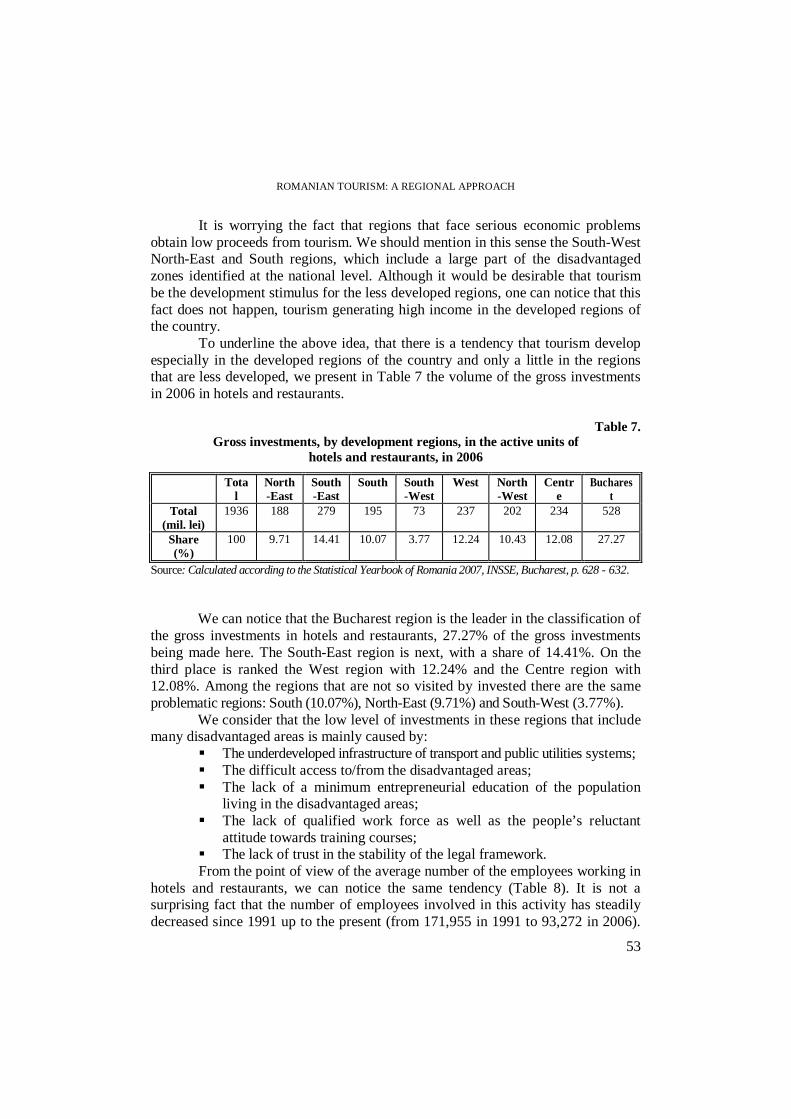
ROMANIAN TOURISM: A REGIONAL APPROACH
53
It is worrying the fact that regions that face serious economic problems obtain low proceeds from tourism. We should mention in this sense the South-West North-East and South regions, which include a large part of the disadvantaged zones identified at the national level. Although it would be desirable that tourism be the development stimulus for the less developed regions, one can notice that this fact does not happen, tourism generating high income in the developed regions of the country. To underline the above idea, that there is a tendency that tourism develop especially in the developed regions of the country and only a little in the regions that are less developed, we present in Table 7 the volume of the gross investments in 2006 in hotels and restaurants.
Table 7. Gross investments, by development regions, in the active units of
hotels and restaurants, in 2006
Total
North-East
South-East
South South-West
West North-West
Centre
Bucharest
Total (mil. lei)
1936 188 279 195 73 237 202 234 528
Share (%)
100 9.71 14.41 10.07 3.77 12.24 10.43 12.08 27.27
Source: Calculated according to the Statistical Yearbook of Romania 2007, INSSE, Bucharest, p. 628 - 632. We can notice that the Bucharest region is the leader in the classification of
the gross investments in hotels and restaurants, 27.27% of the gross investments being made here. The South-East region is next, with a share of 14.41%. On the third place is ranked the West region with 12.24% and the Centre region with 12.08%. Among the regions that are not so visited by invested there are the same problematic regions: South (10.07%), North-East (9.71%) and South-West (3.77%).
We consider that the low level of investments in these regions that include many disadvantaged areas is mainly caused by:
� The underdeveloped infrastructure of transport and public utilities systems; � The difficult access to/from the disadvantaged areas; � The lack of a minimum entrepreneurial education of the population
living in the disadvantaged areas; � The lack of qualified work force as well as the people’s reluctant
attitude towards training courses; � The lack of trust in the stability of the legal framework. From the point of view of the average number of the employees working in
hotels and restaurants, we can notice the same tendency (Table 8). It is not a surprising fact that the number of employees involved in this activity has steadily decreased since 1991 up to the present (from 171,955 in 1991 to 93,272 in 2006).

TIBERIU CRISTIAN AVRAMESCU
54
This is an obvious tendency both at national and regional levels. However, in the last period (2001-2006) it can be noticed a slight increase of the medium number of employees, both at national and regional levels. This is a sign that tourism has gained a greater importance in the national economy.
Table 8.
The average number of employees, in the activity of hotels and restaurants, by development regions, in the period 1991-2006.
- persons - Year Total North-
East South-East
South South- West
West North-West
Centre Bucharest
1991 171995 21761 29364 19955 16481 15875 20191 25801 22567
1992 122039 14541 19803 15426 11790 11629 12032 17400 19418
1993 112020 15146 17222 14415 9416 10811 14066 14683 16261
1994 124112 24720 16484 11295 11354 19842 24230 17281 8906
1995 114943 15642 17918 11154 17032 13402 12090 15243 12462
1996 109104 14385 17010 11365 10809 14703 12600 16922 11300 1997 117693 16469 23257 12413 12194 14753 10200 14906 13501 1998 93456 11444 19628 7265 7718 9951 11202 14226 12022 1999 91191 11716 13354 8917 10654 9545 10599 16706 9700 2000 83830 8372 13275 7955 8139 9712 10289 12519 13569 2001 68064 8203 11683 6355 6523 6704 8757 9670 10170 2002 76143 6642 12585 6208 6832 10385 8113 11346 14032 2003 81297 7489 12309 7140 7711 9413 10052 13151 14032 2004 88772 8257 15123 7741 6121 8413 10933 15437 16747 2005 89710 9268 12194 8138 7237 9187 10709 13939 19038 2006 93272 10190 13727 8689 7661 9843 10991 14948 17223
Source: Territorial statistics 2002, INSSE, Bucharest, p. 88-107; Statistical Yearbook of Romania, INSSE, Bucharest, 2002, p. 648, 2003, p. 692, 2004, p. 604, 2005, p. 188, 2006, p. 188 and 2007, p. 204.
DISCUSSIONS
Tourism development by regions is an ample process that takes a lot of time. At the base of the regional development process lie strategies implying a coherent mix of objectives, priorities and means that all aim at developing tourism by regions. It is of paramount importance for Romania to draw up some strategies of tourism development which correspond to the requirements and particularities of the country and to its development regions.
Therefore, the sustainable planning entails a regional approach of tourism activity. This means that the community must be involved in the planning and development process as well as in creating and developing types of tourism that generate benefits for the natives. If they have advantages due to tourism development, then they will certainly be much more interested in encouraging a tourism development of the respective region, having in view the preservation of the tourism resources, at the same time.

ROMANIAN TOURISM: A REGIONAL APPROACH
55
According the objectives of the macroeconomic policy, the territorial decision-making factors can set their own economic development planning and their priorities. From this point of view, the regional and local, private and public institutions can set the developing steps for the tourism sector.
In order to achieve the planning of tourism development at local and regional levels, the following aspects must be taken into account3:
� identifying and equipping the tourism resources, encouraging the private households to practice tourism;
� organizing some training courses at regional or local level for performing some jobs that are characteristic to tourism;
� granting financial-banking assistance for obtaining credits for starting tourism activities;
� supporting the private persons in obtaining the homologation certificates of the tourist structures and the professional licences and patents in the field;
� training some local specialists in tourism field. A strategy for developing and promoting tourism activity at the level of
one region is a distinct part of a broader regional development strategy. Both the European reality and the Romanian one show that the regional and local development depends directly on the achievement of some local programs that will be managed by the local institutions which know better the existing problems and possibilities.
A regional strategy of sustainable tourism development has to: � contribute to the development of a sustainable tourism in the region
which is to generate incomes and jobs at the level of the local collectivities; � have in view the preservation of the natural and cultural environment; � create structures that facilitate investments, especially in small and
medium-size companies; � facilitate the cooperation between the private and public sectors and to
grant facilities to those that want to make business in the tourism sector; � contribute to a better understanding of the part played by tourism in the
regional economy and to involve the national government and the regional organisations in tourism development;
� contribute to the unification of the regional effort for tourism development. In order to draw up a regional tourism strategy it is compulsory to take into
account both the present situation of the Romanian tourism and the future predictable evolutions. The tourism offer must be established and developed from the point of view of the accession to the European Union. This fact entails the integration of several objectives, among which we can mention: regional development, education, culture, international cooperation.
3 Hanciuc, Nina, 2003, “ConsideraŃii privind necesitatea unor strategii regionale de promovare a
turismului în contextul noii orientări de dezvoltare spaŃială durabilă”, în “Dezvoltarea regională şi integrarea europeană”, lucrările celui de-al doilea simpozion naŃional al AsociaŃiei Române de ŞtiinŃe Regionale, 4 – 5 aprilie 2002, Editura Oscar Print, Bucureşti, p. 406.

TIBERIU CRISTIAN AVRAMESCU
56
At the same time, we must underline the fact that the achievement of a sustainable tourism market has become a necessity because only on such a market investments in the most profitable fields can be generated, investments that will contribute to the development of the entire region.
The positive effects of tourism development on economic and social levels are well known. At the same time, special attention must be paid to costs and to the resources required by tourism development. This problem acquires special meanings when it is approached in the terms of sustainable development, whose key-elements are the equity in the distribution and access to resources in time and space, the protection of the environment and the economic development capable to guaranty the quality and quantity of natural resources.
Thus, it is a well-known fact that the use of the environment resources for tourism development leads frequently to their diminishing and ware, which limits the development of tourism and has negative effects on the quality of the tourism product. That is why the literature about the environment protection in connection with the tourism development approaches this matter as a problem of resource management.
Taking into account all the above mentioned aspects, we obviously need an integrating perspective of the regional strategies and policies. Such an approach shows at least two essential aspects4:
• the multiplication effects generated by the expenses in the tourism field in the economy of regions, localities;
• the relation between tourism and the resources used by it, seen from the perspective of equipping the territory, of dividing the territory in tourism areas and of the compatibility with the environment protection criteria in the broader context of sustainable development.
The impact of tourism on the various economic branches of a region can be divided into multiplication effects, stimulation effects in the case of production, income and employment.
When tourism is approached in terms of sustainable development, the relation between this field and the resources it uses is very important, being mainly regarded as a resource management problem. It shows a series of specific aspects on which the economic policy must focus. These aspects are5:
• the competition between tourism and other users of the resources used by tourism;
• the resources used by tourism are not entirely a part of the system accounted by tourism, a series of costs and benefits being external to the tourism sector;
• the exterior costs are the main reason that hinders the tourism development. 4 Constantin, Daniela LuminiŃa, 2000, Turismul şi strategia de dezvoltare regională durabilă: efecte şi costuri, în “Revista Română de Statistică”, nr. 8 – 9/2000, p. 36 - 37.
5 Idem, p. 39.

ROMANIAN TOURISM: A REGIONAL APPROACH
57
Our opinion is that, in order to achieve a balanced development of tourism at regional level, it is compulsory to obey a set of principles which arise from the requirements of sustainable development:
• the protection of national patrimony (natural and anthropic) as compared to the development plans that suggest the use of these resources for tourism, making a clear-cut distinction between the regenerating and the non-regenerating resources;
• the equality between generations, sectors, regions from the point of view of the resources which are important for the tourism development;
• the key-question in using the resources must take into account what the involved actors want to obtain, what are the results, the consequences of their action rather than how much visitors can bear these resources.
The application of the sustainable development criteria of tourism generates specific aspects which must be taken into account when drawing up the programs of regional development which must approach explicitly the space and the problems of the local economies and communities. In general terms, taking into account its complexity, the sustainable development at the regional level must be considered a long-term objective which can be achieved gradually. In the beginning, stress will be laid on the major challenges to which environment is subjected, so that some compensations will be accepted, compensations that refer to the positive and negative changes of the components of the welfare function (fragile, weak sustainable development). But the final purpose is the powerful sustainable development, which implies the improvement of all components of the welfare function, without the failure of any of them.
The setting up of administrative regions is a factor that would have an essential contribution to increasing the part played by the regional institutions and to their reformation. Although such a decision involves certain risks, especially politic risks, this fact would contribute to the encouragement of partnership among counties and to the formation of a regional spirit. At the same time, the administrative regions would offer the possibility of supporting the local interests. But what impact can the regional consolidation have on tourism?
• the existence of some regional structures of tourism would generate an increased efficiency in the administration of the tourism field, an important stress laid on the allocation of funds and on management;
• the marketing operations could be carried out much more efficiently than if they are promoted from the national level, because of a better knowledge of the tourism facilities and services in the respective region;
• a comprehensive national programme can not be the solution in all cases. Some aspects must be dealt with at the level of regions which know better the specific problems of tourism in the areas that are managed by them.
My opinion is that the present development regions are too large and inappropriate to be developed and promoted for tourism as independent destinations. They do not lay stress on marketing and they themselves are not brands. They are not profitable destination areas. The administrative limits they define as tourism destinations are opposed to the realities of the respective sector.
TIBERIU CRISTIAN AVRAMESCU
58
CONCLUSIONS
From the above analysis, we can conclude that tourism faces a series of problems such as:
• the decrease of the number of tourists on the one hand because of the decrease of the standard of living of a part of the country’s population, and, on the other hand, because a large part of the Romanians with high income chose to spend their holidays abroad;
• the existence of a large number of hotels, with obsolete or inappropriate facilities and assets, with low indexes that refer to the use of the tourist accommodation capacities;
• the decrease of the number of staying over night in motels, hotels, camping and a corresponding increase of those that spend their holydays in tourist urban and rural boarding houses;
• less numerous employees, most of them instable, partly used, not well prepared, not appropriately trained for top quality tourist services;
• only a few investments in tourism have been made.(4) Apart from this, tourism has a general supporting infrastructure (a different
one than that of the communications) that is inappropriate and obsolescent. At the same time, the services of information and promotion of tourism are not developed enough.
Tourism can become an important component of the national economy. This can generate important changes in territory, contributing to the social-economic progress of some regions that are lagging behind or that lack other resources.
The above analysis allows us to draw the conclusion that there is a tendency of developing the tourism sector in the less developed regions of the country (Bucharest, South-East). At the same time, the authorities and the investors are less preoccupied by the less developed areas (North-East, South-West, North-West and South). Of course, one may object the fact that there are no important tourism sights in these regions. But this thing could be contradicted: these regions have at their disposal an important potential for developing the mountain tourism or the cultural and religious one. Because of the infrastructure that is not well developed, the mountain tourism in these areas is not well developed. At the same time, these regions comprise counties that lie along the Danube and in the field region where fishing and hunting tourism can be developed. It is interesting to follow the evolution of the touristic indexes in the following period, especially in the problematic regions.
After ten years since the first regional structures and institutions were created, the Romanian authorities have made great progresses in developing an institutional framework of regional development, in decentralizing the decision at the local level. One can say that there is a new type of approaching the regional development problems, based on the principles of decentralization, of effort concentration, of partnership and planning, principles that are also promoted by the European Union, which allow the authorities and the local and regional collectivities

ROMANIAN TOURISM: A REGIONAL APPROACH
59
to take an active part in the promotion of their own interests, by initiating and promoting regional development projects and programs. The development regions represent the best framework for the implementation the regional development policy, allowing the achievement of some specific development programs in various fields (industry, agriculture, tourism, etc.) having as final objective to assure the increase of the entire country’s standard of economic development.
REFERENCES
1. CONSTANTIN Daniela LuminiŃa, 1998, Economie regională, Editura Oscar Print, Bucureşti.
2. CONSTANTIN Daniela LuminiŃa, 2000, Turismul şi strategia de dezvoltare regională durabilă: efecte şi costuri, în “Revista Română de Statistică”, nr. 8 – 9/2000.
3. FIGUERA, Ana Paula, 2001, The Role of Planning in Local and Regional Tourism Development, XXVII Reunion de Estudios Regionales, Madrid.
4. GLĂVAN, Vasile, 2000, Turismul în România, Editura Economică, Bucureşti.
5. HANCIUC Nina, 2003, ConsideraŃii privind necesitatea unor strategii regionale de promovare a turismului în contextul noii orientări de dezvoltare spaŃială durabilă, în “Dezvoltarea regională şi integrarea europeană”, lucrările celui de-al doilea simpozion naŃional al AsociaŃiei Române de ŞtiinŃe Regionale, Editura Oscar Print, Bucureşti.
6. MINCIU, Rodica, 2001, Economia turismului, Editura Uranus, Bucureşti.
7. NEACŞU, Nicolae, 2000, Turismul şi dezvoltarea durabilă, Editura Expert, Bucureşti.
8. POPESCU Claudia Rodica (coordonator), 2004, DisparităŃi regionale în dezvoltarea economico-socială a României, Editura Meteor Press, Bucureşti.
9. *** - Institutul NaŃional de Statistică şi Studii Economice, 2002 – 2006, Anuarul Statistic al României, Bucureşti.
10. *** - Institutul NaŃional de Statistică şi Studii Economice, 2002, Statistică teritorială, Bucureşti.

STUDIA UNIVERSITATIS BABEŞ-BOLYAI, NEGOTIA, LIII, 2, 2008
THE ENVIRONMENTAL IMPACT OF BEER PRODUCTION
PARTENIE DUMBRAV Ă1, IOAN POP2, ENIKİ FAZAKAS 3, JOZSEF FAZAKAS 4, LUDOVICA BREBAN 5
ABSTRACT. After a short presentation of the URSUS brewery, including the enlargement of the products scale, the paper presents the study and the management of wastes resulted from the technological process and their environmental impact.
The studies of the impact on water, air and soil are pointed out. The results of these studies are presented by charts and diagrams, and in a quantifiable way, with the acquiescence of some bonuses.
The conclusion is that the environment is affected by the URSUS brewery’s activity within acceptable limits, with no irreversible negative effects. Keywords: beer, pollution, air, noise, vibrations, water. INTRODUCTION Beer is a drink consumed with pleasure due to its tasteful and a nutritive
quality, as well as due to the fact that it has low alcohol content. The quality of beer depends to a great extent on the quality of the raw matters (water, hop, air, malt, yeast, etc), which set the basis of beer fabrication. This quality is influenced by the environment it comes from. The mysteries and secrets referring to some beer kinds are closely connected to the composition of the raw maters, but also to the technological processes. In a reverse order, the influence of brewery upon the environment is felt in the different phases of the technological process, especially as regards the resulting waste management (organic and inorganic matters). This becomes more important as this brewery is located downtown.
URSUS Breweries, subsidiary of SAB Miller plc, is the second large beer producer in Romania, with an annual market quota estimated at approximately 25%. The company owns at the moment 4 beer factories with a total output exceeding 6 million hectolitres and it has more than 1,300 employees. URSUS Breweries operates in Bucharest, Cluj-Napoca, Timişoara, Buzău, Braşov and Tunari. The URSUS Breweries portfolio includes at present 6 brands: Ursus, Timişoreana, Ciucaş, Stejar, Peroni Nastro Azzurro and Pilsner Urquell.
1 Prof. Ph., Faculty of Business, UBB Cluj-Napoca. 2 Lecturer Ph., Faculty of Business, UBB Cluj-Napoca. 3 Lecturer dr., Faculty of Economics and Business Administration, UBB Cluj-Napoca, Sfantu-Gheorghe
Extention. 4 Prof. dr., Faculty of Economics and Business Administration, UBB Cluj-Napoca, Sfantu-Gheorghe
Extention. 5 Director CECCAR, Salaj County, Romania

PARTENIE DUMBRAVĂ, IOAN POP, ENIKİ FAZAKAS, JOZSEF FAZAKAS, LUDOVICA BREBAN
62
DOCUMENTATION AND METHODOLOGY
The data referring to the beer fabrication processes in SC Ursus Breweries SA Cluj-Napoca were extracted from the existing documentation of the brewery and from the practical experience of the authors. The information was processed according to the scientific methodology presented in the bibliographical references and compared to the environmental protection legislative provisions.
RESULTS AND DISCUSSIONS
I. The Story of the Ursus Beer
Having 130 years of experience in the field, the history of URSUS beer brand harmoniously combines with the history of Cluj. The Brewery in Cluj is documentarily attested at the end of the 19th century, more exactly in 1878 (according to some documents, the brewery seemed to have existed even since 1366).
In the documents of the time one mentioned the extraordinary quality of the amber-coloured beer, produced by the brewers’ brotherhood in Cluj.
After two world wars and a nationalization period, the breweries in Romania are still standing. During the last years they have even undergone a large modernization process, but they kept the traditional configuration and the fabrication style.
During the inter-war period, in the year 1929, The Brewery in Cluj was to bear the name of the newly founded company “URSUS – The Joined Breweries in Cluj”. During the nationalization period, in the year 1948, URSUS received the name “Onwards/Inainte Brewery” - Cluj”.
After the investment works in 1958, the modernization continued in parallel with the improvement of the production process. During this period, the process of beer pasteurization, was also implemented.
After 1989, URSUS has known an accelerated progress. The re-launch of the brand took place together with the privatization and purchase of the S.C. URSUS S.A. brewery in the year 1992. During this year, URSUS was accepted in the first pilot privatization program. Starting with 1993, the first beer by the Pils recipe was produced in Romania, URSUS Pils, followed in 1994 by URSUS Premium Pils, in the Euro bottle, a beer meant for the upper segment of the market, as it was the first Romanian beer with the “Premium” denomination, but also the first Romanian beer whose advertising image was supported by TV commercials.
Starting with the same year 1994, the distribution towards neighbouring areas of Cluj, as well as towards Bucharest and ConstanŃa is initiated.
The year 1996 brings a national premiere, as URSUS Premium Pils became the first Romanian beer in can.
In 1996, South African Breweries from Johanesburg takes over S.C. URSUS S.A. This purchase meant a new strategy which made URSUS one of the best sold beers on the Romanian market. The distribution was extended at national and international level. The URSUS brand was developed by the implementation of new packages and kinds.

THE ENVIRONMENTAL IMPACT OF BEER PRODUCTION
63
Fig. 1. URSUS Brewery - past and present
The launching of URSUS Black in December 2000 was another step towards the expansion of the company portfolio. Nowadays, URSUS is represented by several different types of beer (blond, black, alcohol free) under a single slogan: “King of Beer in Romania”.
Fig. 2. Emblem KING OF BEER IN ROMANIA

PARTENIE DUMBRAVĂ, IOAN POP, ENIKİ FAZAKAS, JOZSEF FAZAKAS, LUDOVICA BREBAN
64
In April 2001, URSUS Premium Pils became URSUS Premium. In 2002, URSUS introduced the new Gold bottle with its own design,
metallic labels and 0.5l metallic can. In 2004 a new multipack of 4 or 6 cans was introduced, with a handle in
the middle, which is very easy to carry. The implementation of the new twist-off cap (screwed cap) for the 0.33l
URSUS Premium bottle, at the end of the year 2005, was an absolute novelty on the Romanian beer market. URSUS was the first beer in Romania using this type of cap. The twist-off bottled was introduced in order to meet the expectations of young, active, urban consumers, with incomes and level of education above the average. The twist-off cap is an unprecedented, modern and very practical system, which enables the opening of the beer bottle by a simple twist, without needing the classic opener.
In the year 2006, URSUS continued the series of innovations, by the launching of the new green packing, together with the new label, which better reflected the market leader statute held on the Premium segment, thus in correspondence with the most recent consumption behaviour changes and with the market evolution. In the same year, the “Stejar” beer is launched, with higher alcohol content, meant for “strong men”!
In 2007, it is produced for the first time in Cluj, the alcohol free beer and together with it, in the same year, by the re-engineering achieved, there are created the premises of producing on the fabrication lines any type of beer in the Company list (Ursus, Timisoreana, Ciucas, Peroni, Stejar).
II. Location and topography
S.C. URSUS Breweries S.A. Cluj-Napoca Company is located on the lower terrace (of 2-6 m) of the Someşul Mic River, and within the Cluj-Napoca municipality in the central-western part of the city. Within a 500 m range, S.C. Ursus S.A. is surrounded by:
South – The Agronomic Institute with the Dentrological Park, on a 20m – 500 m distance.
West – Residential area, 20m - 500 m, with a school at 150m and the Calvaria Church at 750 m.
West, North - West – Residential area (blocks of flats) from 50m - 500 m, the mill and bread factory MioriŃa, (which is not operational), residential area from 50m to 500m, with a school 120 m away.
North - East, East –Residential area with old houses from 30 m to 500m. South – East – Residential house with student hostels from 40m to 500m. The topography of the area is slightly slanted (3-5 º) to the North, North-West. S.C. URSUS Breweries S.A. is located, from geographical point of view,
on the lower terrace of the Someşul Mic stream, composed of quaternary fluvial deposits (gravels), sands, clays, under different solidification degrees, silted with colluvial deposits of the stream. All these are deposited on an Eocene-Oligocene-Sarmatian foundation made of sand stones, sands and conglomerates, which actually compose the region substratum.

THE ENVIRONMENTAL IMPACT OF BEER PRODUCTION
65
The soil cover which is desired to be a mesobasic heritage (young terrace), is in fact completely different. The precinct of the brewery is covered with a concrete layer, in the immediate vicinity of the soil. The soil is changed, sloppy or with deep humus horizons and the natural vegetation was not preserved.
The seismic magnitude of the area is of the IVth degree type, expressed in MSK degrees, according to the P+100/92 normative.
III. The Technological Process
The activity of the unit is mainly the beer production and merchantability, and the sections of the brewery are:
• The output section: o boiling o fermentation o bottle-filling • Auxiliary sections: o thermal plant o refrigerating plant o mechanical workshop o electrical workshop
The flowsheet is presented in fig. 4. The raw matter is unloaded at the unloading rack, by means of screws and
it is stored in storage cells. From the storage cells, the raw matter reaches the storage bunkers, and
after that in the grinding machine, where the malt cleaning takes place, by means of some brushes, and the husks are disposed of by means of some sieves. In order to retain the iron particles, magnets are installed. After cleaning and weighting, the raw matter is taken to the grinding intermediary bunker.
The grinding has three steps: - dry grinding of malt
- wet „ of „ - dry „ of barley.
The kneading/ moulding takes place in the moulding tank provided with an
agitator. In this boiler there are introduced: grinded malt, grinded barley and water, which then result into the yeast cake.
The yeast cake is subjected to saccharification, a process in which the starch is transformed into maltose, resulting in the beer wort. The beer wort is then subjected to the primary and secondary fermentation process. After the completion of the fermentation, beer is obtained.
The maximum output capacity is 1,000,000 hl/year.

PARTENIE DUMBRAVĂ, IOAN POP, ENIKİ FAZAKAS, JOZSEF FAZAKAS, LUDOVICA BREBAN
66
Fig. 3. Flowsheet Chart IV. Environmental Impact
As it is located in a residential area, S.C. URSUS Breweries S.A. Cluj – Napoca, needs to be paid a maximum attention to the mitigation of the air, water and soil pollution level, as well as to the mitigation of noise and vibrations. Also, a very important aspect is the waste management.
The waste type and quantities are reproduced in table 1.
Table 1.
No. Name Quantity
t/h t/an
The technological
process generating the
waste
The storage
manner
1. Brewery mash 1.65 10 319 Boiling Container transp. 2. Filter earth 11.97 104.92 Fermentation „
Wet Grinding Dry Grinding Section III - boiling
Section I - boiling
Primary Fermentation
Fermentation I and II, ZKT
Secondary Fermentation
Filtration
Bottling
Storage
Malt Cell Malt and Barley Cell
WATER (20-40oC)

THE ENVIRONMENTAL IMPACT OF BEER PRODUCTION
67
3. Filter cardboard 0.59 5.18 „ „ 4. Broken glasses 0.4 570.37 Bottle-filling „ 5. Paper wastes 0.0005 2.10 Administration „ 6. Iron wastes 0.17 343.89 Mechanic
workshop Uncovered pad
7. Casting wastes 0.001 2.23 „ „ 8. Stainless steel
wastes 0.0035 7.08 „ „
9. PVC wastes 2 21.51 Packing „ 10. Domestic
wastes 10.42 43 329 „
The emission sources into the atmosphere are summarized in table 2.
Table 2.
Section Pollutant Weight rate Concentration
Limits Order 462/93
kg/h kg/an mg/Nmc Debit g/h
Concentration mg/Nmc
Thermal plant
Particles SO2 NOx CO CO2
0.0274 0.0054 1.2822 0.3205 0.0526
165.72 32.66
7754.75 1938.38 318.12
4.05 0.81
188.98 47.25 7.76
- - - - -
5 35 350 100
-
Grinding Particles 1.125 7020 - 500 50 Bottle-filling
CO2 0.55 211 - 3000 -
Refrige rating plant
NH3 0.271 1639.00 - 300 30
One should notice that the provisions of the Order 462/93 are totally
observed.
V. Water supply
The source: the drinking water supply network of the Cluj – Napoca municipality. The water catchment is made by two branch pipes, one from the Calea Mănăştur Street, and the other from the MioriŃei Street. Two water supply sources are provided in order to avoid the output interruption in case of damage in one of the sources.

PARTENIE DUMBRAVĂ, IOAN POP, ENIKİ FAZAKAS, JOZSEF FAZAKAS, LUDOVICA BREBAN
68
The water necessary a) in hygienic – sanitary purposes: 3151.2 mc/an b) for the washing of the platform: 3892.5 mc/an c) for the output activity: the water consumption for average
output: 63507 mc/an The necessary overall quantity of water is: Maximum: 217.47 mc/h
Average: 138.52 mc/h Waste Waters Discharge
The resulting waste washing and technological waters are discharged after pre-treatment in the sewage system of the Cluj – Napoca municipality.
The pre-treatment plant of S.C. URSUS Breweries S.A. is composed of two plants located in the brewery precinct on the domestic and technological waste waters canals which discharge the waters in Calea Mănăştur Street (plant I) and in Plopilor Street (plant II).
The total amount of waste waters represents the sum of the domestic waste waters, technological waters and used waters collected from the industrial platform.
The pollutants concentration in compliance with the regulatory limits is presented in the fig. 4 chart.
0
500
1000
1500
2000
2500
3000
3500
Particulatematters
CBO5 Fix Residue
Max. Conc.
Alert threshold
Intervention threshold
Fig. 4. The charging of used discharged waters (mg/l) From the chart values one may notice that the charges of used waters
exceed the intervention threshold, which represents an impact upon the city sewage system. This is the reason why the brewery intends to design serious measures for the mitigation of the above mentioned values.

THE ENVIRONMENTAL IMPACT OF BEER PRODUCTION
69
VI. Noise and vibrations
The noise and vibrations sources are: - the thermal plant; - the refrigerating plant; - the beer bottle-filling section; - external and internal traffic;
In order to assess the noise level within S.C. URSUS Breweries S.A., noise measurements were performed in 9 points, achieving the values in table 3.
Table 3.
No. Measurement location Noise level db(A) 1 Point 1 (Gate no. 1) 65 2 Point 2 (Fermentation) 79 3 Point 3 (Barrel-filling) 67 4 Point 4 (Boiling) 78 5 Point 5 (ZKT) 68 6 Point 6 (Refrigerating plant) 73 7 Point 7 (Bottle warehouse) 71 8 Point 8 (Bottle-filling) 77 9 Point 9 (Warehouse) 65
Admitted level 65
Fig. 5. The refrigerating plant, noise source
As S.C. URSUS Breweries S.A. is located in a residential area, it is very important to adjust the noise level according to the nearest residential area. Thus, the noise level will be approached on the direction of the cardinal points.
In the South – at 20 m away form the brewery, the Agronomical Institute with the Dentrological Park. In this area one should also notice the influence of the intense traffic on the Calea Mănăştur Street. The noise level measured in this part is: 78 db, 68 db, 73 db.

PARTENIE DUMBRAVĂ, IOAN POP, ENIKİ FAZAKAS, JOZSEF FAZAKAS, LUDOVICA BREBAN
70
In the West –20 m away, residential area, noise levels measured of about 65 db (A).
In North – West – 50 m away there are blocks of flats (residential area), the measured noise level is 82db, 78 db, 77 db.
In the North – residential area 1 m away, measured noise level of 65 db. No. Area Lech db(A) Admitted L ech db (A) 1 South 38 50 2 West 25 50 3 North 63 50
It results from this table that the Northern area (the first receiver, the house)
is affected by the noise level. These values result both from the production activities and from the road
traffic, respectively from the hauling equipments. VII. The environmental factor - air
The emission pollutant concentrations resulting from plant operation are illustrated by the chart in fig. 6, compared to the regulatory limits.
Fig. 6. The pollutants emission into the air
The production activity emits considerable quantities of particles and NH3 into the air, according to the presentation in fig. 7.
050
100150200250300350
Particles NO2
Emisia de poluanŃi din CT (mg/mc)
Max. Conc.
Alert Threshold
Intervention threshold

THE ENVIRONMENTAL IMPACT OF BEER PRODUCTION
71
0
100
200
300
400
500
Particles NH3
Emisia de poluanŃi - activităŃi de producŃie (microgr/mc)
Max. Conc.
Alert Threshold
InterventionThreshold
Fig. 7. Emission of pollutants resulted from the production activity.
VIII. Soil samples
Soil pollution results especially from the grease extractor, from the sludge chamber, by the sediments and infiltrations into soil, but it also results from the grinding and handling operations. The discharged particles are not toxic, as their origin is natural, vegetal and mineral dust, vegetal particles. The natural powders do not affect the soil structure which complies with the determined type.
The unit platform is made of concrete, and the maximum concentration is measured at 20 – 25 m away from the source, practically affecting the precinct surface.
The grease extractor and the sludge chamber are underground and made of concrete. The existence of fissures in the vat structure was not identified.
No quantifiable impact upon the vegetation in the area was noticed. CONCLUSIONS
From those presented above, one can notice that beer production in the city on the Someş river has a tradition of more than 130 years, period in which it has succeeded in operating and developing without causing environmental infection or damage.
The raw matters processed within the technological process are only of natural origin, and from this we can deduce that the resulting wastes (brewery mash, filter earth) are not toxic or dangerous pollutants.
The management of pollutant factors: 1. Air samples: - concentration of the particulate matters exceed the alert
threshold and the intervention threshold in all the sampling points (P1…P5),

PARTENIE DUMBRAVĂ, IOAN POP, ENIKİ FAZAKAS, JOZSEF FAZAKAS, LUDOVICA BREBAN
72
- concentration of the gaseous pollutants is much below the alert threshold in all the sampling points, even below the detection limits.
Concentration of the powders presents a significant impact upon the surrounding air.
2. Water samples: - the charges of waste waters (particulate maters, CCOCr) entering and discharging into the waste waters treatment plant exceed the intervention threshold,
- the temperature of discharged waters exceeds the alert threshold at the collection point from the final discharge into the sewage system.
The developed activity presents a significant impact upon the sewage system of the city.
3. Soil samples: - powders of vegetal nature do not affect the soil structure. - As the field observations did not show any relevant results regarding the
activity impact upon the analyzed plants, it results that: The developed activity presents a low potential impact upon soil quality. 4. For the quantitative assessment of the environmental impact induced
by the brewery activity the reliability scale was applied, awarding some marks which expressed the closeness to, respectively the remoteness from the ideal state.
The reliability scale is expressed by marks from 1 to 10. Ten (10) represents the natural state not affected by the human activity, while 1 represents an irreversible and extremely severe damage state of the analyzed environmental factor.
The reliability marks awarded: Nb AIR = 8.5 Nb WATER = 5.5 Nb SOIL, VEGETATION = 7.25 Nb WASTES = 8.66 Nb RESIDENTIAL AREAS = 7.85 From this scale it results that: The environment is affected within the admissible limits without negative
irreversible effects. The environmental impact produced by S.C. URSUS Breweries S.A. is manifested locally on a limited area.
REFERENCES
1. *** Report regarding the environmental study level I. at S.C. Ursus SA Cluj-Napoca during the period 1998 – 2006.
2. Rojanschi, M., Calculus of reliability indexes, The Environment, vol. II., no. 1-2, 1991. 3. P. Dumbravă, I. A. Pop: The rationalization possibility for the Romanian Management
Accounting, Studia Universitatis Babes Bolyai - Negotia (1/2004), 23 – 27.

STUDIA UNIVERSITATIS BABEŞ-BOLYAI, NEGOTIA, LIII, 2, 2008
CONSTRAINTS CONCERNING INVESTMENT AND PARTICIPATION IN PROFESSIONAL TRAINING
IN THE COMPANIES FROM THE ROMANIAN MANUFACTURING INDUSTRY
MAGDALENA VORZSAK 1, CARMEN MARIA GUT 2
ABSTRACT . Life long learning represents a determinant factor in the adaptation process of the business to market changes and it contributes to the increase of peoples’ chances to be employed. The introduction of new technologies in economy imposes the need of improving the level of labor force qualification. Education and training courses become more important than ever when refer to persons’ chances to realize in life. Learning opens the possibility to make a productive life and full of satisfactions even out of employed person statute. The present paper aims to analyze the main constraints met by employees and employers concerning investment and participation in professional training in the companies from the Romanian manufacturing industry. For this analyze data were collected based on questionnaires and were processed with SPSS 11.0 software. Keywords: professional training, employment, unemployment. Acknowledgement. The paper was prepared with the support of CNCSIS research grant, type TD, no. 63, 2007-2008.
INTRODUCTION
The matter of labor force employment has become extremely severe in post-communist Romania, the degree of employment drastically diminished due to the economic restructurings, followed by the massive personnel shakeouts. If the subsistence agriculture outlet and the migration had not partially absorbed the unemployed persons, unemployment would have reached worrying dimensions.
In order to diminish the negative consequences of the unemployment (the diminution of production and incomes, the cause of some profound sufferings, because the unemployed fight to survive with the small incomes that they have) and to insure a high level of employment, some active measures, that should support unemployed and inactive persons in founding a job, like training courses, are imposed. Life long learning represents also a determinant factor in the accommodation of business to market changes. The introduction of new technologies in economy imposes the 1 Professor, PhD, Babes-Bolyai University, Cluj-Napoca, Faculty of Business, email:
[email protected]. 2 Teaching Assistant, Babes-Bolyai University Cluj-Napoca, Faculty of Business, email:

MAGDALENA VORZSAK, CARMEN MARIA GUT
74
necessity of the level of manpower qualification improvement. The education and life long learning has a positive impact on the individual because it seems to increase his chances of employment, to reduce the term of unemployment, to reduce the costs of finding a job, to offer to the individual the possibility to have a bigger wage, to contribute to the productivity growth and to the economic development of the society.
Taking into account the importance of professional training, both for the employers and the employees, we have undertaken a study on employees’ professional training in companies of the manufacturing industry. The main goal of the present study is the analysis of the demand for continuous professional training among employers and employees in these companies and the efficacy of these training programs. In this paper we are going to present the main constraints met by employees and employers concerning investment and participation in professional training. In Romania studies have been made concerning the characteristics of continuous professional training (INS 2001) and the demand and offer of continuous professional training (INCSMPS, 2004; MMSSF, 2004). Thus The exploratory study regarding the demand for lifelong learning, made as part of component 2 of the PHARE project of Institutional Twinning – Assistance for the consolidation of policies concerning continuous professional training, has aimed at analyzing the demand for professional training with employers and employees of two economic sectors – tourism and constructions. Research on certain aspects regarding professional training of the employees was undertaken as part of a study made by Osoian (2004), A practical study on occupying and using human resources at territorial level focusing on active industrial firms in the Cluj county. Similarly, as part of the research study centered on the Impact of direct foreign investments in the processing industry upon the occupation of labor force3,certain aspects concerning the professional training of the employees’ of these firms have been analyzed.
MATERIAL AND METHODS
In order to analyze how life long learning is organized in companies from the manufacturing sector and which are the constraints concerning investment and participation in professional training, we made a study during the period 2007-2008. The study was carried out as part of the research project on “Unemployment in Romania – present and perspectives”4 , between 2007 and 2008. The study has aimed at analyzing the demand for continuous professional training among employees and employers of the manufacturing industry, following the pattern of the one carried out by INCSMPS5 (2004). For the purpose of this study two types of questionnaire were drawn up: one for employers and one for employees. 3 Project coordinated by Prof. Maria Bîrsan, PhD, Facultry of European Studies, Babes-Bolyai University,
between 2006 and 2007. 4 Grant CNCSIS, type TD, nr. 63, project coordinator - Carmen Maria GuŃ, 2007-2008 (underway) 5 National Institute of Scientific Research in the field of Work and Social Network

CONSTRAINTS CONCERNING INVESTMENT AND PARTICIPATION IN PROFESSIONAL TRAINING …
75
The period encompassed by the study was 19th November 2007- 20th January 2008. Most questionnaires (95%) were administered directly and only a small part (5%) through e-mail addresses of the firms.
In carrying out the study we focused on companies in the manufacturing sector, NACE 15-37. In order to make sure the firms are active and to check if they handed in their financial reports for the previous year (2006), we accessed the site of the Ministry of Economy and Finance (www.mfinante.ro). We applied the questionnaires to a total of 210 companies in the manufacturing sector (NACE 15-37). Also, we randomly picked 1-2 employees of each company and applied the questionnaires to a total of 502 employees. The data obtained through questionnaire were processed with SPSS 11.0 software.
RESULTS AND DISCUSSIONS
1. Constraints of the employees
The main constraints met by employees when deciding whether to participate or not in professional training are presented in table 1.
The most important obstacle is the timetable of the course, since it overlaps with working hours. We consider that professional training suppliers should pay more attention to this aspect, since a better coordination between the timetable of the course and the employees’ spare time could enhance participation in professional training. Other two important impediments are represented by the lack of professional training offers at local level and the lack of financial resources. Costs implied by professional training have become one of the factors that led to low employee participation in professional trainings in the last two years, although more than 80% of the employees stress their importance for them to better perform their work tasks. As a consequence in order to increase the level of the employees participation in trainings more financing would be needed on the behalf of the companies or the offering of incentives/subventions for professional training on the behalf of the state.
2. Constraints of the employers
Between 2006 and 2007, out of the total number of companies analyzed 25.2% has not offered any kind of training to their employees. As a consequence, we aimed at finding out the main reasons why employers did not offer training to their own employees. The answers of the employers are summed up in the tables’ no. 2 and no. 3. The reasons most often set forth were those related to the companies preference to recruit already qualified staff (especially the companies of the cellulose and paper industry (NACE 21), those of the means of transport industry (NACE 34-35); companies specialized in waste recycling (NACE 37); companies of the wood processing industry (NACE 20)) and the one stating that the present level of the employees’ knowledge meet the needs of the company (especially firms

MAGDALENA VORZSAK, CARMEN MARIA GUT
76
of the composite book publishing (NACE 22) and those producing chemical substances and rubber and plastic products - NACE 23-25). In what follows, we will present the problems employers are most often confronted with when they want to organize or to offer professional training programs.
Table 1.
Constraints of the employees concerning investment and participation in professional training
498 1 5 2,94 1,341
496 1 5 3,03 1,337
496 1 5 2,83 1,268
496 1 5 2,65 1,184
498 1 5 3,27 1,253
496 1 5 2,50 1,247
496 1 5 2,90 1,301
496
the lack of financialresources
the lack of professionaltraining offers at locallevel
the incongruity betweenthe content of the courseand the need of thecompany
the length of the course
the timetable of thecourse
the low quality of thecourses
the existence of lowincentives in our legislative system
Valid N (listwise)
N Minimum Maximum Mean Std. Deviation
(Minimum 1 = the least often; Maximum 5 = the most often) Source: own calculations
Table 2.
Analysis of main reasons of employers’ who do not offer professional training to their employees
Reasons Total (%) 1. The present level of the employees’ knowledge and their qualification
meet the needs of the company
29.2 2. Recruiting already qualified staff 40.7 3. The employees’ initial professional training is satisfactory for the
activity of the company
18.6 4. High costs of professional training programs 11.5
Source: own calculations

CONSTRAINTS CONCERNING INVESTMENT AND PARTICIPATION IN PROFESSIONAL TRAINING …
77
Table 3.
Analysis of main reasons of employers’ who do not offer professional training to their employees by NACE sections
The present level of the employees’
knowledge and their qualification meet the needs of the
company
Recruiting already
qualified staff
The employees’ initial professional
training is satisfactory for the
activity of the company
High costs of
professional training
programs
Total
15+16 36,8 36,8 21,1 5,3 100,0 17+19 29,0 35,5 12,9 22,6 100,0
20 0 66,7 33,3 0 100,0 21 0 100 0 0 100,0 22 50,0 50,0 0 0 100,0
23-25 41,7 16,7 16,7 25,0 100,0 26-28 30,0 50,0 10,0 10,0 100,0
29 33,3 33,3 33,3 0 100,0 30-32 0 0 0 0 0,0
33 0 0 0 0 0,0 34-35 0 100 0 0 100,0
36 22,2 33,3 44,4 0 100,0 37 0 100 0 0 100,0
Source: own calculations
Analysis of tables’ no. 1 and 4 shows that the employees’ main constraints and that of the employers’ are very much alike. Thus both actors of the market point out as main obstacle the timetable of the course, which overlaps with working hours, followed by the lack of professional training offers at local level. Consequently we repeatedly stress the importance of a better coordination between the timetable of the courses and the employees’ working hours. In the same way suppliers of professional training programs have to adapt their training offers to the actual needs of companies and to offer to employees the qualifications required by the market in the respective geographical area. Another constraint of the employers is the lack of stimulating legislation, which makes us consider a legislative amendment to be necessary so that to motivate both employers and employees regard the offer and participation respectively in professional training.
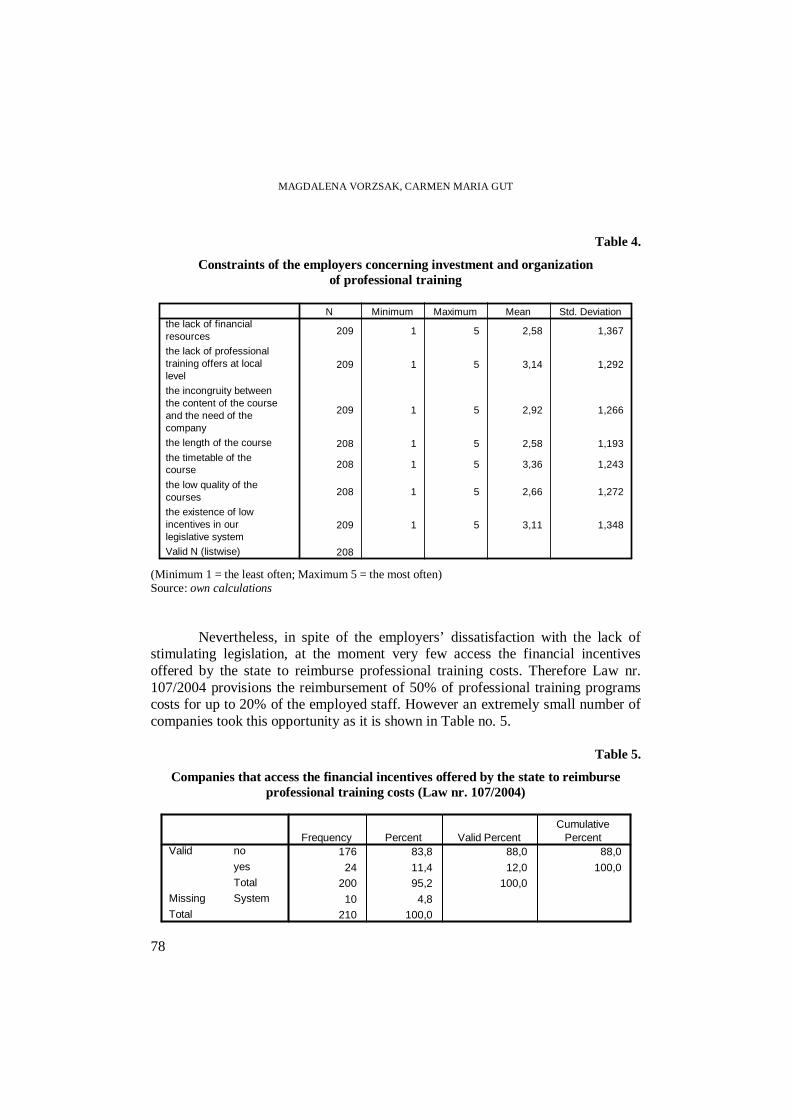
MAGDALENA VORZSAK, CARMEN MARIA GUT
78
Table 4.
Constraints of the employers concerning investment and organization of professional training
209 1 5 2,58 1,367
209 1 5 3,14 1,292
209 1 5 2,92 1,266
208 1 5 2,58 1,193
208 1 5 3,36 1,243
208 1 5 2,66 1,272
209 1 5 3,11 1,348
208
the lack of financialresources
the lack of professionaltraining offers at locallevel
the incongruity betweenthe content of the courseand the need of thecompany
the length of the course
the timetable of thecourse
the low quality of thecourses
the existence of lowincentives in ourlegislative system
Valid N (listwise)
N Minimum Maximum Mean Std. Deviation
(Minimum 1 = the least often; Maximum 5 = the most often) Source: own calculations Nevertheless, in spite of the employers’ dissatisfaction with the lack of stimulating legislation, at the moment very few access the financial incentives offered by the state to reimburse professional training costs. Therefore Law nr. 107/2004 provisions the reimbursement of 50% of professional training programs costs for up to 20% of the employed staff. However an extremely small number of companies took this opportunity as it is shown in Table no. 5.
Table 5.
Companies that access the financial incentives offered by the state to reimburse professional training costs (Law nr. 107/2004)
176 83,8 88,0 88,0
24 11,4 12,0 100,0200 95,2 100,0
10 4,8210 100,0
no
yes
Total
Valid
SystemMissing
Total
Frequency Percent Valid PercentCumulative
Percent

CONSTRAINTS CONCERNING INVESTMENT AND PARTICIPATION IN PROFESSIONAL TRAINING …
79
Source: own calculations Only 11.4% of the total number of companies considered asked for
reimbursement of professional training costs, in accordance with Law nr 107/2004. The main reasons for this are presented below: � not knowing the legislation (22.5%); � excessive bureaucracy met in preparing necessary papers (14.7%) � lack of time (2.7%) � reimbursement of courses realized from the company’s funds (5.8%) � professional training was organized at work place and as such it did not require
extra costs (3.5%) � it was not the case since there were no professional training programs offered
due to the fact that employees had the qualification necessary to carrying out their activities, on the one hand (23.6%), and, on the other hand, due to lack of program offers (5.9%).
� no answer given (21,3%). The data above show that the number of companies resorting to this arrangement
is very low, which is attributed by more than one third of them to not knowing the legislation and to excessive bureaucracy. Therefore we consider that for an action to be efficient it needs not only to be provisioned by the law, but also to be brought to the notice of potential beneficiaries, while measures concern the documentation required need to be reasonable and the time necessary for taking steps to access financing to be reduced. These way employers could be motivated to resort to these measures and, as a consequence, the number of employees to benefit of professional training programs would grow.
CONCLUSIONS
1. The main constraints that employers and employees are up to when taking the decision to invest and to participate, respectively, in professional training are represented by: the timetable of the course, the lack of professional training offers at local level and the lack of financial resources.
2. The main reasons for certain employers not to offer professional training to their own employees are: recruiting previously qualified staff and the present level of the employees’ knowledge meeting the needs of the company.
REFERENCES
1. GuŃ, C.M., (2007), “Romania’s Unemployment Situation”, in Studia Universitatis Babeş-Bolyai, Negotia, LII, 2/2007, Cluj Napoca.

MAGDALENA VORZSAK, CARMEN MARIA GUT
80
2. INCSMPS, Studiu exploratoriu privind cererea de formare profesională continuă [Exploratory study regarding the demand for lifelong learning – our translation], 2004, Bucureşti.
3. Ministry of Labor, Social Solidarity and Family, Ministry of Education from Denmark, Proiectul de ÎnfrăŃire InstituŃională RO2/IB-SA-03 - AsistenŃă pentru consolidarea politicilor în domeniul formării profesionale din România, Anchetă asupra ofertei de formare profesională continuă din sectoarele construcŃii şi turism Regiunile Nord-Vest şi Sud-Vest [Study upon the lifelong leaning offer from tourism and construction sectors – our translation], Romania, 27 May – 18 June 2004.
4. National Institute of Statistics, Caracteristici ale formării profesionale continue în România, [Lifelong learning characteristics in Romania – our translation], 2001, Bucureşti.
5. Osoian, C., (2005), PiaŃa forŃei de muncă – restructurare, ocupare, şomaj, Editura Dacia, Cluj Napoca.

STUDIA UNIVERSITATIS BABEŞ-BOLYAI, NEGOTIA, LIII, 2, 2008
DECISION SUPPORT SYSTEMS: PRESENT AND FUTURE TRENDS
MANOLE VELICANU1, GHEORGHE MATEI2
ABSTRACT. As competition gets tougher and tougher, companies have to implement new management systems to stay efficient. Along business performance monitoring application, executive information systems, business intelligence systems and decision support systems (DSS) help managers to lead their companies successfully and survive into the future. They are interactive, flexible and adjustable systems that offer support in solving unstructured or semistructured management problems, meant to improve the decision process. They are developed to assist the tactical and strategic level of management. The classic architecture of a DSS contains the database management system, the model base management system and the interface management system. The evolved DSS have also a knowledge component that provides the information needed for solving certain aspects of the problems. According to D. J. Power, at a conceptual level the DSS can be classified into the following categories: data-driven systems, model-driven systems, knowledge-driven systems, document-driven systems, communication-driven systems, intra and inter organizational systems, specialized systems and Web-based systems. At the end of the paper some opinions concerning the future of DSS are presented. Keywords: Decision support system; Structured, semistructured and unstructured problems; Database; Model base; Knowledge base; User interface.
INTRODUCTION
In order to respond to market constraints, companies have to implement new management systems so they can stay efficient. As the economic environment is more and more dynamic and as competition gets tougher and tougher, it is necessary to implement IT solutions that provide flexibility, speed and accuracy to the decision making process.
The decision making process is a mix of activities undertaken by an individual or a group of individuals faced with an event that generates a set of alternative actions. Its major purpose is choosing an alternative that suits the value system of the individual/group of individuals. The best solution is that alternative that will produce the greatest number of desired results, with the least number of undesired consequences.
1 Professor, PhD, Informatics in Economy Department, Academy of Economic Studies, Bucharest,
Romania, [email protected] 2 Romanian Commercial Bank, Accounting Division, Bucharest, Romania, [email protected]

MANOLE VELICANU, GHEORGHE MATEI
82
The complexity and difficulty of a decision grows as the number of alternatives or objectives increases. In such situations decision-makers need certain instruments to help them and a decision support system is a proper tool for assisting the decision making process.
Decision support systems form a category of such systems suitable for reaching set targets. They are developed to assist the decision makers in semistructured and unstructured problems and use knowledge from various domains, such as database, operational research, human-computer interaction, artificial intelligence, simulation, telecommunications and software engineering.
As Bill Inmon stated in an interview for DSSResources.com (Power, 2005a), “ the managers that will lead their corporations successfully and survive into the future are those using decision support systems, business performance monitoring applications, executive information systems or business intelligence systems”. Using such technologies, companies learn what has happened to their business, why it has happened and what may happen; all these, combined with users’ experience and intuition, lead to competitive advantages.
Decision support systems (DSS) are a specific class of information systems that deal with decision making within the organization. As Bill Inmon defined them, DSS are “systems used to support managerial decisions”. They are intended to inform and assist decision makers and their scope is very large, from a single-user to an enterprise-wide DSS. A single-user DSS is a more or less simple application running on a PC and helps the user to make better decisions in solving the problems he/she is facing. Generally, such systems are developed to support operational decision making.
Enterprise-wide DSS are complex applications developed to assist many users in the company. These systems include a large range of functionality and use enterprise data repositories, which contain information concerning the entire company’s activity. The tools they are using are more sophisticated, including data warehouse, OLAP (On Line Analytical Processing) or data mining technologies, in client/server or Web architecture. These instruments enable storing, retrieving and analysing large volumes of data, in order to support strategic and long-run decision making.
Some DSS Definitions
There are many definitions of what a decision support system is. The various DSS definitions formulated along time emphasized certain features of decision support systems. Thus, in the early 1970 John Little emphasized the system’s function, stating that a DSS is a model based on a set of procedures needed for data processing and managers support in the decision making process (Little, cited in Turban, et al., 2004).
Gorry and Scott-Morton emphasized the type of problems solved and the system function. They defined DSS (Gorry & Scott-Morton, 1971) as “interactive computer-based systems which help decision-makers utilize data and models to solve unstructured problems”.
DECISION SUPPORT SYSTEMS: PRESENT AND FUTURE TRENDS
83
Keen and Scott-Morton emphasized the synergy between individuals and computer and the type of the problems solved by these systems. They stated (Keen & Scott-Morton, 1978) that “decision support systems couple the intelectual resources of individuals with the capabilities of computer to improve the quality of decisions. It is a computer-based system for management decision-makers who deal with semistructured problems”.
Alter (1980) emphasized the system’s goals. He consideres that DSS are intended to support managers and their main goal is to ensure decision making effectiveness, in contrast to transaction systems that are used by operators and aimed at data efficiency and consistency.
Bonczek, et al. (1981) emphasized the system’s components, defining a DSS as an information system composed of three interacting components: dialog management, data management and model management.
In a more precise way, Turban (2004) defined a DSS as “an interactive, flexible and adjustable information system, especially developed to offer support in solving unstructured or semistructured management problems, meant to improve the decision process”.
A common feature pointed out by these definitions refers to the degree of the structuring of the problems. From this point of view, there are structured, unstructured and semistructured problems.
Structured problems are repetitive and routine. The values of the key variables and the relationships between them are known and can be understood by a problem solver.
Unstructured problems are novel and non-routine. The values of key variables and the relationships between them are not known, so it is very difficult or even impossible to automate their solving. This type of problems requires considerable judgement, evaluation and human creativity and they are manager solutions.
Semistructured problems contain elements of both structured and unstructured problems. Human judgement and computers can work together for solving this type of problems and DSS focus on them (figure 1).
Whatever their scope and purpose are, DSS are developed to help decision makers to better interpret the relevant information from data, documents, knowledge and models, in order to identify and solve problems. DSS do not make decisions. They propose alternatives to decision-makers, presenting both advantages and disadvantages of each alternative. A DSS spreads a manager’s ability to quickly process valuable information and to approach complex problems, decreases the necessary time for the decision making process and provides competitive advantages for the company. According to Power (1997), a DSS is “an interactive computer-based system intended to help managers make decisions. It helps a manager retrieve, summarize and analyse decision relevant data”.

MANOLE VELICANU, GHEORGHE MATEI
84
Fig. 1. DSSs and the problems they solve
In an interview for DSSResources.com (Power, 2005b), Clyde Holsapple defined a DSS as “a system that supplements, complements, or amplifies the knowledge resources and/or knowledge processing capabilities of a user engaged in making a decision”. This type of systems focuses on specific decisions and on support, but does not replaces the human decision making process. They have a positive impact on increasing the productivity of the decision making process, on the quality of the decision making outcomes and even on decision makers’ satisfaction. All these things indirectly impact the organization’s reputation and competitivity.
Decision problems that give rise to the need for a decision support system are those in which: • user’s judgement, intuition, preferences and experience are essential; • finding the solution requires a combination of activities for searching and
handling information, and for formalizing problems; • the sequence of operations cannot be set in advance as it depends on the used
data and may change in order to allow simulations; • data that have to be used are not always known or certain; • an adequate solution has to be reached within a reasonable timeframe; • the problem is the subject of a quick evolution and transformation.
A DSS is a system meant to assist the decision makers in solving some problems, through the mix of human judgement and automated data processing. Its main purpose is to improve the quality of the decision making process. It is a system that analyses both internal and external data of the organization in order to show the most relevant information, at a suitable time and in an adequate form. It is an interactive system which facilitates ad-hoc queries, capable of presenting alternative decisions along with their consequences, a system that improves knowledge, as well as
Computer solutions
Manager solutions
Structured problems
Semistructured problems
Unstructured problems
Maneger and
computer solutions (DSS)

DECISION SUPPORT SYSTEMS: PRESENT AND FUTURE TRENDS
85
the possibilies for processing the knowledge by the users involved in the decision making process. As Turban (2004) stated, “the system uses internal and external data and models, offers a simple and easy to use interface, allows the user to control the decision process and offers support for all the stages of the decision process”.
Unlike transactional information systems, which are addressed to the operative level of management, DSS are meant especially for the tactical and stategic levels of management. Transactional systems assist the daily operational requirements of the organization, helping the day-to-day decision making process. DSS address the informational requirements of the organization, helping to make medium and long term decisions. If transactional systems operate with current data, data precision being essential, DSS operate especially with historical data and focus on their relevance, because executives need an overall view, with a lot of analysis needed behind.
DSS give computers a new role, a fundamental one in business management. With their components for data and knowledge management, they bring the past experience to the current framework and have a positive impact in decision process, by directly influencing its productivity and quality. The use of DSS leads to a sinergy between the processing and storing capacity of the computer and the user’s experience and judgement. The system can confirm or infirm certain suppositions; it can offer solutions, suggestions, appreciations, diagnoses, forecasts, but the final decision and responsibility belong to the user.
DSS Requirements
A DSS must answer a series of requirements given by the features of the decision problems it is used for. Here there are some of these requirements: � The system must help the decision process by using human judgement as well
as computer stored information. It must offer many options for data processing and information assessment.
� The system must be developed so it can operate with user’s representation and concepts, in a simple and natural language. Ergonomic considerations are essential in such a system and they translate in the existance of a friendly user/computer interface, easy to use and of high quality. For solving the user’s problems, the system must offer him/her an easy and fast access to information and knowledge.
� The system must have the possibility to structure a problem, to model it according to its nature and its solving requirements. It must also have more analytical and intuitive models for data assessment and be able to analyse as many solutions as possible for the problems of which solving it assists.
� The system must be adaptable in time, must have the capacity to react correctly to the evolution of user’s requirements in what the modification of data is concerned, of the problem structure, and of the information and results presentation. At the same time, the system must be flexible, to allow the user to add, remove, combine or modify system basic elements.

MANOLE VELICANU, GHEORGHE MATEI
86
� The user must have the possibility to use the system in a way that gets him closer to the targeted results. A friendly interface can have a major influence on system efficiency. The user must have the complete control of the process through the interface, because the system’s purpose is to help, to assist the decision maker, not to take his place.
By reaching these requirements, a DSS turns, from a tool, into a decision makers’ “partner”, helping them to better and more quickly respond in a more complex and dynamic economic environment. The system assures a better quality of the decision making process, a cost reduction and a productivity increase. The system’s ability to transform data into information, information into knowledge and knowledge into action enables companies to stay competitive in the present ever-changing market.
For developing a DSS, it is necessary to design a decision model, which must include the following elements (Demarest, 2005): • a decision maker: a person or a group which is going to make decisions; • a set of inputs to the decision making process: data, numeric and/or qualitative
models for data interpretation, human experience, rules, restrictions; • the decision making process itself: the stages to follow for transforming the
inputs into outputs; • a set of outputs from the decision making process, including the decisions
themselves and their assessment criteria, depending on the needed requirements, problems and goals.
DSS Architecture DSS can be developed in many configurations. These configurations depend
on the nature of management decision and the characteristics of each technology that is used. A DSS architecture refers to the integration and connection of all the involved components. It shows how hardware is organized, as well as how software and data are distributed in the system. The classic architecture of a DSS, defined by Sprague and Carlson (1982), is composed database management system, model base management system and user interface management system.
The database system is composed of the database and its management system. The database is a data collection organized as to answer the organization’s needs and as to be used by more users for different applications. For complex systems, the database is composed of all the data owned by the organization. For less complex systems, a special database is developed, by making a selection of data from different transactional systems.
The system can use both internal data, especially from transactional systems, and external data (legal settlements, market surveys, censuses, data regarding the national economy), delivered by the government, the central bank, market survey companies, institutes of statistics and so forth, but also obtained through the organization’s own efforts for collecting data. The database management system provides the database creation, the data update, access, protection and security.
DECISION SUPPORT SYSTEMS: PRESENT AND FUTURE TRENDS
87
The model system is composed of the model base and its management system. It handles models, which are simplified representations of facts, events or situations. The major purpose of modelling is to understand a complex problem with the help of a more simple and less expensive object (the model). This component assists the user in solving decision situations by generating alternatives and comparing their results, using what-if and goal-seeking simulations, and optimising the leading process.
The model base comprises mathematical, statistical, financial, managerial, projection and other quantitative models providing analysis possibilities. Depending on the management level they are meant for, the used models can be grouped as follows: • strategic models, used to support high level management decisions; • tactical models, used at the middle level of the management; • operational models, used by the operation management for supporting the day-
by-day activities within the organization.
The model base management system allows provision of reports, creation of new models, modification of existing ones, manipulation of data models. Through its control mechanism, the user can intervene in the component functioning and correct or modify certain operations by entering new subjective information, or by modifying some restrictions and/or objective functions. At the same time, the system permanently provides information on the current state of the decision situation solving, thus helping process control and user’s intervention if needed.
The user interface system provides interaction between DSS and user. It includes not only hardware and software components, but also the mechanism providing easy use, flexibility and access. Many experts say that the user interface is the most important component, because the power, flexibility and easiness in using the system derive mainly from it.
The interface is the only component seen by the user, who does not see what is behind it. Different studies have shown that its design influences the quality of user’s decision and his/her perception about the system. That is why an unproper(improper) interface may be a main reason for managers not to use the computerized analysis at the true scale it is available for solving decision problems.
The interface management system is composed of a series of programs providing the following functions: • ensures the graphical user interface; • ensures the interaction through different forms of dialogue: question-answer,
command language, menu and mostly graphical interfaces; • provides standard formats for entering data and commands, and also for
delivering the system’s answers; • offers help facilities; • provides the interaction between the database and the model base; • provides user training through examples.
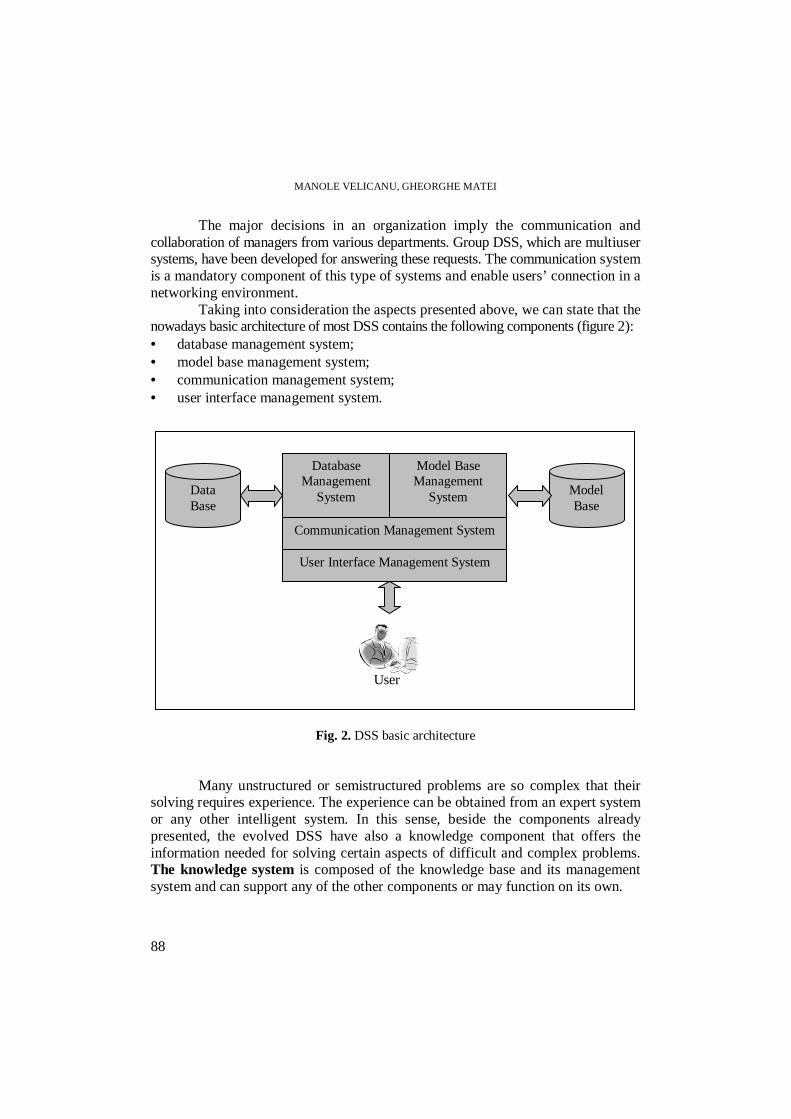
MANOLE VELICANU, GHEORGHE MATEI
88
The major decisions in an organization imply the communication and collaboration of managers from various departments. Group DSS, which are multiuser systems, have been developed for answering these requests. The communication system is a mandatory component of this type of systems and enable users’ connection in a networking environment.
Taking into consideration the aspects presented above, we can state that the nowadays basic architecture of most DSS contains the following components (figure 2): • database management system; • model base management system; • communication management system; • user interface management system.
Fig. 2. DSS basic architecture
Many unstructured or semistructured problems are so complex that their solving requires experience. The experience can be obtained from an expert system or any other intelligent system. In this sense, beside the components already presented, the evolved DSS have also a knowledge component that offers the information needed for solving certain aspects of difficult and complex problems. The knowledge system is composed of the knowledge base and its management system and can support any of the other components or may function on its own.
Data Base
Database Management
System
Model Base Management
System
Communication Management System
Model Base
User
User Interface Management System

DECISION SUPPORT SYSTEMS: PRESENT AND FUTURE TRENDS
89
A DSS Classification
Across time, more classifications of decision support systems were made, each of them reflecting the progression of DSS research. The information technologies developed in the last years of the previous century have given rise to new criteria for the modern DSS classification. Thus, Power (2001) proposed the following classification, at a conceptual level, of the DSS: data-driven systems, model-driven systems, knowledge-driven systems, document-driven systems and comunication-driven systems. This classification is made in terms of the dominant component of the system.
The major goal of data-driven DSS is to access and manipulate the company’s data. They include file systems, management reporting systems, data warehouse, OLAP systems (On Line Analytical Processing), EIS (Executive Information Systems), spatial information systems and business intelligence systems. These systems focus on accessing and manipulating of very large databases (especialy historical data).
The early DSS using file systems could not provide too much functionality. Data dissipated in various source systems and lack of historical data were serious impediments to building complex DSS.
As information was integrated in more complex data structures, the level of functionality they could provide has become higher. Data warehouses have integrated all the company’s data in a unique, complet, consistent, time-variant repository, making possible the fulfilment of comprehensive analyses of company performance. The highest level of functionality is provided by DSS using OLAP or data mining tools. These systems enable complex analyses that can discover trends, relationships and hidden patterns in the company’s data.
Model-driven DSS use mathematical, statistical, accounting and financial algorithms for the simulation and optimization of different organization economic processes within the organization. In such systems the volume of data needed is relatively small and the paramaters values are often modified, to reflect the changes in company’s activities.
Knowledge-driven DSS are based on Artificial Intelligence technology. They suggest or recommend certain actions to users, offering experience in solving some problems, experience obtained by knowledge acumulation in that domain. These systems use special models in order to process facts, rules and procedures, or to identify relationships in data. Medical diagnostic and fraud detection are some of the fields in which knowledge-driven DSS have prooved their capabilities.
Document-driven DSS help the user to manage both unstructured documents and Web pages, in a large variety of electronic formats, including image, audio or video files, by integrating special technologies for document storing, retrieving and processing. The quantity of information the decision makers have to search in is growing exponentialy. That’s why a power search engine has to be integrated in the system and documents’ processing has to be made efficient. The specific activities for these systems are the document generation, modification, searching, vizualization, grouping and indexing.

MANOLE VELICANU, GHEORGHE MATEI
90
Comunication-driven DSS use comunication, collaboration, coordination and decision support technologies, and facilitate the solving of the problems in a group decision process.
Besides this classification, Power (2001) classified DSS according to other criteria too. Thus, in terms of targeted users, he identified intra and inter-organizational DSS. In terms of purpose, we can speak about specialized DSS, and in terms of the primary deployment technology, there are mainframe-based, LAN-based and Web-based DSS.
Intra and interorganizational DSS use intranet, respectively Internet facilities. An intranet is supposed to be used in a networked environment by individuals or groups of users in a company and is built to support information exchange and knowledge management across the organization. The Internet enable access to unlimitted resources, all over the world, for anybody. The portals represent the contact points which link the company with the world. They provide external users to access company’s intranet and to use specific DSS capabilities. These systems combine the communication-driven DSS, knowledge management and business intelligence in an integrated Web environment (Bhargava & Power, 2001).
Specialized DSS can be classified in function-specific and general-purpose systems. Function-specific DSS are generally used to solve routine or reccuring tasks. They are developed to offer assistance in certain domains, as route programming in a transport company, for certain functional areas of the business, as marketing or finance, or for specific business functions, as budget planning, analysis of loan applications and so forth. Depending on the principal component, they can be data, model or knowledge-driven system.
General-purpose DSS are developed to support more general tasks, like project management, decision analysis or business planning. The most general purpose DSS are DSS generators, which are used to build specific systems.
Web-based DSS use the facilities provided by the client/server architecture. They deliver the needed information and support tools to managers or business analysts which use a “thin client” Web browser, like Microsoft Internet Explorer, Netscape Navigator or Mozilla Firefox. The user’s computer is connected to the server hosting the DSS by a network with a TCP/IP protocol. These systems enable the analysis and display of structured data stored in relational or multidimensional databases, the accessing of models, multimedia documents and unstructured data, and also the communication and decision making in distributed teams.
Generally, all types of the presented DSS can be implemented using Web technologies. Actually, the present trend in the information technologies is to use the Web facilities in all the information systems. The great advantage of Web-based systems is that of being available 24 hours a day and 7 days a week. They reduce the technological barriers and make the information available to a large number of users, both inside and outside the organization – managers, analysts, customers, suppliers and other stakeholders – wherever they are located. These systems have to be robust, easy to use, flexible and scalable and to maintain consistent response times as the number of concurent users and requests increases.
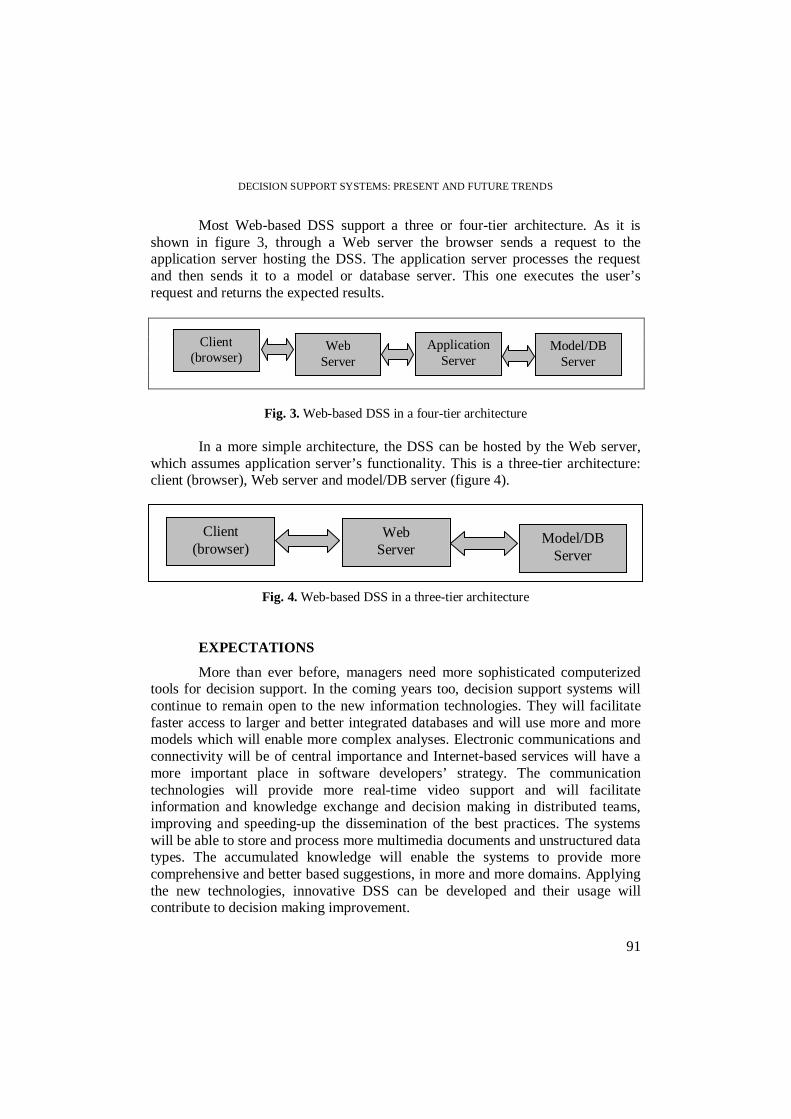
DECISION SUPPORT SYSTEMS: PRESENT AND FUTURE TRENDS
91
Most Web-based DSS support a three or four-tier architecture. As it is shown in figure 3, through a Web server the browser sends a request to the application server hosting the DSS. The application server processes the request and then sends it to a model or database server. This one executes the user’s request and returns the expected results.
Fig. 3. Web-based DSS in a four-tier architecture
In a more simple architecture, the DSS can be hosted by the Web server,
which assumes application server’s functionality. This is a three-tier architecture: client (browser), Web server and model/DB server (figure 4).
Fig. 4. Web-based DSS in a three-tier architecture
EXPECTATIONS
More than ever before, managers need more sophisticated computerized tools for decision support. In the coming years too, decision support systems will continue to remain open to the new information technologies. They will facilitate faster access to larger and better integrated databases and will use more and more models which will enable more complex analyses. Electronic communications and connectivity will be of central importance and Internet-based services will have a more important place in software developers’ strategy. The communication technologies will provide more real-time video support and will facilitate information and knowledge exchange and decision making in distributed teams, improving and speeding-up the dissemination of the best practices. The systems will be able to store and process more multimedia documents and unstructured data types. The accumulated knowledge will enable the systems to provide more comprehensive and better based suggestions, in more and more domains. Applying the new technologies, innovative DSS can be developed and their usage will contribute to decision making improvement.
Client (browser)
Web Server
ApplicationServer
Model/DB Server
Client (browser)
Web Server
Model/DB Server
MANOLE VELICANU, GHEORGHE MATEI
92
Emerging technologies like GPS, machine learning, multimedia, wireless should be integrated in innovative DSS.
Decision support systems will continue to be integrated in larger software systems such as ERP (Enterprise Resource Planning), systems that cover all domains of activity in an organization, from operational level to strategic one.
Another important trend is to include DSS in Business Intelligence systems, which provide a flexible, fast data analysis environment built around the decision-making process. No DSS could solve all the problems a company is facing. A universal DSS does not exist and will probably never exist. Developing such a global system would need so many human, financial and time resources that it would be extremely inefficient. Even its effectiveness may be a matter for debate. As a DSS is developed to solve a certain decisional problem, the solution is to build more specific DSS and to integrate them into a Business Intelligence system. For the time being, the Business Intelligence systems are the most evolved systems that offer support to all the functions of the company’s management, at any organizational level. Such systems enable business insights and a better understanding of the company’s business from multiple perspectives. They combine the capabilities of all the presented DSS in a complex solution that provides advanced facilities for data storing, processing and analysing. They enable a more proactive, high-frequency interaction with data for a large number of users. A Business Intelligence system makes more effective the tactical and strategic decision making and “gains competitive advantage, improves business operations and profitability, and generally achieves whatever goals management has set” (Power, 1997).
The novel DSS must include into their architecture dashboards, effective and easy to use analityc tools, which consolidate, arrange and display data onto a single screen, so users can understand trends and correlations at a glance. Similar to the instrument panel in a car, a dashboard provides managers a simple and user-friendly presentation of the information needed to “drive” the business. It provides visual presentations of performance measures, and increases the ability to make more informed decisions and to align strategies and organizational goals. As a picture is worth than a thousand words, data is displayed mainly as gauges or other visual symbols, as well as graphics such and charts. For example, a quick glance at a trend-oriented graphic can provide a comprehensive image of performance history and status and helps users make effective analyses and comparisons of multiple data sources using the dimension of time. Starting from them, users can use a drill-down option and generate detailed reports showing root causes, correlations and trends. So, dashboards provide users a quick and easy way to analyse large amounts of data and allow them to make smarter decisions faster than ever before. Dashboards can also have an alerting component that notifies the user if a certain metric falls outside of a predetermined range.
As already mentioned, the DSS using OLAP tools provide the highest level of functionality. As a matter of fact, these systems are hybrid ones. They handle
DECISION SUPPORT SYSTEMS: PRESENT AND FUTURE TRENDS
93
large volumes of historical data, stored in relational or multidimensional databases, and use various algorithms for data modelling and analysing. Through network and communication technologies they can share documents and knowledge, facilitate collaboration and coordination, and can be used by decision makers working together as a group, in a distributed computing environment. That’s why the evolved decision support systems should be discussed and explained in terms of the dominant architectural component, the targeted users, the specific purpose of the system and the basic deployment technology.
CONCLUSIONS
The implementation of diverse technologies in certain integrated information systems, which are able to assist all organizational levels, represents a condition for a business’s success or even its survival. Decision support systems are a category of information systems which are developed to assist the decision making process, helping the companies to better and more quickly respond in a more complex and dynamic economic environment. Their purpose is to help tactical and stategic levels of management in solving unstructured or semistructured problems, to help decision makers to interpret the relevant information from data, documents, knowledge and models, in order to improve the quality of the decision making process. These systems use human judgement, based on experience, knowledge and intuition, as well as computer stored information, and provide many options for data processing and information assessment. Integrated in larger and more complex systems such as Business Intelligence systems, they can provide companies with competitive advantages, contributing to their success.
REFERENCES
1. Alter, Steven, 1980. Decision Support Systems: Current Practice and Continuing Challenge. Reading (Ma): Addison-Wesley.
2. Bhargava, H. & Power, D. J., 2001. Decision Support Systems and Web Technologies: A Status Report. Proceedings of the 2001 Americas Conference on Information Systems. Boston (Ma). August 3-5, 2001.
3. Bonczek, R. H., Holsapple, C. W. & Whinston, A., 1981. Foundation of Decision Support Systems. New York: Academic Press.
4. Demarest, Mark, 2005. Technology and Policy in Decision Support Systems. DSS Resources.com, 07/08/2005. Available at:
http://dssresources.com/papers/features/demarest05/demarest07082005.html
5. Gorry, G. A. & Scott-Morton, M. S., 1971. A Framework for Management Information Systems. Sloan Management Review, Vol. 13, No. 1, 1971.

MANOLE VELICANU, GHEORGHE MATEI
94
6. Keen, P. G. & Scott-Morton, M. S., 1978. Decision Support Systems: An Organizational Perspective. Reading (Ma): Addison-Wesley.
7. Power, D. J., 1997. What is a Decision Support System?. DSStar, On-Line Executive Journal for Data-Intensive Decision Support, Vol. 1, No. 3, October 21, 1997. Available at: http://dsa.cba.uni.edu/glossary/dssglossary.html
8. Power, D. J., 2001. Supporting Decision-Makers: An Expanded Framework. Proceedings of Informing Science Conference, Krakow, Poland. June 19-21, 2001, pp. 431-436. Available at:
http://dssresources.com/papers/supportingdm/PowerEBKSupp.pdf
9. Power, D. J., 2005a. Bill Inmon Interview: Data Warehouse and Decision Support Systems. DSSResources.COM, 05/12/2005. Available at:
http://dssresources.com/interviews/inmon/inmon05122005.html
10. Power, D. J., 2005b. Clyde Holsapple Interview: Big Picture about DSS. DSS Resources.COM 2/11/2005. Available at:
http://dssresources.com/interviews/holsapple/holsapple02112005.html
11. Sprague, R. H. & Carlson, E. D., 1982. Building Effective Decision Support Systems. Englewood Cliffs (N.J.): Prentice Hall.
12. Tiedrich, Alan, 2001. Business Intelligence Tools: Perspective. Gartner Inc., Tutorials, October 9, 2001.
13. Turban, E., Aronson, J. E. & Liang, T. P., 2004. Decision Support Systems and Intelligent Systems. 7th edition. Englewood Cliffs (N.J): Prentice Hall.

STUDIA UNIVERSITATIS BABEŞ-BOLYAI, NEGOTIA, LIII, 2, 2008
CRITERIA FOR PRODUCT QUALITY IN THE FRAME OF
INTERCULTURAL MARKET STRATEGIES OF SMALL AND MEDIUM SIZED ENTERPRISES
- a brief review of literature -
MIHAELA DRAGAN1, ZENOVIA CRISTIANA POP2
ABSTRACT. The paper shows that a successful sale of a product is determined not only by the quality but also by the country-specific differences in the field of quality management. Although these criteria are world-wide similar, the priorities are national defined differently. Being an essential component of international management, the intercultural aspects of quality management are acting as a science that is common-shared by all nations and has a great influence on the social behavior of the costumer.
The quality term is treated in respect with reference to the user, to the criteria of product quality such as: design, functionality, image of the manufacturer, service, many – sided applicability, economic efficiency and reliability on the one hand as well as to intercultural market strategies on the other hand. Keywords: product quality, criteria of quality, quality management, intercultural market strategies INTRODUCTION
As to be able to make its way on the market every small and medium sized enterprise must ensure that the customer satisfaction is reached. That is why the product has to have a certain quality, a price which is justified and to fulfill the delivery date. For the customer, price and delivery are two of the three factors which will be easily forgotten, while quality remains important in the long term. The same idea is stated by Frederick Henry Royce who says that “quality exists, when the price is long forgotten". Ahire/Dreyfus try to answer questions on the importance of (product -) design management and the role it is playing over the perception of product quality by the customer3.
1 Associate Professor, Ph.D., Faculty of Economics and Business Administration, Babes-Bolyai University
Cluj-Napoca, Romania [email protected] 2 Student, Ph.D., Faculty of Economics and Business Administration, Babes-Bolyai University Cluj-
Napoca, Romania, [email protected] 3 Ahire, Sanjay L; Dreyfus, Paul, (2000), The impact of design management and process management
on quality: an empirical investigation. Journal of Operations Management, vol 18, Issue 5, p. 551

MIHAELA DRAGAN, ZENOVIA CRISTIANA POP
96
The "collective program” within a culture mentioned by Hofstede can be seen as the process called by Ahile/Dreyfus as an "external quality" which can be equaled with "fitness of use" - dimension of product quality of Juran.
In the center of the policy of many enterprises stands quality in the center. She gained a central position because it is an important-growing factor for the long-term market success. Non quality and its consequences cannot be afforded by an enterprise. Quality has the same level of importance with the holding extension, the reduction of costs, productivity growth, the increasing satisfaction of the clients and profit increase.
When an enterprise having a foreign culture aims at introducing a new product on the market, it must take into account a major factor like the cultural history. It persuades through real quality, but the client’s cultural behavior (“patterns”), known as “the collective programming of the spirit” plays a crucial role, “first, as they relate to costumer behavior and, second, as they affect the implementation of marketing programs within individual markets and across markets.”4 Culture, acting as a common-shared science, as an orientation system for a social behavior, as “the right way”, is not of a secondary importance, being thus an essential component of the international management.5
In a global society the international associations should become a serious competitive advantage, but reality proves the opposite: 80% of the international enterprises and strategic alliances fail and require the expensive fusions’ abolishment. For the banished ones the situation is a bit different: almost a third of the personal from outside the country (between 10% and 45%) is not able to become familiar with the new climate and has to put a premature end to their trip. The reasons why the transnational enterprises fail are not mainly represented by technical, financial or strategic problems (30%); they are rather to be found though the cultural differences (70%).
The impossible or insufficient adaptation to o friendly culture psychologically leads to in-group-out-group way of thinking which precedes a premature ceasing of the activities. Taking into account that, according to Worchel6 , security and existence are the main features of the cultural groups, the insurances in this area determine the separation from the other group. A banished person, meant to play the role of a medium is permanently between the culture/native enterprise poles and zeal-culture/affiliate enterprises.
MATERIAL AND METHOD
Nine hypotheses light up the connection of process and design management, only thesis 1, 2, 5 and 6 are relevant in relation to customer satisfaction an these thesis will be further analyzed. The first thesis postulates a correlation of internal and external quality. The outgoing is the fact that both functionality and reliability of the product affect the satisfaction of the costumer through complaints and
4 Czinkota M.R., Ronkainen I.A., (7. Ed.., 2004), International Marketing, Thomson Learning, Mason, S. 58 5 Czinkota M.R., Ronkainen I.A., (7. Ed.., 2004), International Marketing, Thomson Learning, Mason, S. 70 6 Worchel, Stephen, (2005), Culture’s role in conflict and conflict management: Some suggestions,
many questions. International Journal of Intercultural Relations, Vol, 29, Issue 6, p. 739-757

CRITERIA FOR PRODUCT QUALITY IN THE FRAME OF INTERCULTURAL MARKET STRATEGIES
97
warranties. In the Thesis 2 is indicated that the product design the external quality affects. If companies realize that they have to invest more in innovation, as to be able to come up whit a better product design and to introduce quicker their product, they will win consumers through a better understanding of their preferences and needs. A positive effect on the external quality is reached by a process orientated quality management explained in Thesis 5.
Thesis 5 explains that a process orientated quality management has a positive effect on the external quality. Thesis 6 designates the positive connection between design management and product design. “The design process ensures that product designs are relevant to customer needs. “7
For the survival of a company, to develop and introduce new products becomes essential. Every small end medium sized enterprises must adopt and adapt their policy on the development of new products to their specific operations and according to the nature of their field of activity8. Reed claims that under uncertain market terms can companies invest in the product design. In a foreign cultural surrounding field, a company is noticed first over the product (design). It is important to see which value the customer perceives over an enterprise apart from the products and their design. Examining the data between 1995 and 2004 Nair9 establishes a clear relationship between quality management and the achievement of the enterprise, extending the ranges of quality management, one can call classical, to other dimensions such as product quality (stable quality, reliability, and design quality) and to the customer alignment (service alignment).
The classical ranges are the corporate management, leadership, process management, product management data analysis and supplier management. Therefore a high correlation between the corporate management, customer alignment and product quality can be established. This offers crucial information for the managers. There is no correlation between the leadership and the product quality, as well as between the leadership and customer alignment as follows:
A high correlation offers here the connection of the corporate management, the customer alignment, and product quality. Since the two latter criteria with the corporate management are positively connected, this influences crucial the company’s prosperity. It is adequate for an enterprise to offer on the market a quality which the competitive enterprise may establish (production quality) and which may be inquired by one of the customer (product quality).
7 Ahire, Sanjay L; Dreyfus, Paul, (2000), The impact of design management and process management
on quality: an empirical investigation. Journal of Operations Management, Vol 18, Issue 5, p. 555 8 Michail Kagioglu John M.Sharp, Zahir Irani, (2002) Information system flow models for new
product development processes: speed and flexibility vs. focus and control International Journal of International Technology of and Management, Vol. 1, No.2/3 pp. 168-190
9 Nair, Anand, (2006), Meta-analysis of the relationship between quality management practices and firm performance – implications for quality management theory development. Journal of Operations Management, Vol 24, Issue 6, p. 960

MIHAELA DRAGAN, ZENOVIA CRISTIANA POP
98
Classical Ranges Correlation corporate management customer
alignment product quality positive
leadership customer alignment
- negative
leadership - product quality negative
The product quality will be defined as: “fulfilling the requirements of a developed product”. These are liable to criteria10 such as there in the following scheme:
Criteria of quality
1 Design 2 Functionality 3 The image of the producers and label 4 Service 5 Multisided applicability 6 Economic efficiency 7 Reliability
The fact appears in the intercultural context that the perceptions of the seven criteria are country-specific. As to determine the impact of culture on sales, one more criteria of the customer must be determined (hence from Garvin and its eight criteria of product quality: functionality, characteristics, reliability, adjustment, durability, aesthetics and noticed quality by the customer).
There are two essential factors that lead to product’s/service’s acceptance and marketing: first of all education and, secondly, the reference groups. While the pretentious related to a product increase in the same time, with the level of education, the reference groups as well as family, friends determine the values and arrangements that influence the behavior. The last will be the key element in establish the criteria used in choosing and buying a product.
The lack of knowledge about the way of living and the cultural history has an immediate effect on a company’s success. More precisely, it requires a close relation between the product evolution, the marketing department and the market exploitations, in order to successfully introduce services carrying out a product on a market with a different culture. “While products that hit the right cultural buttons can be huge successes in foreign markets, not all top brands will translate easily from one culture to another”11. This process of adaptation depending on the cultural variables is often
10 Schoper Y., (2004), Interkulturelle Unterschiede im Qualitätsverständnis, in: Internationales
Projektmanagement, dtv, München, S. 296 11 Vgl. Czinkota M.R., Ronkainen I.A., (7. Ed.., 2004), International Marketing, Thomson Learning,
Mason, S. 69
CRITERIA FOR PRODUCT QUALITY IN THE FRAME OF INTERCULTURAL MARKET STRATEGIES
99
joined by “trial and error”. Moreover, the sensitive products, such as consumption goods12 and nutriments, need a serious analysis of their consumption, based on the customer’s perspective and his attitude towards the product, and on the selling flow. “Research studies show that, independent of social class and income, culture is a significant influence on consumption behavior and durable goods ownership”13.
The studies analyzing intercultural management are interested in the features/abilities which should characterize an international manager. The aim of Cassiday’s research is to establish the attitudes that leading people like managers, should have in order to be successful in their business: “It seems reasonable that when it comes to argue that understanding the experiences of leaders, as they transition to a new culture and attempt to communicate effectively in a new environment, becomes more and more essential. The purpose of this study was to investigate the relationship between the deeply held values, beliefs and assumptions of expatriate leaders, and their effective leadership practice”14. The study contains 11 partial structured interviews, having as a hypothesis the fact that the world is always subjectively looked. It depends on everyone’s system of values, because this system defines the human being individually. The same study refers to four variables according to Perry (phases of plurality), Hall (value orientation), Kluckhohn and Strodtbeck (cultural values), and to Rosen (global forming). Through these criteria the study points out that that leading persons who admit the cultural relativity are interested in their own professional evolution (the world as a “creative project in which I want to participate and to which I have something unique and different to offer”15). The manager acting in an intercultural environment is using the best practical models, different cultural values and ways of behavior. The measures used in creating a secure atmosphere, the effective communication (the ability to listen to the others), as well as recognition of the verbal and nonverbal key-signals, are of a great importance in solving problems within a multicultural team. The governing body is given the task to promote, a situation in which the central value is embodied in the communication process and interaction. “Conflict resolutions skills on multicultural teams often depend on the leaders’ meditation skills and knowledge of intercultural issues”16. Those belonging to the successful governing body were able to express their own perceptions and principles regarding various cultures and to maintain a “creative tension”.
12 Vgl. Keegan W.J, Schlegelmilch B.B., (6. Ed.., 1999), Global Marketing Management, Prentice-
Hall, Essex, S. 99 13 Keegan W.J, Schlegelmilch B.B., (6. Ed.., 1999), Global Marketing Management, Prentice-Hall,
Essex, S. 96 14 Cassiday, Patricia A, (2005), Expatriate leadership: An organizational resource for collaboration.
International Journal of Intercultural Relations, Vol, 29, Issue 4, p. 393 15 Hall, nach: Cassiday, Patricia A, (2005), Expatriate leadership: An organizational resource for
collaboration. International Journal of Intercultural Relations, Vol, 29, Issue 4, p. 398 16 Cassiday, Patricia A, (2005), Expatriate leadership: An organizational resource for collaboration.
International Journal of Intercultural Relations, Vol, 29, Issue 4, p. 406
MIHAELA DRAGAN, ZENOVIA CRISTIANA POP
100
Even Jun, Lee and Gentry (1997) agree with Cassiday; the fact that the banished need to adept themselves to a friendly culture. “Culture and ethic roots define the group, and the group becomes active in pressuring group members to participate in protecting and perpetuating the culture.”17
So managers must not play the role of the banished. The study examines the direct and indirect effects of this cultural adjustment for the Commitment to the foreign subsidiary as to the master enterprise. Two hypotheses precede the investigation, on the one hand the statement that the Commitment to the foreign subsidiary is in direct and positive way connected with the degree of the cultural connection, as well as the consideration, that the Commitment to the master enterprise is rather indirectly submitted.
RESULTS
As presented in the table above, criteria are world-wide similar, but the priorities of these criteria are national differently defined. One may understand quality in Germany as reliability, functionality and good design. People from countries like Italy and France see design in connection with style and aesthetic shaping. In England criteria such as hand-made products are important. Branded articles with good image and a large number of functions are preferred for example by the American customers18. A good illustration and understanding for the approach and its conception, is offered through the term quality, by the manufacturers of technical products both in America and Germany. While the Germans want to bring a product on the market only then, when it is technically perfectly out swept, the Americans prefer speed and innovative design. Even thought the American customer is adjusted on this fact, the German is however not!
In Japan quality is equaled again with high reliability, topicality and a maximum at functions. The circumstance that Germans and Japanese share a similar quality concept, can be explained, that Japanese cars may obtain a large market success in Germany and that German vehicles in Japan exhibit a comparatively high market share.
“While in Japan and Germany high technical yardsticks are being applied this high demands come across in the USA through lack of understanding. Because there economy and productivity of an enterprise have priority”19.
In Poland, Hungary and Slovenia is stated a "new" group affiliation which defines itself over status symbols and prestige objects: “that was also connected to a remarkable achievement orientation in middle management- layers and a clear career-
17 Worchel, Stephen, (2005), Culture’s role in conflict and conflict management: Some suggestions,
many questions. International Journal of Intercultural Relations, Vol, 29, Issue 6, p. 744 18 Schoper Y., (2004), Interkulturelle Unterschiede im Qualitätsverständnis, in: Internationales
Projektmanagement, dtv, München, S. 296f 19 Schoper Y., (2004), Interkulturelle Unterschiede im Qualitätsverständnis, in: Internationales
Projektmanagement, dtv, München, S. 299
CRITERIA FOR PRODUCT QUALITY IN THE FRAME OF INTERCULTURAL MARKET STRATEGIES
101
conscious"20. Therefore it appears in the purchase pattern that quality deals with the fact that humans have" to be able to afford something. “The price is here considered again a quality criterion. A survey carried out in the faculties of Burgenland among students from Middle and South-East Europe proved that quality is defined in Poland, Croatia, Hungary and Czech Republic, primarily, over the price. Hungary follows the mark and the reliability, in Croatia the mark and the design (nearness to Italy), in Czech Republic reliability (traditionally close trade relations with Germany) and service likewise.
The example of Intercultural Market Strategies proves that dependency on costumers shows that the quality value is to be found in the eyes of the onlooker; as a result, the products which can be characterized by high quality are those satisfying most of the consumers’ needs. For example, the coming out of the walkman on the market proves again that quality always starts with the attitude towards a product. The walkman was designed to create the possibility to listen to music, without disturbing those next to you (collective culture). Still, one of the main reasons why the walkman was launched on the European market is represented by someone-s will not to be disturbed (the individualist culture)21. From this point of view, based on the cultural adjustments requirements regarding a certain product can be made. An example could be that of VW Golf, which was sold very good in Europe, but it did not manage at all to be on the same level with the US market-unlike the new Beetle. Made in Mexico, this automobile was not able to justify its selling price of about 18,000 EUR22. Unlike this case, due to its unusual shape, the car somehow succeeded in touching the customers’ feelings (design as a criterion for the quality of the product). Another example is that given by the quality of Persil detergent which is being sold due to its values connected to future and family, and also by the idea of creating a clean and wealthy climate, the only thing that matters, in terms of quality, being the washing power of the product.
For instance, Heiz Co. sells sweet ketchup in US while the Europeans tend to buy more piquant ketchup; in central Europe, there is another assortment called “Hot Ketchup”
Some examples of stable systems of value are represented by the auto distribution industry, Toyota; ore other companies from different industries like Dell, IKEA and Nike network distributions.
DISCUSSIONS
This allows the discussions that those countries which co-operate, traditionally closely approximate also in the quality understanding. The researcher and management advisor Fons Trompenaars from the Netherlands sees the synergies for intercultural
20 Meierewert S, Horváth-Topcu K., (2002), Kulturstandards im Vergleich: Österreich und Ungarn,
in: Österreichische Perspektiven, S. 122 21 Trompenaars F., (1993), Handbuch globales Managen. Wie man kulturelle Unterschiede im
Geschäftsleben versteht, verlag Econ, Düsseldorf, S. 24 22 Keegan W.J, Schlegelmilch B.B., (6. Ed.., 1999), Global Marketing Management, Prentice-Hall,
Essex, S. 77f

MIHAELA DRAGAN, ZENOVIA CRISTIANA POP
102
quality. Reed et.al. also underlines the fact that culture can serve to create one lasting competitive advantage, however, less than two restrictions: if this presents itself either coherently, or the synergy can be used; at if necessary one should count on friction losses. Nevertheless, enterprise cultures can ignore national cultures, because according to Schein the culture is embedded in the group and not vice versa.
“The buying behavior of consumers is heavily influenced by tastes and preferences of their own culture”23. Thus, the quality of products is given by customers’ preferences and tastes, which means that only those things satisfying people’s expectances last.
In this context, Molle/Svahn discusses the influence of culture on cognitive management within various ethnic industries. They take into account that culture represents the ultimate factor for the communication inside a company. “Our basic assumption is that the nature of the cultures involved in the network through the ethnic background of the member firms and the type of network, both influence the barriers faced in knowledge sharing”24. A central feature of this influence is the system of values. Each carried out product or service involves values that create and divide a common group. Given the subordination of this system to a certain culture, the system itself creates another complex system, the product’s launching and evolution on the market of a different culture being able to bring a real success, but only if the product respects the customers’ needs within their own systems of values. Most of the authors distinguish between 3 types of systems of values that act depending on this evolution of the product: stable systems of value, stabled and future systems. Stable systems of value have a constant orientation. Through value growth and local modifications (e.g.: the research and evolution networks, as well as the change management within enterprises’ procedures). It is all about offering new pieces of information and product’s evolution inside a different culture market; this type of network determines challenging promises, being not only adaptable but also integrated in the basic culture. The basic culture helps in creating a base on whose matrix the products can be adapted to a tel-culture.
As far as the future systems are concerned, they need radical changes of their present system of values and of their activities. Some examples could be those of Internet protocols and mobile telecommunications. This system of values opens many gates to the launching and evolution of the new products depending on the customers from a certain cultural area, but it also involves an imminent risk: “Uncertainty and ambiguity related to value activities and to actors and their capabilities are inherent features of this landscape (…)”.
The authors consider that there are other cultural orientations connected to the three types (according to Hofstede and Triandis): “Triandis and his colleagues suggest that the four cultural patterns derived by combining these dimensions-
23 Keegan W.J, Schlegelmilch B.B., (6. Ed.., 1999), Global Marketing Management, Prentice-Hall,
Essex, S. 88 24 Möller, Kristian; Svahn, Senja, (2004), Crossing East-West boundaries: Knowledge sharing in
intercultural business networks. Industrial marketing Management, Vol. 33, issue 3, p. 220
CRITERIA FOR PRODUCT QUALITY IN THE FRAME OF INTERCULTURAL MARKET STRATEGIES
103
vertical-individualistic (VI), vertical-collectivist (VC), horizontal-individualistic (HI), horizontal-collectivist (HC)-strongly influence how information and knowledge may be selectively transferred and processed”25. VI cultures are those named after the authors from France, Germany, Great Britain and USA, the VC cultures after China, India, Korea and Singapore, HI after Australia, Denmark and Sweden, the only HC culture being represented by Japan. HC combined with VI represent the greatest intercultural challenge (e.g.: Germany-Japan) which is essential to the development of new specialized products and to a client-oriented disposition.
Both proposed hypotheses are confirmed, because a Commitment correlates to the foreign daughter significantly with cultural touch and social interaction in the host country. “It was found that both dimensions of acculturation had direct effects on commitment to the foreign operation, but had only indirect effects on commitment to the parent company through commitment to the foreign operation, as was hypothesized”26.
Brew/Cairns explain about the conflicts between Australian and Asiatic managers regarding the importance of the cultures, and also the dimensions for their study of individualisms/ collectivism as well as highly and low contextual cultures. Three conflict situations are lighted up outgoing from the acceptance that culture shows the most important factor in the conflict behavior, the criteria pressure of time, cultural identity of the conflict partner. These situations stand in close relationship with a further criterion belonging to Hofstede, the power distance, because countries of Eastern Asia show a higher power distance and an unequal hierarchy relations than western countries in which a lower power distance and a rather equal management style rule. The general hypothesis, that Australian emigrants chose a stronger direct conflict and East Asian country members a rather indirect conflict style, is shown in this study regarding only the (western) superior. Both parties however prefer a more strongly direct and/or less indirect conflict style under time pressure or however avoid the conflicts, if it is possible, in order to be able to keep the dead line: “when the clock becomes important, then there is less time for socializing and relationship building during the working day”27.
CONCLUSIONS
This study comes to the conclusion that quality can be defined only through the critical view of the client. Differences can be seen both directly in the quality of the products and also in the utility of such products.
25 Möller, Kristian; Svahn, Senja, (2004), Crossing East-West boundaries: Knowledge sharing in
intercultural business networks. Industrial marketing Management, Vol. 33, Issue 3, p. 222 26 Jun, Sunkyu et. al., (1997), The effects of acculturation on commitment to the parent company and
the foreign operation. International Business review, Vol 6, Issue 5, p. 531 27 Brew, Francis P.; Cairns, David R., (2004), Do culture or situational constraints determine the
choice of direct or indirect styles in intercultural workplace conflicts? International Journal of Intercultural Relations, Vol, 28, Issue 5, p. 346

MIHAELA DRAGAN, ZENOVIA CRISTIANA POP
104
The factor culture has therefore a great influence in planning the marketing strategies. The attributes and attitudes of every manager towards the intercultural context in which the company functions can determine if the company will have success or not.
Finally, the intercultural management pointed out that those involved in individualist cultures appreciate personal motivations more and more, while collective cultures’ priority is given by some kind of a team award.
Inside the individualist cultures personal communication and writings appear in order to solve the conflicts, and the collective ones are rather based on group communication. Generally, the most appreciated in intercultural competition’s development are tolerance in multidimensional situations, cultural sensitivity and empathy.
Concerning the cultural identity of the conflict partners, the study comes to the conclusion that the superiors of the host country communicate directly without consideration for the culture of the coworkers, while foreign superiors should select rather an indirect conflict style.
The study points out that the members of the host country react generally more sensitive than foreigners. This happens because members of the host country maintain a more strongly indirect, diplomatic and less controlling style towards superior and rather direct style towards employees, while this difference plays no role with foreigners.
In cultures with high power distance however status strongly respected. The power distance is considered the strongest distinction to handling conflicts.
REFERENCES
1. Ahire, Sanjay L; Dreyfus, Paul, (2000), The impact of design management and process management on quality: an empirical investigation. Journal of Operations Management, Vol 18, Issue 5, p. 551
2. Czinkota M.R., Ronkainen I.A., (7. Aufl., 2004), International Marketing, Thomson Learning, Mason, S. 58
3. Worchel, Stephen, (2005), Culture’s role in conflict and conflict management: Some suggestions, many questions. International Journal of Intercultural Relations, Vol, 29, Issue 6, p. 739-757
4. Michail Kagioglu John M.Sharp, Zahir Irani, (2002) Information system flow models for new product development processes: speed and flexibility vs. focus and control International Journal of International Technology of and Management, Vol. 1, No.2/3 pp. 168-190
CRITERIA FOR PRODUCT QUALITY IN THE FRAME OF INTERCULTURAL MARKET STRATEGIES
105
5. Nair, Anand, (2006), Meta-analysis of the relationship between quality management practices and firm performance – implications for quality management theory development. Journal of Operations Management, Vol 24, Issue 6, p. 960
6. Schoper Y., (2004), Interkulturelle Unterschiede im Qualitätsverständnis, in: Internationales Projektmanagement, dtv, München, S. 296
7. Czinkota M.R., Ronkainen I.A., (7. Aufl., 2004), International Marketing, Thomson Learning, Mason, S. 69
8. Keegan W.J, Schlegelmilch B.B., (6. Aufl., 1999), Global Marketing Management, Prentice-Hall, Essex, S. 99
9. Cassiday, Patricia A, (2005), Expatriate leadership: An organizational resource for collaboration. International Journal of Intercultural Relations, Vol, 29, Issue 4, p. 393
10. Hall, nach: Cassiday, Patricia A, (2005), Expatriate leadership: An organizational resource for collaboration. International Journal of Intercultural Relations, Vol, 29, Issue 4, p. 398
11. Worchel, Stephen, (2005), Culture’s role in conflict and conflict management: Some suggestions, many questions. International Journal of Intercultural Relations, Vol, 29, Issue 6, p. 744
12. Schoper Y., (2004), Interkulturelle Unterschiede im Qualitätsverständnis, in: Internationales Projektmanagement, dtv, München, S. 296f
13. Meierewert S, Horváth-Topcu K., (2002), Kulturstandards im Vergleich: Österreich und Ungarn, in: Österreichische Perspektiven, S. 122
14. Traars F., (1993), Handbuch globales Managen. Wie man kulturelle Unterschiede im Geschäftsleben versteht, verlag Econ, Düsseldorf, S. 24
15. Keegan W.J, Schlegelmilch B.B., (6. Aufl., 1999), Global Marketing Management, Prentice-Hall, Essex, S. 77f
16. Möller, Kristian; Svahn, Senja, (2004), Crossing East-West boundaries: Knowledge sharing in intercultural business networks. Industrial Marketing Management, Vol. 33, issue 3, p. 220
17. Jun, Sunkyu et. al., (1997), The effects of acculturation on commitment to the parent company and the foreign operation. International Business review, Vol 6, Issue 5, p. 531
18. Brew, Francis P.; Cairns, David R., (2004), Do culture or situational constraints determine the choice of direct or indirect styles in intercultural workplace conflicts? International Journal of Intercultural Relations, Vol, 28, Issue 5, p. 346
19. Stashevsky, Shmuel; Elizur, Dov, (2000), The effect of quality management and participation in decision-making on individual performance. Journal of Quality Management, Vol 5, Issue 1, p. 62
STUDIA UNIVERSITATIS BABEŞ-BOLYAI, NEGOTIA, LIII, 2, 2008
DERIVATIVE INSTRUMENTS – ALTERNATIVES TO COVER
THE FOREIGN EXCHANGE RATE IN THE CASE OF IMPORT-EXPORT OPERATIONS - ACCOUNTING APPROACH
FOR ROMANIA
CRISTINA SILVIA NISTOR 1, CRINA IOANA FILIP 2, ADELA DEACONU 3
ABSTRACT The present dynamics of the economic environment imply the existence of permanent exchange between the world states’ economies. This fact is benefic for and desired by all the participants on the international economic transactions market, but it may also imply some risks. Thus, they must have the capacity, in the current conditions of financial evolutions and involutions, to protect themselves against the risk generated by foreign currency fluctuations in the case of international business. In this paper, our attention is focused on the possibilities of diminishing the foreign currency risk of the import-export operations, through usage of derivative instruments. We singularized the research for two components of the derivative instruments: futures and options. We added an accounting approach to the theoretical approach singularized for Romania. In order to be relevant, our study was build in parallel, by highlighting the effects of the foreign currency fluctuations in both the cases of using and not using derivative instruments. The research findings will demonstrate and sustain the fact that usage of derivative instruments is an admissible way to cover the risk generated by foreign currency fluctuations in the case of import-export operations. Keywords: derivative instruments, foreign currency risk, import-export, accounting approach, Romania 1. INTRODUCTION
Globalization started to be defined after the Second World War. It implies the internationalization of commercial exchange, production and, last but not least, capital markets. The capitalization of the opportunities offered by globalization turned out to be a catalyst for international trade, thus in the current environment all the world states, either rich or poor, developed or developing, are preoccupied with highly efficient participation to the world economy and economic circle.
1 Lecturer, PhD, Department of Accounting, Faculty of Economics and Business Administration,
Babes-Bolyai University, Cluj-Napoca, Romania, [email protected] 2 Lecturer, PhD, Department of Accounting, Faculty of Economics and Business Administration,
Babes-Bolyai University, Cluj-Napoca, Romania [email protected] 3 Assistant Professor, Phd, Department of Accounting, Faculty of Economics and Business
Administration, Babes-Bolyai University, Cluj-Napoca, Romania, [email protected]

CRISTINA SILVIA NISTOR, CRINA IOANA FILIP, ADELA DEACONU
108
Out of the vast international trade operations, we focused on the commodities import-export operations, considered to be the main form of international trade and, nevertheless, the base of interdependence between states in the trade environment.
LITERATURE REVIEW
Options appeared a long time ago as a response to investors’ needs. Confirmation of such instruments can be found way back to 3500 B.C. when the Phoenicians and Romans used contracts with terms similar to the present options regarding the commodities transported on their commercial boats. In Romania, until 2007, the only exchange where such instruments were offered was Sibiu Monetary - Financial and Commodity Exchange (now Sibex). Options were launched in November 1998. Sibex also offers options on futures contracts on 19 shares listed on the BVB and also for foreign exchange rates (RON/EUR, RON/USD, EUR/USD), rates of interest (EURIBOR, LIBOR, BUBOR) and stock market indices (SIBEX9 and SIBEX18) (Vlada, 2008).
The Romanian literature contains papers of various authors that, for the past years, were concerned mainly with research on financial instruments, in particular derivatives (Dutescu, 2000; Nistor, 2003, 2006; Filip 2006, 2007; Ivan Ungureanu, 2003; Coloian, 2006; Miclaus, 2008). Their findings on different aspects related to the existence of these instruments are highly valuable both for other researchers that may come to realize the impact of their usage in different situations and areas, and for the large public that may become an effective user of derivatives, and thus a trained participant in the international trade market.
Moreover, according to the latest statistics, the international market of derivative instruments has had a high growth rate in the past period, of 24% annually (2006). There are two major segments on this market i.e. derivative instruments for the rates of interest and foreign currency instruments (with an average growth rate of 13-15% annually). Another significant tendency of the market in the past period is the slowly decreasing growth rate for forward contracts on foreign currency, swap foreign currency contracts and derivative instruments for primary titles (shares and stock market indices).
The international literature is far more abundant in information regarding derivative instruments. Exchange-traded forex futures contracts were introduced in 1972 at the Chicago Mercantile Exchange and are actively traded relative to most other futures contracts. Forex futures volume has grown rapidly in recent years, and accounts for about 7% of the total foreign exchange market volume, according to The Wall Street Journal Europe (2006).
Kolb did a great practical introduction to derivatives in the capital markets. It offers just enough theory for the reader to understand the important role that financial engineering plays in pricing and hedging these instruments. (Kolb, 2007)
Nassim Taleb's (1996) Dynamic Hedging is an extraordinarily authoritative and informative book. Balancing essential theory with the realities of markets, Taleb explains the strategy, tactics and risks—both on-model and off-model—of managing derivatives portfolios. Cautions, insights and essential techniques jumble together with anecdotes and practical examples.

DERIVATIVE INSTRUMENTS – ALTERNATIVES TO COVER THE FOREIGN EXCHANGE RATE …
109
The phenomenal growth of derivative markets across the globe indicates their impact on the global financial scene. As the securities markets continue to evolve, market participants, investors and regulators are looking at different ways in which the risk management and hedging needs of investors may be effectively met through the derivative instruments. However, it is equally recognized that derivative markets present market participants and regulators with different and complex regulatory (control) issues, which must be adequately addressed if derivative markets are to gain and maintain investors’ confidence. Thus, more and more companies are using (or being forced to use) futures and derivatives to stay competitive in a fast-changing world characterized by both unprecedented opportunities and unprecedented risks (Nwaobi, Godwin C, 2008)
Complexities of today's financial markets are increasing day, and so are the opportunities and risks associated with them. It has given a way out to hedge all levels of risks weather in domestic scenario or while dealing in a multi currency environment. Types of instruments are increasing from derivatives in the form of Futures and Options to the upcoming ones like currency swaps in open markets. Understanding each of them is difficult but it gives an extra edge in hedging the risks of small and big corporations or even at retail level.
2. MATERIAL AND METHODS
There are two arguments based on which we decided to research this theme. On the one hand there are the arguments already shown above, related to the international trade that represent, as an expression of each state’s participation to the world economic circuit in the present context of higher interdependence between the world states, the strategy for sustaining the national economies. On the other hand, because of the complexity and the importance of the foreign trade operations, they represent, also for accounting, a particular area, extremely important as far as research and application is concerned. Accounting researchers from all over the world issued similar hypothesis regarding the role of accounting in management science in general, and the role of information offered by accounting in particular, as part of information sources with economic characteristics. Romanian authors like Pantea (1999), Rosca (1993), Oprean (1999) consider that the economic informational system is the basis of management systems with a growing impact on economic functionality and efficiency, while the economic evidence holds 80% of the economic informational systems’ content and accounting holds 90% of the economic evidence.
In this train of thoughts, the research theme’s objectives shown in this paper are oriented especially towards:
� Harness of accounting information with regard to foreign currency transactions taking into account the risks generated by foreign currency fluctuations;
� Developing a possible solution for increasing the efficiency of an import or export operation within an economic entity (economic agent) corroborated with the possibilities of reducing the foreign currency risk.

CRISTINA SILVIA NISTOR, CRINA IOANA FILIP, ADELA DEACONU
110
In order to reach our objectives we based our study on certain deductive methods of scientific research. Thus, we analyzed the import-export operations using case studies, through the descriptive/narrative method, but we also analyzed documents, especially the accounting documents, both current and synthetic. We may note in this case the fact that we used both the quantitative and the qualitative method during our research. And, for the data collection, we used the observation method.
In order to set out our research’s directions we established certain research hypothesis. G. Watson (1987) said that to research means to answer a question or to search for an answer. It does not imply just the simple study of an area. The study represents a preliminary stage and it is indispensable for the research, but no more than that. This is the essential research point –the paper tries to solve or answer a question - if the motive exists, then finally the whole picture will exist.
The established hypotheses are: H1: The usage of derivative instruments, in this case futures contracts
represent a way to cover foreign currency risk at maturity in the case of import-export operations
H2: The usage of derivative instruments, in this case options contracts represent a way to cover foreign currency risk at maturity in the case of import-export operations.
Our findings will have a significant importance for all Romanian economic entities that are involved in the international trade process. The presence of foreign currency fluctuation risk in this process can not be denied.
The authors’ personal contribution to the subject of this paper i.e. the usage of derivative instruments, in this case term contracts futures and options, relates to the theoretical approach but most important to the practical side of the subject. For it to be relevant, the case study on Romania is based on the national and international framework i.e. the national legislation linked to the international accounting standards. We build our study in parallel, taking into account the effects of the foreign currency fluctuation when derivative instruments are used and when they are not used. The effects are shown both from the importer’s and the exporter’s point of view. In this way the findings can be interpreted more easily, thus the established hypothesis for the research theme can be validated or invalidated.
RESULTS AND DISCUSSIONS
3.1. General presentation
The main characteristic of an import-export operation is the fact that it is done in a foreign currency. To register the operation one has to transform its value into the national currency i.e. lei, by applying the exchange rate (established for the day of the transaction) between the national currency and the foreign currency to the value of the transaction. Subsequent, the balance sheet elements shown in a

DERIVATIVE INSTRUMENTS – ALTERNATIVES TO COVER THE FOREIGN EXCHANGE RATE …
111
foreign currency will be noted at a different exchange rate than the one from the day of the transaction (according to O.M.F.P no. 1.752/2005), thus differences of exchange rate may occur in one of the following moments:
� At the maturity of the debts and receivables registered in a foreign currency: � At the end of the financial year when the un-cashed receivables and
unpaid debts are reevaluated at the exchange rate from December 31st; � At the end of the financial year the amount in the account Cash at bank in
foreign currency is reevaluated at the exchange rate from December 31st in order to present correct information through the financial reports.
The recognition of the foreign currency fluctuations, at the above mentioned moments, will lead to financial income or loss that will influence the result of the economic agents’ activity engaged in import-export operations. As these transactions are part of their activity, in the end, the entity as a whole is influenced as far as import-export operations’ profitableness is concerned.
Under these circumstances, we consider that the economic entities that engage in import-export operations should take measures in order to eliminate these influences. Moreover, importers and exporters have to face another issue as they have to pay the profit tax applied to the differences generated by the foreign currency fluctuation.
Vişan, Buruda, Burtescu, LuŃă (2006) show such a way in the form of derivative financial instruments regulated by the International Accounting Standards: IAS 32 “Financial Instruments: Presentation” and IAS 39 “Financial Instruments: Recognition and Measurement” but also by the Romanian regulations O.M.F.P. no. 1.752/2005. This solution is used by a small part of undertakings, more active, trained and informed.
Out of the derivative financial instruments’ category we will focus on presenting term transactions - futures and term transactions with options as a concrete way of covering foreign currency risk,. Over time, as trade intensified, competitiveness and other factors triggered the appearance of these instruments, in an organized environment i.e. commodities and monetary-financial market.
3.2. Term transactions – futures
As any other transaction, the futures transaction is based on a contract. The contract contains the parties engagement to deliver, respectively receive, at a future date, a commodity or a determined foreign currency, at a price established in the moment the contract is signed, if at maturity, the operator’s position remains open. The party that takes on the obligation to receive the commodity/foreign currency opens a “long” position (long hedging), while the futures’ seller has a “short” position (short hedging).

CRISTINA SILVIA NISTOR, CRINA IOANA FILIP, ADELA DEACONU
112
The definition of the futures contract (Vişan et al, 2006) highlights its main features:
� The futures contract is standardized in respect to: the nature of the underlying security, the contracted quantity i.e. the transaction’s unit (for example 500 euros/contract), the delivery month. The delivery month does not represent an exact date but a period of time – months. Delivery months are predefined and published on the stock market.
� The price of the futures contracts is established using a specific negotiation and engagement procedure to this organized market. Depending on the market’s conditions the price fluctuates daily and thus the contract’s value is variable (not fixed as in the case of the forward contract);
� The futures contract is carried out by the actual delivery (the delivery of the underlying security) made only by the operators with open positions in the last transaction day established in the contract. From the moment the contract is signed until the delivery month the short position holder (the seller) may cover his position through a purchase, and the long position holder (the buyer) through a sale.
As an organized market, on which the price for futures contracts is established, a market that ensures the carrying out of the contracts and guarantees that each party respects its obligations, the stock market has a specific mechanism for these transactions (futures) that relates to the following (Vişan et al, 2006):
A. the transactions’ inception is initiated by the operators (buyers-sellers) through orders given to the broker firms with which they work in order to set the contracts. Concurrently the operators open special accounts at the broker firms in order to bring into effect the transactions. Primarily, the operators supply the accounts with a margin – a percentage established out of the value of the contracts. Subsequently, the level of the margin is brought up to date as the value of the futures contracts changes by market quotation4. Thus, the gains and losses determined by the market quotation are reflected in the operators’ accounts: they receive cash in the deposit account for the gains, and the losses are redrawn from the cash available in the account. When the cash in the account exceeds the level of the margin, the operators may redraw it of they may use it in order to open new futures positions. The guarantees available in the account after the contracts are terminated are returned to the operators;
B. market quotation of the futures contracts, and also the set of compensation operations, offset and delivery/acceptance of titles remain the responsibility of the Clearing Houses, which work directly with the brokers who likewise work with the operators (buyers-seller) that don not know each other;
4 Market quotation refers to the periodical adaptation of the futures contracts’ value according to the
futures price evolution on the market
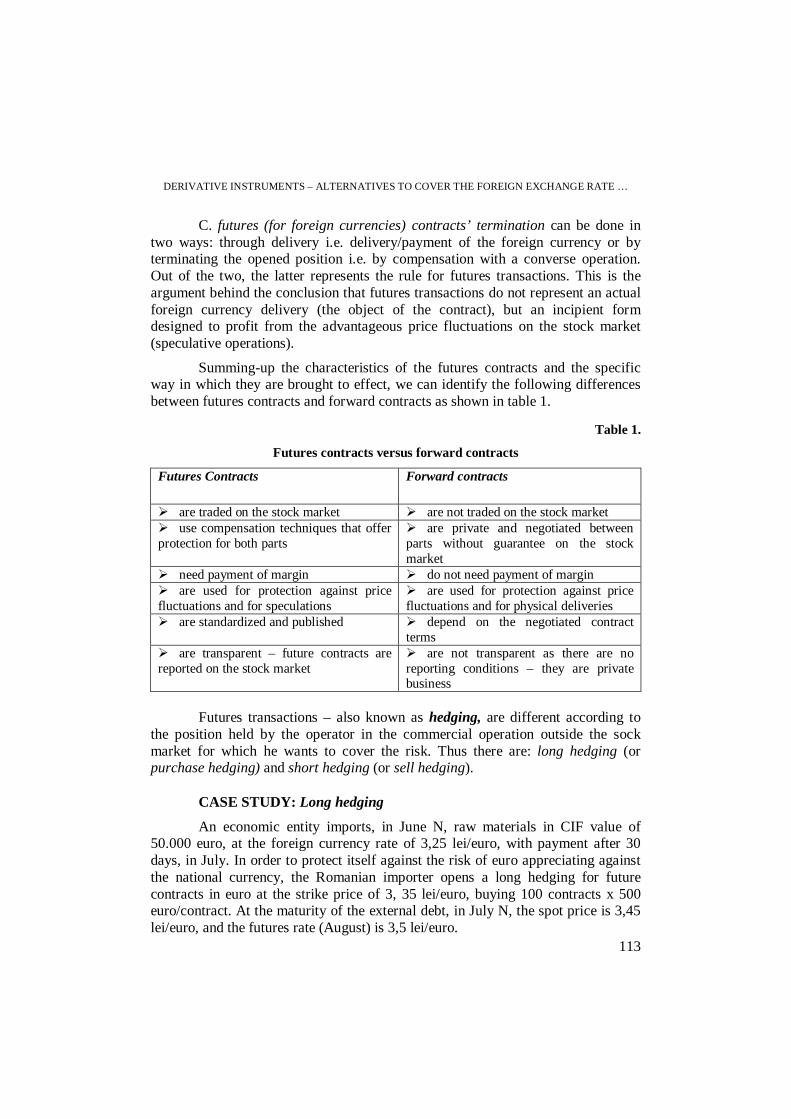
DERIVATIVE INSTRUMENTS – ALTERNATIVES TO COVER THE FOREIGN EXCHANGE RATE …
113
C. futures (for foreign currencies) contracts’ termination can be done in two ways: through delivery i.e. delivery/payment of the foreign currency or by terminating the opened position i.e. by compensation with a converse operation. Out of the two, the latter represents the rule for futures transactions. This is the argument behind the conclusion that futures transactions do not represent an actual foreign currency delivery (the object of the contract), but an incipient form designed to profit from the advantageous price fluctuations on the stock market (speculative operations).
Summing-up the characteristics of the futures contracts and the specific way in which they are brought to effect, we can identify the following differences between futures contracts and forward contracts as shown in table 1.
Table 1.
Futures contracts versus forward contracts
Futures Contracts Forward contracts
� are traded on the stock market � are not traded on the stock market � use compensation techniques that offer protection for both parts
� are private and negotiated between parts without guarantee on the stock market
� need payment of margin � do not need payment of margin � are used for protection against price fluctuations and for speculations
� are used for protection against price fluctuations and for physical deliveries
� are standardized and published � depend on the negotiated contract terms
� are transparent – future contracts are reported on the stock market
� are not transparent as there are no reporting conditions – they are private business
Futures transactions – also known as hedging, are different according to
the position held by the operator in the commercial operation outside the sock market for which he wants to cover the risk. Thus there are: long hedging (or purchase hedging) and short hedging (or sell hedging).
CASE STUDY: Long hedging
An economic entity imports, in June N, raw materials in CIF value of 50.000 euro, at the foreign currency rate of 3,25 lei/euro, with payment after 30 days, in July. In order to protect itself against the risk of euro appreciating against the national currency, the Romanian importer opens a long hedging for future contracts in euro at the strike price of 3, 35 lei/euro, buying 100 contracts x 500 euro/contract. At the maturity of the external debt, in July N, the spot price is 3,45 lei/euro, and the futures rate (August) is 3,5 lei/euro.

CRISTINA SILVIA NISTOR, CRINA IOANA FILIP, ADELA DEACONU
114
These operations are accounted for as follows (table2):
Table 2.
The accounting circuit specific to import without / with measures for covering foreign currency risk – long hedging
Without measures for covering foreign currency risk (without futures contracts)
With measures for covering foreign currency risk (with purchase hedging)
- June N, accounting the imported raw materials (50.000 x 3,25):
Raw materials
= Suppliers 162.500
- June N, accounting the imported raw materials (50.000 x 3,25):
Raw materials
= Suppliers 162.500
- July N, paying the debt towards the foreign supplier (50.000 x 3,45):
% = Cash at bank in foreign currencies
172.500
Suppliers 162.500 Foreign exchange losses
10.000
- June N, setting up the deposit of initial margin, at the broker firm, 10% of the futures contract’s value (100 x 500 x 3,35 x 10%):
Sundry debtors / analytic-broker
= Cash at bank in lei
16.750
- July N, paying the debt towards the foreign supplier (50.000 x 3,45):
% = Cash at bank in foreign currencies
172.500
Suppliers 162.500 Foreign
exchange losses 10.000
- July N, accounting the operations generated
by market quotation of futures contracts: June futures rate: 3,35 lei/euro x 500 euro July futures rate: 3,5 lei/euro x 500 euro Gain from futures contract: 75 lei Financial income: 75 lei/contract x 100 contracts
Other short term investments and related receivables
= Other financial incomes
7.500
- Alimentation of the deposit:
Sundry debtors / analytic-broker
= Other short term investments and related receivables
7.500
DERIVATIVE INSTRUMENTS – ALTERNATIVES TO COVER THE FOREIGN EXCHANGE RATE …
115
- August, payment to the broker out of the deposit account of the owed commission for the futures transaction5 (for instance, 0,5%): 100 x 500 x 3,35 x 0,5%:= 1.730 lei
Commissions and fees
= Sundry debtors / analytic-broker
838
- The broker transfers the balance account of
the deposit in the current account of the exporter (supplier):
Cash at bank in lei
= Sundry debtors / analytic-broker
23.412
INTERPRETATION
When the importer takes measures to cover the foreign currency risk, by purchasing futures contracts, he registers a net financial loss of 3.338 lei (financial incomes of 7.500 lei, financial losses of 10.000 lei and commissions of 838 lei). But when the importer does not cover the foreign currency risk through futures contracts, the financial loss is 10.000 lei (foreign exchange losses). We can thus conclude that through futures contracts the importer gains 6.662 lei (10.000 – 3.338).
Given this, we may state that the first hypothesis H1, the use of derivative instruments - futures contracts, as the result of the present example shows, futures contracts, represents a way to cover foreign exchange risk at maturity in the case of import operations, has proven to be valid.
Case study: Short hedging
An economic entity exports commodities in September N. Their value of 150.000 euros will be received in October N. In September N at the moment of the transaction the spot price is 3,8235 lei/euro. In order to cover the risk of euro depreciation, the exporter sales 150 futures contracts, each of them covering an amount of 1.000 euros at the futures rate (November) of 3,8450 lei/euro. At the external receivables’ maturity generated through export, in October, the spot price is 3,6738 and futures November 3,65 lei/euro.
The accounting interpretation of these operations is shown in table 3:
5 The commissions levied by the BMFMS Sibiu are established in a fix amount per contract, between
1,2 and 1,7 lei/contract

CRISTINA SILVIA NISTOR, CRINA IOANA FILIP, ADELA DEACONU
116
Table 3.
The accounting circuit specific to export without / with measures to cover the foreign currency risk - short hedging
Without measures for covering foreign currency risk (without futures contracts)
With measures for covering foreign currency risk (with selling hedging )
- September N, accounting the commodities export (150.000 x 3,8235):
Customers = Sales of commodities
573.525
- September N, accounting the commodities export (150.000 x 3,8235):
Customers = Sales of commodities
573.525
- October N, cashing in the external receivable (150.000 x 3,6738):
% = Customers 573.525 Cash at bank in foreign currencies
551.070
Foreign exchange losses
22.455
- September N, setting up the deposit of initial margin, at the broker firm, 10% of the futures contract’s value (150.000 x 3,8450 x 10%):
Sundry debtors / analytic-broker
= Cash at bank in lei
57.675
- October N, cashing in the external receivable (150.000 x 3,6738):
% = Customers 573.525 Cash at bank in foreign currencies
551.070
Foreign exchange losses
22.455
- October N, accounting the operations
generated by market quotation of futures contracts: September futures rate: 3,8450 lei/euro x 1.000 euros October futures rate: 3,6500 lei/euro x 1.000 euros Gain from futures contract: 195 lei Financial income: 195 lei/contract x 150 contracts
Other short term investments and related receivables
= Other financial incomes
29.250
- Alimentation of the deposit:
Sundry debtors / analytic-broker
= Other short term investments and related receivables
29.250
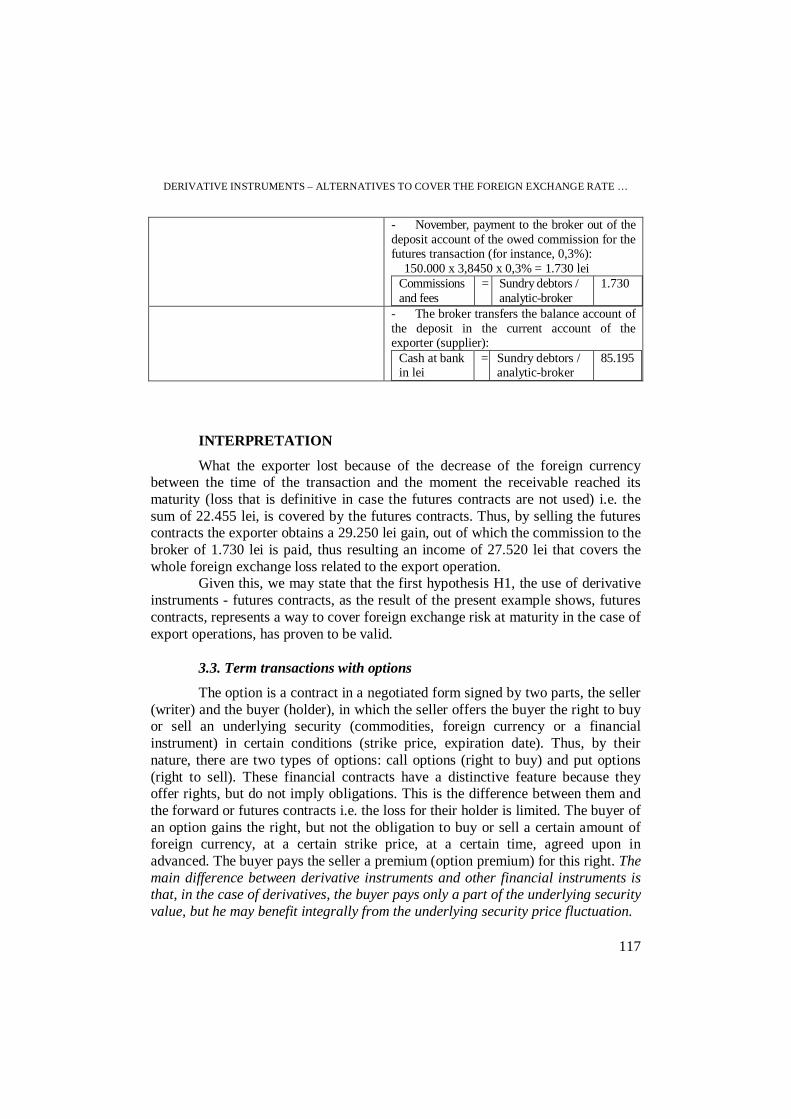
DERIVATIVE INSTRUMENTS – ALTERNATIVES TO COVER THE FOREIGN EXCHANGE RATE …
117
- November, payment to the broker out of the deposit account of the owed commission for the futures transaction (for instance, 0,3%): 150.000 x 3,8450 x 0,3% = 1.730 lei
Commissions and fees
= Sundry debtors / analytic-broker
1.730
- The broker transfers the balance account of
the deposit in the current account of the exporter (supplier):
Cash at bank in lei
= Sundry debtors / analytic-broker
85.195
INTERPRETATION
What the exporter lost because of the decrease of the foreign currency between the time of the transaction and the moment the receivable reached its maturity (loss that is definitive in case the futures contracts are not used) i.e. the sum of 22.455 lei, is covered by the futures contracts. Thus, by selling the futures contracts the exporter obtains a 29.250 lei gain, out of which the commission to the broker of 1.730 lei is paid, thus resulting an income of 27.520 lei that covers the whole foreign exchange loss related to the export operation.
Given this, we may state that the first hypothesis H1, the use of derivative instruments - futures contracts, as the result of the present example shows, futures contracts, represents a way to cover foreign exchange risk at maturity in the case of export operations, has proven to be valid.
3.3. Term transactions with options
The option is a contract in a negotiated form signed by two parts, the seller (writer) and the buyer (holder), in which the seller offers the buyer the right to buy or sell an underlying security (commodities, foreign currency or a financial instrument) in certain conditions (strike price, expiration date). Thus, by their nature, there are two types of options: call options (right to buy) and put options (right to sell). These financial contracts have a distinctive feature because they offer rights, but do not imply obligations. This is the difference between them and the forward or futures contracts i.e. the loss for their holder is limited. The buyer of an option gains the right, but not the obligation to buy or sell a certain amount of foreign currency, at a certain strike price, at a certain time, agreed upon in advanced. The buyer pays the seller a premium (option premium) for this right. The main difference between derivative instruments and other financial instruments is that, in the case of derivatives, the buyer pays only a part of the underlying security value, but he may benefit integrally from the underlying security price fluctuation.

CRISTINA SILVIA NISTOR, CRINA IOANA FILIP, ADELA DEACONU
118
Call options. A call option is a contract that offers to the holder the right, but not the obligation, to buy a certain amount of foreign currency, at a certain strike price, at a certain time. The lack of compulsoriness implies limited liability for the buyer. He may fall out of the contract if the price evolution at maturity does not suit him. Keep in mind that, although until the option is called the underlying security price (foreign currency) increases, the buyer will win, by paying less for that asset, and the gain increases as the asset price goes more and more over the strike price. If the foreign currency rate decreases under the strike price, the buyer losses, but this loss is limited to the amount paid as a premium for backing down the right to call the option. The situation is vice versa for the seller of the call option.
CASE STUDY: Call options
An economic entity purchases in 1.03.N, imported commodities on commercial loan (CIF condition for delivery) in the amount of 50.000 $, at the exchange rate of 2,7 lei/$, payment after 3 months i.e. 31.05.N. The importer predicts an increase of the foreign currency and starts an operation to cover the risk regarding the debt to the foreign supplier. In this idea he buys a call option of 50.000$ (underlying security), at the strike price of 2,8 lei/$. The option premium paid is 6.000 lei [50.000$ x (2,8 – 2,7)lei/ $ + 1.000 lei additional value]. At the expiration date of the option - 31.05.N, the spot price is 3 lei/$.
The operations are accounted in two ways: one by buying the call option, and one by not using any measures to cover the foreign currency risk, as shown in table 4.
Table 4.
The accounting circuit specific to import without / with measures to cover the foreign currency risk – call options
Without measures to cover the foreign currency risk (without call options)
With measures to cover the foreign currency risk (purchase of call options)
- 1.03.N, accounting the imported commodities (50.000 x 2,7): Commodities = Suppliers 135.000
- 1.03.N, accounting the imported commodities (50.000 x 2,7):
Commodities = Suppliers 135.000 - 31.05.N, payment of debt to the foreign supplier (50.000 x 3): % = Cash at bank
in foreign currencies
150.000
Suppliers 135.000 Foreign exchange losses
15.000
- payment of the premium option (accounting the financial instrument):
Other short term investments and related receivables
= Cash at bank in lei
6.000

DERIVATIVE INSTRUMENTS – ALTERNATIVES TO COVER THE FOREIGN EXCHANGE RATE …
119
- 31.05.N, calling the option by purchasing 50.000 $ at the strike price of 2,8 lei/$, even if the spot price (for that day) is 3 lei/$: Cash at bank in foreign currencies
= % 150.000
Cash at bank in lei
140.000
Foreign exchange gains
10.000
- writing off the financial instrument by
performing the call option in $: Other financial expenses
= Other short term investments and related receivables
6.000
INTERPRETATION
In this case, the call option brought the importer a 4.000 lei gain, because he paid only 146.000 lei (6.000 lei option premium + 140.000 lei value in lei of the purchased currency at the strike price) for writing off the external debt, instead of 150.000 lei (value in lei of 50.000 $ at the exchange rate of the day ). In case the importer had not called the option he would have had a 15.000 lei loss, representing the exchange rate difference for the foreign currency at the time of payment to the foreign supplier. On the other hand, the call option’s seller registered a loss of 4.000 lei (10.000 lei representing the negative difference of exchange rate minus 6.000 lei cashed premium). In case the call option’s buyer had not called the right to buy, he would have lost the premium option of 6.000 lei, and the call option’s seller would have gained this amount.
The call option’s seller (the seller of the underlying security i.e. the foreign currency), will account the operation as follows:
� accounting the financial instrument (the call option contract) after the option premium has been paid by the holder: Other short term investments and related receivables = Other financial incomes 6.000
� selling to the call option’s holder the foreign currency at the strike price of 2,8 lei/$, when the spot price (in that day) is 3 lei/$: % = Cash at bank in foreign currencies 150.000 Cash at bank in lei 140.000 Foreign exchange losses 10.000
� writing off the financial instrument through cashing in the option premium (through the hand of the broker): Cash at bank in lei = Other short term investments and related receivables 6.000

CRISTINA SILVIA NISTOR, CRINA IOANA FILIP, ADELA DEACONU
120
Given this, we may state that the second hypothesis H2 i.e. the usage of derivative instruments – in this example options, represents a way to cover foreign currency risk at maturity in the case of import operations, has proven to be valid.
Put options. The selling option (put) gives the holder the right to sell the underlying security (the foreign currency) to the writer of the option at the strike price agreed upon in the contract, after the option premium is paid so that the transaction may be realized. If until the expiration date the exchange rate decreases, the put holder will win, and if the exchange rate increases over the strike price, the put holder will lose, but he will lose only the amount paid as an option premium (because he will not exercise the right offered by the option). The situation is vice versa for the writer of the put option.
CASE STUDY: Put options
An economic entity sells commodities to a foreign customer, in 1.09.N, at the external value of 30.000 euros, spot price 3,5 lei/euro, cashing in after 3 moths i.e. 31.11.N. The exporter predicts a decrease of the exchange rate, and starts an operation to cover the risk for the foreign receivable. In this idea, he buys a put option for 30.000 euros (underlying security) at the strike price of 3,4 lei/euro. He pays an option premium of 4.000 lei [30.000 euros x (3,5 – 3,4)lei/euro + 1.000 lei additional value]. At the option expiration date i.e. 31.11.N the spot price is 3,15 lei/euro.
The exporter accounts these operations, depending on the chosen alternative, as follows (table 5):
Table 5.
The accounting circuit specific to export without / with measures to cover the foreign currency risk – put options
Without measures to cover the foreign currency risk (without put options)
With measures to cover the foreign currency risk (purchase of put options )
- 1.09.N, accounting the commodities export (30.000 x 3,5): Customers = Sales of
commodities 105.000
- 1.09.N, accounting the commodities export (30.000 x 3,5): Customers = Sales of
commodities 105.000
- 31.11.N, cashing in the receivable from the foreign customer (30.000 x 3,15): % = Customers 105.000 Cash at bank in foreign currencies
94.500
Foreign exchange losses
10.500
- payment of the option premium (accounting the financial instrument): Other short term invest-ments and related receivables
= Cash at bank in lei
4.000
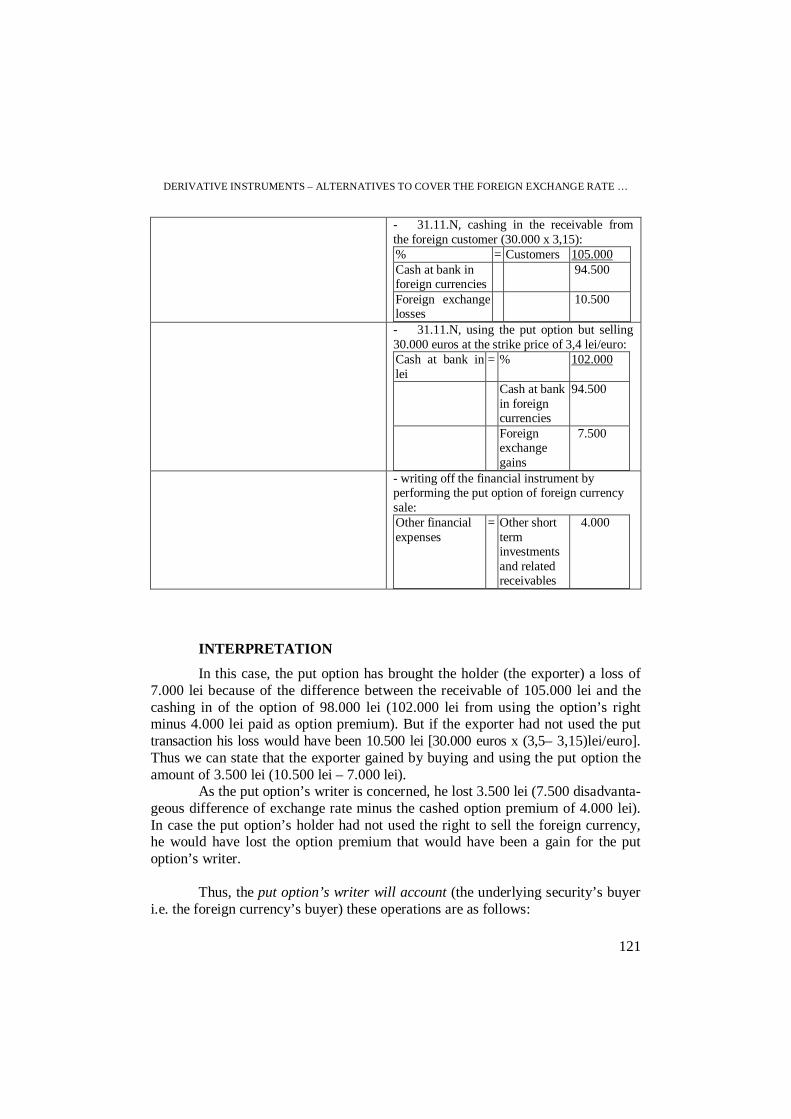
DERIVATIVE INSTRUMENTS – ALTERNATIVES TO COVER THE FOREIGN EXCHANGE RATE …
121
- 31.11.N, cashing in the receivable from the foreign customer (30.000 x 3,15): % = Customers 105.000 Cash at bank in foreign currencies
94.500
Foreign exchange losses
10.500
- 31.11.N, using the put option but selling
30.000 euros at the strike price of 3,4 lei/euro: Cash at bank in lei
= % 102.000
Cash at bank in foreign currencies
94.500
Foreign exchange gains
7.500
- writing off the financial instrument by
performing the put option of foreign currency sale: Other financial expenses
= Other short term investments and related receivables
4.000
INTERPRETATION
In this case, the put option has brought the holder (the exporter) a loss of 7.000 lei because of the difference between the receivable of 105.000 lei and the cashing in of the option of 98.000 lei (102.000 lei from using the option’s right minus 4.000 lei paid as option premium). But if the exporter had not used the put transaction his loss would have been 10.500 lei [30.000 euros x (3,5– 3,15)lei/euro]. Thus we can state that the exporter gained by buying and using the put option the amount of 3.500 lei (10.500 lei – 7.000 lei).
As the put option’s writer is concerned, he lost 3.500 lei (7.500 disadvanta-geous difference of exchange rate minus the cashed option premium of 4.000 lei). In case the put option’s holder had not used the right to sell the foreign currency, he would have lost the option premium that would have been a gain for the put option’s writer.
Thus, the put option’s writer will account (the underlying security’s buyer
i.e. the foreign currency’s buyer) these operations are as follows:

CRISTINA SILVIA NISTOR, CRINA IOANA FILIP, ADELA DEACONU
122
� accounting the financial instrument (the put option contract) after the buyer paid the option premium:
Other short term investments and related receivables
= Other financial incomes 4.000
� selling 102.000 lei to the put option’s buyer (the equivalent of 30.000 euros at the strike price of 3,4 lei/euro) in exchange for 30.000 euro (the underlying security) at the spot price of 3,15 lei/euro:
% = Cash at bank in lei 102.000 Cash at bank in foreign currencies
94.500
Foreign exchange losses 7.500 � writing off the financial instrument through cashing in the option
premium (through the hand of the broker):
Cash at bank in lei = Other short term investments and related receivables
4.000
Given this, we may state that the second hypothesis H2 i.e. the usage of
derivative instruments – in this example options, represents a way to cover foreign currency risk at maturity in the case of export operations, has proven to be valid.
4. CONCLUSIONS
We must mention the fact that foreign currency options are used during the periods in which there are high and volatile exchange rates. In this case, the customers may choose the price, the period and the appropriateness of using the option contract. This offers them the possibility to choose and thus, flexibility.
Consequently, the foreign exchange risk may be eliminated or at least diminished through the usage of derivative financial instruments. In Romania derivative financial instruments were first used in august 1997, within Sibiu Monetary-Financial and Commodities Exchange (BMFMS), exactly with the purpose to minimize the foreign currency risk. For an efficient risk management, futures contracts and options for futures contracts were used. Thus, BMFMS became the first market for futures and options in Romania. In June 2000, BMFMS introduced the electronic system for futures and options contracts transactions. Likewise, from September 2007 derivative financial instruments are being transacted on the Bucharest Stock Exchange (BVB). In conclusion, we may state that the true challenge of using the derivative financial instruments is just beginning to settle into shape in our country.
We consider that our paper has reached its established objectives and has demonstrated the fact that the usage of derivative instruments is a viable alternative to eliminate or diminish the risk generated by the foreign currency fluctuation in the case of import-export operations. Knowing these instruments, the way in which they work and using them effectively represents an advantage for any participant in the international commercial trade market.

DERIVATIVE INSTRUMENTS – ALTERNATIVES TO COVER THE FOREIGN EXCHANGE RATE …
123
Table 6.
Research results
H1: The usage of derivative instruments, in this case term contracts - futures, represents a way to cover foreign currency risk at maturity in the case of import-export operations
VALID
H2 : The usage of derivative instruments, in this case term contracts - options, represents a way to cover foreign currency risk at maturity in the case of import-export operations
VALID
Nevertheless, these actions launched by the economic agents are not
without risk. From an accounting point of view (written register), we may thus identify impairments for the depreciation of derivative financial instruments, and from a practical point of view there is an identified need for some solutions that a future research aims to detect and analyze.
REFERENCES
1. Bartov E., Bodnar G. M., Firm Valuation, Earnings Expectations and the Exchange Rate Exposure Effect, Journal of Finance, 49, 1994
2. Bătrâncea, I. (coordonator), Analiză financiară pe bază de bilanŃ, Presa Universitară Clujeană, Cluj-Napoca, 2001
3. Belke, A. and Gros, D., Estimating the Cost and Benefits of EMU: The Impact of External Shocks on Labour Markets, CEPS Working Document 11, 1997.
4. Bodnar, G. M. and Marston, R. C., Exchange rate exposure: A simple model, International Finance Review, Volume 3, 2002, 107-115
5. Brandt, M. W., Cochrane J., and Santa-Clara P., International Risk- Sharing is Better Than You Think, or Exchange Rates are Too Smooth, Journal of Monetary Economics, 53, 2006, 671–698.
6. Filip C., Nistor C., Recunoaşterea instrumentelor financiare prin prisma Standardelor InternaŃionale de Contabilitate, în revista „Gestiunea si Contabilitatea Firmei”, nr. 4/2003
7. Filip C., ImplicaŃiile contabile ale operaŃiunilor de import-export prin prisma Directivelor Europene, Congresul al XVI-lea al profesiei contabile „Profesia contabilă şi globalizarea”, Bucureşti, 2006
8. Filip C., MuŃiu A., Prezentarea operaŃiunilor de import-export în situaŃiile financiare, în revista „Gestiunea si Contabilitatea Firmei”, nr. 5/2007

CRISTINA SILVIA NISTOR, CRINA IOANA FILIP, ADELA DEACONU
124
9. Halpem L., Wyplosz C., Equilibrium Real Exchange Rates in Transition Economics, in IMF Staff Papers, no. 4/1997
10. Kolb, R., Futures, Options and Swaps, Publisher Blackwell, 2007, p.235-267
11. Manolescu D., DiferenŃele de curs valutar-particularităŃi contabile şi fiscale, în revista „Tribuna economică”, nr. 47/2005
12. Marca M. L., Real Exchange Rate, Competitiviness and Policy Implications: a formal analysis of alternative macro models, in CEPA 24/05/2004
13. Miclaus, P.G., Piata instrumentelor financiare derivate, Editura Economica, 2008
14. Nistor C., Filip C., Contabilitatea – sursa informaŃională, “ ConferinŃa Contabilitatea Mileniului III”, Editura Sincron, Cluj-Napoca, 2003
15. Nwaobi, Godwin C., The Economics of Financial Derivative Instruments, http://ideas.repec.org/p/pra/mprapa/9463.html
16. Ivan Ungureanu, C., Contabilitate nationala, Casa de Editura IRECSON, Bucuresti, 2003
17. Oprean I., Analiza şi proiectarea sistemelor informaŃionale în economie, Ed. Polirom, Iaşi, 1999, pag 87-98
18. Pantea I.P., Managementul contabilitǎŃii româneşti, Ed. Intelcredo, Deva, 1999, pag. 7-20
19. Popescu C., Raboaca Gh., Ciucur D., Iovan D., Metodologia cercetării ştiinŃifice economice, Editura ASE, Bucureşti, 2006
20. Rosca I.,Proiectarea sistemelor informatice financiar-contabile, Ed. Didacticǎ şi Pedagogicǎ, Bucureşti, 1993, pag 132-145
21. Söhnke M. Bartram and Karolyi, G.A., The impact of the introduction of the Euro on foreign exchange rate risk exposures, Journal of Empirical Finance, Volume 13, Issues 4-5, 2006, 519-549
22. Taleb, N., Dynamic Hedging, Publisher Wiley, 1996, p.157-172
23. Vi şan D., Buruda C., Burtescu C., LuŃă D., Contabilitatea operaŃiilor de acoperire a riscurilor în comerŃul exterior, în “Gestiunea şi contabilitatea firmei”, nr. 3/2006, pag 20-31
24. Vlada A., Contractele cu optiuni sunt cautate in perioadele de scaderi , available on line at http://www.financiarul.com/articol_15114/contractele-cu-optiuni-sunt-cautate-in-perioadele-de-scaderi.html
25. Warson, G, Searching for photon localization in the time domain, G.H. Watson, P.A. Fleury, and S.L. McCall, Phys. Rev. Lett. 58, 945, 1987
26. Watcher, J., A., Consumption-Based Model of the Term Structure of Interest Rates, Journal of Financial Economics, 2006, 365–399.
27. *** O analiză consacrată operaŃiunilor de import-export, in „Economistul”, march 2004, p.4
28. *** Wall Street Journal Europe 5/5/06, p. 20

STUDIA UNIVERSITATIS BABEŞ-BOLYAI, NEGOTIA, LIII, 2, 2008
THE IMPLEMENTATION OF PROFIT CENTRES INSIDE AN ECONOMIC ENTITY
ADRIAN GROSANU1, PAULA RAMONA RACHISAN2 ABSTRACT. The first part of this paper presents, from a conceptual point of view, the responsibility centres and we used a theoretical and methodological approach that allows us to understand the role generally played by the responsibility centres, profit centres in particular, concerning the optimization of economic efficiency of a business.
According to the existing particularities of economic entities of the cosmetic industry, we delimited some responsibility centres and identified some of the relations between them. This way we determined two categories of expenses centres: � The centre of general expenses of the entity which include the expenses of
the administrative function of the entity (including the financial accounting departments, human resources, quality control, environmental protection, research department and so on);
� The centre of expenses with the auxiliary activity of the entity (central heating). At the same time, we determined two categories of profit centres:
� Level I profit centres – for the productive activity of the entity; � Level II profit centres – for the sales activity of the products obtained in the
level I profit centres. We also underlined the fact that there are some transfers between these
responsibility centres which take place trough the prices of inner cession of the transfer prices. Keywords: economic efficiency, economic entity, efficiency, profit centres, budget.
I. INTRODUCTION
The aim of every commercial entity with limited resources that acts in a competition economy is to conduct business as efficient as possible. In the economic literature several management methods are presented, among them: the method of management by objectives, the method of management through budgets, the method of exceptions management, the method of project management and product management. Each of these methods has as final objective the transformation of information concerning reality into decisions and also into rational and efficient actions. (Borza & al., 2005).
1 Teaching Assistant, Doctoral Student, Babeş-Bolyai University of Cluj-Napoca, Faculty of Economics
and Business Administration, [email protected] 2 Teaching Assistant, PhD, Babeş-Bolyai University of Cluj-Napoca, Faculty of Business,
ADRIAN GROSANU, PAULA RAMONA RACHISAN
126
Recently, organizing responsibility centres has become a general practice of the medium sized and large economic entities, and this situation called for the modification of the accounting management in response of new demands. The introduction of efficient management by organizing the activity in responsibility centres represents a method of management that has as main objective the optimum use of resources inside the organization by motivation and stimulation of the creativity of all employees who participate to the fulfilling of the determined tasks and objectives (Rusu & Voicu, 2001).
As a result, a new branch of managerial accounting appeared, the Accounting of Responsibility Centres (Responsibility Accounting) that deals with the way in which the benefit reports of the responsibility centres are created and generated, being specialized in collecting, using and reporting all the information needed to ensure the performance of each responsibility centre.
II. RESEARCH METHODOLOGY
The domain of scientific research acknowledges two types of research: the quantitative and the qualitative research. Qualitative research represents “any type of research that generates establishments which are not obtained using statistical or other quantitative methods” (Strauss and Corbin, 1990). Qualitative approach is used when the aim is to observe a phenomenon and to interpret reality.
A typology of researches (Miller, 1977) distinguishes the following approaches: - basic research that investigates the level of knowledge and brings its
contribution if it discovers a new problem or if develops a new theoretical approach in order to solve the problems earlier known. This kind of research is very useful for researchers and not so useful for practitioners;
- applied research, that contributes to the consolidation of knowledge and has practical implications. This type of research is based on the previous basic research and tests it;
- usable research, that implies dissemination of some former results and, in essence, is not applied in practice.
With these as a starting point, our research can be defined as a qualitative research, of the applied type, with elements of basic research. Because we have started with the study of specialized literature in order to integrate the problem we have investigated before in other papers and former researches, a starting point to achieve our proposed objective, which is the analysis of the role and of the means of implementation of profit centres in an entity, especially with applicability in the case of entities in the cosmetic industry.
III. PROFIT CENTRES IN AN ECONOMIC ENTITY
Several categories of responsibility centres can be distinguished within an economic entity: the centres of costs, centres of expenses, centres of profits, centres

THE IMPLEMENTATION OF PROFIT CENTRES INSIDE AN ECONOMIC ENTITY
127
of incomes or centres of investments. According to the type of entity, the technical and productive characteristics, the informational needs of an entity’s management, we can identify a certain combination between the various categories of the implemented responsibility centres.
There are three systems of development and implementation of responsibility centres:
� The system of cost centres – if they are delimited, mainly cost centres in the entity; � The system of natural profit centres – if the entity is divided in natural profit centres; � The system of artificial profit centres – if the cost centres are transformed in profit centres by inner transfer prices.
No matter what the chosen system is, in order for it to function efficiently,
some essential conditions must be fulfilled for the successful implementation of such systems (Leca, 2008), additional to the organizing of the accounting of responsibility centres (informational – accounting infrastructure in order to achieve the control/evaluation of performances) and the management by exceptions (for the reporting of deviations from prescriptions and rules):
1) assuring the confidence in the system – managers must be convinced of the fact that their performances are described accordingly and correctly evaluated;
2) permanent revision of control systems for internal control – in order to ensure the actualization and correctness of accounting information. This assertion is based on two motivations – on one hand, any system is wearing away, and on the other hand there is a possibility for some persons inside the entity to try to manipulate the measured performances by forging accounting registers (undeclared stocks or by registering the costs in other accounts);
3) periodical revising of the organizational structure and of the decision making process – giving up some products and product lines and adding new ones; managers from all levels are changed as they become obsolete; production activities are transferred between entities or changed because technological innovations – all of these are reasons for the reporting entities (responsibility centres) to change their structure and form in order to remain efficient in time.
The deimitation and implementation of responsibility centres at the level of an economic entity are fundamental stages in obtaining some real and exact information from the accounting financial administration. The criteria used for the delimitation of profit centres can be of two types (Nicolescu & Verboncu, 1998):
� Procedural, according to which the most important components of the entity (functions and activities) can be elaborated as profit centres;
� Structural-organizational, according to which each functional and operational department or groups of these departments become and function as profit centres.

ADRIAN GROSANU, PAULA RAMONA RACHISAN
128
If the organization of the entity in responsibility centres is desired, with emphasis on the profit centres, the entire informational system of the entity must be redesigned in such a way to answer the demands of the new structure and to provide quality information regarding the costs level, performances, deviation from budgets, in order to fundament the economic decisions. But before redesigning the informational system, under the condition of the organization of the economic entity in responsibility centres, an important stage is represented by the following steps (Leca, 2008):
� Step 1: The entity is divided into responsibility centres, according to the following criteria and rules:
- Geographical area: country, district, county, city – results investment or profit centres, if the business unit has a juridical personality, or cost centres if the business unit does not have a juridical personality;
- Organizational or functional criteria – production departments, marketing etc. – it is recommended that only costs centres should result;
In our opinion, exist profit centres can exist even if the business unit does not have a juridical personality because fake or artificial profit centres are implemented, and their benefits are not always represented by incomes generated by the sales of goods or services to third parties, but by benefits generated by the reimbursements from other profit centres of the entity.
� Step 2: Managers who are to be held responsible for the results of the responsibility centres are identified. In most cases they are the heads of the departments or units of the organizational subdivisions that have become individual responsibility centres. If the activities of a specific department are delegated to another one, the persons who shall lead that centre must be selected.
� Step 3: The objectives, standards, targets and budgets of the entire entity and for each responsibility centre are described. The objectives of the business are established at the central level and in detail for each responsibility centre, together with the centre managers.
The delimitation and establishment of profit centres must be done according to logical and rational regulations (Pop & Muresan, 1998):
a) any time when it is possible, a benefit centre must be the same with a technical – productive or/and functional subdivision of the entity: departments, workshops, branches, subsidiaries, functional offices, etc.;
b) any benefit centre defined, delimitated and established, must allow the financial control by a budget of incomes and expenses;
c) the frontiers of any benefit centre must be determined in such a way to allow the regrouping of expenses and incomes in various types of costs and prices;
d) there must be technical or working activity homogeneity. This does not mean that the centre manufactures (or trades) only one product but it contains a well located installation or a well defined activity that it executes. A benefit centre is identified by an installation or an activity and not by a product. In some cases, inside the same centre more installations can be regrouped if they have homogenous characteristics;

THE IMPLEMENTATION OF PROFIT CENTRES INSIDE AN ECONOMIC ENTITY
129
e) a benefit centre must be placed under the authority of only one person, who bears the whole responsibility, and who is named without ambiguity. This condition requires a precise definition of the responsibilities of each person, which is not always an easy task;
f) it is necessary for the activity of each centre to be accountable, the expenses it does, the products it generates, its performances.
The organization of the entity in responsibility centres implies the implementation of the management system by exceptions and by the accounting of the responsibility centres (CCR) or of the system for the determination of cost based activities (ABC).
The organization chart of the entity structured in profit centres most often are under the form of a divisional organization. This is characterized by the fact that the first levels in the hierarchy are not shaped after the same activities (as in the case of a classical organization based on the functional criterion) but by their field of activity. These are the profit centres, and the cost centres. The advantages of the divisional form of organization is the capacity to adapt to new products, new clients or new markets, sharing the burden of the responsibility of top leaders of an entity with the chiefs of the departments, a good perspective over the market by the existence of profit centres oriented on products, as well as by the good development and improvement opportunities for personnel, from experimented generalists, such as divisional chiefs to the position of leaders in the leading committee of the entire entity. The organization of the department in the divisions as profit centres has powerful motivations for the personnel.
IV. THE IMPLEMENTATION OF PROFIT CENTRES WITHIN
ECONOMIC ENTITIES FROM THE COSMETICS INDUSTRY
In an economic entity, having cosmetics as the main field of activity, organized in responsibility centres, the profit centres have the main role and the organizational chart must be modified in such a way to result, next to profit centres, also expense centres for the functional departments of the entity, including general expenses of the financial administration or other indirect expenses.
The expense centres also include the financial–accounting department, the human resources department, the quality control and environmental protection department, the research department or auxiliary services activities of the entity.
Concerning profit centres, it is recommended to structure them into two categories:
� Level I profit centres – that include the responsibility centres where the cosmetic products are manufactured, and are transferred in order to be sold to the clients of the sales department;
ADRIAN GROSANU, PAULA RAMONA RACHISAN
130
� Level II profit centres – that include the responsibility centres of the sales department, the products transferred from level I centres being sold to the clients of the entity.
The relation between level I and level II profit centres is realized by the transfer prices. The expense centres transfer their expenses to the level I and level II profit centres, according to some repartition criteria.
In an economic entity, having as field of activity the cosmetic industry, organized in responsibility centres without juridical personality, taking into account the fact that the entire production of the level I profit centres is transferred to be sold to level II profit centres, we consider it is wise to settle some transfer prices represented by the forecasted market price, minus a certain percentage, that is settled by negotiation, under the direct supervision of the general management of the entity. Concerning the services provided by the expense centre with auxiliary production to level I profit centres, the complete standard cost represents a corresponding variable under the given conditions.
V. THE BUDGETS OF THE ECONOMIC ENTITIES ORGANIZED
IN PROFIT CENTRES
There is no unitary model concerning the procedures of budget elaboration, but each economic entity starts the budgetary process with the forecasting of the determined budgets and especially with the sales budget. Also, if the entity is organized in profit centres, the budgets must be forecasted at the level of each benefit centre and the coordinates by which the budgets at the level of a benefit centre relate to the budgets of another benefit centre must be determined. In this case, the transfer prices or the inner cession prices have a very important role because they can stimulate or not the growth in economic efficiency at the level of each responsibility centre.
There are numerous difficulties to be overcome while creating budgets, generally in relation to the problems of estimating future values or because of human nature related factors (some employees may oppose wrongly established budgets, thinking that they have a dishonest character, that the management tends to overestimate costs as a safety measure, that the competition between profit centres or expense centres may cause a dysfunctional behavior).
In our contemporary economy, the market decides what, when and how much is produced. As a consequence, the budgetary process must start from the elaboration of the sales budget, and later on it determines the production budget in order to support the forecasted sales. From the production budget there derives the budget for supplies, human resources, and other budgets in order to achieve under normal conditions the planned activity, the general objectives of the economic entity. The components of an operational budget influence the financial budget. The operational budgets are functional if they generate a financial budget that can be sustained and an efficient use of the limited resources.

THE IMPLEMENTATION OF PROFIT CENTRES INSIDE AN ECONOMIC ENTITY
131
An entity in the cosmetics industry organized in profit centres may have the following structure, between profit centres, on one hand, and the expense centres, on the other hand, existing numerous financial–material and informational relationships, as drawn in the figure below:
Expenses centres Expense centre no. 1 ... Expense centre no. k
Level I profit centres Level II profit centres Benefit centre no. CPI-1 Benefit centre no. CPII-1 Benefit centre no. CPI-2 Benefit centre no. CPII-2 ... ... Benefit centre no. CPI-n
Benefit centre no. CPII-m
Fig. 1. Responsibility centres of an economic entity and the relations among them
If the economic entity is organized in profit centres, not all the components
of the general budget, as it was presented in the above figure appear inside each responsibility centre. In Level I profit centres, the exploitation budget is made only of a production budget, of a supply/raw materials and materials consumption budget, of a human resources budget, (for production) and of a general expense budget for production. In the case of Level II profit centres that emerge in the area of sales we can find a sale budget and supply expenses budget. At the level of expense budgets, a general and administrative expenses budget is created, as well as all the components of the financial budget, and a sum of all budgets at the level of other responsibility centres, these generating a general budget for the entire economic entity. There are two categories of expense centres:
� expense budgets regarding the auxiliary production (for example, the heating system), in whose case the costs are transferred mainly to Level I profit centres; and a separate budget is created.
� general and administrative expenses centres. Budgets represent the forecasting instrument under the conditions of
economic efficiency of the way of allocation and use of resources of an economic entity for a future period of time. As a consequence, budgets are instruments of forecast, analysis and control of the activities of an economic entity during a specific period of time. Through budgets, the budgetary control is done, consisting of the permanent comparison of the results obtained from budgetary forecasts aiming to (Ionaşcu, 2003):

ADRIAN GROSANU, PAULA RAMONA RACHISAN
132
� determine the cause (or causes) of deviations from the budgets; � inform the various hierarchy levels; � take coercive measures; � appreciate the activity of the people responsible for the budgets. Because in this paper we have tried to describe a possible financial–
accounting system concerning the cost calculation on profit centres for economic entities in the industry of cosmetics, the problem of budgets is relevant, as budgets represent a fundamental instrument for the optimization of the manner how resources are used, in order to achieve minimum production costs and to fulfill the organizational objectives. For these reasons, we consider that budgets must answer the need to elaborate a system that improves the economic efficiency of entities in the industry of cosmetic products.
This is why we have considered that a budget is the value and/or expression of forecasts of an entity in what concerns benefits, expenses, costs and other elements of financial and non-financial nature (loans that will be contracted or reimbursed, number of products manufactured or sold), according to the strategic objectives of the entity and the forecasted necessary resources. With budgets, the future policy that will be adopted during a specific period of time, in order to achieve the initial targets and objectives is defined. In order to be efficient, budgets must be created in such a manner that forecasts resemble the effective achievement as much as possible.
The affirmation that an entity has achieved income during a period of time is not sufficient to show its’ efficiency. We must not forget that an economic entity exists and is active because the share owners or associates have put to its disposal some resources, materialized in production factors, and they want for these resources to be used in a productive manner, in order to be remunerated accordingly. This is why, some strategic objectives are established, and plans and budgets are elaborated. Economic performance must be analyzed by referring to the objectives established and transferring them to the elaborated budgets.
In order to achieve a growth in the general economic efficiency of economic entities, lately, the tendency to organize and create some subdivisions inside the entities, under the form of responsibility centres, is more and more obvious. In the case of the economic entities in the industry of cosmetics, taking into account the specifics of their activity, we have considered that it is for their benefit to create expense centres (manly for the administrative function) and level I profit centres (for the productive function) and level II centres (for the commercial function).
Under these conditions, we appreciate that at the level of an economic entity a general budget is established, formed of more operational and financial budgets. The operational budgets are also established at the level of each responsibility centre and the financial budget is only established by taking into consideration the level of the entire economic activity. Also, a budget will be established for each level I or

THE IMPLEMENTATION OF PROFIT CENTRES INSIDE AN ECONOMIC ENTITY
133
level II benefit centre, which comprises the information of the exploitation budgets elaborated at the level of the benefit centre, to which other elements of expenses or transfers are added in such a way to be able to determine the forecasted profitability for each benefit centre. In the end, by comparing the forecasts to the accomplishments, deviations and their causes can be determined. The profitability of each product and the deviations from the budgetary profitability can also be determined.
VI. CONCLUSIONS
The economic environment in Romania demands adequate instruments to support decision-making processes inside economic entities and the present paper, opens other directions of study such as a simulation that captures the way how the system functions and an analysis of the performances of each responsibility from the point of view of the relation between the effective values and the forecasted ones. The final objective of this system would be the improvement of economic performances, the providing of quality information when needed, for the decision-making process at the level of the responsibility centres and the entity as a whole.
At the same time, we consider it is beneficial to extend the qualitative research to a quantitative one, by creating an informational data base, concerning the way how economic entities, in the Romanian industry of cosmetic products in, consider the organizing in profit centres and if they are organized din such a way. We believe that, starting from the direct observations of some case studies, we may commence with interviews and questionnaires from create and analyze a database. This methodological pluralism of a very complex problem would be useful to the management who can only gain by using methodologies from different paradigms informally in order to achieve maximum efficiency.
REFERENCES
1. Borza A. & colab., Management [Management], Editura Risoprint, Cluj-Napoca, 2005
2. Ionaşcu I. (coord.), Control de gestiune [Management Control], Editura Economică, Bucureşti, 2003
3. Leca C., Contabilitatea centrelor de responsabilitate (CCR). Aplicare. [Responsibility Accounting], Revista Financial Director Romania, 17 martie 2008
4. Miller P.V., Strategies for communication research, Beverly Hills: Sage Publications, 1977
5. Nicolescu O. & Verboncu I., Managementul pe baza centrelor de profit. Ghid practic pentru firmele româneşti [Management of profit centres], Editura Tribuna Economică, Bucureşti, 1998

ADRIAN GROSANU, PAULA RAMONA RACHISAN
134
6. Pop A. & Mureşan M.L., Contabilitatea de gestiune a centrelor de responsabilitate [Management Accounting of responsibility centres], Sesiune de comunicări ştiinŃifice, Cluj-Napoca, 1998
7. Rusu C. & Voicu M., Managementul pe baza centrelor de responsabilitate [Management of responsibility centres], Editura Economică, Bucureşti, 2001
8. Strauss A. & Corbin J., Basics of qualitative research: Grounded theory procedures and techniques, London, 1990

STUDIA UNIVERSITATIS BABEŞ-BOLYAI, NEGOTIA, LIII, 2, 2008
METHODS OF PORTFOLIO MANAGEMENT
- A REVIEW OF LITERATURE -
CRISTINA CURUłIU1
ABSTRACT. In recent years, a growing body of literature in portfolio management has devoted a great deal of attention for this subject. The theoretical foundation to portfolio management was offered by Harry Markowitz at the beginning of the 1950s. The limitations of the original Markowitz model have stimulated the occurrence of extended or modified models – two of the best known (and criticized) being the equilibrium models: CAPM (capital asset pricing model) and APT (arbitrage pricing theory). Alternative optimization methods were also developed; among them must be mentioned: the utility function optimization, conditional value-at-risk optimization, multiple benchmark tracking, scenario-based optimization, robust statistical methods and the Bayesian methods. The present paper provides a selective overview of existing models and methods regarding portfolio management and optimization since 1952 (Markowits model) and synthesizes the academic research to date. Keywords: portfolio management, risk, portfolio models, volatility
INTRODUCTION
In finance, a portfolio is considered to be an appropriate mix or collection of investments held by an institution or a private individual. Holding a portfolio is part of an investment and risk-limiting strategy called diversification. By owning several assets, certain types of risk (in particular specific risk) can be reduced.
In building up an investment portfolio a financial institution will typically conduct its own investment analysis, whilst a private individual may make use of the services of a financial advisor or a financial institution which offers portfolio management services.
Portfolio management process involves deciding what assets to include in the portfolio, given the goals of the portfolio owner and changing economic conditions. Selection involves deciding what assets to purchase, how many to purchase, when to purchase them, and what assets to divest. These decisions always involve some sort of performance measurement, most typically expected return on the portfolio, and the risk associated with this return (for example the standard deviation of the return). Typically the expected return from portfolios of different asset bundles is compared.
1 Teaching Assistant, PhD Student, Faculty of Business, Babeş-Bolyai University of Cluj-Napoca,
METHODS OF PORTFOLIO MANAGEMENT. - A REVIEW OF LITERATURE –
136
The unique goals and circumstances of the investor must also be considered. Some investors are more risk averse than others.
The theoretical foundation of portfolio management, as one knows it today, was laid by Harry M. Markowitz by stating a parametric optimization model. The idea of this model is to split the portfolio selection process into two steps where first the set of optimal portfolios is determined and then the investor chooses from this set the portfolio that suits him/ her best. Markowitz’s approach therefore includes (i) measuring the expected return and risk of the available assets (independently of the investor’s believes and preferences), and (ii) making certain assumptions about the investor’s utility functions (independently of the available assets). These two steps are then brought together in a quadratic optimization problem. This model, by now the centre of Modern Portfolio Theory, provoked a revised notion of risk and in due course of what is a fair risk premium.
Modern portfolio theory (MPT) considers how rational investors will use diversification to optimize their portfolios, and how a risky asset should be priced. MPT models an asset's return as a random variable, and models a portfolio as a weighted combination of assets so that the return of a portfolio is the weighted combination of the assets' returns. Moreover, a portfolio's return is a random variable, and consequently has an expected value and a variance. Risk, in this model, is the standard deviation of return.
An investor can reduce portfolio risk simply by holding instruments which are not perfectly correlated. In other words, investors can reduce their exposure to individual asset risk by holding a diversified portfolio of assets. Diversification will allow the same portfolio return but with a reduced risk.
If all the assets of a portfolio have a correlation of 1, a perfect correlation, the portfolio volatility (standard deviation) will be equal to the weighted sum of the individual asset volatilities. Hence the portfolio variance will be equal to the square of the total weighted sum of the individual asset volatilities.
If all the assets have a correlation of 0, a perfect uncorrelation, the portfolio variance is the sum of the individual asset weights squared times the individual asset variance (and volatility is the square root of this sum).
If correlation is less than zero, the assets are inversely correlated, the portfolio variance and hence volatility will be less than if the correlation is 0.
The Capital Asset Pricing Model (CAPM) is used to determine a theoretically appropriate required rate of return of an asset, if that asset is to be added to an already well-diversified portfolio, given that asset's non-diversifiable risk. The model takes into account the asset's sensitivity to non-diversifiable risk (also known as systemic risk or market risk), often represented by the quantity beta (β) in the financial industry, as well as the expected return of the market and the expected return of a theoretical risk-free asset.

CRISTINA CURUłIU
137
The model was introduced by Jack Treynor, William Sharpe, John Lintner and Jan Mossin independently, building on the earlier work of Harry Markowitz on diversification and modern portfolio theory.
Arbitrage pricing theory (APT) is a general theory of asset pricing that has become influential in the pricing of stocks.
APT holds that the expected return of a financial asset can be modeled as a linear function of various macro-economic factors or theoretical market indices, where sensitivity to changes in each factor is represented by a factor-specific beta coefficient. The model-derived rate of return will then be used to price the asset correctly - the asset price should equal the expected end of period price discounted at the rate implied by model. If the price diverges, arbitrage should bring it back into line. The theory was initiated by the economist Stephen Ross in 1976.
As with the CAPM, the factor-specific Betas are found via a linear regression of historical security returns on the factor in question. Unlike the CAPM, the APT, however, does not itself reveal the identity of its priced factors - the number and nature of these factors is likely to change over time and between economies. As a result, this issue is essentially empirical in nature.
MATERIAL AND METHODS
In recent years, a growing body of literature in portfolio management has devoted a great deal of attention for this subject. This paper provides a selective overview of existing models since 1952 (Markowits model) and synthesizes the academic research to date. It is a qualitative research.
DISCUSSIONS
In 1952, Harry M. Markowitz published the article entitled “Portfolio Selection”. In this material, he developed the first mathematical model that specified the volatility reduction that occurs in a portfolio as a result of combining investments with different patterns of return. The amazing thing about his accomplishment is that he developed his thesis over a half century ago, long before the advent of the modern computer. His influence on the world of modern finance and investment management has been so profound that he became known as the father of modern portfolio theory and was awarded the Nobel Prize for Economics in 1990.
Before modern portfolio theory, investment management was a two dimensional process focusing primarily on the volatility and return characteristics of individual securities. Markowitz’s work resulted in the recognition of the importance of the interrelationships among asset classes and securities within portfolios. Modern portfolio theory added a third dimension to portfolio management that evaluates an investment’s diversification effect on a portfolio. Diversification effect refers to the impact that the inclusion of a particular asset class or security will have on the volatility and return characteristics of the overall portfolio.

METHODS OF PORTFOLIO MANAGEMENT. - A REVIEW OF LITERATURE –
138
Modern portfolio theory thus shifted the focus of attention away from individual securities toward a consideration of the portfolio as a whole. The notion of diversification had to be simultaneously reconsidered. Optimal diversification goes beyond the idea of simply using a number of baskets in which to carry your eggs. It also places major emphasis on finding baskets that are distinctly different from one another. This is important because each basket’s unique pattern of returns partially off sets the others, with the effect of smoothing overall portfolio volatility.
An alternative view of risk has been derived from extensive work in portfolio theory and capital market theory by Markowitz, Sharpe, and others. These prior works by Markowitz and Sharpe indicated that investors should use an external market measure of risk. Under a specified set of assumptions, all rational, profit maximizing investors want to hold a completely diversified market portfolio of risky assets, and they borrow or lend to arrive at a risk level that is consistent with their risk preferences.
Markowitz showed that the variance of the rate of return was a meaningful measure of portfolio risk under a reasonable set of assumptions, and he derived the formula for computing the variance of a portfolio. This portfolio variance formula indicated the importance of diversifying your investments to reduce the total risk of a portfolio but also showed how to effectively diversify. The Markowitz model is based on several assumptions regarding investor behavior:
1. Investors consider each investment alternative as being represented by a probability distribution of expected returns over some holding period.
2. Investors maximize one-period expected utility, and their utility curves demonstrate diminishing marginal utility of wealth.
3. Investors estimate the risk of the portfolio on the basis of the variability of expected returns.
4. Investors base decisions solely on expected return and risk, so their utility curves are a function of expected return and the expected variance (or standard deviation) of returns only.
5. For a given risk level, investors prefer higher returns to lower returns. Similarly, for a given level of expected return, investors prefer less risk to more risk.
Under these assumptions, a single asset or portfolio of assets is considered to be efficient if no other asset or portfolio of assets offers higher expected return with the same (or lower) risk, or lower risk with the same (or higher) expected return.
On the American market, the empirical relation existent between a portfolio’s risk and the number of titles that it consists of has been studied for the first time by Evans and Archer (1968). They studied Wagner and Lau (1971) and Solnik (1974) for the main European markets. The companies included in this portfolio had been selected aleatory. The results of those studies show that a number of 15 or 20 companies are enough to make in such a way that the specific risk decreases substantially. Concomitantly it is interesting to observe that the market risk for a portfolio which is very well diversified (more than 50 titles) it’s situated between 20% or 40% from the portfolio’s total risk.

CRISTINA CURUłIU
139
A value market risk consists of, in according to Sharpe’s theory, two parts which are the systematic risk afferent tot the capital market in its ensemble and explained through its dependence from the macro economical factor and the risk specific to each title, which can be eliminated through diversification.
Following the development of portfolio theory by Markowitz, two major theories have been put forth that derive a model for the valuation of risky assets. One of these two models is the capital asset pricing model (CAPM). The background on the CAPM is important at this point in the book because the risk measure implied by this model is a necessary input for our subsequent discussion on the valuation of risky assets. The presentation concerns capital market theory and the capital asset pricing model that was developed almost concurrently by three individuals. Subsequently, an alternative multifactor asset valuation model was proposed, the arbitrage pricing theory (APT).
Several authors have contributed to the Capital Asset Pricing Model (CAPM). Sharpe (1963, 1964) is considered to be the forerunner and received the Nobel Prize in 1990. Treynor (1961) independently developed a model that was quite similar to Sharpe’s. Finally, Mossin (1966), Linter (1965, 1969) and Black (1972) made contributions a few years later.
This model is the first to introduce the notion of risk into the valuation of assets. It evaluates the asset return in relation to the market return and the sensitivity of the security to the market. It is the source of the first risk-adjusted performance measures. Unlike the empirical market line model, the CAPM is based on a set of axioms and concepts that resulted from financial theory.
The capital asset pricing model (CAPM), which is a model that indicates what, should be the expected or required rates of return on risky assets. This transition is important because it helps you to value an asset by providing an appropriate discount rate to use in any valuation model. Alternatively, if you have already estimated the rate of return that you think you will earn on an investment, you can compare this estimated rate of return to the required rate of return implied by the CAPM and determine whether the asset is undervalued, overvalued, or properly valued.
The latter was developed by Sharpe in order to simplify the calculations involved in the Markowitz model and thereby render it more operational. The next step in financial modeling was to study the influence of the behavior of investors, taken as a whole, on asset prices. What resulted was a theory of asset valuation in an equilibrium situation, drawing together risk and return.
It provides a powerful description of the relationship between volatility and expected return in an efficient capital market. As is the case with most models, simplifying assumptions are made to abstract the essence of the relationship being modeled. With the CAPM, several such assumptions are made:
1. All investors are assumed to have the same investment information and to hold identical expectations regarding the future.
2. The market is perfectly competitive. 3. There are no transaction costs for buying and selling securities.

METHODS OF PORTFOLIO MANAGEMENT. - A REVIEW OF LITERATURE –
140
4. Investors live in a tax-free world. 5. Investors can either invest or borrow at the same volatility-free rate of
interest. 6. Investors are volatility averse. In such a world, all investors would create and hold the same efficient
portfolio of volatile investments. This is called the market portfolio and is composed of all volatile investments, each weighted in terms of its outstanding market value.
The logic behind the CAPM's assertion is fairly simple. The idea is that investors are compensated for taking necessary risks, but not for taking unnecessary risks. The risk in the market portfolio is necessary: Market risk is inescapable. The market is the ''hot potato" of risk that must be borne by investors in aggregate. Residual risk, on the other hand, is self-imposed. All investors can avoid residual risk.
The CAPM isn't the same as efficient markets theory, although the two are consistent. Efficient markets theory comes in three strengths: weak, semi strong, and strong. The weak form states that investors cannot outperform the market using only historical price and volume data. The semi strong form states that investors cannot outperform the market using only publicly available information: historical prices plus fundamental data, analysts' published recommendations, etc. The strong form of the efficient markets hypothesis states that investors can never outperform the market: Market prices contain all relevant information. The CAPM makes similar statements, although perhaps from a slightly different perspective. For any investor whose portfolio doesn't match the market, there must (effectively) be another investor with exactly the opposite deviations from the market. So, as long as there are no "greater fools," one shouldn't expect either of those investors to outperform the market. Efficient markets theory argues that there are no "greater fools" because market prices reflect all useful information.
Various extended models of the original CAPM have been developed since the mid-1960s, as well as other models concerning security pricing. For example, Arbitrage Pricing Theory asserts that multiple factors, in addition to market volatility, are involved in security pricing. The CAPM has been criticized on the basis of its unrealistic assumptions and as not providing a completely accurate description of real-world security pricing. It nevertheless remains a powerful model that highlights the importance of diversification and the relationship between no diversifiable volatility and security expected returns.
In 1976, Ross proposed a model based on the principle of valuing assets through arbitrage theory (Roll and Ross, 1980). This model, called the Arbitrage Pricing Theory (APT) model, is based on less restrictive assumptions than the CAPM. While the CAPM assumes that asset returns are normally distributed, the APT does not hypothesis on the nature of the distribution. The APT model does not include any assumptions on individuals’ utility functions either, but simply assumes that individuals are risk averse. This simplification of the assumptions allows the model to be validated empirically.

CRISTINA CURUłIU
141
The chief difference between the CAPM and the APT is that the latter specifies several risk factors, thereby allowing for a more expansive definition of systematic investment risk than that implied by the CAPM’s single market portfolio.
The arbitrage pricing theory (APT) is an interesting and powerful alternative to the CAPM for forecasting expected returns. The APT postulates a multiple-factor model of excess returns. The conclusions are:
• The APT is a model of expected returns. • Application of the APT is an art, not a science. • The APT points the quantitative manager toward the relationship between
factors and expected returns. • APT factors can be defined in a multitude of ways. These may be
fundamental, technical, or macro factors. • The flexibility of the APT makes it inappropriate as a model for consensus
expected returns, but an appropriate model for a manager's expected returns. • The APT is a source of information to the active manager. It should be
flexible. If all active managers shared the same information, it would be worthless. The APT requires less stringent assumptions than the CAPM and produces
similar results. This makes it sound as if the APT is a dominant theory. The difficulty is that the APT says that it is possible to forecast expected stock returns but it doesn't tell you how to do so. It has been called the ''arbitrary" pricing theory for just this reason. The CAPM, in contrast, comes with a user's manual. The APT states that each stock's expected excess return is determined by the stock's factor exposures. For each factor, there is a weight (called a factor forecast) such that the stock's expected excess return is the sum over all the factors of the stock's factor exposures times the factor forecasts.
The theory doesn't say what the factors are, how to calculate a stock's exposure to the factors, or what the weights should be in the linear combination. This is where science steps out and art steps in.
In discussing the APT, one should be careful to distinguish among: • Stories that motivate the APT. These usually involve basic economic
forces that alter the relative valuation of stocks. The motivating stories may mislead some people into thinking that it is necessary for the APT to be based on exogenous macroeconomic factors. The applications described in this chapter indicate that this is not the case.
• Attempts to implement the APT. The APT is by nature arbitrary. Different individuals' attempts to implement it will take different forms. One should not confuse a particular implementation with the theory.
To these models there are juxtaposed also the hetero skedatic models. Numerous empirical studies on the performance of investment funds have been carried out with the help of traditional measures. The results of these studies often give negative Jensen alphas, and the Treynor and Mazuy and Henriksson and Merton methods tend to attribute a negative performance to informed investors.

METHODS OF PORTFOLIO MANAGEMENT. - A REVIEW OF LITERATURE –
142
These studies also reveal that the results are not very stable over time. The results are therefore relatively unsatisfactory. However, the measurement methods used in these studies do not take into account the dynamic nature of the returns.
More recent studies have shown that the use of conditional performance measurement models leads to more satisfactory results. Nevertheless, when one look at the modeling of returns with the help of models that integrate variations over time since the beginning of the 1980s, the application of these models to performance measurement has not been developed greatly in the literature. Notwithstanding this, models that use stochastic volatility are potentially useful.
The ARCH (autoregressive conditional heteroskedasticity) models were developed by Engle (1982) and generalized by Bollersev (1986), after the assumption of homoskedastic stock market returns was called into question. They allow one to model volatility stochastically, by taking its variations over time into account, and therefore provide more detailed information.
The ARCH model, which is the simplest, enables the conditional variance to be represented as a function of the squares of past forecast errors.
The ARMA–GARCH model, developed by Weiss (1986), allows to be even more sophisticated by introducing dynamic modeling into the first-order moment. This moment is then represented by an autoregressive moving average (ARMA) model.
Engle et al. (1987) extended the previous model to relate it more closely to financial theory and reveal the existence of a risk premium. The model that they developed involves introducing the volatility into the conditional mean. The name ARCH-M means that the ARCH effect is situated in the mean.
The GARCH model is a generalization of the previous model. The volatility now depends on both a linear combination of the forecast error squares (an autoregressive term) and past conditional variances (a moving average term).
Next to this is important also the study of the investment variants of an individual investor. For example, J. Linter (1965) studies the election modalities of the investments in financial titles, and there is a situations sequence by which an investor can choose the optimum investment variant.
The assets in the portfolio could include stocks, bonds, options, warrants, gold certificates, real estate, futures contracts, production facilities, or any other item that is expected to retain its value.
The types of portfolios on which the present doctoral dissertation will centre upon will be the stock portfolio. The evaluation methods of the shares arise from the principle according to which a share value is the actualized value of the future financial fluxes. There are two types of models: basis models (Gordon-Shapiro, 1956; Bates, 1962; Holt, 1957; Rainsy Sam, 1984) and more stages models (Molodovsky, 1960).
Regarding the most recent models, some of them would be the following:

CRISTINA CURUłIU
143
- Limited Information Bayesian Model Averaging (LIBMA). The proposed approach accounts for model uncertainty by averaging over all possible combinations of predictors when making inferences about the variables of interest, and it simultaneously addresses the biases associated with endogenous and omitted variables by incorporating a panel data systems Generalized Method of Moments estimator;
- Generalized Method of Moments Estimator (GMM) proposed by Hansen (1982). GMM estimators hold the potential for both consistency and efficiency gains by exploiting additional moment restrictions;
- model of interdependence of asset markets during non-crisis periods is specified as a latent factor model of asset returns - Similar latent factor models of contagion are used by Dungey and Martin (2001); Dungey, Fry, González-Hermosillo, and Martin (2002); Forbes and Rigobon (2002); and Bekaert, Harvey, and Ng (2003);
- Miniaci and Weber (2002) review the methodological issues surrounding estimation of portfolio choice models from survey data. They point out that a panel structure is necessary to estimate portfolio choice models, propose the use of binomial probit models, and state the different mechanisms that can lead to limited participation;
- Ricardian model (Miklos Koren, 2003) – the specialization and trade arise as a result of productivity differences across countries. The pattern of specialization will be pinned down by the portfolio decision of the representative investor in each country. Portfolio choice will in turn be affected by the development of international financial markets;
- the simulated method of moments (SMM) suggest that all variants of models which do not take into account stochastic volatility and unanticipated jumps cannot generate the non-normalities consistent with the observed interest rates;
- the Quadratic GARCH (QGARCH) model by Sentana (1995) is used to model asymmetric effects of positive and negative shocks;
- the Threshold GARCH (TGARCH) model by Zakoian (1994) is one on conditional standard deviation instead of conditional variance;
- the parametric ARFIMA - FIGARCH (Baillie, 2002) model is used to estimate the order of fractional integration.
CONCLUSIONS
Thus, Markowitz’s optimization model turns out to be particularly appropriate for handling the problem of asset allocation, because the number of asset classes is limited. The number of calculations to be carried out thus becomes reasonable. The input data are the means and the variances, estimated for each asset class, and the correlations between the asset classes. The model provides the optimal percentage to assign to each asset class to obtain the best return for a given level of risk. This optimization can be produced by defining the constraints linked to the manager’s investment style: for example, holding a minimal percentage of stocks in the portfolio.

METHODS OF PORTFOLIO MANAGEMENT. - A REVIEW OF LITERATURE –
144
The capital asset pricing model (CAPM), although much maligned, remains as perhaps the most popular tool for quantifying and measuring risk for equities in academic circles and in the investment industry in the USA, but is less popular with the UK investment community. The main attraction of the CAPM is the simplicity of its predictions. However, according to detractors of the model, the simplicity is achieved at the expense of a realistic view of how financial markets work.
The APT describes the mechanism of arbitrage whereby investors will bring an asset which is mispriced, according to the APT model, back into line with its expected price. APT thus assumes "arbitrage in expectations" - that arbitrage by investors will bring asset prices back into line with the returns expected by the model portfolio theory. The APT along with the capital asset pricing model (CAPM) is one of two influential theories on asset pricing. The APT differs from the CAPM in that it is less restrictive in its assumptions. It allows for an explanatory (as opposed to statistical) model of asset returns. It assumes that each investor will hold a unique portfolio with its own particular array of betas, as opposed to the identical "market portfolio". In some ways, the CAPM can be considered a "special case" of the APT.
The APT along with the capital asset pricing model (CAPM) is one of two influential theories on asset pricing. The APT differs from the CAPM in that it is less restrictive in its assumptions. It allows for an explanatory (as opposed to statistical) model of asset returns. It assumes that each investor will hold a unique portfolio with its own particular array of betas, as opposed to the identical "market portfolio". In some ways, the CAPM can be considered a "special case" of the APT.
The autoregressive conditional heteroskedasticity (ARCH, Engle 1982) model considers the variance of the current error term to be a function of the variances of the previous time period's error terms. ARCH relates the error variance to the square of a previous period's error. It is employed commonly in modeling financial time series that exhibit time-varying volatility clustering, i.e. periods of swings followed by periods of relative calm. If an autoregressive moving average model (ARMA model) is assumed for the error variance, the model is a generalized autoregressive conditional heteroskedasticity (GARCH, Bollerslev 1986) model.
All those models give various angles regarding portfolio management process and transform it into a complex activity which must take into consideration the growing effects of globalization at financial markets level.
REFERENCES
1. Adams, A.T. & Bloomfield, D.& Booth, P.& England, P. (1993), Investment Mathematics and Statistics, Graham & Trotman Ltd.;
2. Andersen, T.G.&Bollerslev, T.&Diebold, F.X.&Ebens, H. (2000), The distribution of Stock Return Volatility, University of Pennsylvania Wharton School Financial Institution Center;

CRISTINA CURUłIU
145
3. Badea, L. (2005), Gestiunea portofoliilor de titluri primare, Editura Economica, Bucureşti;
4. Baron, T. & Biji, E. (1996), Statistică teoretică şi economică, EDP-RA, Bucureşti; 5. Bates, G. (1970), Methode d’evaluation des actions, Analyse Financiere, Harvard
Business Review; 6. Begg, D.& Fisher& Rudiger& Dornbush (2000), Economics, McGraw-Hill
International Edition; 7. Bernoulli, D. (1738), Specimen theoriae novae de mensura sortis (Exposition of a
New Theory on the Measurement of Risk; 8. Bodie, Z.& Kane, Al.& Marcus, A.J.(2002), Investements, Richard Irving Inc.; 9. Bollerslev, T. (1986), “Generalized Autoregressive Conditional Heteroskedasticity”,
Jurnal of Econometrics, no. 31 10. Brezeanu, P. (2002), Gestiunea financiară a portofoliului, Editura Economica,
Bucureşti; 11. Brooks& Robin&Del Negro, M. (2002), “The Rise in Comovement across
National Stock Markets: Market Integration or IT Bubble?”, Atlanta Federal Reserve Working Paper Series;
12. Carpenter, M.D.& Upton, D.E. (1981), “Trading Volume and Beta Stability”, JPM, vol. 7(2);
13. Copeland, T.& Koller, T.& Murrin, J. (1996), Valuation – measuring and managing the value of companies, SUA;
14. Dragotă, V. (2003), Gestiunea portofoliului de valori mobiliare, Editura Economica, Bucureşti;
15. Dragotă, V.& Mitric ă, E. (2001), Romanian Capital Market – Testing Efficiency, 28th European Working Group for Financial Modelling, Vilnius;
16. Estrada, J. (2001), The Cost of Equity in Emerging Markets: a downside risk approach (II), IESE Business School, Spania;
17. Farrell, J.L. (1997), Portfolio management, McGraw-Hill International Edition; 18. Gordon, M.& Shapiro, E.(1956), “Capital equipment analysis: The required rate of
profit”, Management Science; 19. Gujarati, D. (1988), Basic Econometrics, McGraw-Hill International Edition; 20. Halpern, P. (2001), FinanŃe manageriale. Modelul canadian, Editura Economică,
Bucureşti; 21. Harpern, P.& Weston, J.& Brigham, E. (1998), Finante Manageriale, Editura
Economica, Bucureşti; 22. Holt, C. (1962), “The influence of growth duration on share price”, Journal of
Finance; 23. Huidumac, C.& Stancu, S. (1999), Teoria portofoliului cu aplicaŃii pe piaŃa
financiară, Editura didactică şi pedagogică, Bucureşti; 24. Jensen, M.C.& Mecking, W. (1976), “Theory of the Firm: Managerial Behavior,
Agency Costs and Capital Structure”, Journal of Financial Economics; 25. King, M.&Sentana, E.&Wadhwani, S. (1994),: “Volatility and links between
national stock markets”, Econometrica, vol. 62: 901–933;

METHODS OF PORTFOLIO MANAGEMENT. - A REVIEW OF LITERATURE –
146
26. Ledoit, O.&Santa-Clara, P.& Wolf, M. (2003), “Flexible multivariate GARCH modeling with an application to international stock markets,” Review of Economics and Statistics forthcoming;
27. Ling, S.& McAleer, M. (2003), “Asymptotic theory for a vector ARCH- GARCH model,” Econometric Theory, vol. 19: 280–310;
28. Lintner, J. (1965), Security prices, risk and maximal gains from diversification. The valuation of risk assets and selection of risky investments in stock portfolio and capital budgets.
29. Markowitz, H. (1952), “Portfolio Selection”, The Journal of Finance, vol. VII, No.1; 30. Modigliani, F.&Miller, M. (1958), The Cost of Capital, Corporation Finance and
the Theory of Investments, American Economic Review; 31. Modigliani, F.&Miller, M. (1963), Corporate Income Taxes and Cost of Capital:
A Correction, American Economic Review; 32. Myers, S.C. (1984), The Capital Structure Puzzle, The Journal of Finance; 33. Reilly, F. (1989), Investment Analysis and Portfolio Management, 3rd edition,
Dryden Press; 34. Roman, M. (1999), “Statistica aplicată în evaluarea riscurilor financiare: aspecte
metodologice referitoare la indicatorul value-at-risk”, Simpozionul ISE Timişoara; 35. Roman, M. (2003), Statistică financiar-bancară şi bursieră, Editura ASE, Bucureşti; 36. Ross, S. (1976), “The Arbitrage Theory of Capital Assets pricing”, Journal of
Economic Theory; 37. Sandu, G. (2000), Formarea capitalurilor firmelor private, Editura Economica,
Bucureşti; 38. Sharpe, W. (1963), “A Simplified Model of Portfolio Analysis”, Management Science; 39. Sharpe, W. (1964), “Capital Asset Price: A Theory of Market Equilibrium Under
Conditions of Risk”, Journal of Finance; 40. Solnik, B. (2000), International Investments, 4th ed. Addison-Wesley, MA; 41. Stancu, I. (1998), Articole fundamentale în teoria finaciară, DOFIN, Bucureşti; 42. Stancu, I. (2002), FinanŃe. PieŃe financiare şi gestiunea portofoliului, Editura
Economică, Bucureşti; 43. łigănescu, E.& Dobre, I.& Roman, M. (2000), Macroeconomie. Decizii strategice,
Editura ASE, Bucureşti; 44. Todea, Al. (2003), Managementul investitiilor pe piaŃa de capital, Casa CărŃii de
ŞtiinŃă, Cluj Napoca; 45. Todea, Al. (2004), EficienŃa informaŃională a pieŃelor de capital, Casa CărŃii de
ŞtiinŃă, Cluj Napoca; 46. Vascu, T.& Dragotă, V. (1998), PieŃe de capital. Evaluarea şi gestionarea
valorilor mobiliare, Editura FundaŃiei “România de mâine”, Bucureşti; 47. Wilmott, P. (2002), Derivative. Inginerie financiară, Editura Economică, Bucureşti; 48. www.dofin.ase.ro 49. www.aimr.org 50. www.riskmetrics.com 51. www.bvb.ro 52. www.kmarket.ro