nebraska’s highway 275 4-lane expansion: driving … · nebraska’s highway 275 4-lane...
TRANSCRIPT
Nebraska’s Highway 275 4-Lane Expansion:Driving Economic Growth, 2015-2020 and Beyond Produced for 4 Lanes 4 Nebraska April 6, 2015
Goss & Associates Economic SolutionsThe Goss InstituteErnest Goss, Principal Investigator600 17th Street, Suite 2800 SouthDenver, Colorado [email protected]
Ernest Goss, Ph.D.andJeffrey Milewski, B.A., M.S.

Table of Contents
NEBRASKA’S HIGHWAY 275 4-LANE EXPANSION: DRIVING ECONOMIC GROWTH, 2015-2020 AND BEYOND
Nebraska’s Highway 275 4-Lane Expansion: Driving Economic Growth, 2015-2020 and Beyond
Preface . . . . . . . . . . . . . . . . . . . . . . . . . . . . . . . . . . i
Glossary. . . . . . . . . . . . . . . . . . . . . . . . . . . . . . . . . . i
Executive Summary . . . . . . . . . . . . . . . . . . . . . . . . . . . . 1
Section 1: Nebraska’s Highway 275 4-lane Expansion: A Bird’s Eye View. . . .7
Section 2: The Impact of Highway 275 Widening on Economic Development 13
Section 3: The Impact of Highway 275 Construction Spending . . . . . . . 17
Section 4: The Impact of Highway 275 Widening on Accidents . . . . . . . . . 23
Section 5: The Impact of Highway 275 Widening on Commute Times . . . . . 27
Section 6: Alternative Highway Funding Strategies. . . . . . . . . . . . . . . 34
Appendix A: Board of Directors 4 Lanes 4 Nebraska . . . . . . . . . . . . . . . 48
Appendix B: Impact of Highway 275 on accident rates . . .. . . . . . . . . . . . 49
Appendix C: Impact of Nebraska road mileage on economic development . . . .50
Appendix D: References . . . . . . . . . . . . . . . . . . . . . . . 51
Appendix E: Researchers’ Biographies . . . . . . . . . . . . . . . . . . 55

Preface
NEBRASKA’S HIGHWAY 275 4-LANE EXPANSION: DRIVING ECONOMIC GROWTH, 2015-2020 AND BEYOND Page i
Nebraska’s Highway 275 4-Lane Expansion: Driving Economic Growth, 2015-2020 and Beyond
In 1969, the Nebraska Department of Roads (NDOR) first identified the need for an expressway system for northeast Nebraska. The planned system included the Highway 275 expan-sion which amounts to approximately 46.9 miles between Omaha and Norfolk, from Hooper to the Stanton turn-off.
The purpose of the expressway system is to: (1) connect urban centers with a population of 15,000 or more to the Interstate system, (2) add those routes which have an average daily traffic of 500 or more heavy commercial vehicles, and (3) add additional segments to provide 4-lane continu-ity.
Based on the estimates provided by the Nebraska Department of Revenue, the proposed expansion of Highway 275 will cost approximately $186 million. For the purposes of this study, it is assumed that the expansion will consist of con-verting the current 46.9 miles of two-lane highway to divided four-lane highway.
1
1This study was completed independent of Creighton Univer-sity. As such, Creighton University bears no responsibility for findings or statements by Ernie Goss, or Goss & Associates, Economic Solutions.
Goals of the study The goal of this study is to evaluate the eco-nomic importance and contributions of this expan-sion to counties that are traversed by the expansion, and to the remainder of the state.
Specific goals of the study are to estimate impacts of the highway expansion on:
1. Contribution to the reduction in accidents and deaths for the region and state.
2. Contribution to recuced commute times for workers in the Highway 275 counties.
3. Economic development - Impact on:• Overall economic activity. • Employment-contribution to the job base.• Wages and salaries-contribution to wages and
salaries.• Proprietorship-contribution to the income of
self-employed individuals.• Taxes-contribution to state and local tax
collections.• Population growth.
4. The study will also evaluate alternative funding options in light of what is being adopted across the nation.
The Goss & Associates research team thanks the Board of Directors and staff of 4 Lanes 4 Nebraska. Executive Director Josh Moenning was especially helpful in providing timely data and answers to ques-tions from our staff. Goss & Associates also thanks the Nebraska Department of Roads for accident and traffic count data. However, any errors, omissions, or misstatements are solely the responsibility of Goss & Associates and the principal investigator. This study, while funded by 4 Lanes 4 Nebraska, was developed independently of this organization. Any conclusions, findings, errors or mis-statements con-tained in this study are solely the responsibility of Goss & Associates, Economic Solutions, LLC.

NEBRASKA’S HIGHWAY 275 4-LANE EXPANSION: DRIVING ECONOMIC GROWTH, 2015-2020 AND BEYOND Page ii
Glossary
Term Definition
Discounted Unless stated otherwise, all financial data in this report are stated in 2015 dollars.
Direct effects The set of expenditures applied to the predictive model for impact analysis.
IMPLAN Using classic input-output analysis in combination with regional specific Social Accounting Matrices and Multiplier Models, IMPLAN provides a highly accurate and adaptable model for its users. The IMPLAN database contains county, state, zip code, and federal economic statistics which are specialized by region and can be used to measure the effect on a regional or local economy of a given change or event in the economy’s activity. See Appendix C.
Input-output analysis A type of applied economic analysis that tracks the interdependence among various producing and consuming sectors of an economy. More particularly, it measures the relationship between a given set of demands for final goods and services and the inputs required to satisfy those demands (U.S. Bureau of Economic Analysis).
Jobs supported A job in IMPLAN = the annual average of monthly jobs in that industry. Thus, 1 job lasting 12 months = 2 jobs lasting 6 months or = 3 jobs lasting 4 months each. A job can be either full-time or part-time.
Labor income Wages & salaries plus self-employment income.
Overall or sales impacts Amount of additional sales, including insurance premiums, retail sales, wholesale expenditures, construction sales, etc. It is analogous to gross domestic product (GDP) but will include some double counting and will thus exceed GDP.
Payroll All forms of compensation, such as salaries, wages, commissions, dismissal pay, bonuses, vacation allowances, sick-leave pay, and employee contributions to qualified pension plans paid during the year to all employees.
Private workers All those working excluding government workers, state, local and federal.
Productivity Growth in Gross Domestic Product (GDP) per worker.
Self-employment income Income of proprietors of non-incorporated companies including attorneys, accountants and consultants.
Wages and salaries The total payroll cost of the employee paid by the employer. This includes wage and salary, all benefits (e.g. health, retirement, etc) and employer paid payroll taxes (e.g. employer side of social security, unemployment taxes, etc).
NEBRASKA’S HIGHWAY 275 4-LANE EXPANSION: DRIVING ECONOMIC GROWTH, 2015-2020 AND BEYOND Page 1
Executive Summary
I. The Need for Expanding Highway 275• Average 2012 vehicle traffic on the 2-lane portion of Highway 275 proposed for conversion was:
o 69 percent higher than other 2-lane portions of Highway 275.
o 8 percent higher than current 4-lane portions of Highway 275.
• Average 2012 heavy truck traffic on the 2-lane portion of Highway 275 proposed for conversion was:
o 148 percent higher than other 2-lane portions of Highway 275.
o 32 percent higher than current 4-lane portions of Highway 275.
• Median traffic deaths per auto registrant were 61.9 percent higher in Highway 275 counties than in the rest of Nebraska.
• Industries with substantial projected increases in employment opportunities due to highway im-provements are more concentrated in the six Highway 275 counties than in the rest of Nebraska. Per 100 highway miles:
o Manufacturing employees: Highway 275 counties 984.1; the rest of the state 926.4.
o Manufacturing firms: Highway 275 counties 21.7; rest of the state 18.3.
o Primary metal product employees: Highway 275 counties 52.3; rest of the state 11.8.
o Primary metal product firms: Highway 275 counties 0.27; rest of the state 0.20.
• The agriculture industry demands extensive and high-quality highways and roads. Furthermore, farm output per highway mile is higher among Highway 275 counties than in other counties in the state. Per highway mile:
o Cattle (median): Highway 275 counties had 912 head compared to the rest of Nebraska’s 528 head.
o Farms (median): Highway 275 counties had 6.8 farms compared to the rest of Nebraska’s 4.7.
o Cropland in acres (median): Highway 275 counties had 2,847 acres compared to the rest of Nebraska’s 2,138.
Nebraska’s Highway 275 4-Lane Expansion: Driving Economic Growth, 2015-2020 and Beyond
Median traffic deaths per auto registrant were 61.9 percent higher in Highway 275 counties than in the rest of Nebraska.

NEBRASKA’S HIGHWAY 275 4-LANE EXPANSION: DRIVING ECONOMIC GROWTH, 2015-2020 AND BEYOND Page 2
Executive Summary
• Black Hills Energy has announced plans for a 50-mile natural gas pipeline stretching along High-way 275 from Bancroft to Norfolk.
o This access for natural gas will expand the development of industries along Highway 275 that are intense users of natural gas and quality highways.
- Paper products, metal producers, and food processing companies are likely candidates.
- In the recruitment or expansion of these industries, economic development officials will need to assure not only natural gas availability but also excellent highway access, such as an expanded Highway 275.
II. The Economic Development Impact of Expanding Highway 275• In 2012, Nebraska had 6,519 miles of urban roads of which 8.6 percent were classified as “arterial” or
wider.2
• In 2012, Nebraska had 87,279 miles of public rural roads of which only 2.7 percent were classified “arterial.”
• The expansion of Highway 275 would represent a 0.68 percent increase in rural arterial highway in Nebraska. For the period 2018-32, this expansion would:
o Add $1.2 billion to the state’s GDP, discounted to 2015 dollars, via expanded economic develop-ment.
o Annually support an additional 1,315 Nebraska jobs and 2,987 in state population.
III. Impact of Highway Construction Spending • It is assumed that $186.4 million will be spent on the widening of 46.9 miles of Highway 275 over a
two-year period.
• Direct and spillover economic activity generated from Highway 275 widening for the two-year con-struction period include:3
o $284.1 million addition to the overall Nebraska economy.
o $94.6 million in wages, salaries and self-employment income.
o 1,035 jobs on average for the two-year period.
2Arterial is defined by the U.S. Census Bureau as being a “a major road for any form of motor transport. Wider would mean interstate and expressways.3All impacts are djusted to 2015 dollars.
Between 2018 and 2032, the expansion would add $1.2 billion to the state’s GDP via expanded economic development, and support an addition of 1,315 jobs per year to the state’s economy.

NEBRASKA’S HIGHWAY 275 4-LANE EXPANSION: DRIVING ECONOMIC GROWTH, 2015-2020 AND BEYOND Page 3
Executive Summary
- $1.9 million in personal income taxes.
- $0.3 million in corporate income taxes.
- $2.3 million in personal property taxes.
- $1.2 million in other taxes and fees.
• The impacts of Highway 275 widening are spread across 355 of Nebraska’s 432 industries. The industries experiencing the greatest impacts will be:
o $65.2 million in sales for construction industry.
o $5.9 million in sales for architecture firms.
o $4.7 million in sales for the wholesale trade industry.
o $2.4 million in revenue for offices of physicians and dentists.
o $1.9 million in revenue for the food services industry.
o $204.0 million in revenue across the state’s remaining industries.
IV. Impact of Completed Highway 275 Widening on Accidents• The Federal Highway Administration estimated that conversion of a 2-lane highway to a 4-lane
divided highway reduced vehicle crashes between 40 percent and 60 percent.4
• Accidents per average daily traffic volume on the 2-lane portion of Highway 275 proposed for conversion for 2012 were:
o 0.5 percent higher than other 2-lane portions of Highway 275 not slated for conversion.
o 152 percent higher than current 4-lane portions of Highway 275.
• Accidents per average heavy truck volume on the 2-lane portion of Highway 275 proposed for con-version were 107 percent higher than current 4-lane portions of Highway 275.
• It is estimated that the widening of Highway 275 will reduce accidents per year per mile by 0.65.
• Over the first 15 years of operation, it is estimated that the proposed expansion of Highway 275 will create $25.3 million in value to the Nebraska economy resulting from a reduction in the num-ber of accidents.
4http://www.fhwa.dot.gov/publications/research/safety/humanfac/pdfs/99206.pdf. Accessed Jan. 23, 2015.
Direct and spillover economic activity generated from Highway 275 widening for the two-year construction period is a $284.1 million addition to the overall Nebraska economy.
o $7.8 million in state and local tax collections in the form of:
- $2.2 million in sales taxes.
Page 4
Executive Summary
NEBRASKA’S HIGHWAY 275 4-LANE EXPANSION: DRIVING ECONOMIC GROWTH, 2015-2020 AND BEYOND
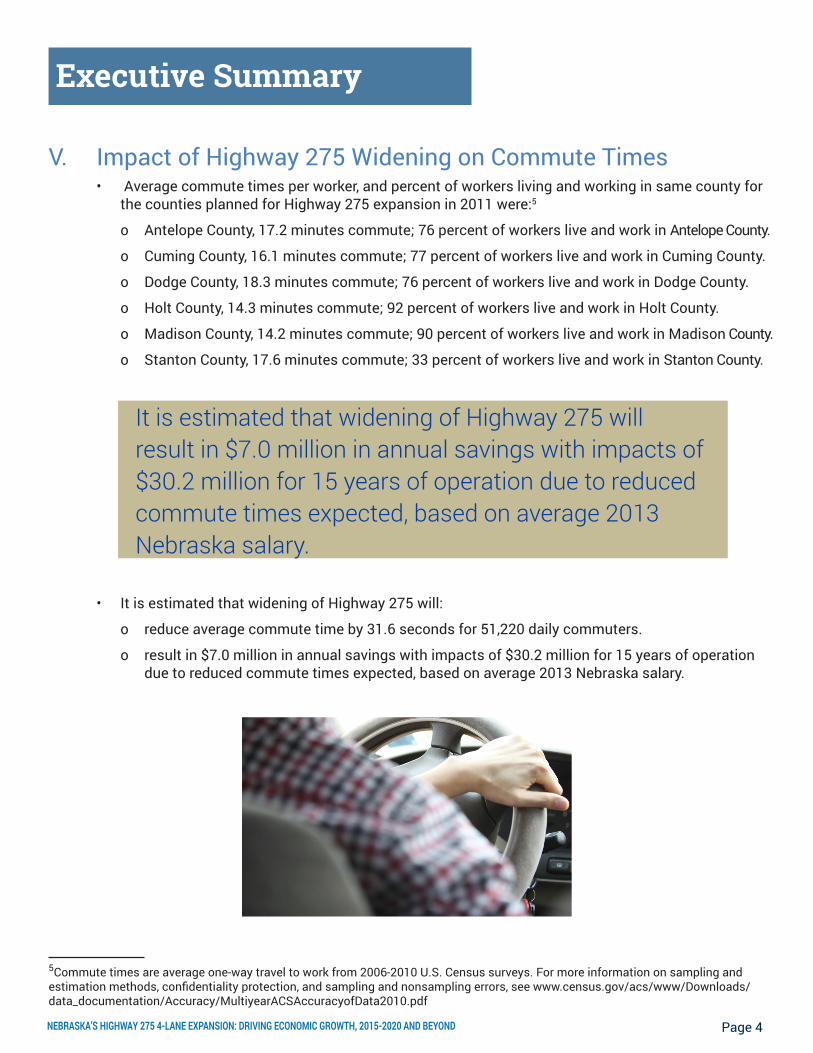
V. Impact of Highway 275 Widening on Commute Times• Average commute times per worker, and percent of workers living and working in same county for
the counties planned for Highway 275 expansion in 2011 were:5
o Antelope County, 17.2 minutes commute; 76 percent of workers live and work in Antelope County.
o Cuming County, 16.1 minutes commute; 77 percent of workers live and work in Cuming County.
o Dodge County, 18.3 minutes commute; 76 percent of workers live and work in Dodge County.
o Holt County, 14.3 minutes commute; 92 percent of workers live and work in Holt County.
o Madison County, 14.2 minutes commute; 90 percent of workers live and work in Madison County.
o Stanton County, 17.6 minutes commute; 33 percent of workers live and work in Stanton County.
• It is estimated that widening of Highway 275 will:
o reduce average commute time by 31.6 seconds for 51,220 daily commuters.
o result in $7.0 million in annual savings with impacts of $30.2 million for 15 years of operation due to reduced commute times expected, based on average 2013 Nebraska salary.
5Commute times are average one-way travel to work from 2006-2010 U.S. Census surveys. For more information on sampling and estimation methods, confidentiality protection, and sampling and nonsampling errors, see www.census.gov/acs/www/Downloads/data_documentation/Accuracy/MultiyearACSAccuracyofData2010.pdf
It is estimated that widening of Highway 275 will result in $7.0 million in annual savings with impacts of $30.2 million for 15 years of operation due to reduced commute times expected, based on average 2013 Nebraska salary.

NEBRASKA’S HIGHWAY 275 4-LANE EXPANSION: DRIVING ECONOMIC GROWTH, 2015-2020 AND BEYOND Page 5
Executive Summary
By 2013, thirty-three states had enacted laws that enable transportation departments to use public-private partnerships for highway projects.
• State and local governments are enacting alternatives to the traditional fuel taxes to fund highway and road construction.
o Some states, such as Washington, have enacted a per vehicle tax for electric and hybrid vehicles.
o States are considering the use of GPS technology to tax per mile driven as an alternative method of funding highways and roads
• Public-private partnerships (PPPs) are increasingly allowing states to finance needed transportation projects when other revenue sources are lacking.
o PPPs enable the states to finance and build highways to meet a pressing need more quickly.
o By 2013 thirty-three states had enacted laws that enable transportation departments to use public-private partner-ships for highway projects.
• Funding options:
o Nebraska enact PPP-enabling legislation.
o Nebraska take immediate action to shore up funds for highway construction.
o Nebraska Unicameral should pass highway bond-enabling legislation.
- Given that current interest rates are at historic lows, it is recommended that Nebraska issue bonds to pay for the Highway 275 expansion.
- Use a portion of LB 84 (Build Nebraska Act)6 revenue to pay interest and principal on the highway bonds or,
- Implement a system of pass-through tolls to pay interest and principal on the highway bonds.
6http://nebraskalegislature.gov/bills/view_bill.php?DocumentID=11707
VI. Alternative Funding Methodologies for Expanding Highway 275

NEBRASKA’S HIGHWAY 275 4-LANE EXPANSION: DRIVING ECONOMIC GROWTH, 2015-2020 AND BEYOND Page 6
Executive Summary
VII. Summary of Economic Impacts, 2016-2032.
Table EX1.1: Summary of economic impacts of Highway 275 widening (2015 dollars)
Description of impact 2016-17 2018-32
Highway construction
Sales or output $284.1 million
Jobs (average per year) 1,035
Wages, salaries & self-employment income $94.6 million
Added wages & salaries from reduced commute times $7.1 million
Added sales from accident reductions $15.9 million
Added economic development from expansion
GDP $1.2 billion
Jobs supported each year 1,315
Population increase (assuming all new jobs go to non-Nebraskans)
2,987
Reduced wages & salaries from increase commute times during construction
($1.7 million)
Increase in yearly highway maintenance costs ($671,815)
Cost of highway construction (assume from state reserves or federal highway dollars)
($186.4 million)
Source: Goss & Associates
Page 7
Section 1 - Nebraska’s Highway 275 4-lane Expansion: A Bird’s Eye View
NEBRASKA’S HIGHWAY 275 4-LANE EXPANSION: DRIVING ECONOMIC GROWTH, 2015-2020 AND BEYOND
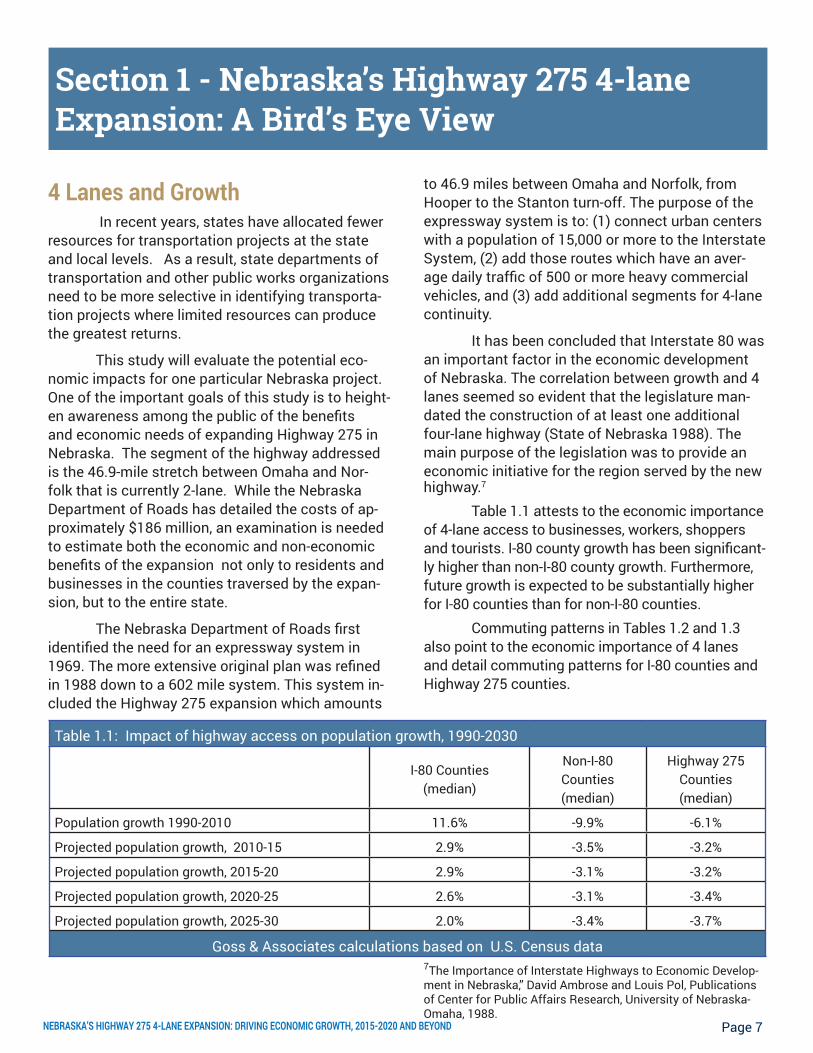
4 Lanes and Growth In recent years, states have allocated fewer resources for transportation projects at the state and local levels. As a result, state departments of transportation and other public works organizations need to be more selective in identifying transporta-tion projects where limited resources can produce the greatest returns.
This study will evaluate the potential eco-nomic impacts for one particular Nebraska project. One of the important goals of this study is to height-en awareness among the public of the benefits and economic needs of expanding Highway 275 in Nebraska. The segment of the highway addressed is the 46.9-mile stretch between Omaha and Nor-folk that is currently 2-lane. While the Nebraska Department of Roads has detailed the costs of ap-proximately $186 million, an examination is needed to estimate both the economic and non-economic benefits of the expansion not only to residents and businesses in the counties traversed by the expan-sion, but to the entire state.
The Nebraska Department of Roads first identified the need for an expressway system in 1969. The more extensive original plan was refined in 1988 down to a 602 mile system. This system in-cluded the Highway 275 expansion which amounts
to 46.9 miles between Omaha and Norfolk, from Hooper to the Stanton turn-off. The purpose of the expressway system is to: (1) connect urban centers with a population of 15,000 or more to the Interstate System, (2) add those routes which have an aver-age daily traffic of 500 or more heavy commercial vehicles, and (3) add additional segments for 4-lane continuity.
It has been concluded that Interstate 80 was an important factor in the economic development of Nebraska. The correlation between growth and 4 lanes seemed so evident that the legislature man-dated the construction of at least one additional four-lane highway (State of Nebraska 1988). The main purpose of the legislation was to provide an economic initiative for the region served by the new highway.7
Table 1.1 attests to the economic importance of 4-lane access to businesses, workers, shoppers and tourists. I-80 county growth has been significant-ly higher than non-I-80 county growth. Furthermore, future growth is expected to be substantially higher for I-80 counties than for non-I-80 counties. Commuting patterns in Tables 1.2 and 1.3 also point to the economic importance of 4 lanes and detail commuting patterns for I-80 counties and Highway 275 counties.
7The Importance of Interstate Highways to Economic Develop-ment in Nebraska,” David Ambrose and Louis Pol, Publications of Center for Public Affairs Research, University of Nebraska-Omaha, 1988.
Table 1.1: Impact of highway access on population growth, 1990-2030
I-80 Counties(median)
Non-I-80 Counties(median)
Highway 275Counties(median)
Population growth 1990-2010 11.6% -9.9% -6.1%
Projected population growth, 2010-15 2.9% -3.5% -3.2%
Projected population growth, 2015-20 2.9% -3.1% -3.2%
Projected population growth, 2020-25 2.6% -3.1% -3.4%
Projected population growth, 2025-30 2.0% -3.4% -3.7%
Goss & Associates calculations based on U.S. Census data
Table EX1.1: Summary of economic impacts of Highway 275 widening (2015 dollars)
Description of impact 2016-17 2018-32
Highway construction
Sales or output $284.1 million
Jobs (average per year) 1,035
Wages, salaries & self-employment income $94.6 million
Added wages & salaries from reduced commute times $7.1 million
Added sales from accident reductions $15.9 million
Added economic development from expansion
GDP $1.2 billion
Jobs supported each year 1,315
Population increase (assuming all new jobs go to non-Nebraskans)
2,987
Reduced wages & salaries from increase commute times during construction
($1.7 million)
Increase in yearly highway maintenance costs ($671,815)
Cost of highway construction (assume from state reserves or federal highway dollars)
($186.4 million)
Source: Goss & Associates

NEBRASKA’S HIGHWAY 275 4-LANE EXPANSION: DRIVING ECONOMIC GROWTH, 2015-2020 AND BEYOND Page 8
SECTION 1 - NEBRASKA’S HIGHWAY 275 4-LANE EXPANSION: A BIRD’S EYE VIEW
Table 1.2: Commuting for I-80 counties, 2006-10
County
2006-10Population
Percent of daytime population change due to commuting
Percent of workers who lived and worked
in same area
Employment- residence ratio
Douglas 505,545 10.9% 87.7% 1.21
Buffalo 45,437 3.3% 89.9% 1.06
Cass 25,246 -27.9% 32.4% 0.46
Cheyenne 10,049 10.1% 96.1% 1.18
Dawson 24,245 2.3% 89.2% 1.05
Deuel 1,963 -10.9% 59.3% 0.79
Hall 56,899 8.5% 91.5% 1.16
Hamilton 9,160 -8.3% 59.4% 0.84
Keith 8,356 -4.2% 80.0% 0.92
Kimball 3,814 -2.8% 82.7% 0.94
Lancaster 279,428 2.5% 93.6% 1.05
Lincoln 36,167 3.0% 95.7% 1.06
Sarpy 152,180 -15.9% 40.3% 0.71
Seward 16,628 -10.9% 60.1% 0.79
York 13,886 4.8% 85.9% 1.09
Median (I-80) 24,245 2.3% 85.9% 1.05
Median (non-I-80) 5,546 -6.2% 72.6% 0.87
Source: U.S. Census Bureau, 2006-2010 American Community Survey 5-year estimates
Table 1.3: Commuting for Highway 275 counties, 2006-10
County
2006-10Population
Percent of daytime population change due to commuting
Percent workers who lived and worked in
same area
Employment- residence ratio
Antelope 6,742 -8.3% 34.4% 0.83
Cuming 9,243 -4.4% 38.6% 0.91
Dodge 36,621 -1.4% 36.6% 0.97
Holt 10,479 -0.1% 46.3% 1.00
Madison 34,720 9.7% 45.1% 1.19
Stanton 6,207 -25.4% 17.1% 0.52
Median 9,861 -2.9% 37.6% 0.94
Source: U.S. Census Bureau, 2006-2010 American Community Survey 5-year estimates
In other words, I-80 access has stimulated business growth in I-80 counties, enabling residents to work closer to home.
Table 1.2: Commuting for I-80 counties, 2006-10
County
2006-10Population
Percent of daytime population change due to commuting
Percent of workers who lived and worked
in same area
Employment- residence ratio
Douglas 505,545 10.9% 87.7% 1.21
Buffalo 45,437 3.3% 89.9% 1.06
Cass 25,246 -27.9% 32.4% 0.46
Cheyenne 10,049 10.1% 96.1% 1.18
Dawson 24,245 2.3% 89.2% 1.05
Deuel 1,963 -10.9% 59.3% 0.79
Hall 56,899 8.5% 91.5% 1.16
Hamilton 9,160 -8.3% 59.4% 0.84
Keith 8,356 -4.2% 80.0% 0.92
Kimball 3,814 -2.8% 82.7% 0.94
Lancaster 279,428 2.5% 93.6% 1.05
Lincoln 36,167 3.0% 95.7% 1.06
Sarpy 152,180 -15.9% 40.3% 0.71
Seward 16,628 -10.9% 60.1% 0.79
York 13,886 4.8% 85.9% 1.09
Median (I-80) 24,245 2.3% 85.9% 1.05
Median (non-I-80) 5,546 -6.2% 72.6% 0.87
Source: U.S. Census Bureau, 2006-2010 American Community Survey 5-year estimates
Table 1.3: Commuting for Highway 275 counties, 2006-10
County
2006-10Population
Percent of daytime population change due to commuting
Percent workers who lived and worked in
same area
Employment- residence ratio
Antelope 6,742 -8.3% 34.4% 0.83
Cuming 9,243 -4.4% 38.6% 0.91
Dodge 36,621 -1.4% 36.6% 0.97
Holt 10,479 -0.1% 46.3% 1.00
Madison 34,720 9.7% 45.1% 1.19
Stanton 6,207 -25.4% 17.1% 0.52
Median 9,861 -2.9% 37.6% 0.94
Source: U.S. Census Bureau, 2006-2010 American Community Survey 5-year estimates
NEBRASKA’S HIGHWAY 275 4-LANE EXPANSION: DRIVING ECONOMIC GROWTH, 2015-2020 AND BEYOND Page 9
SECTION 1 - NEBRASKA’S HIGHWAY 275 4-LANE EXPANSION: A BIRD’S EYE VIEW
to 16,256). From 1990 to 2001, 6,269 jobs were created as a result of development and explansion of 151 manufacturing plants in the vicinity of the highway’s path.9
U.S. On the other hand, in a national study Chandra and Thompson (2000) concluded that on the whole, economic activity remains unchanged. They show that counties on the path of the highway experience increased economic activity, but adja-cent counties see economic activity being drawn away.10 Specifically in counties where a highway directly passes, earnings in the manufacturing, retail trade, services, communication, and public utilities industries increase. They see that “regional highway investments aid the nationally oriented manufacturing industry but lead to the reallocation of economic activity in more regionally oriented industries.”11
Missouri. Counties with four-lane highways were studied by a group of researchers affiliated with the University of Missouri. They found that overall, the impact of highway improvement on eco-nomic activity was small, with only a few counties seeing a measurable impact from increased high-way mileage. They suggest that rural areas lacking four-lane highways “hold their own”, only lagging behind four-lane highway counties in terms of sales taxes generated and real estate valuations.12
In discussing the reasons why highway im-provement shows little effect on economic develop-ment, the researchers suggest that the complexity of the relationships is hard to quantify. They also mention the decision making process of the busi-ness owner when selecting locations and highlight that transportation access is an important compo-nent, but also suggest that for small, rural retailers, expanded highways make little difference, as they are already in their home community.13
9 Leong et al, (2014).10Chandra, A. and Thompson, E., (2000). “Does public infra-structure affect economic activity? Evidence from the rural interstate highway system”, Regional Science and Urban Eco-nomic 30(4), p. 487.11Chandra, A. and Thompson, E., (2000), p. 487.12Pigg, K., Johnson, T., Gilles, J., Fulcher, C., and Wilson-Orndoff, C., “Benefits of Highway Improvements on Rural Communities in Missouri: Economic Development Consideration”, Missouri Department of Transportation, September 2003. p. 4.13Pigg et al. (2003), p. 17.
Data in Tables 1.2 and 1.3 indicate several important outcomes. First, he employment to resi-dence ratio for I-80 counties is substantially higher than that for Highway 275 counties. Furthermore, the percent of workers who lived and worked in the same county for I-80 counties was significantly higher than that of Highway 275 counties. In other words, I-80 ac-cess has stimulated business growth in I-80 counties enabling residents to work closer to home.
The Evidence from Other Highway Projects Wisconsin. A Wisconsin case study analyzing the expansion of Highway 29 to 4 lanes highlighted several positive results from a survey of community leaders, business owners, and property assessors in regard to community economic impacts. Survey par-ticipants noted improved travel times, better access to the freeway, and improved safety. Planning efforts for commercial development were accelerated, and employment prospects improved.
Specifically, employment along the corridor exceeded statewide growth by 3.0 percentage points (8.7 percent to 11.7 percent). The highway also af-fected income levels. Estimates suggest a benefit of $1.4 billion by 2020 for statewide disposable income.8
Highway 29’s impact on business was also evaluated. However, retail stores indicated that the impact was mixed. They found that the expanded highway brought more customers to their locations, but the highway also created a landscape of greater competition, particularly from stores in larger nearby cities.
From 1995 to 2003, the number of businesses along the highway increased by 55 percent (10,464 8Leong, D., Lichtman, L., Marcos, F., Michelson, K., and Russell, R., “Economic and Land Use Impacts of Wisconsin State Trunk Highway 29”, Final Report, Projects 0092-02-17 and 0092-03-06, Wisconsin DOT, July 2014.

NEBRASKA’S HIGHWAY 275 4-LANE EXPANSION: DRIVING ECONOMIC GROWTH, 2015-2020 AND BEYOND Page 10
SECTION 1 - NEBRASKA’S HIGHWAY 275 4-LANE EXPANSION: A BIRD’S EYE VIEW
North Dakota. It was concluded that the lack of a four-lane highway hurt efforts to bring new retail and restaurant opportunities to the northwest-ern area of North Dakota. As a result, the North Da-kota Department of Transportation will be expand-ing US Highway 85 to a four-lane roadway from the west edge of Watford City to US Highway 2 east of Williston. The department has spent approximately $300 million building the 42 miles of four-lane high-way over the past three years. The landmark project represents a significant investment by the state of North Dakota to complete a vital link in meeting the region’s growing transportation needs.
California. To safely accommodate the increasing number of motorists traveling between Napa and Solano Counties, Caltrans is working with the Napa County Transportation and Planning Agen-cy (NCTPA) and the Solano Transportation Author-ity (STA) to widen a 5.8-mile stretch of State Route 12 through Jameson Canyon Road from a two-lane highway to a four-lane highway. The project extends from Highway Route 12 from the Highway 29 and Highway 12 junction in Napa County to Red Top Road and Highway 12 in Solano County.
The expansion will also add a concrete me-dian along the project route. Once completed, the project will improve safety and travel times through-out the region. The widening project includes two construction packages; The Napa County contract and the Solano County contract. The project is fund-ed by the Corridor Mobility Improvement Account (CMIA), the State Transportation Improvement Pro-
gram (STIP), and Proposition 1B. The entire project will cost approximately $115 million.
The benefits of widening depend heavily on the current industrial concentrations and the poten-tial for concentration. Industries with substantial projected increases in employment opportunities due to highway improvements include: 14
• Primary metals.
• Electric equipment.
• Paper and printing.
• Eating and drinking establishments.
• Retail trade.
• Business and professional services.
• Medical care services.
The Need and Potential for Highway 275 Counties As presented in Table 1.4, Highway 275 counties have 984.1 manufacturing employees per 100 miles of highway compared to the rest of Nebraska’s 926.4 manufacturing employees per 100 miles of highway. Likewise per 100 miles of high-way, Highway 275 counties have 21.7 manufactur-ing firms while the rest of the state has 18.3 manu-facturing firms.
Carlino and Mills (1987) found that greater interstate highway density was associated with higher levels of manufacturing employment and total employment overall.
14“Do New Highways Attract Businesses?” Daniel J. Hodge, Glen Weisbrod, and Arno Hart. Transportation Research Record, paper no. 03-414B.

NEBRASKA’S HIGHWAY 275 4-LANE EXPANSION: DRIVING ECONOMIC GROWTH, 2015-2020 AND BEYOND Page 11
SECTION 1 - NEBRASKA’S HIGHWAY 275 4-LANE EXPANSION: A BIRD’S EYE VIEW
Industries with substantial projected increases in employment opportunities due to highway improvements are more concentrated in the six Highway 275 counties. Table 1.4 summarizes the differences. Per 100 highway miles, Highway 275 counties had 984.1 manufacturing employees compared to 926.4 manufacturing employees for the rest of Nebraska. Additionally, there were 21.7 manufacturing firms per highway mile for Highway 275 counties versus only 18.3 manufacturing firms for the rest of the state.
The agriculture industry demands extensive, high-quality highways and roads. Furthermore, farm out-put per highway mile is higher among Highway 275 counties than other counties in the state. Per highway mile:• Number of cattle (median): Highway 275 counties had 912 head compared to the rest of Nebraska’s 528 head. • Number of farms (median): Highway 275 counties had 6.8 farms compared to the rest of Nebraska’s
4.7.Cropland in acres (median): Highway 275 counties had 2,847 acres compared to the rest of Nebraska’s 2,138.
Table 1.4: Industrial concentration, Highway 275 counties compared to rest of Nebraska, 2012
Highway 275 counties Rest of Nebraska
Employees per 100 miles of high-
way
Firms per 100 miles of highway
Employees per 100 miles of
highway
Firms per 100 miles of highway
Manufacturing 984.1 21.7 926.4 18.3
Primary metal 52.3 0.27 11.8 0.20
Source: County Business Patterns, U.S. Census Bureau
Table 1.5: Agriculture concentration, Highway 275 counties compared to rest of Nebraska, 2012
Median Highway 275 counties per highway mile Rest of Nebraska
Number of farms 6.8 4.7
Number of cattle 912 528
Cropland 2,847 2,138
Source: County Business Patterns, U.S. Census Bureau
Furthermore, as shown in Table 1.4, the most highway-sensitive industry in the U.S. has a heavy concentration in the six Highway 275 counties. According to the latest data from the U.S. Census Bureau’s County Business Patterns, per 100 miles of highway, the six county Highway 275 area had 52.3 primary metal employees and the rest of the state had a much lower 11.8 primary metal employees. Not surprisingly, the Highway 275 counties also had a much higher concentration of primary metal products firms per 100 highway miles with 0.27 compared to the rest of the state at 0.20.

NEBRASKA’S HIGHWAY 275 4-LANE EXPANSION: DRIVING ECONOMIC GROWTH, 2015-2020 AND BEYOND Page 12
SECTION 1 - NEBRASKA’S HIGHWAY 275 4-LANE EXPANSION: A BIRD’S EYE VIEW
Black Hills Energy has announced plans for a 50-mile natural gas pipeline stretching along Highway 275 from Bancroft to Norfolk. This access for natural gas will expand the development of industries along Highway 275 that are intense users of natural gas and quality highways. Paper products, metal producers, and food processing companies are likely candidates. In the recruitment or expansion of these industries, economic development officials will need to assure not only natural gas availability but also excellent highway access, such as an expanded Highway 275.
Summary Natural gas is consumed primarily in the pulp and paper, metals, chemicals, petroleum refining, stone, clay and glass, plastic, and food processing industries. These businesses account for more than 84 percent of all industrial natural gas use.15 These are also industries that demand excellent highway access. According to a 2008 study by the Natural Gas Association, Nebraska’s natural gas industry creates directly and indirectly $2.6 billion in income and 26,856 jobs for the state.
The previous discussion has identified factors stimulating the need for the 46.9 mile expansion of Highway 275. Average vehicle traffic on the 2-lane portion of Highway 275 proposed for conversion is sub-stantially higher than for other portions of Highway 275. Furthermore, industries with substantial projected increases in employment opportunities due to highway improvements are more concentrated in the six High-way 275 counties (to be discussed in greater detail in Section 2). For example, metal manufacturing and the agriculture industry demands extensive, high-quality highways and roads. Farm output per highway mile is higher among Highway 275 counties than other counties in the state. Likewise, primary metal product firms are significantly more concentrated along Highway 275 than in other Nebraska locations.
15http://naturalgas.org/overview/uses-industrial/
CHI HEALTH INJECTS CASH AND GROWTH INTO NEBRASKA AND IOWA ECONOMIES Page 13
Section 2 - The Impact of Highway 275 Widening on Economic Development
The current Highway 275 configuration limits economic growth, especially for certain industries. Currently, heavy truck traffic is 148 percent higher on the 2-lane portion of 275 slated for expansion in comparison to the 2-lane portion remaining the same. Additionally, heavy truck traffic on the two lanes proposed for expansion is 32 percent higher than 4-lane portions of Highway 275.
Failure to expand Highway 275 could thus result in two negative outcomes for the Nebraska economy. First, due to the current heavy and burdensome traffic loads in the six counties, some businesses using Highway 275 at this time, particularly manufacturers, could relocate. Second, the failure to widen Highway 275 is likely to limit the ability to recruit new firms to the area.
Not only does Highway 275 currently limit growth, that constraint is likely to grow significantly. That is, greater natural gas access which is currently planned will make even more evident the need for an expanded Highway 275. Black Hills Energy has recently initiated planning for one of the longer natural gas pipeline projects in recent history in Nebraska.16
16http://norfolkdailynews.com/news/pipeline-to-expand-gas-service-to-norfolk/article_4bc7fc10-df61-11e3-a679-001a4b-cf6878.html
The pipeline will run the 50-mile stretch from Bancroft and Norfolk. Most of the underground line will be north of, and parallel to, Highways 51 and 275. It is estimated that the project will carry a total price tag of $22.5 million to $35 million.
The line will supply natural gas to, among others, Houston-based Tejas Tubular Products, which will build a plant near Nucor Steel in Norfolk. The Norfolk City Council has agreed to commit $3.6 million from the city’s LB840 economic development program to the gas line, pending a formal application.
The plan is for the new gas line to connect to the Northern Natural Gas interstate pipeline, allowing the area to receive gas from multiple pipelines in order to ease the capacity bottleneck at Norfolk and significantly enhance the economic development potential of the area.
The enhanced access to natural gas will greatly incentivize manufacturing expansion in the area and make the constraints of the current Highway 275 even less tenable. With expanded manufacturing comes the demand for improved highway access for input supplies and output products.
...the failure to widen Highway 275 is likely to limit the ability to recruit new firms to the area.
...greater natural gas access which is currently planned will make even more evident the need for an expanded Highway 275.
The enhanced access to natural gas will greatly incentivize manufacturing expansion in the area and increase the demand for Highway 275 expansion.

CHI HEALTH INJECTS CASH AND GROWTH INTO NEBRASKA AND IOWA ECONOMIES Page 14
Impact of Rural Highway Expansion on Economic Development The variety of different scenarios of highway projects and the different needs which they address complicate the analysis of the economic benefits of highway investment. In the 2001 Federal Highway Administration’s report, “Using Empirical Information to Measure the Economic Impact of Highway Investment”, three observations summarize the challenge of the evaluation highway investment projects:17
• The economic effect of a specific highway can vary from project to project.
• The potential economic effects of a specific new highway can be local and/or regional.
• There has been a lack of post-project studies documenting the actual economic impacts of built highway projects.
Observations from academic literature regarding this issue are mixed. In evaluating the effect of new interstate highway expansion, Chandra and Thompson (2000) conclude that on the whole economic activity remains unchanged. They show that counties on the path of the highway experience increased economic activity, but adjacent counties see economic activity being drawn away.18 Specifically in counties where a highway directly passes, earnings in the manufacturing, retail trade, services, communication, and public utilities industries increase. They see that “regional highway investments aid the nationally oriented manufacturing industry but lead to the reallocation of economic activity in more regionally oriented industries.”19
In a study for the Minnesota Department of Transportation, Lacono and Levinson (2013) found no convincing evidence of a statistically significant impact on earnings and employment from four rural Minnesota highway expansion projects. The post-construction data was relatively 17Economic Development Research Group. Using Empirical Information to Measure the Economic Impact of Highway Investments 18Chandra and Thompson (2000), p. 48719Chandra and Thompson (2000), p. 487
short-term, however, having only 11 years of data for the employment analysis. With these results, the authors suggest that highway projects should be evaluated on user benefits like time savings, safety, and reduction in pollutants, instead of focusing on economic cost-benefit analysis.20
In a study by Hodge et al (2003), a model was used that examined the extent to which highway investment improved access to markets, and impacted location decision of businesses. The study concluded that there is the potential that transportation improvements will lead to business attraction in the North County region of North Carolina.21 To determine the highway impact on regional attractiveness, Hodges et al. included four components in their model: comparative employment data, competitive cost factors, transportation usage by industry, and accessibility impacts. They found that a lack of transportation access inhibits economic growth in the North Country region. In cases like this one there exists the potential for highway investment to lead to business attraction.22
Post-project impact studies offer clearer views of the impact of highway expansion projects. For example, a 2004 report by the Wisconsin DOT evaluated the impact of the Highway 29 expansion project, with positive results.
Impact of Highway 275 on Economic Development. In order to investigate the future impact of the proposed expansion, the present study will examine Nebraska highway construction from 1987 to 2012. Table 2.1 lists the percentage growth in miles of various categories of Nebraska highways.
20Iacono and Levinson (2012) 21Hodge, D., Weisbrod, G., and Hart, A., “Do New Highways Attract Business? Case Study for North Country, New York”, Cambridge Systematics, Transportation Research Record 1839, Paper No. 03-4148, 2003. p. 15822Hodge et al, (2003), p. 158
SECTION 2 - THE IMPACT OF HIGHWAY 275 WIDENING ON ECONOMIC DEVELOPMENT

CHI HEALTH INJECTS CASH AND GROWTH INTO NEBRASKA AND IOWA ECONOMIES Page 15
The objective of the statistical analysis is to link the changes listed in Table 2.1 to growth.
In order to estimate the impact of adding 46.9 miles of Rural Main Artery highway surface, a Cobb-Douglas production function will be esti-mated. The Cobb-Douglas form was developed and tested against statistical evidence by Charles Cobb and Paul Douglas.23
The Cobb–Douglas production function is a particular functional form of the production func-tion, widely used to represent the technological relationship between the amounts of two or more inputs, physical capital and labor, and the amount of output, or GDP, that can be produced by those inputs.
In addition to capital and labor as inputs, the present study will add the number of miles of Nebraska highway by category. This formulation allows one to estimate the impact of adding 46.9 miles of rural arterial highway as proposed for Highway 275. Equation 2.1 specifies the theoreti-cal model to be estimated with Nebraska economic data from 1987 to 2012.
Regression results from the estimation of Equation (2.1) are contained in Appendix C, Table C.1. As listed in Table C.1, the model is able to ex-plain 99% of the variation in Nebraska gross
23Cobb, C. W.; Douglas, P. H. (1928). “A Theory of Production”. American Economic Review 18 (Supplement): 139–165.
domestic product (GDP) over the period 1987 to 2012. Alternatively, one could assert that the model has a one percent error, or unexplained variation in Nebraska GDP.
Also, data from Appendix C shows that the elasticity of RuralMain mileage is 0.126. This means that for a one percent increase in rural arterial mileage, Nebraska GDP expands by 0.126 percent. The proposed expansion in Highway 275 represents a 1.7 percent increase in RuralMain which translates into a 0.21 percent increase in Nebraska GDP.24
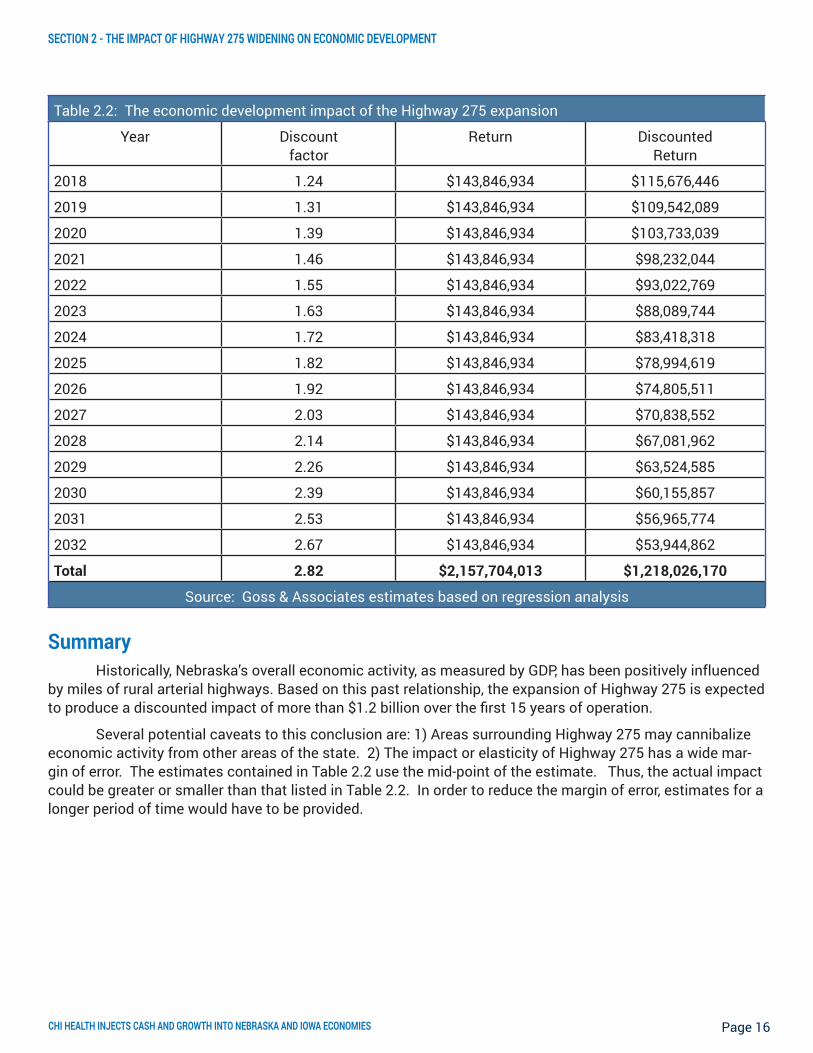
Table 2.2 contains estimated increases in Nebraska GDP by year discounted to present or 2015 values.25 As presented, over the course of 15 years of operation, the expansion in Highway 275 would increase GDP by a total of $1.2 billion. This result stems from the increased likelihood of new manufacturers moving to areas along Highway 275, the reduced probability of firms leaving the area, and to the expansion of firms already located along Highway 275. This estimated increase in state GDP would annually support 1,315 Nebraska jobs. Assuming all new jobs go to non-Nebraskans, this would result in a population increase for Nebraska of 2,987.
24Elasticity (E) = % change in GDP / % change in RuralMain mileage; 0.126 = % Change in GDP / 0.017; Thus, % Change in GDP = (0.126 * 0.017) = 0.00225Estimates in Table 2.2 assume a yearly maintenance cost of $671,815, a discount rate of 3.6 percent and a depreciation rate of two percent per year.
Table 2.1: Change in highway mileage by category, 1987-2012
Category Mnemonic Percent change in Nebraska miles, 1987-2012
Interstate Interstate 0.2%
Rural Main Artery RuralMain -13.1%
Rural Local RuralLocal 0.6%
Urban Express UrbanEx 918.9%
Urban Local UrbanLoc 30.1%
Source: U.S. Census Bureau
Equation 2.1 Ln (GDP) = Ln(A) + β1 Ln (Interstate) +β2 Ln(RuralMain)+ β3 Ln(UrbanEX) + β4 Ln(UrbanLoc) + β5 Ln(Labor) + β6 Ln(capital) (2.1)
SECTION 2 - THE IMPACT OF HIGHWAY 275 WIDENING ON ECONOMIC DEVELOPMENT
CHI HEALTH INJECTS CASH AND GROWTH INTO NEBRASKA AND IOWA ECONOMIES Page 16
Summary Historically, Nebraska’s overall economic activity, as measured by GDP, has been positively influenced by miles of rural arterial highways. Based on this past relationship, the expansion of Highway 275 is expected to produce a discounted impact of more than $1.2 billion over the first 15 years of operation.
Several potential caveats to this conclusion are: 1) Areas surrounding Highway 275 may cannibalize economic activity from other areas of the state. 2) The impact or elasticity of Highway 275 has a wide mar-gin of error. The estimates contained in Table 2.2 use the mid-point of the estimate. Thus, the actual impact could be greater or smaller than that listed in Table 2.2. In order to reduce the margin of error, estimates for a longer period of time would have to be provided.
Table 2.2: The economic development impact of the Highway 275 expansion
Year Discount factor
Return DiscountedReturn
2018 1.24 $143,846,934 $115,676,446
2019 1.31 $143,846,934 $109,542,089
2020 1.39 $143,846,934 $103,733,039
2021 1.46 $143,846,934 $98,232,044
2022 1.55 $143,846,934 $93,022,769
2023 1.63 $143,846,934 $88,089,744
2024 1.72 $143,846,934 $83,418,318
2025 1.82 $143,846,934 $78,994,619
2026 1.92 $143,846,934 $74,805,511
2027 2.03 $143,846,934 $70,838,552
2028 2.14 $143,846,934 $67,081,962
2029 2.26 $143,846,934 $63,524,585
2030 2.39 $143,846,934 $60,155,857
2031 2.53 $143,846,934 $56,965,774
2032 2.67 $143,846,934 $53,944,862
Total 2.82 $2,157,704,013 $1,218,026,170
Source: Goss & Associates estimates based on regression analysis
SECTION 2 - THE IMPACT OF HIGHWAY 275 WIDENING ON ECONOMIC DEVELOPMENT

NEBRASKA’S HIGHWAY 275 4-LANE EXPANSION: DRIVING ECONOMIC GROWTH, 2015-2020 AND BEYOND Page 17
Section 3 - The Impact of Highway 275 Construction Spending
Section Highlights:• Direct and spillover economic activity generated
from Highway 275 widening for the two-year construction period are:26
o $284.1 million addition to the overall Nebraska economy.
o $94.6 million in wages, salaries and self-employment income.
o Average of 1,035 jobs for the two-year period.
o $7.8 million in state and local tax collections.
• The impacts of Highway 275 widening are spread across 355 of Nebraska’s 432 industries. The industries experiencing the greatest im-pacts are:
o $65.2 million for the construction industry.
o $5.9 million for architecture firms.
o $4.7 million for the wholesale trade industry.
o $2.4 million for offices of physicians and dentists.
o $1.9 million for the food services industry.
Introduction In 2008, Mulatu Wubleh from East Carolina University outlined an assessment of how much an investment in the Highway 17 improvement project could impact the growth of the eastern North Caro-lina economy. Significant impacts were found: total economic output was $5.5 billion; total earnings was $1 billion; and the overall employment impact was the creation of 20,489 jobs.27 These numbers indicate a multiplier effect, where direct investment leads to indirect effects, further leading to induced effects. 26All dollar values are djusted to 2015 dollars.27Wubleh (2008) p. 7.
Infrastructure spending in Nebraska, just as in other states, is an important part of the economy. Such revenues from external sources are a direct economic impact used in this study’s input-output model of the economy. The direct economic impact therefore represents the first round of Highway 275 construction spending.
The direct or initial round of spending is followed by additional economic activity in the economy due to the “multiplier” impact. For ex-ample, construction company purchases of goods and services support other local businesses outside construction such as retail trade purchases from wholesale trade firms.
Furthermore, businesses throughout the community are supported when construction com-pany employees spend their paychecks. This addi-tional economic activity is a portion of the multiplier impact. The total economic impact is the sum of direct, indirect and induced impacts. The full mul-tiplier impact (indirect and induced) resulting from the direct economic impact is estimated utilizing the IMPLAN model.
Figure 3.1 depicts examples of the flow of funds into and out of Nebraska. As indicated, the total impact is the sum of direct (green arrows), indi-rect (blue arrows) and induced (red arrows) impacts minus leakages (gray arrows). Leakages represent highway spending outside of the state. Input-output multiplier systems are used to estimate impacts in Figure 3.1 by industry.
Direct economic impacts. Highway construc-tion spending has direct economic effects on the local economy through expenditures for goods and services and employee salaries. The most obvious direct expenditures are wages paid to workers em-ployed by highway construction firms. In addition, expenditures by business visitors to support high-way construction have direct impacts on the region, affecting primarily the accommodations industry. Direct economic impacts are color coded green in Figure 3.1.

NEBRASKA’S HIGHWAY 275 4-LANE EXPANSION: DRIVING ECONOMIC GROWTH, 2015-2020 AND BEYOND Page 18
SECTION 3- THE IMPACT OF HIGHWAY 275 ON CONSTRUCTION SPENDING
Indirect Economic Impacts. Highway spend-ing also produces indirect economic effects on the area economy. Architecture and engineering pur-chases at area wholesale firms, for example, gener-ate indirect effects by increasing: (a) the number of firms drawn to the community; (b) the volume of deposits in local financial institutions and; (c) eco-nomic development. Examples of indirect economic impacts are color coded blue in Figure 3.1.
Induced Economic Impacts. Induced impacts in the region occur as the initial spending feeds back to industries in the region when workers in the area purchase additional output from local firms in a second round of spending. That is, highway spending increases overall income and population, which produces another round of increased spend-ing adding to sales, earnings and jobs for the area. Examples of induced economic impacts are color coded red in Figure 3.1.
Figure 3.1: Schematic of impacts
Source: Goss & Associates 2014
NEBRASKA’S HIGHWAY 275 4-LANE EXPANSION: DRIVING ECONOMIC GROWTH, 2015-2020 AND BEYOND Page 19
SECTION 3 - THE IMPACT OF HIGHWAY 275 ON CONSTRUCTION SPENDING
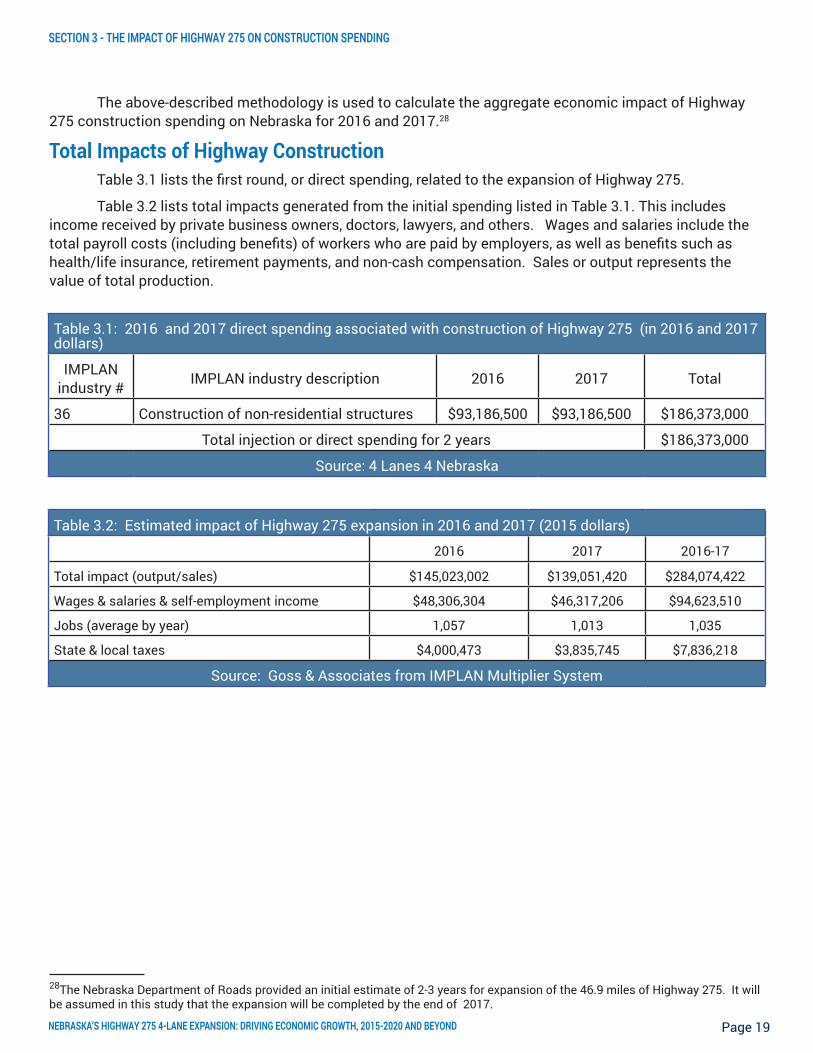
The above-described methodology is used to calculate the aggregate economic impact of Highway 275 construction spending on Nebraska for 2016 and 2017.28
Total Impacts of Highway Construction Table 3.1 lists the first round, or direct spending, related to the expansion of Highway 275.
Table 3.2 lists total impacts generated from the initial spending listed in Table 3.1. This includes income received by private business owners, doctors, lawyers, and others. Wages and salaries include the total payroll costs (including benefits) of workers who are paid by employers, as well as benefits such as health/life insurance, retirement payments, and non-cash compensation. Sales or output represents the value of total production.
28The Nebraska Department of Roads provided an initial estimate of 2-3 years for expansion of the 46.9 miles of Highway 275. It will be assumed in this study that the expansion will be completed by the end of 2017.
Table 3.1: 2016 and 2017 direct spending associated with construction of Highway 275 (in 2016 and 2017 dollars)
IMPLAN industry # IMPLAN industry description 2016 2017 Total
36 Construction of non-residential structures $93,186,500 $93,186,500 $186,373,000
Total injection or direct spending for 2 years $186,373,000
Source: 4 Lanes 4 Nebraska
Table 3.2: Estimated impact of Highway 275 expansion in 2016 and 2017 (2015 dollars)
2016 2017 2016-17
Total impact (output/sales) $145,023,002 $139,051,420 $284,074,422
Wages & salaries & self-employment income $48,306,304 $46,317,206 $94,623,510
Jobs (average by year) 1,057 1,013 1,035
State & local taxes $4,000,473 $3,835,745 $7,836,218
Source: Goss & Associates from IMPLAN Multiplier System

NEBRASKA’S HIGHWAY 275 4-LANE EXPANSION: DRIVING ECONOMIC GROWTH, 2015-2020 AND BEYOND Page 20
SECTION 3 - THE IMPACT OF HIGHWAY 275 ON CONSTRUCTION SPENDING
Impacts by Industry of Highway Construction Table 3.3 lists impacts by industry. Of course, the major beneficiary industries are those in which there will be direct highway spending. How-ever, the remainder of the industries listed in Table 3.3 received no direct highway spending. More than 355 of Nebraska’s 432 industries will experi-ence increases in revenues as a result of Highway 275 construction activity.
As presented, Nebraska’s Food Services will benefit from Highway 275 spending even though
there are no Highway 275 dollars spent directly in this industry. According to estimates, the spend-ing will support $1.2 million in self-employment income and wages and salaries, $1.9 million in sales, and 37 jobs for the food services industry. Even the state’s physicians will experience positive impacts. For 2016 and 2017, according to esti-mates , the Highway 275 spending will support $2.4 million in self-employment income and wages/sala-ries, $2.4 million in revenues for physician’s offices, and an average of 14 jobs.29
29Due to rounding, column details do not sum to column totals.
Table 3.3: Impact of 2016 and 2017 Highway 275 spending on Nebraska by industry16
Industry Jobs(average per year)
Wages, Salaries and self-employ-ment income
Total output or sales
Wages per job
Construction of other new non-residential structures
580 $54,211,286 $65,226,330 $46,723
Architectural, engineering, and related ser-vices
38 $5,764,832 $5,858,710 $75,558
Food services 37 $1,203,319 $1,860,429 $16,147
Wholesale trade businesses 18 $2,640,817 $4,686,837 $71,668
Offices of physicians, dentists, and other health practitioners
14 $2,360,604 $2,437,634 $82,152
Private hospitals 14 $1,611,089 $1,759,217 $59,217
Real estate establishments 13 $318,195 $2,302,501 $11,861
Retail Stores - Food and beverage 13 $629,104 $908,024 $23,962
Non-depository credit intermediation and related activities
13 $1,677,754 $1,911,806 $66,954
Retail Stores - General merchandise 12 $634,042 $988,005 $25,569
All other industries 282 $23,572,467 $41,232,978 $41,869
Total all industries 1,035 $94,623,510 $129,172,472 $45,715
Source: Goss & Associates estimates from IMPLAN Input-Output Multipliers
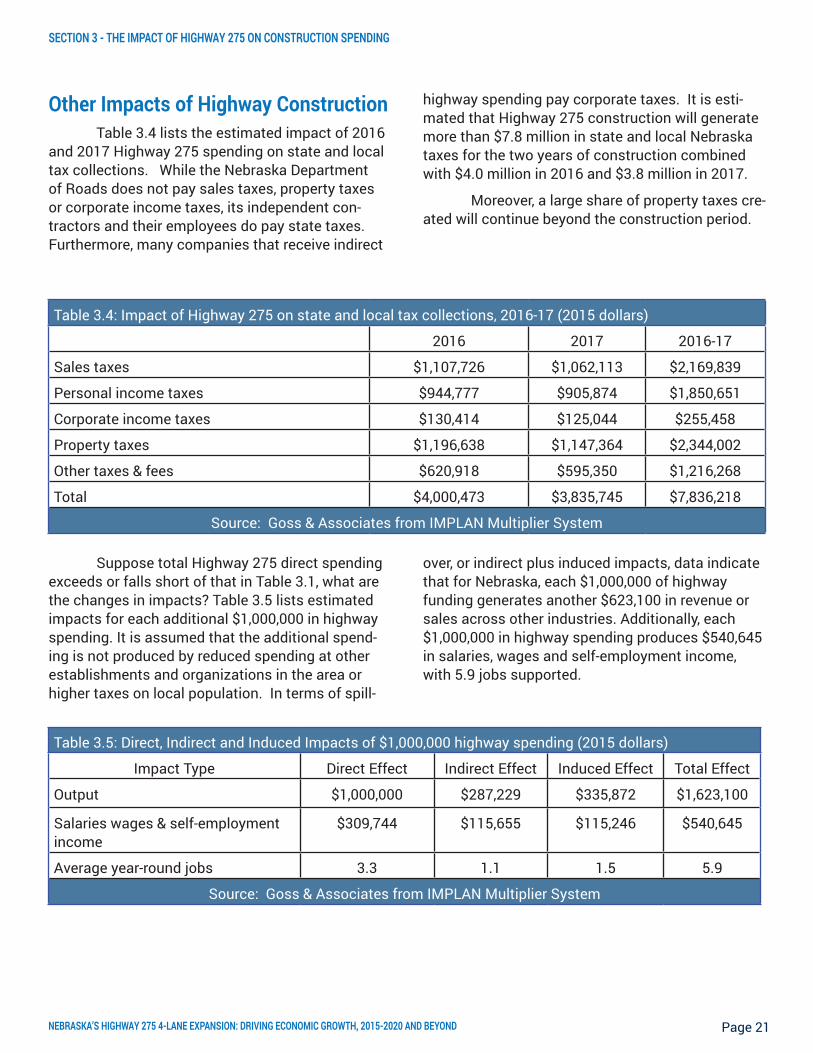
NEBRASKA’S HIGHWAY 275 4-LANE EXPANSION: DRIVING ECONOMIC GROWTH, 2015-2020 AND BEYOND Page 21
SECTION 3 - THE IMPACT OF HIGHWAY 275 ON CONSTRUCTION SPENDING
Other Impacts of Highway Construction Table 3.4 lists the estimated impact of 2016 and 2017 Highway 275 spending on state and local tax collections. While the Nebraska Department of Roads does not pay sales taxes, property taxes or corporate income taxes, its independent con-tractors and their employees do pay state taxes. Furthermore, many companies that receive indirect
highway spending pay corporate taxes. It is esti-mated that Highway 275 construction will generate more than $7.8 million in state and local Nebraska taxes for the two years of construction combined with $4.0 million in 2016 and $3.8 million in 2017.
Moreover, a large share of property taxes cre-ated will continue beyond the construction period.
Table 3.4: Impact of Highway 275 on state and local tax collections, 2016-17 (2015 dollars)
2016 2017 2016-17
Sales taxes $1,107,726 $1,062,113 $2,169,839
Personal income taxes $944,777 $905,874 $1,850,651
Corporate income taxes $130,414 $125,044 $255,458
Property taxes $1,196,638 $1,147,364 $2,344,002
Other taxes & fees $620,918 $595,350 $1,216,268
Total $4,000,473 $3,835,745 $7,836,218
Source: Goss & Associates from IMPLAN Multiplier System
Suppose total Highway 275 direct spending exceeds or falls short of that in Table 3.1, what are the changes in impacts? Table 3.5 lists estimated impacts for each additional $1,000,000 in highway spending. It is assumed that the additional spend-ing is not produced by reduced spending at other establishments and organizations in the area or higher taxes on local population. In terms of spill-
over, or indirect plus induced impacts, data indicate that for Nebraska, each $1,000,000 of highway funding generates another $623,100 in revenue or sales across other industries. Additionally, each $1,000,000 in highway spending produces $540,645 in salaries, wages and self-employment income, with 5.9 jobs supported.
Table 3.5: Direct, Indirect and Induced Impacts of $1,000,000 highway spending (2015 dollars)
Impact Type Direct Effect Indirect Effect Induced Effect Total Effect
Output $1,000,000 $287,229 $335,872 $1,623,100
Salaries wages & self-employment income
$309,744 $115,655 $115,246 $540,645
Average year-round jobs 3.3 1.1 1.5 5.9
Source: Goss & Associates from IMPLAN Multiplier System

NEBRASKA’S HIGHWAY 275 4-LANE EXPANSION: DRIVING ECONOMIC GROWTH, 2015-2020 AND BEYOND Page 22
SECTION 3 - THE IMPACT OF HIGHWAY 275 ON CONSTRUCTION SPENDING
Summary The preceding analyses indicate that construction of the Highway 275 expansion will have a signifi-cant and positive economic impact on the state. This impact does not consider the negative impact from funding this expansion via higher taxes on Nebraska citizens. To the degree that the expansion is funded by higher taxes on non-Nebraskans, by funds drawn from reserves, or by federal highway support, there will be no offsetting negative impacts.

CHI HEALTH INJECTS CASH AND GROWTH INTO NEBRASKA AND IOWA ECONOMIES Page 23
Section 4 - The Impact of Highway 275: Widening on Accidents
Section Highlights:• The Federal Highway Administration estimated
that conversion of a 2-lane highway to a 4-lane divided highway reduced vehicle crashes be-tween 40 and 60 percent.
• Average vehicle traffic on the 2-lane portion of Highway 275 proposed for conversion was:
o 69 percent higher than other 2-lane portions of Highway 275.
o 8 percent higher than current 4-lane portions of Highway 275.
• Average heavy truck traffic on the 2-lane portion of Highway 275 proposed for conversion was:
o 148 percent higher than other 2-lane portions of Highway 275.
o 32 percent higher than current 4-lane portions of Highway 275.
• Accidents per average daily traffic volume on the 2-lane portion of Highway 275 proposed for conversion were:
o 0.5 percent higher than other 2-lane portions of Highway 275 not slated for conversion.
o 152 percent higher than current 4-lane portions of Highway 275.
• Accidents per average heavy truck volume on the 2-lane portion of Highway 275 proposed for conversion were:
o 32 percent lower than other 2-lane portions of Highway 275 not slated for conversion.
o 107 percent higher than current 4-lane portions of Highway 275.
• Per year, it is estimated that the proposed expan-sion of Highway 275 will create $1.9 million in value to the Nebraska economy resulting from a reduction in the number of accidents.
• Over the first 15 years of operation, it is estimat-ed that the proposed expansion of Highway 275 will create $25.3 million in value (2015 dollars) to the Nebraska economy resulting from the reduction in the number of accidents.
Introduction Slower economic growth and fiscal austerity have encouraged government officials to turn away from new highway construction and embrace the conversion of 2-lane highways to 4-lane highways. One of the goals of this conversion is the reduction of vehicle accidents.
The Federal Highway Administration exam-ined crash data from the states of California, Michi-gan, North Carolina and Washington to determine the impact of the conversion of 2-lane highways to 4-lane highways on accidents.30 The findings of the researchers is contained in Table 4.1.
Data from 2012 indicate the variation in traf-fic intensity across Highway 275 and contained in Table 4.2. As indicated, the daily average of traffic intensity for the 46.9 miles of 2-lane highway to be converted was 5,672 for all vehicles and 907 for heavy trucks. For the portion of Highway 275 that will remain 2-lane, the average overall traffic count was 3,356 and was 364 for heavy trucks. The aver-age daily usage for the current 4-lane portion was 5,234 for all traffic and 689 for heavy trucks.
30“Council, F. and Stewart, R., Safety Effects of the Conversion of Rural Two-Lane Roadways to Four-Lane Roadways,” Federal Highway Administration, U.S. Department of Transportation, McLean, VA.
Table 4.1: The impact of roadway expansion from 2-lane to 4-lane
Type of expansion
Change in crashes per kilometer
2-lane to 4-lane undivided -20% to 0%
2-lane to 4-lane divided -60% to -40%
Source: Federal Highway Administration

CHI HEALTH INJECTS CASH AND GROWTH INTO NEBRASKA AND IOWA ECONOMIES Page 24
Data in Table 4.2 indicate that accidents per mile of highway, the portion to be converted, experienced a 76.4 percent higher accident rate than the 2-lanes that will not be converted, and a 24.7 percent higher accident rate than the current 4-lane portion of Highway 275.
According to the National Highway Traffic Safety Administration (NHTSA, 2014) there were 32,999 people killed, 3.9 million injured, and 24 million vehicles were damaged in motor vehicle crashes in the United States in 2010. NHTSA estimated the economic costs associ- ated with these accidents was $277 billion. Included in these losses are lost productivity, medical costs, legal and court costs, emergency service costs (EMS), insur- ance administration costs, traffic congestion costs, property damage, and workplace losses.31
Using a three percent discount rate, the NHTSA estimated that each vehicle fatality resulted in an average discounted lifetime cost of $1.9 million.
Table 4.3: Summary of NHTSA crash study, 2010
Totals Per crash
Number of motor vehicle crashes in 2010 13,600,000
Number of injured individuals 3,900,000 0.287
Cost borne by society $200,000,000,000 $14,706
Cost borne by businesses and individuals $77,000,000,000 $5,662
Total cost of crashes $277,000,000,000 $20,368
Discounted cost per fatality $1,900,000
Societal harm from vehicle crashes (economic+lost quality of life=cost per crash)
$870,800,000,000 $64,029
Source: National Highway Traffic Safety Administration (NHTSA)
31The Economic and Societal Impact of Motor Vehicle Crashes, 2010,” National Highway Traffic Safety Administration, DOT HS 812 013, May 2014. http://www-nrd.nhtsa.dot.gov/Pubs/812013.pdf
Data in Table 4.2 indicate that accidents per mile of highway, the portion to be converted, experienced a 76.4 percent higher accident rate than the 2-lane portion that will not be converted and a 24.7 percent higher accident rate than the current 4-lane portion of Highway 275.
Table 4.2: Accidents for Highway 275 (2012)
Portion MileageDaily traffic count Accidents
All vehicles Heavy trucks Total Per Mile
2-lane to be converted 46.9 5,672 907 90 1.92
Remaining 2-lanes 48.7 3,356 364 53 1.09
4-lane 21.4 5,234 689 33 1.54
Source: Goss & Associates calculations based on NDOR data
SECTION 4 - THE IMPACT OF HIGHWAY 275 WIDENING ON ACCIDENTS
CHI HEALTH INJECTS CASH AND GROWTH INTO NEBRASKA AND IOWA ECONOMIES Page 25
Data in Table 4.2 indicate that accidents per mile of highway, the portion to be converted, experienced a 76.4 percent higher accident rate than the 2-lanes that will not be converted, and a 24.7 percent higher accident rate than the current 4-lane portion of Highway 275.
According to the National Highway Traffic Safety Administration (NHTSA, 2014) there were 32,999 people killed, 3.9 million injured, and 24 million vehicles were damaged in motor vehicle crashes in the United States in 2010. NHTSA estimated the economic costs associ- ated with these accidents was $277 billion. Included in these losses are lost productivity, medical costs, legal and court costs, emergency service costs (EMS), insur- ance administration costs, traffic congestion costs, property damage, and workplace losses.31
Using a three percent discount rate, the NHTSA estimated that each vehicle fatality resulted in an average discounted lifetime cost of $1.9 million.
Table 4.3: Summary of NHTSA crash study, 2010
Totals Per crash
Number of motor vehicle crashes in 2010 13,600,000
Number of injured individuals 3,900,000 0.287
Cost borne by society $200,000,000,000 $14,706
Cost borne by businesses and individuals $77,000,000,000 $5,662
Total cost of crashes $277,000,000,000 $20,368
Discounted cost per fatality $1,900,000
Societal harm from vehicle crashes (economic+lost quality of life=cost per crash)
$870,800,000,000 $64,029
Source: National Highway Traffic Safety Administration (NHTSA)
31The Economic and Societal Impact of Motor Vehicle Crashes, 2010,” National Highway Traffic Safety Administration, DOT HS 812 013, May 2014. http://www-nrd.nhtsa.dot.gov/Pubs/812013.pdf
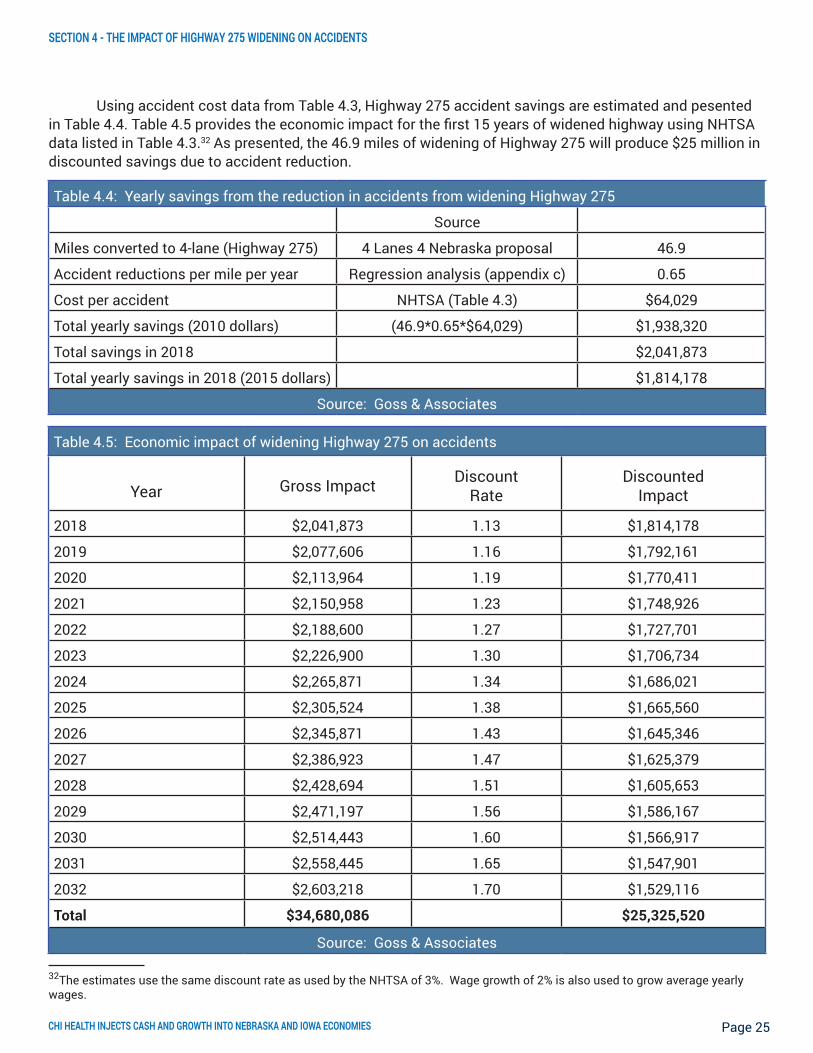
Using accident cost data from Table 4.3, Highway 275 accident savings are estimated and pesented in Table 4.4. Table 4.5 provides the economic impact for the first 15 years of widened highway using NHTSA data listed in Table 4.3.32 As presented, the 46.9 miles of widening of Highway 275 will produce $25 million in discounted savings due to accident reduction.
32The estimates use the same discount rate as used by the NHTSA of 3%. Wage growth of 2% is also used to grow average yearly wages.
Table 4.2: Accidents for Highway 275 (2012)
Portion MileageDaily traffic count Accidents
All vehicles Heavy trucks Total Per Mile
2-lane to be converted 46.9 5,672 907 90 1.92
Remaining 2-lanes 48.7 3,356 364 53 1.09
4-lane 21.4 5,234 689 33 1.54
Source: Goss & Associates calculations based on NDOR data
SECTION 4 - THE IMPACT OF HIGHWAY 275 WIDENING ON ACCIDENTS
Table 4.4: Yearly savings from the reduction in accidents from widening Highway 275
Source
Miles converted to 4-lane (Highway 275) 4 Lanes 4 Nebraska proposal 46.9
Accident reductions per mile per year Regression analysis (appendix c) 0.65
Cost per accident NHTSA (Table 4.3) $64,029
Total yearly savings (2010 dollars) (46.9*0.65*$64,029) $1,938,320
Total savings in 2018 $2,041,873
Total yearly savings in 2018 (2015 dollars) $1,814,178
Source: Goss & Associates
Table 4.5: Economic impact of widening Highway 275 on accidents
Year Gross Impact DiscountRate
DiscountedImpact
2018 $2,041,873 1.13 $1,814,178
2019 $2,077,606 1.16 $1,792,161
2020 $2,113,964 1.19 $1,770,411
2021 $2,150,958 1.23 $1,748,926
2022 $2,188,600 1.27 $1,727,701
2023 $2,226,900 1.30 $1,706,734
2024 $2,265,871 1.34 $1,686,021
2025 $2,305,524 1.38 $1,665,560
2026 $2,345,871 1.43 $1,645,346
2027 $2,386,923 1.47 $1,625,379
2028 $2,428,694 1.51 $1,605,653
2029 $2,471,197 1.56 $1,586,167
2030 $2,514,443 1.60 $1,566,917
2031 $2,558,445 1.65 $1,547,901
2032 $2,603,218 1.70 $1,529,116
Total $34,680,086 $25,325,520
Source: Goss & Associates
NEBRASKA’S HIGHWAY 275 4-LANE EXPANSION: DRIVING ECONOMIC GROWTH, 2015-2020 AND BEYOND Page 26
Section Highlights:• 1,378 commuters currently travel on the pro-
posed Highway 275 expansion section and would immediately benefit from decreased daily-commute times.
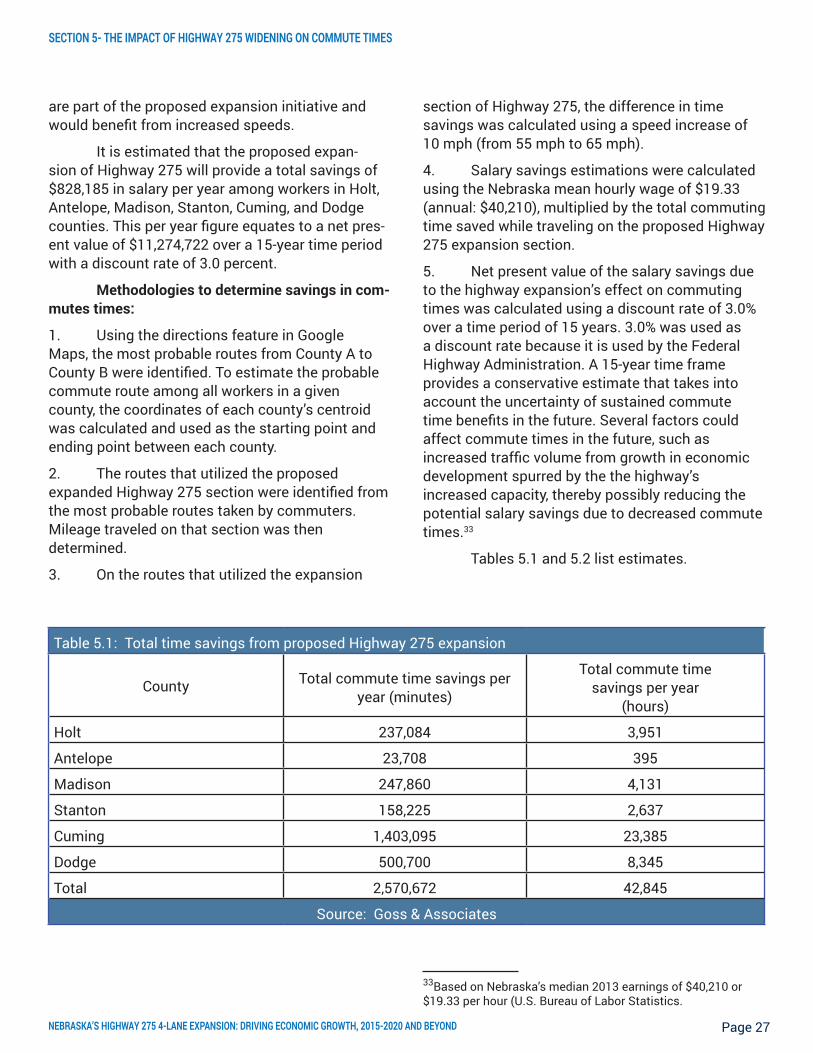
• Total time savings per year for commuters originating in the counties analyzed would be 2,570,672 minutes (42,845 hours).
• Total savings in salary per year from decreased commute times for workers originating in the counties of Holt, Antelope, Madison, Stanton, Cuming, and Dodge would be $828,185 for 2018.
• The value of savings in salary from faster com-mute times would be $11,274,722 over a period of 15 years.
Overview of commute time analysis:Impacts on commute time:
Trucking
• Shortened delivery trips to large metropolitan areas, e.g. Omaha.
• Increased driving speed, shortened trips.
• Shorter trips and ease of delivery resulting in lower freight charges to for-hire truck compa-nies, saving manufacturers money on delivery fees.
• Companies that produce perishable items see improved reliability measures due to shorter travel times and ease of delivery.
Service Sector Impact:
• Repair shops and agricultural businesses will find faster travel times beneficial to reaching customers sooner.
• Improved access for customers.
Commuting Workers Impact:
• Employees will get to jobs in a faster, more safe manner.
• Some commuters will take the 4-lane highway for its safety benefits over a shorter distance route.
• Downtown driving will be less congested.
This commute time analysis was performed using the present day environment, taking into account only the expansion of Highway 275 from two lanes to four lanes. The actual future economic benefit, based on commute time savings particu-larly, will be dependent on the broader effects of an expanded highway in the region, which could spur increases in traffic volume and the number of work-ers utilizing Highway 275 for their daily commute.
In this analysis the average commute times were calculated for all workers in the six counties identified. This includes both workers who stay near home and workers who travel long distances for their daily commute.
Among the six counties analyzed, commut-ing patterns show that 79.7 percent of workers live and work in the same county, whereas 20.3 percent commute to a different county from that in which they live. The six counties contain 51,220 total work-ers, which consists of 40,832 workers that live and work in the same county and 10,388 workers that commute out-of-county. Of the 10,388 out-of-county commuters, 1,378 currently take a route that utilizes the proposed highway expansion section and would directly benefit from shorter commute times.
The counties of Holt, Antelope, Madison, Stanton, Cuming, and Dodge had a total of 51,220 workers with an average commute time of 16.18 minutes (16 min 10.8 sec). The proposed expansion of Highway 275 would decrease average commute time per worker in the Highway 275 counties by 0.10 minutes (6.0 sec), reducing the average com-mute time to 16.08 minutes. The county with the highest reduction in commute time would be Cum-ing County, with an estimated per commute savings of 0.60 minutes (36 sec). This is not unexpected, since all sections of Highway 275 in Cuming County
Section 5 - The Impact of Highway 275 Widening on Commute Times
NEBRASKA’S HIGHWAY 275 4-LANE EXPANSION: DRIVING ECONOMIC GROWTH, 2015-2020 AND BEYOND Page 27
SECTION 5- THE IMPACT OF HIGHWAY 275 WIDENING ON COMMUTE TIMES
are part of the proposed expansion initiative and would benefit from increased speeds.
It is estimated that the proposed expan-sion of Highway 275 will provide a total savings of $828,185 in salary per year among workers in Holt, Antelope, Madison, Stanton, Cuming, and Dodge counties. This per year figure equates to a net pres-ent value of $11,274,722 over a 15-year time period with a discount rate of 3.0 percent.
Methodologies to determine savings in com-mutes times:
1. Using the directions feature in Google Maps, the most probable routes from County A to County B were identified. To estimate the probable commute route among all workers in a given county, the coordinates of each county’s centroid was calculated and used as the starting point and ending point between each county.
2. The routes that utilized the proposed expanded Highway 275 section were identified from the most probable routes taken by commuters. Mileage traveled on that section was then determined.
3. On the routes that utilized the expansion
section of Highway 275, the difference in time savings was calculated using a speed increase of 10 mph (from 55 mph to 65 mph).
4. Salary savings estimations were calculated using the Nebraska mean hourly wage of $19.33 (annual: $40,210), multiplied by the total commuting time saved while traveling on the proposed Highway 275 expansion section.
5. Net present value of the salary savings due to the highway expansion’s effect on commuting times was calculated using a discount rate of 3.0% over a time period of 15 years. 3.0% was used as a discount rate because it is used by the Federal Highway Administration. A 15-year time frame provides a conservative estimate that takes into account the uncertainty of sustained commute time benefits in the future. Several factors could affect commute times in the future, such as increased traffic volume from growth in economic development spurred by the the highway’s increased capacity, thereby possibly reducing the potential salary savings due to decreased commute times.33
Tables 5.1 and 5.2 list estimates.
33Based on Nebraska’s median 2013 earnings of $40,210 or $19.33 per hour (U.S. Bureau of Labor Statistics.
Table 5.1: Total time savings from proposed Highway 275 expansion
County Total commute time savings per year (minutes)
Total commute time savings per year
(hours)
Holt 237,084 3,951
Antelope 23,708 395
Madison 247,860 4,131
Stanton 158,225 2,637
Cuming 1,403,095 23,385
Dodge 500,700 8,345
Total 2,570,672 42,845
Source: Goss & Associates

NEBRASKA’S HIGHWAY 275 4-LANE EXPANSION: DRIVING ECONOMIC GROWTH, 2015-2020 AND BEYOND Page 28
SECTION 5 - THE IMPACT OF HIGHWAY 275 WIDENING ON COMMUTE TIMES
Table 5.2: Salary savings from decreased commute times23
County Salary savings per year NPV (discount rate = 3%; time period = 15 yrs.)
Holt $76,381 $1,039,834
Antelope $7,638 $103,983
Madison $79,852 $1,087,096
Stanton $50,974 $693,962
Cuming $452,030 $6,153,866
Dodge $161,308 $2,196,030
Total $828,185 $11,274,772
Source: Goss & Associates
Table 5.3 provides details of economic savings from reduced commute time by year.
Table 5.3: Impact of Highway 275 on the reduction in commute time
Year Gross impact Discounted impact
2018 $828,185 $804,063
2019 $844,749 $796,257
2020 $861,644 $788,526
2021 $878,877 $780,870
2022 $896,454 $773,289
2023 $914,383 $765,782
2024 $932,671 $758,347
2025 $951,324 $750,984
2026 $970,351 $743,693
2027 $989,758 $736,473
2028 $1,009,553 $729,322
2029 $1,029,744 $722,242
2030 $1,050,339 $715,230
2031 $1,071,346 $708,286
2032 $1,092,773 $701,409
Total discounted impact $11,274,772
Source: Goss & Associates

Table 5.2: Salary savings from decreased commute times23
County Salary savings per year NPV (discount rate = 3%; time period = 15 yrs.)
Holt $76,381 $1,039,834
Antelope $7,638 $103,983
Madison $79,852 $1,087,096
Stanton $50,974 $693,962
Cuming $452,030 $6,153,866
Dodge $161,308 $2,196,030
Total $828,185 $11,274,772
Source: Goss & Associates
NEBRASKA’S HIGHWAY 275 4-LANE EXPANSION: DRIVING ECONOMIC GROWTH, 2015-2020 AND BEYOND Page 29
SECTION 5 - THE IMPACT OF HIGHWAY 275 WIDENING ON COMMUTE TIMES
Of course, during construction, commute times are expected to rise. Table 5.4 details those economic costs. It is assumed that due to construction, average speeds are reduced from 55 mph to 45 mph. This increase in commute times is estimated to cost $1.7 million.
Figures 5.1 through 5.7 summarize commuting patterns (journey-to-work) for all six Highway 275 counties.
Table 5.4: Estimated costs of increase in commute times due to construction
Year Salary Savings Growth at 2% NPV at 3.0% Discount Rate
2016 $828,185 $804,063
2017 $844,749 $796,257
Total $1,672,934 $1,600,320
Source: Goss & Associates
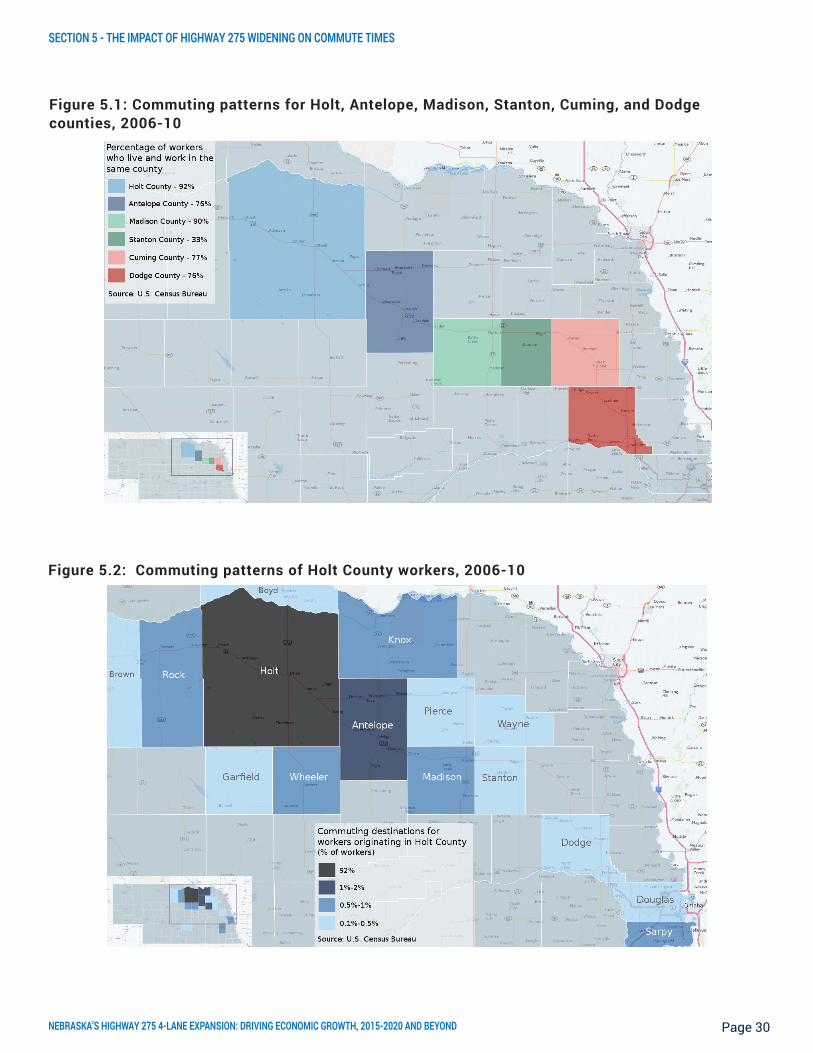
NEBRASKA’S HIGHWAY 275 4-LANE EXPANSION: DRIVING ECONOMIC GROWTH, 2015-2020 AND BEYOND Page 30
SECTION 5 - THE IMPACT OF HIGHWAY 275 WIDENING ON COMMUTE TIMES
Figure 5.1: Commuting patterns for Holt, Antelope, Madison, Stanton, Cuming, and Dodge counties, 2006-10
Figure 5.2: Commuting patterns of Holt County workers, 2006-10

NEBRASKA’S HIGHWAY 275 4-LANE EXPANSION: DRIVING ECONOMIC GROWTH, 2015-2020 AND BEYOND Page 31
SECTION 5 - THE IMPACT OF HIGHWAY 275 WIDENING ON COMMUTE TIMES
Figure 5.3: Commuting patterns of Antelope County workers, 2006-10
Figure 5.4: Commuting patterns of Madison Country workers, 2006-10

NEBRASKA’S HIGHWAY 275 4-LANE EXPANSION: DRIVING ECONOMIC GROWTH, 2015-2020 AND BEYOND Page 32
SECTION 5 - THE IMPACT OF HIGHWAY 275 WIDENING ON COMMUTE TIMES
Figure 5.5: Commuting patterns of Stanton County workers, 2006-10
Figure 5.6: Commuting patterns of Cuming County workers, 2006-10

NEBRASKA’S HIGHWAY 275 4-LANE EXPANSION: DRIVING ECONOMIC GROWTH, 2015-2020 AND BEYOND Page 33
SECTION 5 - THE IMPACT OF HIGHWAY 275 WIDENING ON COMMUTE TIMES
Figure 5.7: Commuting patterns of Dodge County workers, 2006-10
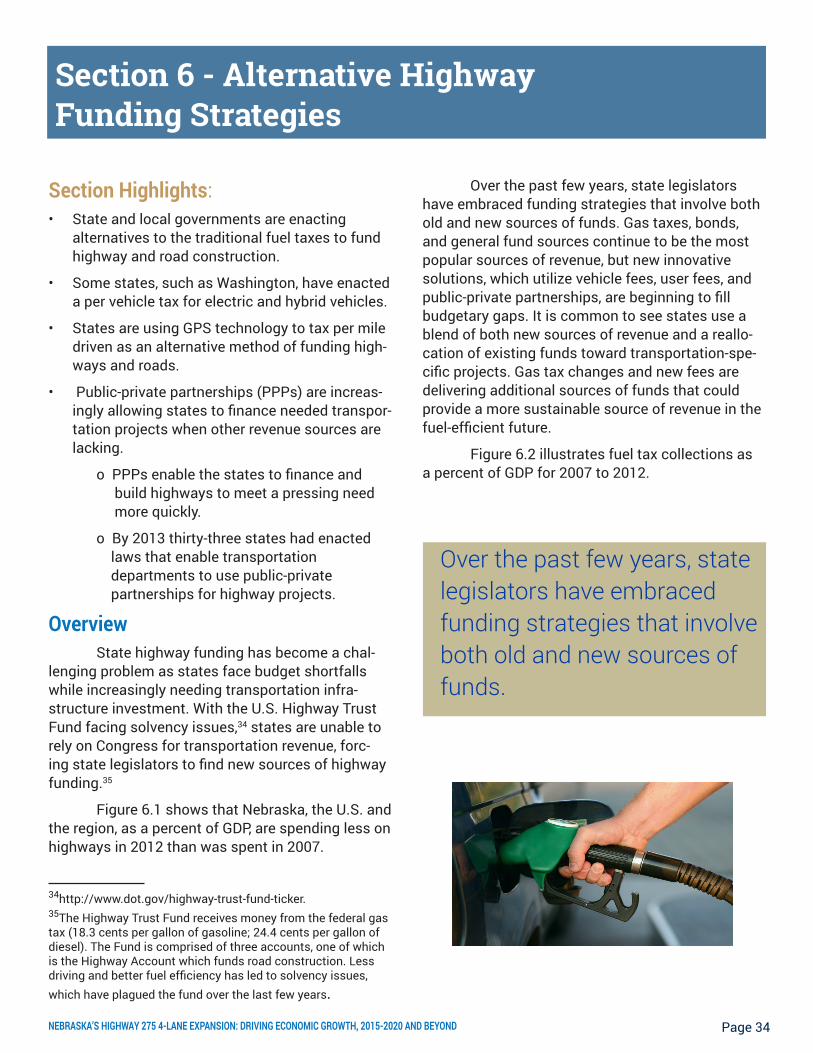
NEBRASKA’S HIGHWAY 275 4-LANE EXPANSION: DRIVING ECONOMIC GROWTH, 2015-2020 AND BEYOND Page 34
Section Highlights:• State and local governments are enacting
alternatives to the traditional fuel taxes to fund highway and road construction.
• Some states, such as Washington, have enacted a per vehicle tax for electric and hybrid vehicles.
• States are using GPS technology to tax per mile driven as an alternative method of funding high-ways and roads.
• Public-private partnerships (PPPs) are increas-ingly allowing states to finance needed transpor-tation projects when other revenue sources are lacking.
o PPPs enable the states to finance and build highways to meet a pressing need more quickly.
o By 2013 thirty-three states had enacted laws that enable transportation departments to use public-private partnerships for highway projects.
Overview State highway funding has become a chal-lenging problem as states face budget shortfalls while increasingly needing transportation infra-structure investment. With the U.S. Highway Trust Fund facing solvency issues,34 states are unable to rely on Congress for transportation revenue, forc-ing state legislators to find new sources of highway funding.35
Figure 6.1 shows that Nebraska, the U.S. and the region, as a percent of GDP, are spending less on highways in 2012 than was spent in 2007.
34http://www.dot.gov/highway-trust-fund-ticker.35The Highway Trust Fund receives money from the federal gas tax (18.3 cents per gallon of gasoline; 24.4 cents per gallon of diesel). The Fund is comprised of three accounts, one of which is the Highway Account which funds road construction. Less driving and better fuel efficiency has led to solvency issues, which have plagued the fund over the last few years.
Over the past few years, state legislators have embraced funding strategies that involve both old and new sources of funds. Gas taxes, bonds, and general fund sources continue to be the most popular sources of revenue, but new innovative solutions, which utilize vehicle fees, user fees, and public-private partnerships, are beginning to fill budgetary gaps. It is common to see states use a blend of both new sources of revenue and a reallo-cation of existing funds toward transportation-spe-cific projects. Gas tax changes and new fees are delivering additional sources of funds that could provide a more sustainable source of revenue in the fuel-efficient future.
Figure 6.2 illustrates fuel tax collections as a percent of GDP for 2007 to 2012.
Section 6 - Alternative Highway Funding Strategies
Over the past few years, state legislators have embraced funding strategies that involve both old and new sources of funds.
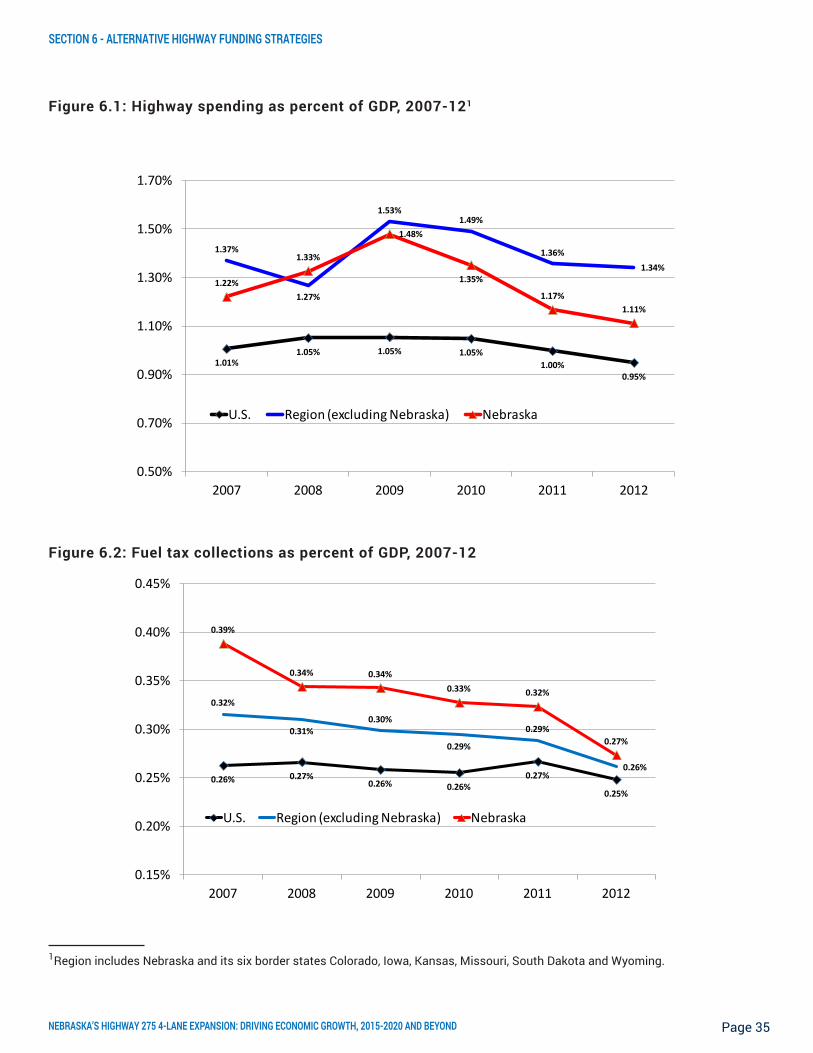
NEBRASKA’S HIGHWAY 275 4-LANE EXPANSION: DRIVING ECONOMIC GROWTH, 2015-2020 AND BEYOND Page 35
1.01%1.05% 1.05% 1.05%
1.00%0.95%
1.37%
1.27%
1.53%1.49%
1.36%1.34%
1.22%
1.33%
1.48%
1.35%
1.17%1.11%
0.50%
0.70%
0.90%
1.10%
1.30%
1.50%
1.70%
2007 2008 2009 2010 2011 2012
U.S. Region (excluding Nebraska) Nebraska
Figure 6.1: Highway spending as percent of GDP, 2007-121
1Region includes Nebraska and its six border states Colorado, Iowa, Kansas, Missouri, South Dakota and Wyoming.
Figure 6.2: Fuel tax collections as percent of GDP, 2007-12
0.26% 0.27%0.26% 0.26%
0.27%
0.25%
0.32%
0.31%0.30%
0.29%
0.29%
0.26%
0.39%
0.34% 0.34%0.33% 0.32%
0.27%
0.15%
0.20%
0.25%
0.30%
0.35%
0.40%
0.45%
2007 2008 2009 2010 2011 2012
U.S. Region (excluding Nebraska) Nebraska
SECTION 6 - ALTERNATIVE HIGHWAY FUNDING STRATEGIES

NEBRASKA’S HIGHWAY 275 4-LANE EXPANSION: DRIVING ECONOMIC GROWTH, 2015-2020 AND BEYOND Page 36
SECTION 6 - ALTERNATIVE HIGHWAY FUNDING STRATEGIES
Adjustments to Gas Taxes. Several states have made adjustments to gas taxes. In Wyoming, a 10 cent increase in gas tax is estimated to gener-ate $70 million in extra revenue that will specifically benefit highways. In New Hampshire, a four cent gas tax increase will be allocated to bridge repair projects in a two-year time frame.36 It is common to see gas tax legislation pass successfully when addi-tional revenues are directed toward specific projects over a set amount of time.
Virginia is taking a different approach to gas taxes by eliminating them entirely. In 2013 the state enacted a bill that removed the per gallon gas tax and replaced it with an increase in sales tax, while also adding a 3.5% tax on wholesale gas transac-tions.37
The rationale for eliminating per gallon gas taxes, and increasing other sources of revenue, stems from the fact that cars are becoming more fuel efficient and people are driving less overall. State planners are suggesting that per gallon gas taxes will become a less sustainable source of transportation funding in the future, especially with the Obama Administration’s increased efficiency standards.38 People are also driving less, with sta-tistics showing a leveling off of miles traveled since the recession in 2008.39
36http://t4america.org/maps-tools/state-transportation-fund-ing/37http://t4america.org/maps-tools/state-transportation-fund-ing/38The Obama Administration has introduced new standards that require 54.5 mpg for cars and light trucks by 2025. (http://www.whitehouse.gov/the-press-office/2012/08/28/obama-ad-ministration-finalizes-historic-545-mpg-fuel-efficiency-standard)39Duntzik, T., Baxandall, Phineas. http://uspirg.org/sites/pirg/files/reports/A%20New%20Direction%20vUS.pdf
Vehicle Fees. With efficiency considerations in mind, states are looking toward vehicle fees for additional revenue, and, in some cases, are intro-ducing new fees on fuel efficient cars. Vehicle fees ensure a predictable revenue source to offset the reduction in gas tax revenue.
States that have already introduced ad-ditional fees specifically on fuel efficient vehicles include Colorado, Nebraska, North Carolina, and Washington. Several other states are looking to add similar legislation as well. These fees ensure a predictable source of transportation revenue to offset the declining gas tax revenue in the future. Wisconsin is considering the electric vehicle fee for 2016,40 while the state of Washington has added a $100 fee to electric car owners.41
Fees on electric and hybrid cars could po-tentially be politically contentious revenue sources, having already led to pushback from both fuel ef-ficient car owners and from politicians who pro-mote green initiatives. For example, when Virginia considered the $100 annual fee to hybrid owners, a protest was held at the Virginia Capitol Build-ing because the fees would be added to cars they had already purchased.42 The new electric vehicle fee was signed into law by Virginia Governor Bob McDonnell in 2013. However, in 2014, new Virginia Governor Terry McAuliffe repealed it.43
Vehicle Miles Traveled Fees. Interest in a tax or fee based on vehicle miles traveled is also gain-ing momentum as a possible solution for revenue shortfalls.44 Vehicle Miles Traveled (VMT) fees are
40http://www.jsonline.com/business/wisconsin-would-join-electric-car-tax-trend-b99392257z1-282962321.html41http://seattletimes.com/html/localnews/2019981088_elec-riccars25.html42http://www.huffingtonpost.com/2013/02/20/virginia-hybrid-fees_n_2727142.html43http://www.usatoday.com/story/money/cars/2013/04/28/hybrid-taxes-gas-tax-highway-funding/2110297/44http://www.fhwa.dot.gov/ipd/revenue/road_pricing/defined/
State planners are suggesting that per gallon gas taxes will become a less sustainable source of transportation funding in the future.
Vehicle fees ensure a predictable revenue source to offset the reduction in gas tax revenue.

NEBRASKA’S HIGHWAY 275 4-LANE EXPANSION: DRIVING ECONOMIC GROWTH, 2015-2020 AND BEYOND Page 37
based on distance traveled using some type of tracking device installed in the car. New initiatives in Oregon are set to begin in mid 2015, with 5,000 vol-unteer drivers enrolled in a pilot program in which they pay 1.5 cents per mile and are issued a gas tax credit.45 Illinois has implemented a limited VMT fee on trucks.46
The VMT fee is calculated using a GPS tracking device that tracks the roads driven on and calculates distances. The efficiency and accuracy of such a system is well-regarded, but concerns of privacy, particularly because of the GPS tracking capabilities, must be reconciled before large-scale adoption can be achieved.47
Highway Bonds. In 2014, a Nebraska bond-ing bill fell short of passage by three votes, leav-ing Nebraska and Wyoming as the only two states that currently do not allow bonding for highway construction. However, bonding remains a viable resource in terms of expediting important roads projects, and as such, should be an option when considering funding strategies.
Public-Private Partnerships. Public-private partnerships (PPPs) are increasingly allowing states to finance needed transportation projects where other revenue sources are lacking. PPPs enable the capacity to finance and build highways to meet a pressing need, rather than wait for funds to accu-mulate over several years through traditional state funding sources.
According to the Colorado Department of Transportation, their US-36 highway project is being completed two decades earlier because of a PPP arrangement.48 In states that do not enter into PPP agreements, legislation is currently focused on au-thorizing state departments to seek out these part-nerships within an efficient framework that protects the interests of the citizens.
vmt.aspx45http://www.nlc.org/media-center/news-search/oregon%E2%80%99s-vmt-pilot-to-begin-its-third-phase-road-usage-charge-program-update46http://www.cyberdriveillinois.com/departments/vehicles/cft/fees.html47http://www.citylab.com/tech/2011/11/are-road-use-fees-just-too-creepy-to-work/506/48https://www.codot.gov/projects/US36ExpressLanes/update-on-us-36-public-private-partnership-understanding-the-facts
For example, Arizona enacted HB 2396 which granted the Department of Transportation the ability to pursue a wider range of more immedi-ate projects. Maryland’s legislature enacted formal guidelines for the use of PPPs, making the process more efficient and transparent for potential part-ners. Florida modified its current rules on PPPs,
allowing broader use for projects, while implement-ing safeguards to protect public interests.49
The benefits of PPPs can vary, but structur-ally they provide efficiencies in project initiation and project management. PPPs can be initiated more quickly compared to the pay-as-you-go model used with traditional state financing. Pay-as-you-go models wait until enough funds are generated from gas taxes or other allocated sources of funds before the project can be initiated.50
The benefits of PPP projects vary with the type and scale of the project, but according to the Federal Highway Administration, overall cost sav-ings have materialized through properly-aligned incentives and greater efficiencies from more expertise and better management.51
Funding sources can vary depending on the type of PPP project. One interesting source has been highway tolls, which have been used to finance the debt of PPP projects with various degrees of success. The Colorado US-36 project is utilizing modern toll systems that allow traffic to flow continuously.52 The
49Reed (2014) Reed, J., “The Growing Use of Transportation Public-Private Partnerships”, National Conference of State Legislators, May 201450Ybarra and Gilroy (2009)51 “Report to Congress on Public-Private Partnerships”, United States Department of Transportation, Dec. 2004. 52https://www.codot.gov/projects/US36ExpressLanes/update-on-us-36-public-private-partnership-understanding-the-facts https://www.codot.gov/projects/US36ExpressLanes
SECTION 6 - ALTERNATIVE HIGHWAY FUNDING STRATEGIES
According to the Colorado Department of Transportation, their US-36 highway project is being completed two decades earlier because of a PPP arrangement.

NEBRASKA’S HIGHWAY 275 4-LANE EXPANSION: DRIVING ECONOMIC GROWTH, 2015-2020 AND BEYOND Page 38
expanded highway will reduce the bus trip between Boul-der and Denver by about 24 minutes — even during the peak morning commute — compared to 52 minutes using the general purpose lanes before project construction began.53
In Colorado’s PPP, the tolls collected go to the following obligations, in this order of priority:
1. Maintaining and operating the highway.
2. Paying off bonds and other project debts.
3. Returning equity to the private partner.
4. Earning return-on-equity for the private partner.
5. Any additional revenues are split between Colorado Department of Transportation and the private partner for re-investment in the US-36 corridor.
The popularity of PPPs is rising among states. In 2006, 23 states had constructed the legislative frame-work that allowed for transportation-related PPPs. By 2013 thirty-three states had enacted laws that enable transportation departments to use public-private partner-ships for highway projects; up from 29 states in 2010.54 It is estimated that about $30 billion has been committed to PPP projects in the last five years.55
Nebraska is not among the 33 states that en-able these financial arrangements. This issue, however,
53http://flatironbike.com/2014/02/14/us-36-for-whom-the-road-tolls/54Rall (2014)55Reed (2014) Reed, J., “The Growing Use of Transportation Public-Private Partnerships”, National Conference of State Legislators, May 2014.
SECTION 6 - ALTERNATIVE HIGHWAY FUNDING STRATEGIES
It is estimated that about $30 billion has been committed to PPP projects in the last five years.
has been discussed among interested parties, and economic development groups have recommended enabling legislation. According to the Platte In-stitute for Economic Research, there are ample opportunities to utilize public-private partnerships in Nebraska. This organization has recommended that the state consider this financing option for several of the large projects that could potentially be underfuned.
Funding Source Breakdown56
Figure 6.3 profiles the change in the source of funds for highway construction and maintence. As presented, funding for highways via general funds has grown.
Figures 6.4 and 6.5 show the source of lo-cal highway funding. As presented, Nebraska local spending depends much more heavily on spending supported by the general fund.
56Ohlms (2014), p. 15
Figure 6.3 Local government funding sources for highway projects in the United States, 2002-2011
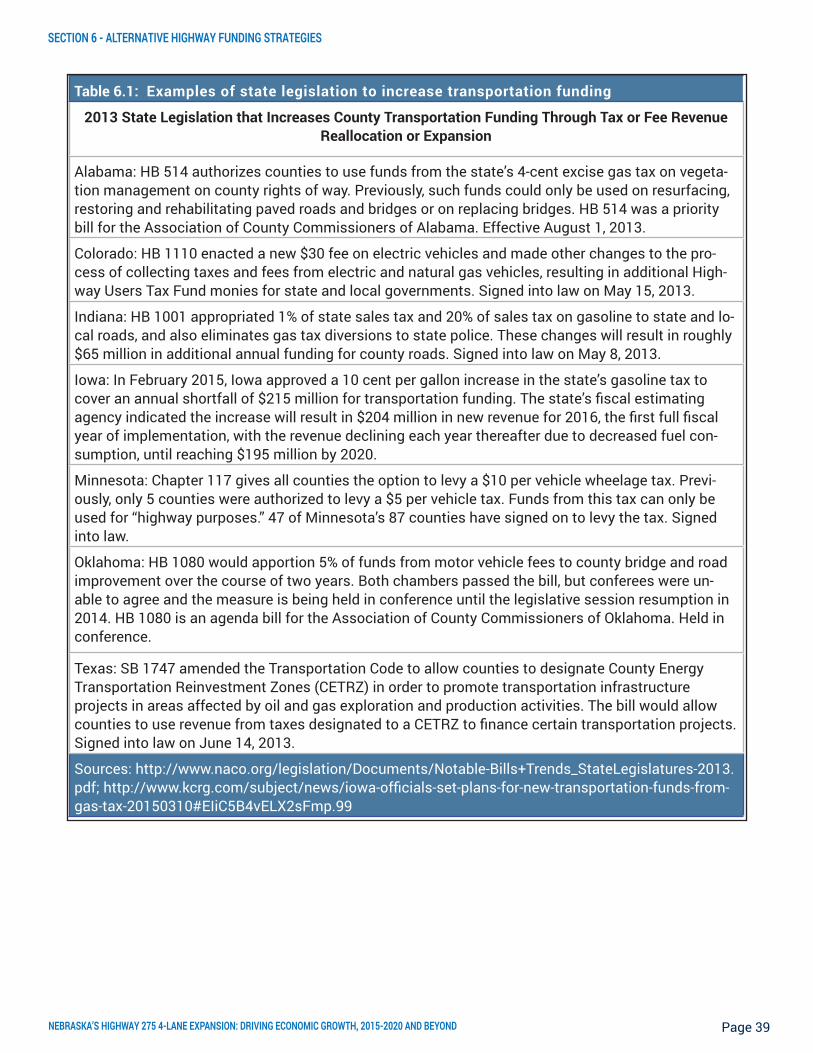
NEBRASKA’S HIGHWAY 275 4-LANE EXPANSION: DRIVING ECONOMIC GROWTH, 2015-2020 AND BEYOND Page 39
SECTION 6 - ALTERNATIVE HIGHWAY FUNDING STRATEGIES
Table 6.1: Examples of state legislation to increase transportation funding
2013 State Legislation that Increases County Transportation Funding Through Tax or Fee Revenue Reallocation or Expansion
Alabama: HB 514 authorizes counties to use funds from the state’s 4-cent excise gas tax on vegeta-tion management on county rights of way. Previously, such funds could only be used on resurfacing, restoring and rehabilitating paved roads and bridges or on replacing bridges. HB 514 was a priority bill for the Association of County Commissioners of Alabama. Effective August 1, 2013.
Colorado: HB 1110 enacted a new $30 fee on electric vehicles and made other changes to the pro-cess of collecting taxes and fees from electric and natural gas vehicles, resulting in additional High-way Users Tax Fund monies for state and local governments. Signed into law on May 15, 2013.
Indiana: HB 1001 appropriated 1% of state sales tax and 20% of sales tax on gasoline to state and lo-cal roads, and also eliminates gas tax diversions to state police. These changes will result in roughly $65 million in additional annual funding for county roads. Signed into law on May 8, 2013.
Iowa: In February 2015, Iowa approved a 10 cent per gallon increase in the state’s gasoline tax to cover an annual shortfall of $215 million for transportation funding. The state’s fiscal estimating agency indicated the increase will result in $204 million in new revenue for 2016, the first full fiscal year of implementation, with the revenue declining each year thereafter due to decreased fuel con-sumption, until reaching $195 million by 2020.
Minnesota: Chapter 117 gives all counties the option to levy a $10 per vehicle wheelage tax. Previ-ously, only 5 counties were authorized to levy a $5 per vehicle tax. Funds from this tax can only be used for “highway purposes.” 47 of Minnesota’s 87 counties have signed on to levy the tax. Signed into law.
Oklahoma: HB 1080 would apportion 5% of funds from motor vehicle fees to county bridge and road improvement over the course of two years. Both chambers passed the bill, but conferees were un-able to agree and the measure is being held in conference until the legislative session resumption in 2014. HB 1080 is an agenda bill for the Association of County Commissioners of Oklahoma. Held in conference.
Texas: SB 1747 amended the Transportation Code to allow counties to designate County Energy Transportation Reinvestment Zones (CETRZ) in order to promote transportation infrastructure projects in areas affected by oil and gas exploration and production activities. The bill would allow counties to use revenue from taxes designated to a CETRZ to finance certain transportation projects. Signed into law on June 14, 2013.
Sources: http://www.naco.org/legislation/Documents/Notable-Bills+Trends_StateLegislatures-2013.pdf; http://www.kcrg.com/subject/news/iowa-officials-set-plans-for-new-transportation-funds-from-gas-tax-20150310#EIiC5B4vELX2sFmp.99
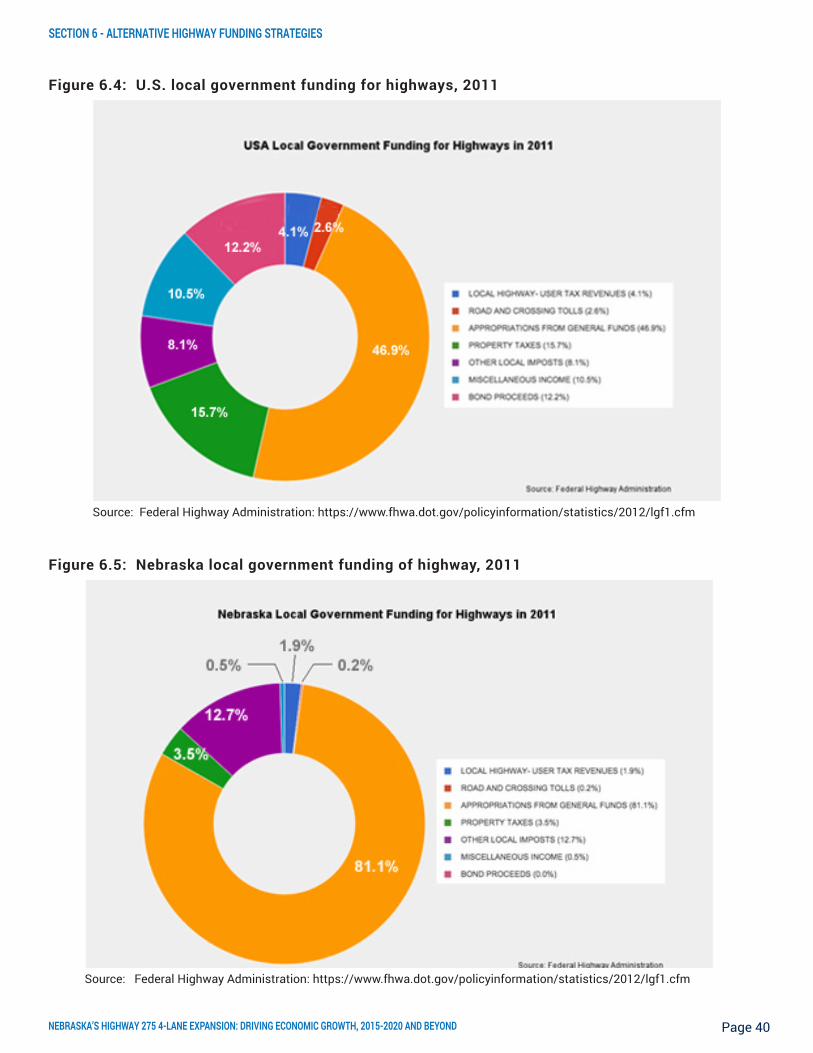
NEBRASKA’S HIGHWAY 275 4-LANE EXPANSION: DRIVING ECONOMIC GROWTH, 2015-2020 AND BEYOND Page 40
Figure 6.4: U.S. local government funding for highways, 2011
Source: Federal Highway Administration: https://www.fhwa.dot.gov/policyinformation/statistics/2012/lgf1.cfm
SECTION 6 - ALTERNATIVE HIGHWAY FUNDING STRATEGIES
Figure 6.5: Nebraska local government funding of highway, 2011
Source: Federal Highway Administration: https://www.fhwa.dot.gov/policyinformation/statistics/2012/lgf1.cfm
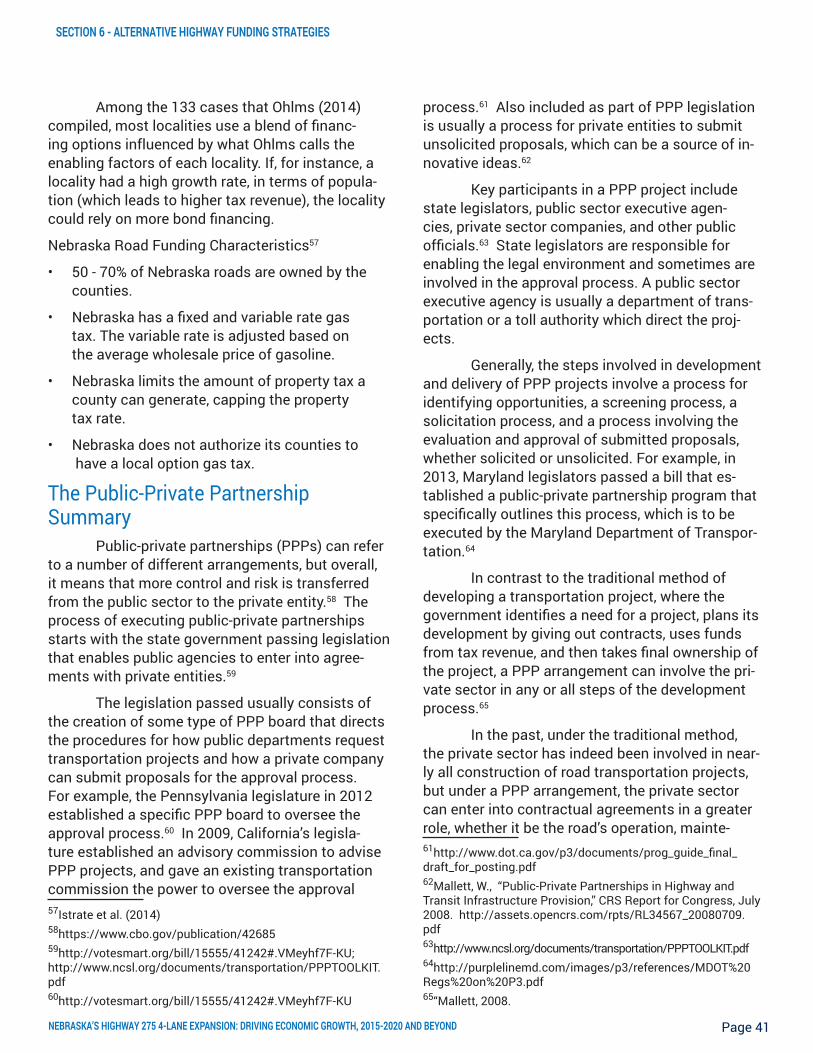
NEBRASKA’S HIGHWAY 275 4-LANE EXPANSION: DRIVING ECONOMIC GROWTH, 2015-2020 AND BEYOND Page 41
SECTION 6 - ALTERNATIVE HIGHWAY FUNDING STRATEGIES
Among the 133 cases that Ohlms (2014) compiled, most localities use a blend of financ-ing options influenced by what Ohlms calls the enabling factors of each locality. If, for instance, a locality had a high growth rate, in terms of popula-tion (which leads to higher tax revenue), the locality could rely on more bond financing.
Nebraska Road Funding Characteristics57
• 50 - 70% of Nebraska roads are owned by the counties.
• Nebraska has a fixed and variable rate gas tax. The variable rate is adjusted based on the average wholesale price of gasoline.
• Nebraska limits the amount of property tax a county can generate, capping the property tax rate.
• Nebraska does not authorize its counties to have a local option gas tax.
The Public-Private Partnership Summary Public-private partnerships (PPPs) can refer to a number of different arrangements, but overall, it means that more control and risk is transferred from the public sector to the private entity.58 The process of executing public-private partnerships starts with the state government passing legislation that enables public agencies to enter into agree-ments with private entities.59
The legislation passed usually consists of the creation of some type of PPP board that directs the procedures for how public departments request transportation projects and how a private company can submit proposals for the approval process. For example, the Pennsylvania legislature in 2012 established a specific PPP board to oversee the approval process.60 In 2009, California’s legisla-ture established an advisory commission to advise PPP projects, and gave an existing transportation commission the power to oversee the approval 57Istrate et al. (2014)58https://www.cbo.gov/publication/4268559http://votesmart.org/bill/15555/41242#.VMeyhf7F-KU; http://www.ncsl.org/documents/transportation/PPPTOOLKIT.pdf60http://votesmart.org/bill/15555/41242#.VMeyhf7F-KU
process.61 Also included as part of PPP legislation is usually a process for private entities to submit unsolicited proposals, which can be a source of in-novative ideas.62
Key participants in a PPP project include state legislators, public sector executive agen-cies, private sector companies, and other public officials.63 State legislators are responsible for enabling the legal environment and sometimes are involved in the approval process. A public sector executive agency is usually a department of trans-portation or a toll authority which direct the proj-ects.
Generally, the steps involved in development and delivery of PPP projects involve a process for identifying opportunities, a screening process, a solicitation process, and a process involving the evaluation and approval of submitted proposals, whether solicited or unsolicited. For example, in 2013, Maryland legislators passed a bill that es-tablished a public-private partnership program that specifically outlines this process, which is to be executed by the Maryland Department of Transpor-tation.64
In contrast to the traditional method of developing a transportation project, where the government identifies a need for a project, plans its development by giving out contracts, uses funds from tax revenue, and then takes final ownership of the project, a PPP arrangement can involve the pri-vate sector in any or all steps of the development process.65
In the past, under the traditional method, the private sector has indeed been involved in near-ly all construction of road transportation projects, but under a PPP arrangement, the private sector can enter into contractual agreements in a greater role, whether it be the road’s operation, mainte-61http://www.dot.ca.gov/p3/documents/prog_guide_final_draft_for_posting.pdf62Mallett, W., “Public-Private Partnerships in Highway and Transit Infrastructure Provision,” CRS Report for Congress, July 2008. http://assets.opencrs.com/rpts/RL34567_20080709.pdf63http://www.ncsl.org/documents/transportation/PPPTOOLKIT.pdf64http://purplelinemd.com/images/p3/references/MDOT%20Regs%20on%20P3.pdf65“Mallett, 2008.

Since Highway 275 is an existing route, adding traditional tolls would not be feasible. Instead, a project’s revenue source could depend on either “availability payments” or “pass-through tolls”.
NEBRASKA’S HIGHWAY 275 4-LANE EXPANSION: DRIVING ECONOMIC GROWTH, 2015-2020 AND BEYOND Page 42
nance, or financing.66 PPPs are also unique in the sense that the private sector can receive revenue from a transportation facility in exchange for taking on the construction, maintenance, or operation of the project, and its accompanying risks.67
Colorado Highway 36 PPP. The Colorado Highway U.S. 36 project provides a good illustration of a public-private partnership highway expansion project. The project gained momentum with the completion of an environmental impact study in late 2009 that recommended improvements to the U.S. 36 corridor between Denver and Boulder.
In 2009, to expedite the availability of highway construction funds, Colorado legislators passed a bill that gave the Colorado Department of Transportation (CDOT) the ability to pursue PPP deals. The bill also created the High Performance Transportation Enterprise, which is a division of the CDOT responsible for seeking out PPPs and manag-ing proposals.68 A PPP was pursued to expedite the project in an environment of insufficient funds.
The PPP consists of an agreement among the CDOT, the High-Performance Transportation Enterprise, and Plenary Roads Denver, the private partner, which is a consortium of six firms involved in the construction, architecture, and finance indus-tries. Plenary Roads Denver has agreed to construct express lanes, reconstruct general purpose lanes, cover maintenance of the highway, and operate the toll roads, generating revenue to the private firm over a 50-year contract period.69
To obtain the contract, Plenary Roads Den-ver competed in a two-stage bidding process that involved input from local governments and other stakeholders.70 The process included opportuni-ties for public input, a proposal evaluation process by the High-Performance Transportation Enterprise, and a vetting process by the Colorado Transporta-tion Commission, which directs the CDOT on 66http://reason.org/files/reason_nebraska_transportation_ppp_2009.pdf67 “Using Public-Private Partnerships to Carry Out Highway Proj-ects”, CBO, Jan. 2012, https://www.cbo.gov/publication/4268568http://mountaintownnews.net/2014/02/08/colorado-public-private-partnership-in-spotlight/69https://www.codot.gov/news/2013-news-releases/04-2013/cdot-and-hpte-select-concessionaire-to-complete-the-us-36-ex-press-lanes-project70https://www.codot.gov/projects/US36ExpressLanes/update-on-us-36-public-private-partnership-understanding-the-facts
projects and expenditures. In February 2014, the Colorado Transportation Commission voted to of-ficially approve the Highway U.S. 36 PPP agreement with Plenary Roads Denver.71
Innovative Revenue Sources. For PPPs, the revenue source is vital to a private entity’s willing-ness to invest in a transportation project. Since Highway 275 is an existing route, adding traditional tolls would not be feasible. Instead, a project’s revenue source could depend on either “availability payments” or “pass-through tolls”.
Availability payments compensate a pri-vate concessionaire based on particular project milestones and/or performance benchmarks. For example, a milestone would be the completion of a project before a deadline or, as an operator, a per-formance benchmark such as the number of lane closures and safety incidents recorded during a set amount of time. Availability payments are start-ing to be used in the U.S., but are more common in Canada and Europe.72
71http://www.thedenverchannel.com/news/local-news/colora-do-transportation-commission-votes-on-us-36-concessionaire-contract-with-plenary-roads0220201472http://www.transportation-finance.org/funding_financing/financing/other_finance_mechanisms/availability_payments.aspx
SECTION 6 - ALTERNATIVE HIGHWAY FUNDING STRATEGIES

NEBRASKA’S HIGHWAY 275 4-LANE EXPANSION: DRIVING ECONOMIC GROWTH, 2015-2020 AND BEYOND Page 43
SECTION 6 - ALTERNATIVE HIGHWAY FUNDING STRATEGIES
Pass-through tolls would be the most feasi-ble option for Highway 275, particularly if operation-al duties stay with the state agency. Pass-through tolls consist of per-vehicle or per-vehicle-mile fees that are not paid by drivers directly, but, instead, are paid by the state or local authority to the private entity that agreed to finance, build, or operate the highway within the PPP agreement. Pass-through tolls are not very common in the U.S., but have been used by the Texas Department of Transportation (TxDOT).
In 2003 and 2005, the state of Texas passed legislation that gave the TxDOT the authority to use pass-through tolls. To take advantage of this method of funding, the TxDOT has a special pass-through financing program, which has specific application guidelines for proposals wanting to use pass-through financing.
El Paso’s Highway Spur 601 project is an ex-ample where the TxDOT compensates a private con-tractor based on a fixed dollar amount per vehicle which takes a 7.4-mile segment of upgraded high-way.73 The cost of the project was $321 million over a period of 15 years. It was a design-build-finance contract, with highway operations staying with the local authorities.
73http://www.transportation-finance.org/funding_financing/financing/other_finance_mechanisms/pass_through_tolls.aspx
The private entity, J.D. Abrams, received direct payments from the TxDOT of $55 million to cover construction, design, and utility relocation costs, $213 million from bond proceeds executed through a conduit bond issuer (Camino Real Region-al Mobility Authority), and $7.9 million per year from pass-through toll payments.74
Figures 6.6 and 6.7 depict PPP structure and process flow. Table 6.2 provides more details on PPPs.
s (hid
74“Innovative Finance in Action: El Paso, Texas Inner Loop Spur 601”, Minnesota Department of Transportation, Oct. 2009.
Pass-through tolls would be the most feasible option for Highway 275, particularly if operational duties stay with the state agency

NEBRASKA’S HIGHWAY 275 4-LANE EXPANSION: DRIVING ECONOMIC GROWTH, 2015-2020 AND BEYOND Page 44
SECTION 6 - ALTERNATIVE HIGHWAY FUNDING STRATEGIES
Goss & Associates, as does the Platte Institute, recommends that the State of Nebraska move forward with PPP-enabling legislation as well as PPP implementation to fund highway construction.
• Funding options include:
o Nebraska enact PPP-enabling legislation.
o Nebraska take immediate action to shore up funds for highway construction.
o Nebraska Unicameral should pass highway bond-enabling legislation.
- Given that current interest rates are at historic lows, it is recommended that Nebraska issue bonds to pay for the Highway 275 expansion.
- Use a portion of LB 84 (Build Nebraska Act)75 revenue to pay interest and principal on the highway bonds or,
- Implement a system of pass-through tolls to pay interest and principal on the highway bonds.
e)
75http://nebraskalegislature.gov/bills/view_bill.php?DocumentID=11707

NEBRASKA’S HIGHWAY 275 4-LANE EXPANSION: DRIVING ECONOMIC GROWTH, 2015-2020 AND BEYOND Page 45
SECTION 6 - ALTERNATIVE HIGHWAY FUNDING STRATEGIES
Figure 6.6: PPP Process Structure

NEBRASKA’S HIGHWAY 275 4-LANE EXPANSION: DRIVING ECONOMIC GROWTH, 2015-2020 AND BEYOND Page 46
SECTION 6 - ALTERNATIVE HIGHWAY FUNDING STRATEGIES
Figure 6.7: PPP Process flow
NEBRASKA’S HIGHWAY 275 4-LANE EXPANSION: DRIVING ECONOMIC GROWTH, 2015-2020 AND BEYOND Page 47
SECTION 6 - ALTERNATIVE HIGHWAY FUNDING STRATEGIES
Table 6.2: PPP Process Definitions, Examples, and Explanations1. Enabling Legislation: Legislation that enables Public-Private Partnerships usually means that the state gov-
ernment is granting authority to the state’s department of transportation to enter into agreement with private entities. Decision making power is usually given to the transportation department’s commission, which governs the state’s department of transportation. Enabling legislation also outlines the process requesting solicited proposals and accepting unsolicited proposals. For example, legislation in Georgia gave the Georgia Department of Transportation (GDOT) a process to evaluate unsolicited proposals and the power to solicit proposals from private entities. In 2004, Florida legislators gave their DOT the ability to enter into PPPs and receive both solicited and unsolicited proposals.
2. Evaluation Committee: The evaluation committee (also called an advisory group or board) is a group of pro-fessionals formed by the department of transportation that reviews proposals and recommends companies to the commission. The committee comprises of individuals with expertise in several domains related to transportation project execution: construction, engineering, legal, business affairs, and finance. The commit-tee is usually organized by the state’s department of transportation. Texas uses a recommendation commit-tee, which has four subcommittees: Legal/Administrative, Financial, Management, and Development that do the in-depth evaluation.
3. Transportation Commission: The transportation commission is a group of people, usually appointed by the governor, that govern a state’s department of transportation. In PPP negotiations, the commission holds the decision making power, which was granted by state legislature. At the Nebraska Department of Roads, this group is referred to as the Highway Commission.76
4. Solicited Proposal: A solicited proposal in a proposal that was submitted as a response to a request from the department of transportation. If a department of transportation has a need for a project, they will send out a Request for Qualifications (RFQ) followed by a Request for Proposal (RFP) to qualifying firms.
5. Unsolicited Proposal: An unsolicited proposal is submitted by a firm that wishes to suggest a transportation project to the department of transportation. This proposal will be conceptual in nature and will also outline the firm’s qualifications. In Florida, when an unsolicited proposal is received, the department of transporta-tion publishes a notice in the newspaper indicating that they will accept other proposals. Unsolicited propos-als in Florida require payment of a $50,000 fee.77
6. Private Entity: A private entity can be a single company or a consortium of companies acting as a group that submit proposals to take on transportation projects. Private entities are usually construction, architectural, engineering, and financing companies. In Colorado, for the U.S. Highway 36 PPP, the private entity was called Plenary Roads Denver, a consortium of six firms involved in the construction, architecture, and finance indus-tries.
7. Conceptual Proposal: A conceptual proposal details the plans and objectives of the transportation project. Additionally, the vision of the partnership and the qualifications of the participating firms are outlined.
8. Proposal Evaluation Process: Proposals are evaluated based on the department’s transportation plans and goals. The state of Texas uses a two-phase competitive process: it begins with a conceptual proposal that is evaluated based on the department’s needs and goals; the second phase involves proposers’ qualifications (i.e. experience, expertise, financial standing). Georgia uses a five-phase process: (1) evaluation activities (screening process by advisory committee), (2) committee recommendations presented to the transporta-tion board, (3) board (or commission) consideration (this includes a public comment period of 15 days), if approved, (4) development activities, which are outlined in a letter of intent (LOI), and (5) final contract ne-gotiations. Florida ranks submitted proposals based on “professional qualification, general business terms, innovative engineering or cost-reduction terms, finance plans, and the need for state funds to deliver the project.”78 Florida also requires an independent analysis to be completed before awarding a contract. This analysis reviews the cost-effectiveness and public benefit.
76, 77,78
76http://www.transportation.nebraska.gov/admin/hwycomm.htm 77CUI, Q., Lindly, J., Evaluation of Public Private Partnership Proposals. http://utca.eng.ua.edu/files/2011/08/08402-Final-Report-6-2-10.pdf 78Florida Bill HB 985, http://www.myfloridahouse.gov/Sections/Bills/billsdetail.aspx?BillId=35864
NEBRASKA’S HIGHWAY 275 4-LANE EXPANSION: DRIVING ECONOMIC GROWTH, 2015-2020 AND BEYOND Page 48
Appendix A - 4 Lanes 4 NebraskaBoard of Directors and Overview
4 Lanes 4 Nebraska promotes state infrastructure projects, focusing on opportunities in business and economic development; promotion of safety resulting in reducuced accidents and deaths; and increased convenience and commute times for workers and residents.
One area of significant interest for the coalition is Highway 275, which has spanned northeast Nebraska since 1939. Despite Nebraska’s transportation policy to connect every major community to an interstate system using 4-lane highways, the 45-mile section of the highway between Norfolk and Fremont has yet to be widened. The board of directors commissioned this study to quantify the benefits of the proposed expansion. The 4 Lanes 4 Nebraska board of directors includes the following Nebraska business leaders:
Dirk Petersen, Nucor Steel
Dick Robinson, Norfolk Iron & Metal
Jeff Scherer, Smeal Fire Apparatus
J.D. Alexander, Alexander Cattle and Farms
Nadine Hagedorn, Citizens State Bank of West Point
Dennis Baumert, Scribner Grain

NEBRASKA’S HIGHWAY 275 4-LANE EXPANSION: DRIVING ECONOMIC GROWTH, 2015-2020 AND BEYOND Page 49
Appendix B: The impact of Highway 275 on Accident Rates
Table B.1: Impact of factors on accidents per mile, 2010
SUMMARY OUTPUT
Regression Statistics
Multiple R 0.321
R Square 0.103
Adjusted R Square 0.081
Standard Error 1.54
Observations 126
ANOVA
Df F Significance F
Regression 3 4.66 0.004
Residual 122
Total 125
Coefficients P-value Lower 95% Upper 95%
Intercept -0.55 0.32 -1.65 0.54
4 lanes -0.65 0.07 -1.34 0.05
Average automobile count (000s) 0.67 0.00 0.00 0.00
Average heavy truck count (000s) -1.55 0.06 0.00 0.00
Source: http://www.unmc.edu/aboutus/facts.html; http://www.aurorahealthcare.org/aboutus/community-benefits/art/impact-study.pdf
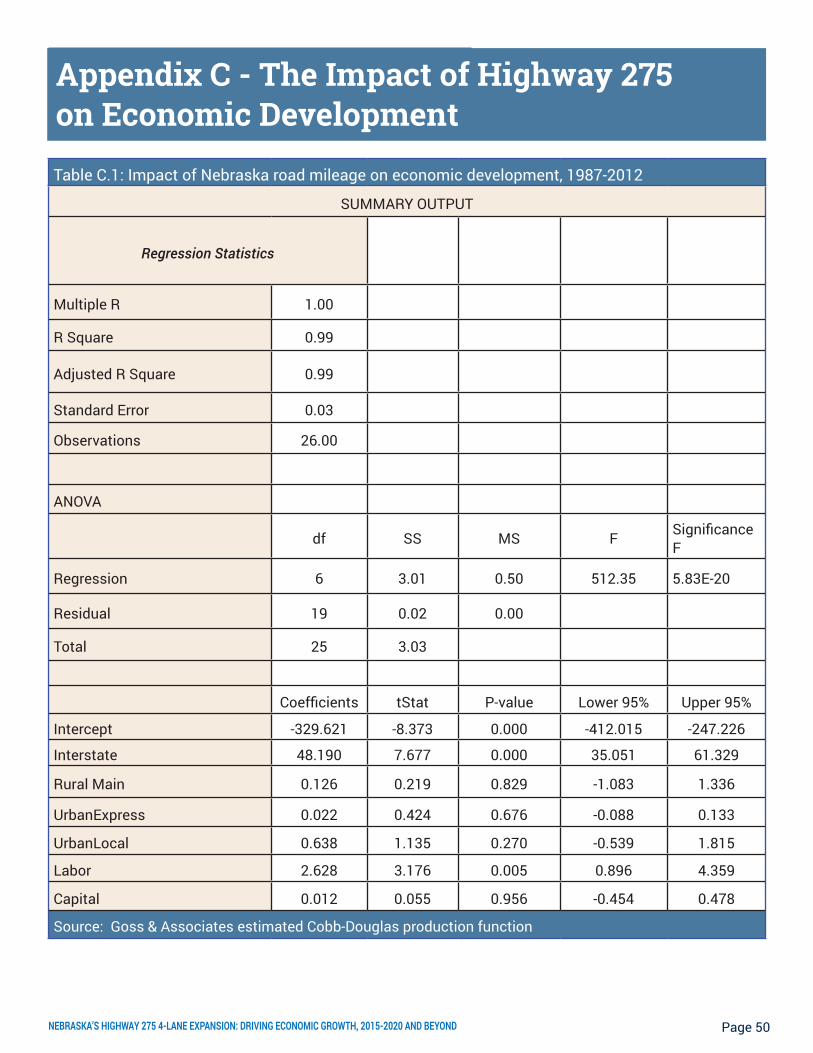
NEBRASKA’S HIGHWAY 275 4-LANE EXPANSION: DRIVING ECONOMIC GROWTH, 2015-2020 AND BEYOND Page 50
Appendix C - The Impact of Highway 275 on Economic Development
Table C.1: Impact of Nebraska road mileage on economic development, 1987-2012
SUMMARY OUTPUT
Regression Statistics
Multiple R 1.00
R Square 0.99
Adjusted R Square 0.99
Standard Error 0.03
Observations 26.00
ANOVA
df SS MS F Significance F
Regression 6 3.01 0.50 512.35 5.83E-20
Residual 19 0.02 0.00
Total 25 3.03
Coefficients tStat P-value Lower 95% Upper 95%
Intercept -329.621 -8.373 0.000 -412.015 -247.226
Interstate 48.190 7.677 0.000 35.051 61.329
Rural Main 0.126 0.219 0.829 -1.083 1.336
UrbanExpress 0.022 0.424 0.676 -0.088 0.133
UrbanLocal 0.638 1.135 0.270 -0.539 1.815
Labor 2.628 3.176 0.005 0.896 4.359
Capital 0.012 0.055 0.956 -0.454 0.478
Source: Goss & Associates estimated Cobb-Douglas production function

NEBRASKA’S HIGHWAY 275 4-LANE EXPANSION: DRIVING ECONOMIC GROWTH, 2015-2020 AND BEYOND Page 51
Appendix D - References
1. 7News Denver, http://www.thedenverchannel.com/news/local-news/colorado-transportation-commission-votes-on-us-36-concessionaire-contract-with-plenary-roads02202014, accessed March 14, 2015.
2. Ambrose, D., and Pol, L. “The Importance of Interstate Highways to Economic Development in Nebraska,” Publications of Center for Public Affairs Research, University of Nebraska-Omaha, 1988.
3. California Dept. of Transportation, Public Private Partnerships Program Guide. http://www.dot.ca.gov/p3/documents/prog_guide_final_draft_for_posting.pdf, accessed March 13, 2015.
4. Chandra, A. and Thompson, E., (2000). “Does public infrastructure affect economic activity? Evidence from the rural interstate highway system”, Regional Science and Urban Economic 30(4), 457-90.
5. Chi, G., “Final Report for Assessing Economic and Demographic Impacts of Intermodal Transportation Systems”, The National Center for Intermodal Transportation, August 2010.
6. CityLab, http://www.citylab.com/tech/2011/11/are-road-use-fees-just-too-creepy-to-work/506/, accessed March 4, 2015.
7. Cobb, C. W.; Douglas, P. H. (1928). “A Theory of Production”. American Economic Review 18 (Supplement): 139-165.
8. Colorado Dept. of Transporation, https://www.codot.gov/projects/US36ExpressLanes/update-on-us-36-public-private-partnership-understanding-the-facts, accessed March 4, 2015.
9. Colorado Dept. of Transportation, https://www.codot.gov/projects/US36ExpressLanes/, accessed March 4, 2015.
10. Colorado Dept. of Transportation, https://www.codot.gov/news/2013-news-releases/04-2013/cdot-and-hpte-select-concessionaire-to-complete-the-us-36-express-lanes-project, accessed March 4, 2015.
11. Congressional Budget Office, “Using Public-Private Partnerships to Carry Out Highway Projects”, Jan. 2012.
12. Council, F. and Stewart, R., “Safety Effects of the Conversion of Rural Two-Lane to Four-Lane Roadways Based on Cross-Sectional Models”, Transportation Research Board Record, November 1999.
13. CUI, Q., Lindly, J., “Evaluation of Public Private Partnership Proposals,” June, 2010.
14. Duntzik, T., Baxandall, Phineas, “A New Direction. Our Changing Relationship with Driving and the Implications for America’s Future,” Frontier Group and U.S. PIRG Education, Spring 2013.
15. Economic Development Research Group. Using Empirical Information to Measure the Economic Impact of Highway Investments - Volume 1: Review of Literature, Data Sources, and Agency Needs”, prepared for Federal Highway Administration, prepared by Economic Development Research Group, Inc. and Cambridge Systematics, Inc.

NEBRASKA’S HIGHWAY 275 4-LANE EXPANSION: DRIVING ECONOMIC GROWTH, 2015-2020 AND BEYOND Page 52
APPENDIX D - REFERENCES
Appendix D -References (cont.)
16. Federal Highway Administration. http://www.fhwa.dot.gov/ipd/revenue/road_pricing/defined/vmt.aspx.
17. Fitzpatrick, K., Schneider, W.H., and Park, E.S., “Comparisons of Crashes on Rural Two-Lane and Four-Lane Highways in Texas”, Texas Transportation Institute, September 2005.
18. Flatiron Bike, http://flatironbike.com/2014/02/14/us-36-for-whom-the-road-tolls/, accessed March 4, 2015.
19. Florida House of Representatives, Florida Bill HB 985, http://www.myfloridahouse.gov/Sections/Bills/billsdetail.aspx?BillId=35864, accessed March 14, 2015.
20. Hodge, D., Weisbrod, G., and Hart, A., “Do New Highways Attract Business? Case Study for North Country, New York”, Cambridge Systematics, Transportation Research Record 1839, Paper No. 03-4148, 2003.
21. Huffington Post, http://www.huffingtonpost.com/2013/02/20/virginia-hybrid-fees_n_2727142.html, accessed March 4, 2015.
22. Iacono, M. and Levinson, D., “Case Studies of Transportation Investment to Identify the Impacts on the Local and State Economy”, Final Report, January 2013, published by Minnesota Department of Transportation.
23. Iacono, M. and Levinson, D., “Rural Highway Expansion and Economic Development: Impact on Private Earnings and Employment”, working paper, 2012.
24. Illinois Secretary of State, http://www.cyberdriveillinois.com/departments/vehicles/cft/fees.html, accessed March 6, 2015.
25. Istrate, E., Nowakowski, A., and Mak, K. (2014) “The Road Ahead: County Transportation Funding and Financing”, National Association of Counties.
26. Iowa Department of Transportation. http://www.fhwa.dot.gov/publications/research/safety/humanfac/pdfs/99206.pdf. Accessed Jan. 23, 2015.
27. Journal Sentinel- Milwaukee Wisconsin, http://www.jsonline.com/business/wisconsin-would-join-electric-car-tax-trend-b99392257z1-282962321.htm, accessed March 4, 2015.
28. KCRG.com, http://www.kcrg.com/subject/news/iowa-officials-set-plans-for-new-transportation-funds-from-gas-tax-20150310#EIiC5B4vELX2sFmp.99.
29. Leong, D., Lichtman, L., Marcos, F., Michelson, K., and Russell, R., “Economic and Land Use Impacts of Wisconsin State Trunk Highway 29”, Final Report, Projects 0092-02-17 and 0092-03-06, Wisconsin DOT, July 2014.
30. Mallett, W., “Public-Private Partnerships in Highway and Transit Infrastructure Provision,” CRS Report for Congress, July 2008.
31. Maryland Dept. of Transportation, Public Private Partnership Provision, http://purplelinemd.com/images/p3/references/MDOT%20Regs%20on%20P3.pdf, Oct., 2013.

CHI HEALTH INJECTS CASH AND GROWTH INTO NEBRASKA AND IOWA ECONOMIES Page 53
Appendix D -References (cont.)
32. Minnesota Department of Transportation, “Innovative Finance in Action: El Paso, Texas Inner Loop Spur 601,” Oct., 2009.
33. Mountain Town News, http://mountaintownnews.net/2014/02/08/colorado-public-private-partnership-in-spotlight/, accessed March 14, 2015.
34. National Association of Counties (NACO), http://www.naco.org/legislation/Documents/Notable-Bills+Trends_StateLegislatures-2013.pdf, accessed March 4, 2015.
35. National Conference of State Legislatures, “Public-Private Partnerships for Transportation: A Toolkit for Legislators”, Oct. 2010.
36. National Highway Traffic Safety Administration, DOT, The Economic and Societal Impact of Motor Vehicle Crashes, 2010.
37. National League of Cities, http://www.nlc.org/media-center/news-search/oregon%E2%80%99s-vmt-pilot-to-begin-its-third-phase-road-usage-charge-program-update, accessed March 6, 2014.
38. Natural Gas.Org., http://naturalgas.org/overview/uses-industrial/.
39. Nebraska Dept. of Transportation, http://www.transportation.nebraska.gov/admin/hwycomm.htm, accessed March 15, 2015.
40. Norfolk Daily News. http://norfolkdailynews.com/news/pipeline-to-expand-gas-service-to-norfolk/article_4bc7fc10-df61-11e3-a679-001a4bcf6878.html. Accessed March 4, 2015.
41. Ohlms, P., “Local Government Funding and Financing of Roads: Virginia Case Studies and Examples From Other States”, Virginia Center for Transportation Innovation & Research, Oct 2014.
42. Pigg, K., Johnson, T., Gilles, J., Fulcher, C., and Wilson-Orndoff, C., “Benefits of Highway Improvements on Rural Communities in Missouri: Economic Development Consideration”, Missouri Department of Transportation, September 2003.
43. Platte Institute for Economic Research, http://reason.org/files/reason_nebraska_transportation_ppp_2009.pdf.
44. Rall, J., “Public-Private Partnerships for Transportation: A Toolkit for Legislators February 2014 Updates and Corrections”, NCSL Transportation Program, National Conference of State Legislatures, Feb. 2014.
45. Reason.org, http://reason.org/files/reason_nebraska_transportation_ppp_2009.pdf.
46. Reed, J., “The Growing Use of Transportation Public-Private Partnerships”, National Conference of State Legislators, May 2014.
47. Rural Connections: Challenges and Opportunities in America’s Heartland”, TRIP, July 2014, http://www.tripnet.org/docs/Rural_Roads_TRIP_Report_July_2014.pdf.
48. Seattle Times. http://seattletimes.com/html/localnews/2019981088_elecriccars25.html, accessed March 4, 2015.
CHI HEALTH INJECTS CASH AND GROWTH INTO NEBRASKA AND IOWA ECONOMIES Page 54
Appendix D -References (cont.)
49. Shirley, C. and C. Winston (2004). Firm inventory behavior and the returns from highway infrastructure investments. Journal of Urban Economics 55, 398-415.
50. Transportation for America. http://t4america.org/maps-tools/state-transportation-funding/.
51. Transportation Finance Clearinghouse by AASHTO, http://www.transportation-finance.org/funding_financing/financing/other_finance_mechanisms/availability_payments.aspx, accessed March 15, 2015.
52. Transportation Finance Clearinghouse by AASHTO, http://www.transportation-finance.org/funding_financing/financing/other_finance_mechanisms/pass_through_tolls.aspx.
53. U.S. Census Bureau. http:// www.census.gov/acs/www/Downloads/data_documentation/Accuracy/MultiyearACSAccuracyofData2010.pdf.
54. U.S. Department of Transportation, Federal Highway Administration, Report to Congress on Public-Private Partnerships, Dec. 2004.
55. USA Today, http://www.usatoday.com/story/money/cars/2013/04/28/hybrid-taxes-gas-tax-highway-funding/2110297/, accessed March 14, 2015.
56. Virginia Department of Transportation. http://www.virginiadot.org/vtrc/main/online_reports/pdf/15-r2.pdf.
57. VoteSmart.org, http://votesmart.org/bill/15555/41242#.VMeyhf7F-KU; http://www.ncsl.org/documents/transportation/PPPTOOLKIT.pdf, accessed March 15, 2015.
58. Ybarra, S. and Gilroy, L., “The Role for Public-Private Partnerships in Modernizing and Expanding Nebraska’s Transportation System”, Platte Institute for Economic Research, Dec. 2009.
59. Whitehouse.gov. http://www.whitehouse.gov/the-press-office/2012/08/28/obama-administration-finalizes-historic-545-mpg-fuel-efficiency-standard, Aug. 2012.
60. Wubneh, M., “US Highway 17 and its impact on the economy of eastern North Carolina”, prepared for Highway 17 Association, May 2008.
NEBRASKA’S HIGHWAY 275 4-LANE EXPANSION: DRIVING ECONOMIC GROWTH, 2015-2020 AND BEYOND Page 55
Appendix E -Researchers’ Biographies
Ernie Goss is the Jack MacAllister Chair in Regional Economics at Creighton University and is the initial director for Creighton’s Institute for Economic Inquiry. He is also principal of the Goss Institute in Denver, Colorado. Goss received his Ph.D. in Economics from The University of Tennessee in 1983 and is a former faculty research fellow at NASA’s Marshall Space Flight Center. He was a visiting scholar with the Congressional Budget Office for 2003-04, and has testified before the U.S. Congress, the Kansas Legislature, and the Nebraska Legislature. In the fall of 2005, the Nebraska Attorney General appointed Goss to head a task force examining gasoline pricing in the state.
He has published more than 100 research studies focusing primarily on economic forecasting and on the statistical analysis of business and economic data. His book Changing Attitudes Toward Economic Reform During the Yeltsin Era was published by Praeger Press in 2003, and his book Governing Fortune: Casino Gambling in America was published by the University of Michigan Press in March 2007.
He is editor of Economic Trends, an economics newsletter published monthly with more than 11,000 subscribers, produces a monthly business conditions index for the nine-state Mid-American region and conducts a survey of bank CEOs in ten U.S. states. Survey and index results are cited each month in approximately 100 newspapers and citations have included the New York Times, Wall Street Journal, Investors Business Daily, The Christian Science Monitor, Chicago Sun Times and other national and regional newspapers and magazines. Each month 75-100 radio stations carry his Regional Economic Report.
Ernie Goss, Ph.D. MacAllister Chair Creighton University Creighton University Omaha, NE 68178 www.outlook-economic.com [email protected]
Jeff Milewski is a researcher at Goss & Associates. He received his master’s degree in political economy from the London School of Economics and Political Science in 2013. He completed his bachelor’s degree at Creighton University in 2007, having studied economics and finance. Milewski also has experience working in finance, and as an entrepreneur.