near-surface site characterisation by ground stiffness ... paper.pdf · near-surface site...
TRANSCRIPT
Menzies 1
Near-surface site characterisation by ground stiffness profiling using surface wave geophysics.
By Bruce Menzies, PhD, DSc, CEng.Chairman & Director, GDS Instruments Ltd, U.K.
1. Geophysics in civil engineering
Geophysics is probably best known for itsapplications in the petroleum industry for use inoil prospecting. In civil engineering, however,traditionally geophysics has been used to targetand map subsurface features (e.g. ground radar).But now civil engineers and engineeringgeologists who specialise in ground engineering(called geotechnical engineers) are doingsomething new - measuring ground parameters.
The science of ground engineering is called“rock mechanics” when applied to rocks andcalled “soil mechanics” when applied to soils andsoft rocks. In the relatively young science of soilmechanics, the use of geophysics is not new.The soil mechanics pioneers like Terzaghi (1943)and Hvorslev (1949) were both interested inusing geophysics in the study of machinefoundations subject to vibration in the 1940s.During the 1950s, Jones (1958) at the TransportResearch Laboratory in the UK used surfacewave geophysics to assess materials under roadpavements but his work was hampered by theunsuitable technology of the time that involvedmanually using an oscilloscope.
With the advent of spectral analysis and portablecomputers that enable the application of fastFourier transforms online, the appeal of surfacewave geophysics has grown with the technology.At the same time, the emphasis in geotechnicaldesign has swung away from stability andstrength measurement towards grounddeformations and stiffness measurement. This isbecause in many urban environments sites arevery congested and construction of tunnels,retaining walls and deep excavations causeground movements that have an adverse effect onnearby structures. With numerical modellingable to predict ground movements qualitatively,the assessment of stiffness has become the keyelement to enable quantitative predictions.
There has been a move towards the use of fieldtechniques for the measurement of stiffnessbecause laboratory methods are subject tosampling disturbance and to unrepresentativesampling. Many field tests, however, are
unsuitable for measuring soil parameters in the(vertical) direction of foundation loadapplication. Plate loading tests simulating thesize and loading of real foundations are veryexpensive and are rarely carried out except toverify less expensive methods. The pressure-meter, which is inserted into a borehole andexpands a shell, gives horizontal groundparameters only. Penetration testing (pushing apointed probe into the ground and measuring theforce penetration relationship e.g. CPT – ConePenetration Test) can only be interpreted byempiricism.
Seismic methods overcome these problems bymeasuring a ground property, maximumstiffness, as distinct from a ground parameter(like strength) that depends on the method ofmeasurement. Research is now focussed on twomain areas. How do we factor maximumstiffness down to that at operational strain levels?How do we convert (the process is called“inversion”) the shear wave velocity-wave lengthrelationship (this is the output of spectral analysisof surface waves and is called the “dispersioncurve”) into a useful shear modulus-depthprofile?
2. Geotechnical problems that the surfacewave method solves
2.1 Overview
The surface wave method is non-invasive andtests a large zone of ground and so the methodavoids the problems of borehole based methodsi.e. drilling and sampling disturbance andunrepresentative sampling and hence testing ofsamples. It is particularly suited to soilscontaining stones and rock debris like glacialtills , residual soils, boulder clay, and to fracturedand jointed rock, where penetration testing likeCPT (Cone Penetration Test) and boreholescannot be used. The method uses very smallstrains that are now known to be near theoperational stiffnesses operating around real civilengineering structures like foundations, retainingwalls and tunnels.

Menzies 2
2.2 Stiffness in geotechnical engineering
2.2.1 The variation of soil stiffness with strainlevel
It is well known that conventional approaches tosettlement prediction greatly over-estimateground movement. Typically, the methods useYoung’s modulus, E, measured in compressionin the triaxial test. Jardine et al.(1978) measuredsmall strains (≈ 0.01% to 0.1%) in the triaxialtest using local strain transducers inside thetriaxial cell. They showed that small strainstiffness is very much greater than large strain (≈1%) values derived from conventionalmeasurements. These measurements are madeoutside the cell and include end cap beddingerrors.
Finite element back-analysis from observedmovements around real civil engineeringstructures give smaller strains (typically < 0.1%)with stiffnesses greater than measured by thesenew triaxial tests . Dynamic tests using theresonant column apparatus apply very smallstrains (typically < 0.001%) and give stiffnessesgreater than the back-analysed values. Clearly,soil stiffness is dependent on strain level.
Fig.1 Idealised stiffness-strain behaviour shownby most soils illustrating that stiffness is strain-level dependent.
The typical variation of shear or bulk stiffnesswith strain for most soils is given in Fig.1. It isbelieved that most soils behave elastically at verysmall strains (i.e. < 0.00l%) giving rise to aconstant stiffness. The strain induced by thepropagation of seismic waves is within this rangeand hence provides a measure of the upper bound
for stiffness (E0 or G0 i.e. the maximum modulusvalue that occurs at strains very near zero). It isalso now generally accepted that ground strainsassociated with most soil-structure interactionproblems are less than 0.l % and hence smallstrain stiffness values are required to makereasonable predictions of deformation (Jardine etal., 1986).
Fig.2 Typical shear modulus-depth profilesmeasured using the CSW, seismic cone, cross-hole and triaxial methods (Matthews et al.,1993).
The upper bound stiffness is clearly afundamental parameter in defining the curve ofFig.1 and hence in situ seismic measurements ofstiffness will become even more important in thefuture. At the present time these measurementsmay be used in conjunction with laboratorymeasurements for soil and in situ loading testmeasurements in rock which provide a lowerbound for stiffness. As shown in Fig.2, it can beseen that local strain measurement in the triaxialtest provides a lower bound to stiffnessmeasurement while surface wave geophysicsdata define an upper bound.
2.2.2 Advantages of geophysical methods forstiffness measurement
Like all methods of parameter determination,field geophysical techniques have bothadvantages and disadvantages. For mostengineers, the primary difficulty has been abelief that geophysics measures dynamicstiffness at very small strain levels, and that thisstiffness is very different from that required forgeotechnical design. This is now known not to bethe case. Matthews (1993) suggests that forfractured Chalk the ratio between stiffnessespredicted using geophysics and those from large-diameter plate tests is close to unity and thatgeophysics provides the best way to determinestiffness.

Menzies 3
For clays it has also been found that themaximum stiffness in highest quality laboratoryspecimens is close to that determined from fieldgeophysics (Clayton & Heymann, in press).Table 1 shows the stiffness degradation withstrain level for soft clay (Bothkennar Clay), stifffissured clay (London Clay) and intact weak rock(Chalk) determined in the triaxial apparatususing local strain instrumentation described byHeymann et al. (1997). It is clear from Table 1that the stiffness at operational strain levels, Eop ,is between 40% and 80% of the maximumstiffness, E0. Given the rates of stiffnessdegradation discussed above, it would seementirely reasonable to estimate operationalstiffness, Eop , from field geophysical results incombination with some (perhaps conservative)reduction factor to take account of the expectedstrain level around the proposed construction.Referring to Table 1, notional values forfactoring E0 could be as follows (Matthews et al.,2000):
Eop ≈ 0.50E0 for soft clays, and
Eop ≈ 0.85E0 for stiff clays and weak rocks.
Material E0.01/E0 E0.1/E0 E1.0/E0
Intact Chalk 0.87-0.93 0.42 failedLondon Clay 0.83-0.97 0.35-0.58 0.11-0.20Bothkennar Clay 0.75-0.81 0.36-0.55 0.11-0.21
Table 1. Examples of stiffness degradation for asoft clay (Bothkennar Clay), a stiff clay (LondonClay) and a weak rock (Intact Chalk), afterHeymann, 1998.
Values of stiffness estimated in this way can beexpected to be far superior to many techniquesused routinely today. For example, oedometertesting (a one-dimensional compression test),external strain triaxial testing, and penetrationtesting, where poor performance in predictingstiffness has been known for decades (e.g.Burland & Hancock, 1977; Clayton et al., 1988;Izumi et al., 1997). As an example, Fig. 3 showsnot only stiffnesses back-analysed from groundmovements around a number of major structuresin the London area, but also the very much lowervalues from routine oedometer and triaxial testsconducted on samples from the Grand Buildingssite. It can be seen that these stiffnesses areabout an order of magnitude too low. In contrast,the cross-hole stiffnesses for the London Claysites are close to those derived from backanalysis (Matthews et al., 2000).
Geophysics has other advantages. For example,although it may be necessary to install casedholes for sources and receivers, the vast bulk ofthe ground tested remains at its in-situ stress andsaturation level, and undisturbed. In contrast,laboratory tests require that specimens be taken.Sample disturbance involves not only mechanicaldisturbance to the soil structure, but also stressrelief. In addition, field geophysical results arerepresentative of a large volume of ground, sothat layering and fracturing are taken intoaccount. The Continuous Surface Wave methodand Spectral Analysis of Surface Waves,however, are non-invasive. Because boreholesare not required such tests are very fast, and theresults can be obtained relatively cheaply, andavoid significant contact with contaminated land(Matthews, et al., 2000).
To sum up, the method measures the (very smallstrain) maximum value of shear modulus of theground i.e. a property that can be used tocharacterise the site. This property may bedistinguished from a parameter that depends onthe method of measurement (e.g.undrained soilstrength).
Fig.3 Comparison of stiffness profiles fromlaboratory tests, back analysis and seismic cross-hole surveys at various sites on London Clay(Matthews et al., 2000).
Menzies 4
3. Principles of the surface wave method
3.1 Elastic waves: definitions and terminology
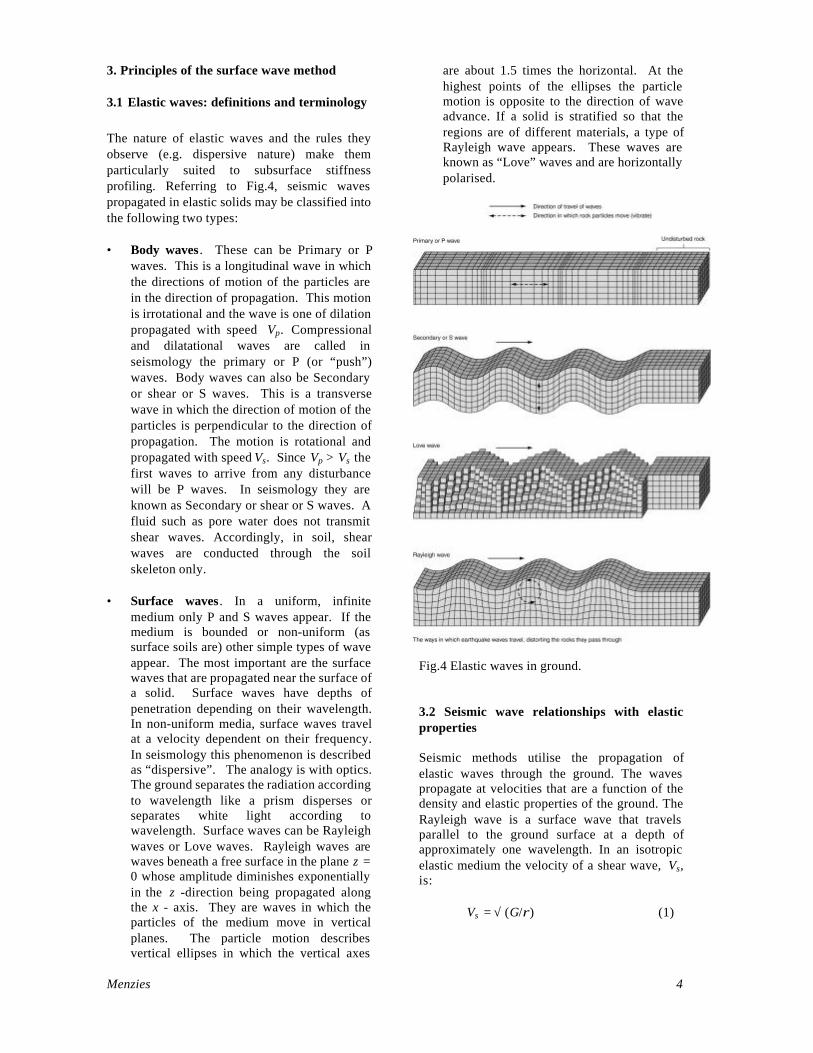
The nature of elastic waves and the rules theyobserve (e.g. dispersive nature) make themparticularly suited to subsurface stiffnessprofiling. Referring to Fig.4, seismic wavespropagated in elastic solids may be classified intothe following two types:
• Body waves . These can be Primary or Pwaves. This is a longitudinal wave in whichthe directions of motion of the particles arein the direction of propagation. This motionis irrotational and the wave is one of dilationpropagated with speed Vp. Compressionaland dilatational waves are called inseismology the primary or P (or “push”)waves. Body waves can also be Secondaryor shear or S waves. This is a transversewave in which the direction of motion of theparticles is perpendicular to the direction ofpropagation. The motion is rotational andpropagated with speed Vs. Since Vp > Vs thefirst waves to arrive from any disturbancewill be P waves. In seismology they areknown as Secondary or shear or S waves. Afluid such as pore water does not transmitshear waves. Accordingly, in soil, shearwaves are conducted through the soilskeleton only.
• Surface waves . In a uniform, infinitemedium only P and S waves appear. If themedium is bounded or non-uniform (assurface soils are) other simple types of waveappear. The most important are the surfacewaves that are propagated near the surface ofa solid. Surface waves have depths ofpenetration depending on their wavelength.In non-uniform media, surface waves travelat a velocity dependent on their frequency.In seismology this phenomenon is describedas “dispersive”. The analogy is with optics.The ground separates the radiation accordingto wavelength like a prism disperses orseparates white light according towavelength. Surface waves can be Rayleighwaves or Love waves. Rayleigh waves arewaves beneath a free surface in the plane z =0 whose amplitude diminishes exponentiallyin the z -direction being propagated alongthe x - axis. They are waves in which theparticles of the medium move in verticalplanes. The particle motion describesvertical ellipses in which the vertical axes
are about 1.5 times the horizontal. At thehighest points of the ellipses the particlemotion is opposite to the direction of waveadvance. If a solid is stratified so that theregions are of different materials, a type ofRayleigh wave appears. These waves areknown as “Love” waves and are horizontallypolarised.
Fig.4 Elastic waves in ground.
3.2 Seismic wave relationships with elasticproperties
Seismic methods utilise the propagation ofelastic waves through the ground. The wavespropagate at velocities that are a function of thedensity and elastic properties of the ground. TheRayleigh wave is a surface wave that travelsparallel to the ground surface at a depth ofapproximately one wavelength. In an isotropicelastic medium the velocity of a shear wave, Vs,is:
Vs = √ (G/ρ) (1)

Menzies 5
where G is the shear modulus and ρ the density.According to the theory of elasticity, Young'smodulus E is related to G by:
G = E/ (2(1 + ν)) (2)
where ν is the Poisson's ratio. Thus G can beobtained from measurements of Vs alone.
Surface waves may also be used to determineshear stiffness in soils and rocks. Approximatelytwo thirds of the energy from an impact sourcepropagates away in the form of surface waves ofthe type first described by Rayleigh in 1885.These waves travel at speeds governed by thestiffness-depth profile of the near surfacematerial. It can be shown from the theory ofelasticity that the relationship between thecharacteristic velocity of shear waves Vs andRayleigh waves Vr in an elastic medium is givenby:
Vr = C Vs (3)
where C is a function of Poisson's ratio, ν. Therange of C is from 0.911 to 0.955 for the range ofPoisson's ratio associated with most soils androcks if anisotropy is ignored. The maximumerror in G arising from an erroneous value of C istherefore probably less than 10%.
3.3 Seismic methods for stiffness measurement
The seismic methods employed to determinestiffness-depth profiles are divided intosubsurface and surface methods as shownschematically in Fig.5. Most of the subsurfacemethods require one or more boreholes that needto be cased with special plastic casing that addsto the cost of the survey.
These methods are most useful where the depthof investigation is greater than l5m and involvethe measurement of the transit times of seismicwaves over known distances. The seismic conehas the advantage of providing both stiffness andstrength-related data and does not require aborehole since the cone is pushed into theground. The depth of penetration is limited,however, by the strength of the ground and anyobstructions such as boulders, claystones or rocklayers.
A simple and cost-effective surface methodmakes use of surface waves. Surface wavemethods exploit the dispersive nature ofRayleigh waves. The speed of propagation of aRayleigh wave travelling at the surface of
inhomogeneous ground depends on itswavelength (or frequency) as well as the materialproperties of the ground. Measurements of phasevelocity of Rayleigh waves of differentfrequencies (or wavelengths) can be used todetermine a velocity-depth profile.To sum up, surface wave methods are attractiveboth for speed and to save the cost of drillingboreholes.
Fig.5 Seismic methods that measure groundstiffness.
3.4 The surface wave method
Surface waves may be used to determine shearstiffness in soils and rocks. These waves travel atspeeds governed by the stiffness-depth profile ofthe near-surface material. Geotechnical engineershave long recognised that Rayleigh waves offer auseful non-invasive method of investigating theground in situ (eg Hertwig, 1931; Jones, 1958;Heukolom and Foster, 1962; Abbiss, 1981).
Two distinct surface-wave methods are available.
• Spectral Analysis of Surface Waves(SASW). This method makes use of ahammer as an energy source. The fieldtechnique is described by Ballard and McLean(1975), Nazarian and Stokoe (1984), Addoand Robertson (1992), and by Matthews et al(1996).
• Continuous Surface Wave (CSW). Thismethod makes use of a vibrator as an energysource. The field technique is described byBallard and McLean (1975), Abbiss (1981),Tokimatsu et al. (1991), and by Matthews etal. (1996).
The SASW method relies on the frequencyspectrum of the energy source used. In most casesa range of hammers of different mass are
Menzies 6
employed to achieve the necessary frequency range(3-200Hz). However, it is inevitable that certainfrequencies will be missing from the spectra ofthese sources. This can result in gaps in thestiffness profile data. This serious disadvantagemay be overcome by replacing the hammers with afrequency-controlled vibrator. This is the basis ofthe CSW method.
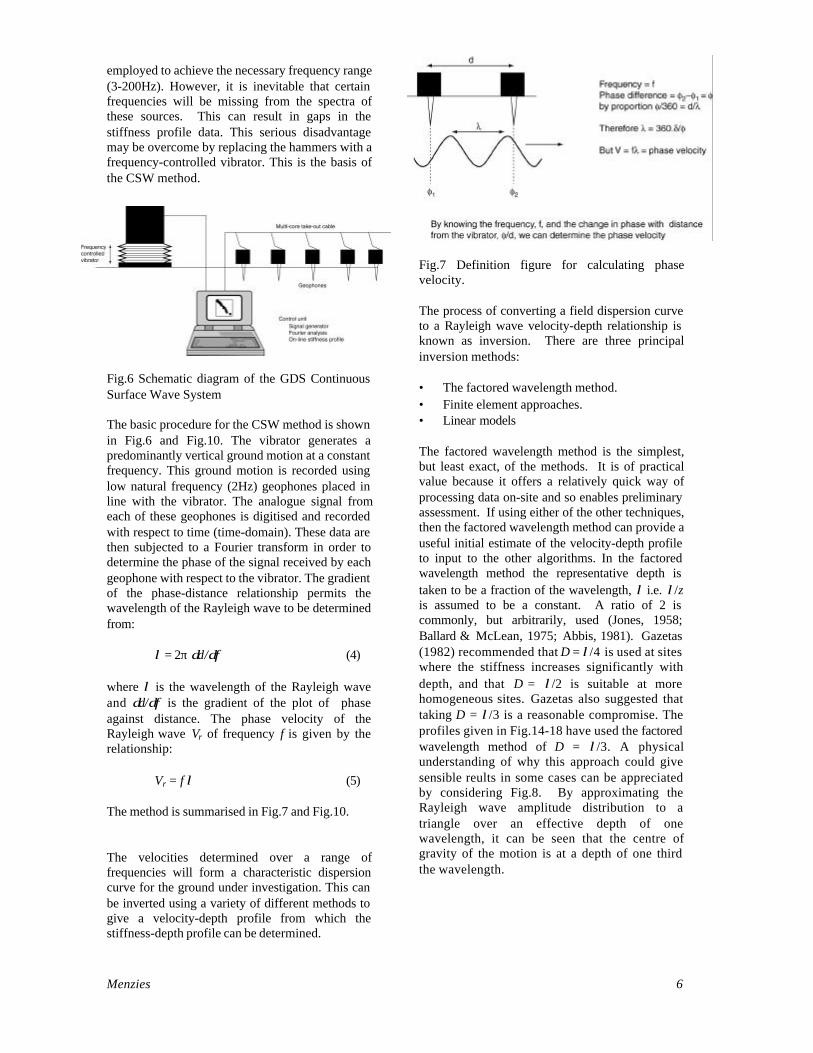
Fig.6 Schematic diagram of the GDS ContinuousSurface Wave System
The basic procedure for the CSW method is shownin Fig.6 and Fig.10. The vibrator generates apredominantly vertical ground motion at a constantfrequency. This ground motion is recorded usinglow natural frequency (2Hz) geophones placed inline with the vibrator. The analogue signal fromeach of these geophones is digitised and recordedwith respect to time (time-domain). These data arethen subjected to a Fourier transform in order todetermine the phase of the signal received by eachgeophone with respect to the vibrator. The gradientof the phase-distance relationship permits thewavelength of the Rayleigh wave to be determinedfrom:
λ = 2π δd/δφ (4)
where λ is the wavelength of the Rayleigh waveand δd/δφ is the gradient of the plot of phaseagainst distance. The phase velocity of theRayleigh wave Vr of frequency f is given by therelationship:
Vr = f λ (5)
The method is summarised in Fig.7 and Fig.10.
The velocities determined over a range offrequencies will form a characteristic dispersioncurve for the ground under investigation. This canbe inverted using a variety of different methods togive a velocity-depth profile from which thestiffness-depth profile can be determined.
Fig.7 Definition figure for calculating phasevelocity.
The process of converting a field dispersion curveto a Rayleigh wave velocity-depth relationship isknown as inversion. There are three principalinversion methods:
• The factored wavelength method.• Finite element approaches.• Linear models
The factored wavelength method is the simplest,but least exact, of the methods. It is of practicalvalue because it offers a relatively quick way ofprocessing data on-site and so enables preliminaryassessment. If using either of the other techniques,then the factored wavelength method can provide auseful initial estimate of the velocity-depth profileto input to the other algorithms. In the factoredwavelength method the representative depth istaken to be a fraction of the wavelength, λ i.e. λ/zis assumed to be a constant. A ratio of 2 iscommonly, but arbitrarily, used (Jones, 1958;Ballard & McLean, 1975; Abbis, 1981). Gazetas(1982) recommended that D = λ/4 is used at siteswhere the stiffness increases significantly withdepth, and that D = λ/2 is suitable at morehomogeneous sites. Gazetas also suggested thattaking D = λ/3 is a reasonable compromise. Theprofiles given in Fig.14-18 have used the factoredwavelength method of D = λ/3. A physicalunderstanding of why this approach could givesensible reults in some cases can be appreciatedby considering Fig.8. By approximating theRayleigh wave amplitude distribution to atriangle over an effective depth of onewavelength, it can be seen that the centre ofgravity of the motion is at a depth of one thirdthe wavelength.

Menzies 7
Fig.8 The amplitude of surface wavedisplacements as a function of distance to thesurface (after Richart, Hall and Woods, 1970).
Using the finite element method a syntheticdispersion curve is generated and the stiffnessdistribution is progressively adjusted until thesynthetic dispersion curve matches the curveobtained in the field (Clayton et al., 1995). Theground is divided into layers on constant stiffness.For a simple sub-surface geometry a two-dimensional, axially symmetric, idealisation ofsurface wave tests can be made. The equations ofmotion are integrated with respect to time to modelthe ground motion at the actual geophone locationsused in the field. These data are used to determinethe synthetic dispersion curve.
Linear models have been proposed by andNazarian and Stokoe (1984) (the so-called“Haskell-Thompson” method) and by Lai andRix (1998).
4. Use of the surface wave method in practice
4.1 Introduction to the GDS Surface WaveSystems
Two surface wave systems are available thatshare several common elements like fieldcomputer, geophones, geophone take-out cable,etc. The SASW (Spectral Analysis of SurfaceWaves) method makes use of a hammer as anenergy source (see Fig.9). The CSW(Continuous Surface Wave) method makes useof a vibrator as an energy source (see Fig.10).Both techniques are described in detail byMatthews et al., (1996).
Fig.9 Schematic diagram showing the stepsfollowed in the determination of a dispersioncurve using the SASW (hammer-based) method(after Matthews et al., 1996).
As indicated in Fig.9, the SASW systemcomprises a hammer as the seismic source,medium frequency (6Hz) geophones and a fieldcomputer.
As shown in Fig.11, the CSW system comprises afrequency-controlled vibrator, low frequency(2Hz) geophones and a field computer. Thefrequency of the vibrator and frequency of thegeophone data acquisition are controlled by thePC. Once the vibrator and geophones have beenpositioned and the details of the location andlayout entered into the computer, the vibrator istaken from 5 to 100Hz in 5Hz increments and theresulting stiffness profile is displayed. Based onthis preliminary survey, the user can then select anumber of frequency ranges and assign suitablefrequency increments in order to provide a morecomprehensive stiffness profile. The minimumfrequency increment is 0.1Hz. This is required inorder to ensure continuity of the stiffness profilewhen operating at frequencies less than 10Hz. The

Menzies 8
raw data are stored on disk for further analysis inthe office. The stiffness profile derived from thefactored wavelength inversion method describedabove is displayed on the computer screen and iscontinuously updated during the test. In general atypical test in which over 50 stiffnessmeasurements are taken at different depths willtake less than 2 hours.
4.2 Applications of surface wave methods
The applications of the surface-wave methodinclude:
• Profiling in terms of shear stiffness (Gordon,et al., 1995)
• Prediction of ground deformation (Matthews,1993)
• Assessment of lateral variations in stiffness• Quality control for ground improvement
(Cuellar et al., 1995), rail track ballast andsub-grade and road pavement sub-grade(Jones, 1962)
• Rock mass assessment (Matthews, 1993)• Determination of landfill thickness (Butcher &
Tam, 1994)• Assessment of liquefaction potential (Stokoe
& Nazarian, 1985)• Assessment of shear damping ratio (Lai and
Rix, 1998)
The most common applications at the present timeare profiling in terms of shear stiffness and theprediction of ground deformations. For example,Fig.2 shows results from an investigation carriedout to provide stiffness parameters for thestructural design of cut and cover tunnels andretaining walls associated with a major junctionimprovement scheme. Stiffness data were alsorequired to assess the effects of construction onnearby buildings. The site is underlain by over 30mof London Clay. It will be seen from Fig.2 thatdata obtained from the seismic cone penetrationtest (SCPT), cross-hole and continuous surface-wave (CSW) surveys show good agreement andform an upper bound for the stiffnessmeasurements. The lower bound for stiffnessmeasurements was provided by the laboratorytriaxial tests with local strain measurement. Ingeneral the shear modulus at very small strain (iefrom the seismic tests) is about two times thatmeasured at 0.01% strain in the triaxial tests. Thisindicates that the drop in stiffness from very smallstrain levels to the lower bound of field operationalstrain levels is perhaps not as severe as indicatedby the idealised model of stiffness-strain behaviourshown in Fig.1.
Using large scale loading tests and observations offull-scale foundations, it has been shown that theload-settlement behaviour of chalk is more or lesslinear elastic up to the yield stress which variesbetween 200kPa and 400kPa (Ward et al.,1968,Burland & Lord,1970, Matthews,1993). It seemsreasonable, therefore, to use stiffness-depthprofiles determined using seismic methods directlyin predictions of ground deformation such asfoundation settlements. Matthews (1993) carriedout 9 large diameter (1.8m) plate loading tests onweathered chalks with similar discontinuitypatterns but different intact stiffnesses. In each casethe stiffness-depth profile beneath the platelocations was determined using surface-wavegeophysics, the standard penetration test and visualassessment based on Ward et al. (1968). Fig.12shows a comparison between the observed andpredicted settlement for these nine tests. Clearly,the Standard Penetration Test (SPT) either grosslyover-predicts or under-predicts the settlement,whereas predictions based on geophysics yieldsreasonable agreement.
Fig.10 Schematic diagram showing the stepsfollowed in the determination of a dispersion curveusing the CSW (vibrator-based) method (afterMatthews et al., 1996).

Menzies 9
Fig.11 GDS Continuous Surface Wave Systembeing used on site on a trial road.
Fig.12 Comparison of observed settlement of a1.8m diameter plate on weathered chalk loadedto 100kPa average bearing pressure withsettlement predictions based on stiffness-depthprofiles determined using CSW (surface wavegeophysics) and SPT (Standard penetration Test)(Matthews et al., 1993).
5. Case studies of site characterisation by theGDS Continuous Surface Wave system
• The profiles in Fig.13 are part of a set of 10produced by one operative in one day. Thesite is a trial road in the U.K. Measurementswere made directly on the sub-grade (seealso Fig. 11). The dip of the interfacebetween the overlying stiffer layer and theunderlying softer layer is clearly seen. Whenthe road is constructed, tests will be repeatedfrom the road surface.
• The profile in Fig.14 is for a site in the U.K.The transition from fill to underlying densechalk is not clearly seen because of the scaleof stiffnesses involved. Chalk is a jointedweak rock and the stiffness values measuredare for the chalk mass i.e. including theeffect of the jointing.
• The profile in Fig.15 is for a demonstrationsite in northern France. The profile wasproduced under computer control as usualand then the test was run again and theresults superimposed. All the points fromthe second run plotted directly on the pointsfrom the first run and were indistinguishablefrom them. This demonstrates goodrepeatability of the system and its reliabilityin producing raw data.
• The profile in Fig.16 is for a coastal site insouthern England. The upper desiccatedlayer is clearly seen with stiffness decreasingdown to the water table and increasing withdepth thereafter.
• The depth profiles in Fig.17 compare CPTcone resistance and CSW shear modulus.Looking at the shapes, the inherentaveraging of the CSW method is apparent.
• The depth profiles in Fig.18 compare CPTcone resistance and CSW shear modulus todemonstrate ground improvement followingtreatment by vibro-stone columns. TheCSW plot clearly shows an approximatedoubling of modulus for the test stationlocated midway between the stone columnsfor before and after installation. Theimportant point here is that thedemonstration of improvement by CSW isquantitative and provides a real engineeringparameter, shear modulus. The improvementshown by CPT, however, is qualitative onlyand requires empirical interpretation torelate cone resistance to an engineeringparameter.

Menzies 10
Fig.13 CSW stiffness-depth profiles along thesub-grade of a trial road showing the dip of asofter underlying soil.
Fig.14 CSW stiffness-depth profile for a site insouthern England.
Fig.15 CSW stiffness-depth profile for a site innorthern France.
Fig.16 CSW stiffness-depth profile for a coastalsite in southern England.
0
5
10
15
0 100 200 300

Menzies 11
Fig.17 Comparison of CSW and CPT profiles ata coastal alluvial site in southern Englandshowing a soft alluvial layer at shallow depthbetween stiffer fill and medium dense gravel bed.
Fig.18 Comparison of "before and after" CSWstiffness-depth profiles and CPT cone resistance-depth profiles for loose sandy fill between vibro-stone columns for a site in the U.K.
6. Summary of main points
• The SASW/CSW method is non-invasiveand tests a large zone of soil and so themethod avoids the problems of boreholebased methods i.e. sampling disturbance andunrepresentative sampling/testing.
• The method is particularly suited to soilscontaining stones and rock debris like glacialtills, residual soils, boulder clay, and tofractured and jointed rock, where penetrationtesting and boreholes cannot be used.
• The method is suited to near surfaceapplications only. Using present day signalconditioning and software, stiffness profilesin soft ground can successfully be obtainedup to 10m. In hard soils/soft rocks, profilesto a depth of 50m can be obtained.
• The method uses very small strains that arenow known to be close to the operationalstiffnesses near real civil engineeringstructures like foundations, retaining wallsand tunnels. An approximate relationshipbetween maximum stiffness (E0) measuredby the method and the lower operationalstiffness (Eop) around real structures (seeFig.1) is about
Eop ≈ 0.50E0 for soft clays, and
Eop ≈ 0.85E0 for stiff clays and weak rocks.
• The method provides an upper bound tooperational stiffness while small straintriaxial is a lower bound. Most engineersare comfortable with the idea that theiroperational values lie between known upperand lower bounds.
• The stiffness profiles are logical (i.e. whenan engineer looks at them they make sense)and correlate well qualitatively with ground-truth crosschecks such as CPT profiles andborehole logs.
• The results are remarkably repeatable (e.g.Fig.15) and so indicate that the system andits interaction with the ground is consistentand dependable as a source of raw data.
• The results are online and rapidly obtainedusing the factored wavelength method ofdispersion curve inversion i.e. D = λ/3 (e.g.Fig.13).
• Correlation with “ground truth” like CPT is(subjectively) fairly good (e.g. Fig.17)
• The system is ideal for before and aftermeasurements of ground improvement (e.g.stone columns case study of Fig.18) and for

Menzies 12
monitoring changes in site characteristicse.g. between the wet and dry seasons.
• Because the method is an inherentlyaveraging technique, minor variations suchas thin seams are overlooked, but the massproperties of the ground are well representedand usually in foundation engineering it isthis average value which matters.
• The drawback of the method is theuncertainty with which modulusmeasurements are assigned to depth,particularly in layered ground. Finiteelement methods and linear modelling doaddress this problem and will shortly enableonline interpretation to be incorporated. Forthe present, given that the SASW/CSWmethods are probably part of an overall siteinvestigation scheme, “ground truth” datalike borehole logs and CPT can be used toverify or adjust depth based on the simplefactored wavelength relationship of D = λ/3.
• SASW is a low cost (about the cost of asmall automobile) system that is highlyeffective at relatively shallow depth. TheGDS field computer and geophone take-outcable are common to both the SASW andCSW systems. There is a logical upgradepath, therefore, from the impact seismicsource system, SASW, to the considerableadvantages of the harmonic seismic sourcesystem, CSW. These advantages includegreater depth of stiffness profile and theability to instruct the computer to mapfeatures (e.g. interface between layers) ingreater detail.
References
Abbiss, C.P. (1981) Shear wave measurements ofthe elasticity of the ground. Geotechnique, 31(1),91-104.
Addo, K. and Robertson, P.K. (1992) Shear wavevelocity using Rayleigh surface waves. CanadianGeotechnical Journal, 29(4), 558-568.
Ballard, R.F. and McLean, F.G. (1975) Seismicfield methods for in-situ moduli. Proc. Conf. on Insitu Measurement of Soil Properties. SpecialityConference of the Geotechnical EngineeringDivision A.S.C.E., Raleigh, North Carolina, 1,121-150.
Butcher, A.P. and Tam, W.S.A. (1994) Anexample of the use of Rayleigh waves to detect thedepth of a shallow landfill. Proc. 30th Conf.Engineering Group of the Geological Society,Modern Geophysics in Engineering Geology,Liege, 1994, in press.
Burland, J.B. & Lord, J.A. (1970) The load-deformation behaviour of Middle Chalk atMundford, Norfolk: a comparison between full-scale performance and in-situ and laboratorymeasurements. Proc. Conf. on In situInvestigations in Soils and Rocks, BritishGeotechnical Society, London, 3-15.
Clayton, C.R.I., Gordon, M.A. and Matthewss,M.C. (1994) Measurements of stiffness of soils andweak rocks using small strain laboratory testingand geophysics. Proc. Int. Symp. on Pre-failureDeformation Characteristics of Geomaterials,Balkema, Rotterdam, 1, 229-234.
Clayton, C.R.I., Matthews, M.C., Gunn, M.J.,Foged, N. and Gordon, M.A. (1995)Reinterpretation of surface wave test for theØresund crossing. Proc. 11th European Conf. onSoil Mech. and Found. Engng, Copenhagen,Danish Geotechnical Society, Copenhagen, 1, 141-147.
Cuellar, V., Monte, J.L. and Valerio, J. (1995)Characterization of waste landfills usinggeophysical methods. Proc. 11th European Conf.on Soil Mech. and Found. Engng, Copenhagen,Danish Geotechnical Society, Copenhagen, 2, 33-38.
Gazetas, G. (1982) Vibrational characteristics ofsoil deposits with variable velocity. Int. J. forNumerical and Analytical Methods inGeomechanics , 6, 1-20.
Gordon, M.A., Clayton, C.R.I., Thomas, T.C. &Matthews, M.C. (1995) The selection andinterpretation of seismic geophysical methods forsite investigation. Proc. ICE Conf. on Advances inSite Investigation Practice, March 1995.
Hertwig, A. (1931) Die DynamischeBodenuntersuchung' Der Bauingenieur, No. 25,pp.457-461 and No. 26, pp.476-480.Heukolom, W. and Foster, C.R. (1962) Dynamictesting of pavements. Trans. American Society ofCivil Engineers , 127 (1), 425-456
Hight, D.W. and Higgins, K.G. (1994) KeynoteLecture: An approach to the prediction of groundmovements in engineering practice: background

Menzies 13
and application. Proc. Int. Symp. on Pre-failureDeformation Characteristics of Geomaterials,Balkema, Rotterdam, 3.
Hvorslev, M.J. (1949). Subsurface explorationand sampling of soils for civil engineeringpurposes. Waterways Experiment Station,Vicksburg, Mississippi, 521p.
Jardine, R.J., Potts, D.M., Fourie, A.B. andBurland, J.B. (1986) Studies of the influence ofnon-linear stress-strain characteristics in soil-structure interaction. Geotechnique, 36(3), 377-396.
Jones, R.B. (1958) In-situ measurement of thedynamic properties of soil by vibration methods.Geotechnique, 8(1), 1-21.
Jones, R.B. (1962) Surface wave technique formeasuring the elastic properties and thickness ofroads: theoretical development. J. Appl. Physics,13, 21-29.
Kee, R. & Clapham, H.G. (1971) An empiricalmethod of foundation design in Chalk. Civ. Eng.and Public Wks. Rev.
Lai, C.G. and Rix, G.J. (1998) Simultaneousinversion of Rayleigh Phase velocity andattenuation for near-surface site characterization.Georgia Institute of Technology, Atlanta, USA.
Matthews, M.C. (1993) Mass compressibility offractured chalk. PhD Thesis, University of Surrey.
Matthews, M.C., Clayton, C.R.I., and Own, Y.(2000). The use of field geophysical techniquesto determine geotechnical stiffness parameters.Proc. Instn Civ. Engrs Geotech. Engng. January.
Matthews, M.C., Hope, V.S. & Clayton, C.R.I.(1996) The use of surface waves in thedetermination of ground stiffness profiles. Proc.Instn Civ. Engrs Geotech. Engng 119, April, 84-95.
Mukabi, J.N., Tatsuoka, F., Kohata, Y, Tsuchida,T. and Akino, N. (1994) Small strain stiffness ofPleistocene clays in triaxial compression. Proc.Int. Symp. on Pre-failure DeformationCharacteristics of Geomaterials, Balkema,Rotterdam, 1, 189-196.
Nazarian, S. and Stokoe, K.H. (1984) In situ shearwave velocities from spectral analysis of surfacewaves. Proc. 8th World Conf. on EarthquakeEngineering, 3, 31-38.
Porovic, E. and Jardine, R.J. (1994) Someobservations on the static and dynamic shearstiffness of Ham River sand. Proc. Int. Symp. onPre-failure Deformation Characteristics ofGeomaterials, 1994, Balkema, Rotterdam, 1, 25-30.
Tatsuoka, F. and Shibuya, S. (1992) Deformationcharacteristics of soils and rocks from field andlaboratory tests. Report of the Institute of IndustrialScience, The University of Tokyo, 37(1), 1-136.
Tatsuoka, F. and Kohata, Y. (1994) KeynoteLecture: Stiffness of hard soils and soft rocks inengineering applications. Proc. Int. Symp. on Pre-failure Deformation Characteristics ofGeomaterials, Balkema, Rotterdam, 3.
Telford, W.M., Geldart, L.P. & Sheriff, R.E.(1990) Applied Geophysics. 2nd Edition,Cambridge University Press, Cambridge, 770pp.
Terzaghi, K. (1943) Theoretical Soil Mechanics. J.Wiley and Sons, New York, 1943, 510pp.
Tokimatsu, K., Kuwayama, S., Tamura, S. andMiyadera, Y. (1991) Vs determination from steadystate Rayleigh wave method. Soils andFoundations, 31(2), 153-163.
Wakeling, T.R.M. (1970) A comparison of theresults of standard site investigation methodsagainst the results of a detailed geotechnicalinvestigation in Middle Chalk at Mundford,Norfolk. Proc. Conf. on In situ Investigations inSoils and Rocks, British Geotechnical Society,London, 17-22.
Ward, W.H., Burland, J.B. & Gallois , R.M. (1968)Geotechnical assessment of a site at Mundford,Norfolk for a Proton Accelerator. Geotechnique,18(4), 399-431.

Menzies 14
Dr Bruce Menzies, PhD, DSc, CEng
Bruce Menzies graduated in 1961 from the University of New Zealand. Following his Masters degree insoil dynamics he worked for a firm of civil engineering consultants before moving to England. He thenspent periods lecturing at Kingston University and University College London where he completed his PhDin soil mechanics in 1970.
As Lecturer in Soil Mechanics at the University of Surrey his research in the early 1970s concentrated onapplying the then emergent microcomputer to the control of stress paths in the triaxial test. Other researchactivities included numerical analyses of progressive failure of footings and of the performance of buriedpipelines adjacent to trench excavations. He also carried out field and analytical investigations of the shearvane with particular reference to the design of footings and embankments.
He was also active in consulting and was an expert witness in several court cases relating to foundationfailures. He has invented and patented a number of testing instruments. He is an author of over fortypublications including technical books and papers. In recognition of his published work the University ofAuckland awarded him the degree of Doctor of Science in 1990.
In 1979 he founded GDS Instruments Ltd. Widely known as simply “GDS”, the company are world leadersin computer controlled testing systems for geotechnical engineers and geologists. He left the University ofSurrey in 1982 to concentrate full time on developing the company. He invented the microprocessorcontrolled pressure regulator that is the basic element in most GDS lab systems. He devised the computercontrolled triaxial testing system based on the stress path cell. He gives many invited seminars atconferences and symposia. He is now Chairman of GDS and has returned part time to the University ofSurrey.