near-infrared spectra of centaurs and kuiper belt...
TRANSCRIPT

The Astronomical Journal, 135:55–67, 2008 January doi:10.1088/0004-6256/135/1/55c© 2008. The American Astronomical Society. All rights reserved. Printed in the U.S.A.
NEAR-INFRARED SPECTRA OF CENTAURS AND KUIPER BELT OBJECTS
K. M. Barkume, M. E. Brown, and E. L. SchallerDivision of Geological and Planetary Sciences, California Institute of Technology, Pasadena, CA 91101, USA; [email protected]
Received 2007 July 13; accepted 2007 August 26; published 2007 November 29
ABSTRACT
We present here an extensive survey of near-infrared (NIR) spectra of Kuiper belt objects (KBOs) and Centaurstaken with the Keck I Telescope. We find that most spectra in our sample are well characterized by a combinationof water ice and a featureless continuum. A comparative analysis reveals that the NIR spectral properties have littlecorrelation to the visible colors or albedo, with the exception of the fragment KBOs produced from the giant impacton 2003 EL61. The results suggest that the surface composition of KBOs is heterogeneous, though the exposureof water ice may be controlled by geophysical processes. The Centaurs also display diverse spectral properties,but the source of the variability remains unclear. The results for both the KBOs and the Centaurs point to inherentheterogeneity in either the processes acting on these objects or materials from which they formed.
Key words: infrared: solar system – Kuiper Belt – minor planets, asteroids
Online-only material: supplemental data file
1. INTRODUCTION
The Kuiper belt poses a unique opportunity for astronomersto peer back into the formation of our solar system. Composed ofthe debris left after planet formation, Kuiper belt objects (KBOs)are thought to be among the most pristine bodies in the solarsystem. However, KBOs have likely undergone some alterationsince their formation from geophysical, collisional, and spaceweathering processes. Centaurs may have undergone evenmore alteration as their temperatures are increased by closerperihelion passages. KBOs span several orders of magnitudein diameter, and at small sizes they are thought to resemblecomets and be composed largely of primordial materials thatremained at relatively low temperatures. The largest membersof the Kuiper belt, such as Eris and Pluto, resemble planetswith tenuous atmospheres, active resurfacing, and possiblydifferentiated interiors. While this size spectrum provides asingular opportunity to study a variety of planetary processes,the largest objects may be very different from their smallerbrethren. This complicates the task of understanding the smallbodies by extrapolating results from the more easily studiedlarge objects. Furthermore, the surfaces of all these objects arealso likely to be altered by cosmic rays, impacts, and interstellardust, thereby obscuring the materials from which they are made.Despite these complications, the study of KBOs will provideimportant clues to the formation of our solar system and theprocesses that continue to shape it.
Much effort has been put forth in the past decade to under-standing the physical and chemical states of KBOs and Centaursand is well summarized by Barucci et al. (2007). To date, overa hundred objects have measured photometric colors in visi-ble wavelengths, but far fewer objects have spectra due to thefaintness of KBOs. Spectra in the visible wavelengths are oftencharacterized by a red continuum component typically identi-fied as carbon-rich material and some objects may have subtlesilicate spectral features. Near-infrared (NIR) spectra taken overthe past decade have revealed a variety of ices on the surfaces ofKBOs including methane, water, methanol, and nitrogen. Pre-vious studies have shown that the largest KBOs, Eris, Pluto,and 2005 FY9 have spectra dominated by methane (see Barucciet al. (2007) and references therein). In the case of Pluto, N2
and CO have also been detected. The presence of these specieson the largest objects is likely due to their large masses whichallow for volatiles to be retained (Schaller & Brown 2007). Ithas been noted that moderately sized KBOs, such as Quaoarand Orcus, often have surfaces dominated by water ice. Finally,the smallest KBOs and Centaurs for which we have spectra typ-ically appear to be largely featureless in the NIR. The exceptionis a handful of smaller KBOs that have among the deepest waterice absorption features ever detected in the Kuiper belt. Theseobjects have been shown to be dynamically associated with thelarge KBO 2003 EL61 and are thought to be fragments from itsmantle that were ejected during a catastrophic impact (Brownet al. 2007b).
To date, there is no widely accepted standard model of KBOsurface processes that accounts for the varying presence ofwater ice on the moderate to smaller KBOs. One commonlyproposed model describes essentially a two-component surfacemade of dark, carbon-rich deposits and exposed, fresh waterice (Luu & Jewitt 1996). The dark surfaces are thought tobe similar to those observed on comets or Saturn’s moon,Phoebe, and are likely a mixture of materials (Clark et al. 2005).The spectral properties of the crusts are often characterizedby amorphous silicate material, and irradiated, polymerizedhydrocarbons called tholins (Moore et al. 1983), producingthe red visible colors observed and nearly featureless spectraon most KBOs. In this model, fresh ice initially exposed byerosion, impact gardening, outgassing, or cryovolcanism createsa surface with strong water ice signatures. Over time, the surfaceeventually darkens and reddens as it becomes irradiated and anew crust forms, obscuring the water ice signatures.
Thus far most spectra have been analyzed individually of-fering only vignettes of KBO surface characteristics. A com-parative study using the visible and NIR photometric colors ofKBOs by Barucci et al. (2005) found four different color groups,though it remains unclear how these color groups relate to spe-cific spectroscopic features or surface characteristics. Here wepresent a survey of low-resolution NIR spectra of bright KBOsand Centaurs taken with the near-infrared camera (NIRC) on theKeck I Telescope (Matthews & Soifer 1994). The uniformity ofthis survey allows us to study these objects comparatively aswell as individually. Several of the objects in our survey that
55

56 BARKUME, BROWN, & SCHALLER Vol. 135
showed evidence of particularly interesting or unique surfaceshave already been published previously (e.g., 2005 FY9 and2003 EL61). Thus, we concentrate here on a comparative studywith the aim of understanding the surface processes that may begenerally acting on the Centaur and KBO populations. We beginby describing our sample of observed objects in Section 2. Wediscuss the observations and data reduction in Section 3, and theanalysis of the spectra, including the spectral fitting, in Section 4.We find that the properties of the collisional family membersof 2003 EL61 differ from the general population of KBOs andtherefore we describe our results for these two populations sep-arately in Sections 5.1 and 5.2. Finally, we discuss impact thatthe results of this work have on our general understanding ofthe physical processes that occur in the outer solar system inSection 6.
2. THE SAMPLE
For our survey we preferentially selected KBOs with anabsolute magnitude less than 5.0, corresponding to objectswith a diameter longer than about ∼400 km, assuming a10% albedo (Stansberry et al. 2007), though six KBOs haveabsolute magnitudes greater than 5.0. We excluded any KBOsand Centaurs with visual magnitudes greater than ∼21, whichwe found was our effective magnitude limit with NIRC. Targetslocated near the galactic plane were also abandoned due tocontamination from field stars. Of the possible targets, the KBOswere evenly distributed between hot classical and resonantpopulation, with a few objects belonging to the scattered disk.For the purpose of our survey, Centaurs are defined to be objectswith perihelia less than 25 AU. No cold classical objects wereobserved due to the lack of bright targets in this population. Intotal, we observed 33 bright KBOs and 12 Centaurs with NIRCfrom 1998 March to 2007 April.
3. OBSERVATIONS AND DATA REDUCTION
Low-resolution (λ/∆λ ∼ 160) spectra from 1.4 to 2.5 µmwere obtained with NIRC for each object using a 150 linesµm−1 grism and an H–K-order sorting filter. A complete listof observations is provided in Table 1. Targets were identifiedin fields by their motion and tracked during observations bythe telescope. The exposure times for the spectra were between150 s and 300 s, but were typically 200 s. Dithering betweensubsequent images by 5 arcsec was used to subtract most of thebackground sky emission. Solar-type stars were observed forcalibration purposes at similar air masses and times to targetobservations, with the typical differences in air mass being lessthan 0.1.
The raw image processing and spectral extraction were doneusing standard procedures. We first subtracted sequential imagesto remove most of the sky background emission and divided bya flat-field image constructed from a median dome flat. We thenmeasured and removed any curvatures in the sky lines in indi-vidual images. Residual sky emission was measured on eitherside of the target spectrum and subtracted from the image. Thespectrum was then extracted by summing in the spatial direc-tion, typically a 7–10 pixel swath, centered on the target at eachspectral position. Bad pixels were identified by visual inspec-tion and removed. Spectra of calibration stars were extractedsimilarly with the exception of removing the curvature. Sinceexposures were too short for calibration sources to measure theskyline curvature accurately, the curvature measurements wereused from target observations. Target spectra were then divided
1.4 1.6 1.8 2.0 2.2 2.4Wavelength (Microns)
0
1
Rel
ativ
e R
efle
ctan
ce
23
28
15
4
25
Figure 1. The relative reflectance spectra of 2003 EL61 and its collisionalfamily. The KBOs shown above are 25: 2003 EL61, 4: 1995 SM55, 15:2003 TX300, 28: 2005 RR43, and 23: 2003 OP32. Each spectrum is normalizedto 1.0 (the dashed gray lines) and offset to allow for comparison. A modelspectrum of pure water ice is also shown at the top (thick dark gray line). Theregion between 1.8 and 1.9 µm is masked due to the large errors introducedby H2O telluric lines. The thick gray line represents the best-fit model to eachspectrum and is a combination of water ice and a sloped continuum component.See Section 4 for more information on the modeling and Table 2 for the fitresults.
by a calibration star spectra taken at a similar air mass and timeto remove atmospheric absorptions and produce a reflectancespectrum. A more detailed discussion of our data reductionmethods is available in Brown (2000).
The signal to noise was low in individual spectra and thereforemultiple spectra were added together to obtain higher signal tonoise. In many cases, spectra were added over multiple nights(see Table 1). Multiple spectra of a single target were thensummed together weighted by their noise to produce a finalspectrum. We examined individual spectra to look for substantialvariability with time or rotational phase. We did not detect anysignificant variation in the spectra of any object, though smallchanges are undetectable due to noise. As such, the spectra weshow here represent an average spectrum. High signal-to-noisespectra were obtained for most objects with an average of 6000 sof total integration time.
4. ANALYSIS
The reflectance spectrum for each object is shown inFigures 1–7. We broadly find that our results fit with the spectraltrends seen previously for KBOs (see Barucci et al. (2007) for areview). The largest object in our survey, 2005 FY9, has spectralfeatures dominated by methane ice, which has previously beenexplained by the low escape rate of volatiles on large KBOs(Schaller & Brown 2007). The lack of observed methane on theremaining objects in the sample supports the models of Schaller

No. 1, 2008 KBO SPECTRA 57
Table 1Journal of Observations
Number Object UT Date Exposure Time (s) Air mass Calibration Source
Kuiper belt objects1 15875 (1996 TP66) 2000 Jul. 22 5000 1.27–1.02 BD +17 209
2000 Aug. 5 6200 1.21–1.02 BD +05 52122000 Aug. 6 1000 1.01–1.02 BD +05 5212
2 19521 Chaos (1998 WH24) 2000 Sept. 15 11000 1.00–1.36 HD30701, SAO 1498753 20000 Varuna (2000 WR106) 2001 Mar. 10 6000 1.47–1.05 HD 42112, HD 41919
HD 42358, HD418804 24835 (1995 SM55)a 2006 Oct. 9 3000 1.10–1.20 HD 2549855 26181 (1996 GQ21) 2001 Mar. 10 8000 1.14–1.38 HD 150583, HD 148592
HD 151786, HD 1498262001 May 5 4000 1.14–1.27 HD 133688
6 26375 (1999 DE9) 2000 Mar. 10 6000 1.05–1.22 HD 43515, HD 40977HD 42112, HD 148116
7 28978 Ixion (2001 KX76) 2002 May 27 4000 1.29–1.39 HD1008038 33340 (1998 VG44) 2003 Nov. 13 4000 1.00–1.03 HD 2852169 38628 Huya (2000 EB173) 2000 Jun. 18 1800 . . .b SAO 11973
2000 Jun. 19 2700 . . .b SAO 1197310 42301 (2001 UR163) 2004 Nov. 22 3000 1.02–1.08 BD +09 9311 47171 (1999 TC36) 2000 Aug. 6 5200 1.18–1.46 BD +05 5212
2003 Nov. 11 4000 1.11–1.16 BD +07 17312 47932 (2000 GN171) 2001 May 6 6000 1.10–1.18 HD 13368813 50000 Quaoar (2002LM60) 2003 May 10 3000 1.22 HD 155731
2003 May 12 7000 1.23–1.41 HD 161788, HD 15573114 55565 (2002 AW197) 2003 Nov. 10 3000 1.02–1.04 HD 262124
2003 Nov. 11 1000 1.07–1.10 BD +09 20952003 Nov. 12 1000 1.14 BD +09 2095
15 55636 (2002 TX300)a 2003 Nov. 10 2000 1.01–1.00 HD 4612004 Sep. 5 5000 1.01–1.13 HD 4820
16 55637 (2002 UX25) 2003 Nov. 10 6000 1.01–1.04 HD 461, BD +07 36917 55638 (2002 VE95) 2003 Nov. 11 8000 1.01–1.09 BD +8 61518 66652 (1999 RZ253) 2000 Aug. 5 2000 1.33–1.23 HD 204741
2000 Aug. 6 4000 1.22–1.43 HD 204741, BD +05 521219 84522 (2002 TC302) 2003 Nov. 13 5000 1.24–1.00 HD1365020 84922 (2003 VS2) 2005 Oct. 15 4000 1.20–1.49 HD 28136821 119951 (2002 KX14) 2003 May 10 3000 1.29–1.33 HD 14395522 120132 (2003 FY128) 2003 May 5 3000 1.09–1.10 HD 11325423 120178 (2003 OP32)a 2005 Oct. 15 4000 1.11–1.36 HD 20693824 120348 (2004 TY364) 2005 Oct. 15 5000 1.18–1.25 HD 1590725 136108 (2003 EL61)a 2005 Apr. 26 5000 1.01–1.19 HD 12669426 136472 (2005 FY9) 2005 Apr. 26 3000 1.02–1.11 HD 113338
2005 Apr. 27 6000 1.17–1.04 HD 10079627 145452 (2005 RN43 ) 2006 Oct. 7 4000 1.07–1.08 HD 20693828 145453 (2005 RR43)a 2006 Oct. 8 3000 1.05–1.15 G32–8
2006 Oct. 9 3000 1.17–1.29 HD 3482829 2003 AZ84 2004 Nov. 22 4000 1.01–1.12 HD 264528
HD 636902007 Apr. 5 5000 1.02–1.49 BD +13 1721, HD 77708
BD +25 1858, HD 878602007 Apr. 6 4000 1.02–1.10 HD 77708
30 2004 NT33 2005 Oct. 14 3000 1.06–1.01 BD +12 446631 2004 PG115 2004 Sep. 5 6000 1.08–1.23 SAO 14486032 2005 QU182 2006 Oct. 9 4000 1.23–1.39 G 32–833 2005 UQ513 2006 Oct. 7 3000 1.07–1.09 BD +03 351
2006 Oct. 8 3000 1.04–1.11 BD +14 4758Centaurs
34 2060 Chiron (1977 UB) 1998 Aug. 03 500 1.76–1.83 SAO 159027 (A0)35 5145 Pholus (1992 AD) 1998 Mar. 08 2000 1.05–1.22 SAO 100913 (A3)36 8405 Asbolus (1995 GO) 1998 Mar. 07 1000 1.33–1.34 SAO 182160 (A2)37 10199 Chariklo (1997 CU26) 1998 Mar. 07 1000 1.03–1.05 SAO 098558 (A2)38 29981(1999 TD10) 2000 Aug. 6 4000 1.05–1.08 BD +05 521239 31824 Elatus (1999 UG5)b . . . . . . . . . . . .
40 52872 Okyrhoe (1998 SG35) 2003 Nov. 12 4000 1.04–1.08 HD 2606441 54598 Bienor (2000 QC243) 2003 Nov. 11 6000 1.10–1.18 SAO 146792
HD221221

58 BARKUME, BROWN, & SCHALLER Vol. 135
Table 1(Continued)
Number Object UT Date Exposure Time (s) Air mass Calibration Source
42 65489 Ceto (2003 FX128) 2003 May 11 1800 1.05–1.41 HD160805, HD 1075142003 May 12 3200 1.04–1.07 HD 1132542007 Apr. 5 4000 1.25–1.65 BD +01 2956, HD 146396
HD 159741, HD 1555982007 Apr. 6 6000 1.05–1.25 HD 130875, HD 155598
43 83982 Crantor (2002 GO9) 2003 May 12 3000 1.07–1.13 HD 12617044 95626 (2002 GZ32) 2003 May 11 2600 1.01 HD 10751445 127546 (2002 XU93) 2003 Nov. 10 7000 1.03–1.17 HD 262124
2003 Nov. 11 4000 1.01–1.03 HD 262125
Notes.a 2003 EL61 and its associated family members.b Observing log records could not be recovered.
1.4 1.6 1.8 2.0 2.2 2.4Wavelength (Microns)
0
1
Rel
ativ
e R
efle
ctan
ce
13
29
30
5
17
19
11
Figure 2. The relative reflectance spectra for the following KBOs—13: Quaoar,and 29: 2003 AZ84, 30: K40713A, 5: 1996 GQ21, 17: 2002 VE95, 19:2002 TC302, and 11: 1999 TC36. The spectra are shown in decreasing fractionof water ice from bottom to top. See Table 2 for the fraction of water ice detectedin the spectrum and the other fit results for the spectral models. Water ice isdetected on Quaoar, 2003 AZ84, 1996 GQ21, 2002 VE95, and 1999 TC36 atthe 3σ level or higher. 2002 TC302 has a 2σ detection of water ice. We do notdetect additional ice species in the spectra of these KBOs.
& Brown (2007), which suggests that differential loss rates ofvolatiles can provide a first-order explanation for the surfacesof KBOs and Centaurs. 2005 FY9 has been discussed in previ-ous studies (e.g., Licandro et al. 2006; Brown et al. 2007a) andtherefore will not be considered for further analysis.
With few exceptions, the remaining objects have either spec-tral signatures of water ice at 1.5 µm and 2.0 µm with varyingline strengths or show no identifiable spectral features. Ideally,these spectra can provide information about the abundance ofsurface constituents. Approximations to the equations of radia-tive transfer for particulate surfaces have been developed byHapke and others. They allow for the abundances and relativegrain sizes of particles to be determined quantitatively using
1.4 1.6 1.8 2.0 2.2 2.4Wavelength (Microns)
0
1
Rel
ativ
e R
efle
ctan
ce
22
20
33
7
24
31
14
Figure 3. The relative reflectance spectra for the following KBOs—22:2003 FY128, 20: 2003 VS2, 33: K51024A, 7: Ixion, 24: 2004 TY364, 31:K40804A, and 14: 2002 AW97. The spectra are shown in decreasing fraction ofwater ice from bottom to top. See Table 2 for the fraction of water ice detectedin the spectrum and the other fit results for the spectral models. Water ice isdetected on 2003 VS2 at higher than the 3σ level. It is marginally detected onK51024A, Ixion, 2004 TY364, and K40804 at least the 1σ level.
the reflectance spectra (Hapke 1993). However, in practice, itis difficult to obtain accurate abundances because of the uncer-tainties in a number of parameters. To begin, the true geometricalbedo, not the relative reflectance, is needed to estimate abun-dances accurately and few objects in our survey have albedomeasurements. For those with albedo measurements, uncertain-ties remain due to the limited knowledge of the particle scatter-ing properties, degeneracies between intimate and geographicmixtures of the constituents, and poor constraints on the opticalconstants of the materials. With these difficulties in mind, we donot attempt to make precise surface models of the KBO in oursurvey. Still much can be learned by parameterizing the spectraof the whole population and comparing the relative strengths of

No. 1, 2008 KBO SPECTRA 59
1.4 1.6 1.8 2.0 2.2 2.4Wavelength (Microns)
0
1
Rel
ativ
e R
efle
ctan
ce
16
10
3
9
6
12
27
Figure 4. The relative reflectance spectra for the following KBOs—16:2002 UX25, 10: 2001 UR163, 3: Varuna, 9: Huya, 6: 1999 DE9, 12:2000 GN171, and 27: 2005RN43. The spectra are shown in decreasing fractionof water ice from bottom to top. See Table 2 for the fraction of water ice de-tected in the spectrum and the other fit results for the spectral models. No icesare detected on these KBOs.
the spectral signatures of water ice on the surface using Hapkemodels. In particular, we can determine if the data are con-sistent with the simple two-component surface hypothesis ofwater ice and dark, carbon-rich material for the population as awhole. Furthermore, we can relate the fitted parameters of thespectra to other physical and chemical properties of the samplewith the aim of determining the processes that control surfacecharacteristics.
Previously, the spectra obtained in our survey were parame-terized by finding the flux ratio between 1.7 µm region wherewater ice produces little absorption and the 2.0 µm region, whichis at the bottom of the water ice absorption feature (Brown et al.2007b). This method introduces large errors into the parameteri-zation as only small portions of the spectrum are utilized. To usethe full information available in our spectra, we create spectralmodels of the surface reflectance between 1.4 and 2.4 µm usingthe equations of radiative transfer developed by Hapke (1993).To allow for comparison between objects, each spectrum wasnormalized to 1.0 by finding the median reflectance between1.4 and 2.5 µm. The region near the 1.8 µm telluric water lineswas excluded due to the large errors in this wavelength region.After each spectrum was normalized, it was fit with a spectralmodel using a least-squares minimization scheme that utilizesthe Powell method for finding minima. A linear reflectancemodel of water ice and a continuum component was fit to eachspectrum and solved for f , the fraction of water in the spectrum,and m, the slope of the continuum component. The model canbe written as
R(f,m, λ) = fRw(T , g, λ) + (1 − f )(m(λ − 2.0 µm) + 1.0)).(1)
1.4 1.6 1.8 2.0 2.2 2.4Wavelength (Microns)
0
1
Rel
ativ
e R
efle
ctan
ce
1
8
32
2
21
18
Figure 5. The relative reflectance spectra for the following KBOs—1:1996 TP66, 8: 1998 VG44, 33: K50830B, 2: Chaos, 21: 2002 KX14, and18: 1999 RZ256. The spectra are shown in decreasing fraction of water ice frombottom to top. See Table 2 for the fraction of water ice detected in the spectrumand the other fit results for the spectral models. Best-fit models produce negativef values for these KBOs which may be related to variable weather conditionsduring observation. See Section 5 for more details.
Rw is the reflectance spectrum of water ice calculated using theoptical constants from Grundy & Schmitt (1998) at temperature,T , and for grain size, g. The spectral features of water ice showonly slight changes with temperatures in the range expected forthe Kuiper belt, and therefore the temperature was set to 50 K(Grundy & Schmitt 1998). The grain size, which parameterizesthe optical path length through the ice, affects both the lineshape and depth of water ice absorption features but has beenfound to be between ∼20 and ∼100 µm on KBOs. To allowf to be compared across all objects, we set the grain size to50 µm, though different grains may exist on some objects. Theslope of the continuum component, m, is allowed to vary butthe reflectance of the continuum is constrained to be 1.0 at2.0 µm. To match the model to the data, we normalize themodel using the same method of dividing by the median that wasused to normalize the data. The error in the reflectance at eachwavelength used to calculate χ2 was found by first subtractinga smoothed spectrum from the data and finding the standarddeviation of the surrounding pixels. The smoothed spectrumwas created using a boxcar average of a 9 pixel wide regioncentered at each wavelength and the standard deviation wascalculated over the same 9 pixel swath.
Formal statistical 1σ errors in the fit parameters were foundby determining the values of f and m that produced χ2
values equal to χ2min + 1, where χ2
min is the minimum χ2 value(Bevington & Robinson 1993). However, the formal statisticalerrors do not take into account systematic errors and we find thatthey likely underestimate the true errors in our data. To obtainbetter estimates of the true errors, we selected objects in oursurvey whose spectra appeared to be consistent with no water

60 BARKUME, BROWN, & SCHALLER Vol. 135
1.4 1.6 1.8 2.0 2.2 2.4Wavelength (Microns)
0
1
Rel
ativ
e R
efle
ctan
ce
42
37
43
35
41
40
Figure 6. The relative reflectance spectra for the following Centaurs—42:Crantor, 37: Chariklo, 35: Pholus, 43: Ceto, 41: Bienor, and 40: Okyrhoe.The spectra are shown in decreasing fraction of water ice from bottom to top.Water ice is detected on Crantor, Chariklo, Pholus, and Ceto at the 3σ level orhigher. Bienor and Okyrhoe have detections of water ice at a level between 1σ
and 3σ . See Table 2 for the fraction of water ice detected in the spectrum andthe other fit results for the spectral models.
ice by visual inspection. For these objects, we determined theactual error required to have an f consistent with 0 within 3σerrors. We found that the formal statistical errors underestimatedthe true errors by a factor of ∼2 for these objects and thereforewe take the actual 1σ errors to be twice what was found bythe formal statistics for all objects. The fit parameters for eachobject are listed in Table 2.
In addition to the spectral parameters we measured fromthe NIR spectra, we considered the visible color gradients ofthe objects, which are thought to be diagnostic of the carbon-rich materials on KBOs. It has been shown that the visiblespectrum of KBOs between 0.5 µm and 0.8 µm is well describedby a single color gradient, Gv , measured using broadbandphotometry (Hainaut & Delsanti 2002). We obtained visiblecolor measurements for 35 of the 45 objects in our survey frompublished sources (see Table 2 for the full list) and calculated thecolor gradient and its uncertainty using the V , R, and I colorsand the method described in Hainaut & Delsanti (2002). Fiveobjects had no I -band measurements and one object had noR-band measurement. The spectral gradients were calculatedfor these objects using only the two available measurements. Wefind that the average difference in the gradient calculated usingtwo versus three reflectance measurements is small compared tothe errors in the color measurements. We also consider the sizes,albedos, and orbital characteristics of those objects in our surveyfor which measurements are available to gain a comprehensiveunderstanding of these objects. The sizes and albedos are takenfrom Stansberry et al. (2007) and are reproduced in Table 3along with the orbital elements of the objects in our survey.
5. RESULTS
We find that most of the spectra are well fitted by our two-component model and that the spectra had a final reduced χ2
minof ∼1. See Figures 1–7 for the spectra and the best-fit models.Other than 2005 FY9, we find no compelling detections ofadditional ices such as NH3, CH4, CO, or CO2, which areobserved on some outer solar system bodies, though thesespecies may be present in low abundances. Detections of NH3have been reported for Charon and Quaoar (Brown & Calvin2000; Jewitt & Luu 2004). Our spectrum of Quaoar shows asimilar flattening at 2.2 µm that was observed by Jewitt & Luu(2004) but χ2
min is not significantly decreased by the inclusionof NH3 or its hydrate. CH3OH has been previously detected onPholus and 2002 VE95 (Cruikshank et al. 1998; Barucci et al.2006). We find that our two-component model works poorly forPholus unless the region near the 2.3 CH3OH absorption lineis excluded. A three-component model that included CH3OHwas constructed to determine if a better fit could be made byincluding this ice. We find that Pholus had a significant decreasein the χ2
min value by including CH3OH. For 2002 VE95, we findthat the inclusion of CH3OH did not produce a significantlybetter fit to our spectrum and that our measured fraction ofCH3OH in the spectrum is consistent with 0. However, up to25% of the surface can be CH3OH without being detectedin our spectrum due to the lower signal to noise beyond2.2 µm. Consequently, our spectrum may have insufficientsignal to noise to detect the feature seen by Barucci et al. (2006).We find that 1996 GQ21, which has similar spectral features toPholus, also does not have a significant detection of CH3OH,but the signal to noise is similar to 2002 VE95. In summary, wefind that Pholus is the only object in our survey for which theinclusion of a third component, CH3OH, significantly improvedthe fit.
We detected water ice, that is f greater than 0, on 4 out of the12 Centaurs and 12 of the 33 KBOs at the 3σ level or higher. Anadditional 2 Centaurs and 4 KBOs have 1σ detections of waterice on their surfaces. In our modeling, we find that the familymembers of 2003 EL61 are distinguished from the general KBOpopulation by significantly higher fractions of water ice in theirspectra, f and the negative (blue) values for the slope of the NIRcontinuum, m. The four members of the 2003 EL61 collisionalfamily in our survey, 1995 SM55, 2002 TX300, 2003 OP32,and 2005 RR43, as well as 2003 EL61 itself have a mean fof 0.93 and a standard deviation of 0.07. In contrast, the restof the sample has values of f less than 0.55. Given that thefamily members are likely not representative of the generalKBO population, we will treat these objects separately belowand then return to the discussion of the spectral properties of thegeneral population.
To best characterize the spectra, we allow the fraction ofwater ice in the spectrum to take on negative values in our mod-eling, effectively creating the inverse of the water ice spectralfeatures. The aim was to discover if additional spectral charac-teristics could be identified. We find that five objects, Chaos,1999 RZ253, 2002 KX14, 2005 RN43, and K50830B, havenegative f values to within 1σ , but not within the 3σ errors.These objects appear to have broad dips in their reflectance be-tween 1.7 and 2.0 µm. This region straddles the telluric 1.8 µmwater line and the dip may be due to poor correction of thetelluric line as at least three of the objects, 2002 KX14, 2005RN43, and K50830B, were observed under variable weatherconditions and their spectra are likely to have systematic errors.
No. 1, 2008 KBO SPECTRA 61
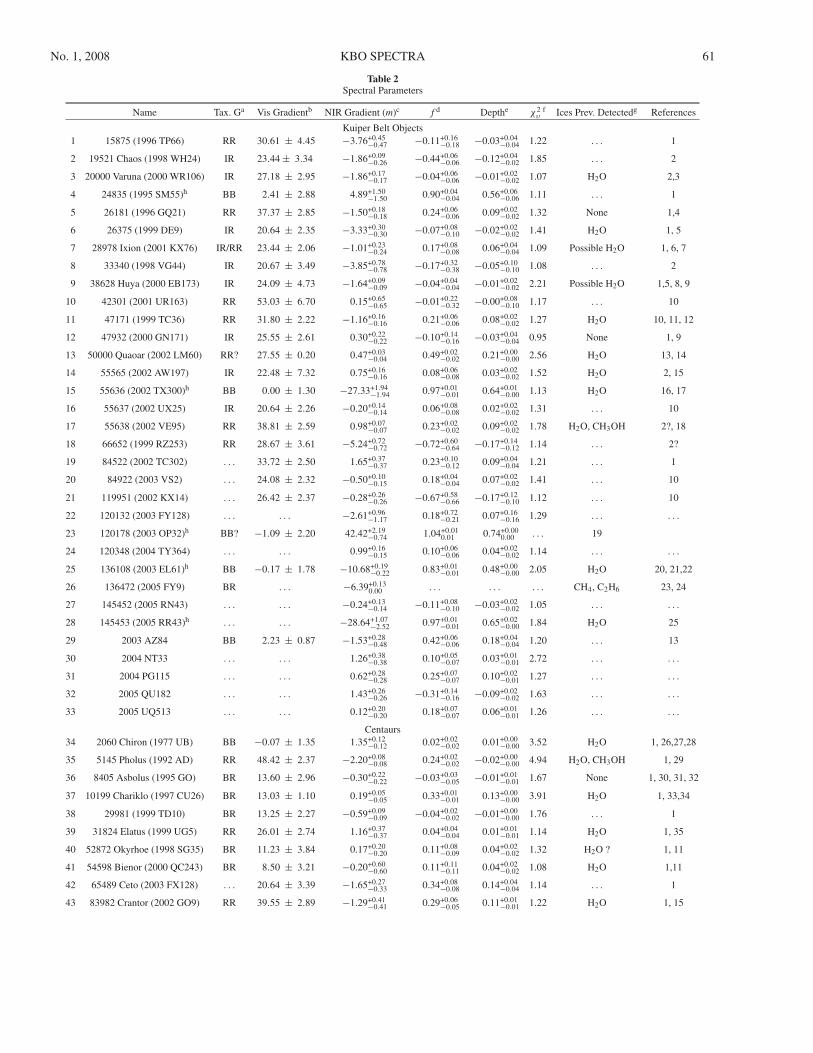
Table 2Spectral Parameters
Name Tax. Ga Vis Gradientb NIR Gradient (m)c f d Depthe χ2υ
f Ices Prev. Detectedg References
Kuiper Belt Objects1 15875 (1996 TP66) RR 30.61 ± 4.45 −3.76+0.45
−0.47 −0.11+0.16−0.18 −0.03+0.04
−0.04 1.22 . . . 1
2 19521 Chaos (1998 WH24) IR 23.44 ± 3.34 −1.86+0.09−0.26 −0.44+0.06
−0.06 −0.12+0.04−0.02 1.85 . . . 2
3 20000 Varuna (2000 WR106) IR 27.18 ± 2.95 −1.86+0.17−0.17 −0.04+0.06
−0.06 −0.01+0.02−0.02 1.07 H2O 2,3
4 24835 (1995 SM55)h BB 2.41 ± 2.88 4.89+1.50−1.50 0.90+0.04
−0.04 0.56+0.06−0.06 1.11 . . . 1
5 26181 (1996 GQ21) RR 37.37 ± 2.85 −1.50+0.18−0.18 0.24+0.06
−0.06 0.09+0.02−0.02 1.32 None 1,4
6 26375 (1999 DE9) IR 20.64 ± 2.35 −3.33+0.30−0.30 −0.07+0.08
−0.10 −0.02+0.02−0.02 1.41 H2O 1, 5
7 28978 Ixion (2001 KX76) IR/RR 23.44 ± 2.06 −1.01+0.23−0.24 0.17+0.08
−0.08 0.06+0.04−0.04 1.09 Possible H2O 1, 6, 7
8 33340 (1998 VG44) IR 20.67 ± 3.49 −3.85+0.78−0.78 −0.17+0.32
−0.38 −0.05+0.10−0.10 1.08 . . . 2
9 38628 Huya (2000 EB173) IR 24.09 ± 4.73 −1.64+0.09−0.09 −0.04+0.04
−0.04 −0.01+0.02−0.02 2.21 Possible H2O 1,5, 8, 9
10 42301 (2001 UR163) RR 53.03 ± 6.70 0.15+0.65−0.65 −0.01+0.22
−0.32 −0.00+0.08−0.10 1.17 . . . 10
11 47171 (1999 TC36) RR 31.80 ± 2.22 −1.16+0.16−0.16 0.21+0.06
−0.06 0.08+0.02−0.02 1.27 H2O 10, 11, 12
12 47932 (2000 GN171) IR 25.55 ± 2.61 0.30+0.22−0.22 −0.10+0.14
−0.16 −0.03+0.04−0.04 0.95 None 1, 9
13 50000 Quaoar (2002 LM60) RR? 27.55 ± 0.20 0.47+0.03−0.04 0.49+0.02
−0.02 0.21+0.00−0.00 2.56 H2O 13, 14
14 55565 (2002 AW197) IR 22.48 ± 7.32 0.75+0.16−0.16 0.08+0.06
−0.08 0.03+0.02−0.02 1.52 H2O 2, 15
15 55636 (2002 TX300)h BB 0.00 ± 1.30 −27.33+1.94−1.94 0.97+0.01
−0.01 0.64+0.01−0.00 1.13 H2O 16, 17
16 55637 (2002 UX25) IR 20.64 ± 2.26 −0.20+0.14−0.14 0.06+0.08
−0.08 0.02+0.02−0.02 1.31 . . . 10
17 55638 (2002 VE95) RR 38.81 ± 2.59 0.98+0.07−0.07 0.23+0.02
−0.02 0.09+0.02−0.02 1.78 H2O, CH3OH 2?, 18
18 66652 (1999 RZ253) RR 28.67 ± 3.61 −5.24+0.72−0.72 −0.72+0.60
−0.64 −0.17+0.14−0.12 1.14 . . . 2?
19 84522 (2002 TC302) . . . 33.72 ± 2.50 1.65+0.37−0.37 0.23+0.10
−0.12 0.09+0.04−0.04 1.21 . . . 1
20 84922 (2003 VS2) . . . 24.08 ± 2.32 −0.50+0.10−0.15 0.18+0.04
−0.04 0.07+0.02−0.02 1.41 . . . 10
21 119951 (2002 KX14) . . . 26.42 ± 2.37 −0.28+0.26−0.26 −0.67+0.58
−0.66 −0.17+0.12−0.10 1.12 . . . 10
22 120132 (2003 FY128) . . . . . . −2.61+0.96−1.17 0.18+0.72
−0.21 0.07+0.16−0.16 1.29 . . . . . .
23 120178 (2003 OP32)h BB? −1.09 ± 2.20 42.42+2.19−0.74 1.04+0.01
0.01 0.74+0.000.00 . . . 19
24 120348 (2004 TY364) . . . . . . 0.99+0.16−0.15 0.10+0.06
−0.06 0.04+0.02−0.02 1.14 . . . . . .
25 136108 (2003 EL61)h BB −0.17 ± 1.78 −10.68+0.19−0.22 0.83+0.01
−0.01 0.48+0.00−0.00 2.05 H2O 20, 21,22
26 136472 (2005 FY9) BR . . . −6.39+0.130.00 . . . . . . . . . CH4, C2H6 23, 24
27 145452 (2005 RN43) . . . . . . −0.24+0.13−0.14 −0.11+0.08
−0.10 −0.03+0.02−0.02 1.05 . . . . . .
28 145453 (2005 RR43)h . . . . . . −28.64+1.07−2.52 0.97+0.01
−0.01 0.65+0.02−0.00 1.84 H2O 25
29 2003 AZ84 BB 2.23 ± 0.87 −1.53+0.28−0.48 0.42+0.06
−0.06 0.18+0.04−0.04 1.20 . . . 13
30 2004 NT33 . . . . . . 1.26+0.38−0.38 0.10+0.05
−0.07 0.03+0.01−0.01 2.72 . . . . . .
31 2004 PG115 . . . . . . 0.62+0.28−0.28 0.25+0.07
−0.07 0.10+0.02−0.01 1.27 . . . . . .
32 2005 QU182 . . . . . . 1.43+0.26−0.26 −0.31+0.14
−0.16 −0.09+0.02−0.02 1.63 . . . . . .
33 2005 UQ513 . . . . . . 0.12+0.20−0.20 0.18+0.07
−0.07 0.06+0.01−0.01 1.26 . . . . . .
Centaurs34 2060 Chiron (1977 UB) BB −0.07 ± 1.35 1.35+0.12
−0.12 0.02+0.02−0.02 0.01+0.00
−0.00 3.52 H2O 1, 26,27,28
35 5145 Pholus (1992 AD) RR 48.42 ± 2.37 −2.20+0.08−0.08 0.24+0.02
−0.02 −0.02+0.00−0.00 4.94 H2O, CH3OH 1, 29
36 8405 Asbolus (1995 GO) BR 13.60 ± 2.96 −0.30+0.22−0.22 −0.03+0.03
−0.05 −0.01+0.01−0.01 1.67 None 1, 30, 31, 32
37 10199 Chariklo (1997 CU26) BR 13.03 ± 1.10 0.19+0.05−0.05 0.33+0.01
−0.01 0.13+0.00−0.00 3.91 H2O 1, 33,34
38 29981 (1999 TD10) BR 13.25 ± 2.27 −0.59+0.09−0.09 −0.04+0.02
−0.02 −0.01+0.00−0.00 1.76 . . . 1
39 31824 Elatus (1999 UG5) RR 26.01 ± 2.74 1.16+0.37−0.37 0.04+0.04
−0.04 0.01+0.01−0.01 1.14 H2O 1, 35
40 52872 Okyrhoe (1998 SG35) BR 11.23 ± 3.84 0.17+0.20−0.20 0.11+0.08
−0.09 0.04+0.02−0.02 1.32 H2O ? 1, 11
41 54598 Bienor (2000 QC243) BR 8.50 ± 3.21 −0.20+0.60−0.60 0.11+0.11
−0.11 0.04+0.02−0.02 1.08 H2O 1,11
42 65489 Ceto (2003 FX128) . . . 20.64 ± 3.39 −1.65+0.27−0.33 0.34+0.08
−0.08 0.14+0.04−0.04 1.14 . . . 1
43 83982 Crantor (2002 GO9) RR 39.55 ± 2.89 −1.29+0.41−0.41 0.29+0.06
−0.05 0.11+0.01−0.01 1.22 H2O 1, 15

62 BARKUME, BROWN, & SCHALLER Vol. 135
Table 2(Continued)
Name Tax. Ga Vis Gradientb NIR Gradient (m)c f d Depthe χ2υ
f Ices Prev. Detectedg References
44 95626 (2002 GZ32) . . . 28.23 ± 4.24 −4.08+4.14−3.83 −0.37+0.77
−2.15 −0.10+0.02−0.01 0.95 . . . . . .
45 127546 (2002 XU93) . . . . . . −0.30+1.54−1.54 0.08+0.32
−0.50 0.03+0.06−0.08 1.36 . . . . . .
Notes.a The Taxonomic groups as defined in Barucci et al., 2005; BB: blue, BR: intermediate blue red, IR: moderately red, RR: red.b The visible (500–800 nm) color gradient in % change in reflectance per 100 nm, calculated using the methods in Hainaut & Delsanti (2002).c The NIR (1.5–2.4 µm) color gradient in % change in reflectance per 100 nm found from slope of the continuum component (m) used to fit the spectralmodel.d The fraction of water ice in the spectrum.e The fractional depth of the 2.0 µm to 1.7 µm spectral regions, where larger depth indicates stronger water ice spectral signatures. The depth is shownhere for comparison with previous studies (e.g. Brown et al (2007a, 2007b)). The depth is calculated using the fitted model spectrum rather than thedata to reduce the noise and has had the continuum contribution subtracted out.f The reduced χ2 value of the spectral model fit to the data.g Spectral features identified in the NIR spectra by other authors.h 2003 EL61 and its associated family members.References. (1) Hainaut & Delsanti (2002); (2) Barucci et al. (2005); (3) Licandro, et al. (2001); (4) Doressoundiram et al. (2003); (5) Jewitt & Luu(2001); (6) Licandro et al. (2002); (7) Boehnhardt et al. (2004); (8) Brown et al. (2000); (9) de Bergh et al. (2004); (10) Tegler, et al. (in preparation)Available at http://www.physics.nau.edu/∼tegler/research/survey.htm; (11) Dotto et al. (2003); (12) Merlin et al. (2005); (13) Fornasier et al. (2004);(14) Jewitt & Luu (2004); (15) Doressoundiram et al. (2005); (16) Doressoundiram et al. (2005); (17) Licandro et al. (2006); (18) Barucci et al. (2006);(19) Rabinowitz, Schaefer & Tourtellotte (2007); (20) Rabinowitz et al. (2006); (21) Trujillo et al. (2007); (22) Merlin et al. (2007); (23) Licandroet al. (2006); (24) Brown et al. (2007); (25) Pinilla-Alonso et al. (2007); (26) Luu et al. (2000); (27) Foster et al. (1999); (28) Romon-Martin et al.(2003); (29) Cruikshank et al. (1998); (30) Barucci et al. (2000); (31) Brown (2000); (32) Romon-Martin et al. (2002); (33) Brown & Koresko (1998);(34) Dotto et al. (2003); (35) Bauer et al. (2002).(Spectral data for all objects in our survey are available as a supplemental data file in the online journal and at http://www.gps.caltech.edu/∼pa/data.html.)
Phyllosilicates and other silicate materials have spectral featuresat 1.9 µm, but these minerals do not reproduce the broad dipthat extends to the region of 1.7 µm in the spectrum. We alsonote that our model produces negative f values for spectra dom-inated by methane bands like that of 2005 FY9, though thereis no indication that methane exists on the five objects listedabove.
5.1. The 2003 EL61 Collisional Family
All the objects in our survey with the strongest signaturesof water ice, that is f greater than 0.55, have previously beenshown to be dynamically related to 2003 EL61 and are likely100–300 km sized fragments ejected from its mantle during amassive collision. The evidence for the giant impact and theformation of the fragments as well as their general spectralcharacteristics are discussed in Brown et al. (2007b). Ragozzine& Brown (2007) discuss the dynamical nature of this familyand find that the collision is over one billion years old and likelyprimordial. Here we discuss in greater detail their spectroscopicfeatures.
In addition to the deep water ice absorption features, thefamily members have uniformly neutral color in the visible.This contrasts with the general KBO population, which showsa diversity of color but is generally red (Figure 8), typicallyattributed to the presence of irradiated organics (Strazzulla et al.1991; Hansen & McCord 2004). The neutral visible colors areconsistent with a relatively pure water ice surface but mayalso indicate a low abundance of the simple ices and organicmaterials from which tholins are formed. The model fits ofthe family members revealed that a second, blue continuumcomponent significantly decreased the minimum χ2 value withthe exception of 2003 OP32. The blue component could be anartifact of modeling with a fixed grain size that is too small.Larger grain sizes would produce a slightly bluer water icespectrum. To determine if the blue component is required by thedata, we created more complex models involving both intimate
1.4 1.6 1.8 2.0 2.2 2.4Wavelength (Microns)
0
1
Rel
ativ
e R
efle
ctan
ce
45
39
34
36
38
44
Figure 7. The relative reflectance spectra for the following Centaurs—45:2002 XU93, 39: Elatus, 34: Chiron, 36: Asbolus, 38: 1999TD10, 44: 2002GZ32.The spectra are shown in decreasing fraction of water ice from bottom to top.No water ice was detected in our data for these Centaurs.
and geographically mixed water ices of varying grain sizes butwere unable to reproduce the observed spectra. As such, the bluecontinuum component appears to be a real feature in the spectraof most of the family members. The slope of the component isvaried, which may reflect the normalization rather than intrinsic

No. 1, 2008 KBO SPECTRA 63
Table 3.Physical Parameters
Name H pv (%)a D (km) a (AU) Ecc Inc (deg) q (AU) References
Kuiper Belt Objects1 15875 (1996 TP66) 6.8 7.4+7
−3 160−45+45 39.21 0.33 5.7 26.35 1
2 19521 Chaos (1998 WH24) 4.9 >5.8 <747 45.59 0.10 12.1 40.94 2, 3
3 20000 Varuna (2000 WR106) 3.7 16+10−8 500−100
+100 42.95 0.05 17.2 40.72 1
4 24835 (1995 SM55)a 4.8 >6.7 <704 41.65 0.10 27.1 37.36 2, 3
5 26181 (1996 GQ21) 5.2 . . . . . . 95.06 0.597 13.3 38.31 . . .
6 26375 (1999 DE9) 4.7 6.85+1.58−1.19 461.0−45.3
+46.1 55.85 0.42 7.60 32.34 1
7 28978 Ixion (2001 KX76) 3.2 12+14−6 650−220
+260 39.62 0.24 19.6 30.072 1
8 33340 (1998 VG44) 6.5 . . . . . . 39.14 0.25 3.0 29.35 . . .
9 38628 Huya (2000 EB173) 4.7 5.04+0.5−0.41 532.6−24.4
+25.1 39.75 0.28 15.5 28.54 1
10 42301 (2001 UR163) 4.2 . . . . . . 51.35 0.284 0.80 36.7666 . . .
11 47171 (1999 TC36) 4.9 7.18+1.53−1.17 414.6−38.2
+38.8 39.23 0.22 8.4 30.56 1
12 47932 (2000 GN171) 6.0 5.68+2.54−1.59 321.05−54.2
+57.4 39.72 0.29 10.8 28.28 1
13 50000 Quaoar (2002 LM60) 2.6 9 ± 3 1260 ± 190 43.54 0.03 8.0 42.02 1, 4
14 55565 (2002 AW197) 3.3 11.77+4.42−3.00 734.6−108.3
+116.4 47.37 0.13 24.4 41.16 1
15 55636 (2002 TX300)a 3.3 >19 <709 43.08 0.123 25.9 37.78 3, 5
1 55637 (2002 UX25) 3.6 11.50+5.09−3.09 681.2−114.0
+115.6 42.52 0.142 19.5 36.48 1
17 55638 (2002 VE95) 5.3 . . . . . . 39.15 0.285 16.4 27.9923 . . .
18 66652 (1999 RZ253) 5.9 29 ± 12 170 ± 39 43.72 0.09 0.60 39.83 2, 3
19 84522 (2002 TC302) 3.9 3.1+2:9−1:2 1150325
+337 55.03 0.29 35.1 39.02 1
20 84922 (2003VS2) 4.2 . . . . . . 39.28 0.073 14.8 36.41 . . .
21 119951 (2002 KX14) 4.4 . . . . . . 39.00 0.041 0.40 37.40 . . .
22 120132 (2003 FY128) 5.0 . . . . . . 49.700 0.25 11.8 37.09 . . .
23 120178 (2003 OP32)a 4.1 . . . . . . 43.18 0.107 27.2 38.56 . . .
24 120348 (2004TY364) 4.5 . . . . . . 38.7 0.067 24.9 36.11 . . .
25 136108 (2003 EL61)a 0.20 84.+10−20 1150−150
+150 43.33 0.19 28.2 35.14 1, 6
26 136472 (2005FY9) −0.30 80.+10−20 1500−200
+300 45.71 0.15 29.0 38.62 1
27 145452 (2005 RN43) 3.9 . . . . . . 41.53 0.02 19.29 40.62 . . .
28 145453 (2005 RR43)a 4.0 . . . . . . 43.05 0.14 28.54 37.19 . . .
29 2003 AZ84 3.9 12.32+4.31−2.91 685.8−95.5
+98.8 39.50 0.179 13.6 32.43 1
30 2004 NT33 . . . . . . . . . 43.44 0.15 31.22 36.85 . . .
31 2004 PG115 . . . . . . . . . 89.83 0.59 16.28 36.42 . . .
32 2005 QU182 . . . . . . . . . 126.4 0.72 14.00 35.39 . . .
33 2005 UQ513 . . . . . . . . . 43.336 0.14 25.72 36.84 . . .
Centaurs34 2060 Chiron (1977 UB) 6.5 7.57+1.03
−0.87 233.3−14.4+14.7 13.701 0.38 6.9 8.45 1
35 5145 Pholus (1992 AD) 7.0 8.0+7−3 140−40
+40 20.411 0.57 24.7 8.74 1
36 8405 Asbolus (1995 GO) 9.0 5.46+1.27−0.86 84.2−7.8
+7.8 18.02 0.621 17.6 6.82 1
37 10199 Chariklo (1997 CU26) 6.4 5.73+0.49−0.42 258.6−10.3
+10.3 15.854 0.175 23.4 13.07 1
38 29981 (1999 TD10) 8.8 4.40+1.42−0.96 103.7−13.5
+13.6 94.97 0.87 6.0 12.25 1
39 31824 Elatus (1999 UG5) 10.1 10+4−3 30+−8
+8| 11.769 0.38 5.3 7.27 1
40 52872 Okyrhoe (1998 SG35) 11.3 2.49+0.81−0.55 52.1−6.9
+6.9 8.38 0.308 15.6 5.79 1
41 54598 Bienor (2000 QC243) 7.6 3.44+1.27−0.82 206.7−30.1
+30.1 16.48 0.200 20.7 13.15 1
42 65489 Ceto (2003 FX128) 6.3 7.67+1.38−1.10 229.7−18.2
+18.6 103.00 0.83 22.3 17.82 1
43 83982 Crantor (2002 GO9) 9.1 11+7−4 60−13
+15 19.537 0.28 12.8 10.92 1
44 95626 (2002 GZ32) 6.8 . . . . . . 23.196 0.223 15.0 18.06 1
45 127546 (2002 XU93) 7.9 . . . . . . 66.950 0.687 78.0 20.95 1
Note.a 2003 EL61 and its associated family members.References. (1) Stansberry et al. (2007); (2) Altenhoff et al. (2004); (3) Grundy et al. (2005); (4) Brown & Trujillo (2004); (5) Ortiz et al. (2004);(6) Rabinowitz et al. (2006).

64 BARKUME, BROWN, & SCHALLER Vol. 135
-10 0 10 20 30 40 50 60Visible Gradient (% slope per 100 nm)
-0.5
0.0
0.5
1.0
Fra
ctio
n of
Wat
er Ic
e in
Spe
ctru
m (
f) 4
15
25
23
4243
44
35
37
10
29
2
13
Figure 8. The fraction of water ice detected in the spectrum versus the visiblecolor gradient for KBOs (black circles) and Centaurs (gray triangles). 2003 EL61and its collisional family are represented by white circles. The errors are the 3σ
error bars. Objects of interest are labeled with numbers as they appear in tables.The thick gray lines represent the expected distribution for a two-componentsystem where water ice and a featureless continuum are the end members and aremixed geographically (see Section 5.2). The different lines represent differentcolor gradients for the featureless component. The dashed gray lines representintimate mixtures of the two components. Once the collisional family of2003 EL61 is excluded, no correlation is found between the fraction of waterice detected in the spectrum of KBOs and Centaurs and their visible colors.
differences between the objects. In an attempt to identify the bluecomponent, we examined the spectra for additional features,but we find no evidence for additional absorptions in thespectra. A similar blue component was reported by Trujilloet al. (2007) for 2003 EL61 and by Pinilla-Alonso et al.(2007) for 2005 RR43. In the case of 2003 EL61, HCN andphyllosilicate clays were both proposed as possible sources ofthe blue continuum component, but no positive identificationwas possible.
While it is difficult to determine much physical informationfor the blue continuum component without better data, thespectra do provide a few clues about the physical state of waterice on the surface. The 1.65 µm crystalline water ice featureis evident in all the spectra of family members. The crystalstructure of water ice is expected to be destroyed by high energyparticles and solar radiation on time scales short compared tothe age of the family (Strazzulla et al. 1991; Hansen & McCord2004; Kouchi & Kuroda 1990), causing the 1.65 µm feature todisappear. However, crystalline water ice is reported on surfacesof icy satellites as well as icy KBOs when spectra of sufficientsignal to noise are available, suggesting that a general processis likely acting to maintain the crystallinity of the water icesurfaces. Both thermal and nonthermal mechanisms have beenproposed as a means to reform crystalline ice on these bodies.Cryovolcanism and outgassing, where surface materials areheated well above the crystallization temperatures of ∼100 K,have been proposed for bodies like Quaoar (Jewitt & Luu 2004).Grundy et al. (2006) and Brown & Calvin (2000) have proposedmaintaining crystalline ice through nonthermal processes suchas slow vapor deposition from micrometeorite bombardmentand nonthermal energy input from radiation. The presence ofcrystalline water ice on the family members appears to preclude
thermal processes as the primary crystallization mechanism.KBOs with diameters less than 300 km are not expected to havesufficient geothermal energy to produce crystalline water icenear or at their surfaces. As such, we argue that the processes ofcrystallizing water ice on these objects is nonthermal in nature.In the future, we expect that any water ice detected on the surfaceof a KBO will be in the crystalline form regardless of size of theKBO.
In addition to the crystalline feature, the large depths of the 1.5and 2.0 µm overtone features suggest that the grain size is largerfor some of the members of the family than is often measured onKBOs. Though the grain size may not represent the true crystalgrain size of the ice, it can be used to judge the relative grainstructures and impurities between objects. Using the modelsfor a water ice surface that include scattering developed forOrcus and 2003 EL61 (Trujillo et al. 2005; 2007), we find thatthe grain sizes are between 100–125 µm on 2002 1995 SM55,2002 TX300 and 2005 RR43—larger than is typically found forKBOs (Barucci et al. 2007). The water ice on 2003 OP32 wasfound to have a grain size of 60 µm, similar to the grain sizethat Trujillo et al. (2007) found for 2003 EL61. The larger grainsizes on the family members may be consistent with water icesurfaces where the crystals have grown due to fewer impurities(Brown et al. 2007a).
From the spectra alone, it is difficult to infer specific detailsabout the giant impact on proto-2003 EL61 as many of theparameters are poorly constrained or ambiguous. The largefraction of water ice detected on the family members couldindicate that the proto 2003 EL61 was differentiated withmaterial ejected largely from an icy mantle. Additionally, thespectral evidence is consistent with heating of the fragmentsduring the impact, leading to devolatilization of carbon-bearingspecies, but the spectral signatures could be explained byother processes. With this in mind, the spectral characteristicsmay be best interpreted as identifying markers for the familymembers.
5.2. KBOs and Centaurs
A two-component surface, with water ice as one end memberand a dark, red, carbon-rich material at the other, could explainthe variety of visible colors and variable presence of water iceseen on KBOs (e.g., Barucci et al. 2005). In such a model,the measured f should correlate with the visible colors. InFigure 8, we see that there is little correlation between theseparameters for either the KBO or the Centaur population. Thecolors of KBOs and Centaurs show no clear trend with f andare often variable amongst objects with similar f values. Forexample, 2003 AZ84 and Quaoar show similar degrees of waterice on their surfaces but 2003 AZ84 is neutral while Quaoaris moderately red. Barucci et al. (2005) argue that KBOs andCentaurs can be organized into four separate color groups (BB,BR, IR, and RR). We find that all the 2003 EL61 collisionalfamily members fall into the bluest group (BB) as well as2003 AZ84, suggesting that this group strongly correlateswith the presence of water ice on the surface (Figure 9).The remaining objects in our survey are distributed among thethree other taxonomic groups: BR, IR, and RR. We find nocorrelation between the remaining three taxonomic groups andany NIR spectral characteristics we measured for our spectra.Specifically, we find that the fraction of water ice in the spectrumcan vary widely amongst the objects in a particular groupand that the groups have similar distributions of f with theexception of the BB group. As such, we do not anticipate that

No. 1, 2008 KBO SPECTRA 65
BB BR IR RRTaxanomic Group
-0.5
0.0
0.5
1.0
Fra
ctio
n of
Wat
er Ic
e in
Spe
ctru
m (
f)
Figure 9. The fraction of water ice detected in the spectrum versus the taxonomicgroup for KBOs (black circles) and Centaurs (gray triangles). 2003 EL61 andits family are presented by white circles. The taxanomic designations are basedon an analysis of the visible and NIR photometric colors and are directly fromBarucci et al. (2005). Each object has been offset to make them more easilydistinguishable. We find that the BB (blue) group is generally well correlatedwith the presence of significant detections of water ice in the spectrum sincethis group is dominated by the 2003 EL61 collisional family members. Ofthe remaining groups, RB (red–blue), IR (intermediate red), and RR (red), wefind no correlation with the fraction of water ice detected in the spectrum. Assuch these taxonomic groups do not appear to correspond to specific spectralsignatures in our NIR spectra.
these taxonomic groups will yield specific information aboutthe surface characteristics above predicting the likelihood of thepresence of ices for objects in the BB group.
Though we do not physically model the surfaces of theKBOs and Centaurs in our survey, we can use models ofsimulated surfaces to predict trends that could be detected inthe parameterization of a population of spectra. We createdartificial spectra of idealized, two-component surfaces withvarying ratios of water ice and a featureless component thatrepresents carbon-rich material. We assume properties of thewater ice and the featureless component based on those observedon icy bodies. The water ice reflectance was modeled in theNIR using the optical constants from Grundy & Schmitt (1998)and assuming isotropic scattering. We assumed a 60% albedofor the visible portion of the water ice reflectance and a grainsize of 50 µm was used. The carbon-rich component is farless characterized, however, so we created a family of modelsassuming different properties for the carbon-rich end member.We assumed that the visible gradient varied between 10% per100 nm and 50% per 100 nm, which are typical values ofthe gradients measured on KBOs (Hainaut & Delsanti 2002).The average NIR gradient, m, that we measured in our owndata was much smaller than the visible gradient and thereforewe set m to 0 for our synthetic carbon-rich component. Thecarbon-rich component was given an albedo of 10% at 550 nm,which is the average albedo of the ice-free objects in our survey(Stansberry et al. 2007). Since the surfaces of KBOs could bemixed either intimately or geographically, we consider bothcases. In these simulations, we tacitly assume that while thecarbon-rich component may be a mixture of materials, it is thesame for all objects and that this material does not alter overtime. For intimate mixtures we use our assumed reflectance
0 5 10 15 20 25Geometric Albedo (%)
-0.2
0.0
0.2
0.4
0.6
Fra
ctio
n of
Wat
er Ic
e in
Spe
ctru
m (
f)
6
11
12
14
19
16
29
3
9
13
7
1
38
42
4140
43
39
35
34
37
36
Figure 10. The fraction of water ice detected in the spectrum versus the albedofor KBOs (black circles) and Centaurs (gray triangles). 2003 EL61 is notshown, but has an albedo of 84+10
−20 and an f of 0.83+0.01−0.01. The albedos are
from Stansberry et al. (2007). Objects of interest are labeled with numbersas they appear in tables. We find no correlation in the fraction of water icedetected in the spectrum and the albedo measured for the object. The thickgray line represents the expected albedo for a given surface fraction of waterice and is determined from our two-component synthetic surface model. In themodel we assume water ice with at 60% albedo and a dark, featureless materialwith a V-band albedo of 10% mix geographically in various ratios. The dashedline represents the distribution expected for an intimate mixture of the twocomponents.
for the carbon-rich component to calculate its single scatteringalbedos. The intimate mixture models were created by linearlymixing the single scatter albedos of water ice and the carbon-rich material and calculating the resulting reflectance using theequations of radiative transfer from Hapke (1993). The syntheticNIR spectrum is then analyzed to determine f and m using thesame methods used for the real spectra and the visible colorgradient is calculated using the methods described in Hainaut& Delsanti (2002). Figure 8 shows the measured Gv and f forthe synthetic surfaces.
We see that our results for the KBOs and Centaurs donot follow any of the models produced above, indicating thatthe surfaces of these objects are not well described by oursynthetic two-component surface model. While the exact f andm measured for our synthetic data depend on poorly knownparameters such as the albedo, the overall trends that our simplesurface modeling predicts should be similar regardless of theparameters of the modeling. Even a model in which the carbon-rich material reddens or the grain size is altered over time cannotexplain the data if this material increasingly obscures the waterice.
The relationship between the albedo of the objects andf further suggests that a simple mixing of two componentsdoes not describe the surface of KBOs or Centaurs well. Thealbedos of KBOs are diverse, ranging from ∼4% up to ∼80%(Stansberry et al. 2007, in press). The dwarf planet-sized KBOshave the highest albedos likely due to resurfacing of CH4 or N2through atmospheric deposition (Stansberry et al. 2007; Brownet al. 2005). In our sample, 17 KBOs and 10 Centaurs havemeasured albedos. If we exclude the methane giants and theKBOs in the collisional family of 2003 EL61, we find that thereis no significant correlation between f and albedo of eitherKBOs or Centaurs using a Kendall rank-correlation test (seeFigure 10). In some cases, we see that objects like 1999 TC36
66 BARKUME, BROWN, & SCHALLER Vol. 135
0 500 1000 1500Diameter (km)
-0.2
0.0
0.2
0.4
0.6F
ract
ion
of W
ater
Ice
in S
pect
rum
(f)
6
11
12
14
19
16
29
3 9
13
7
1
38
42
4140
43
39
35
34
37
36
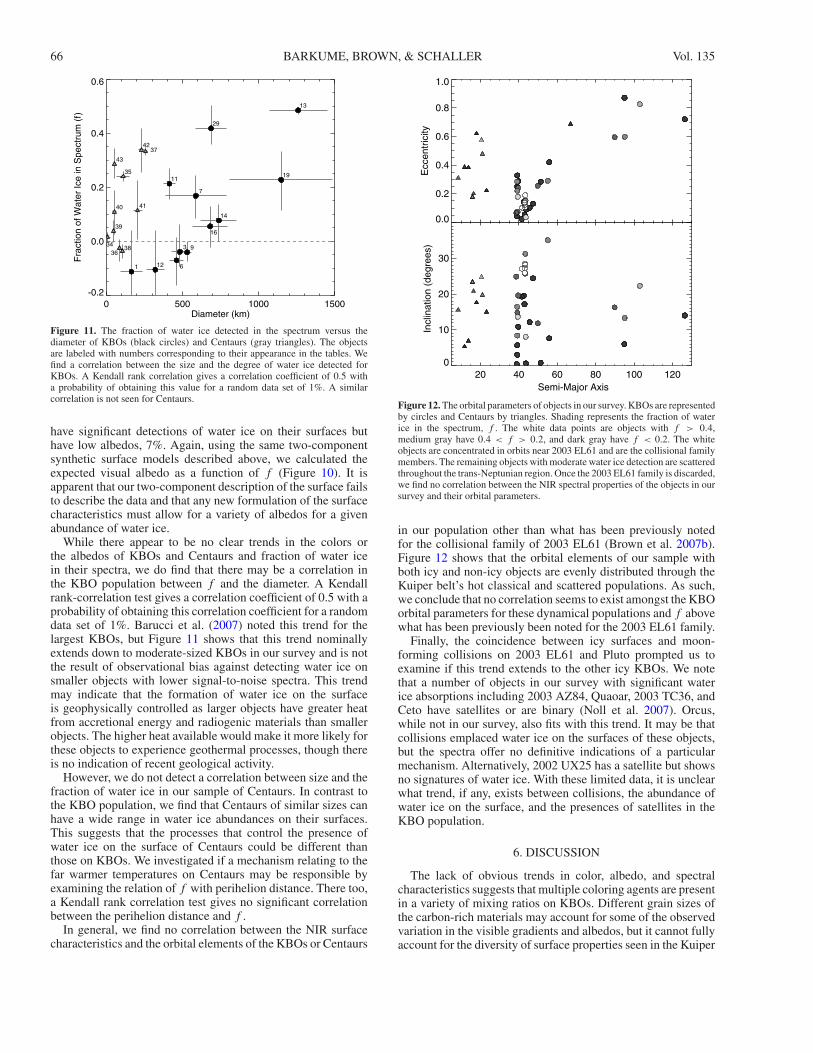
Figure 11. The fraction of water ice detected in the spectrum versus thediameter of KBOs (black circles) and Centaurs (gray triangles). The objectsare labeled with numbers corresponding to their appearance in the tables. Wefind a correlation between the size and the degree of water ice detected forKBOs. A Kendall rank correlation gives a correlation coefficient of 0.5 witha probability of obtaining this value for a random data set of 1%. A similarcorrelation is not seen for Centaurs.
have significant detections of water ice on their surfaces buthave low albedos, 7%. Again, using the same two-componentsynthetic surface models described above, we calculated theexpected visual albedo as a function of f (Figure 10). It isapparent that our two-component description of the surface failsto describe the data and that any new formulation of the surfacecharacteristics must allow for a variety of albedos for a givenabundance of water ice.
While there appear to be no clear trends in the colors orthe albedos of KBOs and Centaurs and fraction of water icein their spectra, we do find that there may be a correlation inthe KBO population between f and the diameter. A Kendallrank-correlation test gives a correlation coefficient of 0.5 with aprobability of obtaining this correlation coefficient for a randomdata set of 1%. Barucci et al. (2007) noted this trend for thelargest KBOs, but Figure 11 shows that this trend nominallyextends down to moderate-sized KBOs in our survey and is notthe result of observational bias against detecting water ice onsmaller objects with lower signal-to-noise spectra. This trendmay indicate that the formation of water ice on the surfaceis geophysically controlled as larger objects have greater heatfrom accretional energy and radiogenic materials than smallerobjects. The higher heat available would make it more likely forthese objects to experience geothermal processes, though thereis no indication of recent geological activity.
However, we do not detect a correlation between size and thefraction of water ice in our sample of Centaurs. In contrast tothe KBO population, we find that Centaurs of similar sizes canhave a wide range in water ice abundances on their surfaces.This suggests that the processes that control the presence ofwater ice on the surface of Centaurs could be different thanthose on KBOs. We investigated if a mechanism relating to thefar warmer temperatures on Centaurs may be responsible byexamining the relation of f with perihelion distance. There too,a Kendall rank correlation test gives no significant correlationbetween the perihelion distance and f .
In general, we find no correlation between the NIR surfacecharacteristics and the orbital elements of the KBOs or Centaurs
0.0
0.2
0.4
0.6
0.8
1.0
Ecc
entr
icity
20 40 60 80 100 120Semi-Major Axis
0
10
20
30
Incl
inat
ion
(deg
rees
)
Figure 12. The orbital parameters of objects in our survey. KBOs are representedby circles and Centaurs by triangles. Shading represents the fraction of waterice in the spectrum, f . The white data points are objects with f > 0.4,medium gray have 0.4 < f > 0.2, and dark gray have f < 0.2. The whiteobjects are concentrated in orbits near 2003 EL61 and are the collisional familymembers. The remaining objects with moderate water ice detection are scatteredthroughout the trans-Neptunian region. Once the 2003 EL61 family is discarded,we find no correlation between the NIR spectral properties of the objects in oursurvey and their orbital parameters.
in our population other than what has been previously notedfor the collisional family of 2003 EL61 (Brown et al. 2007b).Figure 12 shows that the orbital elements of our sample withboth icy and non-icy objects are evenly distributed through theKuiper belt’s hot classical and scattered populations. As such,we conclude that no correlation seems to exist amongst the KBOorbital parameters for these dynamical populations and f abovewhat has been previously been noted for the 2003 EL61 family.
Finally, the coincidence between icy surfaces and moon-forming collisions on 2003 EL61 and Pluto prompted us toexamine if this trend extends to the other icy KBOs. We notethat a number of objects in our survey with significant waterice absorptions including 2003 AZ84, Quaoar, 2003 TC36, andCeto have satellites or are binary (Noll et al. 2007). Orcus,while not in our survey, also fits with this trend. It may be thatcollisions emplaced water ice on the surfaces of these objects,but the spectra offer no definitive indications of a particularmechanism. Alternatively, 2002 UX25 has a satellite but showsno signatures of water ice. With these limited data, it is unclearwhat trend, if any, exists between collisions, the abundance ofwater ice on the surface, and the presences of satellites in theKBO population.
6. DISCUSSION
The lack of obvious trends in color, albedo, and spectralcharacteristics suggests that multiple coloring agents are presentin a variety of mixing ratios on KBOs. Different grain sizes ofthe carbon-rich materials may account for some of the observedvariation in the visible gradients and albedos, but it cannot fullyaccount for the diversity of surface properties seen in the Kuiper

No. 1, 2008 KBO SPECTRA 67
belt. This may indicate inherent heterogeneity in the surfaceproperties of the general KBO population. With the exceptionof very blue, icy objects, the results presented here for the NIRdata do not support clear ties between the photometric colors,specific spectral types, and surface characteristics.
The modest trend in size and water ice abundance that wedetected indicates that water ice may be geothermally controlledon the surfaces of KBOs. With these mechanism though, wefind no evidence that suggests that these surfaces are a resultof recent activity. From the minimum dynamical lifetime of the2003 EL61 family members of approximately 1 Gyr (Ragozzine& Brown 2007), it is possible that the water ice surfaceswe observe in the Kuiper belt are ancient surfaces formedwhen the KBOs had hotter interiors and the impact rates werehigher.
At the moment, though, trends seen in our data are sufficientlytenuous that it is difficult to make any strong conclusions aboutthe relative importance of size and collisions in determiningsurface properties. Our survey included nearly all the KBOsthat are bright enough to easily obtain NIR spectra from largetelescopes, but future spectral studies of newly discovered,bright objects, and additional albedo measurements shouldclarify trends seen in our data. While much remains to be learnedabout the overall mechanisms shaping the outer solar systembodies, we find that a comparative approach to examiningspectra provides a powerful additional tool for understandingthese processes.
This research is funded by the California Institute of Technol-ogy and is also supported by the NASA Planetary Astronomyprogram. Data presented herein were obtained at the W. M.Keck Observatory, which is operated as a scientific partnershipamong the California Institute of Technology, the Universityof California, and the National Aeronautics and Space Admin-istration. The observatory was made possible by the generousfinancial support of the W. M. Keck Foundation. The authorsthank Darin Ragozzine, Deanne Rogers, Timothy Glotch, andOded Aharonson for their helpful discussions regarding this pa-per. We also thank Antonin Bouchez and Megan Scwamb fortheir help during observations.
REFERENCES
Altenhoff, W. J., Bertoldi, F., & Menten, K. M. 2004, A&A, 415, 771Barucci, M. A., Belskaya, I. N., Fulchignoni, M., & Birlan, M. 2005, AJ, 130,
1291Barucci, M. A., Brown, M. E., Emery, J. P., & Merlin, F. 2007, in The Solar
System Beyond Neptune, ed. M. A. Barucci et al. (Tucson, AZ: Univ. ArizonaPress) in press
Barucci, M. A., de Bergh, C., Cuby, J.-G., Le, Bras A., Schmitt, B., & Romon,J. 2000, A&A, 357, L53
Barucci, M. A., Merlin, F., Dotto, E., Doressoundiram, A., & de Bergh, C. 2006,A&A, 455, 725
Bauer, J. M., Meech, K. J., Fernandez, Y. R., Farnham, T. L., & Roush, T. L.2002, PASP, 114, 1309
Bevington, P. R, & Robinson, D. K. 1993, Data Reduction and Error Analysis(New York: McGraw-Hill)
Boehnhardt, H., Bagnulo, S., Muinonen, K., Barucci, M. A., Kolokolova, L.,Dotto, E., & Tozzi, G. P. 2004, A&A, 415, L21
Brown, M. E. 2000, AJ, 119, 977Brown, M. E., Barkume, K. M., Blake, G. A., Schaller, E. L., Rabinowitz, D.
L., Roe, H. G., & Trujillo, C. A. 2007a, AJ, 133, 284
Brown, M. E., Barkume, K. M., Ragozzine, D., & Schaller, E. L. 2007b, Nature,446, 294
Brown, M. E., Blake, G. A., & Kessler, J. E. 2000, ApJ, 543, L163Brown, M. E., & Calvin, W. M. 2000, Science, 287, 107Brown, M. E., & Koresko, C. C. 1998, ApJ, 505, L65Brown, M. E., & Trujillo, C. A. 2004, AJ, 127, 2413Brown, M. E., Trujillo, C. A., & Rabinowitz, D. L. 2005, ApJ, 635, L97Clark, R. N., et al. 2005, Nature, 435, 66Cruikshank, D. P., et al. 1998, Icarus, 135, 389de Bergh, C., et al. 2004, A&A, 416, 791Doressoundiram, A., Barucci, M. A., Tozzi, G. P., Poulet, F., Boehnhardt, H.,
de Bergh, C., & Peixinho, N. 2005a, P&SS, 53, 1501Doressoundiram, A., Peixinho, N., Doucet, C., Mousis, O., Barucci, M. A.,
Petit, J. M., & Veillet, C. 2005b, Icarus, 174, 90Doressoundiram, A., Tozzi, G. P., Barucci, M. A., Boehnhardt, H.,
Fornasier, S., & Romon, J. 2003, AJ, 125, 2721Dotto, E., Barucci, M. A., Boehnhardt, H., Romon, J., Doressoundiram, A.,
Peixinho, N., de Bergh, C., & Lazzarin, M. 2003a, Icarus, 162, 408Dotto, E., Barucci, M. A., Leyrat, C., Romon, J., de Bergh, C., & Licandro, J.
2003, Icarus, 164, 122Fornasier, S., et al. 2004, A&A, 421, 353Foster, M. J., Green, S. F., McBride, N., & Davies, J. K. 1999, Icarus, 141, 408Grundy, W. M., Noll, K. S., & Stephens, D. C. 2005, Icarus, 176, 184Grundy, W. M., & Schmitt, B. 1998, J. Geophys. Res., 103, 25809Grundy, W. M., Young, L. A., Spencer, J. R., Johnson, R. E., Young, E. F., &
Buie, M. W. 2006, Icarus, 184, 543Hainaut, O. R., & Delsanti, A. C. 2002, A&A, 389, 641Hansen, G. B., & McCord, T. B. 2004, J. Geophys. Res. (Planets), 109, 1012Hapke, 1993, Theory of Reflectance and Emittance Spectroscopy (Cambridge,
MA: Cambridge Univ. Press)Jewitt, D. C., & Luu, J. X. 2001, AJ, 122, 2099Jewitt, D. C., & Luu, J. 2004, Nature, 432, 731Kouchi, A., & Kuroda, T. 1990, Nature, 344, 134Licandro, J., di Fabrizio, L., Pinilla-Alonso, N., de Leon, J., & Oliva, E. 2006,
A&A, 457, 329Licandro, J., Ghinassi, F., & Testi, L. 2002, A&A,
388, L9Licandro, J., Oliva, E., & Di Martino, M. 2001, A&A, 373, L29Licandro, J., Pinilla-Alonso, N., Pedani, M., Oliva, E., Tozzi, G. P., & Grundy,
W. M. 2006, A&A, 445, L35Luu, J., & Jewitt, D. 1996, AJ, 112, 2310Luu, J. X., Jewitt, D. C., & Trujillo, C. 2000, ApJ, 531, L151Matthews, K., & Soifer, B. T. 1994, ExA, 3, 77Merlin, F., Barucci, M. A., Dotto, E., de Bergh, C., & Lo Curto, G. 2005, A&A,
444, 977Merlin, F., Guilbert, A., Dumas, C., Barucci, M. A., de Bergh, C., & Vernazza,
P. 2007, A&A, 466, 1185Moore, M. H., Donn, B., Khanna, R., & A’Hearn, M. F. 1983, Icarus, 54, 388Noll, K. S., Grundy, W. M., Chiang, E. I., Margot, J.-L., & Kern, S. D. 2007, in
The Solar System Beyond Neptune, ed. M. A. Barucci et al. (Tucson, AZ:Univ. Arizona Press) in press
Ortiz, J. L., et al. 2004, A&A, 420, 383Pinilla-Alonso, N., Licandro, J., Gil-Hutton, R., & Brunetto, R. 2007, A&A,
468, L25Rabinowitz, D. L., Barkume, K., Brown, M. E., Roe, H., Schwartz, M.,
Tourtellotte, S., & Trujillo, C. 2006, ApJ, 639, 1238Rabinowitz, D. L., Schaefer, B. E., & Tourtellotte, S. W. 2007, AJ, 133, 26Ragozzine, D., & Brown, M. E. 2007, AJ, 134, 6Romon-Martin, J., Barucci, M. A., de Bergh, C., Doressoundiram, A., Peixinho,
N., & Poulet, F. 2002, Icarus, 160, 59Romon-Martin, J., Delahodde, C., Barucci, M. A., de Bergh, C., & Peixinho,
N. 2003, A&A, 400, 369Schaller, E. L., & Brown, M. E. 2007, ApJ, 659, L61Stansberry, J., Grundy, W., Brown, M., Cruikshank, D., Spencer, J.,
Trilling, D., & Margot, J.-L. 2007, in The Solar System Beyond Neptune,ed. M. A. Barucci et al. (Tucson, AZ: Univ. Arizona Press) in press
Strazzulla, G., Leto, G., Baratta, G. A., & Spinella, F. 1991, J. Geophys. Res.,96, 17547
Trujillo, C. A., Brown, M. E., Barkume, K. M., Schaller, E. L., & Rabinowitz,D. L. 2007, ApJ, 655, 1172
Trujillo, C. A., Brown, M. E., Rabinowitz, D. L., & Geballe, T. R. 2005, ApJ,627, 1057