nbj’s global supplement & nutrition industry report · nbj’s global supplement &...
TRANSCRIPT

NBJ’s Global Supplement & Nutrition Industry Report
2012 An analysis of markets, trends, competition and strategy in the Global Nutrition Industry
NBJ’s Global Supplement & Nutrition Industry Report 2012
2 www.nutritionbusinessjournal.com ©2012 Penton Media, Inc.

Table of Contents
©2012 Penton Media, Inc. www.nutritionbusinessjournal.com 3
2.1. ACKNOWLEDGEMENTS ................................................................................................................................................... 17 2.2. RESEARCH METHODOLOGY ............................................................................................................................................. 17
2.2.1. Disclaimer ........................................................................................................................................................ 18 2.2.2. Copyright ......................................................................................................................................................... 18
2.3. DEFINITIONS ................................................................................................................................................................. 19 2.3.1. Product Categories .......................................................................................................................................... 19 2.3.2. Sales Channels ................................................................................................................................................. 21 2.3.3. Global Regions ................................................................................................................................................. 22
3.1. TOTAL NUTRITION INDUSTRY ........................................................................................................................................... 24 3.2. GLOBAL SUPPLEMENT SALES ........................................................................................................................................... 33 3.3. GLOBAL NATURAL & ORGANIC FOOD SALES ....................................................................................................................... 37 3.4. GLOBAL FUNCTIONAL FOOD SALES ................................................................................................................................... 40 3.5. GLOBAL NATURAL & ORGANIC PERSONAL CARE & HOUSEHOLD PRODUCTS ............................................................................. 43 3.6. A BRIEF HISTORY OF THE GLOBAL NUTRITION INDUSTRY ....................................................................................................... 46 3.7. TRENDS & CASE STUDIES ................................................................................................................................................ 51
3.7.1. Supplement Regulators Worldwide Grapple with Four Parallel Issues ............................................................ 51 3.7.2. U.S. Education Spurs Global Growth of Supplements through Practitioner Channel ...................................... 55 3.7.3. Nu Skin and Herbalife Chart Two Paths to Global Growth .............................................................................. 57 3.7.4. Leapfrogging 50 Years of Poor Choices and Conventional Wisdom ................................................................ 60 3.7.5. Regulatory Climate in Europe Moves Closer to Harmonization ....................................................................... 63 3.7.6. Predictions for the European Nutrition Industry .............................................................................................. 66 3.7.7. Natural Food Trends in Europe ........................................................................................................................ 67 3.7.8. Sports Nutrition in the Not-So-Common European Market ............................................................................. 69 3.7.9. NutriBeauty Looks for Growth in Burgeoning Middle Classes Across the Globe ............................................. 73
4.1. U.S. NUTRITION INDUSTRY ............................................................................................................................................. 77 4.1.1. Product Category Sales .................................................................................................................................... 77 4.1.2. Channel Sales ................................................................................................................................................... 80 4.1.3. Growth & Forecast ........................................................................................................................................... 83
4.2. U.S. DIETARY SUPPLEMENTS ........................................................................................................................................... 85 4.2.1. Dietary Supplements vs. U.S. Nutrition Industry .............................................................................................. 85 4.2.2. Product Category Sales .................................................................................................................................... 86 4.2.3. Channel Sales ................................................................................................................................................... 95 4.2.4. Growth & Forecast ........................................................................................................................................... 96
4.3. TRENDS ....................................................................................................................................................................... 98 4.3.1. Dietary Supplement Industry Agrees: NDIs Need a Do-Over ........................................................................... 98 4.3.2. Does Europe Do a Better Job of Policing Its Food Supply than the United States? ........................................ 100 4.3.3. U.S. Nutricosmetics Market Offers Tremendous Growth Potential ............................................................... 103 4.3.4. Açaí Berry Weight-Loss Scammer Hit by FTC ................................................................................................. 105 4.3.5. Healthcare Costs Threaten Society as We Know It ........................................................................................ 106 4.3.6. ‘Natural’ Lawsuits Pick up Steam .................................................................................................................. 108
NBJ’s Global Supplement & Nutrition Industry Report 2012
4 www.nutritionbusinessjournal.com ©2012 Penton Media, Inc.
5.1. NUTRITION INDUSTRY .................................................................................................................................................. 111 5.2. SUPPLEMENTS ............................................................................................................................................................ 117 5.3. TRENDS ..................................................................................................................................................................... 119
5.3.1. Health Canada on Digestive Enzymes: 'For Occasional Use Only' ................................................................. 119 5.3.2. Organic Equivalency Agreement between US and Canada Spreads to EU .................................................... 120
6.1. NUTRITION INDUSTRY .................................................................................................................................................. 123 6.2. SUPPLEMENTS ............................................................................................................................................................ 128 6.3. TRENDS ..................................................................................................................................................................... 130
6.3.1. Latin America: The World’s Next Functional Beverage Hotspot? .................................................................. 130 6.3.2. Fragmented Latin American Markets Make Regulatory Changes Difficult ................................................... 131 6.3.3. Regulation Relaxation May Unlock Brazil’s Massive Natural Products Market ............................................ 131
7.1. GERMANY .................................................................................................................................................................. 135 7.1.1. Nutrition Industry .......................................................................................................................................... 135 7.1.2. Supplements .................................................................................................................................................. 140 7.1.3. Case Study: German Company Taking Drug Route for Its Herbal Products in 49 Global Markets ................ 142
7.2. FRANCE ..................................................................................................................................................................... 145 7.2.1. Nutrition Industry .......................................................................................................................................... 145 7.2.2. Supplements .................................................................................................................................................. 150
7.3. UNITED KINGDOM ....................................................................................................................................................... 152 7.3.1. Nutrition Industry .......................................................................................................................................... 152 7.3.2. Supplements .................................................................................................................................................. 157 7.3.3. Case Study: Hain Celestial Ups UK Presence, Adapts to a New Class of Natural Consumers ........................ 159 7.3.4. Trend: Cash Injection to Boost Scotland’s Functional Food Sector ................................................................ 161
7.4. ITALY ........................................................................................................................................................................ 162 7.4.1. Nutrition Industry .......................................................................................................................................... 162 7.4.2. Supplements .................................................................................................................................................. 167
7.5. SCANDINAVIA ............................................................................................................................................................. 169 7.5.1. Nutrition Industry .......................................................................................................................................... 169 7.5.2. Supplements .................................................................................................................................................. 174 7.5.1. Case Study: Swedish MLM Oriflame Builds a Beauty Empire in the Developing World ................................. 176
7.6. SPAIN ....................................................................................................................................................................... 179 7.6.1. Nutrition Industry .......................................................................................................................................... 179 7.6.2. Supplements .................................................................................................................................................. 184 7.6.3. Trend: Spain Proves to Be a Leader in Functional Food Innovation ............................................................... 185 7.6.4. Case Study: Contador Stripped of Tour Win for Doping, Dietary Supplements Likely Culprit ........................ 189
7.7. SWITZERLAND & AUSTRIA ............................................................................................................................................. 190 7.7.1. Nutrition Industry .......................................................................................................................................... 190 7.7.2. Supplements .................................................................................................................................................. 195 7.7.3. Case Study: Lonza Suffers from Strength of Swiss Franc ............................................................................... 197
7.8. NETHERLANDS ............................................................................................................................................................ 198 7.8.1. Nutrition Industry .......................................................................................................................................... 198 7.8.2. Supplements .................................................................................................................................................. 202
7.9. BELGIUM & LUXEMBOURG ............................................................................................................................................ 204 7.9.1. Nutrition Industry .......................................................................................................................................... 204 7.9.2. Supplements .................................................................................................................................................. 208
8.1. RUSSIA/OTHER EASTERN EUROPE .................................................................................................................................. 212 8.1.1. Nutrition Industry .......................................................................................................................................... 212

Table of Contents
©2012 Penton Media, Inc. www.nutritionbusinessjournal.com 5
8.1.2. Supplements .................................................................................................................................................. 217 8.1.1. Case Study: Ferrosan Buy Makes Pfizer Stronger Player in Russian Market .................................................. 219 8.1.2. Case Study: Is Pepsico’s Purchase of Russian Dairy Firm All It’s Cracked Up to Be? ...................................... 220 8.1.3. Trend: Fortified Food Sales In Russia Growing ............................................................................................... 221 8.1.4. Trend: IADSA Helping Shape Russian Regulations ......................................................................................... 221
8.2. POLAND .................................................................................................................................................................... 222 8.2.1. Nutrition Industry .......................................................................................................................................... 222 8.2.2. Supplements .................................................................................................................................................. 226
9.1. NUTRITION INDUSTRY .................................................................................................................................................. 230 9.2. SUPPLEMENTS ............................................................................................................................................................ 234 9.3. TRENDS ..................................................................................................................................................................... 236
9.3.1. Is Turkey the Next Big Market for Direct-to-Consumer Sales?....................................................................... 236 9.3.2. Health Foods Market Growing Nearly 12% a Year in Saudi Arabia, UAE ...................................................... 238
10.1. JAPAN ....................................................................................................................................................................... 241 10.1.1. Nutrition Industry .......................................................................................................................................... 241 10.1.2. Supplements .................................................................................................................................................. 246 10.1.3. Case Study: Japan’s Ingredient Suppliers Mostly Unscathed by Nuclear Disaster ......................................... 248
10.2. CHINA ....................................................................................................................................................................... 252 10.2.1. Nutrition Industry .......................................................................................................................................... 252 10.2.2. Supplements .................................................................................................................................................. 257 10.2.3. Case Study: 10 Days, 10 Insights: A Whirlwind Tour Through China ............................................................. 259 10.2.4. Trend: Navigating the Legal Landscape in China’s Tarnished Nutrition Industry .......................................... 261 10.2.5. Trend: Exploding Watermelons, Hot Pot Oil and Overlapping Regulations ................................................... 264 10.2.6. Case Study: Chinese Vitamin C Companies Lose Price-Fixing Decision .......................................................... 266 10.2.7. Trend: China is Cheaper, But Should You Do Business There? ....................................................................... 267 10.2.8. Trend: Does ‘Made in China’ Matter to Supplement Consumers? ................................................................. 269
10.3. INDIA & OTHER ASIA ................................................................................................................................................... 272 10.3.1. Nutrition Industry .......................................................................................................................................... 272 10.3.2. Supplements .................................................................................................................................................. 276 10.3.3. Trend: Indian Nutrition Industry Burgeoning with Potential ......................................................................... 278 10.3.4. Trend: From Sanofi to Kaneka, Global Attention turns to India .................................................................... 279 10.3.5. Case Study: Dr. Bronner’s a Rising Star in South Korean Home Shopping ..................................................... 280 10.3.6. Trend: Asian Regulatory Changes Likely ........................................................................................................ 282 10.3.7. Case Study: Is Vietnam The Next Asian Tiger? ............................................................................................... 283 10.3.8. Case Study: Singapore-Based Supplement Company Generates $300 Million in Sales ................................. 284
11.1. NUTRITION INDUSTRY .................................................................................................................................................. 289 11.2. SUPPLEMENTS ............................................................................................................................................................ 294 11.3. TRENDS ..................................................................................................................................................................... 296
11.3.1. ‘Coke and Fries’ Debacle a Setback for Integrative Medicine ........................................................................ 296 11.3.2. Australia Boasts High Per Capita Use of Supplements .................................................................................. 297
12.1.1. Nutrition Industry .......................................................................................................................................... 301 12.1.2. Supplements .................................................................................................................................................. 306 12.1.3. Trend: Africa Is All About Opportunity ........................................................................................................... 308 12.1.4. Canadian Company Describes Entry into West Africa's Supplement Market ................................................ 310
NBJ’s Global Supplement & Nutrition Industry Report 2012
6 www.nutritionbusinessjournal.com ©2012 Penton Media, Inc.
13.1. ALTICOR (AMWAY, NUTRILITE) ...................................................................................................................................... 315 13.2. ATRIUM INNOVATIONS (GARDEN OF LIFE, PURE ENCAPSULATIONS, DOUGLAS LABS, SEROYAL) .................................................. 317 13.3. BAYER GROUP ............................................................................................................................................................ 320 13.4. CARLYLE GROUP - NBTY .............................................................................................................................................. 322 13.5. FOREVER LIVING PRODUCTS .......................................................................................................................................... 324 13.6. GLANBIA (OPTIMUM NUTRITION, BSN, GLANBIA NUTRITIONALS) ........................................................................................ 325 13.7. GLAXOSMITHKLINE...................................................................................................................................................... 327 13.8. HERBALIFE INTERNATIONAL ........................................................................................................................................... 329 13.9. MARKET AMERICA SCIENCE (ISOTONIX) ........................................................................................................................... 331 13.10. MELALEUCA ........................................................................................................................................................... 332 13.11. MONARCH HEALTH PRODUCTS (MONAVIE) ................................................................................................................. 333 13.12. NATURE'S SUNSHINE PRODUCTS ................................................................................................................................ 335 13.13. NESTLÉ ................................................................................................................................................................. 337 13.14. NU SKIN ENTERPRISES (PHARMANEX) ......................................................................................................................... 339 13.15. PFIZER (CENTRUM, CALTRATE) .................................................................................................................................. 341 13.16. PLETHICO (NATROL) ................................................................................................................................................ 343 13.17. SANOFI-AVENTIS (CHATTEM) .................................................................................................................................... 345 13.18. SHAKLEE CORPORATION ........................................................................................................................................... 347 13.19. USANA HEALTH SCIENCES ....................................................................................................................................... 349 13.20. XANGO ................................................................................................................................................................. 351

Index of Figures
©2012 Penton Media, Inc. www.nutritionbusinessjournal.com 1-7
Figure 1-1 Global Nutrition Industry Sales by Product, 2010 .................................................................................. 15 Figure 3-1 Global Nutrition Industry Sales by Product, 2010 .................................................................................. 24 Figure 3-2 Global Nutrition Industry Sales by Product, 2001-2010 ......................................................................... 25 Figure 3-3 Global Nutrition Industry Sales Growth by Product, 2001-2010 ........................................................... 25 Figure 3-4 Global Nutrition Industry Sales by Region, 2001-2010 .......................................................................... 26 Figure 3-5 Global Nutrition Industry Sales Growth by Region, 2001-2010 ............................................................. 26 Figure 3-6 Global Nutrition Industry Sales by Product, 2011e-2016e ..................................................................... 27 Figure 3-7 Global Nutrition Industry Sales & Growth, 2002-2016e ........................................................................ 27 Figure 3-8 Global Nutrition Industry Sales by Region, 2011e-2016e ...................................................................... 28 Figure 3-9 Global Nutrition Industry Sales, Developed vs. Developing Markets, 1997-2010 ................................. 28 Figure 3-10 Global GDP per Capita, 2002-2010 ....................................................................................................... 29 Figure 3-11 Global GDP per Capita by Region, 2010 ............................................................................................... 29 Figure 3-12 Global Nutrition Dollars Spent per Capita, 2002-2010 ........................................................................ 30 Figure 3-13 Global Nutrition Dollars Spent Per Capita by Region, 2010 ................................................................. 30 Figure 3-14 Developed vs. Developing Countries GDP Per Capita Growth, 2001-2017e ........................................ 31 Figure 3-15 Developed vs. Developing Countries Nutrition Dollars Spent/Capita Growth, 2003-2016e ............... 32 Figure 3-16 Global Supplement Sales by Product, 2010 ......................................................................................... 33 Figure 3-17 Global Supplement Sales by Product, 2001-2010 ................................................................................ 33 Figure 3-18 Global Supplement Sales Growth by Product, 2001-2010 ................................................................... 34 Figure 3-19 Global Supplement Sales by Region, 2010 ........................................................................................... 34 Figure 3-20 Global Supplement Sales by Region, 2001-2010 .................................................................................. 35 Figure 3-21 Global Supplement Sales Growth by Region, 2002-2010 .................................................................... 35 Figure 3-22 Global Supplement Industry Sales & Growth, 2002-2016e ................................................................. 36 Figure 3-23 Global Supplement Sales by Region, 2011e-2016e .............................................................................. 36 Figure 3-24 Global Natural & Organic Food Sales by Region, 2010 ........................................................................ 37 Figure 3-25 Global Natural & Organic Food Sales by Region, 2001-2010 ............................................................... 38 Figure 3-26 Global Natural & Organic Food Sales Growth by Region, 2002-2010 .................................................. 38 Figure 3-27 Global Natural & Organic Food Industry Sales & Growth, 2002-2016e ............................................... 39 Figure 3-28 Global Natural & Organic Sales by Region, 2011e-2016e .................................................................... 39 Figure 3-29 Global Functional Food Sales by Region, 2010 ..................................................................................... 40 Figure 3-30 Global Functional Food Sales by Region, 2001-2010 ........................................................................... 41 Figure 3-31 Global Functional Food Sales Growth by Region, 2002-2010 .............................................................. 41 Figure 3-32 Global Functional Food Industry Sales & Growth, 2002-2016e ........................................................... 42 Figure 3-33 Global Functional Food Sales by Region, 2011e-2016e ....................................................................... 42 Figure 3-34 Global N&OPC Sales by Region, 2010 .................................................................................................. 43 Figure 3-35 Global N&OPC and Household Products Sales by Region, 2001-2010 ................................................. 44 Figure 3-36 Global N&OPC and Household Products Sales Growth by Region, 2002-2010 ................................... 44 Figure 3-37 Global N&OPC and Household Products Industry Sales & Growth, 2002-2016e ................................ 45 Figure 3-38 Global N&OPC and Household Products Sales by Region, 2011e-2016e ............................................. 45 Figure 4-1 U.S. Total Nutrition Industry Sales by Product, 2010 ............................................................................. 77 Figure 4-2 U.S. Nutrition Industry Sales by Product , 2000-2010 ............................................................................ 78 Figure 4-3 U.S. Nutrition Industry Sales Growth by Product, 2000-2010 ............................................................... 78 Figure 4-4 U.S. Nutrition Industry Sales by Product as % of Total, 2000-2010 ....................................................... 78 Figure 4-5 U.S. Nutrition Industry Sales Growth by Product in 2010 ...................................................................... 79

NBJ’s Global Supplement & Nutrition Industry Report 2012
Estimates are the result of information obtained from executives, analysts, surveys, and reputable published materials. Figures are not the result of audits and not guaranteed to be accurate. Errors and omissions are unintentional.
1-8 www.nutritionbusinessjournal.com ©2012 Penton Media, Inc.
Figure 4-6 U.S. Nutrition Industry Sales & Growth, 2002-2016e ............................................................................ 79 Figure 4-7 U.S. Total Nutrition Industry Sales by Channel, 2010 ............................................................................ 80 Figure 4-8 U.S. Nutrition Industry Sales & Growth by Channel, 2010 ..................................................................... 81 Figure 4-9 U.S. Nutrition Industry Sales & Growth by Channel, 2009 ..................................................................... 81 Figure 4-10 U.S. Nutrition Industry Sales & Growth by Channel, 2008 ................................................................... 82 Figure 4-11 U.S. Nutrition Industry Sales by Channel, 2000-2010 .......................................................................... 82 Figure 4-12 U.S. Nutrition Industry Sales by Product, 2011e-2017e ....................................................................... 83 Figure 4-13 U.S. Nutrition Industry Sales Growth by Product, 2011e-2017e ......................................................... 83 Figure 4-14 U.S. Nutrition Industry Sales by Product as % of Total, 2011e-2017e ................................................. 83 Figure 4-15 U.S. Nutrition Industry Estimated Compound Annual Sales Growth, 2011e-2017e ............................ 84 Figure 4-16 U.S. Nutrition Industry Sales Growth vs. U.S. GDP per Capita Growth, 2001-2016e ........................... 84 Figure 4-17 U.S. Dietary Supplements vs. Total Nutrition Industry, 2000-2010 ..................................................... 85 Figure 4-18 U.S. Dietary Supplements vs. Total Nutrition Industry Sales Growth, 2000-2017e ............................. 85 Figure 4-19 U.S. Dietary Supplement Sales by Product Category in 2010 .............................................................. 86 Figure 4-20 U.S. Dietary Supplement Sales by Product, 2000-2010 ....................................................................... 86 Figure 4-21 U.S. Dietary Supplement Sales Growth by Product , 2000-2010 ......................................................... 87 Figure 4-22 U.S. Dietary Supplement Sales by Product as % of Total , 2000-2010 ................................................. 87 Figure 4-23 U.S. Dietary Supplement Sales Growth by Product, 2010 ................................................................... 88 Figure 4-24 U.S. Dietary Supplement Sales & Growth, 2000-2017e ....................................................................... 88 Figure 4-25 U.S. Dietary Supplements Product Category Sales Growth, 2000-2017e ............................................ 89 Figure 4-26 Top 50 Dietary Supplement Companies in 2010: Part I ....................................................................... 90 Figure 4-27 Top 50 Dietary Supplement Companies in 2010: Part II ...................................................................... 91 Figure 4-28 U.S. Dietary Supplement Sales by Channel in 2010 ............................................................................. 95 Figure 4-29 U.S. Dietary Supplement Sales and Annual Growth by Channel, 2008-2010 ...................................... 95 Figure 4-30 U.S. Dietary Supplement Sales by Channel, 2000-2010 ....................................................................... 96 Figure 4-31 U.S. Dietary Supplement Sales by Product, 2011e-2017e ................................................................... 96 Figure 4-32 U.S. Dietary Supplement Sales Growth by Product, 2011e-2017e ...................................................... 97 Figure 4-33 U.S. Dietary Supplement Sales by Product as % of Total, 2011e-2017e .............................................. 97 Figure 4-34 U.S. Dietary Supplements Estimated Compound Annual Sales Growth, 2011e-2017e ....................... 98 Figure 5-1 Canada Nutrition Industry Sales by Product, 2010 .............................................................................. 111 Figure 5-2 Canada vs. Global Nutrition Industry, 2001-2010 ................................................................................ 112 Figure 5-3 Canada Nutrition Industry Sales by Product, 2001-2010 ..................................................................... 112 Figure 5-4 Canada Nutrition Industry Sales Growth by Product, 2001-2010 ........................................................ 112 Figure 5-5 Canada Nutrition Industry Sales as % of Total, 2001-2010 .................................................................. 113 Figure 5-6 Canada Nutrition Industry Compound Annual Sales Growth, 2001-2010 ........................................... 113 Figure 5-7 Canada Nutrition Industry Sales & Growth, 2002-2012e ..................................................................... 114 Figure 5-8 Canada Nutrition Industry Estimated Sales and Growth by Product, 2011e-2012e ............................ 114 Figure 5-9 Canada GDP and Nutrition per Capita, 2002-2010 .............................................................................. 115 Figure 5-10 Canada GDP and Nutrition per Capita, 2011e-2016e ........................................................................ 115 Figure 5-11 Canada Nutrition Industry Sales Growth vs. GDP Growth, 2001-2016e ............................................ 116 Figure 5-12 Canada Supplement Sales by Product, 2010 ...................................................................................... 117 Figure 5-13 Canada Supplement Sales by Product, 2001-2010 ............................................................................ 118 Figure 5-14 Canada Supplement Sales Growth by Product, 2002-2010 ............................................................... 118 Figure 5-15 Canada Supplement Sales as % of Total, 2001-2010 ......................................................................... 118 Figure 5-16 Canada Supplement Sales and Growth Forecast by Product, 2011e-2012e ...................................... 119 Figure 6-1 Latin America Nutrition Industry Sales by Product, 2010 .................................................................... 123 Figure 6-2 Latin America vs. Global Nutrition Industry, 2001-2010 ...................................................................... 124 Figure 6-3 Latin America Nutrition Industry Sales by Product, 2001-2010 ........................................................... 124
Index of Figures
©2012 Penton Media, Inc. www.nutritionbusinessjournal.com 1-9
Figure 6-4 Latin America Nutrition Industry Sales Growth by Product, 2002-2010 .............................................. 124 Figure 6-5 Latin America Nutrition Industry Sales as % of Total, 2001-2010 ........................................................ 125 Figure 6-6 Latin America Nutrition Industry Compound Annual Sales Growth, 2001-2010 ................................. 125 Figure 6-7 Latin America Nutrition Industry Sales & Growth, 2001-2012e .......................................................... 126 Figure 6-8 Latin America Nutrition Industry Estimated Sales and Growth by Product, 2011e-2012e .................. 126 Figure 6-9 Latin America Nutrition Industry Sales Growth vs. GDP Growth, 2001-2016e .................................... 127 Figure 6-10 Latin America Supplement Sales by Product, 2010 ............................................................................ 128 Figure 6-11 Latin America Supplement Sales by Product, 2001-2010 .................................................................. 129 Figure 6-12 Latin America Supplement Sales Growth by Product, 2002-2010 ..................................................... 129 Figure 6-13 Latin America Supplement Sales as % of Total, 2001-2010 ............................................................... 130 Figure 6-14 Latin America Supplement Sales and Growth Forecast by Product, 2011e-2012e ........................... 130 Figure 7-1 European Supplement Sales by Region, 2001-2010 ............................................................................ 133 Figure 7-2 Germany Nutrition Industry Sales by Product, 2010 ........................................................................... 135 Figure 7-3 Germany vs. Global Nutrition Industry, 2001-2010 ............................................................................. 136 Figure 7-4 Germany Nutrition Industry Sales by Product, 2001-2010 .................................................................. 136 Figure 7-5 Germany Nutrition Industry Sales Growth by Product, 2002-2010 ..................................................... 136 Figure 7-6 Germany Nutrition Industry Sales as % of Total, 2001-2010 ............................................................... 137 Figure 7-7 Germany Nutrition Industry Compound Annual Sales Growth, 2001-2010 ........................................ 137 Figure 7-8 Germany Nutrition Industry Sales & Growth, 2001-2012e .................................................................. 138 Figure 7-9 Germany Nutrition Industry Sales & Growth Forecast by Product, 2011e-2012e ............................... 138 Figure 7-10 Germany Nutrition Industry Sales Growth vs. GDP Growth, 2001-2012e ......................................... 139 Figure 7-11 Germany Supplement Sales by Product, 2010 ................................................................................... 140 Figure 7-12 Germany Supplement Sales by Product, 2001-2010.......................................................................... 140 Figure 7-13 Germany Supplement Sales Growth by Product, 2002-2010 ............................................................ 141 Figure 7-14 Germany Supplement Sales as % of Total, 2001-2010 ....................................................................... 141 Figure 7-15 Germany Supplement Sales and Growth Forecast by Product, 2011e-2012e ................................... 141 Figure 7-16 France Nutrition Industry Sales by Product, 2010 ............................................................................. 145 Figure 7-17 France vs. Global Nutrition Industry, 2001-2010 ............................................................................... 146 Figure 7-18 France Nutrition Industry Sales by Product, 2001-2010 .................................................................... 146 Figure 7-19 France Nutrition Industry Sales Growth by Product, 2002-2010 ....................................................... 146 Figure 7-20 France Nutrition Industry Sales as % of Total, 2001-2010 ................................................................. 147 Figure 7-21 France Nutrition Industry Compound Annual Sales Growth, 2001-2010 .......................................... 147 Figure 7-22 France Nutrition Industry Sales & Growth, 2001-2012e .................................................................... 148 Figure 7-23 France Nutrition Industry Sales & Growth Forecast by Product, 2011e-2012e ................................. 148 Figure 7-24 France Nutrition Industry Sales Growth vs. GDP Growth, 2001-2012e ............................................. 149 Figure 7-25 France Supplement Sales by Product, 2010 ....................................................................................... 150 Figure 7-26 France Supplement Sales by Product, 2001-2010 .............................................................................. 150 Figure 7-27 France Supplement Sales Growth by Product, 2002-2010 ................................................................ 151 Figure 7-28 France Supplement Sales as % of Total, 2001-2010 ........................................................................... 151 Figure 7-29 France Supplement Sales and Growth Forecast by Product, 20011e-2012e ..................................... 151 Figure 7-30 United Kingdom Nutrition Industry Sales by Product, 2010 .............................................................. 152 Figure 7-31 United Kingdom vs. Global Nutrition Industry, 2001-2010 ................................................................ 153 Figure 7-32 United Kingdom Nutrition Industry Sales by Product, 2001-2010 ..................................................... 153 Figure 7-33 United Kingdom Nutrition Industry Sales Growth by Product, 2002-2010 ........................................ 153 Figure 7-34 United Kingdom Nutrition Industry Sales as % of Total, 2001-2010 .................................................. 154 Figure 7-35 United Kingdom Nutrition Industry Compound Annual Sales Growth, 2000-2010 ........................... 154 Figure 7-36 United Kingdom Nutrition Industry Sales & Growth, 2001-2012e .................................................... 155

NBJ’s Global Supplement & Nutrition Industry Report 2012
Estimates are the result of information obtained from executives, analysts, surveys, and reputable published materials. Figures are not the result of audits and not guaranteed to be accurate. Errors and omissions are unintentional.
1-10 www.nutritionbusinessjournal.com ©2012 Penton Media, Inc.
Figure 7-37 United Kingdom Nutrition Industry Sales and Growth Forecast by Product, 2011e-2012e .............. 155 Figure 7-38 United Kingdom Nutrition Industry Sales Growth vs. GDP Growth, 2001-2012e .............................. 156 Figure 7-39 United Kingdom Supplement Sales by Product, 2010........................................................................ 157 Figure 7-40 United Kingdom Supplement Sales by Product, 2001-2010 .............................................................. 157 Figure 7-41 United Kingdom Supplement Sales Growth by Product, 2002-2010 ................................................. 158 Figure 7-42 United Kingdom Supplement Sales as % of Total, 2001-2010 ........................................................... 158 Figure 7-43 United Kingdom Supplement Sales & Growth Forecast by Product, 2011e-2012e ........................... 158 Figure 7-44 Italy Nutrition Industry Sales by Product, 2010 ................................................................................. 162 Figure 7-45 Italy vs. Global Nutrition Industry, 2001-2010 ................................................................................... 163 Figure 7-46 Italy Nutrition Industry Sales by Product, 2001-2010 ........................................................................ 163 Figure 7-47 Italy Nutrition Industry Sales Growth by Product, 2002-2010 ........................................................... 163 Figure 7-48 Italy Nutrition Industry Sales as % of Total, 2001-2010 ..................................................................... 164 Figure 7-49 Italy Nutrition Industry Compound Annual Sales Growth, 2001-2010 .............................................. 164 Figure 7-50 Italy Nutrition Industry Sales & Growth, 2001-2012e ........................................................................ 165 Figure 7-51 Italy Nutrition Industry Sales & Growth Forecast by Product, 2011e-2012e ..................................... 165 Figure 7-52 Italy Nutrition Industry Sales Growth vs. GDP Growth, 2001-2012e ................................................. 166 Figure 7-53 Italy Supplement Sales by Product, 2010 ........................................................................................... 167 Figure 7-54 Italy Supplement Sales by Product, 2001-2010 ................................................................................. 167 Figure 7-55 Italy Supplement Sales Growth by Product, 2002-2010 .................................................................... 168 Figure 7-56 Italy Supplement Sales as % of Total, 2001-2010 .............................................................................. 168 Figure 7-57 Italy Supplement Sales & Growth Forecast by Product, 2011e-2012e .............................................. 168 Figure 7-58 Scandinavia Nutrition Industry Sales by Product, 2010 ..................................................................... 169 Figure 7-59 Scandinavia vs. Global Nutrition Industry, 2001-2010 ....................................................................... 170 Figure 7-60 Scandinavia Nutrition Industry Sales by Product, 2001-2010 ............................................................ 170 Figure 7-61 Scandinavia Nutrition Industry Sales Growth by Product, 2002-2010 ............................................... 170 Figure 7-62 Scandinavia Nutrition Industry Sales as % of Total, 2001-2010 ......................................................... 171 Figure 7-63 Scandinavia Nutrition Industry Compound Annual Sales Growth, 2001-2010 .................................. 171 Figure 7-64 Scandinavia Nutrition Industry Sales & Growth, 2001-2012e............................................................ 172 Figure 7-65 Scandinavia Nutrition Industry Sales & Growth Forecast by Product, 2011e-2012e ........................ 172 Figure 7-66 Scandinavia Nutrition Industry Sales Growth vs. GDP Growth, 2001-2012e ..................................... 173 Figure 7-67 Scandinavia Supplement Sales by Product, 2010 ............................................................................... 174 Figure 7-68 Scandinavia Supplement Sales by Product, 2001-2010 ..................................................................... 174 Figure 7-69 Scandinavia Supplement Sales Growth by Product, 2002-2010 ........................................................ 175 Figure 7-70 Scandinavia Supplement Sales as % of Total, 2001-2010 .................................................................. 175 Figure 7-71 Scandinavia Supplement Sales and Growth Forecast by Product, 2011e-2012e .............................. 175 Figure 7-72 Spain Nutrition Industry Sales by Product, 2010 ............................................................................... 179 Figure 7-73 Spain vs. Global Nutrition Industry, 2001-2010 ................................................................................. 180 Figure 7-74 Spain Nutrition Industry Sales by Product, 2001-20010 .................................................................... 180 Figure 7-75 Spain Nutrition Industry Sales Growth by Product, 2002-2010 ......................................................... 180 Figure 7-76 Spain Nutrition Industry Sales as % of Total, 2001-2010 ................................................................... 181 Figure 7-77 Spain Nutrition Industry Compound Annual Sales Growth, 2001-2010 ............................................ 181 Figure 7-78 Spain Nutrition Industry Sales & Growth, 2001-2012e ...................................................................... 182 Figure 7-79 Spain Nutrition Industry Sales and Growth Forecast by Product, 2011e-2012e ............................... 182 Figure 7-80 Spain Nutrition Industry Sales Growth vs. GDP Growth, 2001-2012e ............................................... 183 Figure 7-81 Spain Supplement Sales by Product, 2010 ......................................................................................... 184 Figure 7-82 Spain Supplement Sales by Product, 2001-2010 ................................................................................ 184 Figure 7-83 Spain Supplement Sales Growth by Product, 2002-2010 .................................................................. 185 Figure 7-84 Spain Supplement Sales as % of Total, 2001-2010 ............................................................................. 185
Index of Figures
©2012 Penton Media, Inc. www.nutritionbusinessjournal.com 1-11
Figure 7-85 Spain Supplement Sales & Growth Forecast by Product, 2011e-2012e ............................................ 185 Figure 7-86 Switzerland & Austria Nutrition Industry Sales by Product, 2010 ..................................................... 190 Figure 7-87 Switzerland & Austria vs. Global Nutrition Industry, 2001-2010 ....................................................... 191 Figure 7-88 Switzerland & Austria Nutrition Industry Sales by Product, 2001-2010 ............................................ 191 Figure 7-89 Switzerland & Austria Nutrition Industry Sales Growth by Product, 2002-2010 ............................... 191 Figure 7-90 Switzerland & Austria Nutrition Industry Sales as % of Total, 2001-2010 ......................................... 192 Figure 7-91 Switzerland & Austria Nutrition Industry Compound Annual Sales Growth, 2001-2010 .................. 192 Figure 7-92 Switzerland & Austria Nutrition Industry Sales & Growth, 2001-2012e ............................................ 193 Figure 7-93 Switzerland & Austria Nutrition Industry Sales & Growth Forecast by Product, 2011e-2012e ......... 193 Figure 7-94 Switzerland & Austria Nutrition Industry Sales Growth vs. GDP Growth, 2001-2012e ..................... 194 Figure 7-95 Switzerland & Austria Supplement Sales by Product, 2010 ............................................................... 195 Figure 7-96 Switzerland & Austria Supplement Sales by Product, 2001-2010...................................................... 195 Figure 7-97 Switzerland & Austria Supplement Sales Growth by Product, 2002-2010 ........................................ 196 Figure 7-98 Switzerland & Austria Supplement Sales as % of Total,-2001-2010 .................................................. 196 Figure 7-99 Switzerland & Austria Supplement Sales and Growth Forecast by Product, 2011e-2012e ............... 196 Figure 7-100 Netherlands Nutrition Industry Sales by Product, 2010 .................................................................. 198 Figure 7-101 Netherlands vs. Global Nutrition Industry, 2001-2010 .................................................................... 198 Figure 7-102 Netherlands Nutrition Industry Sales by Product, 2001-2010 ......................................................... 199 Figure 7-103 Netherlands Nutrition Industry Sales Growth by Product, 2002-2010 ............................................ 199 Figure 7-104 Netherlands Nutrition Industry Sales as % of Total, 2001-2010 ...................................................... 199 Figure 7-105 Netherlands Nutrition Industry Compound Annual Sales Growth, 2001-2010 ............................... 200 Figure 7-106 Netherlands Nutrition Industry Sales & Growth, 2001-2012e ......................................................... 200 Figure 7-107 Netherlands Nutrition Industry Sales & Growth Forecast by Product, 2011e-2012e ...................... 201 Figure 7-108 Netherlands Nutrition Industry Sales Growth vs. GDP Growth, 2001-2012e .................................. 201 Figure 7-109 Netherlands Supplement Sales by Product, 2010 ............................................................................ 202 Figure 7-110 Netherlands Supplement Sales by Product, 2001-2010 .................................................................. 202 Figure 7-111 Netherlands Supplement Sales Growth by Product, 2002-2010 ..................................................... 203 Figure 7-112 Netherlands Supplement Sales as % of Total, 2001-2010 ............................................................... 203 Figure 7-113 Netherlands Supplement Sales and Growth Forecast by Product, 2009e-2010e ............................ 203 Figure 7-114 Belgium & Luxembourg Nutrition Industry Sales by Product, 2010 ................................................ 204 Figure 7-115 Belgium & Luxembourg vs. Global Nutrition Industry, 2001-2010 .................................................. 204 Figure 7-116 Belgium & Luxembourg Nutrition Industry Sales by Product, 2001-2010 ....................................... 205 Figure 7-117 Belgium & Luxembourg Nutrition Industry Sales Growth by Product, 2002-2010 .......................... 205 Figure 7-118 Belgium & Luxembourg Nutrition Industry Sales as % of Total, 2001-2010 .................................... 205 Figure 7-119 Belgium & Luxembourg Nutrition Industry Compound Annual Sales Growth, 2001-2010 ............. 206 Figure 7-120 Belgium & Luxembourg Nutrition Industry Sales & Growth, 2001-2012e ....................................... 206 Figure 7-121 Belgium & Luxembourg Nutrition Industry Sales & Growth Forecast by Product, 2011e-2012e .... 207 Figure 7-122 Belgium & Luxembourg Nutrition Industry Sales Growth vs. GDP Growth, 2001-2012e ................ 207 Figure 7-123 Belgium & Luxembourg Supplement Sales by Product, 2010 .......................................................... 208 Figure 7-124 Belgium & Luxembourg Supplement Sales by Product, 2001-2010................................................. 208 Figure 7-125 Belgium & Luxembourg Supplement Sales Growth by Product, 2002-2010 ................................... 209 Figure 7-126 Belgium & Luxembourg Supplement Sales as % of Total, 2001-2010.............................................. 209 Figure 7-127 Belgium & Luxembourg Supplement Sales & Growth Forecast by Product, 2011e-2012e ............. 209 Figure 8-1 Russia/Eastern Europe Nutrition Industry Sales by Product, 2010 ...................................................... 212 Figure 8-2 Russia/Eastern Europe vs. Global Nutrition Industry, 2001-2010........................................................ 213 Figure 8-3 Russia/Eastern Europe Nutrition Industry Sales by Product, 2001-2010 ............................................. 213 Figure 8-4 Russia/Eastern Europe Nutrition Industry Sales Growth by Product, 2002-2010 ............................... 213

NBJ’s Global Supplement & Nutrition Industry Report 2012
Estimates are the result of information obtained from executives, analysts, surveys, and reputable published materials. Figures are not the result of audits and not guaranteed to be accurate. Errors and omissions are unintentional.
1-12 www.nutritionbusinessjournal.com ©2012 Penton Media, Inc.
Figure 8-5 Russia/Eastern Europe Nutrition Industry Sales as % of Total, 2001-2010 .......................................... 214 Figure 8-6 Russia/Eastern Europe Nutrition Industry Compound Annual Sales Growth, 2001-2010 ................... 214 Figure 8-7 Russia/Eastern Europe Nutrition Industry Sales & Growth, 2001-2012e ............................................ 215 Figure 8-8 Russia/Eastern Europe Nutrition Industry Sales and Growth Forecast by Product, 2011e-2012e ...... 215 Figure 8-9 Russia/Eastern Europe Nutrition Industry Sales Growth vs. GDP Growth, 2001-2012e...................... 216 Figure 8-10 Russia Supplement Sales by Product, 2010........................................................................................ 217 Figure 8-11 Russia/Eastern Europe Supplement Sales by Product, 2001-2010 .................................................... 218 Figure 8-12 Russia/Eastern Europe Supplement Sales Growth by Product, 2002-2010 ....................................... 218 Figure 8-13 Russia/Eastern Europe Supplement Sales as % of Total, 2001-2010 ................................................. 218 Figure 8-14 Russia/Eastern Europe Supplement Sales and Growth Forecast by Product, 2011e-2012e ............. 219 Figure 8-15 Poland Nutrition Industry Sales by Product, 2010 ............................................................................. 222 Figure 8-16 Poland vs. Global Nutrition Industry, 2001-2010 ............................................................................... 222 Figure 8-17 Poland Nutrition Industry Sales by Product, 2001-2010 .................................................................... 223 Figure 8-18 Poland Nutrition Industry Sales Growth by Product, 2002-2010 ....................................................... 223 Figure 8-19 Poland Nutrition Industry Sales as % of Total, 2001-2010 ................................................................. 223 Figure 8-20 Poland Nutrition Industry Compound Annual Sales Growth, 2001-2010 .......................................... 224 Figure 8-21 Poland Nutrition Industry Sales & Growth, 2001-2012e.................................................................... 224 Figure 8-22 Poland Nutrition Industry Sales and Growth Forecast by Product, 2011e-2012e ............................. 225 Figure 8-23 Poland Nutrition Industry Sales Growth vs. GDP Growth, 2001-2012e ............................................. 225 Figure 8-24 Poland Supplement Sales by Product, 2010 ....................................................................................... 226 Figure 8-25 Poland Supplement Sales by Product, 2001-2010 ............................................................................. 226 Figure 8-26 Poland Supplement Sales Growth by Product, 2002-2010 ................................................................ 227 Figure 8-27 Poland Supplement Sales as % of Total, 2001-2010 .......................................................................... 227 Figure 8-28 Poland Supplement Sales and Growth Forecast by Product, 2011e-2012e ...................................... 227 Figure 9-1 Middle East Nutrition Industry Sales by Product, 2010 ....................................................................... 230 Figure 9-2 Middle East vs. Global Nutrition Industry, 2001-2010 ......................................................................... 230 Figure 9-3 Middle East Nutrition Industry Sales by Product, 2001-2010 .............................................................. 231 Figure 9-4 Middle East Nutrition Industry Sales Growth by Product, 2002-2010 ................................................. 231 Figure 9-5 Middle East Nutrition Industry Sales as % of Total, 2001-2010 ........................................................... 231 Figure 9-6 Middle East Nutrition Industry Compound Annual Sales Growth, 2001-2010 .................................... 232 Figure 9-7 Middle East Nutrition Industry Sales & Growth, 2001-2012e .............................................................. 232 Figure 9-8 Middle East Nutrition Industry Sales and Growth Forecast by Product, 2011e-2012e ....................... 233 Figure 9-9 Middle East Nutrition Industry Sales Growth vs. GDP Growth, 2001-2016e ....................................... 233 Figure 9-10 Middle East Supplement Sales by Product, 2010 ............................................................................... 234 Figure 9-11 Middle East Supplement Sales by Product, 2001-2010 ..................................................................... 235 Figure 9-12 Middle East Supplement Sales Growth by Product, 2002-2010 ........................................................ 235 Figure 9-13 Middle East Supplement Sales as % of Total, 2001-2010 .................................................................. 235 Figure 9-14 Middle East Supplement Sales and Growth Forecast by Product, 2011e-2012e............................... 236 Figure 10-1 Japan Nutrition Industry Sales by Product, 2010 ............................................................................... 241 Figure 10-2 Japan vs. Global Nutrition Industry, 2001-2010 ................................................................................. 242 Figure 10-3 Japan Nutrition Industry Sales by Product, 2001-2010 ...................................................................... 242 Figure 10-4 Japan Nutrition Industry Sales Growth by Product, 2002-2010 ......................................................... 242 Figure 10-5 Japan Nutrition Industry Sales as % of Total, 2001-2010 ................................................................... 243 Figure 10-6 Japan Nutrition Industry Compound Annual Sales Growth, 2001-2010 ............................................ 243 Figure 10-7 Japan Nutrition Industry Sales & Growth, 2001-2012e ..................................................................... 244 Figure 10-8 Japan Nutrition Industry Sales and Growth Forecast by Product, 2011e-2012e ............................... 244 Figure 10-9 Japan Nutrition Industry Sales Growth vs. GDP Growth, 2001-2016e ............................................... 245 Figure 10-10 Japan Supplement Sales by Product, 2010 ...................................................................................... 246

Index of Figures
©2012 Penton Media, Inc. www.nutritionbusinessjournal.com 1-13
Figure 10-11 Japan Supplement Sales by Product, 2001-2010 ............................................................................. 246 Figure 10-12 Japan Supplement Sales Growth by Product, 2002-2010 ................................................................ 247 Figure 10-13 Japan Supplement Sales as % of Total, 2001-2010 .......................................................................... 247 Figure 10-14 Japan Supplement Sales and Growth Forecast by Product, 2011e-2012e ...................................... 247 Figure 10-15 China Nutrition Industry Sales by Product, 2010 ............................................................................. 252 Figure 10-16 China vs. Global Nutrition Industry, 2001-2010 ............................................................................... 253 Figure 10-17 China Nutrition Industry Sales by Product, 2001-2010 .................................................................... 253 Figure 10-18 China Nutrition Industry Sales Growth by Product, 2002-2010 ....................................................... 253 Figure 10-19 China Nutrition Industry Sales as % of Total, 2001-2010 ................................................................. 254 Figure 10-20 China Nutrition Industry Compound Annual Sales Growth, 2001-2010 .......................................... 254 Figure 10-21 China Nutrition Industry Sales & Growth, 2001-2012e .................................................................... 255 Figure 10-22 China Nutrition Industry Sales and Growth Forecast by Product, 2011e-2012e ............................. 255 Figure 10-23 China Nutrition Industry Sales Growth vs. GDP Growth, 2001-2016e ............................................. 256 Figure 10-24 China Supplement Sales by Product, 2010 ....................................................................................... 257 Figure 10-25 China Supplement Sales by Product, 2001-2010 ............................................................................. 257 Figure 10-26 China Supplement Sales Growth by Product, 2002-2010 ................................................................ 258 Figure 10-27 China Supplement Sales as % of Total, 2001-2010 .......................................................................... 258 Figure 10-28 China Supplement Sales and Growth Forecast by Product, 2011e-2012e ...................................... 258 Figure 10-29 Other Asia Nutrition Industry Sales by Product, 2010 ..................................................................... 272 Figure 10-30 Other Asia vs. Global Nutrition Industry, 2001-2010 ....................................................................... 273 Figure 10-31 Other Asia Nutrition Industry Sales by Product, 2001-2010 ............................................................ 273 Figure 10-32 Other Asia Nutrition Industry Sales Growth by Product, 2000-2010 ............................................... 273 Figure 10-33 Other Asia Nutrition Industry Sales as % of Total, 2001-2010 ......................................................... 274 Figure 10-34 Other Asia Nutrition Industry Compound Annual Sales Growth, 2001-2010 .................................. 274 Figure 10-35 Other Asia Nutrition Industry Sales & Growth, 2001-2012e ............................................................ 275 Figure 10-36 Other Asia Nutrition Industry Sales and Growth Forecast by Product, 2011e-2012e ..................... 275 Figure 10-37 Other Asia Supplement Sales by Product, 2010 ............................................................................... 276 Figure 10-38 Other Asia Supplement Sales by Product, 2001-2010 ..................................................................... 276 Figure 10-39 Other Asia Supplement Sales Growth by Product, 2002-2010 ........................................................ 277 Figure 10-40 Other Asia Supplement Sales as % of Total, 2001-2010 .................................................................. 277 Figure 10-41 Other Asia Supplement Sales and Growth Forecast by Product, 2011e-2012e............................... 277 Figure 11-1 Australia/New Zealand Nutrition Industry Sales by Product, 2010 ................................................... 289 Figure 11-2 Australia/New Zealand vs. Global Nutrition Industry, 2001-2010 .................................................... 290 Figure 11-3 Australia/New Zealand Nutrition Industry Sales by Product, 2001-2010 .......................................... 290 Figure 11-4 Australia/New Zealand Nutrition Industry Sales Growth by Product, 2002-2010 ............................. 290 Figure 11-5 Australia/New Zealand Nutrition Industry Sales as % of Total, 2001-2010 ....................................... 291 Figure 11-6 Australia/New Zealand Nutrition Industry Compound Annual Sales Growth, 2001-2010 ................ 291 Figure 11-7 Australia/New Zealand Nutrition Industry Sales & Growth, 2001-2012e .......................................... 292 Figure 11-8 Australia/New Zealand Nutrition Industry Sales and Growth Forecast by Product, 2011e-2012e ... 292 Figure 11-9 Australia/New Zealand Nutrition Industry Sales Growth vs. GDP Growth, 2001-2016e ................... 293 Figure 11-10 Australia/New Zealand Supplement Sales by Product, 2010 ........................................................... 294 Figure 11-11 Australia/New Zealand Supplement Sales by Product, 2001-2010 ................................................. 294 Figure 11-12 Australia/New Zealand Supplement Sales Growth by Product, 2002-2010 .................................... 295 Figure 11-13 Australia/New Zealand Supplement Sales as % of Total, 2001-2010 .............................................. 295 Figure 11-14 Australia/New Zealand Supplement Sales and Growth Forecast by Product, 2011e-2012e ........... 295 Figure 12-1 Africa Nutrition Industry Sales by Product, 2010 ............................................................................... 301 Figure 12-2 Africa vs. Global Nutrition Industry, 2001-2010 ................................................................................ 302
NBJ’s Global Supplement & Nutrition Industry Report 2012
Estimates are the result of information obtained from executives, analysts, surveys, and reputable published materials. Figures are not the result of audits and not guaranteed to be accurate. Errors and omissions are unintentional.
1-14 www.nutritionbusinessjournal.com ©2012 Penton Media, Inc.
Figure 12-3 Africa Nutrition Industry Sales by Product, 2001-2010 ...................................................................... 302 Figure 12-4 Africa Nutrition Industry Sales Growth by Product, 2002-2010 ........................................................ 302 Figure 12-5 Africa Nutrition Industry Sales as % of Total, 2001-2010 ................................................................... 303 Figure 12-6 Africa Nutrition Industry Compound Annual Sales Growth, 2001-2010 ............................................ 303 Figure 12-7 Africa Nutrition Industry Sales & Growth, 2001-2012e ..................................................................... 304 Figure 12-8 Africa Nutrition Industry Sales & Growth Forecast by Product, 2011e-2012e .................................. 304 Figure 12-9 Africa Nutrition Industry Sales Growth vs. GDP Growth, 2001-2016e .............................................. 305 Figure 12-10 Africa Supplement Sales by Product, 2010 ...................................................................................... 306 Figure 12-11 Africa Supplement Sales by Product, 2001-2010 ............................................................................. 306 Figure 12-12 Africa Supplement Sales Growth by Product, 2002-2010 ................................................................ 307 Figure 12-13 Africa Supplement Sales as % of Total, 2001-2010 .......................................................................... 307 Figure 12-14 Africa Supplement Sales & Growth Forecast by Product, 2011e-2012e.......................................... 307 Figure 13-1 Alticor (Amway, Nutrilite) S.W.O.T. Analysis ...................................................................................... 315 Figure 13-2 Atrium Innovations S.W.O.T. Analysis ................................................................................................ 318 Figure 13-3 Bayer Group S.W.O.T. Analysis ........................................................................................................... 321 Figure 13-4 Carlyle Group - NBTY S.W.O.T. Analysis ............................................................................................. 322 Figure 13-5 Forever Living S.W.O.T. Analysis ........................................................................................................ 324 Figure 13-6 Glanbia (Optimum Nutrition, BSN) S.W.O.T. Analysis ........................................................................ 325 Figure 13-7 GlaxoSmithKline S.W.O.T. Analysis .................................................................................................... 327 Figure 13-8 Herbalife International S.W.O.T. Analysis .......................................................................................... 329 Figure 13-9 Monarch Health Products (MonaVie) S.W.O.T. Analysis ................................................................... 333 Figure 13-10 Nature’s Sunshine S.W.O.T. Analysis................................................................................................ 335 Figure 13-11 Nestlé S.W.O.T. Analysis ................................................................................................................... 337 Figure 13-12 Nu Skin Enterprises (Pharmanex) S.W.O.T. Analysis ........................................................................ 339 Figure 13-13 Pfizer S.W.O.T. Analysis .................................................................................................................... 341 Figure 13-14 Plethico (Natrol) S.W.O.T. Analysis .................................................................................................. 343 Figure 13-15 Sanofi-Aventis S.W.O.T. Analysis ...................................................................................................... 345 Figure 13-16 Shaklee Corporation S.W.O.T. Analysis ............................................................................................ 347 Figure 13-17 USANA Health Sciences S.W.O.T. Analysis ....................................................................................... 349 Figure 13-18 Xango S.W.O.T. Analysis ................................................................................................................... 351
1 Executive Summary
©2012 Penton Media, Inc. www.nutritionbusinessjournal.com 1-15
The global nutrition industry continued to enjoy steady growth in 2010, but—thanks to such indomitable
forces as severe weather, emboldened regulators and volatile currencies—the future looks much rockier than the recent past. With the world’s major regulatory bodies adopting stricter stances on product adulteration, health claims and good manufacturing practices, the business climate for dietary supplement and functional ingredient companies across the globe looks highly uncertain, with exceptional bright spots landing in Brazil and many of the emerging markets outside America and Europe.
Currency pressures over the past two years have dramatically affected U.S. suppliers on a global hunt for raw materials. “The decline in the U.S. dollar has made it very challenging—and expensive—to source product offshore,” says George Pontiakos of BI Nutraceuticals. With inflation firmly rooted in the raw materials market, the weakening U.S. dollar comes as a one-two punch for importers of nutrition products, as price increases slowly work their way through the value chain to land on domestic store shelves. A strong currency presents its own challenges too, of course, as Lonza’s top-line successes in much of 2011 fell prey to a strong Swiss franc and an ultimate net decline in earnings.
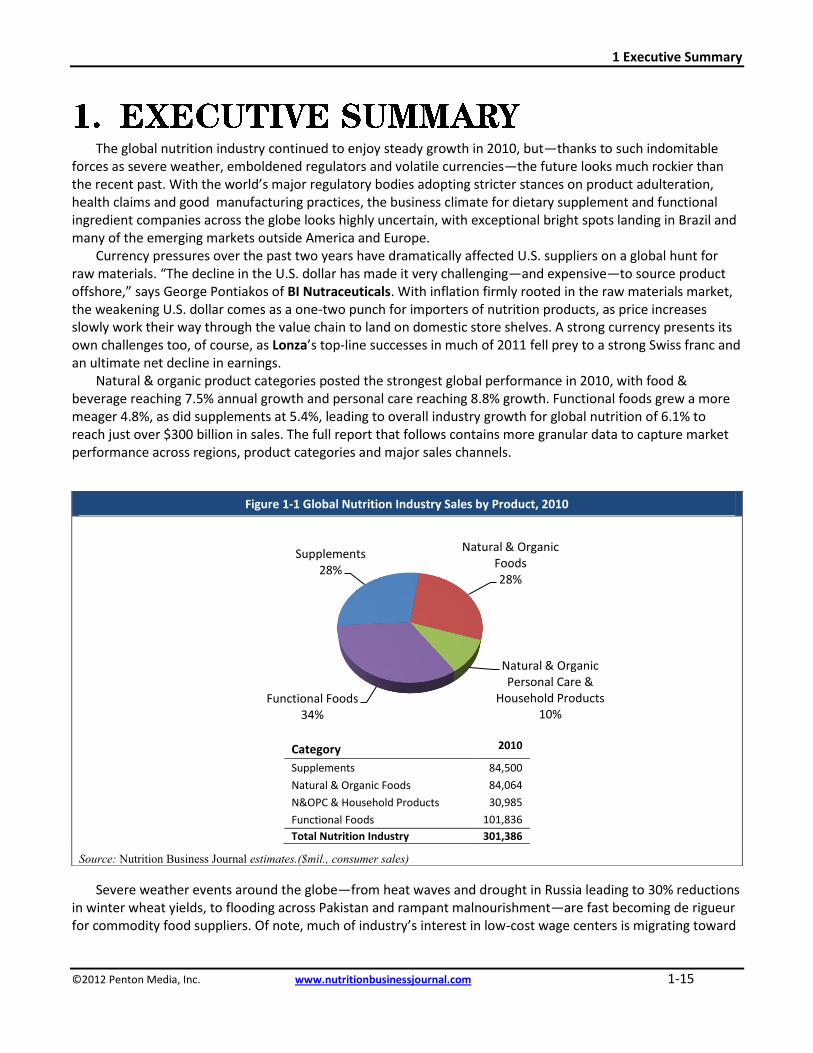
Natural & organic product categories posted the strongest global performance in 2010, with food & beverage reaching 7.5% annual growth and personal care reaching 8.8% growth. Functional foods grew a more meager 4.8%, as did supplements at 5.4%, leading to overall industry growth for global nutrition of 6.1% to reach just over $300 billion in sales. The full report that follows contains more granular data to capture market performance across regions, product categories and major sales channels.
Severe weather events around the globe—from heat waves and drought in Russia leading to 30% reductions in winter wheat yields, to flooding across Pakistan and rampant malnourishment—are fast becoming de rigueur for commodity food suppliers. Of note, much of industry’s interest in low-cost wage centers is migrating toward
Figure 1-1 Global Nutrition Industry Sales by Product, 2010
Category 2010
Supplements 84,500
Natural & Organic Foods 84,064
N&OPC & Household Products 30,985
Functional Foods 101,836
Total Nutrition Industry 301,386
Source: Nutrition Business Journal estimates.($mil., consumer sales)
Supplements 28%
Natural & Organic Foods 28%
Natural & Organic Personal Care &
Household Products 10%
Functional Foods 34%

NBJ’s Global Supplement & Nutrition Industry Report 2012
Estimates are the result of information obtained from executives, analysts, surveys, and reputable published materials. Figures are not the result of audits and not guaranteed to be accurate. Errors and omissions are unintentional.
1-16 www.nutritionbusinessjournal.com ©2012 Penton Media, Inc.
the most fickle weather zones on the globe. New manufacturing centers appear to be locating more in Southern Asia and Africa, less in China and India, where the burgeoning middle classes there have found purchase in commanding higher pay scales.
Across the globe, regulatory creep is top of mind for ingredient suppliers and supplement marketers, as Health Canada, EFSA and the U.S. FDA have all indicated policy revisions to clamp down significantly harder on safety. According to Pierre Fitzgibbon of Atrium Innovations, a serial acquirer of global supplement brands, “If we buy something, we will stay very focused in one country. I want us to be cautious. To buy a company with a pan-European platform right now—not knowing the outcome of EFSA’s stance on allowable claims—I think that would be suicidal.” Across the pond, Health Canada’s guidance on warning labels for digestive enzymes—ingredients found pervasively in stand-alone and multi formulations, including one-per-day vitamins—put industry on high alert as products might soon carry the following language, anathema to the core value proposition for supplementation with consumers: “For occasional use only. Consult a healthcare practitioner for use beyond three days.”
To end on a brighter note, Brazil stole the show in 2010 with outsized growth and a confluence of favorable factors for nutrition companies. Brazil offers an exploding middle class of consumers with increasing levels of discretionary income, a fascination with appearance and beauty, and a healthy appetite for supplements. “Popular thinking is that China is the place to be,” says Pete Zambetti of Capsugel, “but if I was starting a business, I’d put my money in Brazil.” A softening regulatory environment, thanks to ANVISA’s adoption in July 2012 of base limits for vitamins and minerals, rather than a science-based risk assessment model, led to immediate interest in the region from major multinational supplement companies. Also of note, natural food consumers have taken to functional products in a big way, but seem to quickly leapfrog that category for healthy-from-the-start fare like certified organic.
NBJ’s 2012 Global Report includes sales and growth estimates for functional foods and beverages, dietary
supplements, natural & organic foods and beverages and natural & organic personal care and household products. In this report you will find:
Quantification of the global nutrition industry, including market size estimates for the major geographic regions and countries, as well as major product categories and sales channels
A competitive analysis of and discussion of trends affecting individual global nutrition product categories and specific global regions
Detailed sections for all supplement subcategories, including: vitamins, herbs & botanicals, minerals, sports nutrition, meal supplements and specialty supplements
A history of key events in the raw material and ingredient supply industry over the last two decades