supplement of nine years of global hydrocarbon emissions based
TRANSCRIPT

Supplement of Atmos. Chem. Phys., 16, 10133–10158, 2016http://www.atmos-chem-phys.net/16/10133/2016/doi:10.5194/acp-16-10133-2016-supplement© Author(s) 2016. CC Attribution 3.0 License.
Supplement of
Nine years of global hydrocarbon emissions based on source inversion ofOMI formaldehyde observationsMaite Bauwens et al.
Correspondence to: Maite Bauwens ([email protected])
The copyright of individual parts of the supplement might differ from the CC-BY 3.0 licence.

Table S1.Comparison between measured isoprene fluxes from various studies in South America with the isoprene fluxes from this work.The observed 24-hour flux (column 7) is equal to the observed averaged flux (column 5) divided by a diurnal correction factor (column 6)derived from the model.
Reference Coordinates Month(s) Time Observation Correction 24h A priori OMI-based
(hr) factor flux flux flux
Zimmerman et al. (1988) 2.95 S, 59.95 W Jul-Aug 0-24 1.04 1 1.04 1.71 1.47
Davis et al. (1994) id. Jul-Aug 8-14 3.63 2 1.82 1.71 1.47
Andreae et al. (2002) 2.59 S, 60.2 W Sep-Oct 12-13 2.88 3.65 0.79 2.28 2.00
Ciccioli et al. (2003) 2.59 S, 60.2 W Jul 0-24 0.96 1 0.96 1.38 1.02
Greenberg et al. (2004) 1.98 S, 59.2 W Mar 12-13 5.30 3.75 1.41 1.18 0.46
Karl et al. (2007) 2.61 S, 60.21 W Sep 0-24 2.50 1 2.50 2.21 1.97
Kuhn et al. (2007) 2.59 S, 60.21 W Jul 0-24 1.68 1 1.68 1.38 1.02
Kuhn et al. (2007) id. Jul 0-24 1.29 1 1.29 1.38 1.02
Kuhn et al. (2007) id. Jul 10-12 6.90 3 2.30 1.38 1.02
Rizzo et al. (2010) 2.61 S, 60.22 W Sep 12-13 7.40 3.7 2.00 2.21 1.97
Alves et al. (2015) 2.59 S, 60.12 W Sep 10-14 0.60 2 0.30 2.21 1.97
Alves et al. (2015) id. Oct 10-14 2.50 2 1.25 2.34 2.02
Alves et al. (2015) id. Nov 10-14 1.41 2 0.71 1.91 1.47
Alves et al. (2015) id. Dec 10-14 0.49 2 0.25 1.48 0.77
Alves et al. (2015) id. Jan 10-14 0.80 2 0.40 1.28 0.70
Rinne et al. (2002) 2.85 S, 54.97 W Jul 6-18 0.58 2 0.29 0.67 0.50
Greenberg et al. (2004) id. Jan-Feb 12-13 2.20 3.6 0.61 0.54 0.33
Helmig et al. (1998) 4.59 S, 77.47 W Jul 12-13 7.40 3.5 2.11 0.61 0.35
Helmig et al. (1998) id. Jul 12-13 8.10 3.5 2.31 0.61 0.35
Greenberg et al. (2004) 10.13 S, 61.9 W Feb 12-13 9.8 3.6 2.72 1.25 0.59
Simon et al. (2005) 10.08 S, 61.93 W Apr-May 0-24 2.32 1 2.32 1.39 0.81
Simon et al. (2005) id. Sep-Oct 0-24 3.17 1 3.17 2.77 1.77
2

1 3 5 7 9 11 1 3 5 7 9 11 1 3 5 7 9 11 1 3 5 7 9 11 1 3 5 7 9 11 1 3 5 7 9 11 1 3 5 7 9 11 1 3 5 7 9 11 1 3 5 7 9 110
5
10
15
20
Mo
nth
ly V
CD
’Equatorial Africa (6 S−6 N, 15−30 E)’
2005 2006 2007 2008 2009 2010 2011 2012 2013
1 3 5 7 9 11 1 3 5 7 9 11 1 3 5 7 9 11 1 3 5 7 9 11 1 3 5 7 9 11 1 3 5 7 9 11 1 3 5 7 9 11 1 3 5 7 9 11 1 3 5 7 9 110
5
10
15
20
25
Mo
nth
ly V
CD
’Amazonia (14 S−10 N, 45−80 W)’
2005 2006 2007 2008 2009 2010 2011 2012 2013
1 3 5 7 9 11 1 3 5 7 9 11 1 3 5 7 9 11 1 3 5 7 9 11 1 3 5 7 9 11 1 3 5 7 9 11 1 3 5 7 9 11 1 3 5 7 9 11 1 3 5 7 9 110
5
10
15
20
25
30
Mo
nth
ly V
CD
’Southeastern US (26−42 N, 75−95 W)’
2005 2006 2007 2008 2009 2010 2011 2012 2013
OMI observed IMAGES: a priori IMAGES: a posteriori
Figure S1.Monthly averaged HCHO column between 2005 and 2013, as observed by OMI and simulated by the a priori and the a posteriorimodel over Equatorial Africa (6S-6 N, 15-30 E), Amazonia (14S-10 N, 45-80 W), and Southeastern US (26-42 N, 75-95 W). Columns areexpressed in 1015 molec.cm−2.
3

A priori: GFED4s OMI−based
FINNv1.5 GFAS
GFED4 (no small "res) GOME2−based
Tg C
per grid
per year
0
0.1
0.2
0.3
0.4
0.5
0.6
Figure S2.Annually averaged fire emissions in 0.5 degree resolution according to different emission inventories in 2005 expressed in Tg/yr.
4

A priori: MEGAN−MOHYCAN OMI−based
MEGAN−MACC GUESS−ES
Tg Isop.
per grid
per year
0.01
0.02
0.03
0.04
0.05
0.06
0.07
0.08
0.09
Figure S3.Annually averaged isoprene emissions in 0.5 degree resolution according to different emission inventories in 2005 expressed inTg/yr.
5
0
10
20
30
40
50
60
70
water
evergreen needleleaf forest
evergreen broadleaf forest
deciduous needleleaf forest
deciduous broadleaf forest
mixed forests
closed shrubland
open shrublands
woody savannas
savannas
grasslands
permanent wetlands
croplands
urban and built−up
cropland/natural vegetation mosaic
snow and ice
barren or sparsely vegetated
%
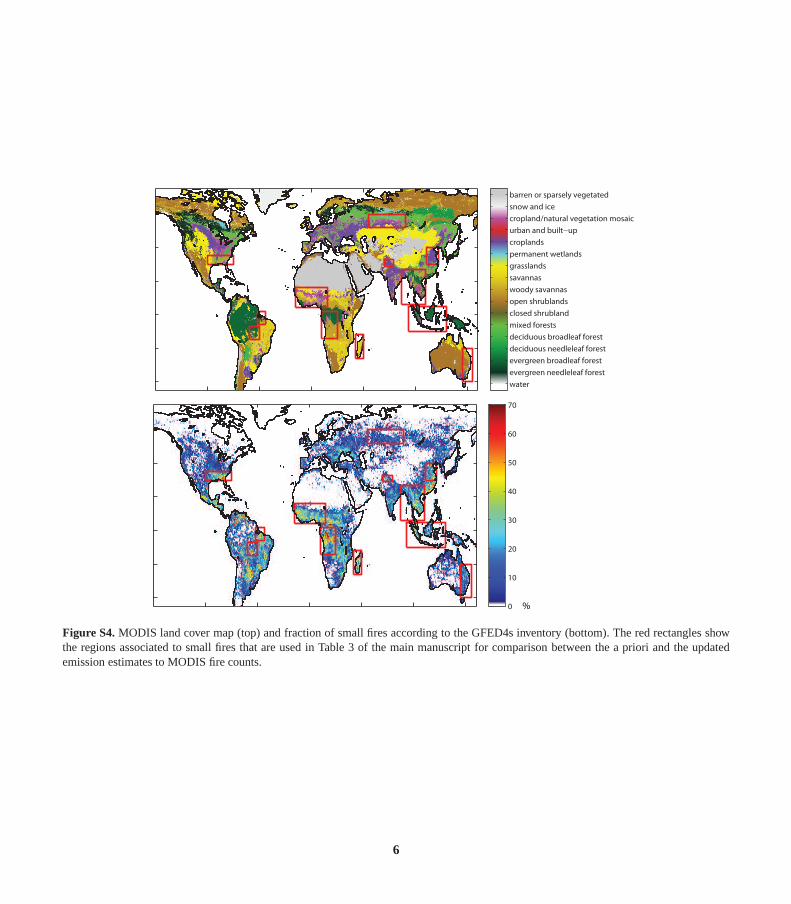
Figure S4.MODIS land cover map (top) and fraction of small fires according to the GFED4s inventory (bottom). The red rectangles showthe regions associated to small fires that are used in Table 3 of the main manuscript for comparison between the a priori andthe updatedemission estimates to MODIS fire counts.
6

Figure S5.Global distribution of trends in MODIS leaf area index between 2005 and 2013 in %/yr.
7

References
Alves, E. G., Jardine, K., Tóta, J., Jardine, A., Yánez-Serrano, A. M., Karl, T., Tavares, J. V., Nelson, B., Gu, D., Stavrakou, T. and Guenther,A.: Seasonality of isoprenoid atmospheric vertical profiles within and above a primary rainforest in central Amazonia,Atmos. Chem.Phys. Discuss., submitted, 2015.
Andreae, M., Artaxo, P., Brandao, C., Carswell, F., Ciccioli, P., Da Costa, A., Culf, A., Esteves, J., Gash, J., Grace, J.and others: Biogeo-5chemical cycling of carbon, water, energy, trace gases, andaerosols in Amazonia: The LBA-EUSTACH experiments, J. Geophys. Res.,107(D20), LBA-33, doi:10.1029/2001JD000524, 2002.
Ciccioli, P., Brancaleoni, E., Frattoni, M., Kuhn, U., Kesselmeier, J., Dindorf, T., Araujo, A. de, Nobre, A., Stefani,P. and Valentini, R.: Fluxesof isoprenoid compounds over the tropical rainforest near Manaus during the dry season and their implications in the ecosystem carbonbudget and in the atmospheric chemistry processes, in Integrated Land Ecosystem-Atmosphere Processes Study (ILEAPS)International10Open Science Conference 2003, pp. 48–53, Finnish Association for Aerosol Research, 2003.
Davis, K., Lenschow, D. and Zimmerman, P.: Biogenic nonmethane hydrocarbon emissions estimated from tethered balloonobservations, J.Geophys. Res.-Atmos., 99(D12), 25587–25598, doi:10.1029/94JD02009, 1994.
Greenberg, J. P., Guenther, A. B., Pétron, G., Wiedinmyer, C., Vega, O., Gatti, L. V., Tota, J. and Fisch, G.: Biogenic VOCemissions fromforested Amazonian landscapes, Glob. Chang. Biol., 10(5),651–662, doi:10.1111/j.1365-2486.2004.00758.x, 2004.15
Helmig, D., Balsley, B., Davis, K., Kuck, L. R., Jensen, M., Bognar, J., Smith, T., Arrieta, R. V., Rodriguez, R. and Birks, J. W.: Verticalprofiling and determination of landscape fluxes of biogenic nonmethane hydrocarbons within the planetary boundary layer in the PeruvianAmazon, J. Geophys. Res., 103(D19), 25519–25532, 1998.
Jacob, D. J. and Wofsy, S. C.: Photochemistry of biogenic emissions over the Amazon forest, J. Geophys. Res., 93,doi:10.1029/jd093id02p01477, 1988.20
Karl, T., Guenther, A., Yokelson, R. J., Greenberg, J., Potosnak, M., Blake, D. R. and Artaxo, P.: The tropical forest andfire emissions exper-iment: Emission, chemistry, and transport of biogenic volatile organic compounds in the lower atmosphere over Amazonia, J. Geophys.Res.-Atmos., 112(D18), doi:10.1029/2007JD008539, 2007.
Kuhn, U., Andreae, M., Ammann, C., Araújo, A., Brancaleoni,E., Ciccioli, P., Dindorf, T., Frattoni, M., Gatti, L., Ganzeveld, L. et al.: Iso-prene and monoterpene fluxes from Central Amazonian rainforest inferred from tower-based and airborne measurements, and implications25on the atmospheric chemistry and the local carbon budget, Atmos. Chem. Phys., 7(11), 2855–2879, doi:10.5194/acp-7-2855-2007, 2007.
Rinne, H., Guenther, A., Greenberg, J. and Harley, P.: Isoprene and monoterpene fluxes measured above Amazonian rainforest and theirdependence on light and temperature, Atmos. Environ., 36(14), 2421–2426, doi:10.1016/S1352-2310(01)00523-4, 2002.
Rizzo, L. V., Artaxo, P., Karl, T., Guenther, A. B. and Greenberg, J.: Aerosol properties, in-canopy gradients, turbulent fluxes and VOCconcentrations at a pristine forest site in Amazonia, Atmos. Environ., 44(4), 503–511, doi:10.1016/j.atmosenv.2009.11.002, 2010.30
Simon, E., Meixner, F., Rummel, U., Ganzeveld, L., Ammann, C. and Kesselmeier, J.: Coupled carbon-water exchange of theAmazon rainforest, II. Comparison of predicted and observed seasonal exchange of energy, CO2, isoprene and ozone at a remote site in Rondonia,Biogeosciences Discuss., 2(2), 399-449, doi:10.5194/bg-2-255-2005, 2005.
Zimmerman, P., Greenberg, J. and Westberg, C.: Measurements of atmospheric hydrocarbons and biogenic emission fluxes in the Amazonboundary layer, J. Geophys. Res.-Atmos., 93(D2), 1407–1416, doi:10.1029/JD093iD02p01407, 1988.35
8